NATURAL RESOURCES SYSTEMS PROGRAMME FINAL TECHNICAL … · 1 department for international...
40
1 DEPARTMENT FOR INTERNATIONAL DEVELOPMENT STRATEGY FOR RESEARCH ON RENEWABLE NATURAL RESOURCES NATURAL RESOURCES SYSTEMS PROGRAMME FINAL TECHNICAL REPORT DIFD Project Number R7269 Project Title Valuation of Peri-Urban Natural Resource Productivity Project Leader Dr Fiona Nunan Organisation International Development Department School of Public Policy University of Birmingham Edgbaston Birmingham B15 2TT NRSP Production System Date Peri-Urban Interface 31 st August 1999
Transcript of NATURAL RESOURCES SYSTEMS PROGRAMME FINAL TECHNICAL … · 1 department for international...
1
DEPARTMENT FOR INTERNATIONAL DEVELOPMENT
STRATEGY FOR RESEARCH ON RENEWABLE NATURAL RESOURCES
NATURAL RESOURCES SYSTEMS PROGRAMME
FINAL TECHNICAL REPORT
DIFD Project Number
R7269
Project Title
Valuation of Peri-Urban Natural Resource Productivity
Project Leader
Dr Fiona Nunan
Organisation
International Development DepartmentSchool of Public PolicyUniversity of BirminghamEdgbastonBirminghamB15 2TT
NRSP Production System Date
Peri-Urban Interface 31st August 1999
EXECUTIVE SUMMARY
The project developed and tested a decision framework for assessing natural resourcevalues in two case study city-regions: Kumasi, Ghana, and Hubli-Dharwad, India. Theframework aims to enable decision-makers to identify resource users and compare theeconomic values of different uses of peri-urban natural resources. It draws on a range ofmethods and techniques used to inform natural resource management, including methodsfor estimating non-market benefits as well as other land use appraisal and planning tools.
Preliminary testing was carried out through the use of semi-structured interviews with targetinstitutions, surveys of users of the natural resource and gathering information on valuessuch as land prices. The preliminary testing concluded that the following elements are ofpractical use within the framework:
• Guidelines on which valuation methods are most suitable in which situations. Methodssuch as those used in environmental impact assessment (EIA) could be drawn on togenerate baseline data, for example.
• Stakeholder analysis is essential to identify the different uses and users of naturalresources.
The decision framework is presented in the main output of the research, a booklet. This setsout how valuing natural resources can aid decision-making, which valuation methods can beused for different types of values and guidelines on how to apply the methods. Stakeholderanalysis should ensure that all users of a natural resource are identified and their valuessought. This should contribute to providing an avenue for consultation among all affectedgroups, including low-income communities.
Whilst the framework can be used to feed into established planning and decision-makingapproaches within a peri-urban context, there are a number of issues which should beconsidered:
• Within the case study city-regions, many agencies with responsibilities for naturalresource management do not effectively involve all affected stakeholders in planning anddecision-making processes. As the framework requires that all stakeholders and theirvalues for natural resources are taken into account, this may present new challenges, aswell as opportunities, for such organisations.
• Following on from this, there is, therefore, a need to widely disseminate the findings fromthe research, which will be available in a booklet, to contribute to greater understandingof the benefits arising from involving stakeholders in decision-making. The booklet willalso encourage recognition of competing demands placed on natural resources andexplain how these demands can be expressed and compared using monetary valuation.
• Training in participatory planning techniques, as well as valuation methods, wouldcontribute to the process of improving natural resource management and decision-making within the peri-urban interface.
• A "rough and ready" approach to the valuation of natural resources within the peri-urbaninterface may generate sufficient information to inform decision-making, rather thanusing detailed and sophisticated analytical techniques.
The framework requires further testing and refinement, but should enable decision-makers tosee how different uses of natural resources affect the livelihoods of different stakeholders.
ii

Further work could be conducted on how sustainability issues can be taken into account bydecision-makers and how organisations can work together to make the best use out of theframework.
iii
iv
ACKNOWLEDGEMENTS
This publication is an output from a project funded by the UK Department forInternational Development (DFID) for the benefit of developing countries. Theviews expressed are not necessarily those of DFID. The project, Valuation ofPeri-Urban Natural Resources Productivity, is funded under the NaturalResources Systems Programme, Peri-Urban Interface, project numberR7269.
v
CONTENTS
Executive Summary iiAcknowledgements ivList of boxes viiList of figures viiList of tables viiAbbreviations viiResearch team viii
1. Background and Project Purpose
1.1 Introduction 11.2 Project Purpose 11.3 Demand for the research 21.4 Previous research 3
2. Research Activities
2.1 Introduction 52.2 Literature reviews 52.3 Selection of case studies 62.4 Testing the valuation approach 6
2.4.1 Hubli-Dharwad 72.4.2 Kumasi 8
2.5 Draft production of the booklet 9
3. Outputs
3.1 Introduction 103.2 Review of literature 103.3 Decision framework 103.4 Dissemination of the framework, with guidelines, through
a booklet 133.5 Identification of further research directions 13
4. Contribution of Outputs
4.1 Contribution towards DFID’s developmental goals 144.2 Promotion pathways 144.3 Further development of the approach 154.4 Publications 16

vi
References 17
Appendices
A. Terms of reference 18B. Logical Framework 19C. Methodological guidelines for Hubli-Dharwad 21D. Key informants in Bangalore and Hubli-Dharwad 29E. Notes from Kumasi visit 31F. Preliminary ReportG. Draft booklet
vii
List of boxes3.1 Narrative summary of the decision framework 12
List of figures3.1 Decision framework for the valuation of peri-urban
natural resources 11
List of tables2.1 Participants in the focus groups: Barikese study 82.2 Participants in the focus groups: land conversion study 9
ABBREVIATIONS
DFID Department for International DevelopmentEIA Environmental impact assessmentGIS Geographic Information SystemsNR Natural resourcesNRSP Natural Resources Systems ProgrammePRA Participatory rural appraisalPUI Peri-urban interfaceRPCU Regional Planning Co-ordinating Unit
viii
RESEARCH TEAM
Dr Fiona Nunan (Project Leader)School of Public PolicyUniversity of BirminghamEdgbastonBirminghamB15 2TTTel: 0121 414 7257 Fax: 0121 414 4989Email: [email protected]
Kate BirdSchool of Public PolicyUniversity of BirminghamEdgbastonBirminghamB15 2TTTel: 0121 414 7591 Fax: 0121 414 4989Email: [email protected]
Joshua BishopDirector, Environmental Economics ProgrammeInternational Institute for Environment and Development3 Endsleigh StreetLondonWC1H 0DDTel: 0171 388 2117 Fax: 0171 388 2826Email: [email protected]
Rachel BergerSchool of Public PolicyUniversity of BirminghamEdgbastonBirminghamB15 2TT
Dr NidagundiDepartment of Geography,Karnatak UniversityDharwadKarnatakaIndia
Anthony EdmundsonInstitute of Land Management & DevelopmentUniversity of Science & TechnologyKumasiGhanaTel/fax 00 233 51 60454
1
1. BACKGROUND AND PROJECT PURPOSE
1.1 IntroductionThe research sought to develop and test a decision framework to enabledecision-makers to assess the relative worth of peri-urban natural resourcesin alternative uses. The decision framework aims to facilitate the evaluation ofnatural resource productivity in alternative uses, for example landuse foragriculture or providing fuelwood compared with conventional “urban” uses,such as housing or manufacturing industry.
Although there has been a considerable amount of work in related areas, suchas environmental economics and environmental impact assessment, thereremains a need to develop practical methods for assessing the relative worthof natural resource productivity within a peri-urban interface context. Thisneed has been expressed by natural resource managers involved in on-goingresearch projects in peri-urban areas, as well as by DFID programmemanagers (see Section 1.3).
The decision framework was developed largely through literature reviews,drawing together existing valuation methods to develop an approach for use ina peri-urban setting. The background to the development of the decisionframework can be found in the Preliminary Report (Nunan and Bishop, 1999 –attached as an appendix to this report). After preliminary testing, theframework was written up in a draft booklet (an appendix to this report),entitled Valuing Natural Resources in Peri-Urban Areas: a guide for naturalresource managers. This booklet, the main output of the research, sets outwhy such a framework may be useful and how it can be used. The bookletalso contains guidance on which valuation methods are most appropriate fordifferent uses of natural resources.
The framework was tested through two case studies in two city-regions,Kumasi, Ghana, and Hubli-Dharwad, India1. The case studies looked atcompeting uses (existing and potential) of a reservoir and agricultural land inboth city-regions. Key findings from the case studies are noted in Chapter 3,but the details of the case studies can be found in Part 2 of the booklet.
1.2 Project PurposeThe purpose of the research was to develop and test methods for thevaluation of peri-urban natural resource productivity, addressing Purpose 1Output 2 of the original logical framework of the Natural Resources SystemsProgramme (NRSP), Peri-Urban Interface (PUI) programme:
Impacts of urban growth on land use patterns and natural resourcedegradation identified and incorporated into strategies for peri-urbanplanning and management.
1 Hubli-Dharwad and Kumasi are the case study city-regions for the Peri-Urban InterfaceProduction System research programme.
2
The framework developed from the research is intended to facilitate theanalysis of conflicts over the use and management of natural resourcesbetween different stakeholders. It is a tool for decision-making and, whilst theframework generates information, it does not, in itself, provide the answers tohow a resource should be managed or whose values should dominate. Suchdecisions are ultimately more political than technical; nevertheless, judicioususe of the framework, and the methods presented in it, can provide valuableinformation to support more sustainable peri-urban planning and resourcemanagement.
The logical framework for the Peri-Urban Interface production system wasrevised in 1998 (after the development of this project proposal), in the light ofthe 1997 White Paper, Eliminating World Poverty: A Challenge for the 21st
Century. The new Output that this project supports is:
Land use planning and natural resources management strategieswhich benefit the poor in peri-urban areas developed and promoted.
The decision framework specifically includes methods for identifying all usersand uses of a natural resource and seeks to highlight non-monetary values ofuses that, to date, may not have received much attention from peri-urbanresource managers. Such uses may include, for example, informal use of areservoir for bathing and swimming and washing clothes, vehicles andlivestock. The framework should contribute to improved strategies for peri-urban planning and management, which can take better account ofsustainability issues and the distribution of costs and benefits betweenstakeholders.
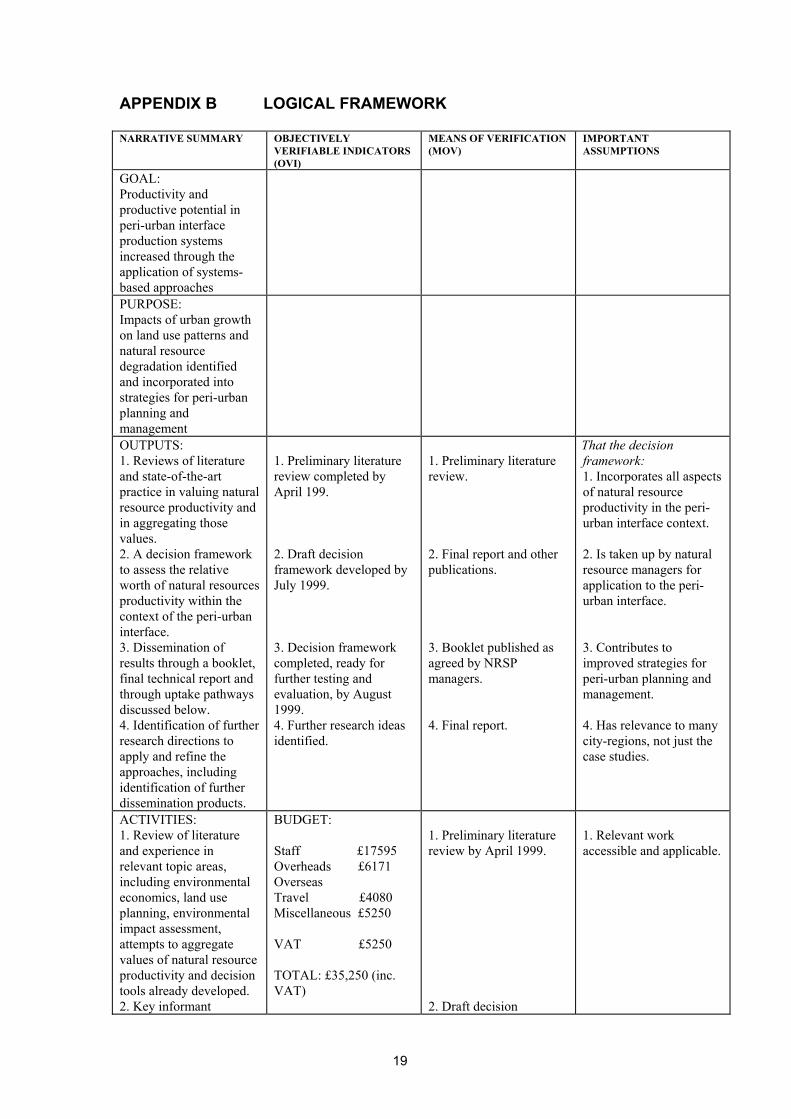
The terms of reference for the research and the logical framework are set outin Appendices A and B of this report.
1.3 Demand for the research Demand for the research in Hubli-Dharwad and Kumasi was noted throughbaseline studies which identified areas of inadequate co-ordination betweennatural resource managers and a lack of tools to assess different types ofuses of natural resources (see University of Birmingham et al., 1998 and NRIand UST, 1997). In terms of managing natural resources within the peri-urban interface, land-use planning and environmental impact assessment are probably the mostwidely used approaches in natural resource management. Land-use planninginvolves setting out a development plan for an urban area, guided by policiesand plans at regional and national levels. Such plans attempt to guide theexpansion of urban areas, converting land and forest areas for residential,commercial and industrial development and building roads. Plans may react tospectulative growth and may respond to forecasts for the expansion of a city,including population growth forecasts.
3
In many Northern countries, there are moves to make the land-use planningactivity more process-oriented and more participative, to encourage genuineinvolvement by a range of stakeholders in decision-making. This approach isless developed in Southern countries and requires changes in organisationalstructures and attitudes, as well as resources and facilitative skills. Thedecision-framework endeavours to address some of the inadequaciesinherent in the management of peri-urban natural resources. The frameworkencourages the identification of stakeholders and their involvement inplanning processes. Similarly, environmental impact assessment (EIA) is widely used to identifythe potential adverse impacts of land development in peri-urban areas, and tospecify appropriate mitigating measures. As in the case of land use planning,practitioners of EIA have increasingly sought to involve a wider range ofstakeholders in the process of impact assessment and mitigation planning. A persistent challenge for EIA is the difficulty of weighing and comparingenvironmental impacts and the costs of mitigation, both against each otherand against the potential benefits of development activities. The decisionframework developed in this project builds on EIA by using information aboutthe physical impacts of changing resource use, while adding an economicdimension to facilitate more direct comparisons of costs and benefits. 1.4 Previous researchThe research builds on previous work on the use of economic valuationmethods, environmental impact assessment, environmental planning andmanagement and stakeholder analysis. The Preliminary Report reviewedsome of these methods (see Nunan and Bishop, 1999). A number ofconclusions were reached:
• Different aspects of methods can be drawn on to contribute to the decisionframework. These include:• using methods developed for environmental impact assessment and
environmental management strategies to generate baseline data.Geographical information systems (GIS) can also be used to set outthe baseline situation.
• recognition that some economic valuation methods are easier to use bynon-specialists than others.
• recognition that intergenerational issues, that is concerns about thesustainability of natural resource uses, and concerns about thedistribution of costs and benefits, should be reflected in valuations asfar as possible.
• There is a range of methods available to identify stakeholders andencourage their involvement in planning processes. Stakeholder analysisis one such approach.
• Any decision framework must account for both formal and customaryrights of access and use of natural resources. This is particularly importantin a peri-urban setting, where changes from a rural model to an urbanregime can lead to conflicts, and where poorer communities often lose out.

4
The research also made use of previous work undertaken within the Peri-Urban Interface Production System, including R6799, ‘Kumasi NaturalResource Management Research Project’, R6825, ‘Baseline Study andIntroductory Workshop for Hubli-Dharwad City-region’ and R6949, ‘PUIConcepts and Methodologies’. Reports arising from these projects providedinformation on issues, stakeholders and methodologies.
5
2. RESEARCH ACTIVITIES
2.1 Introduction The development of the decision framework largely drew on existing work andmethods. A range of approaches was reviewed in the Preliminary Report,identifying the strengths and weaknesses of different methods as well asissues to consider when applying the decision framework, such as how costsand benefits of different uses of natural resources are distributed betweenstakeholders and over time. The Preliminary Report was used to guide the design of research activities inHubli-Dharwad and Kumasi. Two case studies were chosen in each city-region and written up following the decision framework format. The experienceof testing the framework was fed into the development of the booklet. 2.2 Literature reviews A preliminary literature review was conducted, which revealed that there havebeen few attempts to make use of a range of assessment methods within asingle framework. The review also highlighted the relative lack of applicationof valuation methods to peri-urban situations. Literature was reviewed in areas including: (a) economic valuation methods (including non-market valuation of naturalresources); (b) land use and regional planning methods; (c) environmental impact assessment methodologies; (d) valuation of agricultural produce; (e) attempts to aggregate values of natural resource productivity (e.g. benefit
transfer); and, (f) decision-making tools for natural resource planning and management,
including existing planning guidelines and impact assessment manuals. This preliminary literature review (Berger, 1999) was built on in thePreliminary Report (Nunan and Bishop, 1999), which also drew on reportsarising from research in Hubli-Dharwad and Kumasi. The Preliminary Reportalso reviewed the contribution that could be made to the decision frameworkby stakeholder analysis and consideration of property rights and managementregimes. The discussion in the Preliminary Report on economic valuation methodslargely drew on a publication put together by IIED, which looked at theeconomic valuation of forest land use options (IIED, 1994). IIED’s experiencein environmental economics enabled rapid sifting of the literature and theidentification of methods and issues of relevance to this piece of research. 2.3 Selection of case studies
6
One visit was made by a UK team member to each city-region to initiate thefieldwork with local counterparts. Both counterparts had been involved in peri-urban research within the NRSP PUI programme and were familiar with theobjectives and process of peri-urban research. Semi-structured interviewswere held with key institutions to determine: • Methods and approaches already in use into which the decision framework
could usefully feed.• The kind of data already collected that could feed into the decision
framework.• Relationships between institutions to identify how organisations could work
together to use the decision framework.• Potential case studies that could be used to preliminarily test the
framework.• Potential constraints to the use of the decision framework. Lists of people met can be found in Appendices D and E. The decision overwhich case studies to undertake was also informed by previous research inthe city-region under the Peri-Urban Interface research programme. Previousresearch enabled the rapid identification of suitable locations, as well asissues, and provided contacts in some cases. In both Hubli-Dharwad and Kumasi, reservoirs and agricultural landthreatened by urban development were selected. In Kumasi, the reservoir is akey source of water for the city, whereas the reservoir in Hubli-Dharwad has,in recent years, become too polluted to provide drinking water. By selectingthe same type of resources in the city-regions, comparative analysis of theresults and method was facilitated. The issues and locations reflect: • Key peri-urban natural resources.• Areas of existing or potential conflicts over use.• The ability to gather adequate information with the resources, and in the
time, available. 2.4 Testing the valuation approach Information to test the framework was generated through key informantinterviews with, and surveys of, stakeholders, such as farmers and fisherfolk.Records of land sales and compensation levels were also searched. Thispreliminary testing involved the use of: • Agricultural productivity data.• Substitute goods approach.• Opportunity costs.• Travel costs.• Land valuation.
7
The case studies are written up in detail in Part 2 of the booklet, following theformat set out in Part 1. The time and resources available did not permit theuse of more sophisticated economic valuation methods, such as thecontingent valuation method. The potential for further valuation is discussed ineach of the case studies. The rapid and, relatively, low-cost nature of thefieldwork illustrates what can be achieved through the use of the framework ina fairly rough-and-ready way. Guidance notes for both Hubli-Dharwad andKumasi can be found in Appendices C and E. Workshops were not held in Hubli-Dharwad and Kumasi, as suggested thatthey may be in the project memorandum, as it was felt that they would bemore useful once the framework had been tested and the booklet set out indraft form. 2.4.1 Hubli-Dharwad Unkal tank The case study of a reservoir in Hubli-Dharwad was based on the Unkal tank(reservoir), just outside Hubli. This was selected because of its location closeto the city and because of conflicting demands and uses made of it. Theseinclude sewage flowing into the reservoir from uncontrolled housingdevelopment in conflict with the past use of the reservoir as a source ofdrinking water for the city. A number of visits were made to meetstakeholders that use the tank at different times of the day: • Early morning to speak to stakeholders involved in household and
commercial fishing, swimming, household and commercial laundry,carrying water from the tank, the use of the tank for religious purposes andgrass collectors.
• Afternoon to speak to stakeholders involved in bullock and buffalowashing, household fishing, household and commercial laundry andvehicle washing.
• Evening to speak to stakeholders involved in commercial and householdfishing, recreation, boating and vehicle washing.
Due to the time period during which the research was conducted, the datacollected necessarily reflects a seasonal bias (the research was conductedduring the monsoon season). Similar surveys would have to be conductedduring other seasons to obtain a complete picture of the year-round use of thetank. Navalur village Navalur village was selected as a case study due to its proximity to Dharwadand to the National Highway running through Hubli-Dharwad, making it apotentially prime site for development. Data was collected through surveys offarmers and orchard owners and through access to data recorded by thevillage accountant (including data on labour costs, inputs and income fromcrops).
8
2.4.2 KumasiSeveral villages were visited for the two case studies and each was visited atleast twice, to gain acceptance of participation in the research and to conductfocus groups.
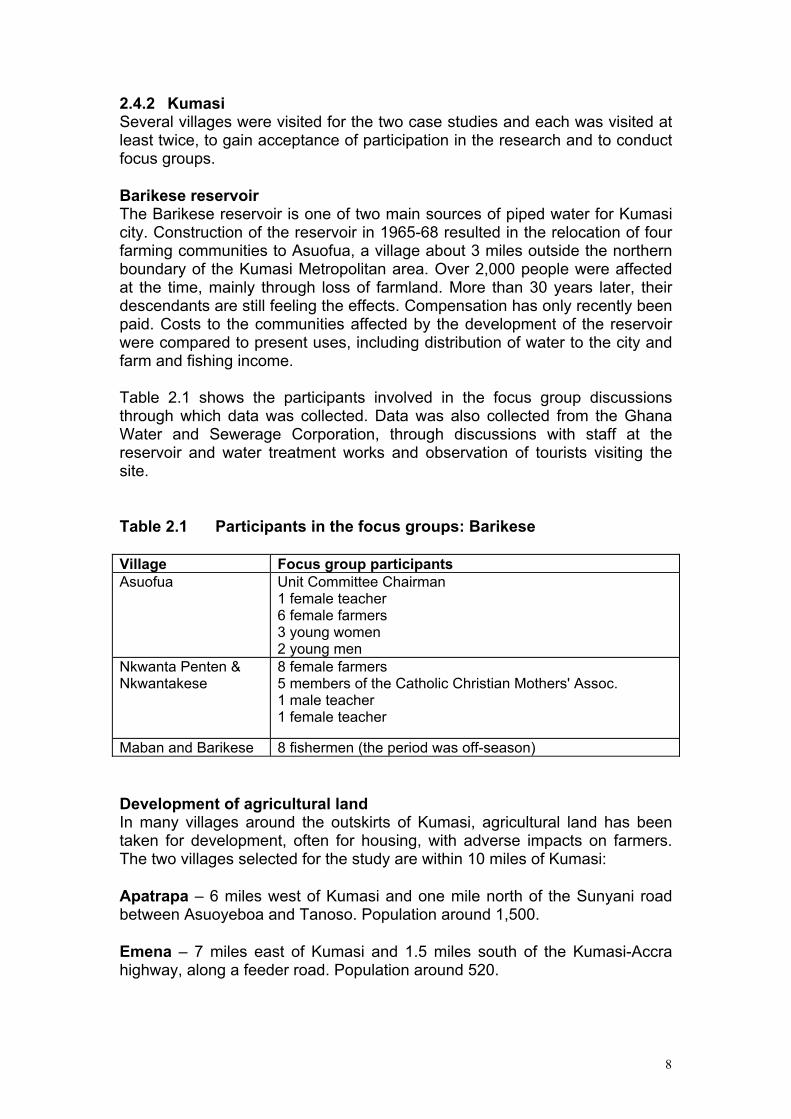
Barikese reservoirThe Barikese reservoir is one of two main sources of piped water for Kumasicity. Construction of the reservoir in 1965-68 resulted in the relocation of fourfarming communities to Asuofua, a village about 3 miles outside the northernboundary of the Kumasi Metropolitan area. Over 2,000 people were affectedat the time, mainly through loss of farmland. More than 30 years later, theirdescendants are still feeling the effects. Compensation has only recently beenpaid. Costs to the communities affected by the development of the reservoirwere compared to present uses, including distribution of water to the city andfarm and fishing income.
Table 2.1 shows the participants involved in the focus group discussionsthrough which data was collected. Data was also collected from the GhanaWater and Sewerage Corporation, through discussions with staff at thereservoir and water treatment works and observation of tourists visiting thesite.
Table 2.1 Participants in the focus groups: Barikese
Village Focus group participantsAsuofua Unit Committee Chairman
1 female teacher6 female farmers3 young women2 young men
Nkwanta Penten &Nkwantakese
8 female farmers5 members of the Catholic Christian Mothers' Assoc.1 male teacher1 female teacher
Maban and Barikese 8 fishermen (the period was off-season)
Development of agricultural landIn many villages around the outskirts of Kumasi, agricultural land has beentaken for development, often for housing, with adverse impacts on farmers.The two villages selected for the study are within 10 miles of Kumasi:
Apatrapa – 6 miles west of Kumasi and one mile north of the Sunyani roadbetween Asuoyeboa and Tanoso. Population around 1,500.
Emena – 7 miles east of Kumasi and 1.5 miles south of the Kumasi-Accrahighway, along a feeder road. Population around 520.
9
Both settlements have witnessed unprecedented housing development byurban dwellers over the last five years. A standard building plot is one quarterof an acre (about 1,000 m2 or 0.10 hectare). Consequently the sale of fourplots for housing leads to the loss of one acre (0.4 ha) of agricultural land.
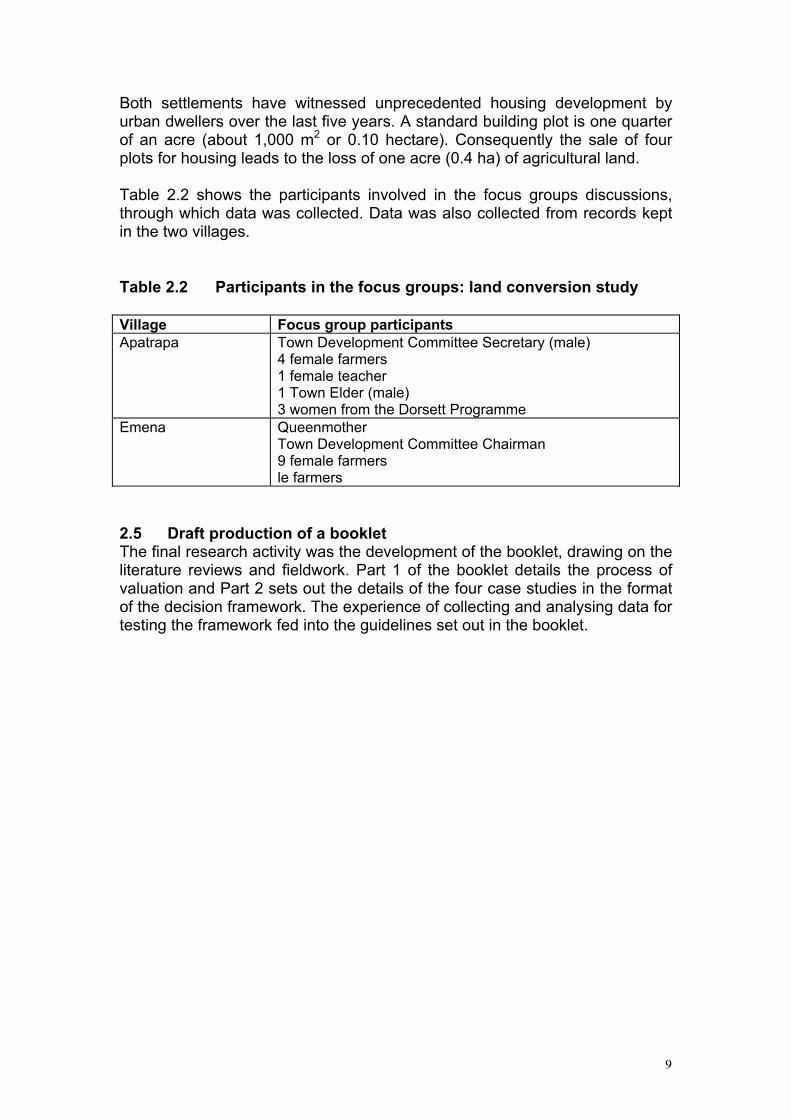
Table 2.2 shows the participants involved in the focus groups discussions,through which data was collected. Data was also collected from records keptin the two villages.
Table 2.2 Participants in the focus groups: land conversion study
Village Focus group participantsApatrapa Town Development Committee Secretary (male)
4 female farmers1 female teacher1 Town Elder (male)3 women from the Dorsett Programme
Emena QueenmotherTown Development Committee Chairman9 female farmersle farmers
2.5 Draft production of a bookletThe final research activity was the development of the booklet, drawing on theliterature reviews and fieldwork. Part 1 of the booklet details the process ofvaluation and Part 2 sets out the details of the four case studies in the formatof the decision framework. The experience of collecting and analysing data fortesting the framework fed into the guidelines set out in the booklet.
10
3. OUTPUTS
3.1 IntroductionThe outputs set out in the logical framework are as follows:
1. A review of literature in valuing and managing natural resourceproductivity.
2. A decision framework to assess the relative worth of natural resourceproductivity within the context of the peri-urban interface. This is set out inthe booklet.
3. Dissemination of the framework, with guidelines, through a booklet.4. Identification of further research directions to apply and refine the
approaches.
This chapter briefly discusses the outputs of the research. The main output ofthe research is the booklet, which can be found in Appendix G and which willbe published separately. Chapter 4 discusses the potential dissemination ofthe booklet.
3.2 Review of literatureThe reviews of literature can be found in a review written by Berger (1999)and in the Preliminary Report (Nunan and Bishop, 1999 – attached as anappendix to this report). Section 1.4 of Chapter 1 set out some of the pointsraised from the literature reviews. However, the main purpose of the literaturereviews was to identify appropriate methods that could be drawn on in thedevelopment of the decision framework.
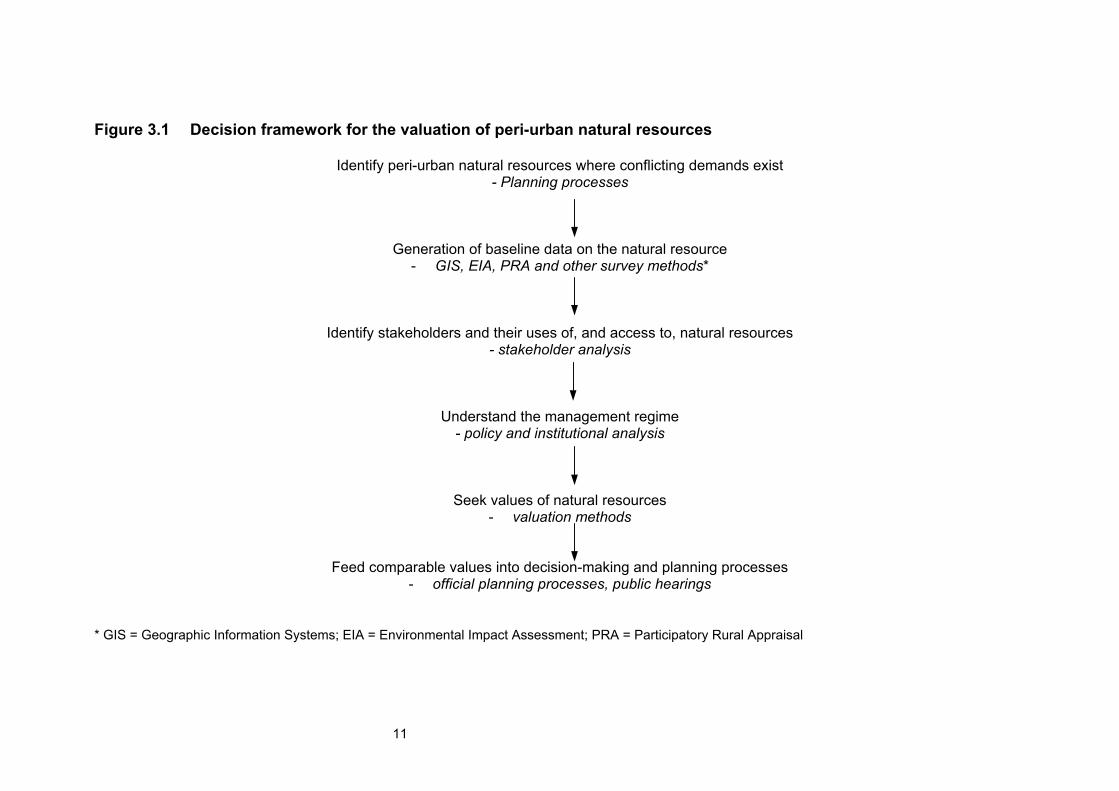
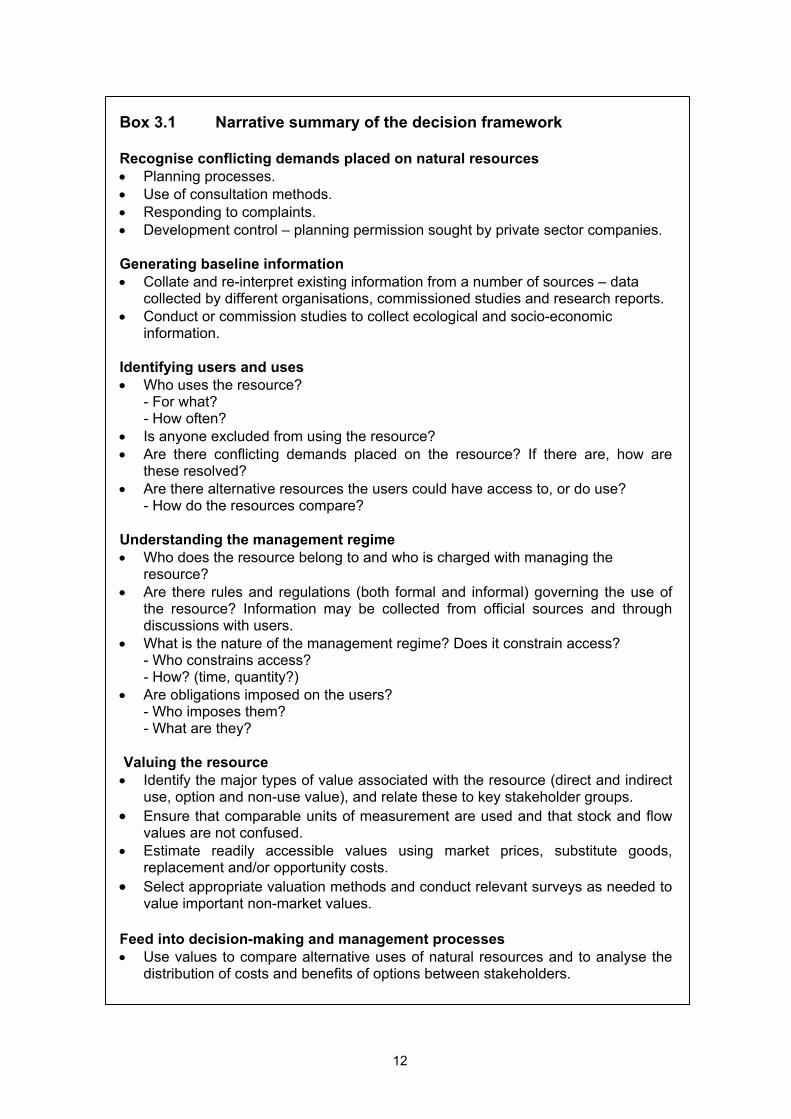
3.3 Decision frameworkThe main output of the research, the decision framework, is set out in greaterdetail in the draft booklet. The decision framework is summarised in Figure 3.1and in Box 3.1. These show the stages through which valuation of peri-urbannatural resources can be carried out.
Preliminary testing of the framework concluded that the following elements arecritical to its effective use:
• Guidelines on which valuation methods are most suitable in whichsituations. The booklet, for example, compares economic valuationmethods to aid decisions over which methods to use in which situations.
• Stakeholder analysis is essential to identify the uses and users of naturalresources and to ensure that as many values as possible are sought.
11
Figure 3.1 Decision framework for the valuation of peri-urban natural resources
Identify peri-urban natural resources where conflicting demands exist - Planning processes
Generation of baseline data on the natural resource- GIS, EIA, PRA and other survey methods*
Identify stakeholders and their uses of, and access to, natural resources - stakeholder analysis
Understand the management regime - policy and institutional analysis
Seek values of natural resources- valuation methods
Feed comparable values into decision-making and planning processes- official planning processes, public hearings
* GIS = Geographic Information Systems; EIA = Environmental Impact Assessment; PRA = Participatory Rural Appraisal
12
Box 3.1 Narrative summary of the decision framework Recognise conflicting demands placed on natural resources• Planning processes.• Use of consultation methods.• Responding to complaints.• Development control – planning permission sought by private sector companies. Generating baseline information• Collate and re-interpret existing information from a number of sources – data
collected by different organisations, commissioned studies and research reports.• Conduct or commission studies to collect ecological and socio-economic
information. Identifying users and uses• Who uses the resource?
- For what? - How often?
• Is anyone excluded from using the resource?• Are there conflicting demands placed on the resource? If there are, how are
these resolved?• Are there alternative resources the users could have access to, or do use? - How do the resources compare? Understanding the management regime• Who does the resource belong to and who is charged with managing the
resource?• Are there rules and regulations (both formal and informal) governing the use of
the resource? Information may be collected from official sources and throughdiscussions with users.
• What is the nature of the management regime? Does it constrain access? - Who constrains access? - How? (time, quantity?)
• Are obligations imposed on the users? - Who imposes them? - What are they?
Valuing the resource• Identify the major types of value associated with the resource (direct and indirect
use, option and non-use value), and relate these to key stakeholder groups.• Ensure that comparable units of measurement are used and that stock and flow
values are not confused.• Estimate readily accessible values using market prices, substitute goods,
replacement and/or opportunity costs.• Select appropriate valuation methods and conduct relevant surveys as needed to
value important non-market values. Feed into decision-making and management processes• Use values to compare alternative uses of natural resources and to analyse the
distribution of costs and benefits of options between stakeholders.
13
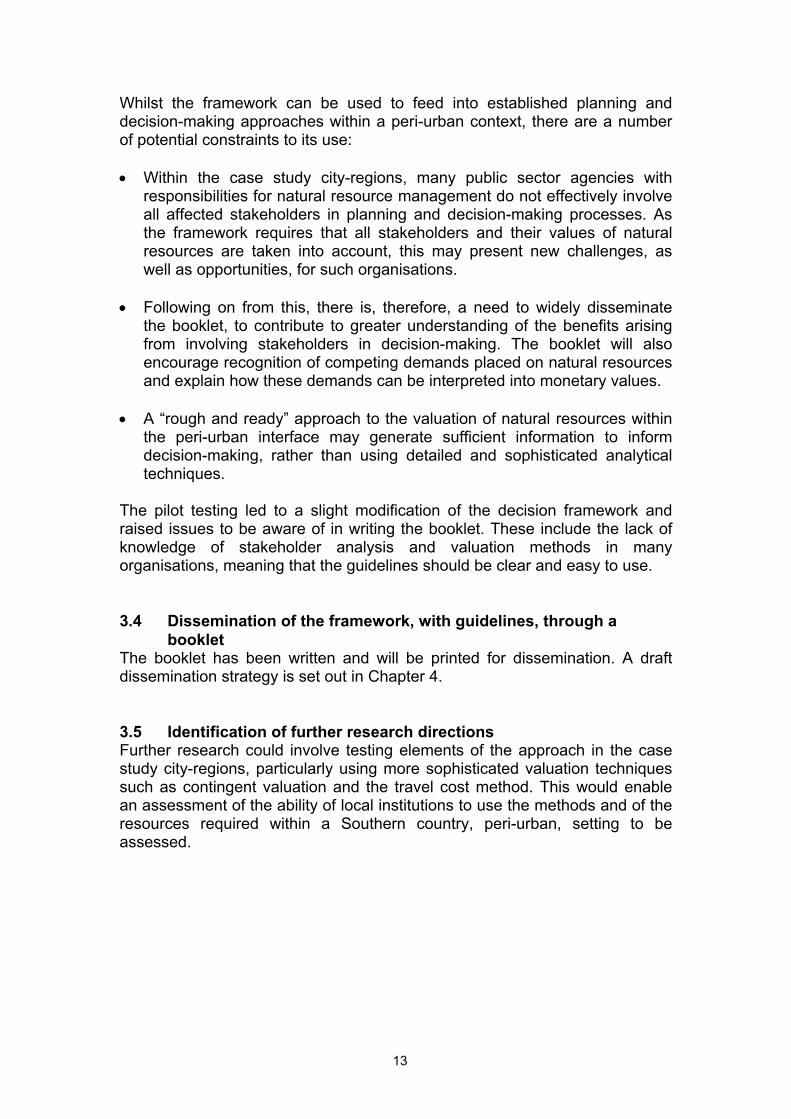
Whilst the framework can be used to feed into established planning anddecision-making approaches within a peri-urban context, there are a numberof potential constraints to its use: • Within the case study city-regions, many public sector agencies with
responsibilities for natural resource management do not effectively involveall affected stakeholders in planning and decision-making processes. Asthe framework requires that all stakeholders and their values of naturalresources are taken into account, this may present new challenges, aswell as opportunities, for such organisations.
• Following on from this, there is, therefore, a need to widely disseminate
the booklet, to contribute to greater understanding of the benefits arisingfrom involving stakeholders in decision-making. The booklet will alsoencourage recognition of competing demands placed on natural resourcesand explain how these demands can be interpreted into monetary values.
• A “rough and ready” approach to the valuation of natural resources within
the peri-urban interface may generate sufficient information to informdecision-making, rather than using detailed and sophisticated analyticaltechniques.
The pilot testing led to a slight modification of the decision framework andraised issues to be aware of in writing the booklet. These include the lack ofknowledge of stakeholder analysis and valuation methods in manyorganisations, meaning that the guidelines should be clear and easy to use.
3.4 Dissemination of the framework, with guidelines, through abooklet
The booklet has been written and will be printed for dissemination. A draftdissemination strategy is set out in Chapter 4.
3.5 Identification of further research directionsFurther research could involve testing elements of the approach in the casestudy city-regions, particularly using more sophisticated valuation techniquessuch as contingent valuation and the travel cost method. This would enablean assessment of the ability of local institutions to use the methods and of theresources required within a Southern country, peri-urban, setting to beassessed.
14
4. CONTRIBUTION OF OUTPUTS
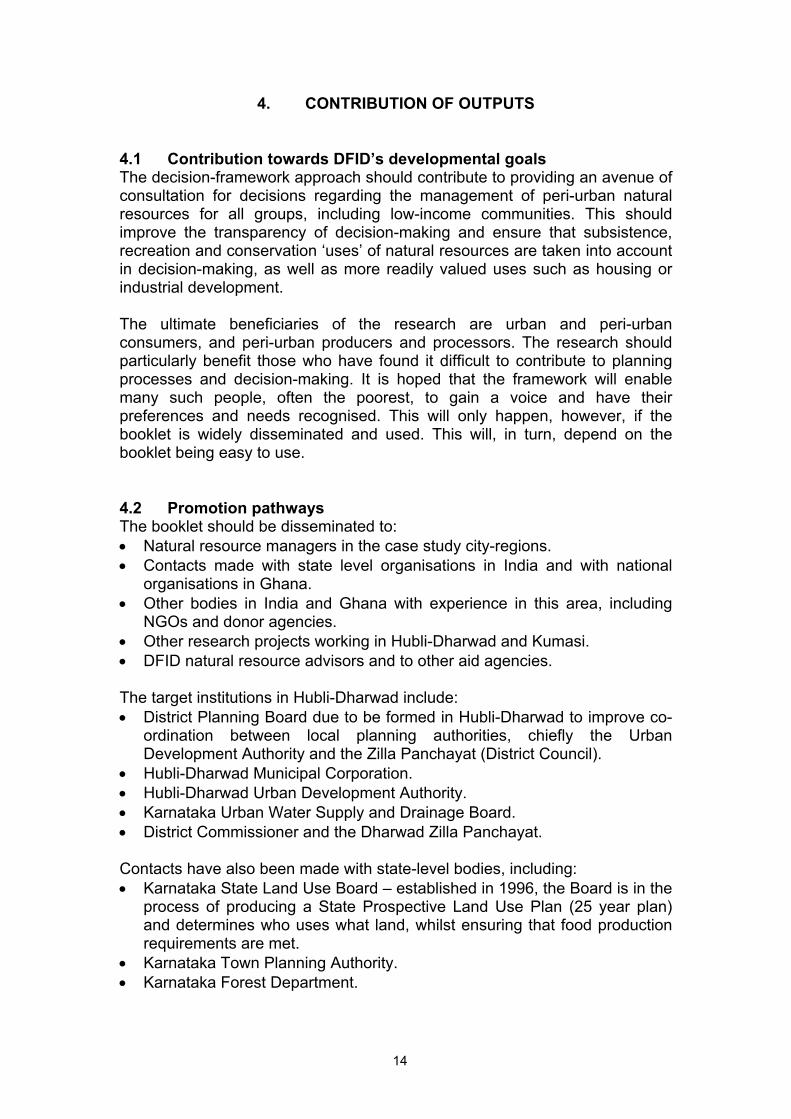
4.1 Contribution towards DFID’s developmental goalsThe decision-framework approach should contribute to providing an avenue ofconsultation for decisions regarding the management of peri-urban naturalresources for all groups, including low-income communities. This shouldimprove the transparency of decision-making and ensure that subsistence,recreation and conservation ‘uses’ of natural resources are taken into accountin decision-making, as well as more readily valued uses such as housing orindustrial development.
The ultimate beneficiaries of the research are urban and peri-urbanconsumers, and peri-urban producers and processors. The research shouldparticularly benefit those who have found it difficult to contribute to planningprocesses and decision-making. It is hoped that the framework will enablemany such people, often the poorest, to gain a voice and have theirpreferences and needs recognised. This will only happen, however, if thebooklet is widely disseminated and used. This will, in turn, depend on thebooklet being easy to use.
4.2 Promotion pathwaysThe booklet should be disseminated to:• Natural resource managers in the case study city-regions.• Contacts made with state level organisations in India and with national
organisations in Ghana.• Other bodies in India and Ghana with experience in this area, including
NGOs and donor agencies.• Other research projects working in Hubli-Dharwad and Kumasi.• DFID natural resource advisors and to other aid agencies. The target institutions in Hubli-Dharwad include:• District Planning Board due to be formed in Hubli-Dharwad to improve co-
ordination between local planning authorities, chiefly the UrbanDevelopment Authority and the Zilla Panchayat (District Council).
• Hubli-Dharwad Municipal Corporation.• Hubli-Dharwad Urban Development Authority.• Karnataka Urban Water Supply and Drainage Board.• District Commissioner and the Dharwad Zilla Panchayat. Contacts have also been made with state-level bodies, including:• Karnataka State Land Use Board – established in 1996, the Board is in the
process of producing a State Prospective Land Use Plan (25 year plan)and determines who uses what land, whilst ensuring that food productionrequirements are met.
• Karnataka Town Planning Authority.• Karnataka Forest Department.
15
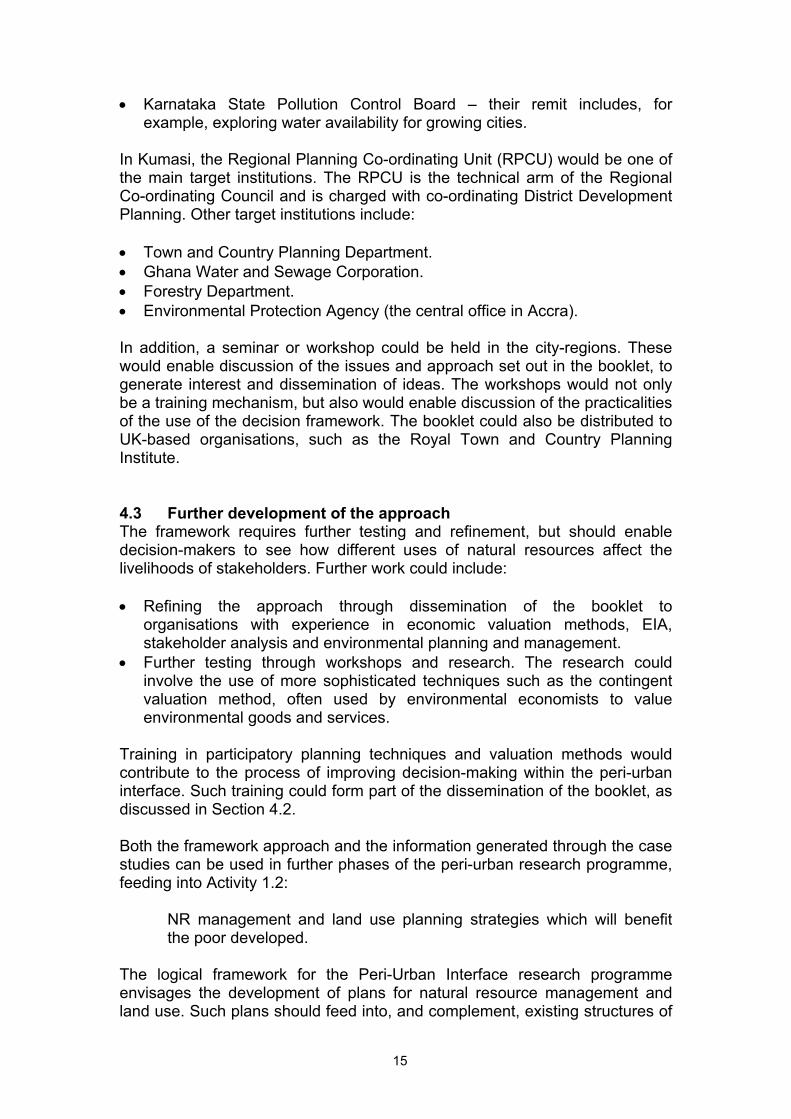
• Karnataka State Pollution Control Board – their remit includes, forexample, exploring water availability for growing cities.
In Kumasi, the Regional Planning Co-ordinating Unit (RPCU) would be one ofthe main target institutions. The RPCU is the technical arm of the RegionalCo-ordinating Council and is charged with co-ordinating District DevelopmentPlanning. Other target institutions include: • Town and Country Planning Department.• Ghana Water and Sewage Corporation.• Forestry Department.• Environmental Protection Agency (the central office in Accra). In addition, a seminar or workshop could be held in the city-regions. Thesewould enable discussion of the issues and approach set out in the booklet, togenerate interest and dissemination of ideas. The workshops would not onlybe a training mechanism, but also would enable discussion of the practicalitiesof the use of the decision framework. The booklet could also be distributed toUK-based organisations, such as the Royal Town and Country PlanningInstitute. 4.3 Further development of the approach The framework requires further testing and refinement, but should enabledecision-makers to see how different uses of natural resources affect thelivelihoods of stakeholders. Further work could include: • Refining the approach through dissemination of the booklet to
organisations with experience in economic valuation methods, EIA,stakeholder analysis and environmental planning and management.
• Further testing through workshops and research. The research couldinvolve the use of more sophisticated techniques such as the contingentvaluation method, often used by environmental economists to valueenvironmental goods and services.
Training in participatory planning techniques and valuation methods wouldcontribute to the process of improving decision-making within the peri-urbaninterface. Such training could form part of the dissemination of the booklet, asdiscussed in Section 4.2. Both the framework approach and the information generated through the casestudies can be used in further phases of the peri-urban research programme,feeding into Activity 1.2:
NR management and land use planning strategies which will benefitthe poor developed.
The logical framework for the Peri-Urban Interface research programmeenvisages the development of plans for natural resource management andland use. Such plans should feed into, and complement, existing structures of
16
relevant institutions in Hubli-Dharwad and Kumasi. The booklet could be usedas one starting point for the development of natural resource managementand land use planning strategies. The approach would fit into an actionplanning framework and would require stakeholders to work together to agreeways forward. 4.4 Publications Two internal reports have been produced in the course of the researchproject. In addition to the publication and dissemination of the booklet,summaries of the research will be distributed electronically and the articlessubmitted to academic journals. Berger, R. 1999. Valuation of Peri-Urban Resource Productivity: LiteratureReview. Birmingham, UK: School of Public Policy, University of Birmingham. Nunan, F. and Bishop, J. 1999. Valuation of Peri-Urban Natural ResourcesProductivity: Preliminary Report. Birmingham, UK: School of Public Policy,University of Birmingham.
17
REFERENCES Berger, R. 1999. Valuation of Peri-Urban Resource Productivity: LiteratureReview. School of Public Policy, University of Birmingham, Birmingham. IIED 1994. Economic Evaluation of Tropical Forest Land Use Options: AReview of Methodology and Applications, Environmental EconomicsProgramme. London: International Institute for Environment andDevelopment. Natural Resources Institute and the University of Science and Technology,Kumasi 1997. Kumasi Natural Resource Management Research Project:Inception Report, Volume 1: Main report, DFID NRSP Peri-Urban InterfaceProduction System, Natural Resources Institute, University of Greenwich. Nunan, F. and Bishop, J. 1999. Valuation of Peri-Urban Natural ResourcesProductivity: Preliminary Report. School of Public Policy, University ofBirmingham, Birmingham. Universities of Birmingham, Nottingham and Wales at Bangor (1998),Baseline Study and Introductory Workshop for Hubli-Dharwad City-region,Karnataka, India, Final Technical Report, Volumes 1 and 2, School of PublicPolicy, University of Birmingham.
18
APPENDIX A TERMS OF REFERENCE Taken from “Invitation to Submit Research Proposals: Valuation of Peri-UrbanNatural Resources”. Research Requirements Peri-urban NR Managers need to have to hand tools which give a clearpicture of the relative worth of use of land, water and other natural resourcesfor agriculture, fuelwood growth, aquaculture etc. as opposed to or takentogether with more conventional “urban” uses such as housing ormanufacturing industry. The intention of this call for submissions is to develop,and carry out a preliminary review with target institutions in the case studyregions of methods for the aggregate valuation of natural resource productivityin the peri-urban interface. Attention should be paid to concurrent PUIresearch work and, where possible and relevant, the review should take placealongside existing research teams. A detailed appreciation should be given ofthe literature and state of the art in relevant topic areas. It is anticipated that awide range of valuation techniques will need to be drawn upon and combined,including e.g. conventional land valuation, environmental impact assessmentapproaches, valuation of agricultural produce.
19
APPENDIX B LOGICAL FRAMEWORK NARRATIVE SUMMARY OBJECTIVELY
VERIFIABLE INDICATORS(OVI)
MEANS OF VERIFICATION(MOV)
IMPORTANTASSUMPTIONS
GOAL: Productivity andproductive potential inperi-urban interfaceproduction systemsincreased through theapplication of systems-based approaches
PURPOSE: Impacts of urban growthon land use patterns andnatural resourcedegradation identifiedand incorporated intostrategies for peri-urbanplanning andmanagement
OUTPUTS: 1. Reviews of literatureand state-of-the-artpractice in valuing naturalresource productivity andin aggregating thosevalues. 2. A decision frameworkto assess the relativeworth of natural resourcesproductivity within thecontext of the peri-urbaninterface. 3. Dissemination ofresults through a booklet,final technical report andthrough uptake pathwaysdiscussed below. 4. Identification of furtherresearch directions toapply and refine theapproaches, includingidentification of furtherdissemination products.
1. Preliminary literaturereview completed byApril 199. 2. Draft decisionframework developed byJuly 1999. 3. Decision frameworkcompleted, ready forfurther testing andevaluation, by August1999. 4. Further research ideasidentified.
1. Preliminary literaturereview. 2. Final report and otherpublications. 3. Booklet published asagreed by NRSPmanagers. 4. Final report.
That the decisionframework: 1. Incorporates all aspectsof natural resourceproductivity in the peri-urban interface context. 2. Is taken up by naturalresource managers forapplication to the peri-urban interface. 3. Contributes toimproved strategies forperi-urban planning andmanagement. 4. Has relevance to manycity-regions, not just thecase studies.
ACTIVITIES: 1. Review of literatureand experience inrelevant topic areas,including environmentaleconomics, land useplanning, environmentalimpact assessment, attempts to aggregatevalues of natural resourceproductivity and decisiontools already developed. 2. Key informant
BUDGET: Staff £17595 Overheads £6171 Overseas Travel £4080 Miscellaneous £5250 VAT £5250 TOTAL: £35,250 (inc.VAT)
1. Preliminary literaturereview by April 1999. 2. Draft decision
1. Relevant workaccessible and applicable.
20
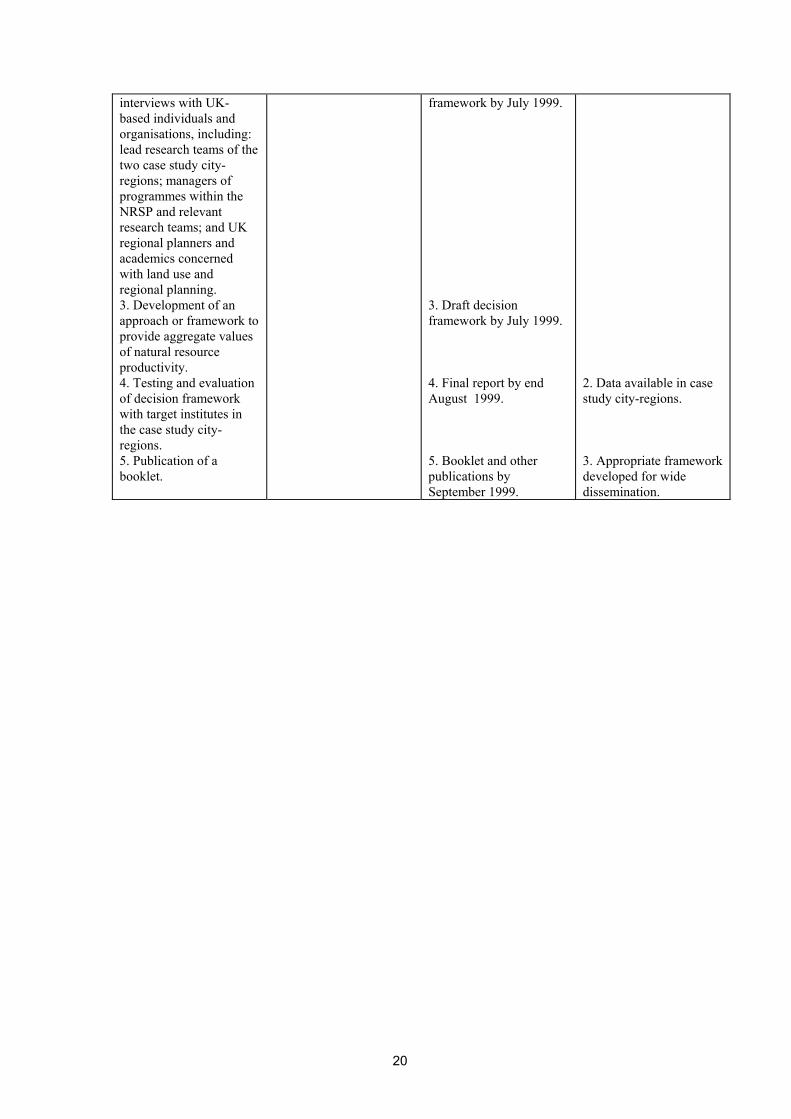
interviews with UK-based individuals andorganisations, including: lead research teams of thetwo case study city-regions; managers ofprogrammes within theNRSP and relevantresearch teams; and UKregional planners andacademics concernedwith land use andregional planning. 3. Development of anapproach or framework toprovide aggregate valuesof natural resourceproductivity. 4. Testing and evaluationof decision frameworkwith target institutes inthe case study city-regions. 5. Publication of abooklet.
framework by July 1999. 3. Draft decisionframework by July 1999. 4. Final report by endAugust 1999. 5. Booklet and otherpublications bySeptember 1999.
2. Data available in casestudy city-regions. 3. Appropriate frameworkdeveloped for widedissemination.
21
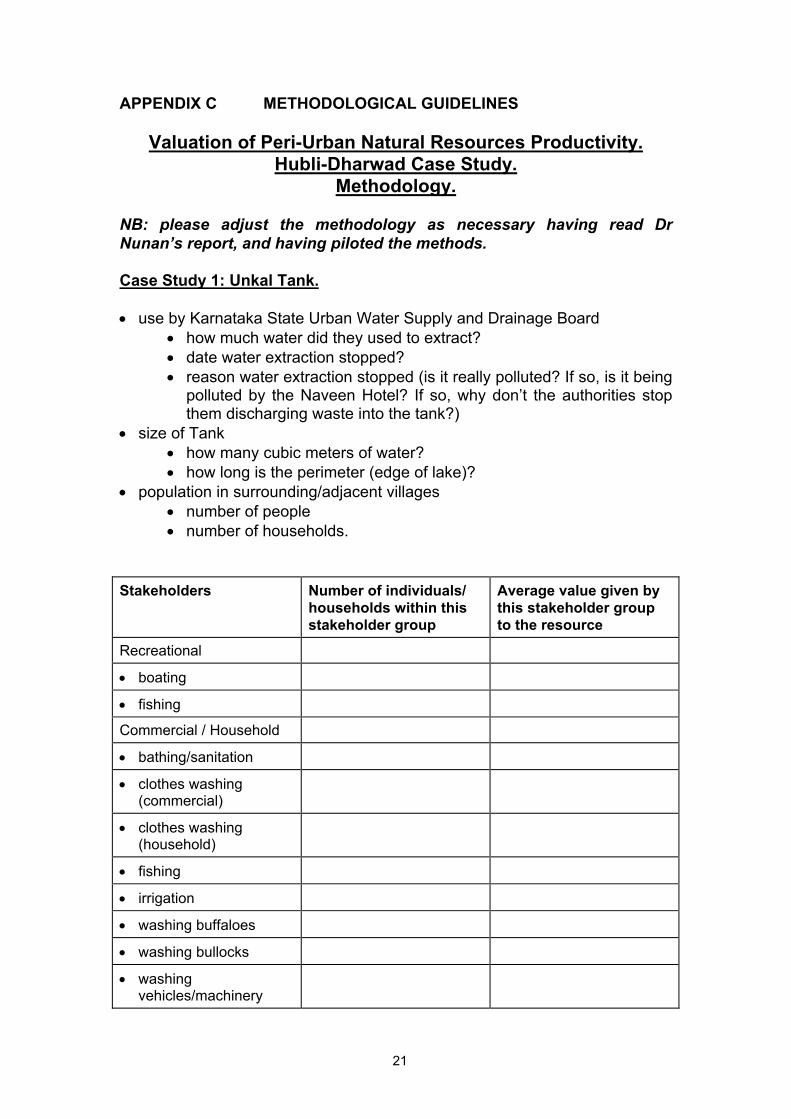
APPENDIX C METHODOLOGICAL GUIDELINES
Valuation of Peri-Urban Natural Resources Productivity. Hubli-Dharwad Case Study.
Methodology. NB: please adjust the methodology as necessary having read DrNunan’s report, and having piloted the methods. Case Study 1: Unkal Tank. • use by Karnataka State Urban Water Supply and Drainage Board
• how much water did they used to extract?• date water extraction stopped?• reason water extraction stopped (is it really polluted? If so, is it being
polluted by the Naveen Hotel? If so, why don’t the authorities stopthem discharging waste into the tank?)
• size of Tank• how many cubic meters of water?• how long is the perimeter (edge of lake)?
• population in surrounding/adjacent villages• number of people• number of households.
Stakeholders Number of individuals/households within thisstakeholder group
Average value given bythis stakeholder groupto the resource
Recreational
• boating
• fishing
Commercial / Household
• bathing/sanitation
• clothes washing(commercial)
• clothes washing(household)
• fishing
• irrigation
• washing buffaloes
• washing bullocks
• washingvehicles/machinery
22
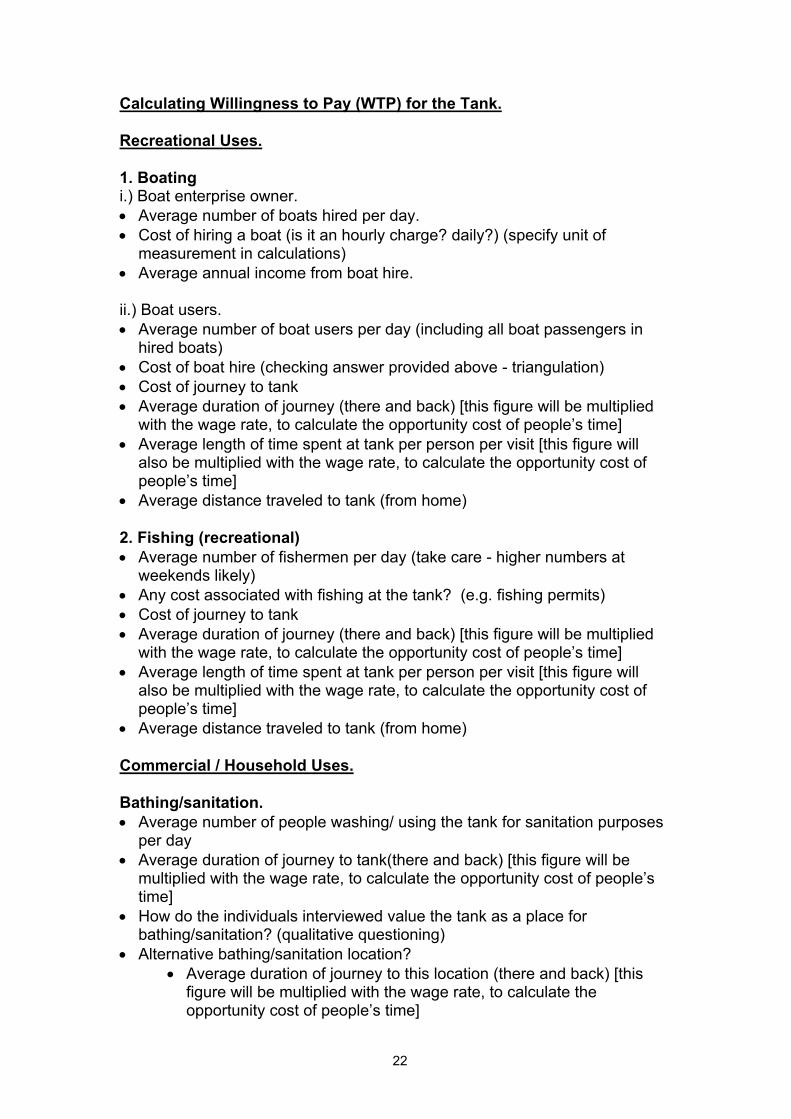
Calculating Willingness to Pay (WTP) for the Tank. Recreational Uses. 1. Boating i.) Boat enterprise owner.• Average number of boats hired per day.• Cost of hiring a boat (is it an hourly charge? daily?) (specify unit of
measurement in calculations)• Average annual income from boat hire. ii.) Boat users.• Average number of boat users per day (including all boat passengers in
hired boats)• Cost of boat hire (checking answer provided above - triangulation)• Cost of journey to tank• Average duration of journey (there and back) [this figure will be multiplied
with the wage rate, to calculate the opportunity cost of people’s time]• Average length of time spent at tank per person per visit [this figure will
also be multiplied with the wage rate, to calculate the opportunity cost ofpeople’s time]
• Average distance traveled to tank (from home) 2. Fishing (recreational)• Average number of fishermen per day (take care - higher numbers at
weekends likely)• Any cost associated with fishing at the tank? (e.g. fishing permits)• Cost of journey to tank• Average duration of journey (there and back) [this figure will be multiplied
with the wage rate, to calculate the opportunity cost of people’s time]• Average length of time spent at tank per person per visit [this figure will
also be multiplied with the wage rate, to calculate the opportunity cost ofpeople’s time]
• Average distance traveled to tank (from home) Commercial / Household Uses. Bathing/sanitation.• Average number of people washing/ using the tank for sanitation purposes
per day• Average duration of journey to tank(there and back) [this figure will be
multiplied with the wage rate, to calculate the opportunity cost of people’stime]
• How do the individuals interviewed value the tank as a place forbathing/sanitation? (qualitative questioning)
• Alternative bathing/sanitation location?• Average duration of journey to this location (there and back) [this
figure will be multiplied with the wage rate, to calculate theopportunity cost of people’s time]
23
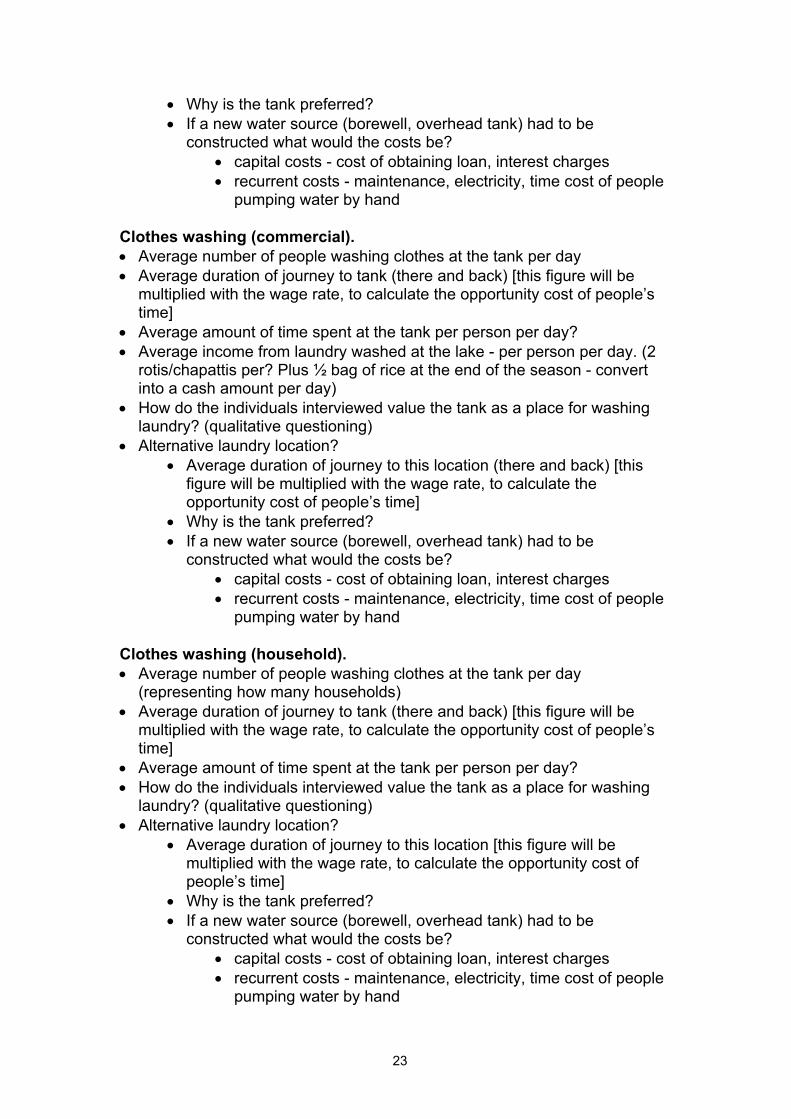
• Why is the tank preferred?• If a new water source (borewell, overhead tank) had to be
constructed what would the costs be?• capital costs - cost of obtaining loan, interest charges• recurrent costs - maintenance, electricity, time cost of people
pumping water by hand Clothes washing (commercial).• Average number of people washing clothes at the tank per day• Average duration of journey to tank (there and back) [this figure will be
multiplied with the wage rate, to calculate the opportunity cost of people’stime]
• Average amount of time spent at the tank per person per day?• Average income from laundry washed at the lake - per person per day. (2
rotis/chapattis per? Plus ½ bag of rice at the end of the season - convertinto a cash amount per day)
• How do the individuals interviewed value the tank as a place for washinglaundry? (qualitative questioning)
• Alternative laundry location?• Average duration of journey to this location (there and back) [this
figure will be multiplied with the wage rate, to calculate theopportunity cost of people’s time]
• Why is the tank preferred?• If a new water source (borewell, overhead tank) had to be
constructed what would the costs be?• capital costs - cost of obtaining loan, interest charges• recurrent costs - maintenance, electricity, time cost of people
pumping water by hand Clothes washing (household).• Average number of people washing clothes at the tank per day
(representing how many households)• Average duration of journey to tank (there and back) [this figure will be
multiplied with the wage rate, to calculate the opportunity cost of people’stime]
• Average amount of time spent at the tank per person per day?• How do the individuals interviewed value the tank as a place for washing
laundry? (qualitative questioning)• Alternative laundry location?
• Average duration of journey to this location [this figure will bemultiplied with the wage rate, to calculate the opportunity cost ofpeople’s time]
• Why is the tank preferred?• If a new water source (borewell, overhead tank) had to be
constructed what would the costs be?• capital costs - cost of obtaining loan, interest charges• recurrent costs - maintenance, electricity, time cost of people
pumping water by hand
24
Fishing (commercial). 1.) Fishing Contractor• What price does he pay for the contract per year?• What income does he gain from the contract (e.g. sub-contracting) 2.) Fishermen/women. (5 contracting households - plus any others?)• Average number of people fishing at the tank per day - representing how
many households?• Average duration of journey to tank (there and back) [this figure will be
multiplied with the wage rate, to calculate the opportunity cost of people’stime]
• Average amount of time spent at the tank per person per day?• Average income from fish caught at the lake - per person (or per household
- which ever unit of measurement works better) per day.• Alternative sources of household income?• Alternative fishing location?
• If there is an alternative… average duration of journey to thislocation [this figure will be multiplied with the wage rate, to calculatethe opportunity cost of people’s time]
• Why is the tank preferred? Irrigation.• how many hectares are irrigated around the tank?• how many farm households does this benefit (farm households, farm
labourers?)• what is the average increase in crop yield as a result of irrigation? how
much does this increase the income per hectare? ⇒ this will give the benefit from irrigation per hectare • what are the alternative sources of irrigation? What would they cost (capital
and recurrent costs per hectare)? Washing buffaloes.• how many buffalo owners are there in the communities around the tank?• how many buffaloes?• on average, how often do the buffalo owners bring their buffaloes to be
washed?• how long does the journey take to bring the buffaloes to the tank (there and
back) (average)• how long does the buffalo owner spend at the tank each visit (average)• alternative washing site
• how long does would the journey take (there and back) (average)• why is the tank preferred?
Washing bullocks.
25
• how many bullock owners are there in the communities around the tank?• how many bullocks?• on average, how often do the bullock owners bring their bullocks to be
washed?• how long does the journey take to bring the bullocks to the tank (there and
back) (average)• how long does the bullock owner spend at the tank each visit (average)• alternative washing site
• how long does would the journey take (there and back) (average)• why is the tank preferred?
Washing vehicles/machinery.• how many vehicle or machinery owners bring their vehicles to be washed at
the tank (average per day)?• on average, how often do the vehicle or machinery owners bring their
vehicles or machinery to be washed?• how long does the journey take to bring the vehicles or machinery to the
tank (there and back) (average)• how long does the vehicles or machinery owner spend at the tank each visit
(average)• alternative washing site
• how long does would the journey take (there and back) (average)• why is the tank preferred?
Brick making. Does brick making take place using resources from the tank? If so, how canwe place a value on this activity? Farmers - taking tank silt. Do any farmers from the surrounding area take tank silt from Unkal Tank? Ifthey do, what value can we place on the silt taken (amount taken, hectares ofland improved with silt, enhanced productivity of land - resulting in ‘x’ increasein yield, and ‘y’ increase in income - or preventing ‘z’ decline) Hotel Naveen. What benefit does the hotel gain from its location?• attractive location - how to value this?• free sewage disposal - cost of connection to HDMC sewage system Others? Please list any other stakeholders and develop a methodology to discover thevalue that they place on the resource provided by the tank. (E.g. There is agroup of people camping on the shores of the lake. What are they doingthere? How long do they spend there? What benefits do they gain from thelake? Can you put a value to them?) Case Study 2: Agricultural land at risk from encroachment.
26
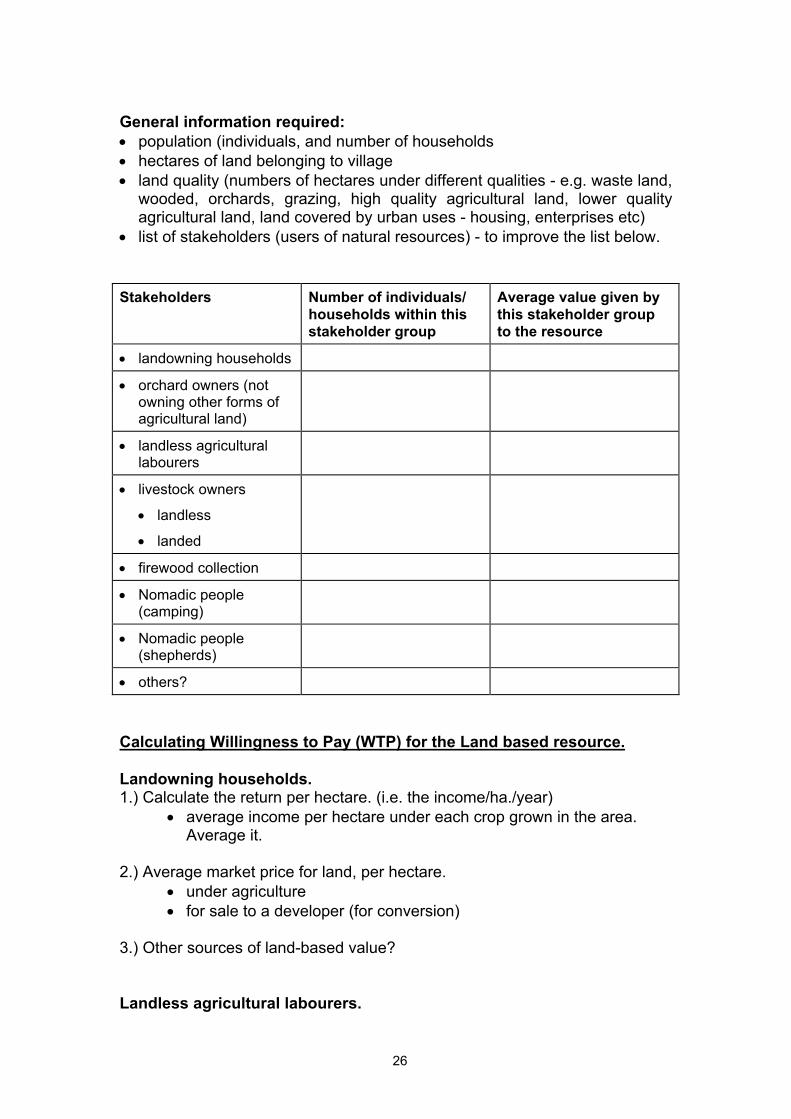
General information required:• population (individuals, and number of households• hectares of land belonging to village• land quality (numbers of hectares under different qualities - e.g. waste land,
wooded, orchards, grazing, high quality agricultural land, lower qualityagricultural land, land covered by urban uses - housing, enterprises etc)
• list of stakeholders (users of natural resources) - to improve the list below.
Stakeholders Number of individuals/households within thisstakeholder group
Average value given bythis stakeholder groupto the resource
• landowning households
• orchard owners (notowning other forms ofagricultural land)
• landless agriculturallabourers
• livestock owners
• landless
• landed
• firewood collection
• Nomadic people(camping)
• Nomadic people(shepherds)
• others?
Calculating Willingness to Pay (WTP) for the Land based resource. Landowning households. 1.) Calculate the return per hectare. (i.e. the income/ha./year)
• average income per hectare under each crop grown in the area.Average it.
2.) Average market price for land, per hectare.
• under agriculture• for sale to a developer (for conversion)
3.) Other sources of land-based value? Landless agricultural labourers.
27
• Average labour days per hectare. [Number of agricultural labourersemployed per hectare per annum]
• Multiply labour days/ha by average wage rate (average annual incomefigure/ha)
• Give as an average figure per hectare per day.• Alternative source of livelihood? Why is agricultural work preferred? Livestock owners (Landless). Grazing/fodder, supports livestock.• number of households in this category owning livestock• number of livestock• where do they get fodder?• volume of fodder required (average, per year)
• Market value of fodder• Cost of ‘free’ fodder
• labour costs - herding, cutting, duration of travel to and from,duration herding, or cutting - multiply by wage rate (forchildren @ Rs. 25/day)
Livestock owners (Landed). Grazing/fodder, supports livestock.• number of households in this category owning livestock• number of livestock• where do they get fodder?• volume of fodder required (average, per year)
• Market value of fodder• Cost of ‘free’ fodder
• labour costs - herding, cutting, duration of travel to and from,duration herding, or cutting - multiply by wage rate (forchildren @ Rs. 25/day)
Firewood collection.• Who collects firewood?• Where is firewood collected from?• How far is it from the village? (Journey duration time)• How often (average) does a member of the household have to collect
firewood? (frequency)• What other fuel sources are there?• How much do they cost? How long do they take?• Why is wood preferred/not preferred? ⇒ gives value of firewood (through opportunity cost of time, and value of
alternative) Nomadic people (camping). Generate a value using the best estimate that you can.
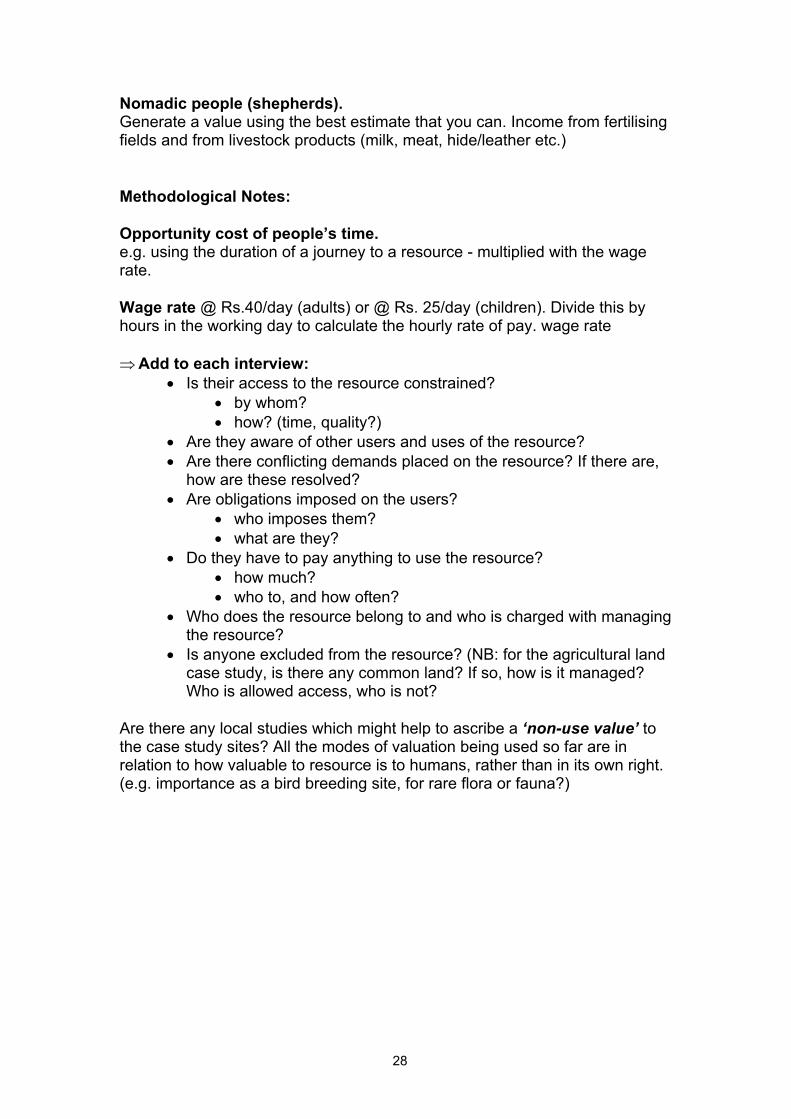
28
Nomadic people (shepherds). Generate a value using the best estimate that you can. Income from fertilisingfields and from livestock products (milk, meat, hide/leather etc.) Methodological Notes: Opportunity cost of people’s time. e.g. using the duration of a journey to a resource - multiplied with the wagerate. Wage rate @ Rs.40/day (adults) or @ Rs. 25/day (children). Divide this byhours in the working day to calculate the hourly rate of pay. wage rate ⇒ Add to each interview:
• Is their access to the resource constrained?• by whom?• how? (time, quality?)
• Are they aware of other users and uses of the resource?• Are there conflicting demands placed on the resource? If there are,
how are these resolved?• Are obligations imposed on the users?
• who imposes them?• what are they?
• Do they have to pay anything to use the resource?• how much?• who to, and how often?
• Who does the resource belong to and who is charged with managingthe resource?
• Is anyone excluded from the resource? (NB: for the agricultural landcase study, is there any common land? If so, how is it managed?Who is allowed access, who is not?
Are there any local studies which might help to ascribe a ‘non-use value’ tothe case study sites? All the modes of valuation being used so far are inrelation to how valuable to resource is to humans, rather than in its own right.(e.g. importance as a bird breeding site, for rare flora or fauna?)
29
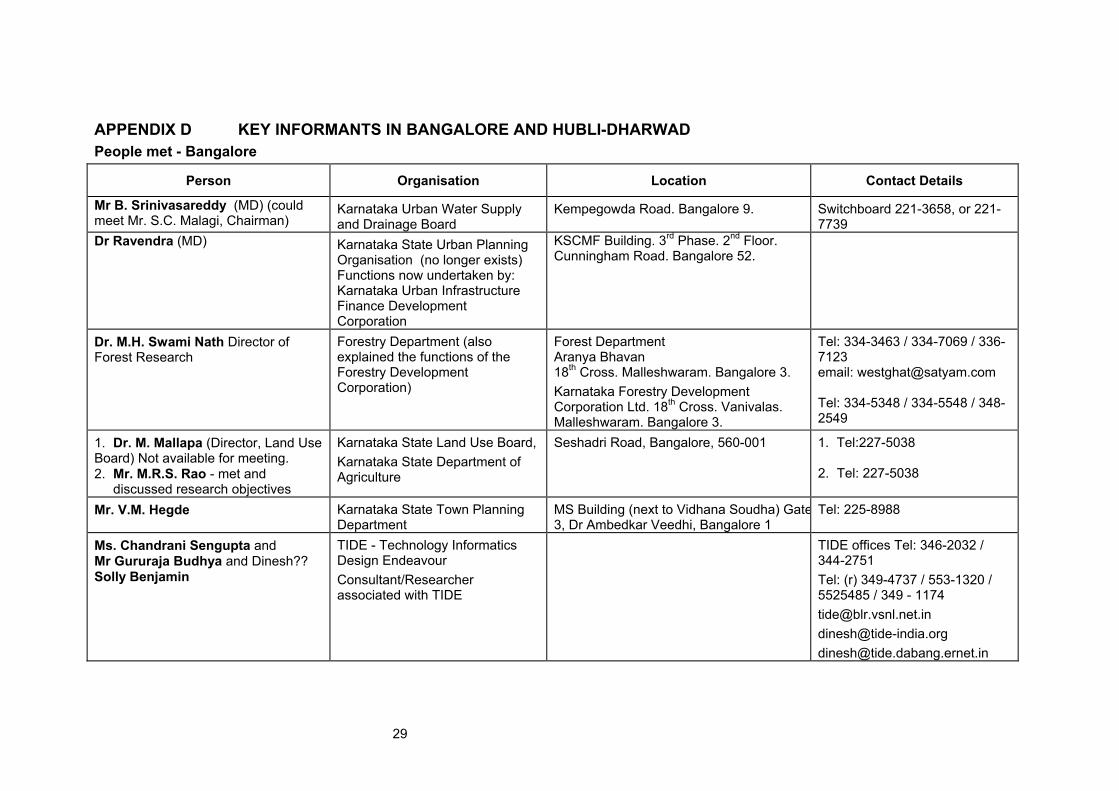
APPENDIX D KEY INFORMANTS IN BANGALORE AND HUBLI-DHARWADPeople met - Bangalore
Person Organisation Location Contact Details
Mr B. Srinivasareddy (MD) (couldmeet Mr. S.C. Malagi, Chairman)
Karnataka Urban Water Supplyand Drainage Board
Kempegowda Road. Bangalore 9. Switchboard 221-3658, or 221-7739
Dr Ravendra (MD) Karnataka State Urban PlanningOrganisation (no longer exists)Functions now undertaken by:Karnataka Urban InfrastructureFinance DevelopmentCorporation
KSCMF Building. 3rd Phase. 2nd Floor.Cunningham Road. Bangalore 52.
Dr. M.H. Swami Nath Director ofForest Research
Forestry Department (alsoexplained the functions of theForestry DevelopmentCorporation)
Forest DepartmentAranya Bhavan18th Cross. Malleshwaram. Bangalore 3.Karnataka Forestry DevelopmentCorporation Ltd. 18th Cross. Vanivalas.Malleshwaram. Bangalore 3.
Tel: 334-3463 / 334-7069 / 336-7123email: [email protected]
Tel: 334-5348 / 334-5548 / 348-2549
1. Dr. M. Mallapa (Director, Land UseBoard) Not available for meeting.2. Mr. M.R.S. Rao - met and
discussed research objectives
Karnataka State Land Use Board,Karnataka State Department ofAgriculture
Seshadri Road, Bangalore, 560-001 1. Tel:227-5038 2. Tel: 227-5038
Mr. V.M. Hegde Karnataka State Town PlanningDepartment
MS Building (next to Vidhana Soudha) Gate3, Dr Ambedkar Veedhi, Bangalore 1
Tel: 225-8988
Ms. Chandrani Sengupta andMr Gururaja Budhya and Dinesh??Solly Benjamin
TIDE - Technology InformaticsDesign EndeavourConsultant/Researcherassociated with TIDE
TIDE offices Tel: 346-2032 /344-2751Tel: (r) 349-4737 / 553-1320 /5525485 / 349 - [email protected]@[email protected]
30
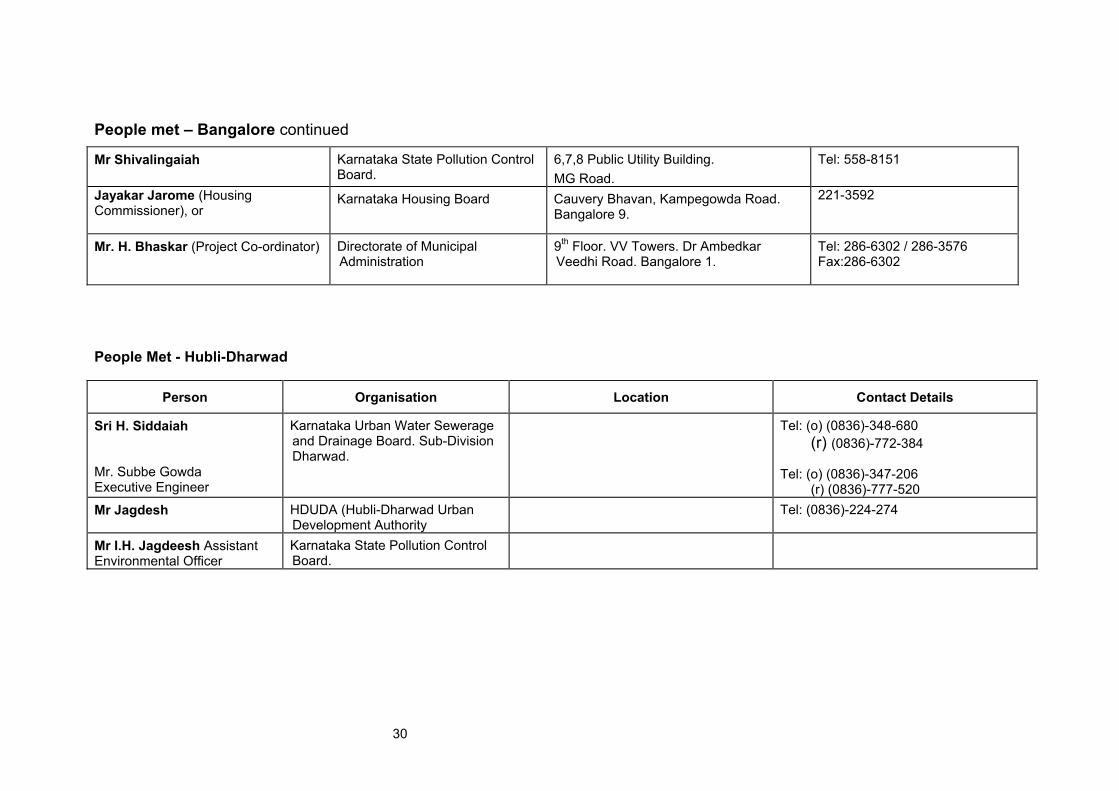
People met – Bangalore continued
Mr Shivalingaiah Karnataka State Pollution ControlBoard.
6,7,8 Public Utility Building.MG Road.
Tel: 558-8151
Jayakar Jarome (HousingCommissioner), or
Karnataka Housing Board Cauvery Bhavan, Kampegowda Road.Bangalore 9.
221-3592
Mr. H. Bhaskar (Project Co-ordinator) Directorate of MunicipalAdministration
9th Floor. VV Towers. Dr AmbedkarVeedhi Road. Bangalore 1.
Tel: 286-6302 / 286-3576Fax:286-6302
People Met - Hubli-Dharwad
Person Organisation Location Contact Details
Sri H. Siddaiah
Mr. Subbe GowdaExecutive Engineer
Karnataka Urban Water Sewerageand Drainage Board. Sub-DivisionDharwad.
Tel: (o) (0836)-348-680(r) (0836)-772-384
Tel: (o) (0836)-347-206(r) (0836)-777-520
Mr Jagdesh HDUDA (Hubli-Dharwad UrbanDevelopment Authority
Tel: (0836)-224-274
Mr I.H. Jagdeesh AssistantEnvironmental Officer
Karnataka State Pollution ControlBoard.
31
APPENDIX E NOTES FROM KUMASI VISIT BY PROJECT LEADER
During the visit, a number of meetings were held with various stakeholders,including:
• Owusu Achiaw, Town Planner, Town and Country Planning Department• Mr Asare, Forestry Department (Manager of the Collaboration Unit)• Kenneth B. Maison, Ghana Water and Sewage Corporation (GWSC)• Mr Mantey, Director, Regional EPA• Mr Asigri, Town and Country Planning Department (also involved in the
Regional Co-ordinating Unit)• Land Valuation Department (part of the Lands Commission)
From these meetings, we concluded that there were four possibilities fortesting out the decision-framework:
1. Barakese reservoir.2. Floodplain in Kumasi – a project, Kumasi Improved Drainage Project,
which could provide more land for development and decrease thefloodplain. We do not have any material on this project, but will try to findout more and sketch out a possible valuation approach in the report onKumasi.
3. Agricultural land that could be developed.4. Sand and gravel extraction from rivers – taking sand and gravel for
construction and causing rivers to become increasingly sedimented andstagnant.
In terms of ease of access to information, we decided that we would attemptto value the Barakese reservoir and two sites of agricultural land that are inareas where development is a strong possibility.
Barakese reservoirMain reservoir that provides water for Kumasi and many surrounding villages.Fishing is allowed. Compensation has recently been paid to farmers for theirloss of land – taking into account size of plots and crops. There are manyvisitors to the site, but these may come to see the water treatment works, asmuch as the reservoir. The reservoir is artificial and has been created from ariver.
Stakeholders• GWSC – the corporation and the employees?• Urban dwellers• One local villages – fishing• Resettlement village – levels of compensation, previous uses (and values
of) of the river.
Approach• More information about compensation.• PRA – what kind of access do villagers and employees have for fishing?
32
• Fishing – levels of catches, what do they do with the catches – if they sellany of it, how much for and if it is for home consumption, how would theyhave had to pay for it.
• Could find out more information about the ecological functions of thereservoir?
Agricultural land that could be developedDescription of the areas in terms of agriculture and development activities.
Stakeholders• Perspective developers• Land owners• Farmers• Planning authority• Politicians• Community
Information on• Agricultural productivity and crop prices• Land values when sold – who gets what revenue?• What, if any, compensation do the farmers get?
ReportWe hope to conclude this research by the beginning of August. The Kumasireport will include:
• Descriptions of the resources.• Description of the stakeholders, the types of decisions made about the
resource (by whom?) and the implications of those decisions.• Approaches used.• Comments on the approaches, including how they would complement
methods already used, and thoughts on further research.