
Natural Monopoly and Distorted Cpmpetition: Evidence from ... · 2 Bank of Canada Working Paper...
40
Working Paper/Document de travail 2012-26 Natural Monopoly and Distorted Competition: Evidence from Unbundling Fiber-Optic Networks by Naoaki Minamihashi
Transcript of Natural Monopoly and Distorted Cpmpetition: Evidence from ... · 2 Bank of Canada Working Paper...

Working Paper/Document de travail 2012-26
Natural Monopoly and Distorted Competition: Evidence from Unbundling Fiber-Optic Networks
by Naoaki Minamihashi

2
Bank of Canada Working Paper 2012-26
August 2012
Natural Monopoly and Distorted Competition: Evidence from Unbundling
Fiber-Optic Networks
by
Naoaki Minamihashi
Financial Markets Department Bank of Canada
Ottawa, Ontario, Canada K1A 0G9 [email protected]
Bank of Canada working papers are theoretical or empirical works-in-progress on subjects in economics and finance. The views expressed in this paper are those of the author.
No responsibility for them should be attributed to the Bank of Canada.
ISSN 1701-9397 © 2012 Bank of Canada

ii
Acknowledgements
This paper has benefitted from continuous suggestions and the overall guidance of Marc Rysman. The industrial research background relies heavily on the deep knowledge of Ingo Vogelsang. I am indebted to Matthew Chesnes, Scott Hendry, Takanori Ida, Jordi Jaumandreu, Joshua Lustig, Keizo Mizuno, Hector Perez Saiz, David Prentice, Yuya Takahashi, Ben Tomlin, Masatsugu Tsuji and Jonathan Witmer for discussions that generated great improvements. I also thank M. Hansen, C. Ho, T. Kuroda, M. Sunada, E. Yilmaz and participants at Boston U., CEA, EARIE, ESNASM, IIOC, ITS, JEA, JFTC, KGIO, Osaka U., SAEe and TPRC. I acknowledge the help Hiroshi Ohashi, MIC and NTT East for data usage, and Masaru Fujino (MIC) and Hirofumi Suto (NTT) for Japanese regulation knowledge. This paper was awarded 1st prize in the TPRC student paper competition and the Moriguchi Prize from the ISER at Osaka University. I acknowledge the Talent Strategy Grant from the Bank of Canada. The author takes full responsibility for any remaining errors. This paper was previously circulated as “Prevention of Competition by Competition Law.”

iii
Abstract
Can regulation solve problems arising from a natural monopoly? This paper analyzes whether “unbundling,” referring to regulations that enforce sharing of natural monopolistic infrastructure, prevents entrants from building new infrastructure. It models and estimates a dynamic entry game to evaluate the effects of regulation, using a dataset for construction of fiber-optic networks in Japan. The counterfactual exercise shows that forced unbundling regulation leads to a 24% decrease in the incidence of new infrastructure builders. This suggests, therefore, that when a new technology is being diffused, regulation to remove a natural monopoly conversely involves risks that regulated monopolists’ shares will increase.
JEL classification: K23, L43, L96 Bank classification: Market structure and pricing; Productivity
Résumé
La réglementation peut-elle résoudre les problèmes associés à un monopole naturel? L’auteur étudie si le « dégroupement », dont l’imposition oblige les entreprises qui exercent un monopole naturel à partager leur infrastructure, empêche la construction de nouvelles infrastructures par des firmes faisant leur entrée sur le marché. Afin d’évaluer les effets de la réglementation, l’auteur modélise et estime un jeu dynamique d’entrée en utilisant un ensemble de données relatives à la construction de réseaux à fibres optiques au Japon. Les résultats de la simulation contrefactuelle indiquent que le recours forcé au dégroupement fait diminuer de 24 % le nombre de nouveaux constructeurs d’infrastructure. L’étude donne donc à penser qu’en période de diffusion d’une nouvelle technologie, chercher à supprimer un monopole naturel par la voie de la réglementation risque plutôt d’accroître la part du marché du monopoleur réglementé.
Classification JEL : K23, L43, L96 Classification de la Banque : Structure de marché et fixation des prix; Productivité
Should we use regulation to encourage competition? Historically, government authorities have
sought to foster competition by regulating the bundling behaviours of firms. In general, firms that
have natural monopolistic infrastructures often offer their own services exclusively by bundling.
For example, electric companies traditionally bundle the generation of electricity with the distrib-
ution of electricity via a monopolistic power grid system.1 More recently, Microsoft has bundled
software with its operating system. Apple also bundles music players and cell phones with its
digital music download system. If incumbent firms bundle these key infrastructures and offer their
services exclusively, new entrants must themselves provide this type of a bottleneck infrastructure
in order to enter the markets. However, the costs of providing this infrastructure can be prohibitive,
and, as a result, firms do not enter the market. This is the main argument for the regulation of mo-
nopolistic infrastructures.
Competition in the telecommunication industry has historically been highly regulated. Govern-
ments around the world have adopted "unbundling" regulations to accelerate competition among
carriers. This regulation requires that telephone companies that have a monopoly on local lines
share them with other companies at a regulated price.2 Local telephone lines are characterized as a
“natural monopoly”; it is not feasible for new entrants to build and maintain the lines due to huge
sunk costs. Absent regulation, there would be little competition in the industry and the incumbent
could charge monopolistic prices. Hence, governments regulate carriers with this infrastructure in
place to allow other firms to use their equipment, so that firms with no infrastructure can more
easily enter the markets, ensuring that consumers have access to a wide variety of high quality
services at a competitive price.3
Policymakers in telecommunications, however, are confronted with a new problem, namely
promoting the building of fiber-optic networks called fiber to the home (FTTH). These new fiber-
optic lines can transfer large amounts of data with faster transfer rates, enabling services such as
high speed internet, HDTV programs and cloud computing, and will replace traditional telephone
lines and cable TV lines. However, unbundling regulations decrease the incentive for fiber-optic
network builders to invest in this latest technology; as a result, few firms build home fiber-optic
networks. They forgo opportunities for monopolistic profits since they have to lend the fiber lines
at a low cost. Thus in 2003, the United States’ Federal Communications Commission (FCC)
amended the law and removed unbundling regulations on fiber-optic premises in order to accel-
1The gas, water, postal and railroad industries have similar characteristics.2"Unbundling" here means a regulation to open a natural monopolistic infrastructure. This word comes from
prohibiting the bundling of an natural monopolistic infrastructure with its usage.3Industries that have similar natural monopolistic characteristics, such as the electric, gas, and railroad industries,
also have unbundling regulations. Indeed, industries without such regulations can run into trouble with consumers and
governments alike: recently, Microsoft and Apple have also been criticized for their monopolistic stance with respect
to their products Windows and iTunes, which prevents competition.
2
erate infrastructure competition among carriers and promote investments in fiber-optic networks,
even though many companies without facilities harshly objected.4 A change in unbundling regula-
tions could thus have an immense effect on investment in the information and telecommunications
industry, the penetration of fiber-optic networks, consumer welfare, and, ultimately, a country’s
productivity. Therefore, the regulation of fiber-optic networks is an important concern of policy-
makers in the world today.
However, few studies have examined the importance of unbundling regulations. The previous
literature focuses mainly on the effects of unbundling on service markets, such as the market for
the use of telephone lines. Using U.S. data, Greenstein and Mazzeo (2006) find that unbundling
widens the variety of entrants. Similarly, Economides, Seim and Viard (2008) find that compe-
tition in service markets induced by unbundling fosters lower-prices and higher-quality services.
Grajek and Roller (2012) find that access regulation decrease both total industry and individual
carrier investment using EU country-level data. Despite this literature, the effects of unbundling
on infrastructure competition itself have not been thoroughly considered, even though it is one of
the key elements for this type of regulations. This is because the construction of new infrastructure
under unbundling regulation is uncommon, and also because micro-level data on regulation are not
readily available. For example, in the telecommunication industry, metal networks were built more
than 50 years ago; the new fiber networks that are being formed will be the first since the 1960s.
We use this event for identifying the effect of unbundling on infrastructure market structure. In ad-
dition, this paper models dynamic strategic behaviours between infrastructure builders and users,
then quantifies the effects of regulation by counterfactual simulation.
This paper uses fiber-construction data from Japan for three reasons. First, Japan has expe-
rienced a rapid increase in the number of FTTH networks, while other countries have not yet
installed home fiber-optic networks.5 Second, Japan continued to regulate the unbundling of fiber-
optic lines during the construction of these networks, while other countries abandoned regulation.
4This deregulation of fiber-optic networks has been continually criticized by firms that use the unbundling sys-
tem and has created a controversy involving regulatory authorities. For example, in December 2009, Cbeyond,Inc,
supported by the Small Business Administration (SBA), filed a petition with the FCC to reverse the deregulation on
fiber-optic lines in the U.S. In response to this, the Telecommunications Industry Association (TIA) and the Fiber-to-
the-Home (FTTH) Council in January 2010 jointly filed with the FCC not to reverse the deregulation. Similar disputes
exist in Asia and Europe. For example, in Japan, SoftBank Corp., a firm using the unbundled facilities of another,
filed a lawsuit to ease the condition of fiber-unbundling in December 2011. In Australia, the largest telecom company,
Telstra, declared that it will not build fiber-optic networks if the unbundling regulation will be enforced on fiber-optic
lines.5The reason Japan experienced rapid diffusion is still an open question. It may come from its high population
density or cultural background of preference for high technology. Another reason may be the low installation cost
of fiber-optic lines. In Japan, most telephone/power lines are built using telephone poles, whereas other developed
countries in North America or Europe bury telephone lines underground because they value the scenery. It is more
costly to bury fiber-optic lines. Some economists claim that unbundling regulations promote diffusion as in Berkman
Report (2009), but there are also critiques of this view.
3

Table 1 shows the international comparisons for the diffusion and regulation of fiber-optic net-
works. Finally, in Japan, authorities and regulated firms also provide micro-level data, which are
not available in other countries.
Thus, by assessing the Japanese data, we can throw light on the general question of how un-
bundling affects new infrastructure construction and assess the policy changes in the U.S. and
other countries. From 2005 to 2009, the Japanese government continued to enforce unbundling
regulations on new fiber-optic lines during an important period of fiber-optic network construc-
tion. In the process, cable television and electric companies, competitors of the regulated firms,
reduced or stopped building fiber-optic lines. They claimed that the unbundling regulations on
incumbents decreased other firms’ incentives to build their own lines. Even though they were not
regulated to lend their lines to other companies,6 these firms were concerned because they would
have to reduce their price to compete with regulated companies and firms using the unbundled
lines. Compared with this, regulated companies increased their shares because they must lend un-
bundled lines to all other firms wanting to borrow them.7 As a result, in Japan, regulated firms have
dominated the infrastructure markets with the increase of unbundling usage, and regulators failed
to encourage competition in the building of fiber-optic networks.8 The regulation to remove the
"natural monopoly" ironically has strengthened a monopoly in infrastructure provision markets in
Japan. Figure 1 shows that the regulated firms’ (called NTT) share expanded with an increase of
unbundling usage.9
Studies on unbundling regulations in a country that continues the practice is of interest for
economists and policymakers, particularly as the United States removed this regulation in the early
2000s.10,11 Using the Japanese experience and several unique datasets, this paper analyzes the
effect of unbundling regulation on the entry decisions of new firms in building infrastructure and
market-structure change of infrastructure. In this paper, we show the effects of unbundling on cable
television’s entry decision into fiber-optic network construction using reduced-form probit models.
6Cable television companies do not have to lend their fiber-optic lines to other companies at the regulated low cost,
but they have to reduce their prices to compete with the regulated companies.7Cable television firms are also able to lend their lines to non-facility firms. However, it is not common as there is
no public system/regulation to share their lines, their coverage is narrower and the transaction costs to contract with
each of them are high.8Both pros and cons exist in the effort to generate competition in infrastructure: On the one hand, competition
generates technological innovation and excludes the price increase associated with monopolies. However, the existence
of two facilities in an area costs more and causes over-investment.9Regulation usage is measured by the number of unbundling-user firms at the municipal level.
10We should keep in mind that, contrary to Japan, the U.S. quit unbundling claimed by incumbent telecommunica-
tion companies, but the deregulated incumbents have not caught up with cable TV firms, and lose their share in home
fiber.11The Berkman Center at Harvard University surveyed international differences on how unbundling affects fiber-
optic networks, on behalf of the FCC. The FCC also visited Japan several times to investigate the regulation of fiber-
optic lines. These surveys are reflected in the U.S. National Broadband Plan.
4
Second, this paper assumes a dynamic game of infrastructure construction, models the behaviours
of the three types of players (regulated firms, unregulated firms and firms borrowing the unbundled
facilities), and estimates the effect of unbundling on the profits of new entrants. Then, using
the profit parameters from the dynamic structural estimation, this paper evaluates the unbundling
effects by counterfactual analysis. In both the reduced-form and structural estimations, we find
negative effects of unbundling on entry decisions for new builders of alternative networks. In the
counterfactual analysis, unbundling decreases new entry into the markets to provide infrastructure
by 24%. This empirical finding suggests that unbundling regulation during periods when new
technology is being diffused decreases competition in the infrastructure market.
This paper proceeds as follows. Section 1 offers an overview of the related literature. Section 2
discusses unbundling regulation and the Japanese experience with infrastructure competition and
fiber-optic penetration. The datasets to be used in this study, their management and their character-
istics are presented in Section 3. In Section 4, the evidence from reduced-form probit regressions
is provided. The dynamic entry game of infrastructure competition, estimation identification and
counterfactual analysis are discussed in Section 5. Section 6 concludes.
<INSERT TABLE 1 and FIGURE 1 HERE>
1 Related Literature
Traditional microeconomic textbook theory predicts a "trade-off" between facility-based and service-
based competition. The former refers to competition in the building of facilities, while the latter
refers to competition for the use of those facilities. It is well known that regulatory authorities
cannot stimulate both types of competition, because there would be no incentive to build facilities
if the regulators opened those facilities to encourage competition in service markets. However,
empirical research on this subject is uncommon because the building new of infrastructure in the
presence of unbundling regulation is rare and micro-level data are unavailable.
Recent theoretical papers on unbundling analyze the price and usage effects of unbundling on
the installation of infrastructure. Jorde, Sidak and Teece (2000) find that the usage of unbundling
decreases investment, and Bourreau and Dogan (2005) and Hori and Mizuno (2006) examine
regulation-price effects on infrastructure competition. Bourreau and Dogan (2006) also claim that
unbundling delays technology adoption. These theoretical papers suggest that unbundling regu-
lations reduce investment and competition in building infrastructures. On the other hand, Cave
(2006) and Cave (2009) propose a new regulation that stimulates both facility-based and service-
5

based competition, contrary to the traditional views.12
In empirical papers, the literature has considered the pros and cons of unbundling for social
benefits. As a positive, Greenstein and Mazzeo (2006) found that unbundling widened the variety
of entries in the telecommunications industry after the Telecomommincations Act of 1996 in the
United States. Economides, Seim and Viard (2008) find that competition induced by unbundling
increases social welfare for low price and high quality services. Conversely, Crandall, Ingraham
and Singer (2004) show that existing telecommunication carriers decrease their own investment as
a result of unbundling policies. Grajek and Roller (2012) find that access regulation decreases both
total industry and individual carrier investment by endogenizing regulations using EU country-
level data.
In the industrial organization literature, Bresnahan and Reiss (1991) is the seminal paper about
the structural estimation of entry and exit models. They analyze market demand and competi-
tive behaviours for a number of firms. Mazzeo (2002) expands this with quality differentiation,
and Seim (2006) considers it under an incomplete-information framework. Toivanen and Water-
son (2005) also study a multi-plant model. More recently, Aguirregabiria and Mira (2007), Bajari,
Benkard and Levin (2007), and Pakes, Ostrovsky and Berry (2007) study dynamic behaviour in en-
try and exit models, and the applied literature of dynamics such as Collard-Wexler (2012) and Ryan
(2012) is rapidly increasing. In the literature of telecommunication studies, Augereau, Greenstein
and Rysman (2006) and Goldfarb and Xiao (2011) provide important contributions using entry and
exit models.13
This paper differs from the previous literature because, first, we analyze whether unbundling
regulations prevent new entry into facility construction markets. Provision of natural monopolistic
infrastructures is an essential topic for this type of regulation. The results show that the regulations
increase the regulated firms’ share in infrastructure markets, because unbundling inhibits the build-
ing behaviour of new entrants. Second, we use the installation of new infrastructure to identify the
effects. The installation of fiber-optic lines to the home is a good case for analyzing the effects:
formation of new fiber-optic lines is rare and easily observed. Also, this new infrastructure com-
petition will have a big impact on future industry structures in telecommunications over the next
decades. Third, this paper estimates their strategic behaviours using dynamic structural models
and evaluates the regulation effects numerically. Entry decisions in natural monopolistic industries
are based heavily on dynamic behaviour and strategic interactions with a clear model. We can also
seperate the effect of regulation and simulate it by counterfactual policy simulations.
12However, Bourreau, Dogan and Manant (2010) criticize this type of regulation.13On the other hand, Chipty (2001), Chu, Leslie and Sorensen (2011) and Ho, Ho and Mortimer (2012) consider
bundling using structural analysis.
6

2 Unbundling and Fiber-Optic Networks
2.1 Telecommunications Act of 1996 and Export of the US Regulation
The Federal Communications Commission (FCC) started the Telecommunications Act of 1996 to
promote new entry and competition in the communication industry, mainly by using unbundling
regulation. Local-loop unbundling requires specific existing carriers with local premises to lend
their facilities to any competitors at a regulated low price. The literature shows that, as a result of
fair competition, unbundling regulation decreases prices, increases the variety of services, raises
consumer welfare, and provides high quality services, all of which are positive contributions to
society. Vogelsang and Mitchell (1997) analyze the regulation scheme. Unbundling regulation
was exported outside the United States, under WTO telecommunications law, and unbundling is
now imposed in more than 80 countries around the world.
In the U.S., however, regulated firms brought many suits against the regulations. They claimed
that the regulation decreased the investment of regulated firms, weakened facility-based competi-
tion, and infringed upon their property rights. In response to these claims and judicial decisions,
the FCC amended some of the regulations. Particularly, the FCC addressed the delay in providing
fiber to the home (FTTH). To encourage the diffusion of fiber-optic networks, the FCC, in 2003,
decided to remove unbundling regulation on fiber-optic lines. Whether this decision by the FCC
was good for social welfare is still under discussion. Firms that use unbundling are petitioning the
FCC to reverse its deregulation of unbundling on fiber-optic lines. Similar controversies exist in
Asia and Europe.
2.2 Fiber Technology and the Market Structure
Unlike the United States, Japan is a country that has faithfully adhered to the unbundling regula-
tion on both fiber and metal lines. Unbundling regulations were first introduced in 1997, and the
Telecommunications Business Act in Japan required the Nippon Telegraph and Telephone Corpo-
ration (NTT)14 to lend their local and relay lines, both fiber and metal, to all other firms at a low
government-decided rental price. The Japanese government unbundles only the NTT’s lines and
does not regulate other lines.15 Therefore, the regulation is asymmetric.
14In Japan, a government company offered telecommunication services exclusively as a monopolist until 1985, and
the company provides fair, inexpensive and high-quality services to the whole nation. However, competition was
needed to induce lower costs, wider variety, and flexible services.15Cable television companies can voluntarily rent their lines to other companies, but user companies have to contract
with each small CATV and the transaction cost is higher than NTT. Currently, most of the CATVs do not lend their
7

In 1985, the former government monopoly for telecommunications service was privatized and
became the NTT. In the same year, several firms entered the market as a result of the liberalization.
The NTT inherited most of the monopolistic premises as a "gift" from the government and made a
substantial profit for an extended period. After 1985, the NTT was divided into several firms, and,
by 2011, cable television companies, electrical utilities etc. had also built their lines and offered
wired telecommunications business.
Fiber to the home (FTTH) is a new technology that provides higher bandwidth. Compared to
traditional metal lines, fiber lines transmit signals at higher speed, with less loss of information and
with lower maintenance cost. Internet service providers in Japan began offering 1Gbps services
using FTTH in 2011. FTTH is a promising technology and the transfer speed of fiber lines can be
improved with technological progress, while drastic improvement in metallic-line service seems
unlikely.
In telecommunications, backbone networks are formed first. Stations are built in each area,
and the backbones between stations are linked to transfer large amounts of information. Next,
individual lines are built from stations to each unit, such as homes and offices. Therefore, when
each unit interacts online, it connects to the closest station first, then the signal is sent via the
backbone network to the station nearest the counterpart’s unit and finally the signal is transferred
to the destination unit.
The wired network between station and home is assumed to be a natural monopolistic in-
frastructure: only a few will provide this due to its huge sunk cost. Compared to this, the demand
for backbone networks is high and these networks are less costly to build than station-to-home net-
works. Therefore, several companies typically build backbones and these premises overlap. For
many developed countries, by 2000 the backbone networks had been changed from metal lines to
fiber lines, but the individual lines from stations to homes/offices remained metal for a long time.
In telecommunications, these problems are called "last mile" problems. The FTTH services refer to
the services that use fiber between stations and homes/offices and are this paper’s main concern.16
Unbundling enables firms without station-to-home networks to enter the markets.
2.3 Diffusion of Fiber-Optic Networks and Battles over Unbundling in Japan
The diffusion process of home fiber networks in Japan can be roughly divided into three stages.
First, in the early 2000s, the regulated firms’ (NTTs’) share of FTTH service was low. In March
lines to others.16We use the term FTTH in the sense that it is used by the Ministry of International Affairs and Communication,
which includes similar services such as hybrid fiber-coaxial (HFC).
8
2002, their share was 25.6%, and cable television (CATVs) and electric companies provided strong
competition. NTTs had metal telephone lines, CATVs had metal CATV lines, and electric com-
panies had their own electric lines. Therefore, it was easy to install fiber-optic lines next to their
pre-existing lines for NTT, CATVs and electric companies. CATVs and electric companies entered
the fiber market to earn profits from services such as high quality IP-phones, high definition TV
programs, and high speed internet. During this period, NTT’s infrastructure competitors preferred
unbundling regulations because such regulations were expected to decrease NTT’s investment in
fiber networks, in turn allowing competitors’ shares in the fiber market to increase.
In the middle of the decade, however, CATVs and electric utilities decreased their investments
or stopped building FTTH, because non-facility service providers entered the market using reg-
ulated NTT premises. These new firms took CATVs’ and electric utilities’ potential customers.
Also, even if CATVs were to build their own fiber lines, they would have faced harsh price com-
petition, since NTT premises have to be shared at a regulated low cost. Furthermore, the service
providers strongly demanded that the government reduce the rental price and increase the flexible
usage of the facility: service providers estimated and claimed the rental cost should be 690 yen
per fiber line a month, significantly different from the preset rental cost of 5094 yen. Conflicts
over the conditions and prices of fiber lines between the NTT and service providers involved the
Ministry of Internal Affairs and Communications (MIC), the Japan Fair Trade Committee (JFTC),
the courts, politicians, lawyers, and economists. In the battles between NTT and service providers,
CATVs and electric companies always filed petitions with the MIC stating that the unbundling
regulation decreased their incentive to enter the fiber-optic line market and increase investment.
They claimed that unbundling only favors the service market in allowing "fair" competition, but
negatively affects competitors in facility-based markets.
Finally, by the end of the 2000s, NTT’s share of fiber lines was around 75%; they dominated the
fiber facility market, eliminating other firms under unbundling regulation. A few CATV compa-
nies have started to borrow fiber lines from NTT, rather than build lines themselves.17 This market
structure was heavily criticized by both service providers and facility competitors facing a monop-
olistic situation. The MIC is discussing the divestiture of the operation of fiber lines from NTT.
However, NTT and their stockholders are heavily opposed to the idea because NTT has already
invested enormously to install fiber lines, and the infrastructure is one of the important sources of
profits for NTT.
17In general, CATVs do not share their lines with other firms. This is because there are only small economies of
scale in the CATVs’ size, and companies tend to be small. So, if user firms want to borrow lines from CATVs, they
have to negotiate for each customer. This significantly increases transaction costs. Electric companies cover wider
areas and sometimes lend their lines to other firms. However, compared to NTT and the government regulation system,
their share of lines is small.
9

This paper models their strategic behaviours, empirically estimates their profits and costs from
available datasets, and assesses numerically whether unbundling regulations prevent new entries
in the facility market and whether it induces regulated firms’ monopolization.
3 Data Description and Variables Construction
3.1 Data Sources
This paper uses four datasets and matches them at the municipal level. The first set is data on
the use of unbundling regulation. NTT East, a unique, regulated carrier in eastern Japan, provides
data on the number of companies that used NTT’s fiber-optic facility at the station level between
2005 and 2009.18 The number of stations that NTT upgraded to fiber lines is also taken from these
data.19
The second source is the entry and exit data in FTTH building markets. The Ministry of Internal
Affairs and Communications (MIC), a Japanese regulation authority, provides an information and
communications statistics database. Using these figures, we can detect which companies built
fiber-optic premises between a station and a home in a prefecture at a monthly interval. Therefore,
we can identify when, where, and which firms built FTTH.20
The third dataset reports figures that examine CATVs and their coverage area. The Regional
Broadcasting Division in the MIC provides facility data on CATVs at the municipal level. Using
this dataset, we can identify which CATVs enter which market. Combined with the second FTTH
dataset, we can deduce which CATVs built FTTH in which markets.21 Most firms that build fiber-
optic networks provide HDTV programs via fiber lines.22
The fourth dataset covers market characteristics. We use population, area, and income at a
market level. The population and area data are taken from the 2005 census, and income data are
taken from a tax division of the MIC.
18NTT West does not publish these data, so we exclude the sample in western Japan.19The usage data that NTT provided cover the following dates: 2005/01/31, 2006/03/31, 2007/03/31, 2008/04/30
and 2009/03/31. We assume that the interval difference in the data does not affect the main results.20The MIC changed its regulations in 2003 and firms can now build their lines freely. However, if they offer or stop
those services, they must register with the MIC. The MIC records that information and announces officially when and
which firms offer what kind of services in which area. We used these registration data for this study.21When the CATVs enter the market, they often offer their services to all of their coverage area, on the request of
application from customers. We assume therefore that CATVs offer the fiber service to all of their coverage area.22Most companies that build fiber lines offer TV program services. If there are some firms that do not offer it, we
assume that those are reflected in the market dummies. The data include firms such as TEPCO (operated by the Tokyo
Electric Power Company) and JCN (operated by KDDI).
10

3.2 Construction of Variables
3.2.1 Definition of Market
This paper combines the aforementioned four datasets at the municipal level. The municipality is
the smallest definition of a market that we can construct from public datasets. The data are taken
from the municipality as it existed in April 2009.23 After eliminating outliers at the 95% signif-
icance level,24 933 municipalities existed.25 The reason we use municipal-level data is twofold.
First, in our model of an entry game, we assume symmetric firms. If we use a larger definition
than the municipal level, it is possible that the assumption of a symmetric firm size is false. For
example, if we use a larger definition of a market, it is possible that 10-20 CATVs enter in one
market, but their actual sizes might be very different. If we divide large firms into small areas, we
can assume similar symmetric size in each area. Most markets contain zero to two CATVs, so this
would be reasonable. Second, this paper considers competing networks between CATV firms. In
other words, we assume consumers can choose fiber-optic lines from a few options, such as from
a regulated carrier (NTT) and one or two CATVs. If we use a larger region size, the consumers’
choice set is different from the actual one.26 Using the municipal market definition, in more than
95% of the markets, the consumer has a choice between 0 and 1 CATV to choose from for FTTH
services, and this is plausible, considering the actual consumers’ choice set in Japan. Table 2 shows
the number distribution of CATVs that build their own fiber lines.
<INSERT TABLE 2 HERE>
3.2.2 Usage of Unbundling Regulation
One of the key variables in this paper is the usage of unbundling regulation. Because we cannot
get direct data on the quantity in each market, we use this number as a measure of unbundling
regulation usage.27 We take two variables from this dataset: usage of "station to home" fiber-optic
networks and usage of "station to station." The "station to home" usage is our main concern, which
is the usage of fiber-optic networks between the core network and the home/office; this is a natural
23There were many mergers of municipalities in Japan from 2005-2009, and we reconstruct the data using the
definition in 2009.24We exclude outliers by number of families, area, income, usage level and station level.25We excluded Niigata and Kamiku Isshiki because they do not fit the definition of a municipal market in April
2009.26It is not realistic to have consumers choosing their FTTH services from among 10 CATVs in the telecommunica-
tion industry. In reality, they often do not compete with each other.27In the structural estimation, we relax this condition and model entry behaviours of unbundling-user firms.
11
monopolistic infrastructure in telecommunications. In each market there are several stations (the
average is 3.66). The maximum number of service providers for each station in the market is taken
as the market’s usage measure, assuming some big firms use all stations in the municipality.
Researchers typically evaluate the effects of regulations by comparing the status before and
after the introduction of regulation. Otherwise, they compare an area where a regulation is adopted
with one where it is not. Furthermore, they compare the areas where the strength of regulation
is different. We take this third way to evaluate the unbundling on fiber lines. The regulation sys-
tem of unbundling itself is the same all over eastern Japan: the regulated firm (NTT) has to lend
all its facilities to every applicant at the same rental price determined by the regulatory authority.
However, the usage level is different in each market. In Figure 2, we observe that the number of
service providers is different for each municipality, even if the municipalities have similar popu-
lation sizes and densities. There are several sources that contribute to this variation. One of the
main sources is the cost difference in each market. It costs a lot to build a fiber-optic network in
some rural areas that have a low population density or are isolated by mountains or seas. Even in
some urban locales, if the telephone/CATV lines are underground, the cost of building a fiber-optic
network is higher compared to installation via telephone poles. Therefore, in relatively low rental
price markets, firms are more likely to use regulated firms’ premises and the number of service
providers will be higher. Variation in usage, given market characteristics (such as the number of
regulated firms’ fiber stations, the number of households, population density, and the like), reflects
the relative importance of the regulation across markets. Figure 3 shows the markets of eastern
Japan. There is substantial variation in the types of markets: rural and urban areas, small and large
area, islands and mountains.
<INSERT FIGURE 2 and FIGURE 3 HERE>
3.2.3 Building Fiber-Optic Networks
Our main interest is to analyze whether CATVs built their own fiber networks between station to
home: the natural monopolistic infrastructure. The Information and Communications Statistics
Database in the MIC maintains records of which companies build networks in which prefecture.
Further, the MIC’s Regional Broadcasting Division Database can identify in which municipal-
ity the CATVs operate. By connecting these two, we can observe when and in which market
CATVs built fiber-optic networks. Because we only have firm/prefecture level fiber-optic entry
and municipal-level CATV activity, we assume that CATVs decide to enter at the prefecture level
on their own networks. Since most CATVs cover a few markets, we think this is a plausible as-
sumption.
12

NTTs, the regulated carriers, also built a fiber-optic network that covered most of Japan: NTTs
did not offer coverage to only 2 markets in eastern Japan.28 NTTs’ dataset shows how many
stations NTTs installed with fiber optics. This number of stations correlates to the number of fiber-
optic lines. However, the number of stations also depends on population density. More stations are
needed in a low density area than a high density area, even if the number of lines offered is equal.
Considering this aspect, we added the logarithm of area in the estimation equation.
The fiber-optic network technology is slightly different between CATVs and NTT. NTT uses
the fiber to the home (FTTH). Most CATV’s technology uses both hybrid fiber coaxial (HFC)29
and FTTH. The two technologies are similar. The difference lies in that HFC uses fiber lines to
connect the core network to a building area, and then uses metallic lines after this point, while
FTTH uses fiber lines entirely. The HFC has a slightly lower data transfer rate than the FTTH, but
both offer similar speeds and thus compete with each other.30
3.2.4 Market Characteristics
Because the decision to build a fiber-optic network depends on market factors, we use several
market characteristic variables. The variables can be grouped into two categories: demand and
cost factors. Demand factors include the number of households and average income. The number
of households measures the potential number of lines in a market. Ordinarily, one fiber line is
installed per household. Average income, defined as aggregate income divided by population in
each market, measures the wealth of the market; richer markets may have greater demand for
fiber-network premises. Area is included as the primary cost factor, since it costs more to install
fiber in lower density markets. All market variables are fixed for a calendar year because higher
frequency data are unavailable and also because they do not change much from year to year.31 We
take the number of households and area from the 2005 Japanese census. Income is taken from
the tax division of the MIC for 2008. Assuming the effects of these market characteristics are
concave, we take the log of all variables, after adding 1 to avoid an infinity problem.32 Tables 3
and 4 summarize the sample statistics.
<INSERT TABLE 3 AND TABLE 4 HERE>
28We deleted the markets in which NTT does not offer fiber.29This is called HFC HTTB or HTTC.30In Tokyo in June 2010, the NTT’s FTTH offered 200 Mbps for 6720 yen per month and J:COM (one of the
CATVs) offered 160 Mbps for 6300 yen per month.31In the estimation of the dynamic game, we can reduce the state space by fixing unchanging variables.32For example, it is likely the case that once income passes some threshold, demand will flatten out. By taking a
log, we can decrease these effects.
13

4 Results of Reduced-Form Models
4.1 Probit Models
4.1.1 Unbundling Effects on CATVs’ Fiber Networks Building Behaviours
First, we consider how much the usage of unbundling affects the entry of CATVs into fiber-optic
network building markets, using probit models. We assume the following estimation equations
with an IV probit model and consider how unbundling usage affects the building of fiber-optic
networks by CATVs. The area where unbundling usage is high, given other market characteristics,
will be the one where unbundling regulation is strong. If so, CATVs would build fewer fiber lines
in such markets. To check this, we assume the following estimation equation:
ymt = 1(y∗mt = β0 +β1×usagemt+β2×Incumbentmt+β3×stationmt+Xmtβ4 +dt+εmt > 0)
where ymt takes a value of 1 if there is entry by CATVs into the fiber-optic building market at
market m in year t, otherwise 0. The variable usagemt is the logarithm of the number of firms
that used the NTT’s regulated facility between station to home, which is our main variable of
interest.33 stationmt is the number of stations at which regulated firms (NTT) adopted the fiber-
optic lines. We use this variable as a measure of the quantity of NTT’s line. This variable is
for distinguishing the unbundling usage effects from NTT’s competitor effects in infrastructure
markets. Market characteristic variables, such as number of households, area and average income,
are represented by Xmt. We added the number of metal CATVs to adjust the ease with which
they can build fiber lines in the market. Also, the number of current incumbents (CATVs) in the
market that had previously built fiber-optic lines is shown as Incumbentmt. dt is the year dummy.
Assuming the effects of these variables are concave, we take the log of usagemt, stationmt and
market characteristics, after adding 1 to avoid an infinity problem.34
Unobservable market characteristics may affect CATV’s fiber-building behaviour. Also, the
CATV’s home fiber may decrease the unbundling usage and this generates a reverse causality
problem. Considering the endogeneity in usagemt, we take the number of firms that used the
33Another specification may be to use the rates of usage per stations usagemt
stationmt, rather than using usagemt itself,
to distinguish the unbundling effects from the staion effects. However, we are taking logs, so those effects will be
absorbed in the station coefficient. (Ex. β1× usagemt
stationmt+β3stationmt → β1 log usagemt+(β3−β1) log stationmt)
We can make a similar statement for the usagemt
populationmtspecification.
34We do not take a log for Incumbentmt, because most observations are 0 or 1, with a maximum of 3.
14
regulated facility between station to station as the instrument. When firms with no facilities enter
into the market, they typically use both station-to-home facilities and station-to-station facilities.
Some firms use just station-to-home lines; these are called bottleneck facilities, because some of
them already have station-to-station facilities. Therefore, the usage of station-to-station facilities
is related to the usage of station-to-home facilities. However, the decision of CATV firms whether
to build lines between station and home should be unrelated to the usage of the facilities between
station and station, because the station-to-station usage will not substitute for the lines between
home and station. We use this as an instrumental variable.35
The results are in the first column of Table 5. We observe a significant negative coefficient
on unbundling usage. Most of our estimates are significant with the predicted sign. Only the
coefficient on the number of regulated firms’ stations was not significant. From these results, we
can compute the marginal effects of unbundling usage on a CATV’s likelihood of building fiber
lines: a 1% increase in the number of service providers decreases by 4.31% the probability of new
entry of CATVs into the building market for home fiber-optic lines.
4.1.2 Unbundling Effects on Regulated Firms’ Fiber Networks Building
We also analyze how the unbundling systems affect the regulated firms’ building behaviour with
respect to the building of new home fiber networks. We use settings similar to those of CATVs.
The main difference is that we change the dependent variable to how many new fiber stations NTT
built in the market. The second column of Table 5 shows the results of the ordered probit model.36
In the results, there are no significant effects of unbundling usage. However, we should keep in
mind that this result uses the full sample, and there are significant positive effects in urban areas as
shown in the next section.
<INSERT TABLE 5 HERE>
4.2 Robustness Checks in Reduced-Form Regressions
In this section, we consider three types of robustness checks on the above results.
35In a robustness check, we consider previous usagemt−1 for usagemt. Also, we checked the endogeneity in
stationmt using the instruments as stationmt−1. In both case, we got robust results.36In an ordered probit model, there is no popular way to estimate with instrumental variables. So, we estimate the
ordered probit model without instruments. Also, we cut the metal CATV, because it will not affect the behavior of the
NTT. Furthermore, we do not add a constant in an ordered probit model.
15
4.2.1 Monopoly Settings
First, we check monopoly settings. We use the municipal-level market definition in the above
estimation. The municipal-level market is the smallest definition of a market possible given the
data constraints. The number of CATVs is less than three in most markets in our data, and it is
plausible that consumers do choose between one or two CATVs. However, it could be possible
that the CATVs do not compete with each other, for example, if two CATVs build fiber lines in a
municipality, but CATV A builds in the west and CATV B in the east. Then, our specification may
have a problem. To check for this problem, we reestimate using only municipalities where zero
or one CATV offered service for the entire sample. The results are in the first column of Table 6.
There are little changes from the base results in Table 5.
4.2.2 Instrumental Variables
Second, the validity of the instruments may be questioned. We attempt to account for the endo-
geneity of usage between home and station premises using usage between station and station as
instruments. There is the possibility of reverse causality in that CATV construction of home fiber
lines could decrease the usage of station-to-station. Because of this, we use past usage of station-
to-home as instruments. In the second column of Table 6, we confirm that there is a negative effect.
We also consider the endogeneity of stationmt using stationmt−1 as instruments in the third and
fourth columns of Table 6. The results are robust to these changes.
<INSERT TABLE 6 HERE>
4.2.3 Urban Area Differences
Third, we analyze whether the unbundling effect is differs across subsamples based on population
density. Unbundling is likely to have larger effects on fiber-line builders’ behaviour in urban areas.
This is because competition is keen and there is a high probability that several builders install
fiber lines within the city. We select the upper 33% of areas by population density and analyze
the results for the same basic model. Table 7 shows the results. For high density urban areas, the
unbundling effects on CATVs are still robust and similar in magnitude to those of the full sample.
However, the effect on regulated firms’ behaviour is significantly positive in these areas.37
<INSERT TABLE 7 HERE>
37In the non-urban areas, the estimation results are also similar to the basic results in the previous section.
16
5 Assessing Unbundling Effects by a Dynamic Game
5.1 Estimation of a Structural Dynamic Entry Game
In comparison to previous sections, here we consider the estimation of a structural dynamic entry
game. By modeling competition in building fiber-optic networks using a dynamic game, we in-
corporate several important features. First, we can estimate dynamic strategic behaviours between
infrastructure-building firms and firms that borrow those infrastructures. For example, CATVs’
decisions to build fiber lines relies heavily on how much regulated firms built fiber lines and how
much the lines are used by other firms, and vice versa. We model and estimate their endogeneously
interactive behaviours from actual outputs using equilibrium conditions of the model. Furthermore,
it takes a long time to build infrastructure, and the telecommunications industry has oligopolic char-
acteristics due to its huge sunk costs. Therefore, the entrants forecast future monopolistic profits
before making the decision to build a fiber-optic network facility. These can be estimated by a
dynamic structural model but not in the static models with no uncertainty.
Second, via this structural method, we can estimate unknown parameters that ordinary reduced-
form estimation methods cannot. The data are limited to entry and exit data of fiber-optic networks,
the usage of unbundling regulation, and market characteristics at the market level. Using these data,
we confirmed the effects on the entries in previous sections. However, by imposing certain eco-
nomic assumptions, we can estimate the mechanism through which the regulation affects entrants’
behaviours via their profit maximization; structural estimation can estimate how much their profits
from constructing infrastructure decrease with unbundling. Also, several concerns with the pre-
vious results can be tested with this type of estimation of a clear model. The regulated company,
NTT, is bigger than the small cable television firms, so NTT may have cost advantages of installing
fiber lines. Also, cable televisions’ main technologies are HFC (hybrid fiber coaxial): this can be
installed at a lower cost, but the speed is also a bit slower than FTTH. These two technologies
are competing, but some effects may come from this difference. In the structural estimation, we
clearly model their type difference in a dynamic game: each has different markets, cost and profit
systems, but they are competing with each other.38
Third, these estimates also have significant values when designing regulation. In the previous
reduced-form estimation, we cannot rationalize why unbundling decreases new entry. We can,
however, value the policy change with microfoundation by counterfactual simulation, using the
estimated parameters. In other words, modeling related players’ behaviours, we can quantify how
38Our model is a 3-type dynamic version of Mazzeo (2002), who considers entry behaviours of different types in
competing markets.
17

much unbundling decreases profits of fiber-line builders, and how much this lost profit will change
their entries. Then, we can predict the outcomes of policy changes.
5.2 Framework
There are m ∈ 1, 2, 3, ...,M independent geographic markets and t ∈ 1, 2, 3, ...,∞ discrete
infinite time periods. Here, the unit for m is a municipality and for t is one year. There are three
type of players τ ∈ CATV,NTT, Service Provider: the regulated carrier, NTT, and CATV
firms compete to build "station-to-home" fiber-optic networks in marketm. Also, service providers
borrow fiber lines from the NTT through an unbundling system. Therefore, this is a 3-type player
dynamic game and analyzes how they affect each other.39 CATVs decide whether to build station-
to-home fiber lines to their clients or not, NTT decides whether to build station-to-home fiber-optic
lines in its stations or not, and service providers decide to enter the markets using NTT’s facilities.
Their strategic behaviours affect each other. Because exit from offering fiber-optic services is very
rare in the diffusion periods, we limit the firms’ option to whether they enter or not. We deleted
those markets where firms exit a fiber-optic network construction.40
The timing of the game is as follows. First, at the beginning of each time period t, NTT, CATVs
and service providers observe: 1) the number of CATVs that have already constructed fiber-optic
networks; 2) the number of stations for which NTT has already adopted a fiber-optic network;
3) the number of service providers of NTT’s facilities; 4) market characteristics; 5) market fixed
effects and 6) current year. Second, CATVs decide whether or not to build a fiber-optic network
in the market, NTT decides whether or not to build its fiber-optic network in additional stations,
and service providers decide whether or not to enter into the markets using unbundling. These
decision are all made simultaneously. Third, entrant CATVs pay costs, and NTT also pays a cost
if they decide to increase lines (stations) for fiber-optic networks.41 At the end of each period, all
three types of players get profits from operating their business. After profits are realized, market
states evolve to the next period. We should keep in mind that this model assumes a one-year
"time-to-build": CATVs and NTT pay the building cost at time t, but they will earn profits after
t+ 1.
39A dynamic version of Mazzeo (2002).40Also, the decrease in the number of fiber-optic stations is vey rare: 1.6% of all observations. To estimate credible
values, we do not estimate the sell-off values on exit.41Service providers pay just operating cost and do not pay the entry sunk cost, because they can enter the market
using regulated firms’ facilities.
18
5.3 State and Action Variables
In recognition of the competition to build fiber-optic networks, we define four state variables:
the number of fiber-built CATVs, the number of fiber-built NTT stations, the number of service
providers of NTT fiber-facilities, and a year dummy. We assume that the first three are endogenous
state variables determined by the model, while the year dummy is an exogenous state variable
determined outside the model.42 We discretize the variables to reduce the state space: there are
15 values for the number of NTT’s fiber-built stations, and 15 values for the number of service
providers. There are 4 states for the number of fiber-built CATVs (0, 1, 2 and 3) and a 4-valued
year dummy. Therefore, the total state space is 4× 15× 15× 4 = 3600.43
Endogenous state variables evolve within the model and their transition probabilities are deter-
mined by the rational profit-maximizing behaviour of CATVs, NTT and service providers. Com-
pared with these, year dummies are determined exogenously: they increase over time but stop after
4 years. These transitions are common knowledge for players.
We assume that action variables are binary. For CATVs, it is whether or not to build station-
to-home fiber-optic networks for their clients. For NTT, it is whether or not to increase station-
to-home fiber-optic stations. For service providers, it is whether or not to enter the market using
NTT’s home fiber-optic networks.
5.4 Unobservable Heterogeneity
One of the important concerns for the relationship between CATVs’ entry and usage of NTT’s
facilities is unobservable heterogeneity. If there are some unobserved market characteristics, the
estimated results may be biased. For example, if for some reason markets have difficulty installing
fiber-network facilities, this causes an increase in the usage of installed lines and a decrease in entry
by CATVs. To avoid this unobserved market heterogeneity, we add market fixed effect variables.
To address this, we use a two-stage fixed approach. This approach is similar to that in other papers
such as Lin (2011) or the related literature. First, we take the average number of entrants for fiber
42Our paper examines the building of fiber lines. However, we consider the case in which unbundling usage is
endogenous.43We can consider other specifications of the state spaces. The baseline specification limits the state space for key
variables, considering that we have about 4000 observations. Our main interest is the relationship between CATVs’
behaviour, NTT’s behaviour, and regulation usage. We also add year effects for technological innovation and demand
change over time. This means that we do not differentiate value functions by those market characteristics. However,
Agguiregabira (2009) uses similar settings (even more restricted state-space cases) and replicates good results for two-
type dynamic entry models. We also calculate under the setting with more state variables as far as computing facilities
allow, such as discretized population, and area. However, the estimated results are similar.
19

CATVs and NTT’s fiber stations for each market. By regressing them on market characteristics,
we get residuals for each market. We discretize the residual for four bins and get dummies to adjust
the level of unobserved profitability. In the second stage, we add the dummies to the per period
payoff function to remove the unobserved heterogeneity bias.
5.5 Spurious Relationship
In the diffusion process, key variables such as usage of unbundling, NTT’s fiber stations and entry
of CATVs often increase simultaneously. There is the possibility of a spurious relationship. Fur-
ther, in the diffusion of new technology, the technology cost to install fiber lines will fall over time,
and demand for them will increase even if other market characteristics are the same. To remove
these effects, we add year dummies in the profit function. They increase with year and stop in
2009.44
5.6 Per Period Payoff Function
We assume a linear and reduced-form payoff function. Linear forms require less computing time
and are also a common approach in the literature.
πτimt = XmtβX︸ ︷︷ ︸Revenues of FTTH service
− ZmtβZ︸ ︷︷ ︸Costs of FTTH service
− g(N τ−imt, N
−τ−imt)︸ ︷︷ ︸
Competitors’ effect
− GmtβτG︸ ︷︷ ︸
Regulated usage effect
where πτimt is the profit of offering FTTH services of firm i of type τ at market m in year t. Xmt is
demand factors of the market (number of households and average income), Zmt is cost factors of
the market (area), g(N τ−imt, N
−τ−imt) is the competitors’ effect of similar services (number of other
CATVs, number of fiber stations of NTT and number of service providers), and Gmt is the effect
of unbundling regulation (regulation usage). These variables are the same as in previous sections.
We assume that CATVs and service providers are symmetric and that the size of NTTs’ stations
are also identical, and the number of NTTs’ stations can be thought as the measure of quantity.45
These firms conduct a Cournot-type competition, and the actual regulatory access rates are already
reflected in the usage of unbundling. We assume that CATVs and NTT pay a sunk cost to enter
and get zero profit if they do not enter.
44The reason it stops is for the limitation of the data.45These assumptions reflect the approach used in the previous literature of entry and exit models.
20

For the competitor effect, gτ (N τ−imt, N
−τ−imt), we do not assume proportional effects because
the first competitor’s effect is larger than the second competitor’s in CATV competition.46 We
also assume that the CATVs’ entry, NTTs’ construction and service providers’ entry all affect each
other. Reflecting these assumptions, the function of gτ (N τ−imt, N
−τ−imt) becomes the following:
gτ (N τ−imt, N
−τ−imt) = βCATV1 × presence of first CATV that built FTTH
+ βCATV2 × presence of second CATV that built FTTH
+ βCATV3 × presence of third CATV that built FTTH
+ βNTT4 × # of NTT’s fiber stations
+ βService Provider5 × # of service providers
5.7 Firm behaviour and the Markov Perfect Equilibrium
Under the above assumptions, CATVs, NTT and service providers simultaneously choose their
actions to maximize the present value of the sum of future profits. We can define their value
function as follows,
V (Sit) = maxaτit∈A
E[πτit(aτit, Sit) + β
∫V (Sit+1)dF (Sit+1|Sit,aτit)]
where aτit is an action variable of firm i, type τ and time t. Sit is the set of state variables for firm i
and time t. Following the previous literature, we assume that the discount factor β is 0.95 because
the data are annual. A Markov strategy is a mapping σi(Sit) 7−→ 0, 1 ∈ Ait, where Ai is the
firm’s action set. If CATV firms enter the market or NTT increases the number of fiber stations, it
is 1; otherwise, 0.
We can rewrite the above value function, conditional on the strategy,
V (Sit|σ) = E[πτit(σ, Sit) + β
∫V (Sit+1|σ)dF (Sit+1|Sit,σ)]
Then a set of Markov strategies (σ∗) is a Markov perfect equilibrium if and only if, for all i,
46Compared to CATVs, we divide NTT’s stations and the number of service providers into 15 bins. So, we do not
distinguish each incumbent for difficulty of the estimation.
21

Sit, and alternative strategies σ′−it, σ
∗ satisfies
V (Sit|σ∗it, σ−it) ≥ V (Sit|σ′it, σ−it)
5.8 Estimation Methodology
In this paper, we use the Aguirregabria and Mira (2007) [referred to as AM(2007)] nested pseudo
likelihood estimation (NPL). AM(2007) has robust characteristics with small sample bias and their
method can still find estimates even under the multiple equilibria.
The value function is defined as
V (xt) =
∫maxπ(xt) + εt(at) + β
∫V (xt+1)dF (xt+1|xt,at)g(dεt)
From observable actions, we can construct conditional choice probabilities (CCP),
pσitit (ait|xt, εt) = Pr(σit(xt, εit) = ait|x) =
∫I(σit(xt, εit) = ait)dF (εt)
I(.) is the indicator function, and we assume εt ∼ N(0,Ω).
The nested pseudo likelihood estimator is calculated using the following procedures.
Step 1: Set initial probability. We chose the initial CCP from the dataset, following AM(2007),
as
P 0(a′|x′) =
∑t
∑i I(ait = a′, xit = x′)∑t
∑i I(xit = x′)
Step 2: Given a CPP (P k), construct the pseudo maximum likelihood function and get the θk+1
by maximization
θk+1 = arg maxθ∈Θ
∑m
∑t
∑i ln Ψ(aimt|ximt : P k, θ)
where Ψ is the choice probability function.
22
Step 3: Based on P k and the θk+1 in step 2, update the probability function according
P k+1(aj|x) = Ψ(aj|ximt : P k, θk+1)
for all aj ∈ A and x ∈ X.
Step 4: Continuously update Step 2 and Step 3. Referring to Aguirregabiria (2009) and Pe-
sendorfer and Schmidt-Dengler’s (2010) non-convergence case, we take the results where θ mostly
converged in the first 50 repetitions.
5.9 Estimation Results
Table 8 shows the estimated parameters for the dynamic structural model.
Our main interest is how unbundling usage will affect the building of infrastructures. The
unbundling usage-effect coefficient on CATVs’ profit was significantly negative, and this indicates
that the unbundling decreases the CATVs’ profits for building fiber-optic networks. In other words,
it decreases CATVs’ incentives to build fiber. On the other hand, there is no effect of unbundling
usage on regulated firms’ profit to build fiber stations, while regulated firms’ profit from fiber
stations increase service providers’ profits.
For other variables, the coefficient of CATVs’ existence is negative, but most are not signifi-
cant. As predicted, the costs to build natural monopolistic infrastructures are significantly negative
with comparatively large magnitude, and this factor explains a large part of the profits and building
behaviours. On the market characteristics, a significant positive sign of regulated firms’ area re-
flects the fact that regulated firms have to build more fiber stations in a wider area. The significantly
negative sign on service providers’ income may suggest that low-income households prefer service
providers using unbundled infrastructure, because many those service providers offer inexpensive
services.
<INSERT TABLE 8 HERE>
5.10 Counterfactual Analysis
How much does unbundling affect behaviour in construction markets? Using the estimated para-
meters, we can quantify the effect of the regulation by counterfactual analysis.
23

This paper applies the methodologies used in Aguirregabiria (2012) and Aguirregabiria and
Ho (2012). We calculate the counterfactual conditional choice probabilities using the following
Taylor-series approximation:
P ∗m = P 0m + P 0
m ∗ (1−P 0m) ∗ (zP
0
m (θ∗ − θ0))
where P ∗im is the counterfactual conditional choice probability in market m, P 0m is the esti-
mated choice probability, 1 is a unit vector, zP0
m are regressors under the estimated choice proba-
bility, θ0 is the estimated parameters, and θ∗ is the parameters under counterfactual assumption.
To remove the effect of service providers on the profits of infrastructure builders, we make the
coefficients for unbundling usage in the profit functions of both CATVs and NTT zeros for the
counterfactual parameters.47 Using the counterfactual choice probabilities from the above equa-
tion, this paper simulates how infrastructure builders change their behaviour. We assume that the
regulator first decides to quit unbundling in 2005. The results are in Table 9. According to our
estimations, if the government had quit unbundling, 24% more CATVs would have built FTTH.
Compared to this, regulated firms decrease the number of fiber stations by around 0.6%.
One possible extension of this analysis would be to consider the expectation of infrastructure
builders in the counterfactual analysis. For example, after the government quits unbundling in order
to induce investments and infrastructure competitions in diffusion periods of new technology, it has
an incentive to restart unbundling once the new technology has prevailed. If infrastructure builders
expect this change in the regulator’s policy, the effect of quitting unbundling may be lower than
the current estimation. This is because builders’ behaviours will only be reflected in the diffusion-
periods’ monopolistic profits.
<INSERT TABLE 9 HERE>
6 Conclusion
This paper studies regulations that accelerate competition in one market and the effect of these
regulations on other related markets that are not targeted by those regulations. In particular, this
paper examines the effect of the unbundling of service provision on the structure of competition
47There is no significant effect of unbundling on regulated firms’ profit in the previous section, but Table 9 reports
the difference of parameters as if those effects exist.
24
in infrastructure markets, a focus that has been ignored in the previous literature. It evaluates how
usage of the unbundling regulation changes the behaviour of firms that build a natural monopolistic
infrastructure, using unique events of fiber-line formation under unbundling regulations.
This study finds that unbundling regulations block new entries and have a monopolization
effect on providers of unbundled infrastructure. Using the entry data of cable television firms in
building fiber-optic networks, as well as the usage data of regulated fiber-optic facilities, this paper
structurally estimates the profit function and the entry sunk cost to identify the regulation effects,
assuming a dynamic entry game. Estimation results suggest that regulation reduces the profit of
new entrants and prevents them from building their own fiber-optic networks. In the baseline
counterfactual simulation, we find that unbundling decreases new entry into infrastructure markets
by about 24%.
As a policy implication, this paper suggests the possibility that regulations regarding compe-
tition distort market discipline and reduce competition in infrastructure-building markets. New
firms build infrastructure, seeking monopolistic profits. Yet if regulations remove the possibility
for monopolistic gains, firms will not enter the markets. In the diffusion of new infrastructure, un-
bundling regulations negatively affect competition in the facilities-building markets. In 1997, when
unbundling started globally, government-built metal lines already existed, and privatized compa-
nies had been receiving monopolistic profits for a long time. Unbundling opened these networks,
and citizens benefited from competition in telecommunications. However, the situation changed in
Japan in the 2000s. The regulatory authority unbundled the firms that were building fiber lines, and
the resulting system strongly affected their building behaviours. Unbundling decreased entrants’
incentives to build new infrastructure. Japan is one of the ironic examples where the regulated car-
rier has monopolized the fiber-optic facility market, whereas normally unbundling aims to remove
the problems of a "natural monopoly."
This prevention of competition in infrastructure markets entails risks. Unbundling may de-
crease duplicative investment among infrastructure builders.48 However, for the next several decades,
little infrastructure competition may impede innovation and efficiency of facilities. Whether the
benefits of the low unbundling price in the diffusion period outweigh the risks in the long run is
still under question, because this market structure may continue in the next decades and efficiency
in the information and telecommunications industry is one of the key sources of economic growth
nowadays.
Countries all over the world are changing their metallic telephone/CATV lines to fiber-optic
48Vogelsang (2002) and Hoeffler (2007) claims a trade-off between the advantages of infrastructure-based competi-
tion and wasteful duplication.
25

lines. Policymakers face an important decision as to whether or not they will continue unbundling
regulations on the new lines. The United States has chosen to abandon unbundling. Japan continues
to enforce the regulation. Our findings from the Japanese experience suggest that unbundling in
periods of technological change reduces competition in telecommunication facilities.
26

References
[1] Aguirregabiria, Victor, 2009, ”Estimation of Dynamic Discrete Games Using the Nested
Pseudo Likelihood Algorithm: Code and Application,” Mimeo
[2] Aguirregabiria, Victor, 2012, ”A Method for Implementing Counterfactual Experiments in
Models with Multiple Equilibria,” Economics Letters 114, pp.190-194.
[3] Aguirregabiria, Victor and Chun-Yu Ho, 2012. "A Dynamic Game of Airline Network Com-
petition: Hub-and-Spoke Networks and Entry Deterrence," Journal of Econometrics 168,
pp.156-173.
[4] Aguirregabiria, Victor and Pedro Mira 2007, "Sequential estimation of dynamic discrete
games." Econometrica 75, 1-53.
[5] Augereau, A., Greenstein, S. and Rysman, M. 2006. "Coordination versus Differentiation in
a Standards War: The Adoption of 56K Modems," RAND Journal of Economics 37, pp.887-
909
[6] Berkman Center 2009 "Next Generation Connectivity: A Review of Broadband Internet Tran-
sitions and Policy from Around the World"
[7] Bajari, Patrick , C. Lanier Benkard and Jonathan Levin, 2007. "Estimating Dynamic Models
of Imperfect Competition." Econometrica 75, pp. 1331–1370
[8] Bourreau, Marc and Pinar Dogan 2005. "Unbundling the Local Loop," European Economic
Review, vol. 49, pp. 173-199.
[9] Bourreau, Marc and Pinar Dogan 2006. "Build or Buy Strategies in Local Markets," American
Economic Review, Papers and Proceedings, Vol. 96, no2, pp. 72-76
[10] Bourreau, Marc, Pinar Dogan and Matthieu Manant 2010. "A Critical Review of the "Ladder
of Investment" Approach," Telecommunications Policy, Vol. 34(11), pp. 683-696
[11] Bresnahan, T., and P. Reiss 1991. "Entry and competition in concentrated markets," Journal
of Political Economy, 99, pp. pp. 977-1009.
[12] Cave, Martin. 2006, "Encouraging infrastructure competition via the ladder of investment,"
Telecommunications Policy. v30. pp. 223-237
[13] Cave, Martin. 2009, "Snakes and ladders: Unbundling in a next generation world," Telecom-
munications Policy. v34. pp. 80-85
[14] Chipty, Tasneem. 2001, "Vertical Integration, Market Foreclosure, and Consumer Welfare in
the Cable Television Industry,” American Economic Review, Vol. 91, No. 3, pp. 428-453.
[15] Chu, Chenghuan Sean, Phillip Leslie, and Alan Sorensen. 2011. “Bundle-Size Pricing as an
Approximation to Mixed Bundling,” American Economic Review 101 (1): 263–303.
27
[16] Collard-Wexler, Allan. 2011, "Demand Fluctuations in the Ready-Mix Concrete Industry,"
Mimeo
[17] Crandall, Robert W., Ingraham, Allan T. and Singer, Hal J. 2004 "Do Unbundling Policies
Discourage CLEC Facilities-Based Investment?" The B.E. Journal of Economic Analysis &
Policy, Vol. 4, pp. 1-23.
[18] Economides, Nicholas, Katja Seim and V. Brian Viard, 2008. "Quantifying the benefits of
entry into local phone service," RAND Journal of Economics, vol. 39(3), pages 699-730.
[19] Goldfarb, Avi, and Mo Xiao. 2011. "Who thinks about the competition? Managerial ability
and strategic entry in US local telephone markets," American Economic Review 101(7): 3130-
3161
[20] Grajek, Michał and Lars-Hendrik Röller. 2012. "Regulation and Investment in Network In-
dustries: Evidence from European Telecoms," Journal of Law and Economics, Forthcoming
[21] Greenstein, Shane and Mazzeo, Michael. 2006 "The Role of Differentiation Strategy in Lo-
cal Telecommunication Entry and Market Evolution: 1999-2002," Journal of Industrial Eco-
nomics, v. 54, iss. 3, pp. 323-50
[22] Ho Katherine, Justin Ho, and Julie Holland Mortimer, 2012. "The Use of Full-Line Forcing
Contracts in the Video Rental Industry," American Economic Review 2012, 102(2): 686–719
[23] Höffler, Felix. 2007 "Cost and Benefits from Infrastructure Competition. Estimating Welfare
Effects from Broadband Access Competition," Telecommunications Policy, vol. 31, no. 6-7,
pp. 401-418.
[24] Hori, Keiichi and Mizuno, Keizo, 2006. "Access pricing and investment with stochastically
growing demand," International Journal of Industrial Organization, vol. 24(4), pages 795-
808, July.
[25] Jorde T.M., Sidak J.G. and D.J. Teece, 2000. "Innovation, Investment, and Unbundling," Yale
Journal on Regulation, vol. 17, pp. 1-37.
[26] Lin, H., 2011, Quality Choice and Market Structure: A Dynamic Analysis of Nursing Home
Oligopolies. Mimeo. Indiana University. Business School.
[27] Mazzeo, Michael. 2002. "Product Choice and Oligopoly Market Structure," RAND Journal
of Economics. 33(2): 221-242
[28] Pakes, A., Ostrovsky, M., Berry, S., 2007. Simple estimators for the parameters of discrete
dynamic games (with entry/exit examples). RAND Journal of Economics 38, 373-399.
[29] Pesendorfer, Martin and Philipp Schmidt-Dengler, 2010. "Sequential Estimation of Dynamic
Discrete Games: A Comment," Econometrica, vol. 78(2), pages 833-842
[30] Ryan, Stephen P. 2012. "The Costs of Environmental Regulation in a Concentrated Industry,"
Econometrica, forthcoming
28

[31] Seim, Katja, 2006. "An empirical model of firm entry with endogenous product-type
choices," RAND Journal of Economics
[32] Toivanen, O., and M. Waterson. 2005 "Market Structure and Entry: Where’s the Beef?,"
RAND Journal of Economics, 36(3), 680-699.
[33] Vogelsang, Ingo. 2002. "Incentive Regulation and Competition in Public Utility Markets: A
20-Year Perspective," Journal of Regulatory Economics, vol. 22(1), pp. 5-27.
[34] Vogelsang, Ingo and Bridger Mitchell. 1997 "Telecommunications Competition: The Last Ten
Miles," MIT Press and AEI Press
29

Figure 1: Share of Regulated Firms (NTTs) in Building FTTH Lines
Table 1: Regulations of the Telecommunications Industry in 2009
US Japan Germany France UK
1. Regulation on Wired Lines
Metallic Line R∗1 R R R R
Fiber-optic Line U∗2 R U∗3 U U
2. Diffusion
# of Broadband Subscribers∗4 81.2 30.9 24.1 18.6 17.7
Fiber-optic Share 6% 51% 1% 0% 0%
Top 5 countries by broadband subscribers are shown. Source: OECD
"R" means Regulated, "U" means Unregulated.
*1 US abolished linesharing in 2003, but continues dry copper.
*2 US abolished the regulation on fiber lines in 2003.
*3 Germany abolished the regulation to induce investment in 2005.
*4 The unit is in millions. Data are taken of June 2009.
30

Table 2: Fiber Construction and Unbundling Usage
2005 2006 2007 2008 2009
(1) # of CATVs that Build Fiber Networks
0 per market 892 839 828 768 750
1 per market 43 89 97 145 160
2 per market 0 7 8 18 21
3 per market 0 0 0 2 2
Total 43 103 113 187 208
(2) # of Regulated Firms’ Fiber Stations
# of Stations 3149 3302 3415 3573 3644
(3) # of Service Providers using Unbundling (FTTH)
# of Firms 2831 3775 4862 5644 5972
Table 3: Summary Statistics (933 markets, 5 years)
Mean Std Min Max
# of Service Providers using Unbundling (station to home) 4.95 5.26 0 39
# of Service Providers using Unbundling (station to station) 6.30 5.71 0 62
# of Regulated Firms’ Station 3.66 3.22 0 21
# of CATVs that Build Fiber Lines 0.14 0.39 0 3
# of Households 25445 43433 143 409193
Area 224.23 259.89 3.47 1449.87
Income 2953.03 540.27 1888.97 5884.61
Table 4: Market Characteristics (Mean)
# of Fiber-
CATVobs. # of Households
# of Service Providers
using Unbundling (Home)
# of Regurated
Firms’ Station
0 4073 19,267 4.05 3.40
1 534 60,540 10.44 5.26
2 54 133,708 16.52 7.35
3 4 170,143 24.75 7.50
31
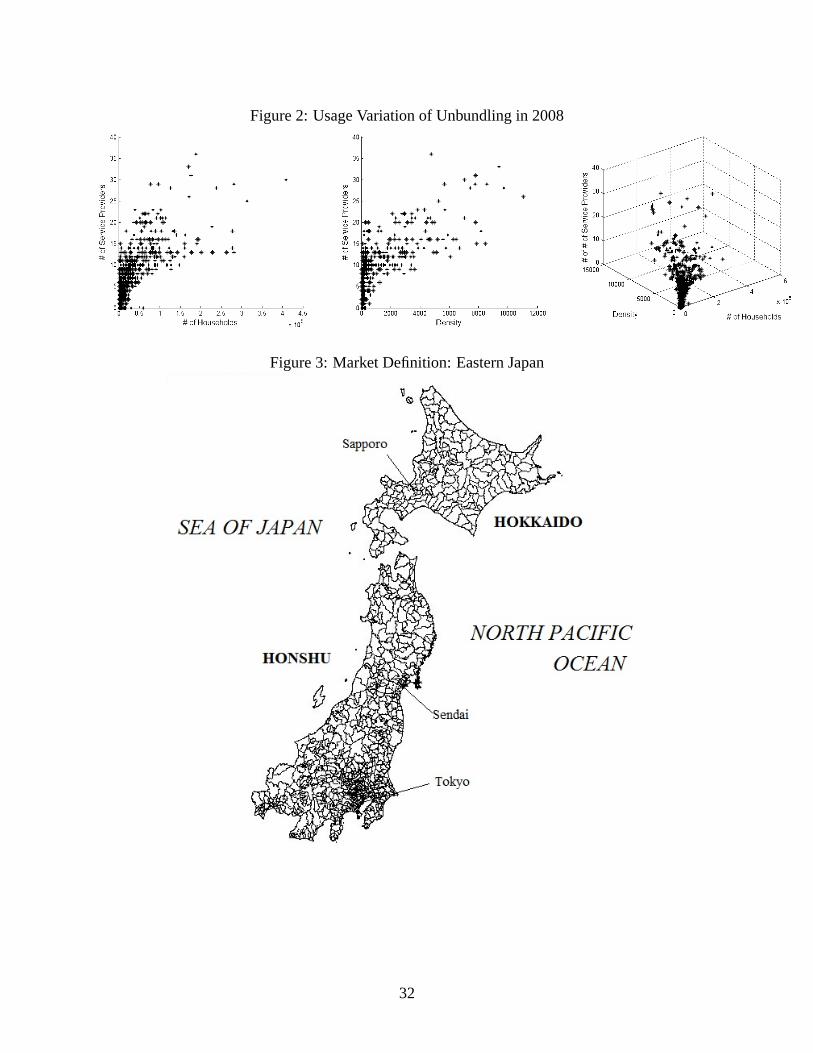
Figure 2: Usage Variation of Unbundling in 2008
Figure 3: Market Definition: Eastern Japan
32

Table 5: Reduced-Form Results of Probit Models
(1) IV Probit (2) Ordered Probit
Dependent VariableUnregulated Firms’ (CATVs’)
Entry in FTTH
Regulated Firms’ (NTTs’)
Increase in FTTH Stations
ln (# of Service Providers) -0.60*** -0.05
(0.18) (0.06)
Incumbent CATVs -0.70*** -0.25**
that Built FTTH (0.12) (0.13)
ln(# of NTT’s 0.02 -0.06**
Fiber Stations) (0.02) (0.01)
ln (# of Metallic CATVs) 0.60*** -
(0.13) -
ln (# of Households) 0.58** 0.01
(0.08) (0.04)
ln (Average Income) 1.27*** -0.48*
(0.63) (0.28)
ln(Area) -0.29*** 0.36***
(0.07) (0.03)
Const -15.79*** -
(4.04) -
Endogeneity√
−Year Dummy
√ √
Note: * In the IV estimation, this paper uses the logarithm of the number of firms that use
the regulated facility between station and station as the instrument of usage for home fiber.
* is significant at 10% , ** at 5% and *** at 1%. Standard deviations are in parentheses.
33

Tab
le6:
Robust
nes
sC
hec
k1:
Monopoly
Set
tings
and
Inst
rum
ents
Val
idit
y
Type
1.
Monopoly
Mar
ket
s2.
Inst
rum
ents
Var
idit
y
Met
hod
IVP
robit
IVP
robit
IVP
robit
IVP
robit
Dep
enden
tV
aria
ble
CA
TV
s’E
ntr
yin
FT
TH
CA
TV
s’E
ntr
yin
FT
TH
CA
TV
s’E
ntr
yin
FT
TH
CA
TV
s’E
ntr
yin
FT
TH
ln(#
of
Ser
vic
eP
rovid
ers)
-0.7
2***
-0.3
6***
-0.7
1***
-0.3
8***
(0.2
2)
(0.1
5)
(0.2
2)
(0.1
5)
Incu
mben
tC
AT
Vs
-1.0
0***
-0.6
7***
-0.6
3***
-0.6
4***
that
Buil
tF
TT
H(0
.21)
(0.1
3)
(0.1
3)
(0.1
4)
ln(#
of
NT
T’s
0.0
4-0
.02
0.0
1-0
.01
Fib
erS
tati
ons)
(0.0
3)
(0.0
2)
(0.0
3)
(0.0
3)
ln(#
of
Met
alli
cC
AT
Vs)
0.4
9***
0.1
10.1
60.0
9
(0.2
0)
(0.1
6)
(0.1
7)
(0.1
7)
ln(#
of
House
hold
s)0.6
4***
0.6
6***
0.6
9***
0.6
5***
(0.0
9)
(0.1
0)
(0.1
0)
(0.1
0)
ln(A
ver
age
Inco
me)
1.4
2***
1.4
4***
1.7
8***
1.4
0***
(0.6
1)
(0.6
0)
(0.6
2)
(0.6
1)
ln(A
rea)
-0.2
9***
-0.2
2***
-0.2
9***
-0.2
4***
(0.0
8)
(0.0
8)
(0.0
9)
(0.0
9)
Const
-17.7
***
-18.2
***
-20.6
***
-17.7
***
(4.8
3)
(4.8
6)
(5.0
3)
(4.8
8)
Endogen
eity
usa
ge
usa
ge
usa
ge,
stat
ion
usa
ge,
stat
ion
Inst
rum
ents
stat
ion-t
o-s
tati
on
usa
ge
stat
ion-t
o-s
tati
on
usa
ge
stat
ion-t
o-s
tati
on
usa
ge
pre
vio
us
usa
ge
-pre
vio
us
usa
ge
pre
vio
us
stat
ion
pre
vio
us
stat
ion
Note
:*
Inth
eIV
esti
mat
ion,th
ispap
eruse
sth
enum
ber
of
firm
sth
atuse
the
regula
ted
faci
lity
bet
wee
nst
atio
nan
dst
atio
n
asth
ein
stru
men
tof
usa
ge
*is
signifi
cant
at10%
,**
at5%
,***
at1%
.S
tandar
ddev
iati
ons
are
inpar
enth
eses
.
34
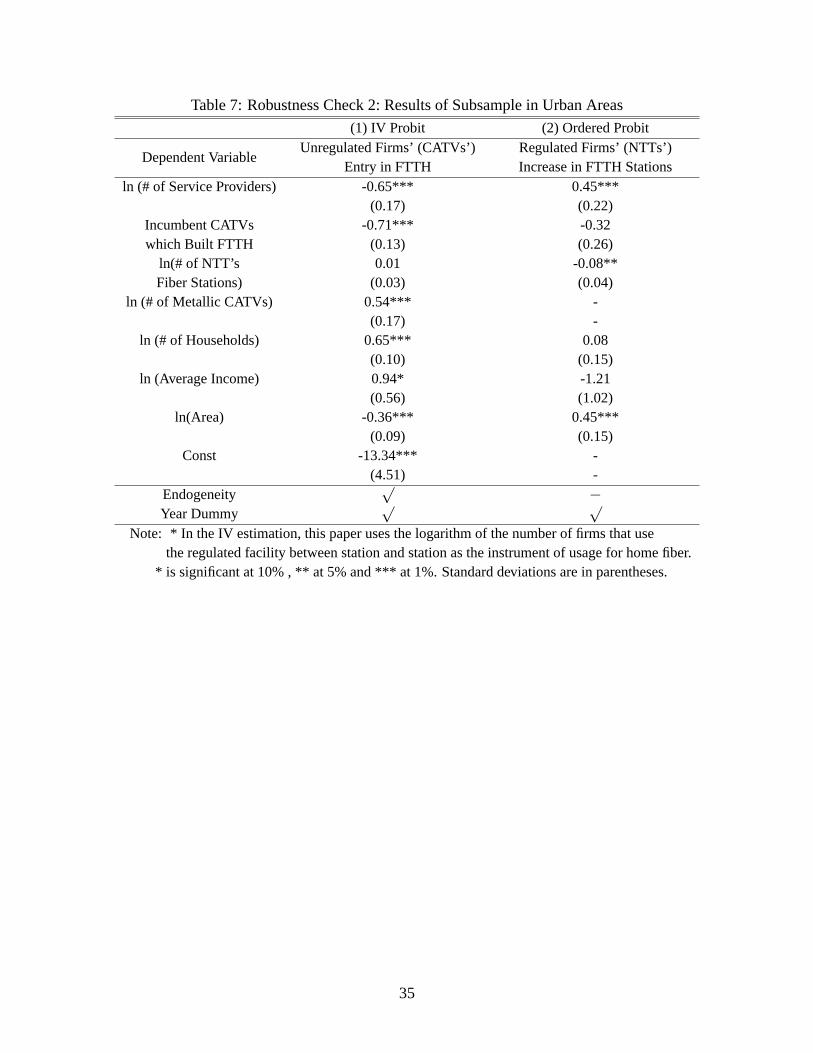
Table 7: Robustness Check 2: Results of Subsample in Urban Areas
(1) IV Probit (2) Ordered Probit
Dependent VariableUnregulated Firms’ (CATVs’)
Entry in FTTH
Regulated Firms’ (NTTs’)
Increase in FTTH Stations
ln (# of Service Providers) -0.65*** 0.45***
(0.17) (0.22)
Incumbent CATVs -0.71*** -0.32
which Built FTTH (0.13) (0.26)
ln(# of NTT’s 0.01 -0.08**
Fiber Stations) (0.03) (0.04)
ln (# of Metallic CATVs) 0.54*** -
(0.17) -
ln (# of Households) 0.65*** 0.08
(0.10) (0.15)
ln (Average Income) 0.94* -1.21
(0.56) (1.02)
ln(Area) -0.36*** 0.45***
(0.09) (0.15)
Const -13.34*** -
(4.51) -
Endogeneity√
−Year Dummy
√ √
Note: * In the IV estimation, this paper uses the logarithm of the number of firms that use
the regulated facility between station and station as the instrument of usage for home fiber.
* is significant at 10% , ** at 5% and *** at 1%. Standard deviations are in parentheses.
35

Tab
le8:
Est
imat
ion
of
aD
ynam
icG
ame
of
Infr
astr
uct
ure
Const
ruct
ion
(1)
CA
TV
s’
Pro
fit
Funct
ion
to
Buil
dF
iber
Net
work
s
(2)
Reg
ula
ted
Fir
ms’
Pro
fit
Funct
ion
to
Buil
dF
iber
Sta
tion
(3)
Ser
vic
eP
rovid
ers’
Pro
fit
Funct
ion
to
Oper
ate
Thei
rB
usi
nes
ses
Est
imat
eS
tandar
dE
rrors
Est
imat
eS
tandar
dE
rrors
Est
imat
eS
tandar
dE
rrors
Fir
stF
iber
-CA
TV
-0.7
55
0.5
52
0.0
26
0.0
47
-0.0
46*
0.0
27
Sec
ond
Fib
er-C
AT
V-0
.793
0.5
29
-0.0
93
0.1
99
-0.0
27
0.0
83
Thir
dF
iber
-CA
TV
-1.1
13
0.6
96
-0.0
59
0.1
51
0.0
35
0.0
86
Sunk
cost
for
CA
TV
-1.1
13*
0.6
45
--
--
Met
alli
cC
able
TV
Incu
mben
ts-0
.032
0.0
76
--
--
Reg
ula
ted
Fir
m’s
Fib
erS
tati
ons
0.0
01
0.0
05
-0.0
02***
0.0
01
0.0
05***
0.0
01
Sunk
Cost
for
Reg
ula
ted
Fir
ms
--
-2.4
60***
1.1
82
--
Ser
vic
eP
rovid
ers
usi
ng
Unbundli
ng
-0.0
09***
0.0
04
-0.0
00
0.0
01
-0.0
03***
0.0
01
log
(#of
House
hold
s)-0
.009
0.0
09
0.0
18
0.0
18
0.0
27***
0.0
08
log
(Aver
age
Inco
me)
-0.0
22
0.0
23
-0.0
12
0.0
11
-0.0
15***
0.0
07
log
(Are
a)0.0
52
0.0
71
0.0
22***
0.0
03
-0.0
11***
0.0
02
Mar
ket
Dum
my
XX
XY
ear
Dum
my
XX
X*
issi
gnifi
cant
at10%
,**
at5%
and
***
at1%
.
36
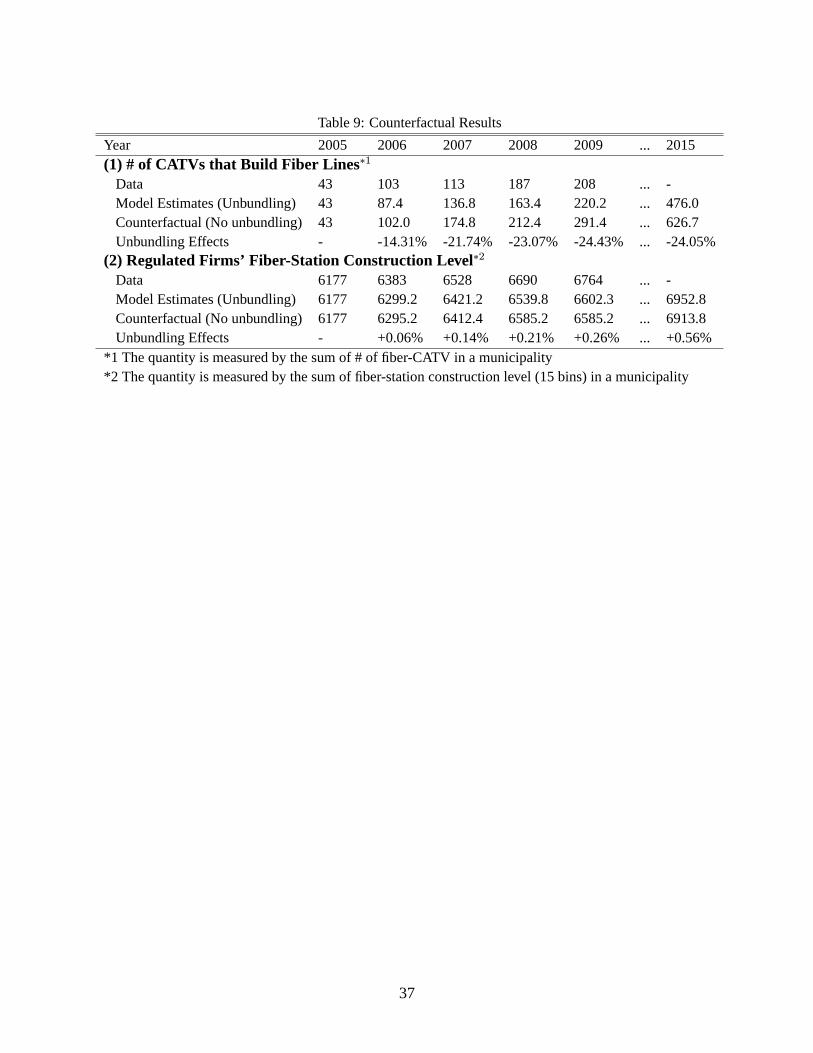
Table 9: Counterfactual Results
Year 2005 2006 2007 2008 2009 ... 2015
(1) # of CATVs that Build Fiber Lines∗1
Data 43 103 113 187 208 ... -
Model Estimates (Unbundling) 43 87.4 136.8 163.4 220.2 ... 476.0
Counterfactual (No unbundling) 43 102.0 174.8 212.4 291.4 ... 626.7
Unbundling Effects - -14.31% -21.74% -23.07% -24.43% ... -24.05%
(2) Regulated Firms’ Fiber-Station Construction Level∗2
Data 6177 6383 6528 6690 6764 ... -
Model Estimates (Unbundling) 6177 6299.2 6421.2 6539.8 6602.3 ... 6952.8
Counterfactual (No unbundling) 6177 6295.2 6412.4 6585.2 6585.2 ... 6913.8
Unbundling Effects - +0.06% +0.14% +0.21% +0.26% ... +0.56%
*1 The quantity is measured by the sum of # of fiber-CATV in a municipality
*2 The quantity is measured by the sum of fiber-station construction level (15 bins) in a municipality
37