NATURAL GAS PIPELINE ANNUAL SAFETY REPORT
28
FLORIDA PUBLIC SERVICE COMMISSION NATURAL GAS PIPELINE ANNUAL SAFETY REPORT 2012 DIVISION OF ENGINEERING
Transcript of NATURAL GAS PIPELINE ANNUAL SAFETY REPORT

FLORIDA PUBLIC SERVICE COMMISSION
NATURAL GAS PIPELINE
ANNUAL SAFETY REPORT
2012
DIVISION OF ENGINEERING


i
TABLE OF CONTENTS
TABLE OF FIGURES ....................................................................................... II
ABBREVIATIONS .......................................................................................... III
GAS SAFETY BACKGROUND .......................................................................... 1
GAS SAFETY 2012 OVERVIEW ...................................................................... 1
GAS SAFETY INSPECTOR DUTIES AND TRAINING REQUIREMENTS .................. 2
SCOPE OF GAS SERVICE IN FLORIDA ............................................................. 4
SAFETY IMPROVEMENT ACTIONS .................................................................. 7
INSPECTION RESULTS ................................................................................... 9
TRANSMISSION PIPELINE INTEGRITY MANAGEMENT ................................... 12
DISTRIBUTION INTEGRITY MANAGEMENT PLAN .......................................... 13
EXESS FLOW VALVES ................................................................................. 14
PREVENTION OF DAMAGE TO GAS PIPELINES BY EXCAVATORS .................. 15
PUBLIC AWARENESS ................................................................................... 16
HISTORY OF REPORTABLE NATURAL GAS INJURIES AND FATALITIES ......... 16
OTHER RESPONSIBILITIES ........................................................................... 19
CONTACT INFORMATION PERTAINING TO PIPELINES IN FLORIDA ................. 19


ii
TABLE OF FIGURES
Figure 1 Diagram of Natural Gas Flow ............................................................. 2
Figure 2 Miles of Main by Utility Type ............................................................ 4
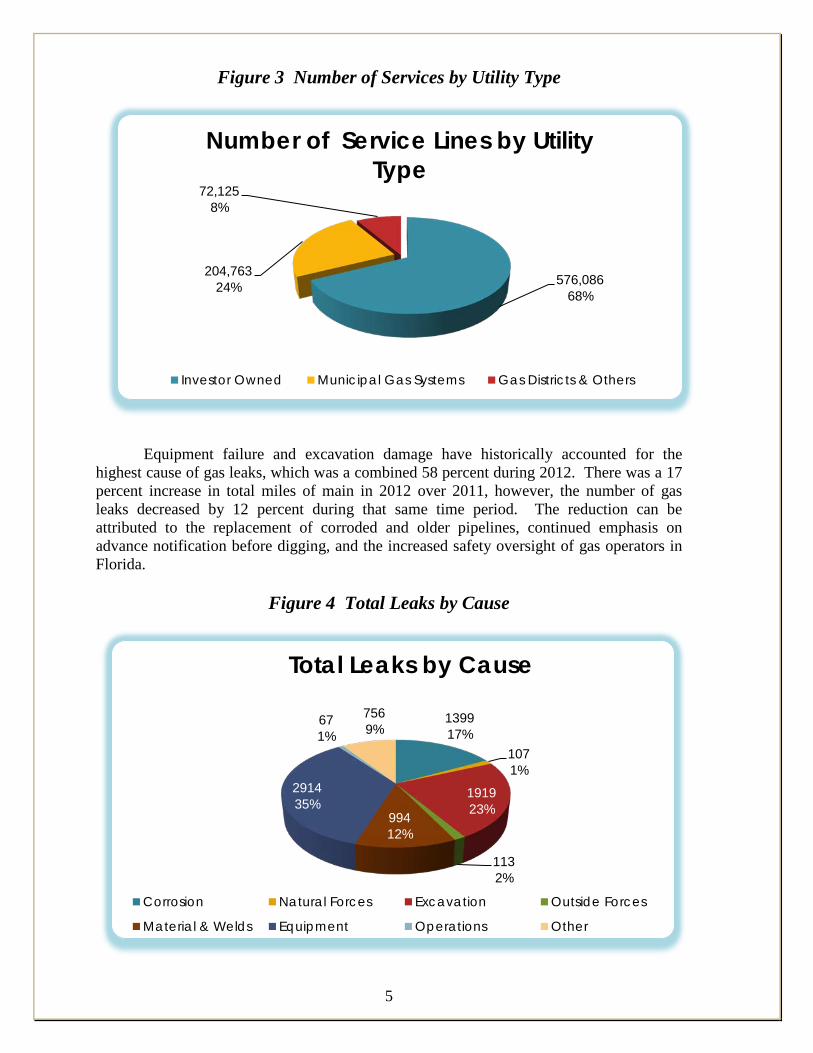
Figure 3 Number of Services by Utility Type ................................................... 5
Figure 4 Total Leaks by Cause .......................................................................... 5
Figure 5 Total Miles of Main and Gas Leaks – 2003 thru 2012 ....................... 6
Figure 6 Miles of Main by Material Type ......................................................... 6
Figure 7 Miles of Main by Decade .................................................................... 7
Figure 8 Pipeline Replacement Program ........................................................... 8
Figure 9 2012 Inspection Days by Activity Type ............................................ 10
Figure 10 2012 Inspection Days by Utility Type ............................................ 10
Figure 11 Violations Found 2010 thru 2012 .................................................... 11
Figure 12 Violations Average Days Open ....................................................... 11
Figure 13 Probable Rule Violations 2008-2012 .............................................. 12
Figure 14 Excess Flow Valves Installed 2012 ................................................. 14
Figure 15 Percent Increase of EFVs 2012 ....................................................... 15
Figure 16 Gas Line Locate Requests ............................................................... 15
Figure 17 Total Gas Dig-In Leaks ................................................................... 16
Figure 18 Incidents/Accidents 2008 thru 2012 ................................................ 17
Figure 19 FPSC Natural Gas Accidents and Incidents 1997 thru 2012 .......... 18


iii
ABBREVIATIONS
DIMP Distribution Integrity Management Plan
CFR Code of Federal Regulations
EFV Excess Flow Valve
EOC Emergency Operations Center F.A.C. Florida Administrative Code FDOT Florida Department of Transportation
FPSC Florida Public Service Commission
FR Federal Regulation
HCA High Consequence Area
IMP Integrity Management Plan
NAPSR National Association of Pipeline Safety Representatives
NTSB National Transportation Safety Board
OPS Office of Pipeline Safety
PHMSA Pipeline and Hazardous Materials Safety Administration
PIG Pipeline Inspection Gauge
SHRIMP Simple, Handy, Risk-based Integrity Management Plan
SSOCOF Sunshine State One Call of Florida
UFDPSA Underground Facility Damage Prevention and Safety Act


1
NATURAL GAS PIPELINE SAFETY Gas Safety Background The federal government establishes minimum pipeline safety performance standards under the U.S. Code of Federal Regulations (CFR), Title 49 “Transportation,” Parts 190, 191, 192, and 199. The Office of Pipeline Safety (OPS), within the U.S. Department of Transportation, Pipeline and Hazardous Materials Safety Administration (PHMSA), has overall regulatory responsibility for hazardous liquid and gas pipelines in the United States. PHMSA’s goal is to improve industry performance and communications to prevent hazardous material transportation incidents, accidents, injuries, and fatalities. PHMSA tracks data on the frequency of failures, incidents, and accidents. PHMSA pipeline safety regulations assure safety in design, construction, inspection, testing, operation, and maintenance of pipeline facilities and in the siting, construction, operation, and maintenance of facilities. Additionally, PHMSA sets out parameters for administering the pipeline safety program.
The Florida Public Service Commission (FPSC) is certified through PHMSA to
inspect intrastate transmission and distribution pipelines, and has adopted the federal standards as well as more stringent regulations found in Section 25-12, Florida Administrative Code (F.A.C.) and Chapter 368 Florida Statutes, which authorize the Commission to inspect pipelines and adopt rules for governing pipeline safety. PHMSA authorizes state agencies, such as the FPSC, to conduct oversight and enforcement of pipeline operators through PHMSA’s State Pipeline Safety Program.1
At the March 5, 1984, Internal Affairs meeting, the Commission voted to require staff
to prepare an annual summary report of the previous year’s natural gas pipeline safety activities. This is the report for calendar year 2012. Gas Safety 2012 Overview
Through its Bureau of Safety, the FPSC evaluates intrastate gas system engineering and operations to ensure that construction, repairs, and maintenance are performed in accordance with specified tested procedures using proper materials. This includes transmission and distribution pipelines, as well as master meter locations.
A major aspect of compliance involves regular inspections of pipeline facilities.
Safety, reliability, and service monitoring promotes an uninterrupted supply of natural gas service to the public and confirms that such services are provided in a reasonable and timely manner with minimal risks. Every gas system operating in Florida is evaluated on an annual basis to insure the operator is in compliance with both the federal standards and state rules. Violations are monitored closely to insure timely compliance. During 2012, the average number of days between a violation notice being issued, to the date the violation closed was 114 days. The number of days a violation remained open has
1 Federal statutes provide for State assumption of all or part of the intrastate regulatory and enforcement responsibility of utility companies through annual certifications and agreements issued under this program.

2
continued to decrease since 2010, indicating a more expedient response to correcting violations as they are found.
During 2012, Florida reported no fatalities and three injuries. The reportable
incidents were due to: a lightning strike and a fire caused by an un-extinguished cigarette. The number of incidents due to dig-ins has tapered off significantly during the past five years which could be attributed to the continued emphasis on calling for underground utility locations before taking any action (digging).
The diagram in Figure 1 provides a simplified look at how natural gas flows from
the source to the final destination.
Figure 1 Diagram of Natural Gas Flow
Gas Safety Inspector Duties and Training Requirements The FPSC safety staff has six inspectors who conduct on-going inspections and
review the safety operations of Florida’s 94 natural gas systems. All FPSC inspectors must complete extensive training through PHMSA, to be fully qualified to perform safety inspections. Initially, there are seven mandatory courses which must be completed within three years from completion date of the first course. The following are the core courses:
Safety Evaluation of Gas Pipeline and Systems Courses
1) Plastic and Composite Materials
2) Welding and Welding Inspection of Pipeline Materials

3
3) Gas Pressure Regulation and Overpressure Protection
4) Pipeline Failure Investigation
5) Pipeline Safety Regulation Application and Compliance Procedures
6) Corrosion Control of Pipeline Systems
7) Safety Evaluation of Gas Pipeline and Systems Course
In addition to the initial training, there are courses which are mandatory if the
inspector performs inspections related to course content, such as:
1) Distribution Integrity Management Plan (DIMP)
2) Fundamentals of SCADA System Technology and Operation
3) Safety Evaluation of Inline Inspection
4) Safety Evaluation of Control Room Management
5) Investigating and Managing Internal Corrosion of Pipelines
6) Operator Qualification
7) Integrity Management Plan for Transmission Pipelines (IMP)
Overall, there are 21 courses available to FPSC inspectors to efficiently perform
natural gas safety inspections. The FPSC inspectors conduct annual evaluations of each of the companies’ systems which include:
Conduct annual field inspections of natural gas pipeline systems
operations and facilities in order to determine conformance to state and federal regulations.
Investigate and review related operator’s records for compliance with
Federal Pipeline Safety Standards (i.e., 49 Code of Federal Regulations Parts 191, 192, 199) state gas pipeline safety rules (i.e., as defined per Section 25-12, F.A.C.) and Chapter 368 Florida Statutes.
Take measurements to assure corrosion control equipment is performing
effectively.
Test pipeline valves to ensure they will be located, and operate in the event of an emergency.
Check settings on instruments and equipment designed to protect against
events that could overpressure the pipeline.
Check customer meter readings for accuracy, in response to requests from customers.

4
SCOPE OF GAS SERVICE IN FLORIDA
There were 65 gas companies, operating 94 systems in Florida as of December 31, 2012.
4 Gas Districts
6 Investor-Owned Companies with 31 gas systems
10 Master Meters
17 Intrastate Pipelines with 20 gas systems
28 Municipalities with 29 gas systems
Florida’s gas systems (some companies have several systems) are comprised of approximately 47,008 total miles of pipeline,2 and 852,974 customer service lines.3 Investor-owned utilities account for 67 percent of the total miles of natural gas mains in Florida, while the remaining 33 percent is comprised of municipalities, gas districts, master meters (housing authorities), and intrastate transmission pipelines. The charts below show the total miles of main (does not include miles of service lines) and the total number of services by utility type providing the service.
Figure 2 Miles of Main by Utility Type
2 This includes 20,194 miles for service lines from the main to the meter. 3 Source: FORM PHMSA F 7100.1-1 and F 7100.2-1, as provided annually, by each operating company in Florida.
17,880 67%
6,237 23%
2,173 8%
524 2%
Miles of Main by Utility Type
Investor Owned Municipal Gas Systems
Gas Districts & Others Transmission Intrastate
5
Figure 3 Number of Services by Utility Type
Equipment failure and excavation damage have historically accounted for the
highest cause of gas leaks, which was a combined 58 percent during 2012. There was a 17 percent increase in total miles of main in 2012 over 2011, however, the number of gas leaks decreased by 12 percent during that same time period. The reduction can be attributed to the replacement of corroded and older pipelines, continued emphasis on advance notification before digging, and the increased safety oversight of gas operators in Florida.
Figure 4 Total Leaks by Cause
576,086 68%
204,763 24%
72,125 8%
Number of Service Lines by Utility Type
Investor Owned Municipal Gas Systems Gas Districts & Others
1399 17%
107 1%
1919 23%
113 2%
994 12%
2914 35%
67 1%
756 9%
Total Leaks by Cause
Corrosion Natural Forces Excavation Outside Forces
Material & Welds Equipment Operations Other

6
Figure 5 Total Miles of Main and Gas Leaks – 2003 thru 2012
Below is a chart which shows the amount of pipeline by material type for the period ending December 31, 2012.
Figure 6 Miles of Main by Material Type
2003 2004 2005 2006 2007 2008 2009 2010 2011 2012Total Miles of Mains 22,08022,70723,17623,87024,37125,18525,46625,09828,82926,814Total Gas Leaks 9,935 10,69712,14411,58110,29611,01510,80911,568 9,269 8,269
010,00020,00030,00040,00050,000
Total Miles of Main and Gas Leaks 2003 thru 2012
Total Gas Leaks Total Miles of Mains
1,637 6%
10,944 41%
236 1%
13,998 52%
Miles of Main by Material Type
Unprotected Steel
Protected Steel
Cast Iron
Plastic

7
Figure 7 below shows the quantity and age of the existing pipeline in Florida as of December 31, 2012. The age of the cast iron and steel pipelines without corrosion control, range in age from 50 to 70 plus years, and account for 26 percent of the total pipeline in Florida. These aged and/or unprotected pipes have a significantly higher leakage rate than that of the newer plastic pipeline that was placed after 1971.
Figure 7 Miles of Main by Decade
SAFETY IMPROVEMENT ACTIONS During 2012, there were 239 additional miles of natural gas pipeline placed throughout Florida, with 30 miles of the pipeline physically inspected by the FPSC inspectors. These inspections are in addition to normal inspection duties performed while conducting the annual evaluation of each gas district throughout the state.
During 2011, PHMSA expressed concerns regarding the need to replace or repair the aging infrastructure of the gas pipelines across the country, primarily the bare steel pipe and cast iron pipeline. The FPSC Bureau of Safety issued a request in September 2011, for all gas operators in Florida who had bare steel and/or cast iron pipes in service, to submit a pipeline replacement program. These plans were to be implemented beginning in 2012. Figure 8 below describes each proposed replacement program submitted by the gas operators involved.
2,190 7%
265 1%
326 1%
1,205 4%
4,300 13%
2,529 8% 3,210
10%
5,297 17%
9,212 29%
3,242 10%
Miles of Main by Decade
Unk Pre-1940 1940's 1950's 1960's
1970's 1980's 1990's 2000's 2010's

8
Figure 8 Pipeline Replacement Program
Company Name Proposed Replacement Completion Date
Miles of Cast Iron as
of 12/31/2012
Miles of Unprotected Bare Steel
as of 12/31/2012
Total Pipeline to Replace as
of 12/31/2012
Chesapeake Utilities
Docket 120036-GU approved September 24, 2012, effective January 1, 2013. 0 151 151
Chipley, City of Date to be determined. 0 2 2
Clearwater Gas System
Replace 12 miles of pipe in 2012. The remaining 45 miles to be replaced as the budget allows. 15 34 49
Energy Services of Pensacola Date to be determined. 85 447 532
Florida City Gas Plans provided to replace pipes annually, with a 100% completion schedule of 2014. 0 14 14
Florida Public Utilities
Docket 120036-GU approved September 24, 2012, effective January 1, 2013. 1 169 170
Gainesville Regional Utilities
2.3 miles started in September 2012, with remainder to complete by 2017. 2 5 7
Milton, City of Replace .5 miles per year until complete, approximately 15 years total. 6 1 1
Okaloosa Gas District
2.5 miles to be replaced in 2012, with current plans to replace 2-3 miles per year for 9 years. 24 0 24
TECO Peoples Gas
Docket 110320-GU approved September 18, 2012, effective January 1, 2013. 103 372 475
Total Miles 236 1,195 1,431
During 2012, the FPSC approved four dockets regarding federal and state safety
issues, as well as rule changes to improve the overall safety and reliability of the gas safety program. Two of the dockets were approved to expedite the replacement programs for Chesapeake Utilities, Florida Public Utilities, and TECO Peoples Gas. As a result of these programs, there were 23 miles of cast iron pipeline, and 510 miles of unprotected bare steel pipeline replaced during 2012.

9
INSPECTION RESULTS
PHMSA requires the state to report by operator type, the number of inspection person-days spent during the calendar year on inspections. Commission staff gas inspectors keep a weekly summary of hours spent engaged in these activities by gas system. These activities are broken down into 20 categories as shown below, with a code associated for each activity:
Code Activity 1 Record Verification 2 Facility Evaluation 3 Construction Inspection 4 Procedures/Plans Review 5 Accident/Incident Reporting 6 Customer Complaint 7 Conference Utility 8 Economic Regulation 9 Progress Report
10 Report Writing 11 Preparatory/Planning 12 Training & Instruction 13 Personnel 14 Assignment Related Travel 15 Leave and absence time 16 Emergency Operations (EOC) 17 Integrity Management 18 Operator Qualifications 19 Damage Prevention 20 Drug & Alcohol Inspections
These hours are tracked throughout the year, and summarized for the certification
report provided to PHMSA. State inspection activity used for this report is broken down by; Standard Comprehensive (SUM of codes 1, 2, 4, 7, 11, and 14), Design (code 3), Incident (code 5), Training (code 12), Integrity (code 17), Operator (code 18), and Damage (code 19). These codes define the direct evaluation time spent on gas safety compliance.
Commission inspectors used 1,047 direct evaluation person-days for 2012. The
direct evaluation person-day is an eight hour calculated day (in the field), checking safety compliance only. The remaining hours were spent for travel time, report writing, interviews, training, compliance follow-up, and administrative time.

10
As shown below in Figure 8, the standard hours accounted for 76 percent of inspector time during 2012.
Figure 9 2012 Inspection Days by Activity Type
Figure 10 2012 Inspection Days by Utility Type
As each gas system is evaluated, the inspector prepares a summary of his findings and discusses the results with the system operator’s supervisory employees. The information is forwarded to the Bureau of Safety office, where a letter is prepared and issued to an officer of the company. When there are no violations found, the letter so states, and when violations are found, a non-compliance letter is issued to the operator, along with a designated time frame (usually 30 days) to respond to the issue(s) found.
0100200300400500600700800
796
66 1 61 35 5 46 37
2012 Inspection Days by Activity Type
State Inspection Days
563 54%
280 27%
50 5%
49 4%
104 10%
2012 Inspection Days by Utility Type
Investor Owned Municipal Master Meter Gas Districts Transmission

11
During 2012, there were 91 total violations, with 85 percent attributed to CFR 49 PHMSA violations, and 15 percent to Rule 25-12 F.A.C.
Figure 11 Violations Found 2010 thru 2012
During 2012, the average number of days between a violation notice being issued, to the date the violation closed was 114 days. The number of days a violation had remained open has continued to decrease since 2010, indicating a more expedient response to correcting violations as they are found. Company response time from issuance of the violation notice to their response was 41 days during 2012. The companies are typically given 30 days to respond to a violation notice, however, the situation often varies due to the nature of the problem and difficulty in getting the violation corrected.
Figure 12 Violations Average Days Open
0
20
40
60
80
100
2010 2011 2012
55 66
77
28 32
14
83
98 91
CFR 49
FPSC RULES
TOTAL
0
50
100
150
200
250
300
2010 2011 2012
32 46 41
273
200
114
Average Days toRespond
Average Days to Close

12
There were 50 compliance notifications issued during 2012, with rule violations ranging from: (1) failure to repair gas leaks, (2) failure to odorize natural gas, (3) failure to properly identify service line valves, (4) failure to follow criteria for cathodic protection, (5) improper welding, (6) failure to use qualified personnel, (7) failure to maintain leak reports, and (8) inadequate IMP and DIMP plans. All violations have been corrected or scheduled for corrective action pursuant to the Commission’s enforcement procedures.
Figure 13 Probable Rule Violations 2008-2012
PROBABLE RULE VIOLATIONS 2008-2012
N
umbe
r Fo
und
Dur
ing
Yea
r
Num
ber
Cor
rect
ed D
urin
g Y
ear
Com
plia
nce
L
ette
rs
2008 136 57 51
2009 125 155 62
2010 83 97 46
2011 98 67 52
2012 91 108 50
TRANSMISSION PIPELINE INTEGRITY MANAGEMENT
The Gas Transmission Integrity Management Plan (IMP) was introduced by the Pipeline Safety Improvement Act in 2002. The rule applies to gas transmission operators jurisdictional to 49 CFR Part 192. This rule became effective February 14, 2004. The objectives are to improve pipeline safety through:
• Accelerating the integrity assessment of pipelines in high consequence areas. • Improving integrity management systems within companies. • Improving the role in reviewing the adequacy of integrity programs and plans. • Providing increased public assurance in pipeline safety.
An operator of a gas transmission pipeline is required to perform ongoing assessment
of the pipeline’s integrity. This is done by performing a risk analysis to identify and mathematically rank all threats that could be detrimental to the integrity of the pipeline. There are many key elements included in the written plan, some of which include identification of all high consequence areas (HCA), baseline assessment plan, and identification of threats to each covered segment. The rules governing the Gas Transmission Pipeline Integrity Management Plan can be found in 49 CFR, Part 192, Subpart O.

13
DISTRIBUTION INTEGRITY MANAGEMENT PLAN
PHMSA previously implemented integrity management regulations which became law when Congress passed the Pipeline Safety Improvement Act in (2002) for hazardous liquid and gas transmission pipelines. This regulation required a pipeline operator to develop an Integrity Management Program (IMP) for gas transmission pipelines located in areas where a leak or rupture could cause the most harm, such as high consequence areas. Congress and other stakeholders expressed interest in understanding the nature of similarly focused requirements for gas distribution pipelines. Significant differences in system design and local conditions affecting distribution pipeline safety ruled out the possibility of applying the same tools and practices used for transmission pipeline systems. Therefore, PHMSA took a slightly different approach for distribution integrity management, following a joint effort involving PHMSA, the gas distribution industry, representatives of the public, and the National Association of Pipeline Safety Representatives (NAPSR) to explore potential approaches.
The final rule establishing integrity management requirements for gas distribution
pipeline systems was issued December 4, 2009 (74 FR 63906), with an effective date of February 12, 2010. Operators were given until August 2, 2011, to write and implement their program. The regulation requires operators, such as natural gas distribution companies to develop, write, and implement a distribution integrity management program (DIMP) with the following elements:
Knowledge
Identify Threats
Evaluate and Rank Risks
Identify and Implement Measures to Address Risks
Measure Performance, Monitor Results, and Evaluate Effectiveness
Periodically Evaluate and Improve Program
Report Results
DIMP Key Items during 2011 and 2012
August 2011 – Plan development and implementation required to be complete.
September 2011 – PHMSA Form 23 issued for Master Meter and Small LPG Operator DIMP Inspections.
January 2012 – FPSC began implementation of DIMP inspections for gas distribution operators in Florida.
June 2012 – Public workshop held to review the first year implementation of DIMP regulations and share lessons learned between Federal/State regulators and industry.
June 2012 – PHMSA trained State inspectors, helped develop state inspection forms, FAQs, and inspection guidance for implementing DIMP, and performed pilot inspections to validate and enhance inspection forms and guidance.

14
September 2012 – DIMP Software Application Instructions training provided to
FPSC inspectors. Excess Flow Valves
An excess flow valve (EFV) is a safety device designed to automatically shut off
the flow of natural gas through a piping service line if it ruptures, thereby mitigating the impact of the rupture. In general, EFVs are an added optional safety device that has no effect on the gas flow resulting from a small leak, such as a leak caused by corrosion or a small crack. EFVs do not prevent accidents; instead, they help mitigate the consequences of accidents where there has been a substantial or catastrophic line break. Where installed, EFVs are complementary to damage prevention programs, one-call systems, and other pipeline safety efforts that focus on preventing accidents caused by outside forces.
EFVs became a reportable item during calendar year 2011, however, operators had
until 2012 to do an inventory and provide accurate numbers of EFVs placed during the calendar year and balance at the end of the year. Effective 2012, the FPSC began to closely monitor the installation of EFVs to insure proactive responses by the gas operators.
Figure 14 Excess Flow Valves Installed 2012
10109 78%
1920 15%
921 7%
Excess Flow Valves Installed 2012
Investor Owned Municipalities Gas Districts

15
Figure 15 Percent Increase of EFVs 2012
PREVENTION OF DAMAGE TO GAS PIPELINES BY EXCAVATORS
When Congress enacted the Pipeline Safety Improvement Act, it added additional requirements mandating that operators of natural gas distribution and transmission pipelines establish and carry out a continuing public education program. Chapter 556 Florida Statutes is the Underground Facility Damage Prevention and Safety Act which requires anyone that will be digging to call 811 first, so underground utility lines can be located and marked. Sunshine State One Call of Florida (SSOCOF) is Florida’s one-call center whose responsibility is to help prevent damages to underground utilities. For the excavator, calling 811 helps prevent hefty fines and repair costs due to utility service outages, injuries, environmental contamination, and property damage, with violation penalties that can range from $500 to $5,000.
Figure 16 Gas Line Locate Requests
24%
9%
35%
Percent Increase of EFVs 2012
IOUs
MUNICIPALS
GAS DISTRICTS
0
500,000
1,000,000
1,500,000
1997
1998
1999
2000
2001
2002
2003
2004
2005
2006
2007
2008
2009
2010
2011
2012
Gas Line Locate Requests
Gas line locate requests

16
The number one cause of damage to natural gas pipelines in Florida, as well as the entire United States, is dig-ins (pipelines cut or damaged by others engaged in excavation activities or directional drilling). Underground utilities can sustain damages from just a small nick of the outer lining of the buried facilities, causing leaks, water intrusion, or corrosion.
Figure 17 Total Gas Dig-In Leaks
Public Awareness In addition to each company conducting public awareness activities, these activities
and education information are further enhanced via the FPSC website which contains publications that provide consumer information on Bill of Rights for Electric and Gas Service, as well as the Natural Gas Pipeline Safety Annual Report.
The Common Ground Alliance (CGA) is a member-driven association dedicated to
ensuring public safety, environmental protection, and the integrity of services by promoting effective damage prevention practices. In recent years, the association has established itself as the leading organization in an effort to reduce damages to all underground facilities in North America through shared responsibility among all stakeholders. Excavation damage prevention organizations can be found at http://www.commongroundalliance.com. HISTORY OF REPORTABLE NATURAL GAS INJURIES AND FATALITIES
The Commission’s natural gas pipeline safety program has injury and fatality data since the beginning of the program in 1972.
The following is a national chart depicting the serious incidents, broken down between
Injuries and Fatalities, for the 20-year period of 1993 thru 2012.
0
2,000
4,000
6,000
Total Gas Dig-In Leaks
Total gas dig-in leaks

17
INJURIES – NATION WIDE
FATALITIES – NATION WIDE
During 2012, Florida had no fatalities and three injuries. The reportable incidents
were due to: a lightning strike and a fire caused by an un-extinguished cigarette. The number of incidents due to dig-ins has tapered off significantly during the past five years as shown below in Figure 18, which could be attributed to the continued emphasis on calling for underground utility locations before taking any action (digging).
Figure 18 Incidents/Accidents 2008 thru 2012
# Incidents
# Injuries05
101520
2008 2009 2010 2011 2012
2008 2009 2010 2011 2012# Incidents 18 14 5 3 2# Fatalities 0 0 0 0 0# Injuries 1 1 2 1 3# Dig-In's 11 4 3 0 1
# Incidents
# Fatalities
# Injuries
# Dig-In's
18
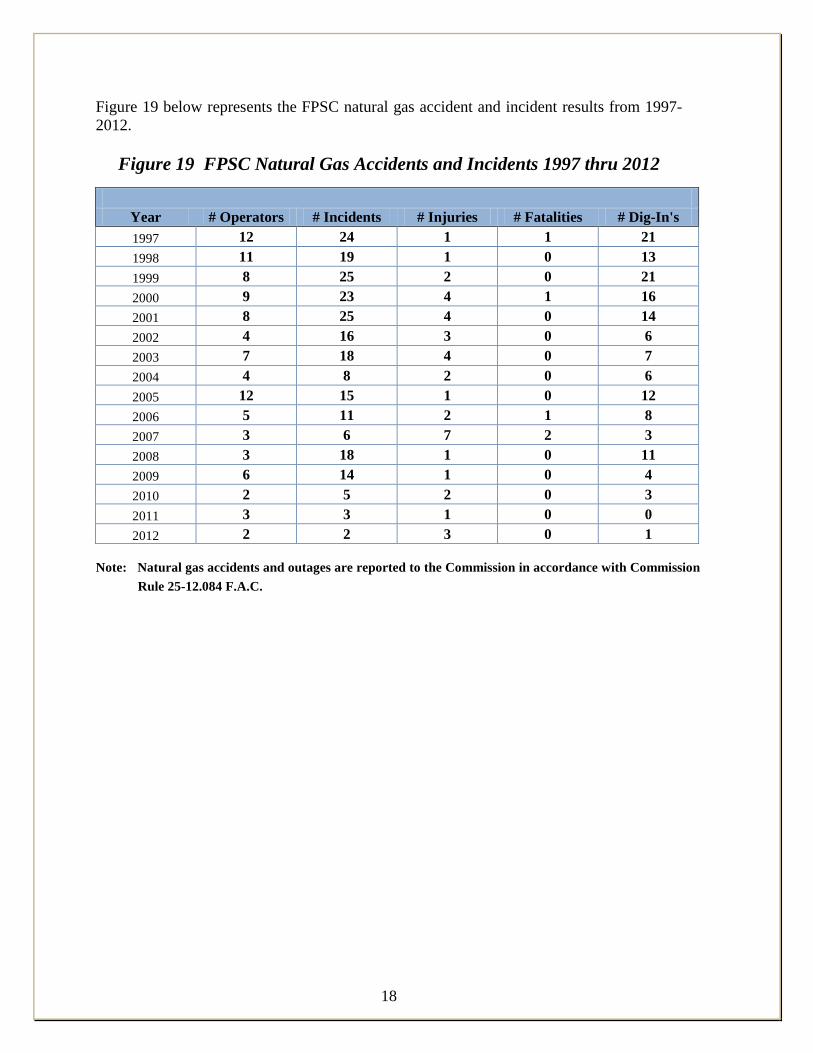
Figure 19 below represents the FPSC natural gas accident and incident results from 1997-2012.
Figure 19 FPSC Natural Gas Accidents and Incidents 1997 thru 2012
Year # Operators # Incidents # Injuries # Fatalities # Dig-In's 1997 12 24 1 1 21 1998 11 19 1 0 13 1999 8 25 2 0 21 2000 9 23 4 1 16 2001 8 25 4 0 14 2002 4 16 3 0 6 2003 7 18 4 0 7 2004 4 8 2 0 6 2005 12 15 1 0 12 2006 5 11 2 1 8 2007 3 6 7 2 3 2008 3 18 1 0 11 2009 6 14 1 0 4 2010 2 5 2 0 3 2011 3 3 1 0 0 2012 2 2 3 0 1
Note: Natural gas accidents and outages are reported to the Commission in accordance with Commission
Rule 25-12.084 F.A.C.

19
OTHER RESPONSIBILITIES The gas pipeline safety section also supports and assists the state’s Emergency Operations Center (EOC) in all energy related issues, such as energy security, natural gas explosions, and natural disasters or when any utility related threat is detected that threatens life and/or property. Several FPSC employees of the Division of Engineering are also members of the State Emergency Response Team4 (SERT). Their assistance requires regular involvement supplying expert advice during an emergency; and coordinating activities of the gas and electric utilities, jointly with government, fire, police, and other public and private agencies. Training exercises and safety drills are held throughout the year to keep members current on existing and upcoming procedures relating to the operations of the EOC and to ensure preparedness should an emergency arise.
The following is contact information pertaining to pipelines in Florida:
Florida Public Service Commission 2540 Shumard Oak Boulevard Tallahassee, FL 32399-0850 Bureau Chief Safety: Rick Moses Office: 850-413-6582 Cell: 850-408-4757 E-mail: [email protected] PHMSA Pipeline Safety - Southern Region Office 233 Peachtree Street, N.E., Suite 600 Atlanta, GA 30303 Telephone: 404-832-1147 Fax: 404-832-1169 Director: Wayne Lemoi Outreach: Community Assistance and Technical Services (CATS): Arthur Buff: 404-832-1155 E-mail: [email protected] Joseph Mataich: 404-832-1159 E-mail: [email protected]
U.S. Department of Transportation Pipeline and Hazardous Materials Safety Administration East Building, 2nd Floor Mail Stop: E24-455 1200 New Jersey Ave., SE Washington, DC 20590
Email: [email protected]
4 State Emergency Response Team (SERT) which provides updated information to other agencies and the public, during any emergency condition involving electric or natural gas threats.