Natural Gas and Renewables - IGU...Natural Gas and Renewables Luis Bertran, Secretary General, IGU 8...
37
Natural Gas and Renewables Luis Bertran, Secretary General, IGU 8 June 2017
Transcript of Natural Gas and Renewables - IGU...Natural Gas and Renewables Luis Bertran, Secretary General, IGU 8...

Natural Gas and RenewablesLuis Bertran, Secretary General, IGU
8 June 2017

International Gas UnionLeading the future of the Industry
90 Charter Members
62 Associate Members
Founded in 1931
IGU Secretariat
Barcelona, Spain
Presidency 2015-2018
Washington, DC USA
South Korea 2018-2021

New Head Quarter in Barcelona
IGU Secretary GeneralMr. Luis Bertran

2. International Market and Price
A Global
Challenge
and
Opportunity
(1) Started in 2009 at WGC 2009 in Buenos Aires
IGU Reports:
WHOLESALE GAS PRICE SURVEY (1)
WORLD LNG REPORT

Think global
act local
Wholesale Gas Price Survey 2016 and 2015
2. International Market and Price

World Price
Formation
Wholesale Gas Price Survey 2016
2. International Market and Price

Gas Price Development
Wholesale Gas Price Survey
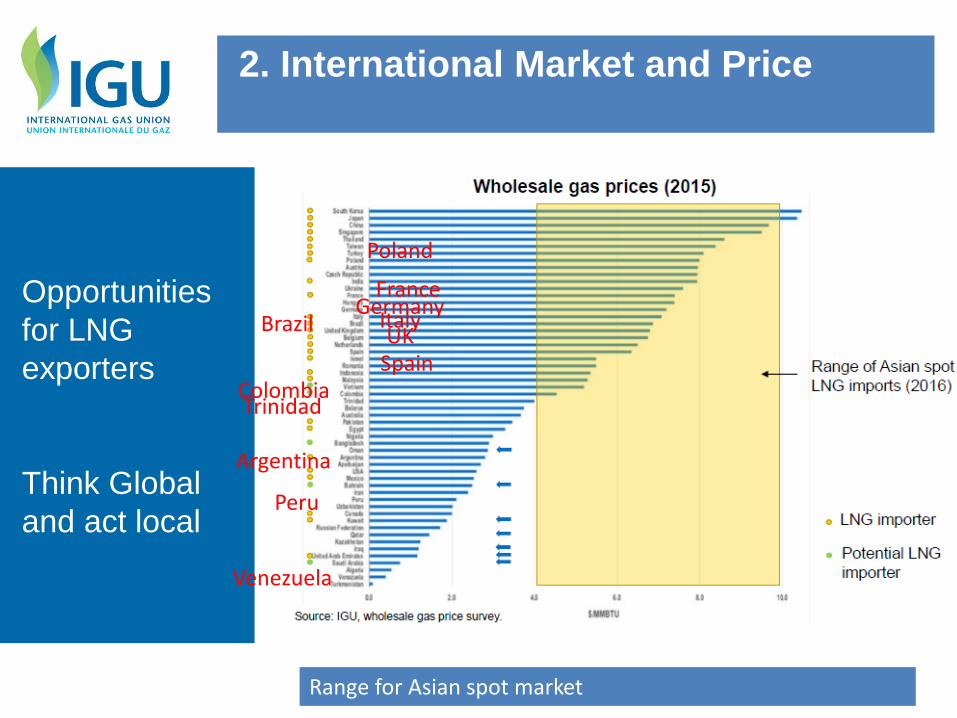
2. International Market and Price

Opportunities
for LNG
exporters
More importing countries and so on
Price formation led by USA
International price level in some regions are higher than Europe price level
2. International Market and Price
Opportunities
for LNG
exporters
Think Global
and act local
Range for Asian spot market
2. International Market and Price
Brazil
ColombiaTrinidad
Argentina
Peru
Venezuela
FranceGermany
Poland
UKSpain
Italy

Opportunities
reducing cost
production
Blast the production using fracking technologies
2. International Market and Price

3. A Growth Story for Natural Gas
World Natural Gas Demand by Scenario
1
2
3
4
5
6
1990
2000 2010
2020
2030 2040
Current PoliciesScenarioNew PoliciesScenario2 °C Scenario
Thousandbcm
Global gas demand is projected to plateau from the late-2020s in the 2 °C Scenario
Source: World Energy Outlook 2016; OECD/IEA
3. Golden
Age of
Gas

3. Gas Demand Growth: A Question of
Geography
Gas Demand by Selected Regions in the New Policies Scenario
150 300 450 600 750 900
India
Latin America
Africa
European Union
Russia
China
Middle East
United States
bcm
2014
Additionalin 2040
Developing countries lead the growth in global gas demand
Source: World Energy Outlook 2016; OECD/IEA
3. Golden
Age of
Gas

3. Not Quite the Usual Suspects
Change in Gas Production by Selected Region in the New Policies Scenario
2014-20 2020-25 2025-30 2030-35 2035-40
bcm OtherRussiaChinaMiddle EastUnited States& Australia
400
300
200
100
0
-100
By the 2020s, a rising share of gas output growth needs to come from a new cast of producers, such as East Africa & Argentina
Source: World Energy Outlook 2016; OECD/IEA
3. Golden
Age of
Gas

3. Evolution of Proven Gas ReservesGas is available and widely distributed
BP Statistical Review of World Energy, 2016

3. Global natural gas trade

A wave of
LNG spurs:
A second
natural gas
revolution
3. Golden age of Gas

4. Reactions to the COP21 agreement
4. Paris
Agreement
4. Natural Gas Enables the Energy
Transition
4. Paris
COP 21
A call to
action

4. Natural Gas Enables the Energy
Transition
4. Paris
COP 21
A call to
action
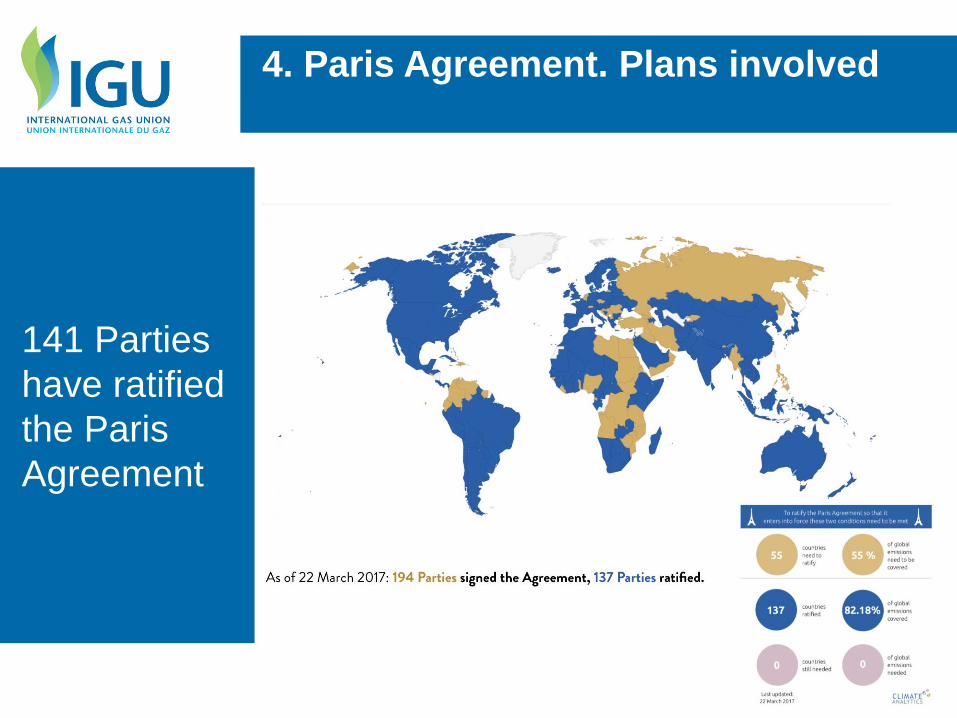
141 Parties
have ratified
the Paris
Agreement
4. Paris Agreement. Plans involved

IEA projected
gas as a winner
with increasing
share in energy
mix, unlike coal
or oilHowever, this
should not be taken
by industry as
default, because of
significant
uncertainties
(as submitted to COP21 in 2013 Source: IEA)
4. Paris Agreement. Plans involved

INDC’s
submitted
cover over
90% of
global fossil
fuel demand
and almost
80% of
production$13.5 trillion – full implementation cost to 2030 for low carbon and efficiency technologies
4. Paris Agreement. Plans involved

INDC’s
versus 2 ºC
trajectory.
Global GHG
emissions
forecast for
scenario
4. Paris Agreement. Plans involved

500 GtCO2
eq is the
additional
cumulative
effort, from
NDC’s
commitments
to 2 ºC
scenario
(Ener-green)
4. Paris Agreement. Plans involved

Polluted and Dirty air is an urgent
crisis

Case studies in improving urban air
quality

Coal to Gas switch: fastest way to reduce CO2
and smog in cities
27Source: Lambert Energy Advisroy Group (based on BP and IEA Stats)

5. Gas working with renewable Energy transitions:Long term process

5. Gas working with renewable Energy transitions:Long term process
1.Support variable renewable production2. Integrating systems CHP3. Biogas4. Power to Gas

Natural Gas Business: Challenges and
Opportunities. Gas in a sustainable energy mix
• Development and wide deployment of new zero/low-
carbon technologies associated to the gas industry (e.g.
biogas/biomethane, Power-to-gas and synthetic gases)
30Source: GreenPeace Energy
SYNTHETIC GAS BIOGAS
+
Natural gas in
the transition
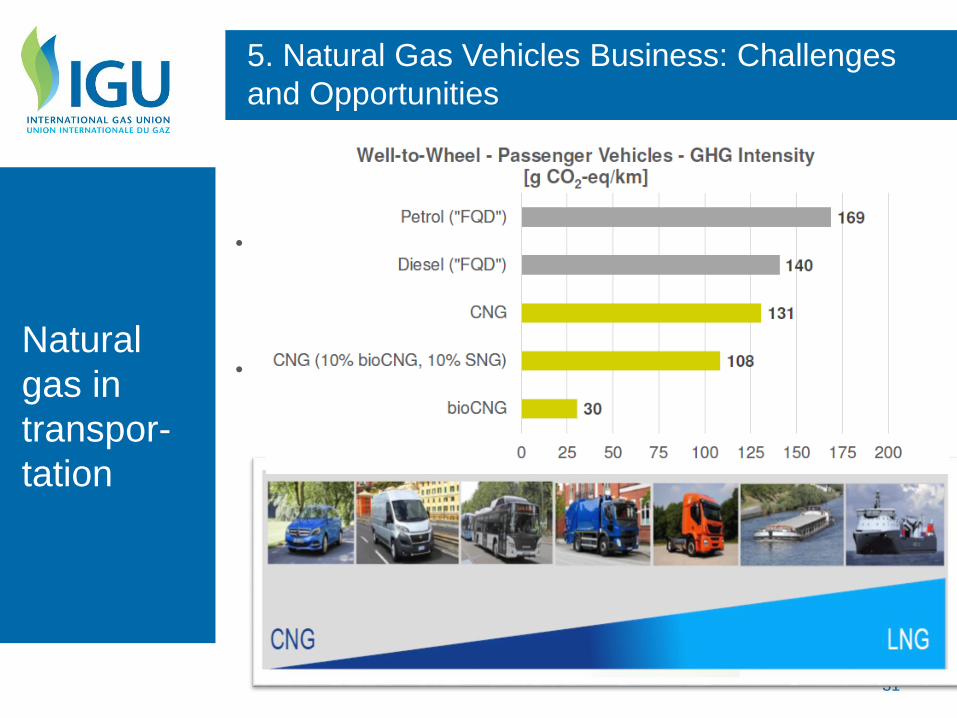
5. Natural Gas Vehicles Business: Challenges
and Opportunities
• Truly enabling the integration of variable renewable
sources (VRES) in the transition to a low-carbon
economy.
• Gaining a significant market share in the mobility sector
(specifically in the heavy duty and maritime sector)
31
Natural
gas in
transpor-
tation

5. Natural gas as transportation fuel
Fuel Consumption of Different vehicles. Equivalences
32
1 Ferry
65 small boats
130 fishing boats
1.300 buses
10.800 taxis
Consumption of CNG/LNG
MW.h/year
395.000
5.900
3.000
290
40
uses as much fuel as
or
or
or
or
80.000 private cars
Natural
gas in
transport-
tation
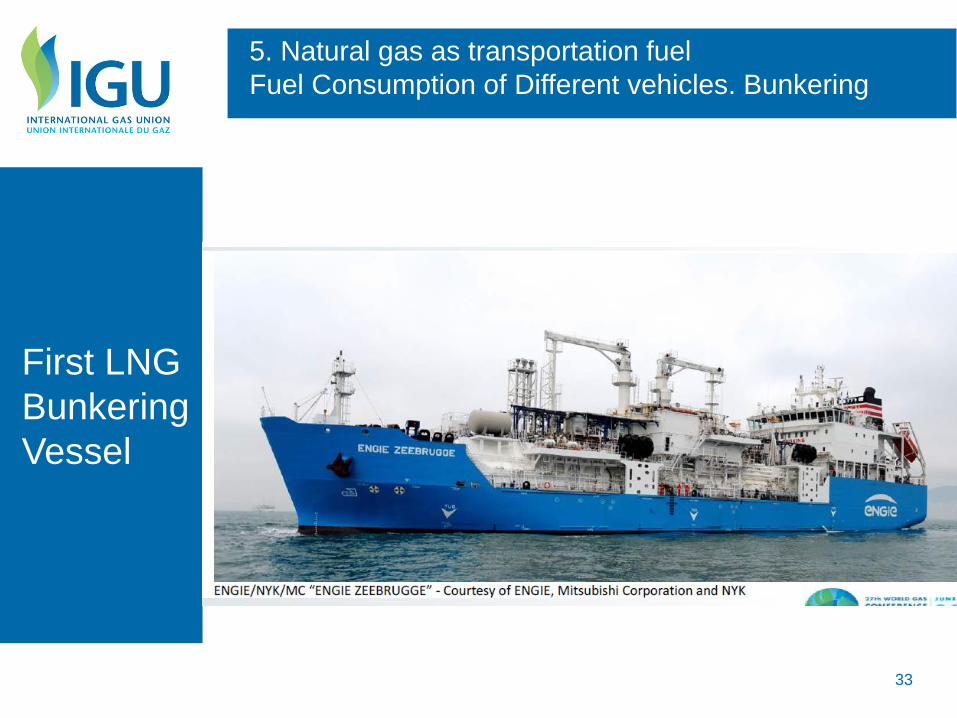
5. Natural gas as transportation fuel
Fuel Consumption of Different vehicles. Bunkering
33
First LNG
Bunkering
Vessel

5. Closing thoughts on energy transition
• Urgency needed to tackle climate change and
air quality
• Gas can play important role; need enlightened
policies
• Governments provide direction, markets
respond
• More investment in technology
• Tireless focus by industry on social license
Natural
gas in
the
transition

Three things to remember
We need more energy globally
Natural Gas is part of the long
term sustainable energy solution
We contribute at Paris agreement

Next appointment in Washington

Thank you for your attention!