Natural Disaster Hotspots: A Global Risk Analysis · PDF fileNatural Disaster Hotspots: A...
24
Natural Disaster Hotspots: A Global Risk Analysis Risk Identification for Disaster Risk Management Maxx Dilley International Research Institute for Climate Prediction L i n k i n g L i n k i n g S c i e n c e S c i e n c e t o t o S o c i e t y S o c i e t y
-
Upload
phungquynh -
Category
Documents
-
view
224 -
download
5
Transcript of Natural Disaster Hotspots: A Global Risk Analysis · PDF fileNatural Disaster Hotspots: A...
Natural Disaster Hotspots: A Global Risk Analysis
Risk Identification for Disaster Risk Management
Maxx DilleyInternational Research Institute
for Climate Prediction
L i n k i n g L i n k i n g S c i e n c e S c i e n c e t o t o S o c i e t yS o c i e t y
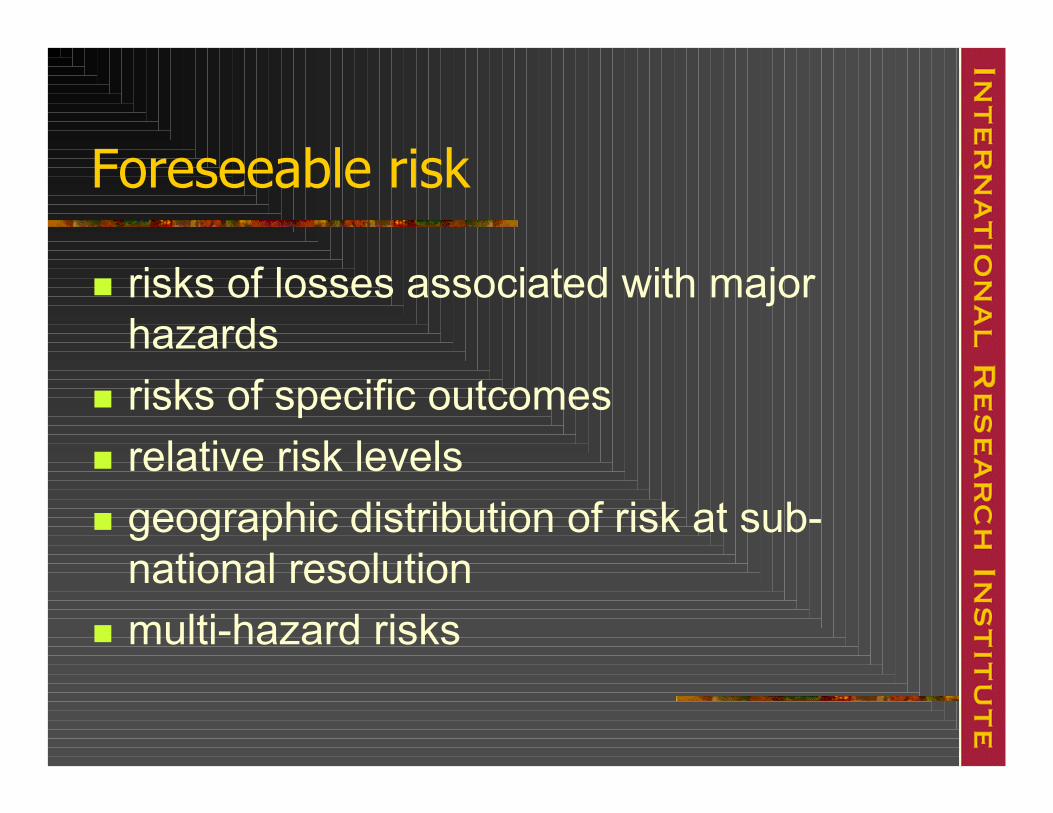
Foreseeable risk
risks of losses associated with major hazardsrisks of specific outcomesrelative risk levelsgeographic distribution of risk at sub-national resolutionmulti-hazard risks
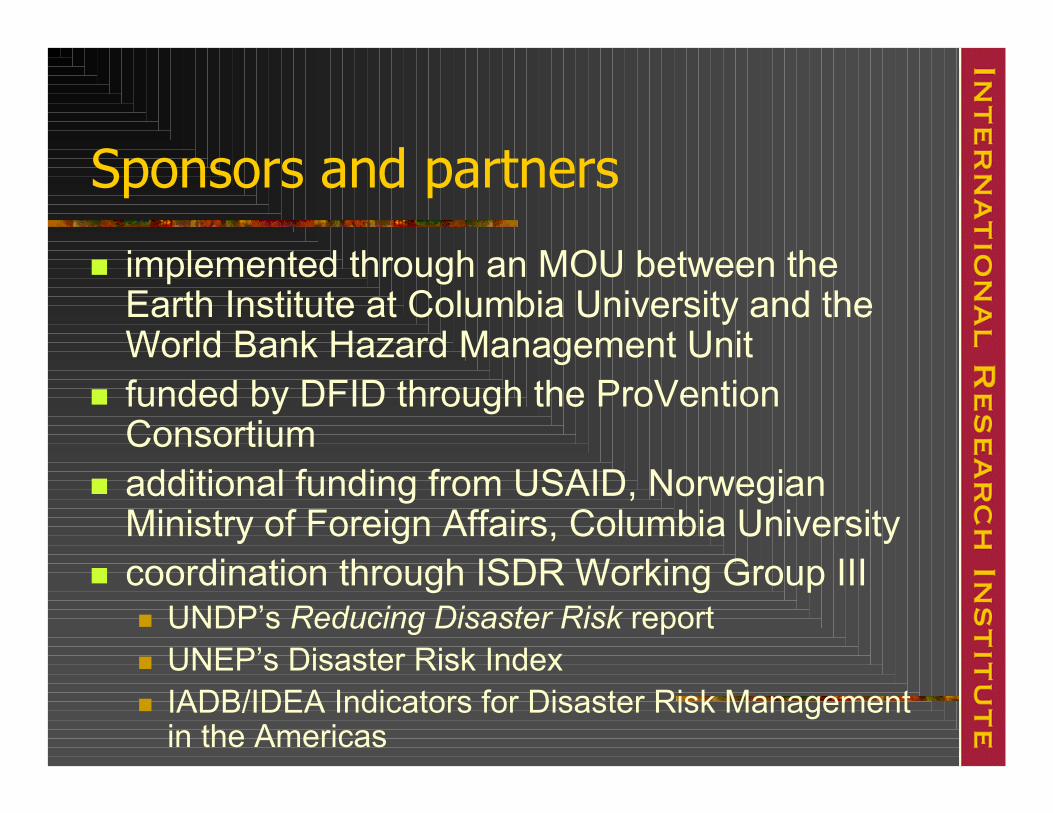
Sponsors and partners
implemented through an MOU between the Earth Institute at Columbia University and the World Bank Hazard Management Unit funded by DFID through the ProVention Consortiumadditional funding from USAID, Norwegian Ministry of Foreign Affairs, Columbia University coordination through ISDR Working Group III
UNDP’s Reducing Disaster Risk reportUNEP’s Disaster Risk IndexIADB/IDEA Indicators for Disaster Risk Management in the Americas
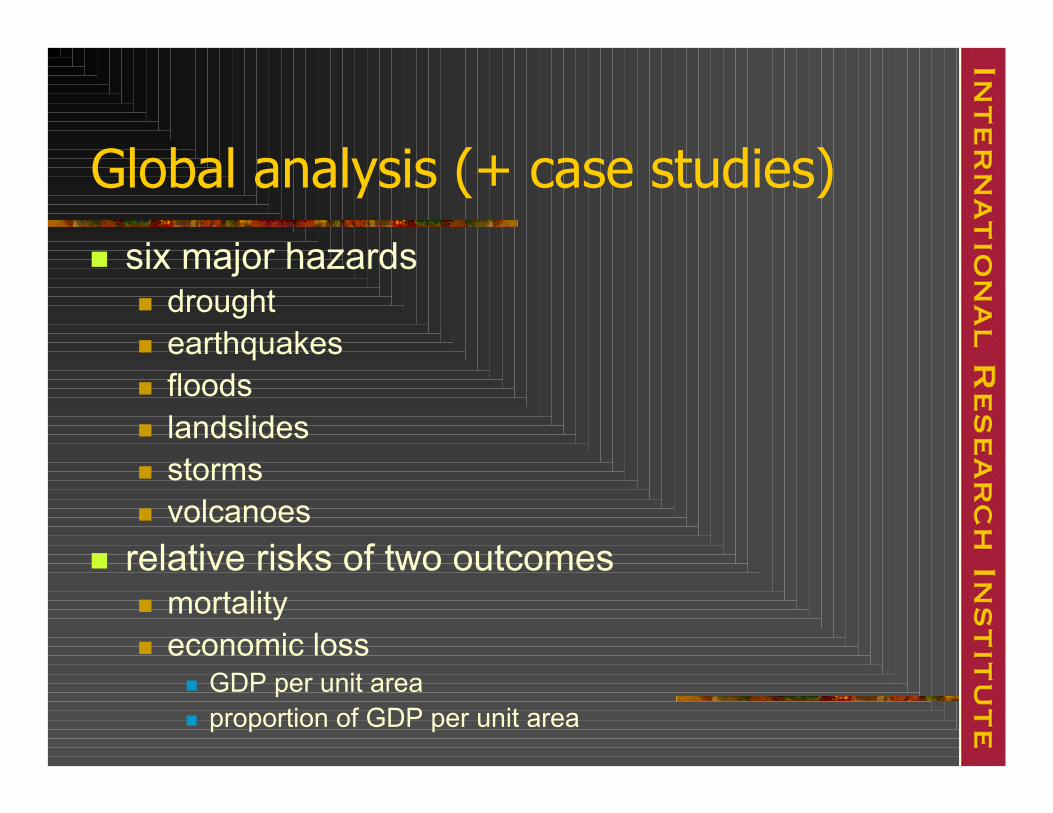
Global analysis (+ case studies)six major hazards
droughtearthquakesfloodslandslidesstormsvolcanoes
relative risks of two outcomesmortalityeconomic loss
GDP per unit areaproportion of GDP per unit area
Methodology
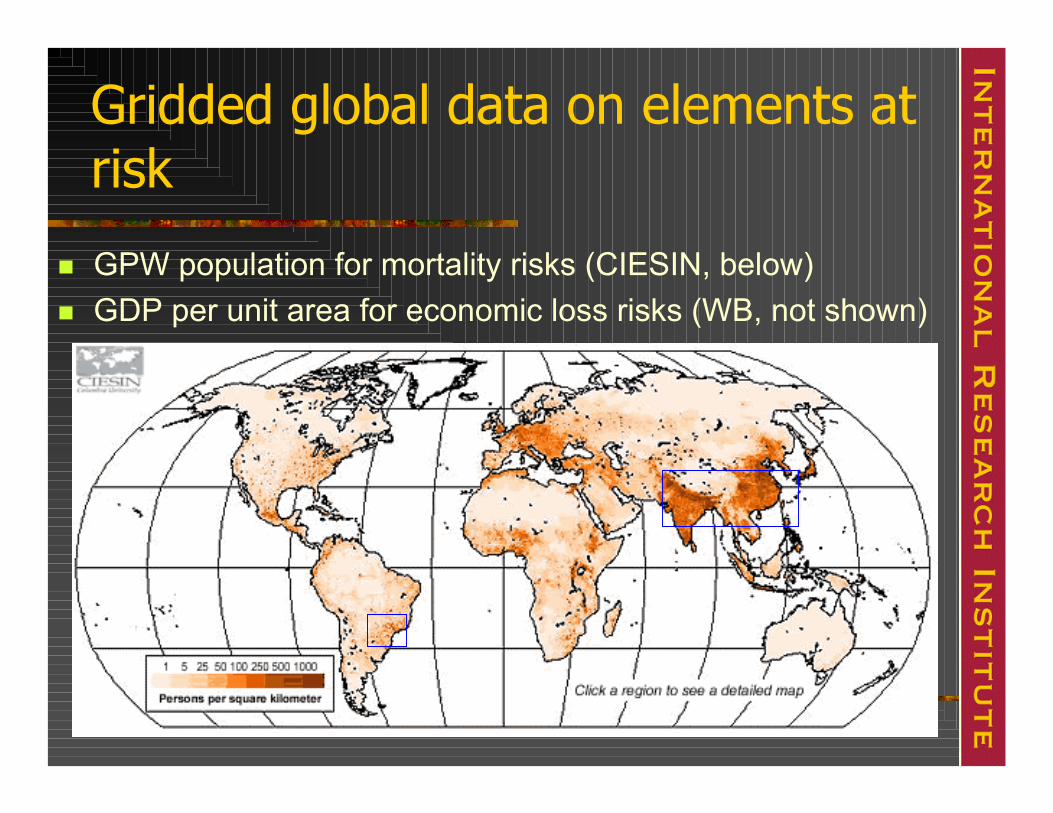
Gridded global data on elements at risk
GPW population for mortality risks (CIESIN, below)GDP per unit area for economic loss risks (WB, not shown)
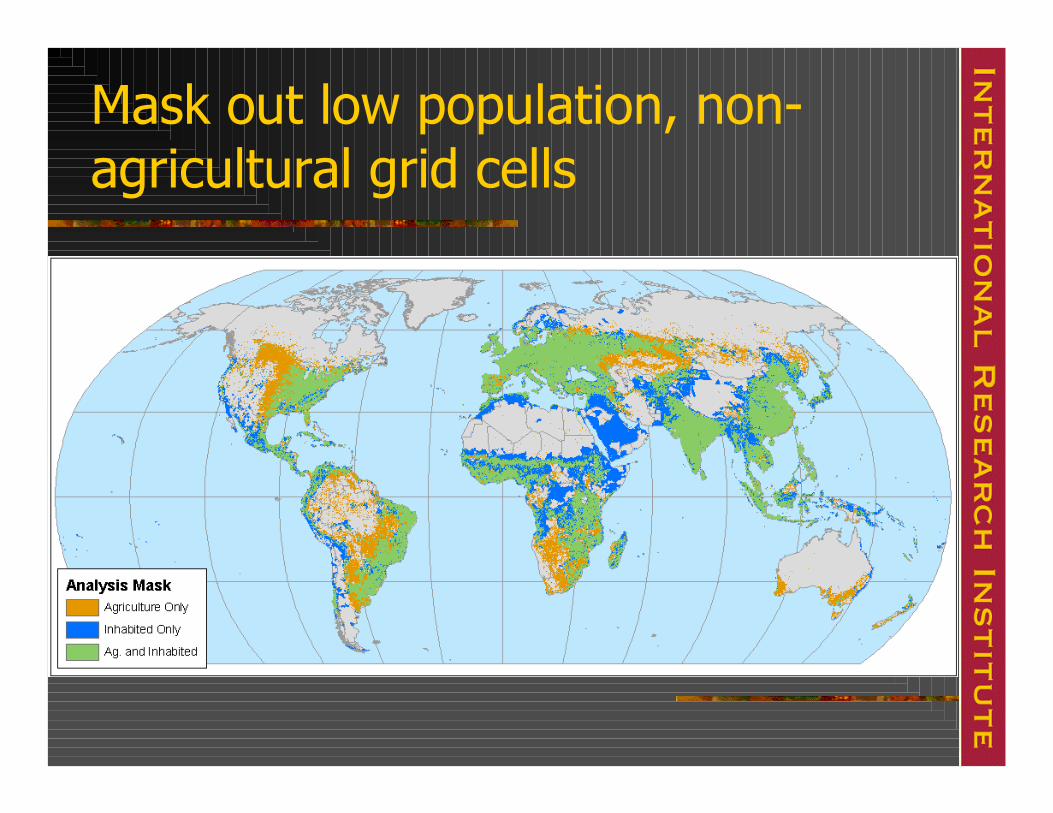
Mask out low population, non-agricultural grid cells
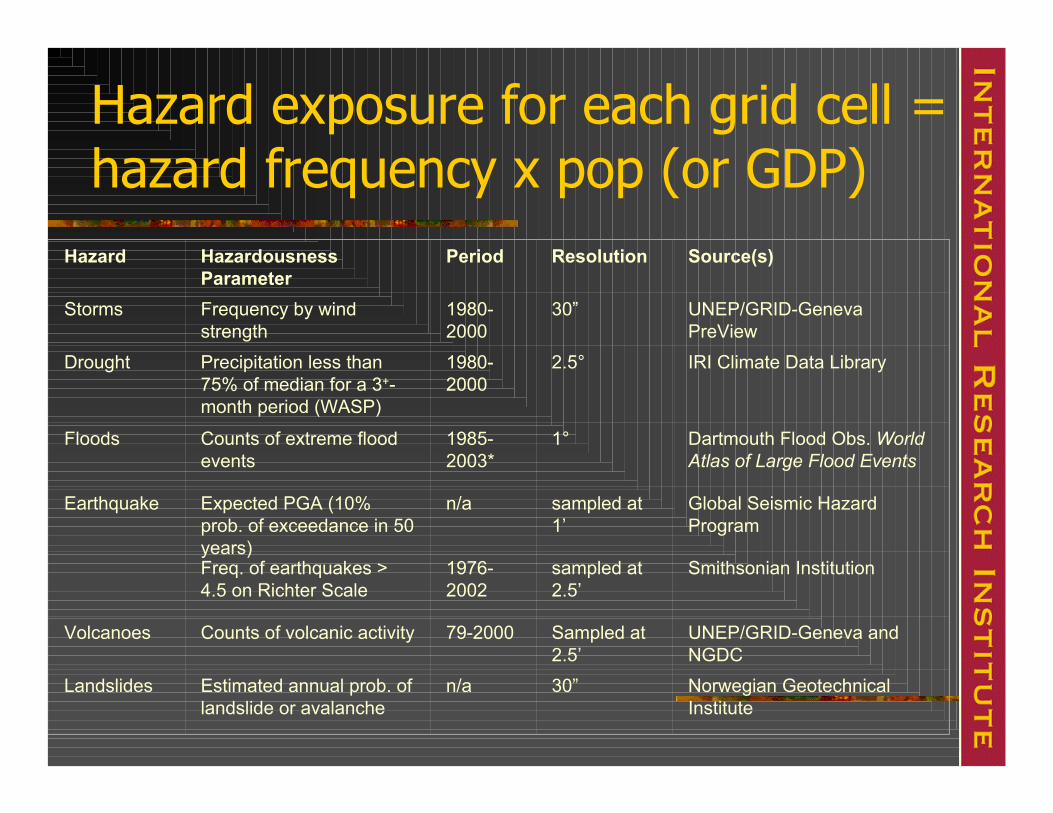
Hazard exposure for each grid cell = hazard frequency x pop (or GDP)
Hazard Hazardousness Parameter
Period Resolution Source(s)
Storms Frequency by wind strength
1980-2000
30” UNEP/GRID-Geneva PreView
Drought Precipitation less than 75% of median for a 3+-month period (WASP)
1980-2000
2.5° IRI Climate Data Library
Floods Counts of extreme flood events
1985-2003*
1° Dartmouth Flood Obs. World Atlas of Large Flood Events
Earthquake Expected PGA (10% prob. of exceedance in 50 years)
n/a sampled at 1’
Global Seismic Hazard Program
Freq. of earthquakes > 4.5 on Richter Scale
1976-2002
sampled at 2.5’
Smithsonian Institution
Volcanoes Counts of volcanic activity 79-2000 Sampled at 2.5’
UNEP/GRID-Geneva and NGDC
Landslides Estimated annual prob. of landslide or avalanche
n/a 30” Norwegian Geotechnical Institute
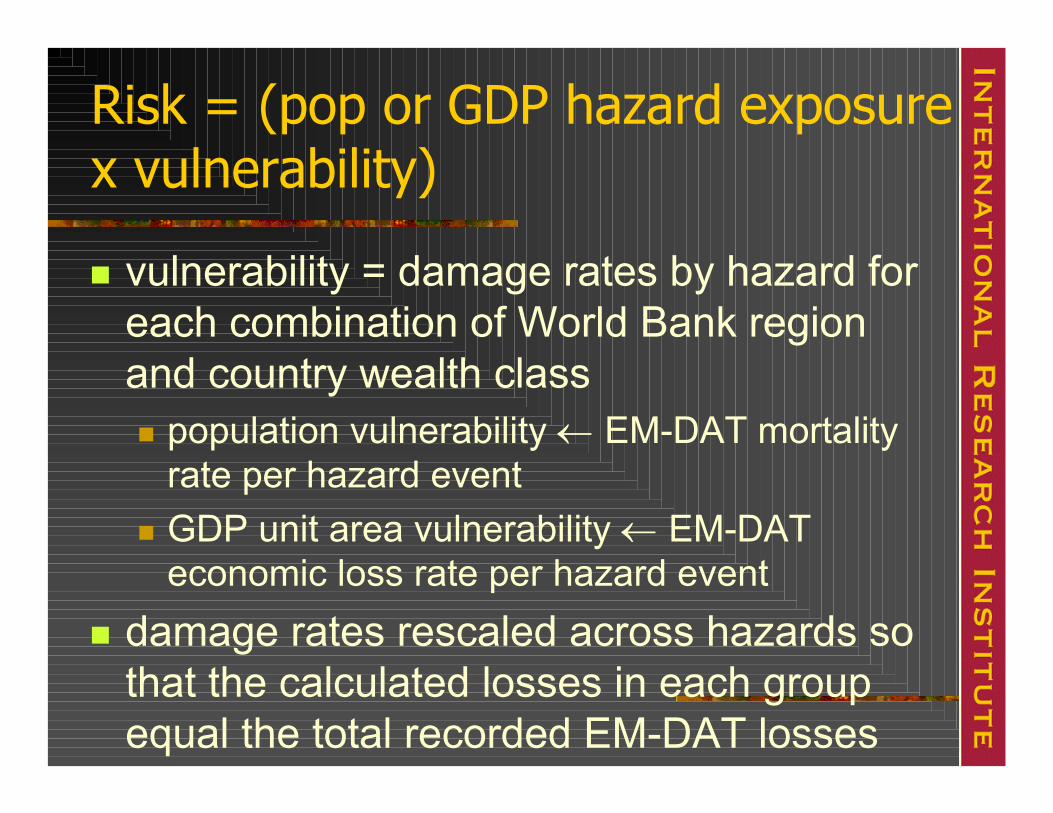
Risk = (pop or GDP hazard exposure x vulnerability)
vulnerability = damage rates by hazard for each combination of World Bank region and country wealth class
population vulnerability ← EM-DAT mortality rate per hazard eventGDP unit area vulnerability ← EM-DAT economic loss rate per hazard event
damage rates rescaled across hazards so that the calculated losses in each group equal the total recorded EM-DAT losses
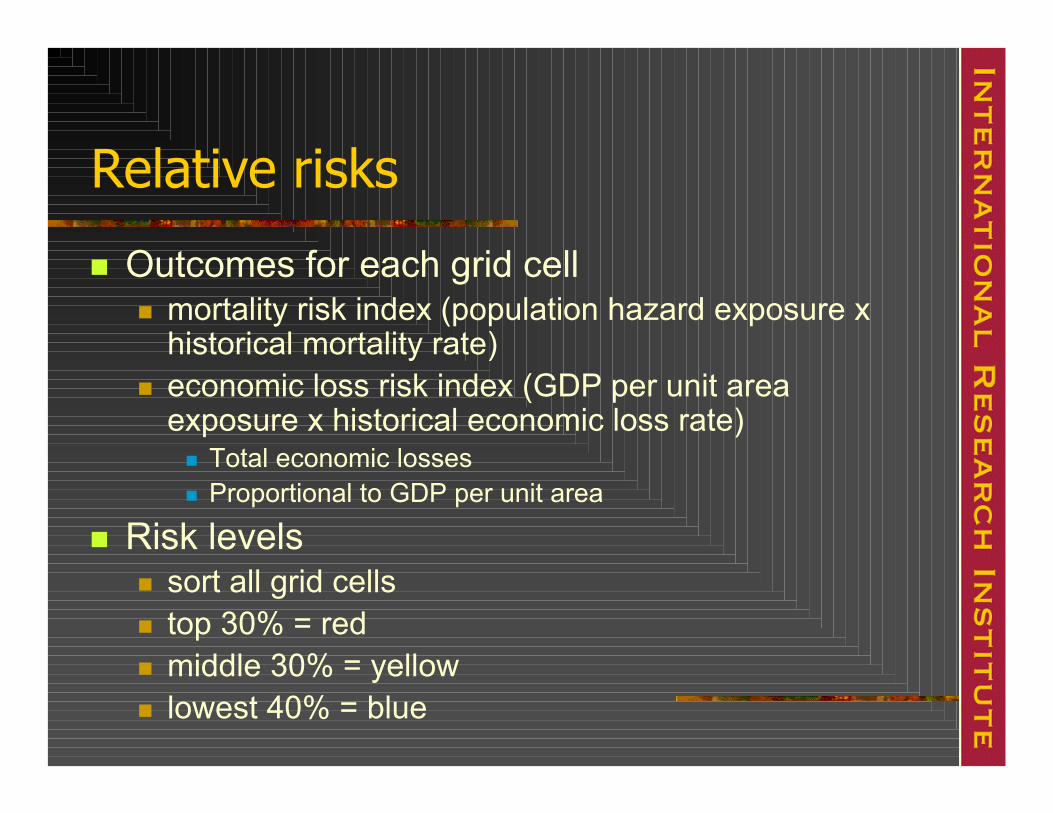
Relative risks
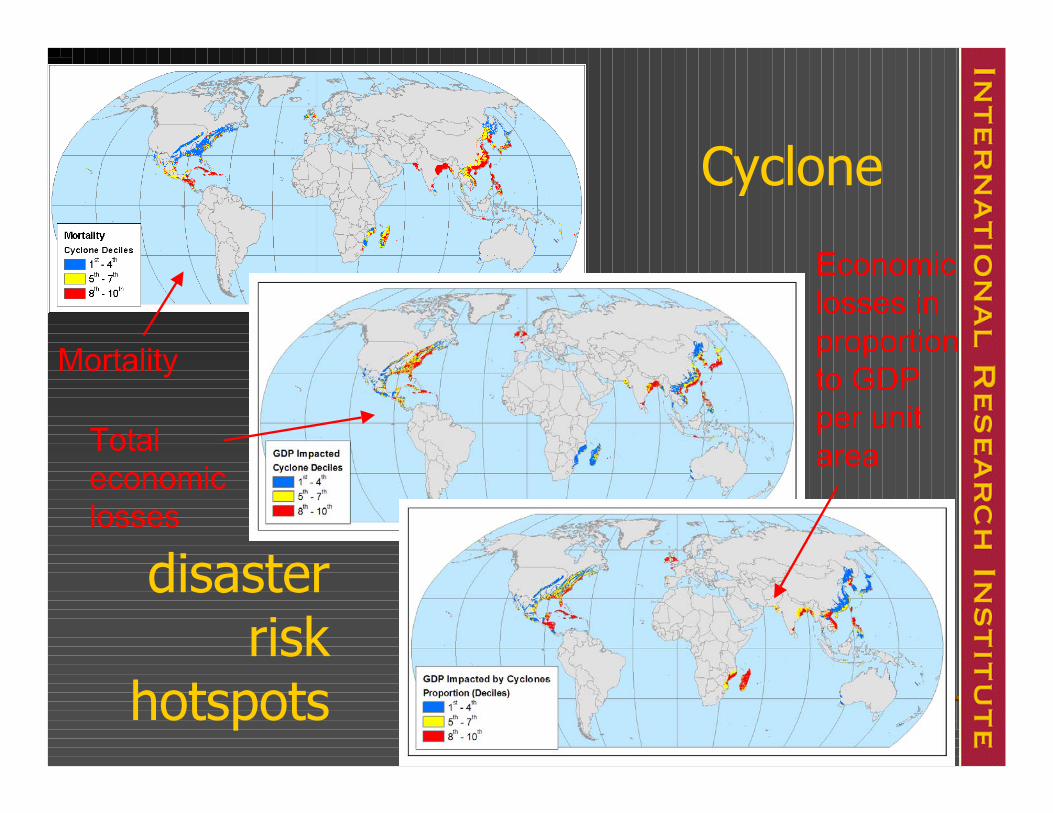
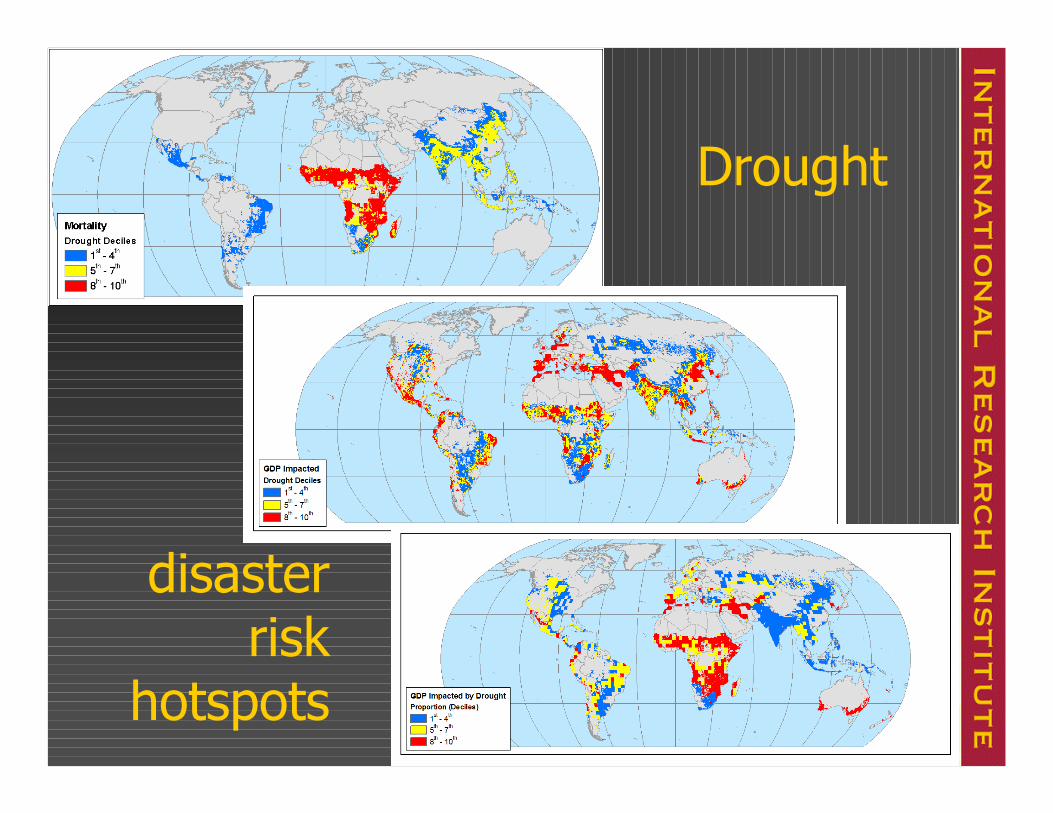
Outcomes for each grid cellmortality risk index (population hazard exposure x historical mortality rate)economic loss risk index (GDP per unit area exposure x historical economic loss rate)
Total economic lossesProportional to GDP per unit area
Risk levelssort all grid cellstop 30% = redmiddle 30% = yellowlowest 40% = blue
Results
disasterrisk
hotspots
Cyclone
Mortality
Totaleconomiclosses
Economiclosses inproportionto GDPper unitarea
disasterrisk
hotspots
Drought
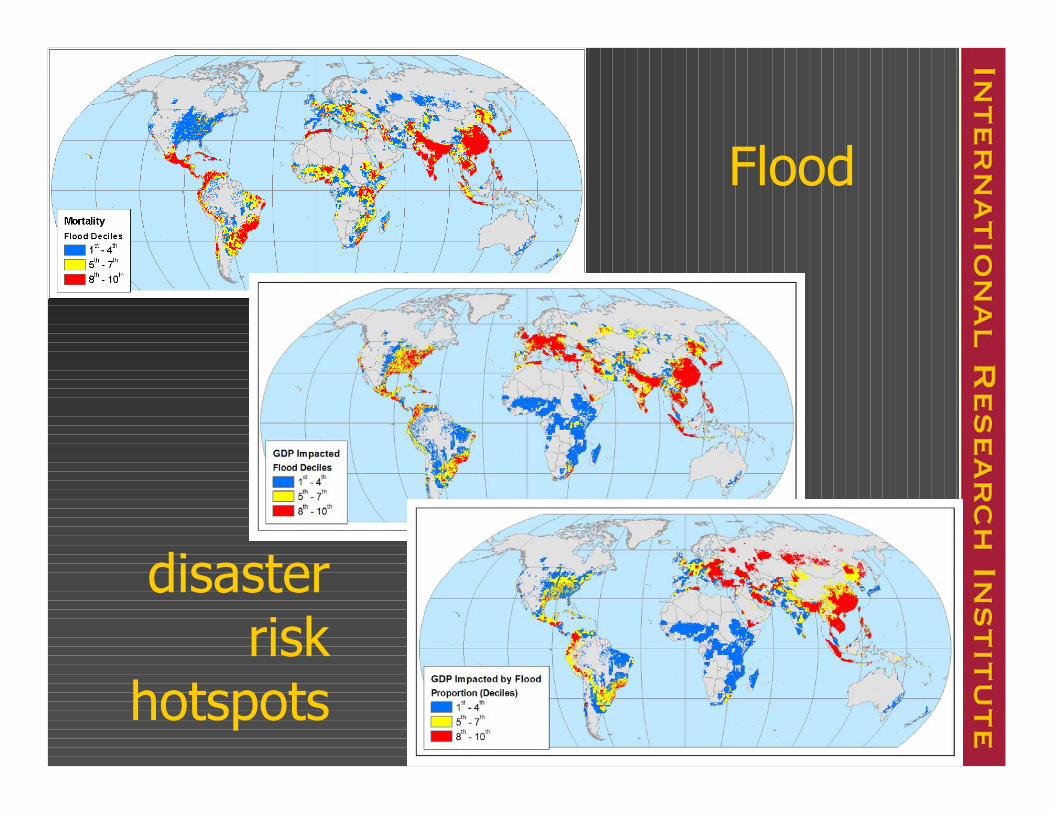
Flood
disasterrisk
hotspots
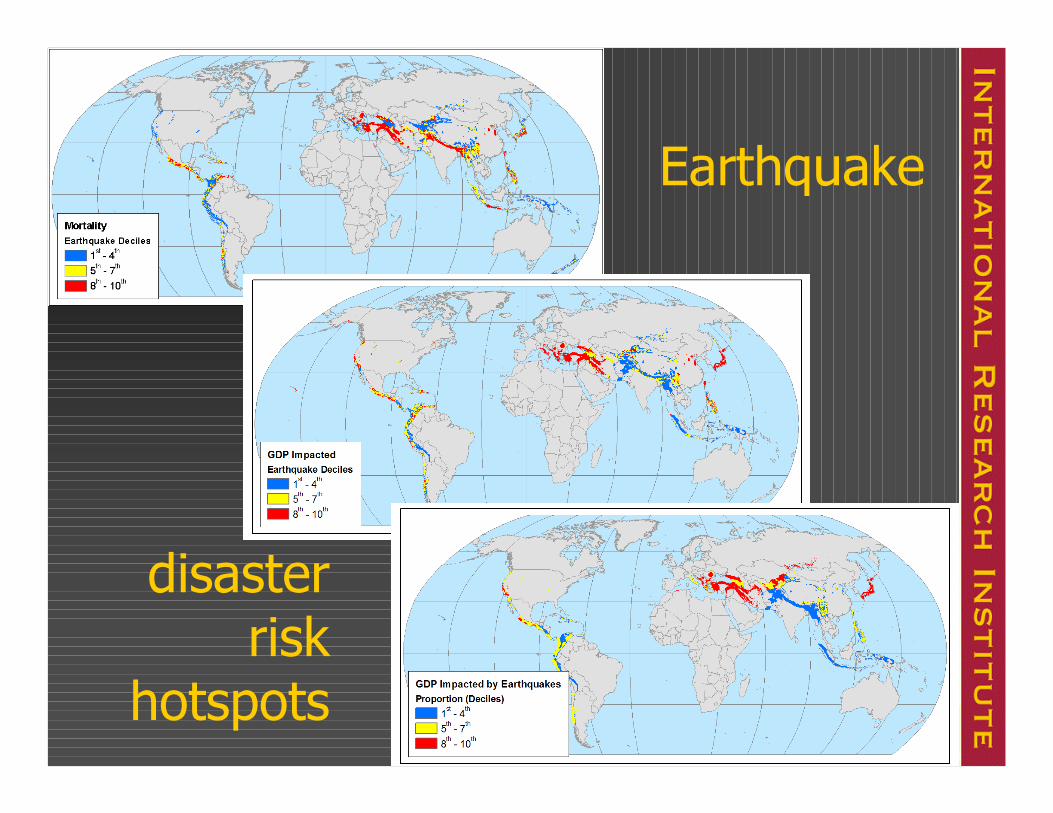
Earthquake
disasterrisk
hotspots
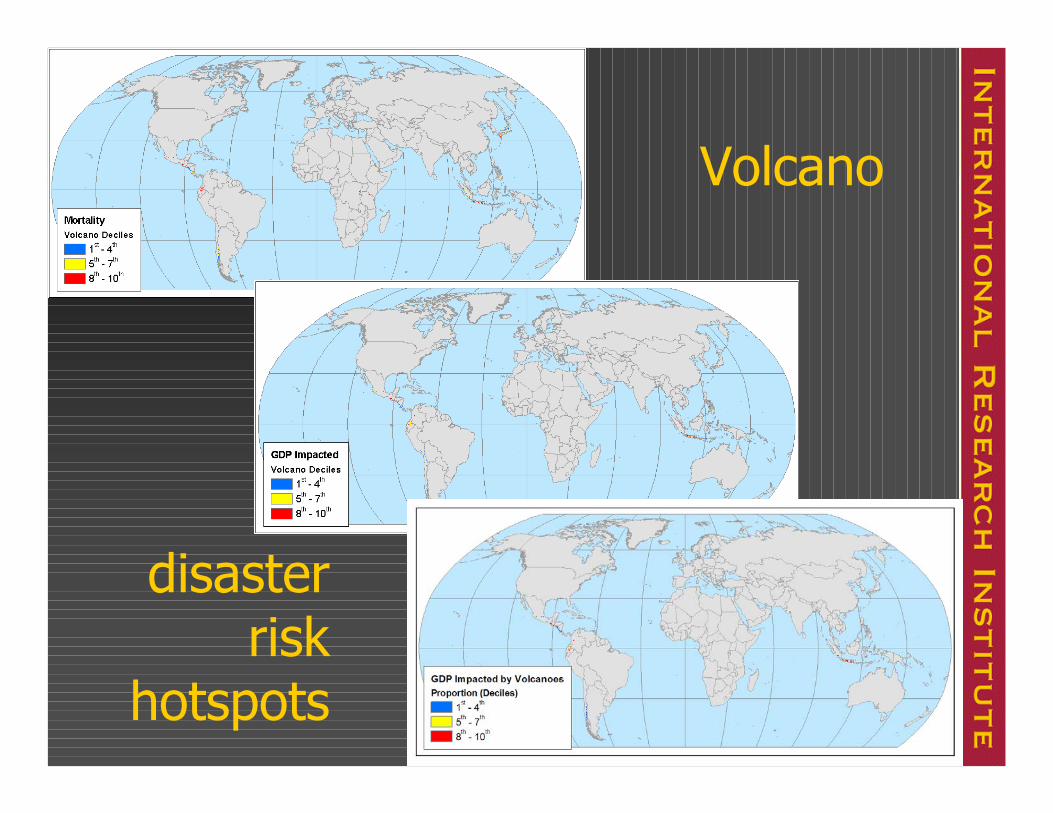
Volcano
disasterrisk
hotspots
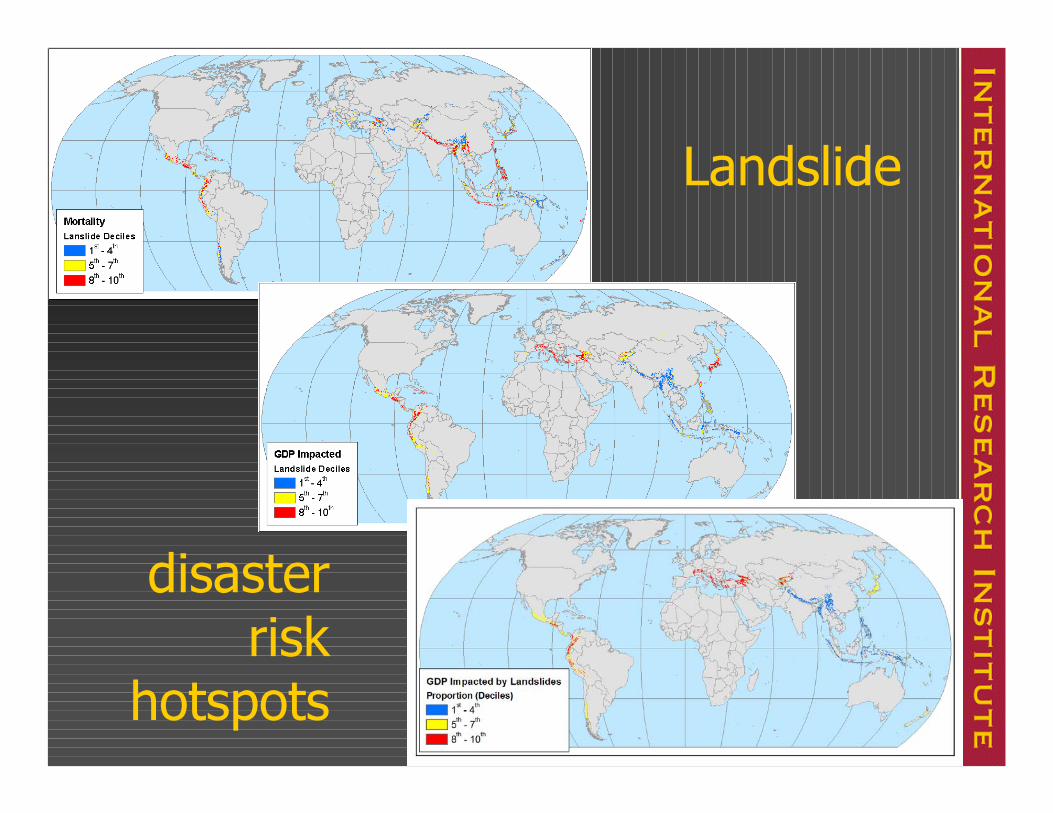
Landslide
disasterrisk
hotspots
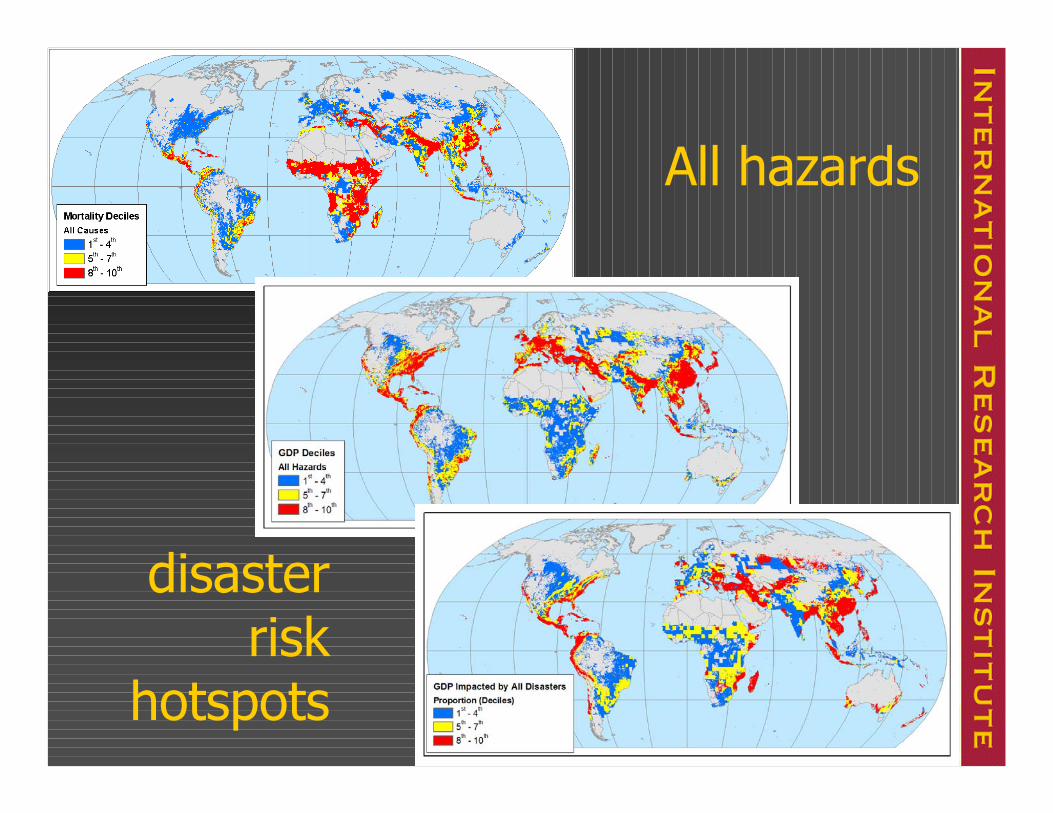
All hazards
disasterrisk
hotspots
Interpretation
L i n k i n g L i n k i n g S c i e n c e S c i e n c e t o t o S o c i e t yS o c i e t y
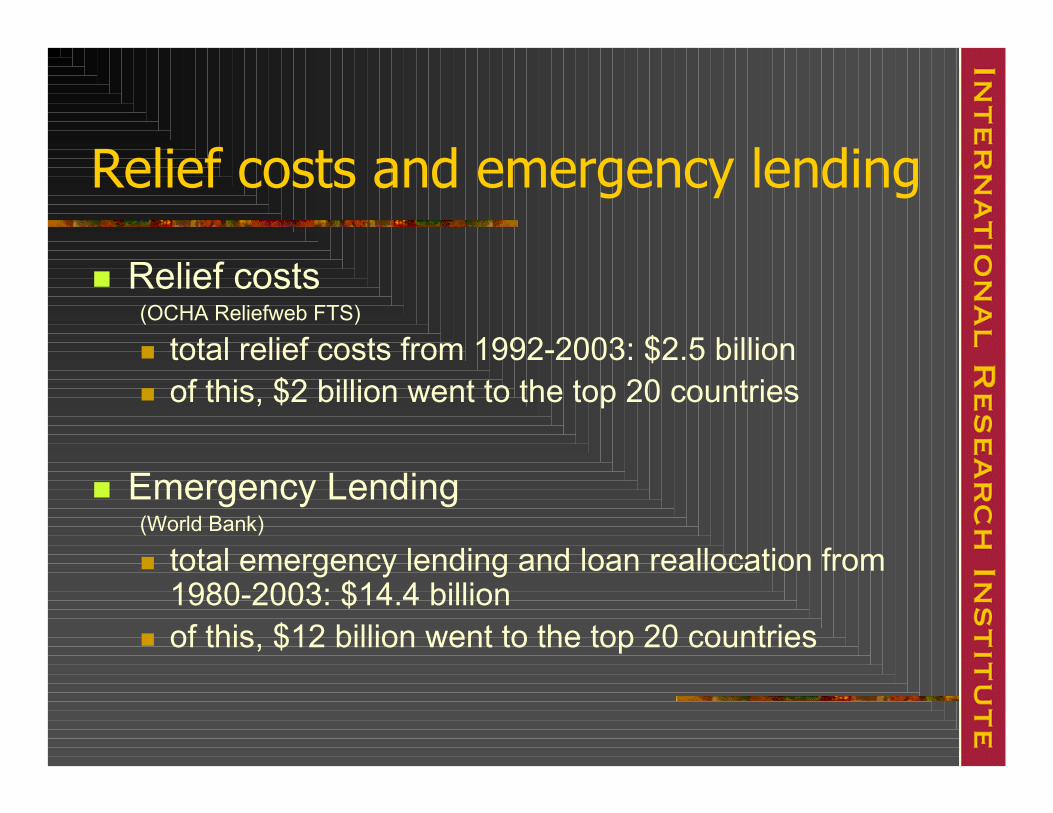
Relief costs and emergency lending
Relief costs (OCHA Reliefweb FTS)
total relief costs from 1992-2003: $2.5 billionof this, $2 billion went to the top 20 countries
Emergency Lending(World Bank)
total emergency lending and loan reallocation from 1980-2003: $14.4 billionof this, $12 billion went to the top 20 countries
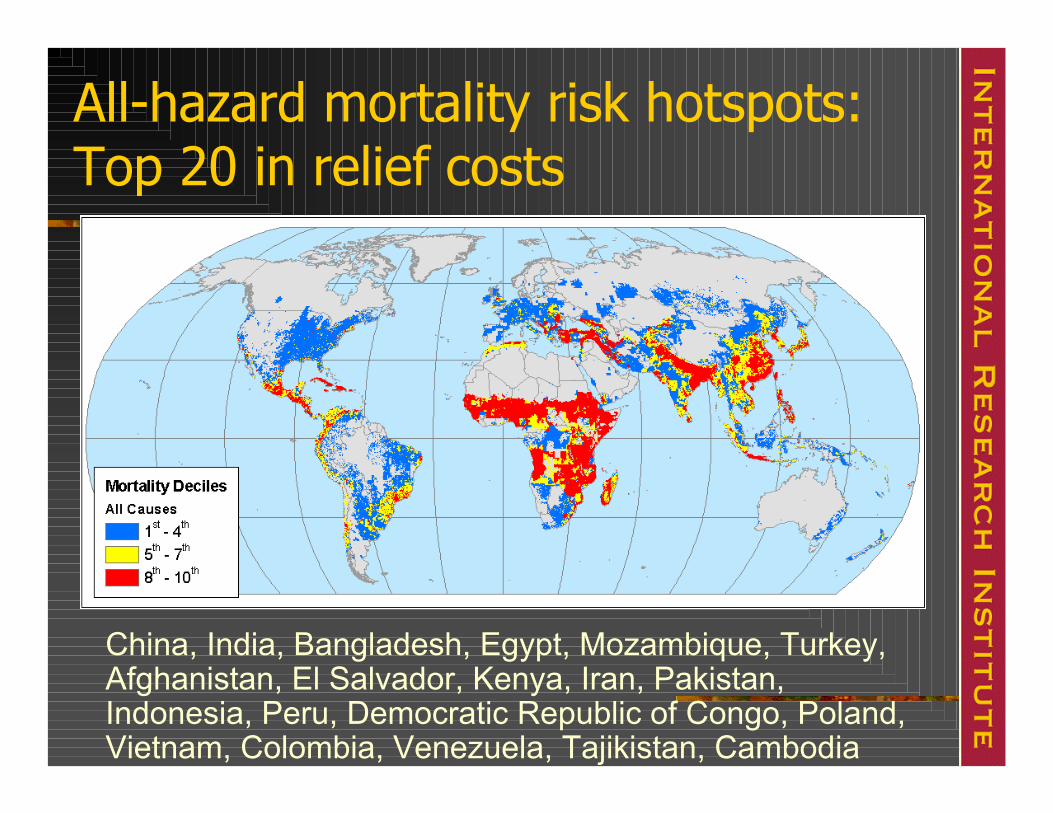
All-hazard mortality risk hotspots: Top 20 in relief costs
China, India, Bangladesh, Egypt, Mozambique, Turkey, Afghanistan, El Salvador, Kenya, Iran, Pakistan, Indonesia, Peru, Democratic Republic of Congo, Poland, Vietnam, Colombia, Venezuela, Tajikistan, Cambodia
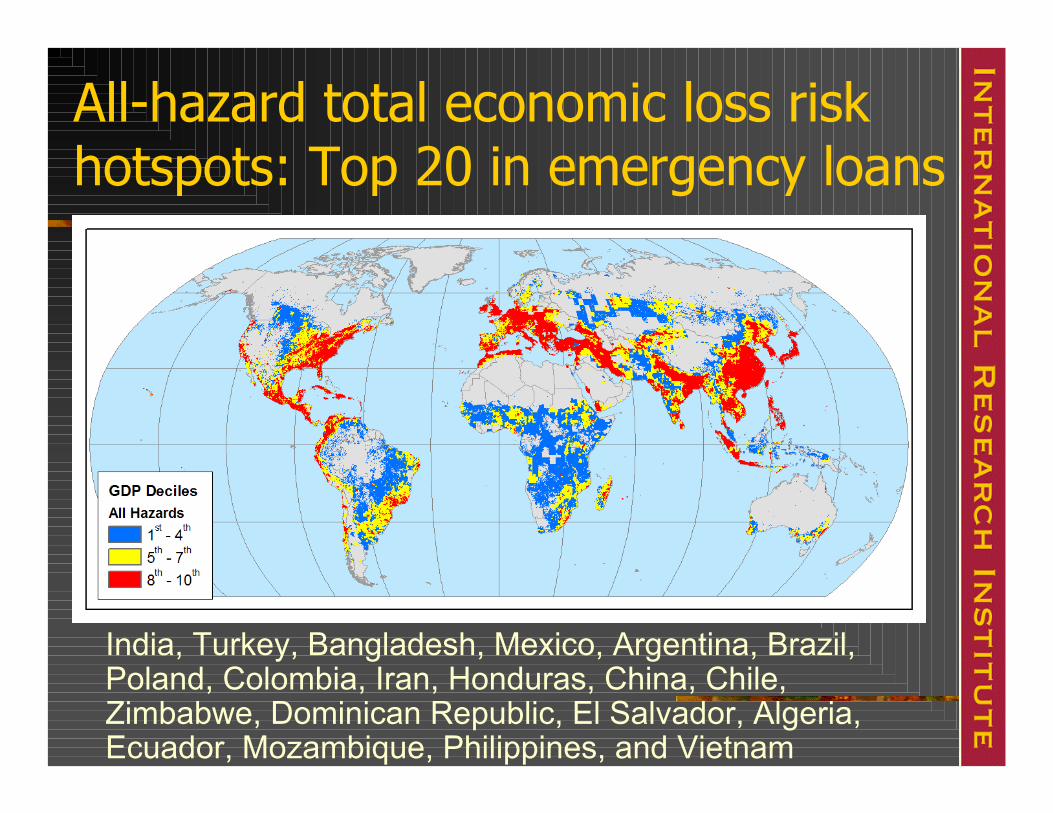
All-hazard total economic loss risk hotspots: Top 20 in emergency loans
India, Turkey, Bangladesh, Mexico, Argentina, Brazil, Poland, Colombia, Iran, Honduras, China, Chile, Zimbabwe, Dominican Republic, El Salvador, Algeria, Ecuador, Mozambique, Philippines, and Vietnam
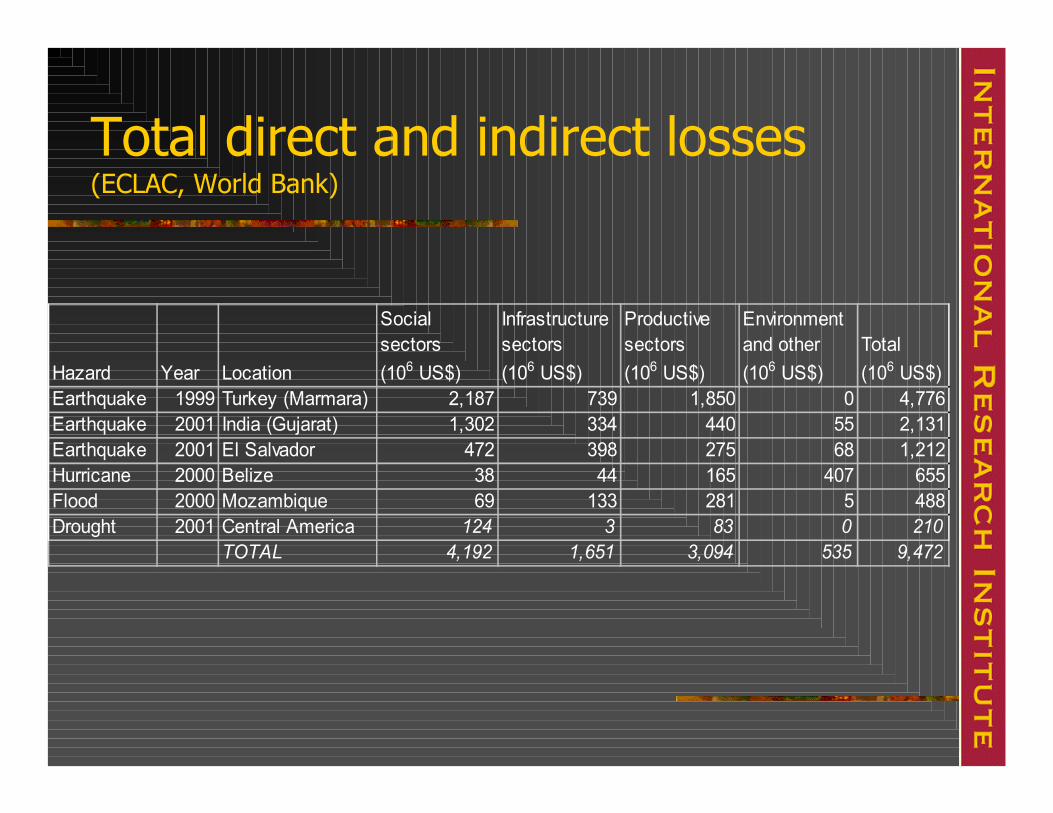
Total direct and indirect losses (ECLAC, World Bank)
Hazard Year Location
Social sectors (106 US$)
Infrastructure sectors (106 US$)
Productive sectors (106 US$)
Environment and other (106 US$)
Total (106 US$)
Earthquake 1999 Turkey (Marmara) 2,187 739 1,850 0 4,776Earthquake 2001 India (Gujarat) 1,302 334 440 55 2,131Earthquake 2001 El Salvador 472 398 275 68 1,212Hurricane 2000 Belize 38 44 165 407 655Flood 2000 Mozambique 69 133 281 5 488Drought 2001 Central America 124 3 83 0 210
TOTAL 4,192 1,651 3,094 535 9,472

Selected next steps in global risk analysis
World Bank to publish Hotspots global analysis and case studies in two volumes (Jan. 2005)create internet access to Hotspots input datacompare Hotspots and Disaster Risk Index resultsimprove global drought, flood and landslide hazard data and assess tsunami risksimprove global loss data, especially economic lossesbegin to move from static to dynamic risk assessment for disaster early warning