Natural Capital Policy Review - David Suzuki Foundation
67
Natural Capital Policy Review A REVIEW OF POLICY OPTIONS TO PROTECT, ENHANCE AND RESTORE NATURAL CAPITAL IN B.C.’s URBAN AREAS
Transcript of Natural Capital Policy Review - David Suzuki Foundation

Natural Capital Policy Review
A Review of PoliCy oPtioNs to PRoteCt, eNhANCe ANd RestoRe NAtuRAl CAPitAl iN B.C.’s uRBAN AReAs

suite 219, 2211 west 4th Avenue, vancouver, B.C. v6K 4s2
t: 604.732.4228 f: 604.732.4228 toll free: 1-800-453-1533
www.davidsuzuki.org
NAtuRAl CAPitAl PoliCy Review A Review of Policy options to Protect, enhance and Restore Natural Capital in B.C.’s urban Areas
september 2011
By Michelle Molnar
this report was made possible through the generous support of the vancouver foundation
Graphic design and contributing photography by Nadene Rehnby and Pete tuepah handsonpublications.com
Canadian Cataloguing in Publication data for this report is available through the National library of Canada
this report can be downloaded free of charge at www.davidsuzuki.org/publications
isBN 978-1-897375-43-3
ContentsexeCutive suMMARy ..........................................................................................................................5
Abbreviations .....................................................................................................................................6
Glossary .............................................................................................................................................. 7
seCtioN 1: settiNG the stAGe ...........................................................................................................8
Methodology ...................................................................................................................................... 9
outline ................................................................................................................................................. 9
1.1 what is Natural Capital and why does it Matter? .......................................................10
1.2 the state of Natural Capital and ecosystem services ............................................... 13
1.3 drivers of loss ................................................................................................................19
1.4 Role of Government ........................................................................................................20
seCtioN 2: PoliCy tools to PRoteCt NAtuRAl CAPitAl ..............................................................23
2.1 Public ownership ............................................................................................................23
2.1.1 free Crown Grant Program ................................................................................24
2.1.2 Purchase of Property Rights .............................................................................24
2.2 Regulatory instruments ................................................................................................26
2.2.1 Planning documents .........................................................................................26
2.2.2 Zoning tools ........................................................................................................30
2.2.3 environmental Bylaws .......................................................................................35
2.2.4 Performance Bonds and Covenants .................................................................38
2.3 Market-based tools ........................................................................................................40
2.3.1 environmental tax instruments .......................................................................40
2.3.2 Bonuses, fees and Charges ............................................................................. 44
2.3.3 subsidy Reform ..................................................................................................48
2.3.4 Creating Markets ................................................................................................48
seCtioN 3: PoliCy ANAlysis .............................................................................................................51
3.1 Policy options .................................................................................................................51
3.1.1 Policy option #1: Natural Capital Accounts .....................................................51
3.1.2 Policy option #2: Connecting our Protected Areas ........................................54
3.1.3 Policy option #3: Mainstreaming ecosystem services .................................56
3.2 Policy Criteria ..................................................................................................................58
3.3 Policy Analysis ................................................................................................................59
3.4 Recommendations and Conclusions ........................................................................... 61
References .......................................................................................................................................62
Page 4
Download this report,
our 2008 report on
natural capital in Ontario,
and our 2010 report on
natural capital in B.C.’s
Lower Mainland at
davidsuzuki.org/
publications/
ACKNowledGeMeNts
Many people helped to make this report a reality. the following individuals provided
invaluable contributions to this report, through expert interviews, advice, guidance, and
as workshop participants: Rod stott(district of Maple Ridge), steffanie warriner (City
of Coquitlam), dave wahn (City of Nelson), heather Beresford (Resort Municipality of
whistler), Richard white and isabel Gordon(City of North vancouver), Adriane Pollard
(district of saanich), Alan duncan (City of vancouver), lisa Gordon (islands trust),
Caroline Ashekian (district of squamish), Kate Miller (Cowichan valley Regional district),
Rod shead and Pauline favero (City of Abbotsford), lea elliott (City of Richmond),
lise townsend (City of Burnaby), and Phil Kent (City of duncan); and david suzuki
foundation staff dr. faisal Moola and Jode Roberts. special thanks to dr. Nancy olewiler
and Andrew Bevan for their helpful guidance, feedback, and suggestions for improving
various elements of this report.
Dav iD s uzu ki fOu n DatiOn Page 5
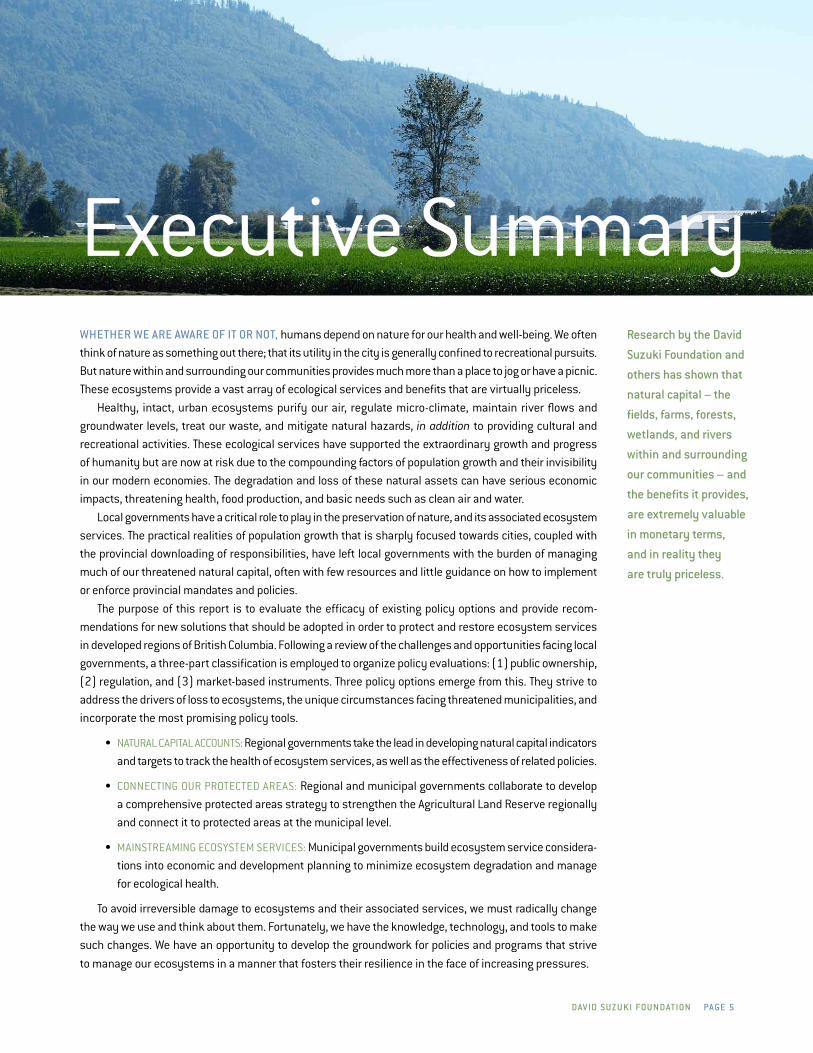
Whether We are aWare Of it Or nOt, humans depend on nature for our health and well-being. we often think of nature as something out there; that its utility in the city is generally confined to recreational pursuits. But nature within and surrounding our communities provides much more than a place to jog or have a picnic. these ecosystems provide a vast array of ecological services and benefits that are virtually priceless.
healthy, intact, urban ecosystems purify our air, regulate micro-climate, maintain river flows and groundwater levels, treat our waste, and mitigate natural hazards, in addition to providing cultural and recreational activities. these ecological services have supported the extraordinary growth and progress of humanity but are now at risk due to the compounding factors of population growth and their invisibility in our modern economies. the degradation and loss of these natural assets can have serious economic impacts, threatening health, food production, and basic needs such as clean air and water.
local governments have a critical role to play in the preservation of nature, and its associated ecosystem services. the practical realities of population growth that is sharply focused towards cities, coupled with the provincial downloading of responsibilities, have left local governments with the burden of managing much of our threatened natural capital, often with few resources and little guidance on how to implement or enforce provincial mandates and policies.
the purpose of this report is to evaluate the efficacy of existing policy options and provide recom-mendations for new solutions that should be adopted in order to protect and restore ecosystem services in developed regions of British Columbia. following a review of the challenges and opportunities facing local governments, a three-part classification is employed to organize policy evaluations: (1) public ownership, (2) regulation, and (3) market-based instruments. three policy options emerge from this. they strive to address the drivers of loss to ecosystems, the unique circumstances facing threatened municipalities, and incorporate the most promising policy tools.
• NAtuRAl CAPitAl ACCouNts: Regional governments take the lead in developing natural capital indicators and targets to track the health of ecosystem services, as well as the effectiveness of related policies.
• CoNNeCtiNG ouR PRoteCted AReAs: Regional and municipal governments collaborate to develop a comprehensive protected areas strategy to strengthen the Agricultural land Reserve regionally and connect it to protected areas at the municipal level.
• MAiNstReAMiNG eCosysteM seRviCes: Municipal governments build ecosystem service considera-tions into economic and development planning to minimize ecosystem degradation and manage for ecological health.
to avoid irreversible damage to ecosystems and their associated services, we must radically change the way we use and think about them. fortunately, we have the knowledge, technology, and tools to make such changes. we have an opportunity to develop the groundwork for policies and programs that strive
to manage our ecosystems in a manner that fosters their resilience in the face of increasing pressures.
research by the David
suzuki foundation and
others has shown that
natural capital – the
fields, farms, forests,
wetlands, and rivers
within and surrounding
our communities – and
the benefits it provides,
are extremely valuable
in monetary terms,
and in reality they
are truly priceless.
executive summary
Page 6 n at u r a L C a Pita L P OLi C y r e v ie W
aBBreviatiOns
Agricultural land Commission AlC
Agricultural land Reserve AlR
Alternative land use services Alus
British Columbia B.C.
Canadian Mortgage and housing Corporation CMhC
Capital Region district CRd
Cowichan valley Regional district CvRd
development cost charge dCC
ecologically sensitive area esA
environmental development permit area edPA
environmental impact assessment eiA
environmental pricing reform ePR
environmental Remediation and site enhancement eRAse
Government finance officers Association GfoA
Gigajoule GJ
harmonized sales tax hst
intergovernmental Panel on Climate Change iPCC
leadership in energy and environmental design leed
Millennium ecosystem Assessment MA
Ministry of Agriculture and lands MAl
Member of the legislative Assembly MlA
National Round table on the environment and the economy NRtee
Nitrogen dioxide No2
official Community Plan oCP
Regional Context statement RCs
Regional Growth strategy RGs
species at-risk sAR
the economics of ecosystems and Biodiversity teeB
union of British Columbia Municipalities uBCM
urban containment boundary uCB

Dav iD s uzu ki fOu n DatiOn Page 7
gLOssary
Abiotic Relating to, caused by, or produced by living organisms.
Biodiversity the variety of life forms, as well as the habitat and natural processes
that support them, within a particular ecosystem.
Biotic of or having to do with life or living organisms.
ecosystem encompasses the living (plants, animals, micro-organisms] and
non-living (water, air) elements that interact in a given area.
ecosystem services the collective benefits provided by the resources and processes
supplied by natural capital.
Natural capital the planet’s stock of renewable and nonrenewable natural resources
(forests, minerals, oil, plant and animal species), environmental
resources (atmosphere, water) and land.
Public goods Public goods are nonrival and non-excludable. that is, the consumption
of a good by an individual does not reduce the availability of the good
for consumption by another (nonrival), and no one can be effectively
excluded from using the good (non-excludable).
Rebound effect the rebound effect refers to increased consumption that results from
actions that increase efficiency and reduce consumer costs.
sustainable development development that meets the needs of the present without compromis-
ing the ability of future generations to meet their own needs.
water harvesting Rainwater harvesting is the gathering, or accumulating and storing,
of rainwater.

Page 8 n at u r a L C a Pita L P OLi C y r e v ie W
British COLuMBia (B.C.) is CanaDa’s most ecologically and biologically diverse province. influ-
enced by its proximity to the Pacific and Arctic oceans, and shaped by its mountainous terrain, B.C.’s
ecosystems are home to more than half of Canada’s wildlife and fish species (Meidinger and Pojar
1991; Cannings and Cannings 1996). in addition to being valuable in their own right, ecosystems
provide critical services to society. we depend upon healthy functioning ecosystems for everything
from purifying our air and providing clean drinking water, to regulating our climate, providing our
food, and supplying recreational opportunities.
today, many of these ecosystems are under stress. Rapid population growth and widespread
development in B.C.’s temperate southern region have contributed to the loss of more than half of
the original wetlands in the lower Mainland region. this includes over 70 per cent of the antelope
brush and needle and thread grasslands of the okanagan; and approximately 90 per cent of Garry
oak meadows on southeastern vancouver island (fraser Basin Council 2011, Biodiversity B.C.,
2007). the limited supply of low elevation areas and grassland habitats has simultaneously drawn
a high level of biodiversity and human settlement to these regions. Protecting ecosystems and
their associated services need not come at the expense of human activities, but does require
consideration of their interconnections and the inherent limits of nature. this task often falls on
the shoulders of local governments. As the government level that is closest to the ground, regional
and local governments have an intimate knowledge of their landscape and its threats, as well as
the people living within them.
the purpose of this report is to evaluate the efficacy of existing policy options and provide
recommendations for new solutions that should be adopted in order to protect and restore natural
capital and associated ecosystem services in developed regions of B.C. it should be noted that this
report has a limited focus on regions and municipalities located within the most threatened regions
of B.C. (i.e. southeastern vancouver island, lower Mainland, and Central and southern okanagan). in
addition, this report does not address first Nations communities throughout the identified regions.
Resources did not allow for this, but the need for a similar evaluation is strongly recommended.
s eCtiOn 1
setting the stagethe purpose of this
report is to evaluate the
efficacy of existing policy
options and provide
recommendations for
new solutions that should
be adopted in order to
protect and restore natural
capital and associated
ecosystem services in
developed regions of B.C.

Dav iD s uzu ki fOu n DatiOn Page 9
MethODOLOgy
this report was prepared over the period of March 2010 – April 2011. data was gathered from three
sources. the first source included a literature review that included an examination of regional
growth strategies (RGs), official community plans (oCPs), and environmental bylaws through
government websites, as well as policy evaluations obtained from academic journals, grey litera-
ture, and conservation-based websites. this information was then grounded through a set of ten
personal interviews conducted in the fall of 2010 with key environmental planners, coordinators,
and managers at the municipal and regional levels of government. interviewees were asked to
comment on threatened ecosystems within their region and the perceived drivers of loss, challenges
and opportunities associated with protecting these ecosystems, and the effectiveness of current
policies. lastly, a workshop was held in the spring of 2011 with a similar group of participants to
examine the viability of four proposed policy options. the workshop attendees represented a wide
range of government interests (e.g. finance directors and mayors) to obtain a balanced perspective.
OutLine
this report is divided into three sections:
• section 1 explains the concepts of natural capital and ecosystem services, and identifies
the drivers of their decline. it addresses the role of government in stemming the decline
of natural capital and opportunities and challenges of implementing protection policies at
a local scale.
• section 2 reviews and assesses policies available to local governments to protect, enhance,
and restore natural capital. Policies are broken into three groups: public ownership,
regulatory instruments, and market-based tools. Case studies of promising, innovative,
or successful policies are provided throughout.
• section 3 provides an analysis of three policy options, which are crafted to address gaps in
policy and are weighed against a set of five criteria. the section concludes with the report’s
findings and recommendations.
Page 10 n at u r a L C a Pita L P OLi C y r e v ie W
1.1 what is Natural Capital and why does it Matter?
Whether We are aWare Of it Or nOt, humans depend on nature for their health and well-being.
By feeding us, protecting us, and inspiring and educating us, nature has supported the extraordinary
growth of humanity. Although nature and its associated services are arguably more essential to
human survival and welfare than other forms of capital, nature remains inadequately valued. in fact,
our economies seem to function as if the supply of nature is inconsequential, or endless.
the term ‘natural capital’ is used extensively in this report. it implies an extension of the economic
notion of capital (a factor of production) to include goods and services related to nature. Natural
capital has been defined as “the planet’s stock of renewable and nonrenewable natural resources
(forests, minerals, oil, plant and animal species), environmental resources (atmosphere, water) and
land” (olewiler 2007). Just as all forms of capital are capable of providing a flow of goods and services,
components of natural capital interact to provide mankind with services that are wide-ranging and
diverse. the collective benefits provided by the resources and processes supplied by natural capital
are known as ecosystem goods and services, or simply ecosystem services.
while there is no single classification of ecosystem services that can capture the countless ways
in which ecosystems contribute to human wealth and well-being, the latest classification builds
upon the Millennium ecosystem Assessment, which at the time of its publication was the most
thorough study on the linkages between ecosystem changes and human well-being. the economics
of ecosystems and Biodiversity (teeB), a recent international initiative led by the united Nations, the
european Commission, and the German and uK governments, has studied the economic importance
of biodiversity and ecosystems, and recognizes four categories of services; provisioning, regulating,
habitat, and cultural and amenity services (teeB foundation 1, 2010).
• PRovisioNiNG seRviCes include all the tangible products people obtain from ecosystems,
such as food, fuel, and fibre. these services are often well represented in the marketplace,
with clear indicators of their monetary value. this class of services has often been artificially
replicated, or manufactured, but usually with limited knowledge of its effects. in many
cases, an attempt to artificially bolster one service has negative repercussions on others.
• ReGulAtiNG seRviCes are the benefits people obtain from the regulation of ecosystem
processes, such as water purification and climate regulation. these services are not well
represented in the marketplace and attempts to duplicate them with technology have been
mixed. such services occur over vast areas and are connected to a range of other services,
making them virtually impossible to isolate for artificial duplication. for similar reasons,
their monetary worth is not well documented.
• hABitAt seRviCes represent the critical role habitat plays in species interactions and
the regulation of population dynamics. these services are not well represented in the
marketplace and attempts to duplicate them have generally met with failure. their monetary
worth is not well documented.
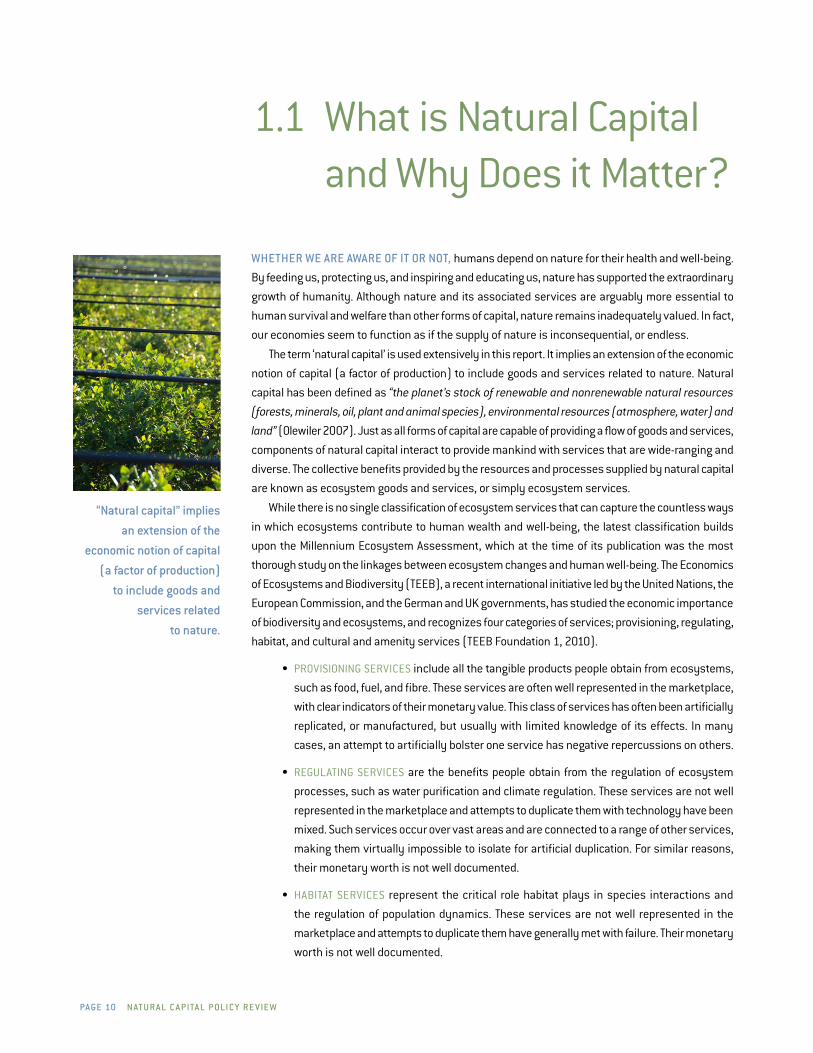
“natural capital” implies
an extension of the
economic notion of capital
(a factor of production)
to include goods and
services related
to nature.
Dav iD s uzu ki fOu n DatiOn Page 11
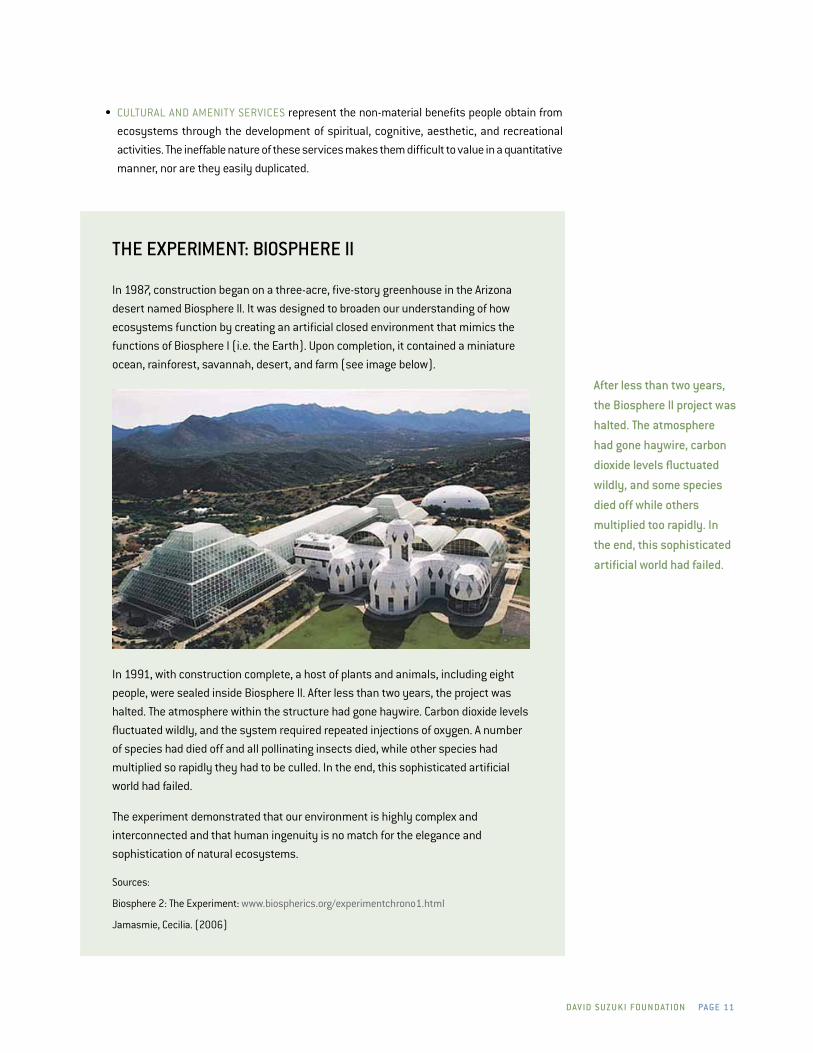
the exPeriMent: BiOsPhere ii
in 1987, construction began on a three-acre, five-story greenhouse in the Arizona
desert named Biosphere ii. it was designed to broaden our understanding of how
ecosystems function by creating an artificial closed environment that mimics the
functions of Biosphere i (i.e. the earth). upon completion, it contained a miniature
ocean, rainforest, savannah, desert, and farm (see image below).
in 1991, with construction complete, a host of plants and animals, including eight
people, were sealed inside Biosphere ii. After less than two years, the project was
halted. the atmosphere within the structure had gone haywire. Carbon dioxide levels
fluctuated wildly, and the system required repeated injections of oxygen. A number
of species had died off and all pollinating insects died, while other species had
multiplied so rapidly they had to be culled. in the end, this sophisticated artificial
world had failed.
the experiment demonstrated that our environment is highly complex and
interconnected and that human ingenuity is no match for the elegance and
sophistication of natural ecosystems.
sources:
Biosphere 2: the experiment: www.biospherics.org/experimentchrono1.html
Jamasmie, Cecilia. (2006)
• CultuRAl ANd AMeNity seRviCes represent the non-material benefits people obtain from
ecosystems through the development of spiritual, cognitive, aesthetic, and recreational
activities. the ineffable nature of these services makes them difficult to value in a quantitative
manner, nor are they easily duplicated.
after less than two years,
the Biosphere ii project was
halted. the atmosphere
had gone haywire, carbon
dioxide levels fluctuated
wildly, and some species
died off while others
multiplied too rapidly. in
the end, this sophisticated
artificial world had failed.

Page 12 n at u r a L C a Pita L P OLi C y r e v ie W
figure 1 gives a schematic representation of the pathway from ecosystems and biodiversity
to human well-being. As the figure shows, there are a number of steps and linkages between
natural capital and ecosystem services. decision-makers need to understand this process in order
to maintain an acceptable level of ecosystem services for their constituents. As such, it is important
to understand that ‘functions’ signify the potential that ecosystems have to provide a service, which
in turn rests upon the health of biological structures, or ‘processes’ (teeB, 2009). for example,
flood protection (the ‘service’) is dependent upon slow water passage (the ‘function’), which is
dependent upon net primary productivity (the ‘process’), which is dependent upon intact wetlands
(the ‘natural capital’). furthermore, it is important to understand that the spatial distribution of
processes, functions, and services varies considerably depending upon the benefit being considered.
lastly, it is critical for decision-makers to recognize what we don’t know. there is scant knowledge
on how ecosystem services are produced and maintained; how they are impacted by biotic and
abiotic changes; how they relate to biodiversity; and how processes and functions interact with
one another (Molnar et al, 2009).
e.g. net primary productivity
e.g. wetland
Natural capital
Process (biophysical structure)
figure 1: the fLOW Of naturaL CaPitaL tO eCOsysteM serviCes
e.g. slow water passage
function
e.g. flood protection
service
Decision-makers
need to understand
steps and linkages
between natural capital
and ecosystem services
in order to maintain
an acceptable level of
ecosystem services for
their constituents.
Dav iD s uzu ki fOu n DatiOn Page 13
“While living standards have generally improved over the past two centuries, human activity is putting such strain on nature that we are undermining the Earth’s capacity to support current and future generations. We are living beyond our means: recent gains in quality of life have come at considerable cost to the natural systems on which we all depend. If we act now, we can avoid irreversible damage to ecosystems and human well-being. But this will require a sea-change in the way we think about and use natural resources.”
— Millennium ecosystem Assessment toolkit, 2007
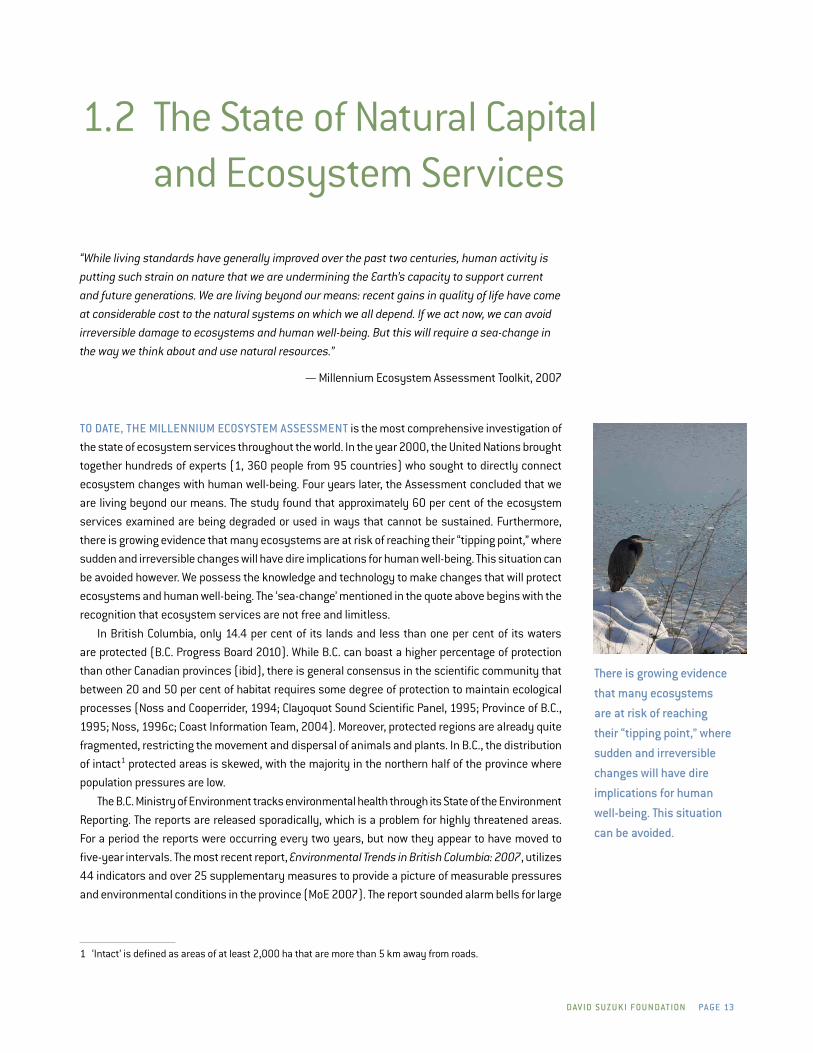
tO Date, the MiLLenniuM eCOsysteM assessMent is the most comprehensive investigation of
the state of ecosystem services throughout the world. in the year 2000, the united Nations brought
together hundreds of experts (1, 360 people from 95 countries) who sought to directly connect
ecosystem changes with human well-being. four years later, the Assessment concluded that we
are living beyond our means. the study found that approximately 60 per cent of the ecosystem
services examined are being degraded or used in ways that cannot be sustained. furthermore,
there is growing evidence that many ecosystems are at risk of reaching their “tipping point,” where
sudden and irreversible changes will have dire implications for human well-being. this situation can
be avoided however. we possess the knowledge and technology to make changes that will protect
ecosystems and human well-being. the ‘sea-change’ mentioned in the quote above begins with the
recognition that ecosystem services are not free and limitless.
in British Columbia, only 14.4 per cent of its lands and less than one per cent of its waters
are protected (B.C. Progress Board 2010). while B.C. can boast a higher percentage of protection
than other Canadian provinces (ibid), there is general consensus in the scientific community that
between 20 and 50 per cent of habitat requires some degree of protection to maintain ecological
processes (Noss and Cooperrider, 1994; Clayoquot sound scientific Panel, 1995; Province of B.C.,
1995; Noss, 1996c; Coast information team, 2004). Moreover, protected regions are already quite
fragmented, restricting the movement and dispersal of animals and plants. in B.C., the distribution
of intact1 protected areas is skewed, with the majority in the northern half of the province where
population pressures are low.
the B.C. Ministry of environment tracks environmental health through its state of the environment
Reporting. the reports are released sporadically, which is a problem for highly threatened areas.
for a period the reports were occurring every two years, but now they appear to have moved to
five-year intervals. the most recent report, Environmental Trends in British Columbia: 2007, utilizes
44 indicators and over 25 supplementary measures to provide a picture of measurable pressures
and environmental conditions in the province (Moe 2007). the report sounded alarm bells for large
1 ‘intact’ is defined as areas of at least 2,000 ha that are more than 5 km away from roads.
1.2 the state of Natural Capital and ecosystem services
there is growing evidence
that many ecosystems
are at risk of reaching
their “tipping point,” where
sudden and irreversible
changes will have dire
implications for human
well-being. this situation
can be avoided.

Page 14 n at u r a L C a Pita L P OLi C y r e v ie W
urban areas in the southern portion of the province, particularly Metro vancouver, southeastern
vancouver island, and the south and Central okanagan regional districts, where findings revealed:
• Rapid population growth, particularly in Metro vancouver where population density doubled
between 1976 and 2006;
• heavily developed aquifers;
• More estuaries with economic tenures than conservation tenures (38 per cent versus 28
per cent);
• A significant increase in the length of roads (82 per cent from the period 1988 to 2005),
especially within the Georgia depression ecoprovince (which includes vancouver) that has
the most roads per square kilometre; and
• An increasing number of mammalian, freshwater fish, and plant species with “deteriorating”
conservation status.
the university of British Columbia has also undertaken research on the province’s “hot spots” (i.e.
regions of B.C. that combine particularly high species richness, endemism, and threat). the results
largely mirror the regions identified by the Ministry of environment. Metro vancouver, southeastern
vancouver island (including the Gulf islands), and the southern okanagan were identified as regions
figure 2: intaCt eCOsysteMs anD PrOteCteD areas in British COLuMBia
source: Ministry of environment (2007)
the strategy
of fragmented
protection offers
limited protection
of natural capital
(and ecosystem
services) due to the
lack of connectivity
for species.
Dav iD s uzu ki fOu n DatiOn Page 15
of high concern. the studies went on to examine the lack of correspondence between these hot spots
and protected areas (scudder 2003; scudder 2004). while the authors conceded that park selection
in the 1930s and 1940s was driven by tourism appeal, they anticipated a shift in park locations
beginning in the 1980s when environmental considerations were added to selection criteria. this
shift failed to materialize when biodiversity came to represent one value in a series of values to be
considered in park selection. feeling that there are few opportunities for adding additional protected
areas in the hot spot regions, recommendations focused on “vest-pocket reserves,” which are small
reserves that are well suited to plant and invertebrates, and integrated conservation planning at
the ecosystem level (scudder 2003; scudder 2004). unfortunately this strategy of fragmented
protection offers limited protection of natural capital (and ecosystem services) due to the lack of
connectivity for species.
eCOsysteM serviCes Of urBan areas
it’s common for people to think that nature has no role or only a very minor role in cities. we think
of nature as something out there; that its utility in the city is generally confined to recreational
pursuits. But there is much more to it than that. Below six local ecosystem services of relevance to
cities and two ecosystem services of relevance to regional districts are discussed.
air PurifiCatiOn
Air pollution caused by transportation and the heating of buildings, among other things, is a major
environmental and health problem in cities. it is well documented that vegetation reduces air pollution
by absorbing dissolved pollutants, filtering particulate matter, and releasing oxygen, but to what
level generally depends on the local situation.
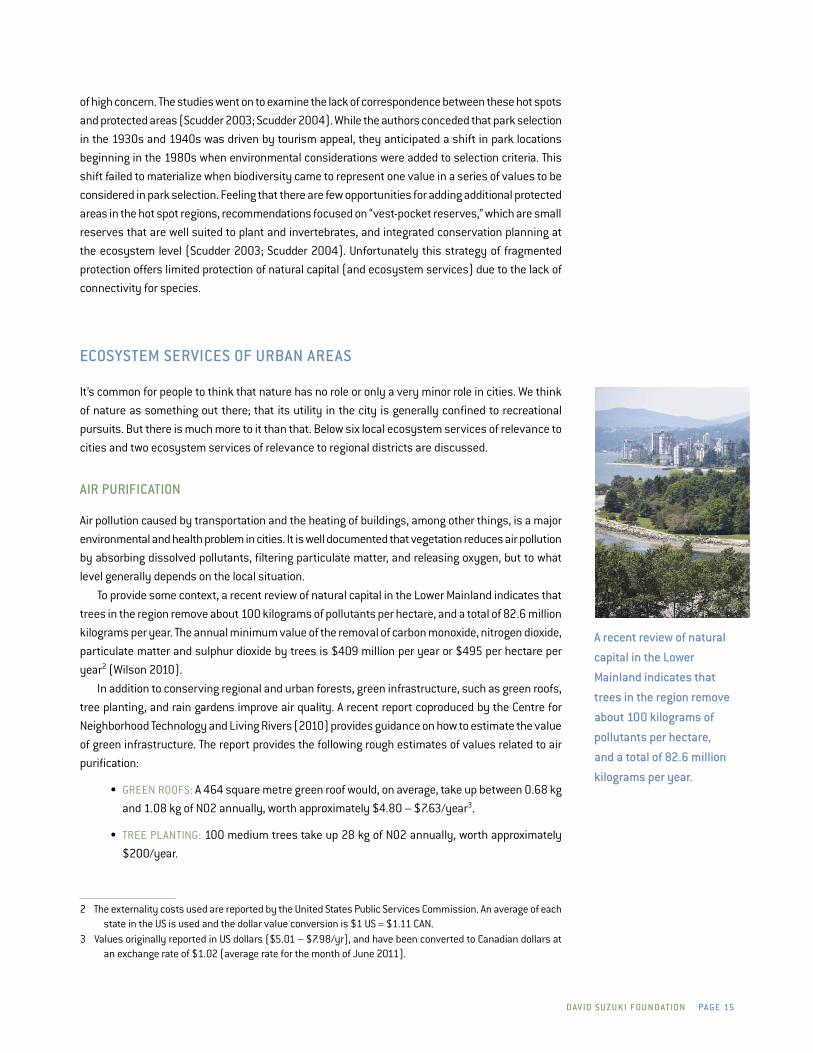
to provide some context, a recent review of natural capital in the lower Mainland indicates that
trees in the region remove about 100 kilograms of pollutants per hectare, and a total of 82.6 million
kilograms per year. the annual minimum value of the removal of carbon monoxide, nitrogen dioxide,
particulate matter and sulphur dioxide by trees is $409 million per year or $495 per hectare per
year2 (wilson 2010).
in addition to conserving regional and urban forests, green infrastructure, such as green roofs,
tree planting, and rain gardens improve air quality. A recent report coproduced by the Centre for
Neighborhood technology and living Rivers (2010) provides guidance on how to estimate the value
of green infrastructure. the report provides the following rough estimates of values related to air
purification:
• GReeN Roofs: A 464 square metre green roof would, on average, take up between 0.68 kg
and 1.08 kg of No2 annually, worth approximately $4.80 – $7.63/year3.
• tRee PlANtiNG: 100 medium trees take up 28 kg of No2 annually, worth approximately
$200/year.
2 the externality costs used are reported by the united states Public services Commission. An average of each state in the us is used and the dollar value conversion is $1 us = $1.11 CAN.
3 values originally reported in us dollars ($5.01 – $7.98/yr), and have been converted to Canadian dollars at an exchange rate of $1.02 (average rate for the month of June 2011).
a recent review of natural
capital in the Lower
Mainland indicates that
trees in the region remove
about 100 kilograms of
pollutants per hectare,
and a total of 82.6 million
kilograms per year.
Page 16 n at u r a L C a Pita L P OLi C y r e v ie W
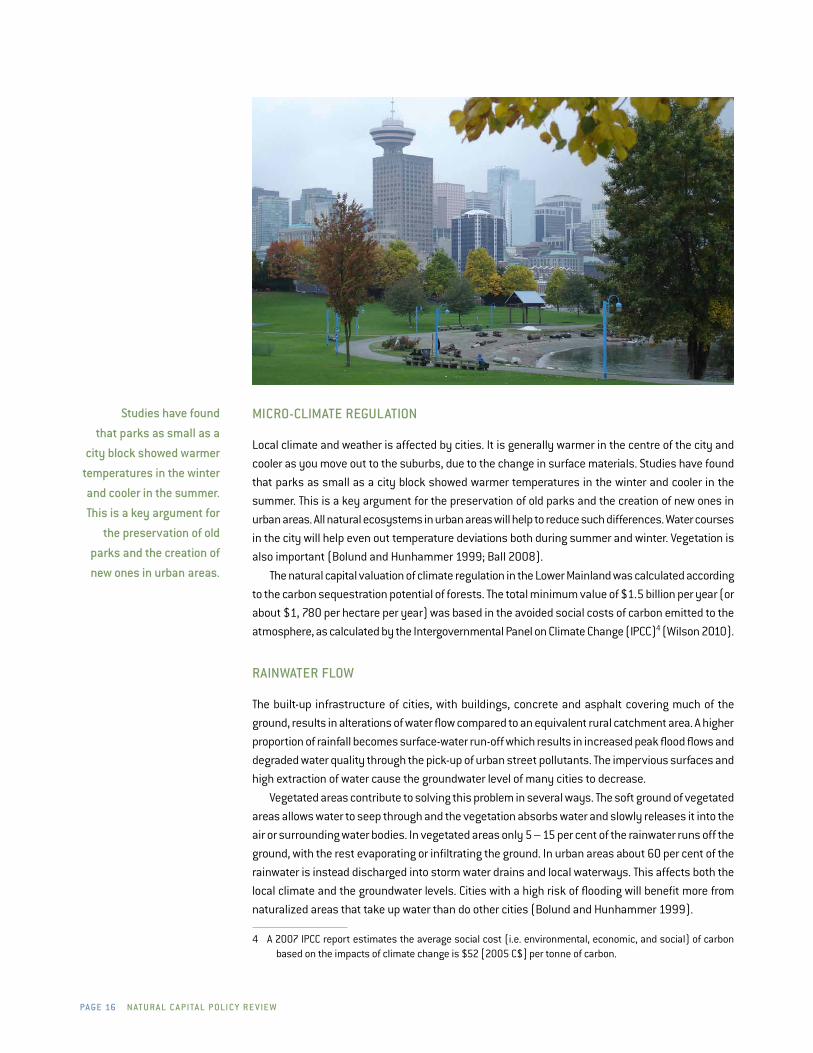
MiCrO-CLiMate reguLatiOn
local climate and weather is affected by cities. it is generally warmer in the centre of the city and
cooler as you move out to the suburbs, due to the change in surface materials. studies have found
that parks as small as a city block showed warmer temperatures in the winter and cooler in the
summer. this is a key argument for the preservation of old parks and the creation of new ones in
urban areas. All natural ecosystems in urban areas will help to reduce such differences. water courses
in the city will help even out temperature deviations both during summer and winter. vegetation is
also important (Bolund and hunhammer 1999; Ball 2008).
the natural capital valuation of climate regulation in the lower Mainland was calculated according
to the carbon sequestration potential of forests. the total minimum value of $1.5 billion per year (or
about $1, 780 per hectare per year) was based in the avoided social costs of carbon emitted to the
atmosphere, as calculated by the intergovernmental Panel on Climate Change (iPCC)4 (wilson 2010).
rainWater fLOW
the built-up infrastructure of cities, with buildings, concrete and asphalt covering much of the
ground, results in alterations of water flow compared to an equivalent rural catchment area. A higher
proportion of rainfall becomes surface-water run-off which results in increased peak flood flows and
degraded water quality through the pick-up of urban street pollutants. the impervious surfaces and
high extraction of water cause the groundwater level of many cities to decrease.
vegetated areas contribute to solving this problem in several ways. the soft ground of vegetated
areas allows water to seep through and the vegetation absorbs water and slowly releases it into the
air or surrounding water bodies. in vegetated areas only 5 – 15 per cent of the rainwater runs off the
ground, with the rest evaporating or infiltrating the ground. in urban areas about 60 per cent of the
rainwater is instead discharged into storm water drains and local waterways. this affects both the
local climate and the groundwater levels. Cities with a high risk of flooding will benefit more from
naturalized areas that take up water than do other cities (Bolund and hunhammer 1999).
4 A 2007 iPCC report estimates the average social cost (i.e. environmental, economic, and social) of carbon based on the impacts of climate change is $52 [2005 C$] per tonne of carbon.
studies have found
that parks as small as a
city block showed warmer
temperatures in the winter
and cooler in the summer.
this is a key argument for
the preservation of old
parks and the creation of
new ones in urban areas.
Dav iD s uzu ki fOu n DatiOn Page 17
Green infrastructure, such as green roofs, tree planting, bioretention& infiltration, permeable
pavement, and water harvesting also assist with rainwater management. the aforementioned
report coproduced by the Centre for Neighborhood technology and living Rivers (2010) provides
the following estimates of the value of green infrastructure to reduce the impact and costs of
stormwater runoff:
• GReeN Roofs: A 464 square meter green roof, using a 60 per cent retention rate will absorb
a volume of 269, 143 litres annually, worth $6.24 in avoided treatment costs annually.
• tRee PlANtiNG: 100 medium red oaks will absorb a volume of 427, 373 litres annually,
worth $9.93 in avoided treatment costs annually.
• BioReteNtioN ANd iNfiltRAtioN: A site with an infiltration area of 185 square metres and
a drainage area of 371 square metres, reduces the volume of runoff by 430, 628 liters
annually. this is worth $9.99 in avoided treatment costs annually.
• PeRMeABle PAveMeNt: An area of 464 square metres of permeable pavement, using an
80 per cent retention rate, will reduce a volume of 358, 857 liters annually. this equates
to $8.33 in avoided treatment costs annually.
• wAteR hARvestiNG: A water harvesting practice, using the rainfall data for Chicago will
reduce a volume of 76,257 litres annually, worth $1.77 in avoided treatment costs annually.
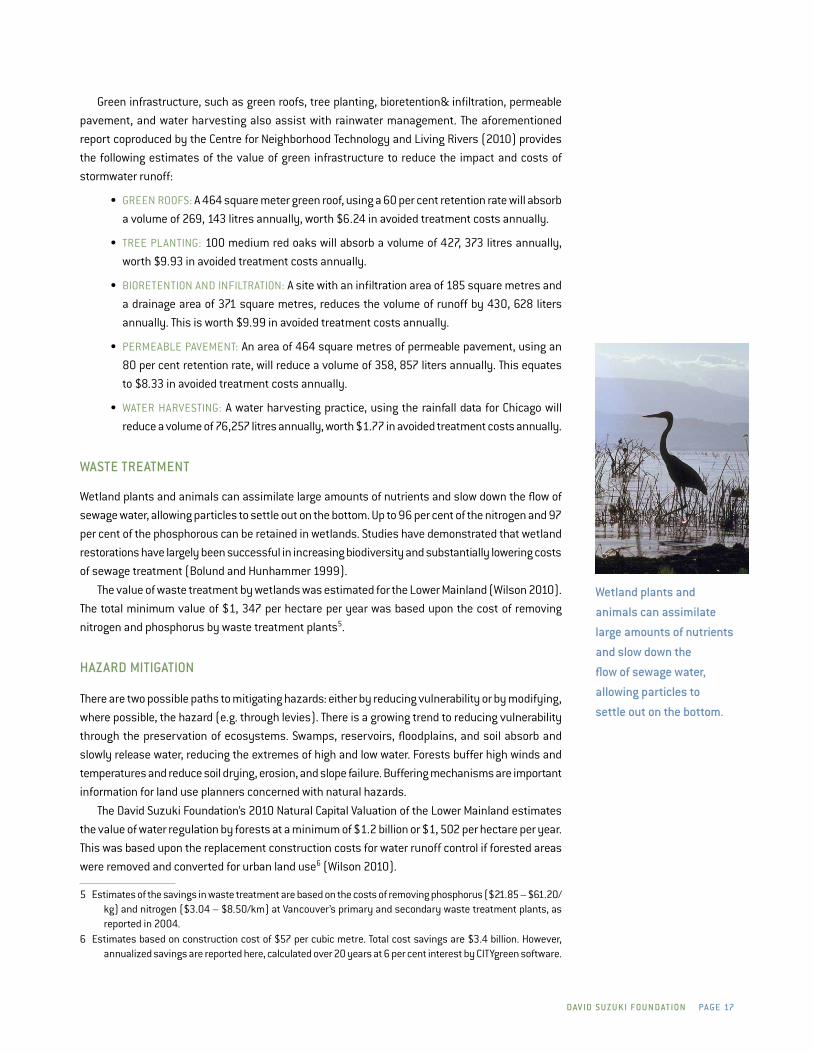
Waste treatMent
wetland plants and animals can assimilate large amounts of nutrients and slow down the flow of
sewage water, allowing particles to settle out on the bottom. up to 96 per cent of the nitrogen and 97
per cent of the phosphorous can be retained in wetlands. studies have demonstrated that wetland
restorations have largely been successful in increasing biodiversity and substantially lowering costs
of sewage treatment (Bolund and hunhammer 1999).
the value of waste treatment by wetlands was estimated for the lower Mainland (wilson 2010).
the total minimum value of $1, 347 per hectare per year was based upon the cost of removing
nitrogen and phosphorus by waste treatment plants5.
hazarD MitigatiOn
there are two possible paths to mitigating hazards: either by reducing vulnerability or by modifying,
where possible, the hazard (e.g. through levies). there is a growing trend to reducing vulnerability
through the preservation of ecosystems. swamps, reservoirs, floodplains, and soil absorb and
slowly release water, reducing the extremes of high and low water. forests buffer high winds and
temperatures and reduce soil drying, erosion, and slope failure. Buffering mechanisms are important
information for land use planners concerned with natural hazards.
the david suzuki foundation’s 2010 Natural Capital valuation of the lower Mainland estimates
the value of water regulation by forests at a minimum of $1.2 billion or $1, 502 per hectare per year.
this was based upon the replacement construction costs for water runoff control if forested areas
were removed and converted for urban land use6 (wilson 2010).
5 estimates of the savings in waste treatment are based on the costs of removing phosphorus ($21.85 – $61.20/kg) and nitrogen ($3.04 – $8.50/km) at vancouver’s primary and secondary waste treatment plants, as reported in 2004.
6 estimates based on construction cost of $57 per cubic metre. total cost savings are $3.4 billion. however, annualized savings are reported here, calculated over 20 years at 6 per cent interest by Citygreen software.
Wetland plants and
animals can assimilate
large amounts of nutrients
and slow down the
flow of sewage water,
allowing particles to
settle out on the bottom.

Page 18 n at u r a L C a Pita L P OLi C y r e v ie W
CuLturaL anD reCreatiOnaL
A city can be a stressful environment for residents. the overall speed and number of daily distrac-
tions result in hectic lifestyles with little room for rest and contemplation. the recreational aspects
of all urban ecosystems, with possibilities to explore, play and rest, are perhaps the highest valued
ecosystem service in cities. these natural urban also provide multiple health and psychological
benefits for individuals, and at a community or regional scale help to attract and sustain a highly
qualified workforce (Bolund and hunhammer 1999).
the non-market benefits of recreation have been valued at a minimum of $298 per hectare per
year (wilson 2010). this value is an aggregate of:
• the value of nature-based recreation ($127 per hectare/year) based upon the economic
value of nature for B.C.’s residents according to a 1996 national survey conducted by
environment Canada; and
• the value of farm-based recreation ($171 per hectare/year) based upon travel costs incurred
for farm visits.
in addition to these services, there are also some key services at the regional level. food provisioning
and biodiversity are addressed below.
fOOD
the importance of food and the associated land and soil quality requires little explanation. of obvious
importance to human survival, the maintenance of productive farmland should be a common concern
to all. with less than five per cent of the land in B.C. classified as suitable for farming, it should be of
paramount concern in this province. the Agricultural land Reserve (AlR) is one of B.C.’s solutions
to its protection. its merits are discussed further under section 2.2.2.
the non-market benefits of ecosystem services in food production were valued at a minimum of
$382 per hectare per year in the lower Mainland (wilson 2010). this was based upon the estimated
travel cost to farms, as well as the reported willingness to pay for locally grown food.
BiODiversity
Biodiversity, or the variety of species and the habitat and natural processes that support them, act
as a foundation for all of the goods and services provided by nature. Biodiversity provides numerous
ecosystem services that are crucial to human well-being. By affecting the magnitude, pace, and
temporal continuity by which energy and materials are circulated through ecosystems, biodiversity
influences the provision of regulating services, such as pollination and seed dispersal, regulation of
climate, the control of pests, invasive species and disease, and the regulation of human health. Also,
biodiversity indirectly supports the production of food, fiber, potable water, shelter and medicines
by affecting nutrient and water cycling, soil formation and fertility.
the recreational aspects
of all urban ecosystems,
with possibilities to
explore, play and rest, are
perhaps the highest valued
ecosystem service in cities.

Dav iD s uzu ki fOu n DatiOn Page 19
1.3 drivers of loss
Drivers are the “naturaL Or huMan-inDuCeD faCtOrs that directly or indirectly cause a change
in ecosystems” (Rahl et al. 2007). there are two basic indirect drivers that affect ecosystem services
(heal et. al 2001). the first is that the scale of human enterprise is now so vast that humanity is
radically changing natural ecosystems and their functioning. for millions of years, humanity had
little impact on the character of ecosystems. But exponential growth in the world’s population – from
one billion people in 1800 to over six billion in 2008 (united Nations 2004) – and rapid advances in
technology are now leaving an indelible imprint. today, the impacts of humanity can be discerned
in the most remote corners of the biosphere, outstripping natural biogeochemical and evolutionary
processes. Moreover, many of these changes are irreversible, at least in the short term.
the second driver is our current economic models, which cause natural capital to be largely
unrecognized in our market economy. even in those instances where it is recognized, it tends
to be neglected in policy because it is deemed virtually“free.” while certain goods are explicitly
accounted for in the market – goods that are perceived as important and in limited supply – the
services underpinning the production of such goods are usually absent in the market. for example,
food, fibre, and fuel have been valued in markets for centuries, whereas climate regulation, carbon
sequestration, and oxygen production have failed to garner market signals that would alert society
to changes in their supply or deterioration of the underlying ecosystems that support them. All too
often, their value is only appreciated upon their degradation or scarcity.
in addition to these indirect drivers there are four direct drivers of ecosystem change, which
can be identified based on broad ecosystem types (Rahl et al 2007). terrestrial ecosystems have
been altered by land cover change and overexploitation. Marine ecosystems have been altered by
overfishing. freshwater ecosystems have been altered by the modification of water regimes, invasive
species, and pollution. And all ecosystems have been altered by climate change.
turning our attention to B.C.’s hot spots, olewiler (2004) identifies four major threats to natural
capital(and by extension ecosystem services) in the lower fraser valley. they include the construc-
tion of low-density suburban housing that consume large amounts of land; loss of forests, wetlands,
and riparian habitat due to urbanization pressures, diking, and industrial agriculture; runoff from
urban centres; and air and water pollution from urbanization and industrial agriculture. it is clear
that the two overriding threats to natural capital are human activities and the invisibility of nature
in the market.
today, the impacts of
humanity can be discerned
in the most remote corners
of the biosphere, outstripping
natural biogeochemical and
evolutionary processes.
Moreover, many of these
changes are irreversible,
at least in the short term.

Page 20 n at u r a L C a Pita L P OLi C y r e v ie W
1.4 Role of Government
WhiLe aLL segMents Of sOCiety have a responsibility to protect natural capital, government must
take the lead. there are two related reasons for this statement. first, the vast majority of landmass
in Canada is publicly owned. secondly, many ecosystem goods and services are classified as ‘public
goods’, or goods that cannot be individually owned or used7 (e.g. clean air). As such, we generally
expect governments to manage public goods for the benefit of all.
in Canada, legislative responsibility for nature conservation is shared under the Constitution.
the federal government is responsible for oceans and freshwater ecosystems, the continental shelf,
migratory birds and the management of federal lands. they also carry fiduciary responsibility for first
Nations lands south of the 60th parallel whose land claims are unsettled. Authority for the coastal zone
is shared between the federal and provincial governments, and the territories. Provincial governments
have responsibility for the majority of public lands; essentially all land classes and ecosystems not
mentioned above. while the role of municipal governments is not explicitly acknowledged in the
Constitution, it is this level of government that has arguably the greatest influence on the health
of natural capital. As the level of government closest to its constituents and natural resources,
local governments can promote the conservation of natural capital through planning decisions,
infrastructure development, and local economic development (NRtee 2003).
ChaLLenges anD OPPOrtunities fOr LOCaL gOvernMents
local governments have a critical role to play in the preservation of natural capital and ecosystem
services. the reasons for this are twofold: the distribution of population growth and the downloading
of provincial responsibilities onto local agencies.
worldwide, population growth is sharply focused towards cities. Although occupying only two
per cent of the world’s land resources, cities are responsible for 75 per cent of our world’s natural
resources consumed and waste produced(wackernagel et al. 2006). this trend is reflected in B.C.,
where 55 per cent of the provinces’ population is located in the lower Mainland. Currently this
region holds over 2.5 million people and it is estimated to grow to over three million by year 2020,
thus potentially placing enormous stress on the region’s natural capital and ecosystem services.
the provincial downloading of responsibilities has left local governments with the burden of
managing much of our threatened natural capital, often with scarce resources and little guidance
on how to implement or enforce provincial mandates and policies. Moreover, citizens often look to
their local governments before provincial governments for guidance on local resources. Citizens
also don’t generally have as much access or sway with provincial officials as they do with local
mayors and councilors.
in order to provide policy recommendations of practical value to regional districts and munici-
palities, interview participants were asked to comment on what they perceive to be their greatest
challenges and opportunities in preserving natural capital.
7 Public goods are nonrival and non-excludable. that is, the consumption of a good by an individual does not reduce the availability of the good for consumption by another (nonrival), and no one can be effectively excluded from using the good (non-excludable).
While the role of
municipal governments is
not explicitly acknowledged
in the Constitution, it is
this level of government
that has arguably the
greatest influence on the
health of natural capital.

Dav iD s uzu ki fOu n DatiOn Page 21
ChaLLenges
the challenges of protecting and restoring natural capital at a local government level can be grouped
into three broad categories: jurisdictional, economic, and ecological. Jurisdictional challenges relate
to the ambiguous mandates of provincial, regional, and local governments. economic challenges
relate to limited government resources, as well as market forces at the local level. ecological chal-
lenges relate to the level of knowledge surrounding ecosystems and their protection.
Jurisdictional challenges relate to conflicting, unclear or competing mandates between
different levels of government, as well as the lack of effective enforcement mechanisms. when
responsibilities are partitioned into silos, are unclear or overlapped across agencies, ministries
or governments, efforts to manage natural capital are generally inconsistent and inefficiently or
ineffectively implemented.
the lack of clear legislative direction from the provincial government was also a top concern
of participants, particularly with respect to endangered species legislation. the need to develop
provincial species At-Risk legislation with a clear role for local governments was noted by each
interviewee. with little to no provincial monitoring or enforcement, and no mandate for local govern-
ments to engage in environmental monitoring, there is a strong need for enabling mechanisms to
protect habitat. one notable exception is the provincial approach to the protection of riparian areas.
it should be modeled for other habitats as this regulatory structure motivated many municipalities
to develop their own policies and processes on the protection of streamside areas.
Senior governments need to be proactive and assist local governments rather than
being reactive (i.e. reviewing applications for approvals under provincial and federal
legislation). — expert interviewee
economic concerns were the second category of challenges facing local governments. increasing
responsibilities with no matching increase in revenue base and development pressures topped the
list of concerns. local governments have limited capacity to protect natural capital. while participants
generally agreed on the effectiveness of incentives, they lacked the resources to independently
implement them. of equal concern is pressure from the business community to develop land that
has more traditional economic worth as a subdivision than a park or natural area. Additionally,
communities are often competing with one another to attract development, so policies that are
overly restrictive to developers are unlikely to gain political support. that said, policies that provide
greater long-term certainty to developers may be met with approval.
When we went through water course bylaw adoption we had huge pushback from the
development community. Now, they thank us for the process. They know what the
setback is that they have deal with. Certainty is highly valuable. The most valuable
thing to a development community is certainty: clear objectives and criteria so they
can evaluate in advance – they can’t extricate once they are in it. It has to be clear.
— workshop participant
the final category of challenges relates to gaps in ecological knowledge of natural capital and
ecosystem services, at both the local level and the broader academic level. there is currently a dearth
of baseline studies of ecosystem health in the province. while many communities have completed
mapping of their watercourses and sensitive areas, little ongoing work is underway to track changes
in the quantity or quality of natural capital and ecosystem services. furthermore, local governments
lack the resources to acquire staff with the required expertise to track environmental health – a
the challenges of
protecting and restoring
natural capital at a local
government level can be
grouped into three broad
categories: jurisdictional,
economic, and ecological.
Page 2 2 n at u r a L C a Pita L P OLi C y r e v ie W
much-needed prerequisite to effective conservation policies. Participants also struggled with how
to identify and prioritize which natural capital assets should be protected within their community.
OPPOrtunities
there are many challenges to protecting and restoring natural capital in B.C. communities, however
interview participants also discussed positive aspects of the changing landscape of local politics in
the province. the emergence of local green leaders, innovative policies, successful partnerships, and
an increasingly environmentally aware public all point to a paradigm shift in how urban governments
view their relationship to natural capital.
the existence and influence of green political leaders in local government was discussed by
several interview participants. their ability to motivate others, their sheer passion, and drive has lead
to incredible and inspiring changes. Green leaders from the community are also valuable in driving
change by educating and motivating residents on environmental issues. for example, squamish CAN
(Climate Action Network) is a newly formed community group that has brought a large membership
together. their work initiated “take back the tap,” a policy banning bottled water in municipal facilities.
Municipalities and regional districts across B.C. are not afraid of trying out innovative new ideas.
North vancouver’s district energy system, saanich’s carbon neutral reserve fund, and the Cowichan
valley Regional district’s exploration of tax-shifting policies are all examples of progressive policy
solutions to environmental issues. it is important for the provincial government to recognize the
difficulty of being an early adopter. those municipalities that implement new policies and procedures
before they are mandated by provincial legislation require recognition and possibly compensation
for the knowledge transfer their actions can provide.
Partnerships between various levels of government, non-governmental organizations and the
private sector have been used by a number of communities and are growing in popularity. Partner-
ships have formed on multiple fronts, from mapping services, to stewardship of key resources, to
cost sharing, and educational needs. this is a key tool for municipalities and regional districts that
have limited staff or financial resources to carry out the long-term demands of natural capital policies.
lastly, the public has an increasing level of awareness of key environmental issues; from
endangered species, to recycling waste and water conservation. the use of social networking
tools has increased the profile of local concerns and allowed residents to become engaged in
unprecedented ways.
There are many examples of how quickly societies can change their lifestyles and develop new technologies in response to major challenges. There have been enormous societal changes in recent times, such as the pervasive implementation of recycling programs and conversion of our society from one of tolerance to smoking, to one of mostly non-smokers and the banning of smoking in public places. With increased awareness of climate change, issues of peak oil and other indicators, people are asking, ‘What can I do to make a difference?’ — teeB 2010
the public has
an increasing level
of awareness of key
environmental issues;
from endangered species,
to recycling waste and
water conservation. the
use of social networking
tools has increased the
profile of local concerns
and allowed residents
to become engaged in
unprecedented ways.

Dav iD s uzu ki fOu n DatiOn Page 23
LOCaL gOvernMents have a variety Of POLiCy instruMents related to the protection and
restoration of natural capital. this study uses a three-part classification to organize policies: (1)
public ownership, (2) regulation, and (3) market-based instruments. No single policy instrument –
market-based or conventional – will be appropriate for all environmental problems. which instrument,
or combination of instruments, is best in any given situation depends upon characteristics of the
specific environmental problem, and the sociopolitical, and economic context.
2.1 Public ownershipthe first broad category of policy instrument is public ownership and management. this refers to
public acquisition of land for managing natural capital. Government control of land is often justified
on the basis of the long-term benefits to the community. Permanent protection of ecologically
valuable or sensitive lands is the most reliable method of protecting natural capital and associated
ecosystem services, since it is not subject to short-term shifts in political priorities or resources.
in British Columbia, municipalities and regional districts can secure parcels of land through the
free Crown Grant program, the Nominal Rent tenure program, or through the outright purchase of
property rights.
strengths
• Permanent protection for environmentally sensitive areas (esAs);
• Monitoring can be undertaken by land trusts or community groups;
• Can be used for public education of natural capital and ecosystem services; and
• establishes an economic value for habitat that supports ecosystem services.
s eCtiOn 2
Policy tools to Protect Natural Capital
Which instrument,
or combination of
instruments, is best
in any given situation
depends upon
characteristics of the
specific environmental
problem, and the
sociopolitical, and
economic context.

Page 24 n at u r a L C a Pita L P OLi C y r e v ie W
Weaknesses
• Can be an expensive way to protect natural capital and ecosystem services;
• violations to protected areas are difficult to enforce as infractions are usually dealt with
through the courts; and
• ongoing cost to maintain and manage land.
2.1.1 free CrOWn grant PrOgraM
the province of British Columbia launched the free Crown Grant program in 2004. it enables govern-
ment to provide Crown land to local governments, public agencies, and community organizations to
meet economic and social development goals. the Community and institutional Program transfers
parcels of Crown land for “health, education, public safety, community infrastructure, and public facilities that benefit the public-at-large”(MAl 2011, www.agf.gov.bc.ca/clad/tenure_programs/
programs/community/index.html). Ministry sponsorship is required to record and track land value,
and to ensure the proposed use of the land is consistent with provincial objectives. Granting decisions
are based on a set of six weighted selection criteria: community priorities; economic benefits; health
and social benefits; sustainable infrastructure; and environmental quality.
while this program has been used most extensively by the islands trust, a federation of
independent local governments of the southern Gulf islands who have access to targeted funding
for land preservation, it is open to both regional districts and municipalities. for example, in 2008,
the province awarded surrey 31 hectares of land worth a total of $7 million for public park purposes
(http://www2.news.gov.bc.ca/news_releases_2005-2009/2008Al0017-000634.htm).
effeCtiveness Of free CrOWn grant PrOgraM: the program is the gold standard of natural
capital protection. it provides certainty that natural capital and ecosystem services will be protected
in perpetuity without the cost of purchasing the land. the effectiveness of the program is tempered
by the arduous application process, which requires considerable staff capacity, as well as the need
for ongoing technical and financial support to maintain the land.
2.1.2 PurChase Of PrOPerty rights
the purchase of property rights is one of the few options for protecting ecosystem services on private
lands. while provincial and federal governments can provide tax incentives for the transfer of land
through the eco Gifts Program, local governments must buy land outright if they don’t qualify under
the free Crown Grant Program.8 this policy option provides a high level of certainty for the long-term
protection of natural capital and ecosystem services, but it does come at a high expense. the
outright purchase of land is not feasible on a broad scale. the initial purchase price, and the ongoing
maintenance and monitoring costs can amount to a particularly expensive means to protect natural
capital in relation to environmental regulation. As such, purchases should be targeted to tracts of
8 An additional option open to government is the Nominal Rent tenure Program. while government doesn’t own the land under this program, successful applicants are awarded 30-year leases. the application process is similar to the free Crown Grant Program: www.al.gov.bc.ca/clad/tenure_programs/programs/community/index.html
the province of British
Columbia launched
the free Crown grant
program in 2004. it
enables government to
provide Crown land to
local governments, public
agencies, and community
organizations to meet
economic and social
development goals.
Dav iD s uzu ki fOu n DatiOn Page 25
land of heightened importance. in addition, a reliable stream of funding for locally managed lands
should be available to local governments.
effeCtiveness Of the PurChase Of PrOPerty rights: the purchase of property rights provides
certainty that natural capital and ecosystem services will be protected in perpetuity, but it can
become counterproductive if the acquired land is poorly managed due to constrained resources.
this option should be reserved for highly critical areas that are under threat.
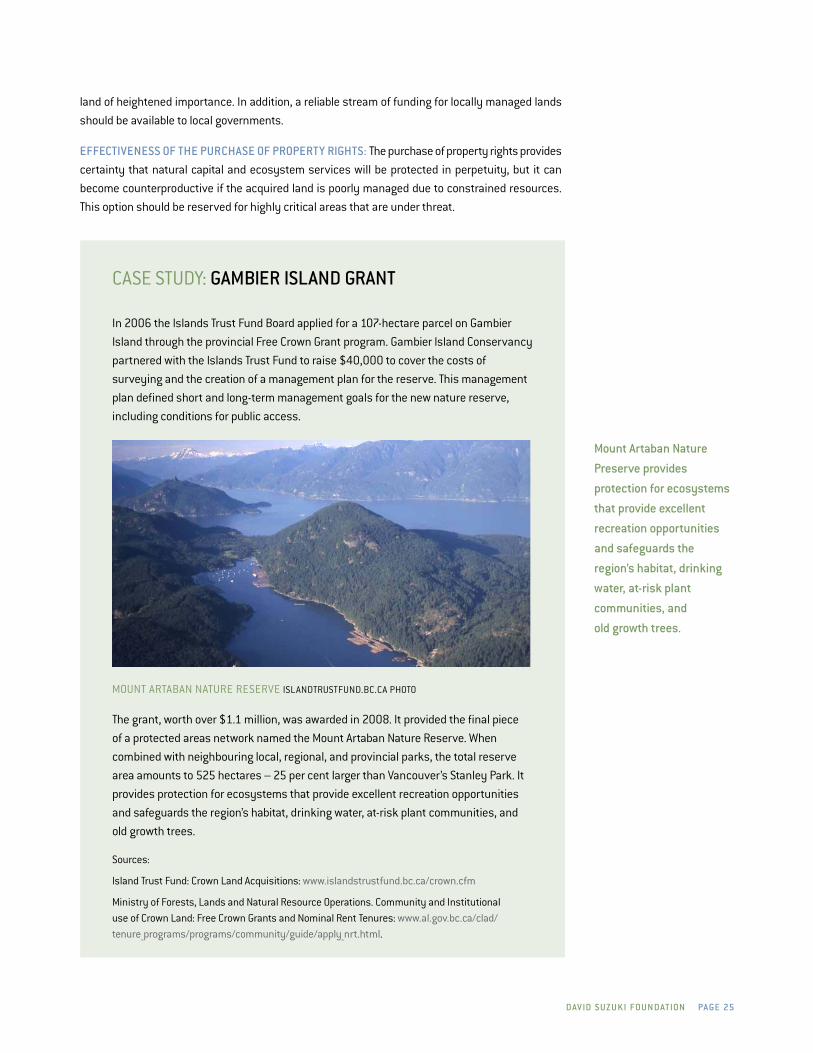
CAse study: gaMBier isLanD grant
in 2006 the islands trust fund Board applied for a 107-hectare parcel on Gambier
island through the provincial free Crown Grant program. Gambier island Conservancy
partnered with the islands trust fund to raise $40,000 to cover the costs of
surveying and the creation of a management plan for the reserve. this management
plan defined short and long-term management goals for the new nature reserve,
including conditions for public access.
MouNt ARtABAN NAtuRe ReseRve islANdtRustfuNd.BC.CA Photo
the grant, worth over $1.1 million, was awarded in 2008. it provided the final piece
of a protected areas network named the Mount Artaban Nature Reserve. when
combined with neighbouring local, regional, and provincial parks, the total reserve
area amounts to 525 hectares – 25 per cent larger than vancouver’s stanley Park. it
provides protection for ecosystems that provide excellent recreation opportunities
and safeguards the region’s habitat, drinking water, at-risk plant communities, and
old growth trees.
sources:
island trust fund: Crown land Acquisitions: www.islandstrustfund.bc.ca/crown.cfm
Ministry of forests, lands and Natural Resource operations. Community and institutional use of Crown land: free Crown Grants and Nominal Rent tenures: www.al.gov.bc.ca/clad/tenure_programs/programs/community/guide/apply_nrt.html.
Mount artaban nature
Preserve provides
protection for ecosystems
that provide excellent
recreation opportunities
and safeguards the
region’s habitat, drinking
water, at-risk plant
communities, and
old growth trees.

Page 26 n at u r a L C a Pita L P OLi C y r e v ie W
2.2 Regulatory instrumentsthe seCOnD BrOaD CategOry of public policy instruments are regulations. Government regulations
attempt to produce outcomes that might not otherwise occur through the use of negative sanctions,
or threats of sanctions. Regulations are most appropriate in situations where a high-risk activity
could result in a substantial impact on the economy, environment, or specific groups or individuals.
there are a number of taxonomies or classifications for regulatory instruments. for the purposes
of this report, regulatory policies are grouped into:(1) planning documents; (2) zoning tools; (3)
environmental bylaws; and (4) covenants.
2.2.1 PLanning DOCuMents
Planning documents are long-term policy directives prepared for a particular area. together with
the framework within which they are produced, they are extremely important. they are the means
by which provincial, regional, and municipal policies are facilitated at the local level. Planning docu-
ments can include regional growth strategies (RGss), official community plans (oCPs), watershed
planning, and conservation planning.
strengths:
• Create local or regional vision of community development;
• foster greater discussion, collaboration and cooperation on a regional scale;
• Provide a mechanism to monitor change and the effectiveness of local policies;
• inform the designation of greenways, developed areas, and protected areas; and
• Provide wider context for considering development proposals and associated applications
for variance permits.
weaknesses:
• Requirement for unanimous approval by member municipalities can lead to compromises
that weaken social, economic, and environmental goals;
• few effective enforcement mechanisms;
• Plans can generally be weakened through amendments; and
• implementation can be slow if there are no or few related policies currently in place.
regiOnaL grOWth strategies
Regional growth strategies (RGs) are an agreement between a regional district and its member
municipalities about long-term social, economic, and environmental goals and policy directives.
they provide a framework for making regional land use and transportation decisions by coordinating
a variety of services such as housing, transportation, urban containment, green infrastructure, and
economic development.
government
regulations attempt to
produce outcomes that
might not otherwise
occur through the use
of negative sanctions,
or threats of sanctions.
regulations are most
appropriate in situations
where a high-risk
activity could result in
a substantial impact
on the economy,
environment, or specific
groups or individuals.

Dav iD s uzu ki fOu n DatiOn Page 27
the Local Government Act states that a RGs must cover a period of at least 20 years and must
include “a comprehensive statement on the future of the region, including the social, economic and environmental objectives of the board in relation to the regional district” (section 849). the
region proposing the RGs must provide opportunity for consultation with persons, organizations
and authorities who will be affected. once drafted, the RGs must be unanimously accepted by all
member municipalities. upon implementation, regional district bylaws and the oCPs of member
municipalities must be consistent with its associated RGs. each municipality internalizes a RGs by
adopting a Regional Context statement in its oCP. this statement proposes how the municipality will
meet the goals of the RGs by amending its policies and bylaws.
CAse study: CaPitaL regiOnaL DistriCt green/BLue sPaCes strategy
the Regional Green/Blue spaces strategy was approved by the Capital Region district
(CRd) Board and the Provincial Capital Commission in November 1997. it is an
ambitious plan that aims to create a corridor of protected wilderness and parkland
stretching from saanich inlet in the east to the
sooke Basin in the southwest. the strategy is
unique in its ability to connect terrestrial and
aquatic protection at a regional scale.
the CRd, in partnership with local municipalities,
the land Conservancy of B.C., habitat Acquisition
trust, the Government of Canada, and the
Province of B.C., aims to protect the entire sea to
sea Greenbelt by the end of 2011, and complete
all of its network trails by 2016. At this time,
almost 90 per cent of the network protection goal
of 11, 500 hectares has been secured through
the designation of provincial, regional, and
municipal parkland. these corridors of protected
areas support a wide range of terrestrial and aquatic plant and animal species, as
well as provide stunning settings for recreation and tourism experiences.
the Regional Growth strategy has acted as the catalyst for bringing together multiple
levels of government to fulfill the Greenbelt strategy. At the local level, the CRd and
member municipalities are developing programs aimed at protecting identified areas
through regional context statements in their oCPs. such programs may consist of
policies, regulations, guidelines and incentives. At a broader level, the CRd is working
alongside member municipalities and the provincial and federal government to
complete a coastal zone management plan within five years of the adoption of the
Regional Growth strategy.
source: Capital Regional district. sea to seaGreen Blue Belt: www.crd.bc.ca/parks/reserves/seatosea.htm
souRCe: lANd CoNseRvANCy of B.C.

Page 28 n at u r a L C a Pita L P OLi C y r e v ie W
effeCtiveness Of rgss: Regional Growth strategies are valuable as a high-level policy document
with the ability to mandate long-term policies that may be difficult to develop at a municipal level,
such as acquiring environmentally sensitive areas as parkland and designating zoning for habitat
corridors. unfortunately, RGss do not have the power to change the way in which regional districts
and municipalities engage in land development. As such, there are no mechanisms to adjust existing
municipal boundaries, to force municipalities to acknowledge adjacent oCPs in planning, or to oversee
land use planning in unincorporated areas.
OffiCiaL COMMunity PLans
the Local Government Act states that an official Community Plan (oCP) is “a statement of objectives
and policies to guide decisions on planning and land use management, within the area covered by
the plan, respecting the purposes of local government” (section 875). oCPs provide the framework
for growth management and conservation by articulating desired patterns of land use, as well as
its policies to protect and restore sensitive environmental areas and biological diversity. oCPs may
contain sub-plans such as neighbourhood plans, watershed plans, or conservation strategies.
oCPs are generally updated every five years. upon drafting a new oCP, the local government
must provide opportunities for consultation with persons, organizations, and authorities it deems
will be affected. once an oCP is in place, local government decisions to amend existing regulations
and approval requirements must be consistent with the oCP.
effeCtiveness Of OCPs: similar to RGss, oCPs are valuable as high-level policy documents. yet
several interview participants indicated that the goals and objectives of oCPs can easily fail in their
transition to on-the-ground policies. Because oCPs do not directly regulate land use, it is up to local
governments to amend existing regulations and approval requirements to align with the oCP.
envirOnMentaL PLanning
in addition to RGss and oCPs, long-term planning can address specific ecosystems or environmental
issues at both the regional and municipal levels. watershed planning, conservation planning, rain-
water management, and integrated flood management strategies are all examples of long-term
environmental planning.
long-term environmental plans should:
• Articulate ecological principles and conservation goals that aim to maintain and enhance
the ecological integrity of natural capital assets;
• establish a geographical framework for the strategy by identifying, mapping and analyzing
habitat types, rare and significant species and ecosystems, and other biodiversity values;
• Be based on sound science, including tradition ecological knowledge;
• Consider and respond to trade-offs at multiple scales (e.g. ecological, social);
• encourage participatory planning;
• include measurable indicators to track effectiveness; and
• include monitoring and enforcement mechanisms.
the Local government
act states that an Official
Community Plan is “a
statement of objectives and
policies to guide decisions
on planning and land use
management, within the
area covered by the plan,
respecting the purposes
of local government.”

Dav iD s uzu ki fOu n DatiOn Page 29
effeCtiveness Of envirOnMentaL PLanning: environmental planning is more focused and
in-depth than RGss or oCPs, and can incorporate meaningful monitoring, allowing a community to
focus on local or regional environmental issues of concern. the main drawbacks are that they take
a long time to develop and are difficult to amend.
CAse study: COWiChan vaLLey regiOnaL DistriCt fLOOD PLanning
the Cowichan valley Regional district (CvRd) is developing an integrated flood
Management Plan for the long-term management of the lower Cowichan flood plain.
the management plan will be structured to meet the goal of reduced flood risk to the
communities on the floodplain, while protecting aquatic and riparian habitat, as well
as the cultural values of the rivers. the plan’s commitment to ecosystem-based goals,
diverse partnerships, and technological innovation has made it a model for other regions.
the CvRd’s integrated flood management plan has included a diverse group of interests,
including the Cowichan tribes, City of duncan, Municipality of North Cowichan, and
CvRd. support for the plan was provided by the union of B.C. Municipalities innovations
fund, Cowichan tribes, and the B.C. Provincial emergency Program, as well as in-kind
contributions from local government organizations. lastly, local universities, federal
agencies, and regional organizations assisted with specific components of the plan,
including the development and implementation of mapping scenarios, predictive
hydrologic models, fisheries restoration plans, and stewardship activities.
the CvRd’s desire to achieve more flood-resistant communities and a more natural,
productive river system requires that floodwater and floodways be viewed as a resource
to be enhanced, rather than something to be managed or mitigated. the integrated flood
management plan was developed to with this in mind.
sources:
sustainable Cowichan: www.12things.ca/12things/12.php
Cowichan valley Regional district. lower Cowichan/Koksilah River integrated flood Management Plan. september 2009: www.cowichanwatershedboard.ca/sites/default/files/lowerCowichan-KoksilahRiverintegratedfloodManagementPlan-finalReport-sept2009.pdf
Photo CiBoulette/fliCKR
Page 3 0 n at u r a L C a Pita L P OLi C y r e v ie W
2.2.2 zOning tOOLs
Zoning allows local governments to control the use, density of use (e.g. number of residential units
per lot allowed), as well as the siting of future development. Zoning bylaws can also regulate how
far buildings and other amenities must be setback from environmentally sensitive areas.
Conservation zoning, in particular, is a straightforward way to keep development out of environ-
mentally sensitive areas. it is often used to reinforce environmental protection goals and to correct
outdated zoning that failed to consider sensitive areas. it is usually part of an application to rezone
and subdivide a large parcel of land where there are plans for cluster development so as to allow
a portion of land to be preserved as parkland. As long as zoning does not restrict public use of the
land, local governments can enforce zoning for ecosystem protection
there are a number of zoning tools regional districts and municipalities can employ to protect
natural capital. four are discussed here: (1) development permit areas; (2) greenbelts; (3) urban
containment boundaries; and (4) cluster zoning and development.
strengths:
• when used with other tools, zoning can be an effective way to protect environmentally
sensitive areas and green infrastructure from development;
• local governments do not have to pay compensation to landowners for changes in the
value of land due to rezoning enacted in the public interest;
• Zoning is better received when it can be communicated as a tool to meet the goals of a
community-wide planning process (e.g. oCP); and
• enforcement mechanisms are available.
weaknesses:
• May promote urban sprawl by pushing residential development and other activities to
regions where there are fewer restrictions; and
• Can be politically unpopular because it can decrease the value of property by limiting its
uses.
envirOnMentaL DeveLOPMent PerMit areas
environmental development permit areas (ePdAs) are among the strongest tools for shaping new
development to ensure that it respects sensitive ecosystems. edPAs allow local governments to
create specific requirements for development in addition to basic zoning. when a municipality or
regional district designates an edPA, a permit must be obtained before a landowner may subdivide
or alter land, or construct or alter a building. the permit must supply information about sensitive
ecosystems on the parcel and describe how the development will impact that area. All development
must be in accordance with the terms of the permit.
edPAs can be designated by regional districts or municipal governments. they can be depicted
on maps in an oCP or RGs or as written descriptions of sensitive areas in oCPs or RGss. when an
edPA is established, the appropriate government must document the specific site conditions or
objectives that justify the designation, and stipulate the guidelines to achieve those objectives.
in instances where an edPA is breached, local government can use the enforcement provisions of
local bylaws to penalize landowners.
there are a number
of zoning tools
regional districts and
municipalities can employ
to protect natural capital.
four are discussed
here: (1) development
permit areas; (2)
greenbelts; (3) urban
containment boundaries;
and (4) cluster zoning
and development.

Dav iD s uzu ki fOu n DatiOn Page 31
effeCtiveness Of eDPas: edPAs are a highly effective tool to protect natural capital assets on
private property when governments have adequately qualified staff to identify and assess the
community’s environmentally sensitive areas and monitor and enforce the provisions of the permits.
greenBeLts
to maintain a high diversity of plants and animal species in urban areas requires the maintenance of
corridors and connections to ecosystems surrounding the city. small city parks and urban forests are
often too small and fragmented to sustain a varied flora and fauna in isolation. through the migration
of organisms from larger core areas outside the city, the diversity in urban ecosystems can still be
maintained (Bolund and hunhammer 1999). Greenbelts serve this purpose, by providing a physical
area of open space that surrounds a region and protects the ecosystems from urban growth.
B.C.’s most relevant version of a greenbelt is the Agriculture land Reserve (AlR). Created in 1973,
the AlR was a response to concerns that farmland in B.C. was being irretrievably lost to development.
the AlR protects agriculture, and to a lesser extent natural heritage, tourism and recreation. it is
administered by the Agricultural land Commission (AlC), whose purpose is to encourage farming
on agricultural land by promoting the adoption of local and provincial plans, bylaws, and policies that
help to protect and enhance farming (Curran, 2005). the AlC was restructured in 2000, providing
regional governments with greater authority to regulate permissible non-farm uses of agricultural
land within the AlR. each 3-person regional panel now has jurisdiction over decisions within their
domain, which has diluted the provincial perspective. since regional panels make decisions for the
new commission and can include “community need” for development, there is concern about the
undue influence of local economic interests (Carter-whitney 2008).
local governments play a vital role in land management affecting the AlR, as the first parties to
see all applications to exclude or subdivide land from the AlR. these agencies can help protect the AlR
by ensuring that all relevant bylaws and plans meet the requirements of the AlC Act (AlC, 2007a).
for example, surrey has an AlR exclusion policy, which specifies compensation for the removal of
AlR land. Among the stipulations is the requirement to replace AlR land with an area that is at least
twice as large as the area of land being excluded. 2 for 1 replacement of land. this has practically
stopped AlR exclusion because it is almost impossible to meet this threshold.
effeCtiveness Of the aLr: while the AlR has met its objective of ensuring no net loss of
agricultural land (from 1974 to 2003, B.C. experienced no net loss of farmland because the amount
of land included and excluded from the AlR was roughly the same), the quality of land in the AlR
has deteriorated. Many are concerned this trend will continue under its restructured form. AlRs are
most effective when they are paired with relevant densification policies, such as urban containment
boundaries.
B.C.’s most relevant
version of a greenbelt
is the agriculture Land
reserve (aLr). Created
in 1973, the aLr was a
response to concerns
that farmland in B.C.
was being irretrievably
lost to development.
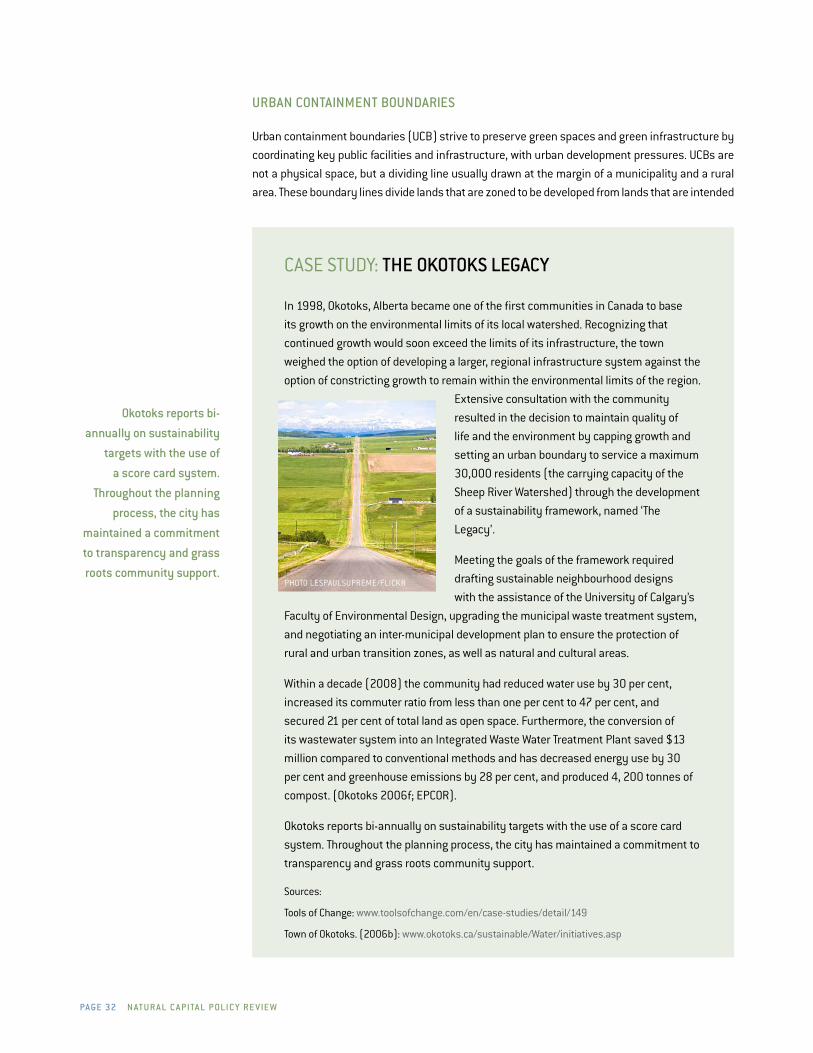
Page 32 n at u r a L C a Pita L P OLi C y r e v ie W
urBan COntainMent BOunDaries
urban containment boundaries (uCB) strive to preserve green spaces and green infrastructure by
coordinating key public facilities and infrastructure, with urban development pressures. uCBs are
not a physical space, but a dividing line usually drawn at the margin of a municipality and a rural
area. these boundary lines divide lands that are zoned to be developed from lands that are intended
CAse study: the OkOtOks LegaCy
in 1998, okotoks, Alberta became one of the first communities in Canada to base
its growth on the environmental limits of its local watershed. Recognizing that
continued growth would soon exceed the limits of its infrastructure, the town
weighed the option of developing a larger, regional infrastructure system against the
option of constricting growth to remain within the environmental limits of the region.
extensive consultation with the community
resulted in the decision to maintain quality of
life and the environment by capping growth and
setting an urban boundary to service a maximum
30,000 residents (the carrying capacity of the
sheep River watershed) through the development
of a sustainability framework, named ‘the
legacy’.
Meeting the goals of the framework required
drafting sustainable neighbourhood designs
with the assistance of the university of Calgary’s
faculty of environmental design, upgrading the municipal waste treatment system,
and negotiating an inter-municipal development plan to ensure the protection of
rural and urban transition zones, as well as natural and cultural areas.
within a decade (2008) the community had reduced water use by 30 per cent,
increased its commuter ratio from less than one per cent to 47 per cent, and
secured 21 per cent of total land as open space. furthermore, the conversion of
its wastewater system into an integrated waste water treatment Plant saved $13
million compared to conventional methods and has decreased energy use by 30
per cent and greenhouse emissions by 28 per cent, and produced 4, 200 tonnes of
compost. (okotoks 2006f; ePCoR).
okotoks reports bi-annually on sustainability targets with the use of a score card
system. throughout the planning process, the city has maintained a commitment to
transparency and grass roots community support.
sources:
tools of Change: www.toolsofchange.com/en/case-studies/detail/149
town of okotoks. (2006b): www.okotoks.ca/sustainable/water/initiatives.asp
Photo lesPAulsuPReMe/fliCKR
Okotoks reports bi-
annually on sustainability
targets with the use of
a score card system.
throughout the planning
process, the city has
maintained a commitment
to transparency and grass
roots community support.
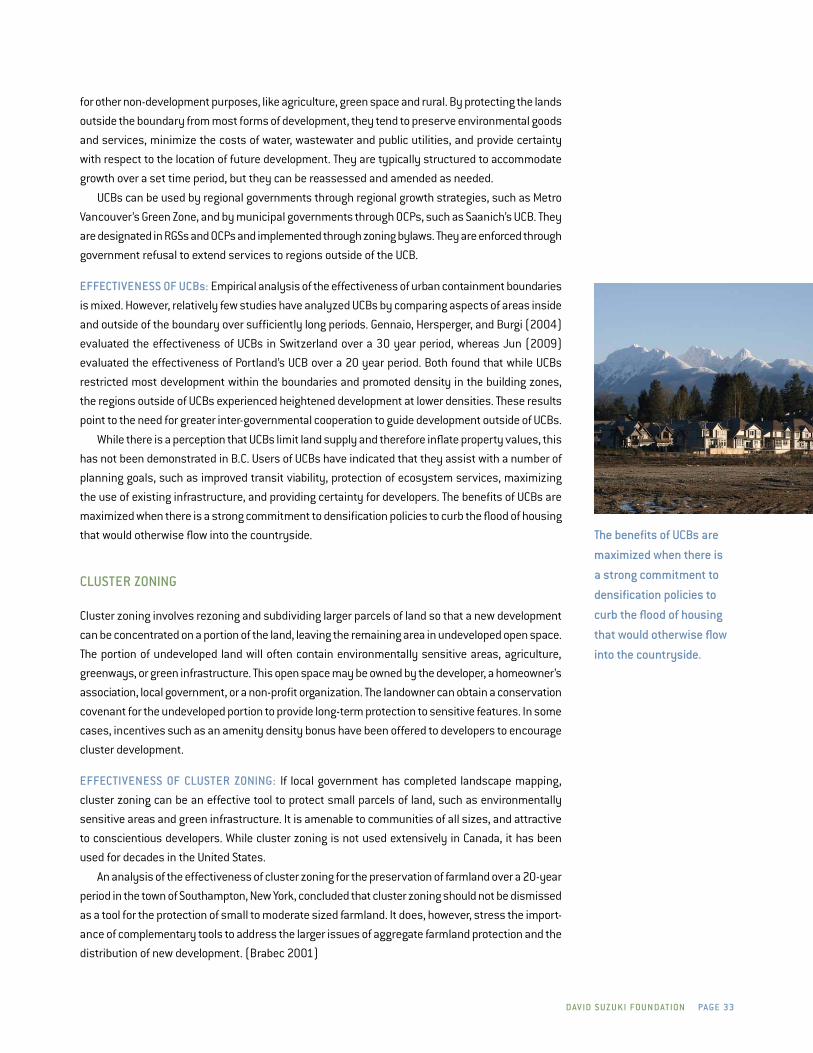
Dav iD s uzu ki fOu n DatiOn Page 33
for other non-development purposes, like agriculture, green space and rural. By protecting the lands
outside the boundary from most forms of development, they tend to preserve environmental goods
and services, minimize the costs of water, wastewater and public utilities, and provide certainty
with respect to the location of future development. they are typically structured to accommodate
growth over a set time period, but they can be reassessed and amended as needed.
uCBs can be used by regional governments through regional growth strategies, such as Metro
vancouver’s Green Zone, and by municipal governments through oCPs, such as saanich’s uCB. they
are designated in RGss and oCPs and implemented through zoning bylaws. they are enforced through
government refusal to extend services to regions outside of the uCB.
effeCtiveness Of uCBs: empirical analysis of the effectiveness of urban containment boundaries
is mixed. however, relatively few studies have analyzed uCBs by comparing aspects of areas inside
and outside of the boundary over sufficiently long periods. Gennaio, hersperger, and Burgi (2004)
evaluated the effectiveness of uCBs in switzerland over a 30 year period, whereas Jun (2009)
evaluated the effectiveness of Portland’s uCB over a 20 year period. Both found that while uCBs
restricted most development within the boundaries and promoted density in the building zones,
the regions outside of uCBs experienced heightened development at lower densities. these results
point to the need for greater inter-governmental cooperation to guide development outside of uCBs.
while there is a perception that uCBs limit land supply and therefore inflate property values, this
has not been demonstrated in B.C. users of uCBs have indicated that they assist with a number of
planning goals, such as improved transit viability, protection of ecosystem services, maximizing
the use of existing infrastructure, and providing certainty for developers. the benefits of uCBs are
maximized when there is a strong commitment to densification policies to curb the flood of housing
that would otherwise flow into the countryside.
CLuster zOning
Cluster zoning involves rezoning and subdividing larger parcels of land so that a new development
can be concentrated on a portion of the land, leaving the remaining area in undeveloped open space.
the portion of undeveloped land will often contain environmentally sensitive areas, agriculture,
greenways, or green infrastructure. this open space may be owned by the developer, a homeowner’s
association, local government, or a non-profit organization. the landowner can obtain a conservation
covenant for the undeveloped portion to provide long-term protection to sensitive features. in some
cases, incentives such as an amenity density bonus have been offered to developers to encourage
cluster development.
effeCtiveness Of CLuster zOning: if local government has completed landscape mapping,
cluster zoning can be an effective tool to protect small parcels of land, such as environmentally
sensitive areas and green infrastructure. it is amenable to communities of all sizes, and attractive
to conscientious developers. while cluster zoning is not used extensively in Canada, it has been
used for decades in the united states.
An analysis of the effectiveness of cluster zoning for the preservation of farmland over a 20-year
period in the town of southampton, New york, concluded that cluster zoning should not be dismissed
as a tool for the protection of small to moderate sized farmland. it does, however, stress the import-
ance of complementary tools to address the larger issues of aggregate farmland protection and the
distribution of new development. (Brabec 2001)
the benefits of uCBs are
maximized when there is
a strong commitment to
densification policies to
curb the flood of housing
that would otherwise flow
into the countryside.
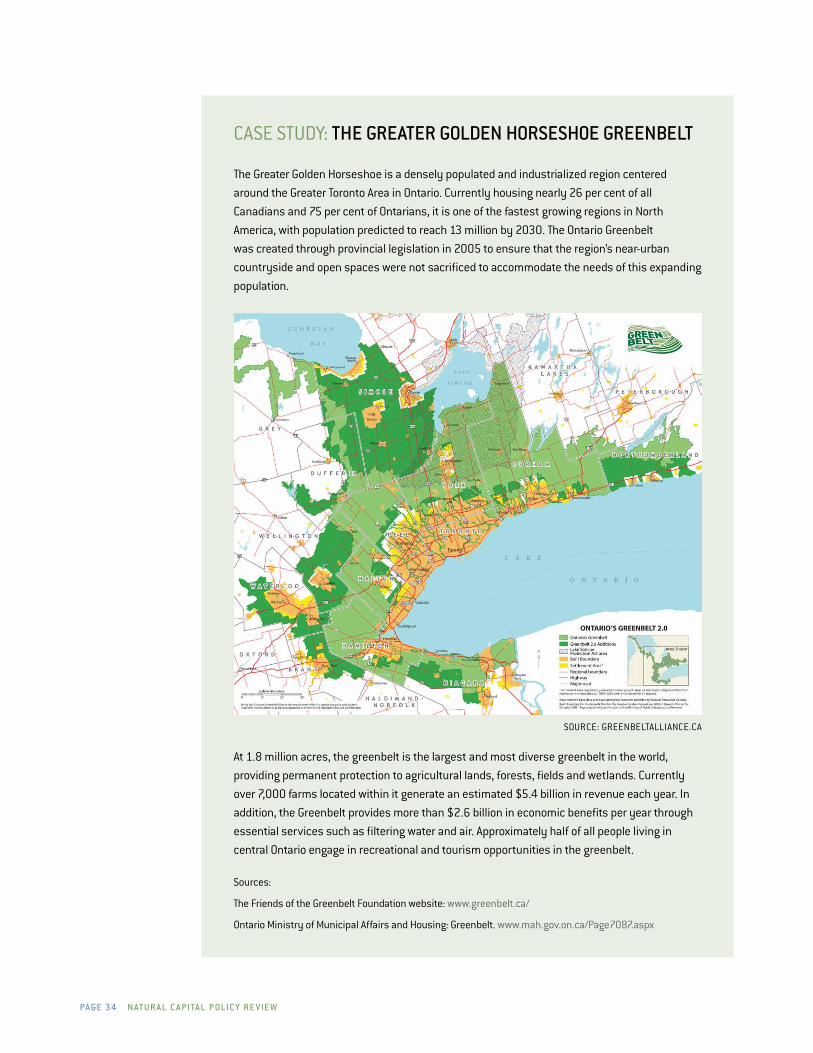
Page 34 n at u r a L C a Pita L P OLi C y r e v ie W
CAse study: the greater gOLDen hOrseshOe greenBeLt
the Greater Golden horseshoe is a densely populated and industrialized region centered
around the Greater toronto Area in ontario. Currently housing nearly 26 per cent of all
Canadians and 75 per cent of ontarians, it is one of the fastest growing regions in North
America, with population predicted to reach 13 million by 2030. the ontario Greenbelt
was created through provincial legislation in 2005 to ensure that the region’s near-urban
countryside and open spaces were not sacrificed to accommodate the needs of this expanding
population.
souRCe: GReeNBeltAlliANCe.CA
At 1.8 million acres, the greenbelt is the largest and most diverse greenbelt in the world,
providing permanent protection to agricultural lands, forests, fields and wetlands. Currently
over 7,000 farms located within it generate an estimated $5.4 billion in revenue each year. in
addition, the Greenbelt provides more than $2.6 billion in economic benefits per year through
essential services such as filtering water and air. Approximately half of all people living in
central ontario engage in recreational and tourism opportunities in the greenbelt.
sources:
the friends of the Greenbelt foundation website: www.greenbelt.ca/
ontario Ministry of Municipal Affairs and housing: Greenbelt. www.mah.gov.on.ca/Page7087.aspx

Dav iD s uzu ki fOu n DatiOn Page 35
2.2.3 envirOnMentaL ByLaWs
environmental bylaws are a finer-scale approach to protecting natural capital. Bylaws are designed
to regulate or prohibit certain activities and prescribe methods of carrying out activities. they can
serve proactive or reactive purposes. Proactive bylaws generally require landowners to obtain
permits before undertaking certain activities, whereas reactive bylaws permit government staff to
enforce a bylaw after the offence has taken place.
with the exception of environmental impact assessments, specific types of environmental
bylaws are not dealt with in this report, as comprehensive reviews are available elsewhere. for a
comprehensive review of environmental bylaws see the Green Bylaws toolkit: http://greenbylaws.ca/.
strengths:
• Can set more stringent standards for individual ecological features;
• opportunity for public education, particularly with proactive bylaws;
• Provides potential for rehabilitation;
• Can control pollution entering an ecosystem; and
• Provides opportunity to address incremental changes to ecosystems.
weaknesses:
• standards can be too stringent or costly to administer;
• Can create trade-offs (e.g. tree protection for dense development);
• Can be difficult to enforce without adequate resources (e.g. staff and training resources);
• ongoing monitoring and enforcement needed;
• Requires landowners and developers to be aware of and understand bylaws and standards;
and
• standards could hinder innovation
envirOnMentaL ByLaWs
Regional districts and municipal governments employ a number of bylaws to protect and restore
particular components of natural capital. Bylaws can encourage certain activities such as tree
planting, and discourage others such as development near sensitive ecosystems. study participants
indicated a preference for proactive bylaws, such as the streamside protection regulations, due
to its clear mandate and simpler enforcement. Reactive bylaws can be difficult to enforce, either
because the damage is already done, or because the enforcements mechanisms and prescribed
penalties are too difficult to enforce and collect. small local governments often lack the resources
to effectively enforce bylaws with such penalties.
the following types of bylaws are currently being used by regional districts and municipalities
in B.C.
• streamside protection regulation;
• watercourse protection bylaws;
• Pesticide restriction bylaws;
• tree protection bylaws;
• soil deposit bylaws;
Bylaws can serve
proactive or reactive
purposes. Proactive
bylaws generally
require landowners to
obtain permits before
undertaking certain
activities, whereas
reactive bylaws permit
government staff to
enforce a bylaw after the
offence has taken place.
Page 36 n at u r a L C a Pita L P OLi C y r e v ie W
• Bylaw to control erosion and sediment flows;
• idling bylaws;
• hobby beekeeping bylaws;
• electric vehicle bylaws; and
• Green building requirements for rezoning applications.
effeCtiveness Of envirOnMentaL ByLaWs: Bylaws are effective when they target environmental
issues not addressed through planning or zoning, when they are well communicated to the public and
developers, and when governments have sufficient resources to monitor and enforce their bylaws.
envirOnMentaL iMPaCt assessMent
environmental impact Assessments (eiAs) provide the means for governments to make an informed
decision about proposed development or activities. they are often seen as a leading policy mechan-
ism to ensure that projects do not cause significant adverse environmental impacts. As such, they
are reviewed here.
eiAs are designed to assess the effects of a new development on community goals and object-
ives, including environmentally sensitive areas. Governments may specify particular areas (e.g.
environmentally sensitive Areas) or situations (e.g. rezoning, development permits, and temporary
commercial or industrial use) for which landowners must provide information on the anticipated
impact of development. if information is required prior to development approval, the local government
must enact a bylaw that outlines the required information and the procedures for obtaining it. this
generally requires professional consultation and is the responsibility of the landowner or developer.
effeCtiveness Of eias: eiAs can be effective when they are mandated through oCPs to occur prior
to development and to provide alternatives to the proposed activities. in addition they contribute to
the community’s knowledge of local ecosystems and watersheds. unfortunately, they are generally
project driven and occur at the middle or end of a process rather than the beginning. it is widely
acknowledged that eiAs rarely conform to the intended models of the process, offering more in
theory then they do in practice (Cashmore et al., 2004; Noble, 2002; dipper, 1998).
PerfOrManCe BOnDs
in instances where performance bonds (or security requirements) are mandated, developers pay
a fee to government as part of the approval process. this fee is held as a bond and is returned once
the developer demonstrates that specific performance objectives have been met.
Performance bonds are contained in environmental bylaws and guidelines for development. they
can be an effective incentive for developers to perform development activities properly in order to
have the bond reimbursed, as well as to maintain good standing in the development community.
in addition, they provide considerable reassurance to governments since remediation funds are
provided up front.
effeCtiveness Of PerfOrManCe BOnDs: Performance bonds, if set at appropriate levels, are an
effective tool for protecting natural capital. they are most useful when environmentally sensitive
areas are known (through mapping) and when the region is a development hot spot. they are less
useful to smaller municipalities that may be competing for development.
eias are designed
to assess the effects of
a new development on
community goals and
objectives, including
environmentally
sensitive areas.
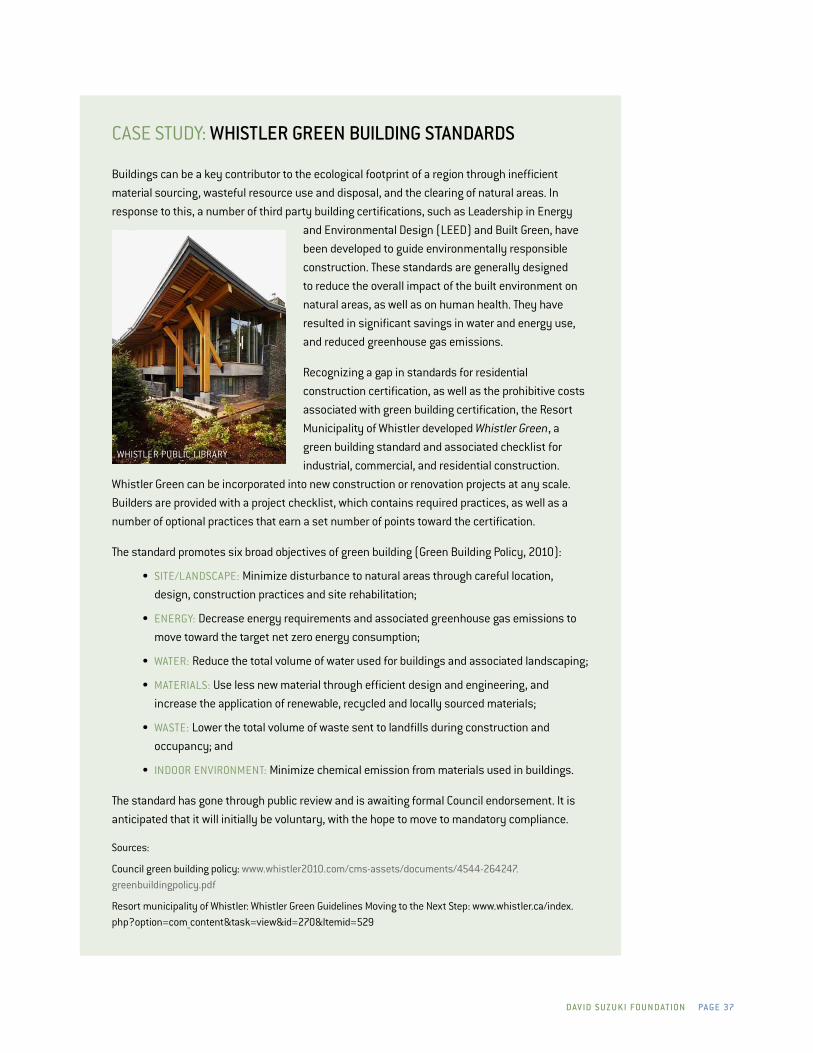
Dav iD s uzu ki fOu n DatiOn Page 37
CAse study: WhistLer green BuiLDing stanDarDs
Buildings can be a key contributor to the ecological footprint of a region through inefficient
material sourcing, wasteful resource use and disposal, and the clearing of natural areas. in
response to this, a number of third party building certifications, such as leadership in energy
and environmental design (leed) and Built Green, have
been developed to guide environmentally responsible
construction. these standards are generally designed
to reduce the overall impact of the built environment on
natural areas, as well as on human health. they have
resulted in significant savings in water and energy use,
and reduced greenhouse gas emissions.
Recognizing a gap in standards for residential
construction certification, as well as the prohibitive costs
associated with green building certification, the Resort
Municipality of whistler developed Whistler Green, a
green building standard and associated checklist for
industrial, commercial, and residential construction.
whistler Green can be incorporated into new construction or renovation projects at any scale.
Builders are provided with a project checklist, which contains required practices, as well as a
number of optional practices that earn a set number of points toward the certification.
the standard promotes six broad objectives of green building (Green Building Policy, 2010):
• site/lANdsCAPe: Minimize disturbance to natural areas through careful location,
design, construction practices and site rehabilitation;
• eNeRGy: decrease energy requirements and associated greenhouse gas emissions to
move toward the target net zero energy consumption;
• wAteR: Reduce the total volume of water used for buildings and associated landscaping;
• MAteRiAls: use less new material through efficient design and engineering, and
increase the application of renewable, recycled and locally sourced materials;
• wAste: lower the total volume of waste sent to landfills during construction and
occupancy; and
• iNdooR eNviRoNMeNt: Minimize chemical emission from materials used in buildings.
the standard has gone through public review and is awaiting formal Council endorsement. it is
anticipated that it will initially be voluntary, with the hope to move to mandatory compliance.
sources:
Council green building policy: www.whistler2010.com/cms-assets/documents/4544-264247.greenbuildingpolicy.pdf
Resort municipality of whistler: whistler Green Guidelines Moving to the Next step: www.whistler.ca/index.php?option=com_content&task=view&id=270&itemid=529
whistleR PuBliC liBRARy
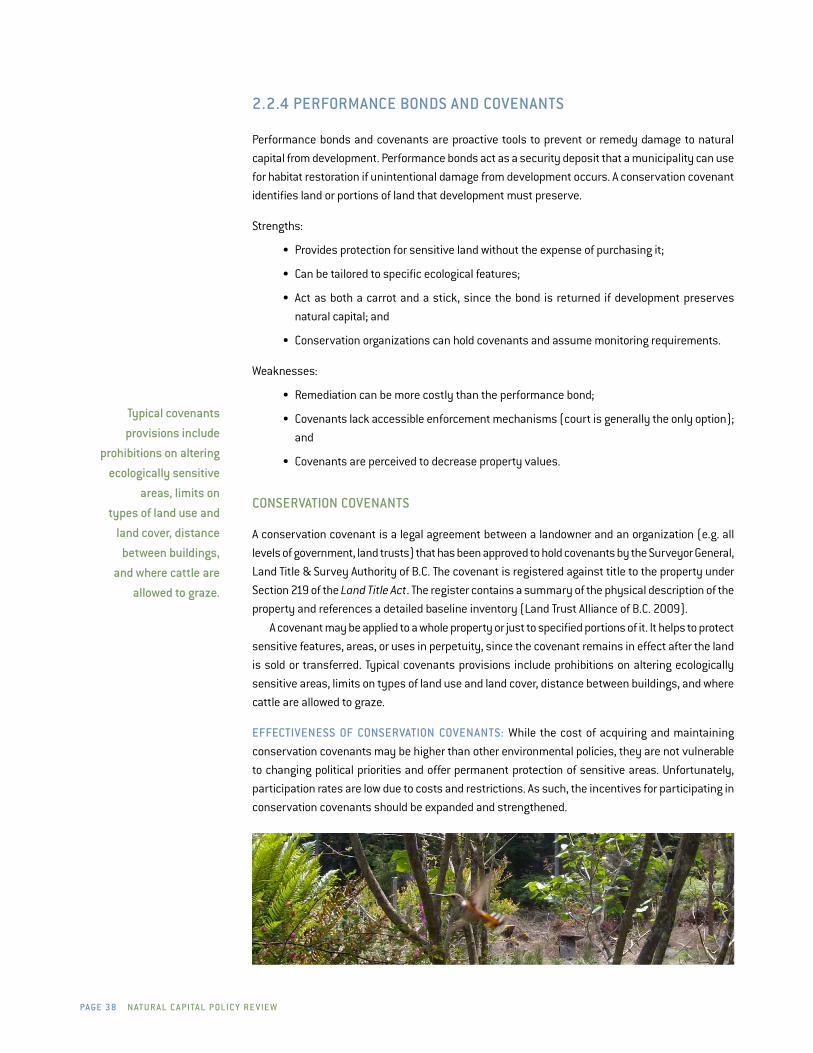
Page 38 n at u r a L C a Pita L P OLi C y r e v ie W
2.2.4 PerfOrManCe BOnDs anD COvenants
Performance bonds and covenants are proactive tools to prevent or remedy damage to natural
capital from development. Performance bonds act as a security deposit that a municipality can use
for habitat restoration if unintentional damage from development occurs. A conservation covenant
identifies land or portions of land that development must preserve.
strengths:
• Provides protection for sensitive land without the expense of purchasing it;
• Can be tailored to specific ecological features;
• Act as both a carrot and a stick, since the bond is returned if development preserves
natural capital; and
• Conservation organizations can hold covenants and assume monitoring requirements.
weaknesses:
• Remediation can be more costly than the performance bond;
• Covenants lack accessible enforcement mechanisms (court is generally the only option);
and
• Covenants are perceived to decrease property values.
COnservatiOn COvenants
A conservation covenant is a legal agreement between a landowner and an organization (e.g. all
levels of government, land trusts) that has been approved to hold covenants by the surveyor General,
land title & survey Authority of B.C. the covenant is registered against title to the property under
section 219 of the Land Title Act. the register contains a summary of the physical description of the
property and references a detailed baseline inventory (land trust Alliance of B.C. 2009).
A covenant may be applied to a whole property or just to specified portions of it. it helps to protect
sensitive features, areas, or uses in perpetuity, since the covenant remains in effect after the land
is sold or transferred. typical covenants provisions include prohibitions on altering ecologically
sensitive areas, limits on types of land use and land cover, distance between buildings, and where
cattle are allowed to graze.
effeCtiveness Of COnservatiOn COvenants: while the cost of acquiring and maintaining
conservation covenants may be higher than other environmental policies, they are not vulnerable
to changing political priorities and offer permanent protection of sensitive areas. unfortunately,
participation rates are low due to costs and restrictions. As such, the incentives for participating in
conservation covenants should be expanded and strengthened.
typical covenants
provisions include
prohibitions on altering
ecologically sensitive
areas, limits on
types of land use and
land cover, distance
between buildings,
and where cattle are
allowed to graze.
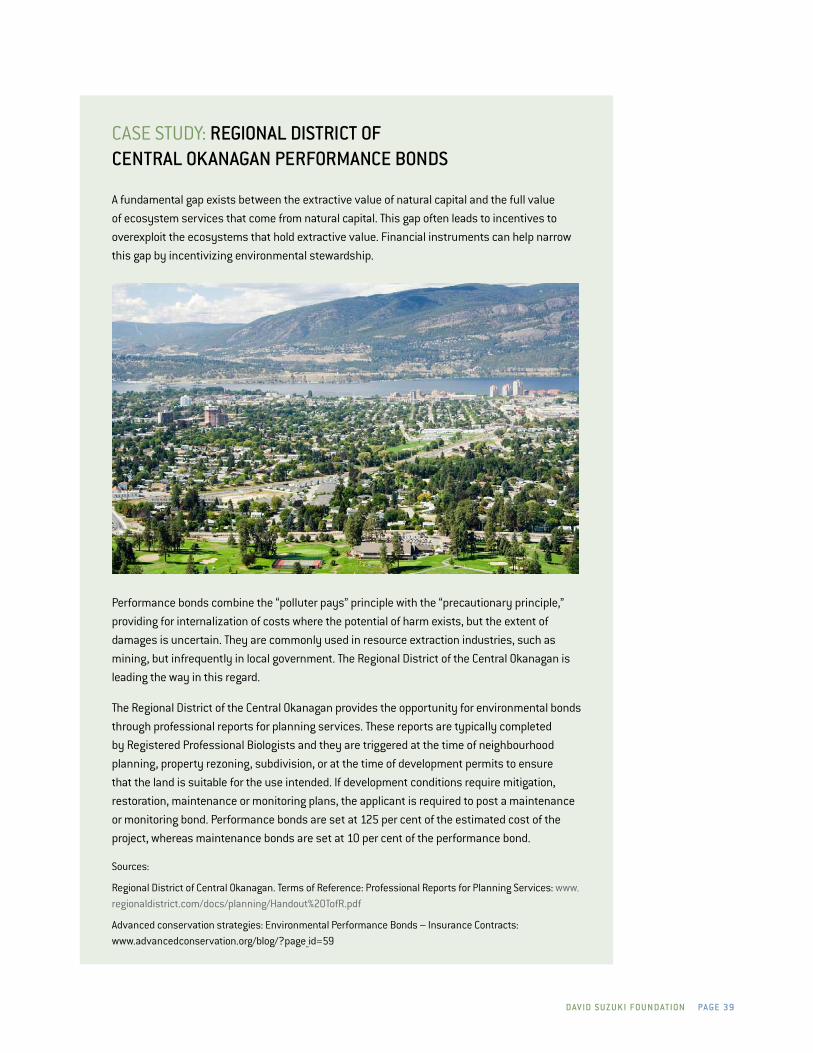
Dav iD s uzu ki fOu n DatiOn Page 39
CAse study: regiOnaL DistriCt Of CentraL Okanagan PerfOrManCe BOnDs
A fundamental gap exists between the extractive value of natural capital and the full value
of ecosystem services that come from natural capital. this gap often leads to incentives to
overexploit the ecosystems that hold extractive value. financial instruments can help narrow
this gap by incentivizing environmental stewardship.
Performance bonds combine the “polluter pays” principle with the “precautionary principle,”
providing for internalization of costs where the potential of harm exists, but the extent of
damages is uncertain. they are commonly used in resource extraction industries, such as
mining, but infrequently in local government. the Regional district of the Central okanagan is
leading the way in this regard.
the Regional district of the Central okanagan provides the opportunity for environmental bonds
through professional reports for planning services. these reports are typically completed
by Registered Professional Biologists and they are triggered at the time of neighbourhood
planning, property rezoning, subdivision, or at the time of development permits to ensure
that the land is suitable for the use intended. if development conditions require mitigation,
restoration, maintenance or monitoring plans, the applicant is required to post a maintenance
or monitoring bond. Performance bonds are set at 125 per cent of the estimated cost of the
project, whereas maintenance bonds are set at 10 per cent of the performance bond.
sources:
Regional district of Central okanagan. terms of Reference: Professional Reports for Planning services: www.regionaldistrict.com/docs/planning/handout%20tofR.pdf
Advanced conservation strategies: environmental Performance Bonds – insurance Contracts: www.advancedconservation.org/blog/?page_id=59

Page 40 n at u r a L C a Pita L P OLi C y r e v ie W
2.3 Market-based tools
Market-BaseD instruMents are the third broad category of public policy instruments. these
policies are often referred to as environmental Pricing Reform (ePR), since they adjust market prices
to account for environmental costs and benefits. ePR instruments have been used to stimulate the
development of green technology, shift market demand, minimize pollution, and conserve and
rehabilitate sensitive areas. As such, they represent a valuable opportunity for regional districts and
municipalities. in some cases, ePR policies can generate revenue for local governments through
the introduction of fees or tax shifting. in other cases they can bring about savings by encouraging
conservative behaviours or activities. in the end, the appeal of ePR policies is that they often have
the ability to do both (Calvert 2010).
Market tools to protect natural capital at the local level are grouped into four broad categories:
environmental tax instruments; price signals; subsidy reform; and the creation of new markets.
2.3.1 envirOnMentaL tax instruMents
environmental tax instruments aim to shift the tax burden from things that are socially desirable,
such as employment, income, and investment, to things that are undesirable, like pollution, resource
depletion, and waste. the goal is to help the environment and community health without hurting
the economy. environmental taxes can be structured to be revenue-neutral (i.e. total tax revenues
remain unchanged), revenue-positive (i.e. total tax revenues increase) or revenue-negative (i.e.
total tax revenues decrease), depending on how much tax revenue is recycled and public attitudes
toward taxes.
Although there is a wide range of tax policies that regional and local governments can implement
to protect natural capital, this section focuses on property tax instruments – the primary tax collected
by local government – and provincial tax sharing opportunities.
in some cases, ePr
policies can generate
revenue for local
governments through
the introduction of
fees or tax shifting. in
other cases they can
bring about savings by
encouraging conservative
behaviours or activities.

Dav iD s uzu ki fOu n DatiOn Page 41
strengths:
• helps government protect natural capital while also providing financial flexibility;
• diversifies revenue stream; and
• Addresses social equity challenges (e.g. not asking everyone to pay into environmental
challenges regardless of one’s contribution to the problem or one’s income level).
weaknesses:
• significant education required to overcome the public’s dislike of taxes;
• the public is sensitive to increases in highly visible taxes (e.g. property taxes);
• increased resources required for administration of policies; and
• significant information required to set effective tax rate.
PrOPerty taxatiOn
Recognizing that property taxes represent approximately half of total local government revenues,
it seems prudent to employ them as a tool to protect natural capital. there are a number of options
available to local governments for restructuring property taxes to encourage the protection and
restoration of natural capital.
• lANd vAluAtioN tAxAtioN: Reduces the portion of tax on building improvements while
increasing the portion of tax on the value of the land. this provides an incentive to increase
development density and repair old or damaged buildings. the drawback of this form of
property taxation is the increase in housing prices in a region’s core, which could promote
sprawl. it is anticipated that this effect would only hold in the short-term, as market forces
adjust over the medium-long term.
• PRoPeRty tAx diffeReNtiAtioN: involves determining tax rates based upon the conserva-
tion of natural capital. the level of property tax is determined by a scoring system that
assigns points to specific natural capital assets.
• deNsity-BAsed PRoPeRty tAxAtioN: Removes the incentive to purchase single-family
homes and by extension, reduces urban sprawl. lowering taxes on multi-family dwellings
recognizes that they have a smaller ecological and financial footprint (e.g. less land and
infrastructure demands per person, lower household heating and cooling costs).
• iMPRoveMeNt distRiCts: Provide a means of capturing increases in property values that
result from public investment in an area. local governments can recover a portion of the
costs for various projects to protect natural capital (e.g. public transit improvements,
brownfield remediation, parkland creation) in this way.
effeCtiveness Of PrOPerty taxatiOn fOr naturaL CaPitaL: Canadian municipalities do not
have enough experience with property tax reform to assess its effectiveness. however, given that
the largest barrier to overcome with taxes is public acceptance, density based taxation is likely
easier to justify than land valuation. in addition, it is administratively preferable to property tax
differentiation (which requires the development of tax rates for various natural capital conservation
activities), and doesn’t require access to funding up front in the way that improvement districts do.
recognizing that
property taxes represent
approximately half of
total local government
revenues, it seems prudent
to employ them as a tool
to protect natural capital.
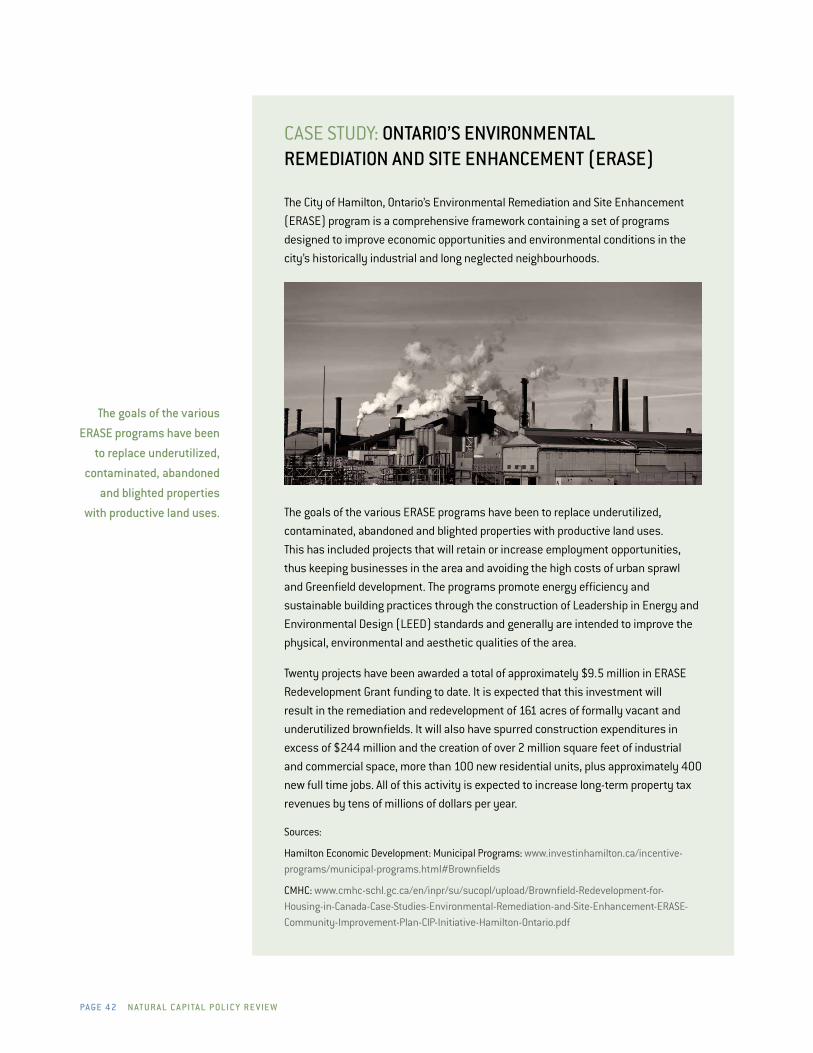
Page 4 2 n at u r a L C a Pita L P OLi C y r e v ie W
Photo lesPAulsuPReMe/fliCKR
CAse study: OntariO’s envirOnMentaL reMeDiatiOn anD site enhanCeMent (erase)
the City of hamilton, ontario’s environmental Remediation and site enhancement
(eRAse) program is a comprehensive framework containing a set of programs
designed to improve economic opportunities and environmental conditions in the
city’s historically industrial and long neglected neighbourhoods.
the goals of the various eRAse programs have been to replace underutilized,
contaminated, abandoned and blighted properties with productive land uses.
this has included projects that will retain or increase employment opportunities,
thus keeping businesses in the area and avoiding the high costs of urban sprawl
and Greenfield development. the programs promote energy efficiency and
sustainable building practices through the construction of leadership in energy and
environmental design (leed) standards and generally are intended to improve the
physical, environmental and aesthetic qualities of the area.
twenty projects have been awarded a total of approximately $9.5 million in eRAse
Redevelopment Grant funding to date. it is expected that this investment will
result in the remediation and redevelopment of 161 acres of formally vacant and
underutilized brownfields. it will also have spurred construction expenditures in
excess of $244 million and the creation of over 2 million square feet of industrial
and commercial space, more than 100 new residential units, plus approximately 400
new full time jobs. All of this activity is expected to increase long-term property tax
revenues by tens of millions of dollars per year.
sources:
hamilton economic development: Municipal Programs: www.investinhamilton.ca/incentive-programs/municipal-programs.html#Brownfields
CMhC: www.cmhc-schl.gc.ca/en/inpr/su/sucopl/upload/Brownfield-Redevelopment-for-housing-in-Canada-Case-studies-environmental-Remediation-and-site-enhancement-eRAse-Community-improvement-Plan-CiP-initiative-hamilton-ontario.pdf
the goals of the various
erase programs have been
to replace underutilized,
contaminated, abandoned
and blighted properties
with productive land uses.
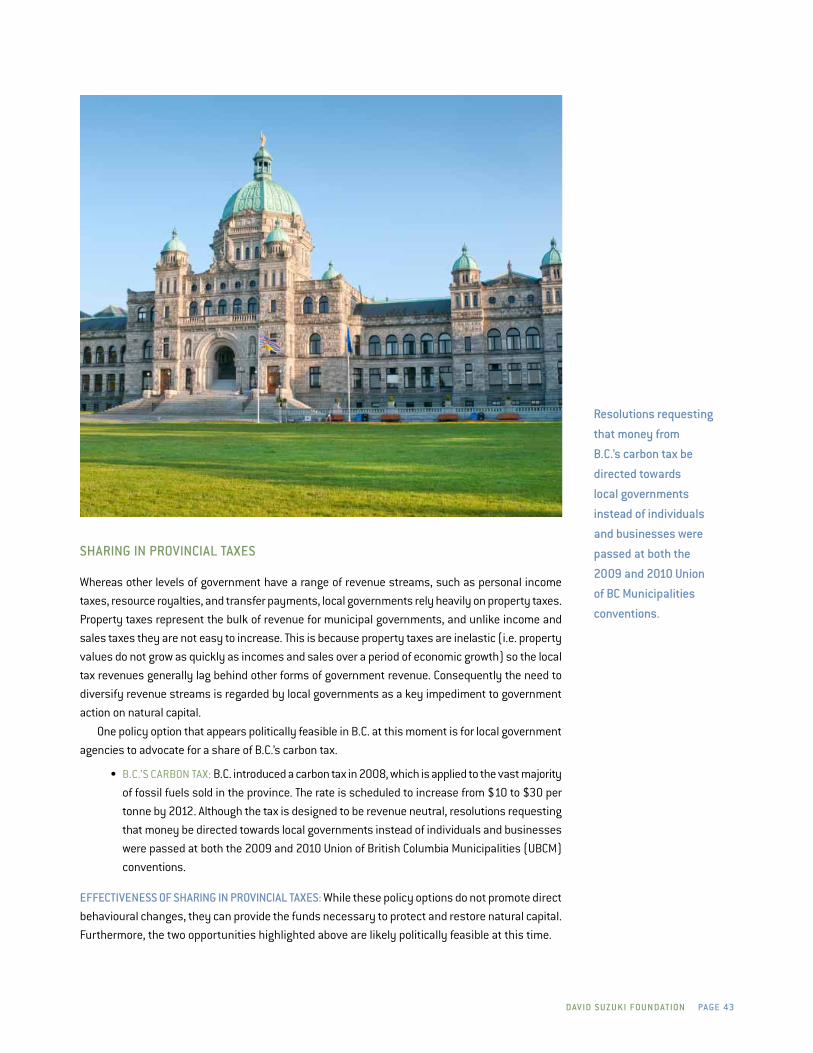
Dav iD s uzu ki fOu n DatiOn Page 43
sharing in PrOvinCiaL taxes
whereas other levels of government have a range of revenue streams, such as personal income
taxes, resource royalties, and transfer payments, local governments rely heavily on property taxes.
Property taxes represent the bulk of revenue for municipal governments, and unlike income and
sales taxes they are not easy to increase. this is because property taxes are inelastic (i.e. property
values do not grow as quickly as incomes and sales over a period of economic growth) so the local
tax revenues generally lag behind other forms of government revenue. Consequently the need to
diversify revenue streams is regarded by local governments as a key impediment to government
action on natural capital.
one policy option that appears politically feasible in B.C. at this moment is for local government
agencies to advocate for a share of B.C.’s carbon tax.
• B.C.’s CARBoN tAx: B.C. introduced a carbon tax in 2008, which is applied to the vast majority
of fossil fuels sold in the province. the rate is scheduled to increase from $10 to $30 per
tonne by 2012. Although the tax is designed to be revenue neutral, resolutions requesting
that money be directed towards local governments instead of individuals and businesses
were passed at both the 2009 and 2010 union of British Columbia Municipalities (uBCM)
conventions.
effeCtiveness Of sharing in PrOvinCiaL taxes: while these policy options do not promote direct
behavioural changes, they can provide the funds necessary to protect and restore natural capital.
furthermore, the two opportunities highlighted above are likely politically feasible at this time.
resolutions requesting
that money from
B.C.’s carbon tax be
directed towards
local governments
instead of individuals
and businesses were
passed at both the
2009 and 2010 union
of BC Municipalities
conventions.
Page 4 4 n at u r a L C a Pita L P OLi C y r e v ie W
2.3.2 BOnuses, fees anD Charges
Correcting price signals can be a very effective tool to protect natural capital, since price is proven to
be a strong motivator for behavioural change. Because participation is voluntary (i.e. you can chose not
to purchase an item or develop in a particular location), there is generally less resistance to changes
in price than equivalent changes in levels of taxation. in addition, fees and charges can bolster and
diversify local government revenues. these tools are most effective when government staff is properly
educated and enforcement mechanisms are well resourced.
Although fees, charges, and bonuses can be applied to a range of amenities and activities, three
key ones are addressed here, including density bonuses, development cost charges, and volumetric
pricing of utilities.
strengths:
• Changes in prices usually invoke quick responses in behaviour;
• Changes culture of local government over time;
• diversifies government revenues;
• Can be tailored to specific issues or ecological components; and
• opportunity for public education.
weaknesses:
• instances of the rebound effect9 could be observed;
• few opportunities for local governments to control prices; and
• Considerable information needed about ecosystem services to set appropriate fees, charges,
and subsidies.
Density BOnuses
local bylaws restrict the amount of floor space that a developer can build in a development. density
bonuses raise that amount in exchange for development that contributes to community priorities,
such as affordable housing, transit shelters, and parkland. By shifting some conservation costs onto
the development community, density bonuses send a price signal to the market, evoking developers
to factor environmental and social values into their business considerations.
density bonuses can prove to be an efficient use of government resources since they can acquire
ecologically sensitive areas with little or no direct cash outlay. in addition they invite stakeholders
to consider trade-offs between higher density and the preservation of nature, in effect adding an
educational element to the process.
effeCtiveness Of Density BOnuses: density bonuses have been used with success in urban areas
of B.C. they have rarely been used in rural areas, where densification goals are not generally met with
the same level of public approval. favourable market conditions and community acceptance of higher
development densities are necessary for a density bonusing system to be successful. As such, their
use should be targeted to developers operating in suitable communities and promoted to residents in
conjunction with educational programs.
9 the rebound effect refers to increased consumption that results from actions that increase efficiency and reduce consumer costs (uKeRC 2007). for example, an improvement in a vehicle’s fuel efficiency does not usually result in a proportional reduction in fuel use, because drivers of fuel efficient vehicles find that they can afford to drive more. As a result, they reinvest a portion of potential energy savings on comfort. the difference between the potential fuel savings and the actual savings is the Rebound effect.
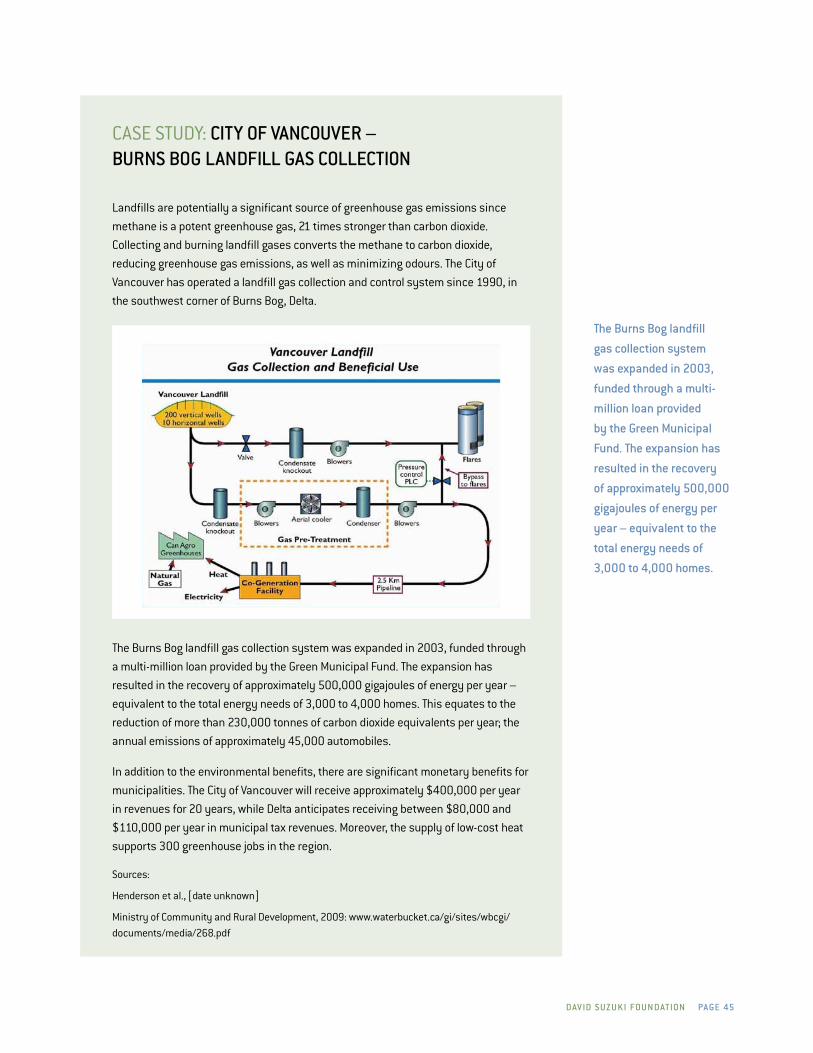
Dav iD s uzu ki fOu n DatiOn Page 45
CAse study: City Of vanCOuver – Burns BOg LanDfiLL gas COLLeCtiOn
landfills are potentially a significant source of greenhouse gas emissions since
methane is a potent greenhouse gas, 21 times stronger than carbon dioxide.
Collecting and burning landfill gases converts the methane to carbon dioxide,
reducing greenhouse gas emissions, as well as minimizing odours. the City of
vancouver has operated a landfill gas collection and control system since 1990, in
the southwest corner of Burns Bog, delta.
the Burns Bog landfill gas collection system was expanded in 2003, funded through
a multi-million loan provided by the Green Municipal fund. the expansion has
resulted in the recovery of approximately 500,000 gigajoules of energy per year –
equivalent to the total energy needs of 3,000 to 4,000 homes. this equates to the
reduction of more than 230,000 tonnes of carbon dioxide equivalents per year; the
annual emissions of approximately 45,000 automobiles.
in addition to the environmental benefits, there are significant monetary benefits for
municipalities. the City of vancouver will receive approximately $400,000 per year
in revenues for 20 years, while delta anticipates receiving between $80,000 and
$110,000 per year in municipal tax revenues. Moreover, the supply of low-cost heat
supports 300 greenhouse jobs in the region.
sources:
henderson et al., [date unknown]
Ministry of Community and Rural development, 2009: www.waterbucket.ca/gi/sites/wbcgi/documents/media/268.pdf
the Burns Bog landfill
gas collection system
was expanded in 2003,
funded through a multi-
million loan provided
by the green Municipal
fund. the expansion has
resulted in the recovery
of approximately 500,000
gigajoules of energy per
year – equivalent to the
total energy needs of
3,000 to 4,000 homes.
Page 4 6 n at u r a L C a Pita L P OLi C y r e v ie W
DeveLOPMent COst Charges
development cost charges (dCCs) are fees imposed on developers to offset the cost of providing
new infrastructure and services to new developments. for example, local government may need to
build new streets, sewer lines, and plan for waste collection in new subdivisions or business parks.
these fees can be waived or reduced for developments designed to have a low-environmental impact
(local Government Act, section 933.1).
it is uncertain what can and should be included in the scope of dCCs. while it is clear that the
capital costs of infrastructure and amenities require compensation, it is unclear if on-going operating
costs can be accounted for or if environmental costs should be internalized in dCCs. the provincial
government could assist local governments in this respect by providing greater flexibility, as well
as guidance, on determining dCCs that reflect the true cost of development. in addition, dCCs could
be used to compensate for impacts to natural capital.
some workshop participants suggested that dCCs may spur urban sprawl since they are
calculated on a per-unit or per-square-foot basis regardless of the location of the development. this
could create a perverse incentive for local governments to approve development that would not
otherwise be approved due to the revenues generated by dCCs. however, a recent survey of local
government leaders (fletcher and McArthur 2010), found that dCCs accounted for, on average, one
per cent of total revenues.
effeCtiveness Of DCCs: while workshop participants felt dCCs were not a preferable policy option
for the protection or restoration of natural capital, they have proven effective in communities like
ottawa, where different rates are used inside and outside the regional greenbelt (Blais, 2010). in
addition to the introduction of differentiated rates, a method of full cost accounting developed and
mandated through the Local Government Act could increase the effectiveness of this policy.
vOLuMetriC PriCing fOr utiLities
volumetric pricing of utilities refers to charging for utilities based upon the amount used. several
options are available to structure pricing. Progressive rate structures are popular as they ensure
low-income residents are not unfairly impacted. Pay as you throw systems have been implemented
in over 200 communities across Canada for waste removal (Kelleher et al. 2005). B.C. hydro employs
a two-tiered rate structure, and metering is increasingly used in water pricing.
Price signals act as indicators of environmental impact and generate public awareness about the
impacts of household consumption choices. And unlike most environmental policies, the significance
of individual or household level actions is apparent.
utility pricing can also be a much-needed source of additional revenues for local government.
After property taxes, the sales of services (including utilities) are the next largest source of locally
generated revenues for regional and municipal governments. Given that few utilities are priced in
this manner, significant opportunities exist for increasing revenues by expanding this policy.
effeCtiveness Of vOLuMetriC PriCing Of utiLities: volumetric pricing can be very effective.
for example, a report by environment Canada (2008) found that since 1991 residential water
consumption has been consistently “70 to 80 per cent higher nationally when under flat rates than under volume-based rates” and pay-as-you-throw systems has reduced garbage volume by 8 to
38 per cent(Kelleher et al. 2005). however such policies can go even further by incorporating full
cost accounting in order to recognize the full financial and environmental costs of service provision.
lastly, utility-pricing structures must ensure they do not disadvantage low-income residents.
While it is clear
that the capital costs
of infrastructure and
amenities require
compensation, it is unclear
if on-going operating
costs can be accounted
for or if environmental
costs should be
internalized in DCCs.
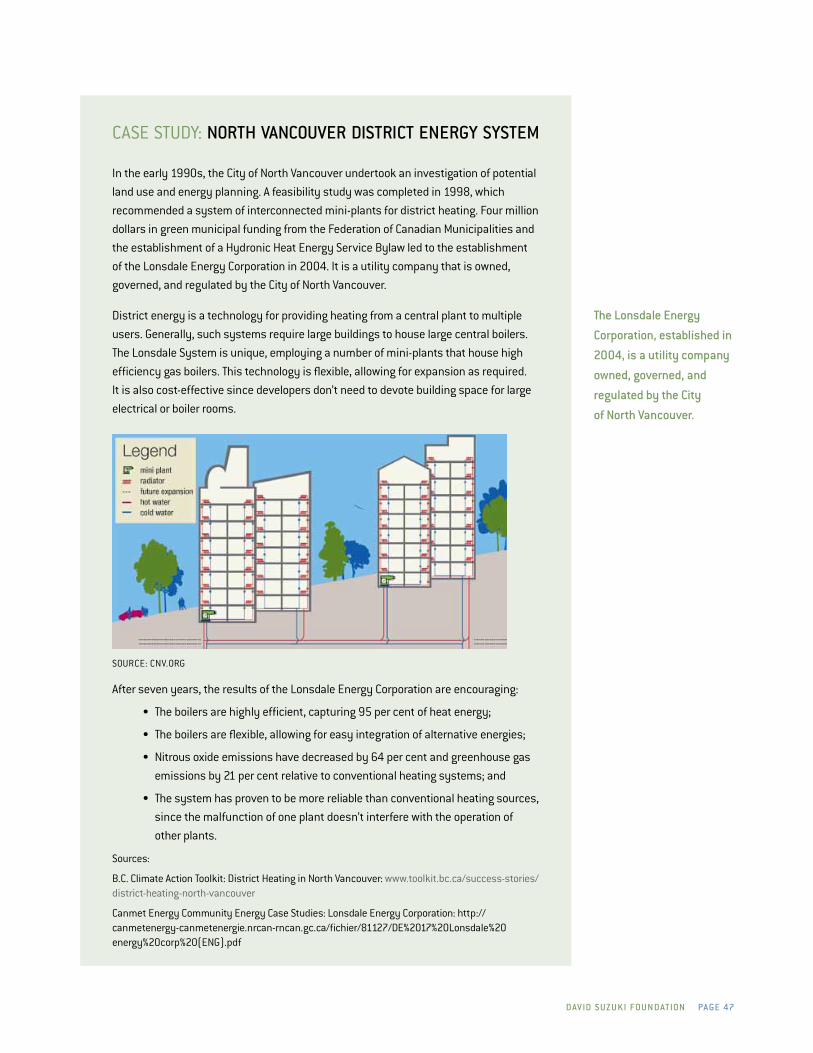
Dav iD s uzu ki fOu n DatiOn Page 47
CAse study: nOrth vanCOuver DistriCt energy systeM
in the early 1990s, the City of North vancouver undertook an investigation of potential
land use and energy planning. A feasibility study was completed in 1998, which
recommended a system of interconnected mini-plants for district heating. four million
dollars in green municipal funding from the federation of Canadian Municipalities and
the establishment of a hydronic heat energy service Bylaw led to the establishment
of the lonsdale energy Corporation in 2004. it is a utility company that is owned,
governed, and regulated by the City of North vancouver.
district energy is a technology for providing heating from a central plant to multiple
users. Generally, such systems require large buildings to house large central boilers.
the lonsdale system is unique, employing a number of mini-plants that house high
efficiency gas boilers. this technology is flexible, allowing for expansion as required.
it is also cost-effective since developers don’t need to devote building space for large
electrical or boiler rooms.
souRCe: CNv.oRG
After seven years, the results of the lonsdale energy Corporation are encouraging:
• the boilers are highly efficient, capturing 95 per cent of heat energy;
• the boilers are flexible, allowing for easy integration of alternative energies;
• Nitrous oxide emissions have decreased by 64 per cent and greenhouse gas
emissions by 21 per cent relative to conventional heating systems; and
• the system has proven to be more reliable than conventional heating sources,
since the malfunction of one plant doesn’t interfere with the operation of
other plants.
sources:
B.C. Climate Action toolkit: district heating in North vancouver: www.toolkit.bc.ca/success-stories/district-heating-north-vancouver
Canmet energy Community energy Case studies: lonsdale energy Corporation: http://canmetenergy-canmetenergie.nrcan-rncan.gc.ca/fichier/81127/de%2017%20lonsdale%20energy%20corp%20(eNG).pdf
the Lonsdale energy
Corporation, established in
2004, is a utility company
owned, governed, and
regulated by the City
of north vancouver.

Page 48 n at u r a L C a Pita L P OLi C y r e v ie W
2.3.3 suBsiDy refOrM
subsidies come in a variety of forms, including direct transfers of funds, income or price support,
tax credits, exemptions and rebates, low-interest loans and guarantees, preferential treatment, and
use of regulatory support mechanisms. implicit income transfers occur when natural resources or
services are not priced at full provisioning costs (teeB 2010).
the removal of perverse subsidies can be a low-cost alternative for environmental and financial
improvements. At the local government level, road construction and maintenance, subsidized by
property taxes, represent what many consider the most significant subsidy. Restructuring this
subsidy to increase the portion drivers pay towards road maintenance will provide a negative
incentive for car travel. such a change to road pricing could bring about large greenhouse gas
reductions, lower demand for new road construction, and reinforce densification policies. savings
from the reduction of road subsidies can be reinvested into environmental programs. At the local
level, subsidies to support public transit are greatly needed.
effeCtiveness Of suBsiDy refOrM: Road and bridge tolls have met with mixed success. while
they are politically unpopular, they appear to be effective at reducing traffic. for example, the london
congestion charge, introduced in 2003 and extended in 2007, met with a 25 per cent reduction in
traffic levels on the first day (Albalate and Bel, 2008). A 2007 follow-up report found traffic levels
in the Zone were consistently 16 per cent lower in 2006 than pre-charge levels in 2002 (transport
for london, 2007).
2.3.4 Creating Markets
the final group of policies to protect and restore natural capital and ecosystem services involve
the creation of markets. the use of environmental taxes, charges, and subsidies assumes that
governments have sufficient information to set an effective tax rate, which is exceedingly difficult
with ecosystem services. these difficulties are heightened when differences in ecosystem services
require governments to apply a different tax, fee, or subsidy at every site. Regulation faces similar
problems, since governments need considerable information to design effective rules. in contrast,
under certain conditions, creating markets for ecosystem services can improve societal well-being
even under incomplete information.
three market tools are viable at the local level: valuation and payments for ecosystem services;
tradable development credits; and labelling or certification schemes.
strengths:
• does not require perfect knowledge of natural capital and ecosystem services in a region;
• Promotes innovation; and
• A monetary value is established for natural capital and ecosystem services.
weaknesses:
• large transaction costs;
• inefficient when there are few buyers and sellers;
• unable to use when ownership cannot be defined and enforced; and
• unable to use when there is uncertainty about the attributes of natural capital and
ecosystem services.
at the local government
level, road construction
and maintenance,
subsidized by property
taxes, represent what
most consider the most
significant subsidy.

Dav iD s uzu ki fOu n DatiOn Page 49
PayMents fOr eCOsysteM serviCes
valuing the environment in monetary terms is difficult and often controversial. several reviews have examined
different valuation methods and the limitations of their applications (ledoux and turner 2002, farber et
al. 2002). it has been argued, however, that these values are capable of highlighting the importance of
natural capital and ecosystem services, provided they are placed in the appropriate context. when monet-
ary valuations are coupled with qualitative descriptions and a clear articulation of the limitations of these
studies, valuations can clearly provide a positive contribution to policy discussions. in the end, it must be
kept in mind that they should be regarded as one tool among many that are available to decision makers.
At the federal level, the Alternative land use services (Alus) is a National farm stewardship program
that provides financial assistance to farmers who implement management practices to protect ecosystem
services. the financial incentives offered to farmers help to offset the costs of implementing the manage-
ment practices. to qualify for the grant, farmers are required to have an environmental farm Plan in place
and management practices must be approved by Agriculture and Agri-food Canada. Pilots of the program
have met with success. ecologically valuable portions of land have been protected, such as riparian buffer
zones, for a cost that was less than expected.
At the local level, payments for ecosystem services are uncommon but evidence shows that they may
not be far away. A B.C. court ordered the municipality of surrey to pay farmers close to $50 million when
agricultural lands were flooded by runoff from urbanization (Curran, 2008).
effeCtiveness Of vaLuatiOn anD PayMents fOr eCOsysteM serviCes: while it is difficult to predict
if payments for natural capital and ecosystem services will take root at the local level, the valuation of
ecosystem services was overwhelmingly supported by interview and workshop participants. they expressed
that valuations were needed to justify the preservation of natural capital to council.
traDaBLe Offsets: traDaBLe DeveLOPMent CreDits
tradable development rights are another form of market creation that can be utilized to protect and restore
natural capital and ecosystem services. in this case, a market is created that allows the sale and transfer
of development rights from a particular parcel of land to other properties. Rights are sold from lands to be
protected and bought for lands to be developed. further use of the sold land is protected through conservation
covenants or deeds prohibiting development.
Communities seeking to implement a tradable development Credit program will need to:
• develop background studies that identify natural capital and ecosystem service areas of significance;
• Perform a real estate market assessment to determine how the credit market would interface with
a local real estate market;
• implement a standardized methodology at the regional level for such assessments;
• develop an education program to engage local citizens; and
• determine the number of permits to be allocated, whether the rights are held for a fixed period or
in perpetuity, and what rules govern trade.
effeCtiveness Of traDaBLe DeveLOPMent CreDits: Although tradable development Credit programs
have been used extensively in the us with mixed results, there are no provinces with legislation that
explicitly enables these programs. early adopters will face some level of uncertainty. it is theorized that
credit programs will work best in conjunction with zoning and other regulatory mechanisms to protect
natural capital and ecosystem services.
Page 50 n at u r a L C a Pita L P OLi C y r e v ie W
CreatiOn Of niChe Markets: LaBeLLing Or CertifiCatiOn
Certification schemes have exploded in recent years, expanding from organic labelling to include
items ranging from beauty products to carpeting. they have emerged as a significant and innovative
venue for standard setting, environmental governance, and consumer education.
Green building is gaining popularity in Canada. in addition to environmental benefits such as
reduced waste, storm water flow reduction, improvements in air quality, and reduction in urban heat
island effect, green buildings make economic sense as well. these types of buildings have higher
productivity, longer life cycles, lower long-term operating costs, and higher property values. these
benefits often outweigh the additional costs incurred in the development and construction phases.
As such, municipalities are beginning to implement policies to encourage green building practices
and compliance with green building standards. for example, the district of ucluelet offers developers
a 5 per cent density bonus if they choose to build developments that comply with leadership in
energy and environmental design (leed).
effeCtiveness Of CertifiCatiOn sCheMes: Certification schemes have become very popular.
when certifications are backed by sound science and strong criteria they can be very effective
in reducing damage to natural capital and ecosystem services, as well as educating the public.
drawbacks include green washing, the flooding of certification schemes causing public confusion,
and high third party costs for certification. innovative solutions are emerging to address these
challenges however. for example, the ‘whistler Green’ building policy was developed by drawing on
leed, while avoiding the third party costs of leed.
CAse study: seattLe’s transferaBLe DeveLOPMent rights PrOgraM
seattle, washington’s transferable development Rights Program was created in 1985.
it is an initiative designed to preserve and rehabilitate affordable housing in the city’s
downtown core. the program allows the transfer of unused development rights from
lower density low-income housing in the downtown area to proposed commercial
projects located within targeted downtown zoning categories. the transfer allows the
buyer to build at a floor area ratio above the maximum in that zone. in the process,
funds are generated from the sale of development rights and are used to rehabilitate
low-income housing, as well as support the construction of new affordable housing.
since the inception of the program, 559 units in the downtown core have been
preserved and/or rehabilitated, and the program has recently been reconfigured to
create an additional 900 units. the city has generated $1.5 million from the sale of
development rights. development rights sold for $115 – $145 CAN per square meter
in the 1990s.
sources:
Canadian Mortgage and housing Corporation: Retaining Affordable housing: www.cmhc-schl.gc.ca/en/inpr/afhoce/tore/afhoid/pore/reafho/reafho_005.cfm#full

Dav iD s uzu ki fOu n DatiOn Page 51
tO avOiD irreversiBLe DaMage tO eCOsysteMs and their associated services, we must change
the way we use and think about them. fortunately, we have the knowledge, technology, and
tools to make such changes. we have an opportunity to develop the groundwork for policies and
programs that strive to manage our ecosystems in a manner that fosters their resilience in the face
of increasing pressures.
the following three policy options are derived from sections one and two. they strive to address
the drivers of loss to ecosystems, the unique circumstances facing B.C. municipalities, and incorpor-
ate the most promising policy tools. following the policy descriptions, the criteria for weighing the
strength of each option is presented, accompanied by an explanation of how the criteria is measured.
Next, the policy options are weighed against one another using the criteria. the section ends with
a discussion of the results and recommendations.
3.1 Policy options3.1.1 POLiCy OPtiOn #1: naturaL CaPitaL aCCOunts
this policy option represents the vital first step in managing natural capital – measuring it. Relative
to other forms of capital, ecosystem capital is poorly understood, scarcely monitored, and in many
cases undergoing rapid degradation and depletion. decision-making that is based on an incomplete
set of natural capital measures may lead to decisions that threaten a community’s sustainability
and ultimately, its well being. By taking stock of our resources and the services they provide, and
by assigning them value, we can set the stage for an informed discussion about how to balance
economic development with a healthy environment.
s eCtiOn 3
Policy AnalysisWe have an opportunity to
develop the groundwork
for policies and programs
that strive to manage our
ecosystems in a manner that
fosters their resilience in the
face of increasing pressures.
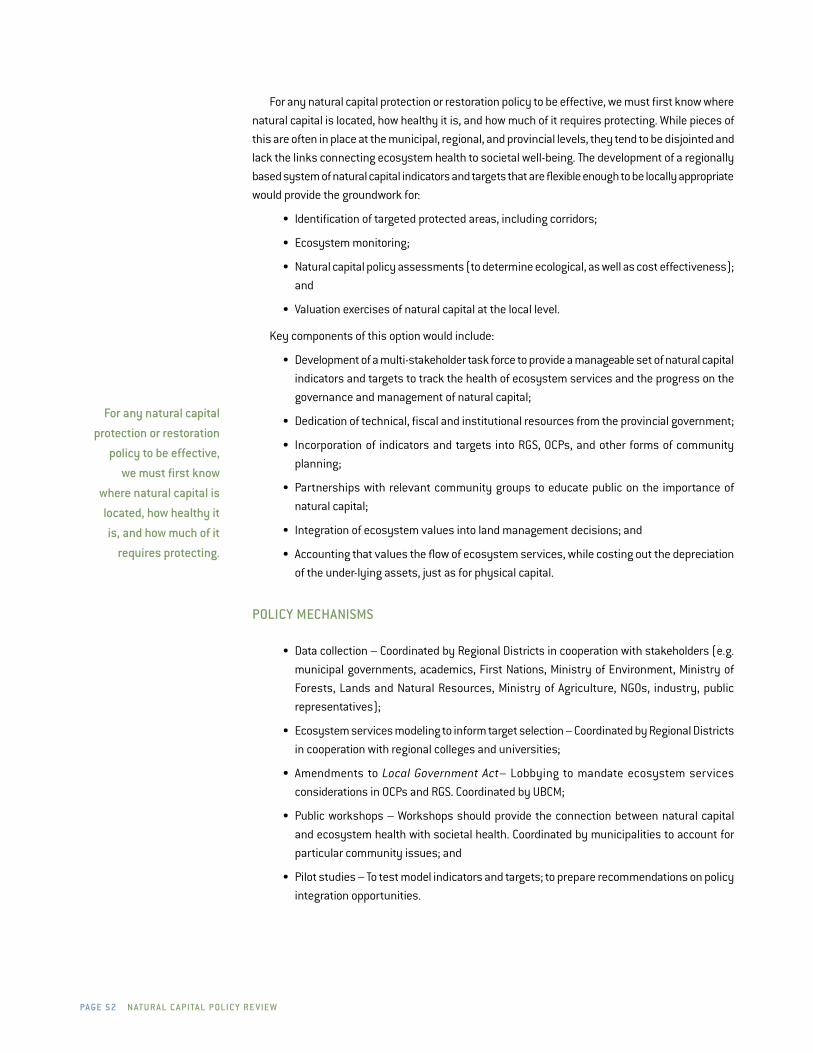
Page 52 n at u r a L C a Pita L P OLi C y r e v ie W
for any natural capital protection or restoration policy to be effective, we must first know where
natural capital is located, how healthy it is, and how much of it requires protecting. while pieces of
this are often in place at the municipal, regional, and provincial levels, they tend to be disjointed and
lack the links connecting ecosystem health to societal well-being. the development of a regionally
based system of natural capital indicators and targets that are flexible enough to be locally appropriate
would provide the groundwork for:
• identification of targeted protected areas, including corridors;
• ecosystem monitoring;
• Natural capital policy assessments (to determine ecological, as well as cost effectiveness);
and
• valuation exercises of natural capital at the local level.
Key components of this option would include:
• development of a multi-stakeholder task force to provide a manageable set of natural capital
indicators and targets to track the health of ecosystem services and the progress on the
governance and management of natural capital;
• dedication of technical, fiscal and institutional resources from the provincial government;
• incorporation of indicators and targets into RGs, oCPs, and other forms of community
planning;
• Partnerships with relevant community groups to educate public on the importance of
natural capital;
• integration of ecosystem values into land management decisions; and
• Accounting that values the flow of ecosystem services, while costing out the depreciation
of the under-lying assets, just as for physical capital.
POLiCy MeChanisMs
• data collection – Coordinated by Regional districts in cooperation with stakeholders (e.g.
municipal governments, academics, first Nations, Ministry of environment, Ministry of
forests, lands and Natural Resources, Ministry of Agriculture, NGos, industry, public
representatives);
• ecosystem services modeling to inform target selection – Coordinated by Regional districts
in cooperation with regional colleges and universities;
• Amendments to Local Government Act– lobbying to mandate ecosystem services
considerations in oCPs and RGs. Coordinated by uBCM;
• Public workshops – workshops should provide the connection between natural capital
and ecosystem health with societal health. Coordinated by municipalities to account for
particular community issues; and
• Pilot studies – to test model indicators and targets; to prepare recommendations on policy
integration opportunities.
for any natural capital
protection or restoration
policy to be effective,
we must first know
where natural capital is
located, how healthy it
is, and how much of it
requires protecting.
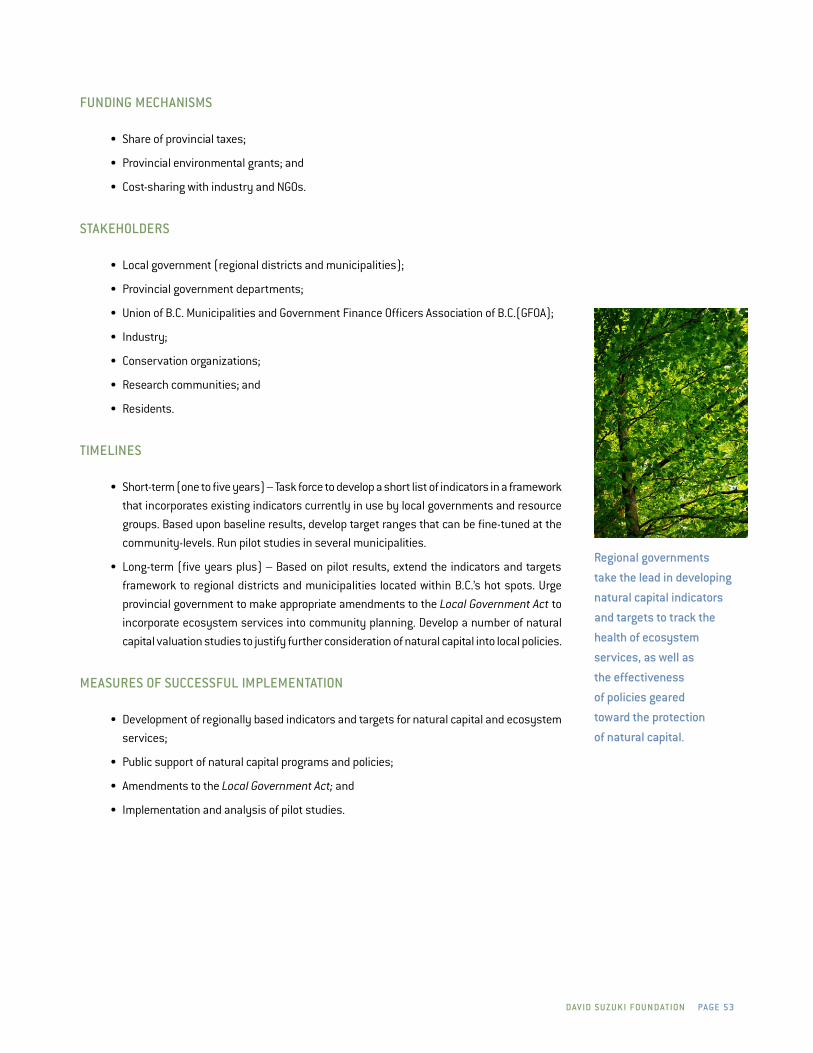
Dav iD s uzu ki fOu n DatiOn Page 53
funDing MeChanisMs
• share of provincial taxes;
• Provincial environmental grants; and
• Cost-sharing with industry and NGos.
stakehOLDers
• local government (regional districts and municipalities);
• Provincial government departments;
• union of B.C. Municipalities and Government finance officers Association of B.C.(GfoA);
• industry;
• Conservation organizations;
• Research communities; and
• Residents.
tiMeLines
• short-term (one to five years) – task force to develop a short list of indicators in a framework
that incorporates existing indicators currently in use by local governments and resource
groups. Based upon baseline results, develop target ranges that can be fine-tuned at the
community-levels. Run pilot studies in several municipalities.
• long-term (five years plus) – Based on pilot results, extend the indicators and targets
framework to regional districts and municipalities located within B.C.’s hot spots. urge
provincial government to make appropriate amendments to the Local Government Act to
incorporate ecosystem services into community planning. develop a number of natural
capital valuation studies to justify further consideration of natural capital into local policies.
Measures Of suCCessfuL iMPLeMentatiOn
• development of regionally based indicators and targets for natural capital and ecosystem
services;
• Public support of natural capital programs and policies;
• Amendments to the Local Government Act; and
• implementation and analysis of pilot studies.
regional governments
take the lead in developing
natural capital indicators
and targets to track the
health of ecosystem
services, as well as
the effectiveness
of policies geared
toward the protection
of natural capital.

Page 54 n at u r a L C a Pita L P OLi C y r e v ie W
3.1.2 POLiCy OPtiOn #2: COnneCting Our PrOteCteD areas
Regional districts and municipalities in the provincial hot spots identified in this report must act
quickly to secure their remaining natural capital and associated ecosystem services. Projected
population growth and accompanying development pressures throughout the region reinforce the
urgency of this message.
this policy option calls for regional governments to work with municipalities to develop a network
of protected natural spaces and corridors around cities, while building or maintaining stocks of
natural capital within cities (i.e. parks, rivers, wetlands, private gardens). the underlying goal of this
option is to protect, restore and preserve the connections existing within and across ecosystems.
Key components of the regional protected areas strategy include:
• identification of priority natural capital assets, ecosystem services, wildlife corridors, and
associated land classes for protection (note: this should flow from policy option #1);
• exploration of policy tools to promote linked networks of protected areas (as opposed to
individual sites);
• exploration of funding mechanisms for various components of the network, including free
Crown Grant program, market-based revenue alternatives, and continued uBCM pressure
for share of Carbon tax;
• development and promotion of incentives for citizens to protect natural capital and
ecosystem services on private land, including the creation of green spaces (e.g. rooftop
gardens, water harvesting, community gardens); and
• tap into existing partnerships with stewardship groups and nongovernmental organiza-
tions to educate public on the importance of natural capital and how they can support this
initiative.
POLiCy MeChanisMs
• data collection – led by Protected Areas Coordinator (1 fte/Regional district). Based upon
results of policy option 1, gather and analyze information on priority areas of protection,
policy options, legislative requirements, and funding mechanisms to implement a system
of protected areas within the region;
• Report – Prepare a report of findings and recommendations to be presented to regional
and municipal councils;
• Public outreach – information sessions, social networking, and public events held to
educate public on the connection between natural capital and societal health. Coordinated
by municipalities to account for particular community issues;
• expert and government workshops – Gather information as needed to build awareness
and support amongst government agencies and various constituencies within their
communities; and
• lobby for Carbon tax revenues be redirected toward local green initiatives.
regional districts
and municipalities in
the provincial hot spots
identified in this report
must act quickly to secure
their remaining natural
capital and associated
ecosystem services.
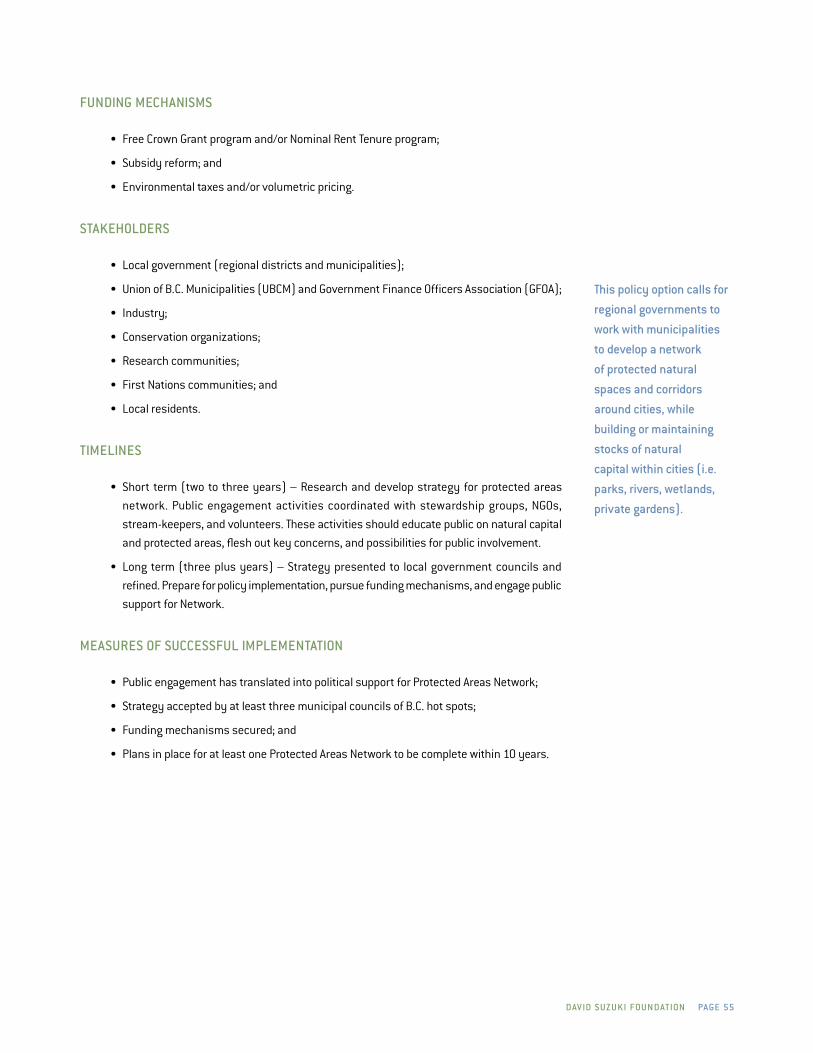
Dav iD s uzu ki fOu n DatiOn Page 55
funDing MeChanisMs
• free Crown Grant program and/or Nominal Rent tenure program;
• subsidy reform; and
• environmental taxes and/or volumetric pricing.
stakehOLDers
• local government (regional districts and municipalities);
• union of B.C. Municipalities (uBCM) and Government finance officers Association (GfoA);
• industry;
• Conservation organizations;
• Research communities;
• first Nations communities; and
• local residents.
tiMeLines
• short term (two to three years) – Research and develop strategy for protected areas
network. Public engagement activities coordinated with stewardship groups, NGos,
stream-keepers, and volunteers. these activities should educate public on natural capital
and protected areas, flesh out key concerns, and possibilities for public involvement.
• long term (three plus years) – strategy presented to local government councils and
refined. Prepare for policy implementation, pursue funding mechanisms, and engage public
support for Network.
Measures Of suCCessfuL iMPLeMentatiOn
• Public engagement has translated into political support for Protected Areas Network;
• strategy accepted by at least three municipal councils of B.C. hot spots;
• funding mechanisms secured; and
• Plans in place for at least one Protected Areas Network to be complete within 10 years.
this policy option calls for
regional governments to
work with municipalities
to develop a network
of protected natural
spaces and corridors
around cities, while
building or maintaining
stocks of natural
capital within cities (i.e.
parks, rivers, wetlands,
private gardens).

Page 56 n at u r a L C a Pita L P OLi C y r e v ie W
3.1.3 POLiCy OPtiOn #3: MainstreaMing eCOsysteM serviCes
the current infrastructure gap presents local governments with a significant opportunity to build com-
munities that are greener and work better. Governments are now contemplating how to satisfy their
community’s infrastructure needs in ways that incur the least cost and provide the most benefits over
time. they are also coping with how to protect and restore nature in their communities. integrating
the value of natural capital into decision-making related to these sorts of community development
discussions is a prudent method to address many of the challenges municipalities are facing.
this policy options calls upon decision makers to deliberately take into account the connections
between how they grow their community and the health of both the ecosystems and residents that
call it home. this requires explicit accounting of the impact of proposed development strategies on
the community’s natural capital. entry points for incorporating ecosystem services into existing
processes occur at all levels of government, from procurement policies to land use planning.
Key components of this option include:
• valuation of ecosystem services within the provinces’ hot spots. valuations need to be
reviewed to isolate natural capital assets and provide monetary findings of relevance to
each municipality.
• development of new decision-making guidelines that incorporate full cost accounting into
all land use decision making, such as, oCPs, and zoning bylaws. (this should include the
monetary damage of the degradation of ecological services due to development.)
• identification of policies that will be impacted by new development decision-making
guidelines.
• staff training on new decision-making guidelines and how to apply natural capital valuation
to decision-making.
• lobby for changes to environmental impact assessments (eiAs) to include an ecosystem
services component that would assign dollar values to the benefits derived from these
actions.
POLiCy MeChanisMs
• data collection – Gather and analyze information on natural capital valuations (tied into
database developed in policy option #1).
• Preparation of revised guidance documents – Amend existing planning and accounting
policies and documents to incorporate consideration for ecosystem services. Provide
guidance on impacts this will have in terms of staffing expertise, time frames, and impacts
upon related departments and policies (e.g. NC depreciation guidelines).
• incentives for developers – introduce incentives such as cluster zoning, performance
bonds, and green building standards to generate support from the development community.
• density-based property taxation – would provide an incentive for residents and property
managers to embrace compact communities.
• Adaptive management – Policy is reviewed every five years to incorporate new information,
methodologies and procedures.
governments are now
contemplating how to
satisfy their community’s
infrastructure needs in
ways that incur the least
cost and provide the
most benefits over time.
Dav iD s uzu ki fOu n DatiOn Page 57
funDing MeChanisMs
• density-based property taxation;
• environmental taxes and/or volumetric pricing; and
• Provincial infrastructure grants.
stakehOLDers
• local government (regional districts and municipalities);
• developers;
• uBCM;
• local residents;
• Conservation organizations; and
• Research communities.
tiMeLines
• short term (two to five years) – within three years, municipalities obtain relevant staff-
ing expertise to provide guidance of natural capital values for municipality and amend
decision-making guidelines. they can also develop policy incentives for developers and
residents. within five years, municipalities can expect changes to eiAs due to coordinated
lobbying efforts.
• long term (five plus years) – density-based property taxation can be introduced and an
adaptation plan completed.
Measures Of suCCessfuL iMPLeMentatiOn
• full cost accounting adopted by municipal council;
• increase in green infrastructure throughout city;
• Reduction in the infrastructure gap; and
• developers understand and accept new decision-making guidelines.
entry points for
incorporating ecosystem
services into existing
processes occur at all
levels of government,
from procurement policies
to land use planning.

Page 58 n at u r a L C a Pita L P OLi C y r e v ie W

Dav iD s uzu ki fOu n DatiOn Page 59
3.2 Policy Criteria
the above policies will be assessed against the following criteria and measures:
tABle 1: PoliCy CRiteRiA
Criteria Considerations Measure(s)
Political viability
does the decision maker have the political capital to undertake a major initiative?
does the public understand the issue and support action to address it?
what is the range of interests that would be affected?
high/medium/low
Based on how easily policy option ties into mainstream issues (workshop feedback) and range of interests affected
economic viabilityis the policy cost-effective for society as a whole?
for those who must change their behaviour?
high/medium/low
Based on relative cost of policy components
effectiveness
does the policy force action that is capable of modifying the direct and indirect drivers of ecosystem change?
is it possible to set an incentive such as a tax credit at the appropriate level to change behavior?
Can the results of the policy be measured and used for accountability and to change course as appropriate?
high/medium/low
Based on ability to address drivers of ecosystem change; availability of incentives; and degree of accountability
equity
is the outcome fair to all stakeholders?
if there are “losers” under the policy, how will they be compensated?
high/medium/low
Based on proportion of winners to losers, and availability of compensation options
institutional capacity
is adequate capacity and funding in government and other participating groups available to implement the policy?
if the policy requires working across scales and/or sectors, is there a mechanism to do so, or can one be created?
high/medium/low
Based on amount of resources required to carry out policy option (fte staffing needs, funding), and level of inter-governmental work
source: Adapted from world Resources institute. ecosystem services: A Guide for decision Makers
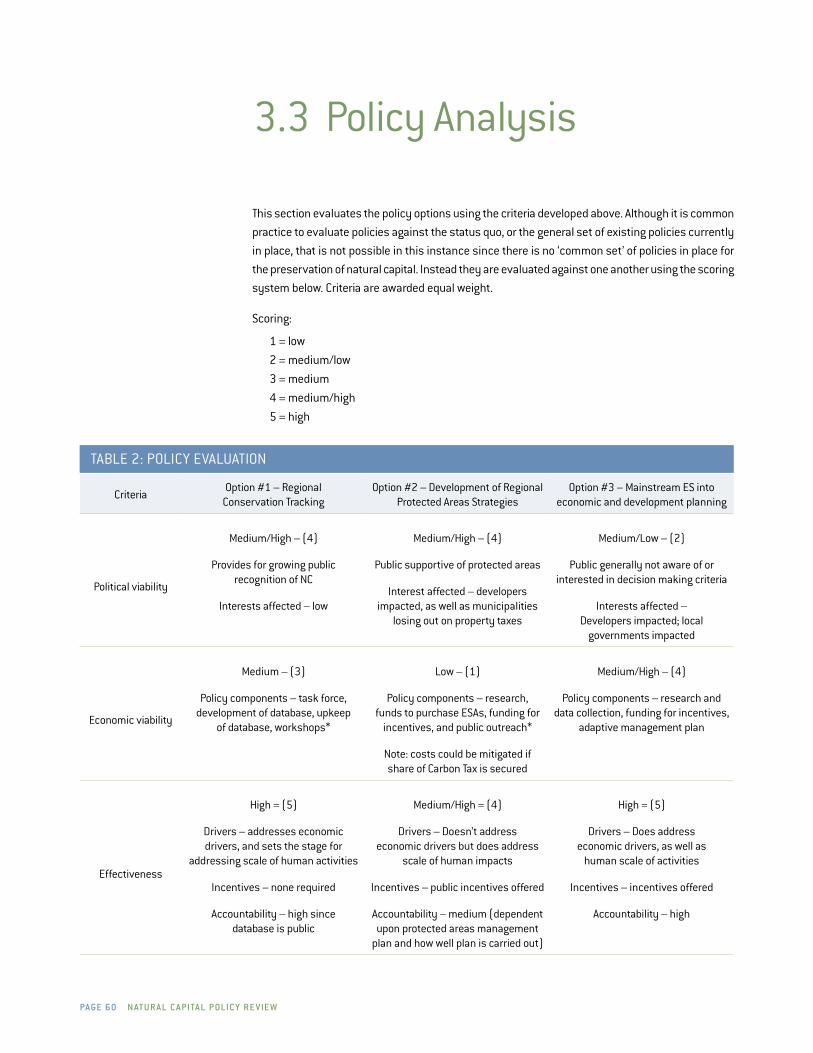
Page 60 n at u r a L C a Pita L P OLi C y r e v ie W
Criteriaoption #1 – Regional
Conservation trackingoption #2 – development of Regional
Protected Areas strategiesoption #3 – Mainstream es into
economic and development planning
Political viability
Medium/high – (4)
Provides for growing public recognition of NC
interests affected – low
Medium/high – (4)
Public supportive of protected areas
interest affected – developers impacted, as well as municipalities
losing out on property taxes
Medium/low – (2)
Public generally not aware of or interested in decision making criteria
interests affected – developers impacted; local
governments impacted
economic viability
Medium – (3)
Policy components – task force, development of database, upkeep
of database, workshops*
low – (1)
Policy components – research, funds to purchase esAs, funding for
incentives, and public outreach*
Note: costs could be mitigated if share of Carbon tax is secured
Medium/high – (4)
Policy components – research and data collection, funding for incentives,
adaptive management plan
effectiveness
high = (5)
drivers – addresses economic drivers, and sets the stage for
addressing scale of human activities
incentives – none required
Accountability – high since database is public
Medium/high = (4)
drivers – doesn’t address economic drivers but does address
scale of human impacts
incentives – public incentives offered
Accountability – medium (dependent upon protected areas management
plan and how well plan is carried out)
high = (5)
drivers – does address economic drivers, as well as
human scale of activities
incentives – incentives offered
Accountability – high
3.3 Policy Analysis
this section evaluates the policy options using the criteria developed above. Although it is common
practice to evaluate policies against the status quo, or the general set of existing policies currently
in place, that is not possible in this instance since there is no ‘common set’ of policies in place for
the preservation of natural capital. instead they are evaluated against one another using the scoring
system below. Criteria are awarded equal weight.
scoring:
1 = low
2 = medium/low
3 = medium
4 = medium/high
5 = high
tABle 2: PoliCy evAluAtioN

Dav iD s uzu ki fOu n DatiOn Page 61
Criteriaoption #1 – Regional
Conservation trackingoption #2 – development of Regional
Protected Areas strategiesoption #3 – Mainstream es into
economic and development planning
equity
high = (5)
Ratio of w:l – few who lose with this option (municipalities who
must change indicators)
Compensation? – Not Applicable
Medium = (3)
Ratio of w:l – development community lose in short-term,
public and future generations win
Compensation? – None
Medium/high = (4)
Ratio of w:l – development community loses some opportunities;
significant changes for municipal agencies but public and future
generations win and government wins by being more cost effective
Compensation? – yes for developers and public
institutional capacity
Medium/low = (2)
Resources – high staffing and funding needs
levels of government involved – high (provincial/regional/ municipal)
low (1)
Resources – some staffing needs and high funding needs
levels of government involved – high (provincial/regional/ municipal)
Medium/high = (4)
Resources – some staffing and funding needs
levels of government involved – medium (municipally focused but will draw in regional and provincial
governments somewhat)
total 19 13 19
* Can tap into partnerships to reduce policy costs

Page 62 n at u r a L C a Pita L P OLi C y r e v ie W
Dav iD s uzu ki fOu n DatiOn Page 63
3.4 Recommendations and Conclusions
in the COurse Of researChing this rePOrt, it became apparent that there is no single policy
or group of policies that will be a perfect fit for all of B.C.’s hot spot regions and municipalities. Com-
munities displayed a considerable range of responses regarding threatened areas, public attitudes,
government budget, capacity, and leadership. this is in addition to wide variances in the number
and type of policies that have already been implemented to protect and restore natural capital. A
number of policy gaps did emerge, however. the policy options were designed to address these.
• POLiCy OPtiOn #1: Regional Conservation tracking would address the most critical gap
in local efforts to protect natural capital. the lack of knowledge regarding the extent and
quality of our natural assets within each community is crippling the ability to respond
effectively. this option scored high in the previous section (19 out of a possible 25 points).
the biggest hurdle to implementation will be institutional capacity. effort should be focused
on building capacity within and across local governments to incorporate this option into
existing mandates.
• POLiCy OPtiOn #2: development of a Regional Protected Areas strategy would address
the prominent coarse-scale issues that were identified in this report, particularly the need
for governments to work together to incorporate connectivity into natural capital planning.
while this option scored lowest in the assessment, due to the high costs associated with
securing and maintaining protected areas, these costs can be offset by programs such
as the free Crown Grant program or by allocating monies from the provincial Carbon tax.
• POLiCy OPtiOn #3: Mainstreaming ecosystem services into economic and development
planning would address finer scale issues that were identified through research. it ranked
high on the policy assessment, together with option #1. the largest barrier identified was
political viability, since it would require considerable thought and effort to effectively gener-
ate awareness and support for protecting and restoring natural capital. framing would need
to focus on the message that this is something that is coming at a large scale eventually,
with local governments leading the way.
the ideal method for the implementation of these policies would likely differ with each com-
munity. Generally speaking, options one and three can quickly be operationalized, while option
two would take more time to implement. the bottom line is that there are no easy policy solutions,
particularly for B.C.’s hot spots. there are, however, a range of innovative policies and funding
mechanisms to draw on.
the bottom line is that there
are no easy policy solutions,
particularly for B.C.’s hot spots.
there are, however, a range of
innovative policies and funding
mechanisms to draw on.

Page 64 n at u r a L C a Pita L P OLi C y r e v ie W
References
Advanced conservation strategies. “environmental Performance Bonds – insurance Contracts.” www.advancedconservation.org/blog/?page_id=59 (accessed May 17, 2010).
Agricultural land Commission (AlC). “AlR and Community Planning Guidelines.” www.alc.gov.bc.ca/publications/Community_Planning_Guidelinescolour.pdf (accessed January 26, 2011).
Albalate, daniel and Germa Bel. “shaping urban traffic patterns through congestion charging: what factors drive success or failure?” Research Institute of Applied Economics. working papers 2008.
Ball, tim. “urban heat island effect.” friends of science, 2008. www.friendsofscience.org/assets/documents/fos_urban%20heat%20island.pdf (accessed January 26, 2011).
B.C. Climate Action toolkit. “district heating in North vancouver.” www.toolkit.bc.ca/success-stories/district-heating-north-vancouver (accessed March 11, 2011).
B.C. Progress Board 2010. “10th Annual Benchmark Report.” www.bcprogressboard.com/pdfs/Bench2010_finals.pdf (accessed March 11, 2011).
Bengston, david N., Jennifer o. fletcher, and Kristen C. Nelson. “Public policies for managing urban growth and protecting open space: policy instruments and lessons learned in the united states.” Landscape and Urban Planning 69 (2003): 271-286.
Biodiversity BC. “section 2: British Columbia’s Natural legacy” in Taking Natures Pulse: The Status of Biodiversity in British Columbia, edited by Austin, Matt A., dan A. Buffett, dave J. Nicolson, Geoff G.e. scudder and victoria stevens. victoria, B.C., 2008. Available at: www.biodiversitybc.org.
Biosphere 2: the experiment. invention, Creation and Mission 1. “A Brief Chronology.” www.biospherics.org/experimentchrono1.html (accessed october 27, 2010).
Blaise, Pamela. Perverse Cities. Hidden Subsidies, Wonky Policy, and Urban Sprawl. vancouver: uBC Press, 2010.
Brabec, elizabeth. “An evaluation of the effectiveness of cluster development in the town of southampton, New york.” Urban Ecosystems 4 (2001): 27-47.
British Broadcasting Corporation News. “10,000 chased for congestion fine.” february 18, 2003. http://news.bbc.co.uk/2/hi/uk_news/england/2776915.stm (accessed July 13, 2010).
British Columbia Progress Board. “Performance indicator 16: Protected Areas.” www.bcprogressboard.com/2010Report/Pi16.html (accessed April 6, 2011).
Bolund, Per and sven hunhammar. “ecosystem services in urban areas.” Ecological Economics 29 (1999): 293-301.
Calvert, sean. “state of Knowledge on Market tools for sustainable Communities.” sustainable Prosperity, 2010.
Canadian Mortgage and housing Corporation. “Retaining Affordable housing: transferable development Rights Program – seattle, washington.” www.cmhc-schl.gc.ca/en/inpr/afhoce/tore/afhoid/pore/reafho/reafho_005.cfm#full (accessed May 3, 2011).
Canmet energy. “Community energy Case studies: lonsdale energy Corporation.” City of North vancouver, B.C. http://canmetenergy-canmetenergie.nrcan-rncan.gc.ca/fichier/81127/de%2017%20lonsdale%20energy%20corp%20(eNG).pdf (accessed october 19, 2010).
Cannings, Richard and sydney Cannings. British Columbia: a natural history. vancouver: Greystone Books, 1996.
Capital Regional district. “sea to sea Green Blue Belt.” www.crd.bc.ca/parks/reserves/seatosea.htm (accessed february 18, 2011).
Carter-whitney, Maureen. “Cinching sprawl: worldwide experience with greenbelts can help Calgary protect its near-urban lands.” Alternatives Journal 34, no. 3 (2008): 17-23.
Cashmore, Matthew, Richard Gwilliam, Richard Morgan, dick Cobb, and Alan Bond. “effectiveness of eiA. the interminable issue of effectiveness: substantive purposes, outcomes and research challenges in the advancement of environmental impact assessment theory.” Impact Assessment and Project Appraisal 22, no. 4 (2004): 295-310.
Centre for Neighbourhood technology and American Rivers. “the value of Green infrastructure: A Guide to Recognizing its economic, environmental and social Benefits” 2010. www.cnt.org/repository/gi-values-guide.pdf (accessed february 3, 2011).
Clayoquot sound scientific Panel. “sustainable ecosystem Management in Clayoquot sound. Planning and Practices. Report 5.” Province of B.C., 1995. http://www, cortex.bc.ca/Rep5c3.pdf (accessed June 7, 2010).
CMhC. “Brownfield Redevelopment for housing. Case studies: environmental Remediation and site enhancement (eRAse) Community improvement Plan (CiP) initiative.” www.cmhc-schl.gc.ca/en/inpr/su/sucopl/upload/Brownfield-Redevelopment-for-housing-in-Canada-Case-studies-environmental-Remediation-and-site-enhancement-eRAse-Community-improvement-Plan-CiP-initiative-hamilton-ontario.pdf (accessed April 18, 2011).

Dav iD s uzu ki fOu n DatiOn Page 65
Coast information team. “the scientific Basis of ecosystem-Based Management.” Province of B.C., 2004. www.citbc.org/ebmscie.html (accessed october 21, 2010)
Curran, deborah. “Protecting the working landscape of Agriculture: A smart Growth direction for Municipalities of British Columbia.” vancouver: west Coast environmental law Research foundation, 2005.
Curran, deborah. “vote for de-suburbanization.” Alternatives Journal 34 (2008): 26-28.
daily, Gretchen C., ed. Nature’s services: societal dependence on natural ecosystems. washington: island Press, 1997.
de Groot, Rudolf, Brendan fisher, Mike Christie, James Aronson, leon Braat, John Gowdy, Roy haines-young, edward Maltby, Aude Neuville, stephan Polasky, Rosimeiry Portela, and irene Ring. “teeB: ecological and economic foundation, Chapter 1” in The Ecological and Economic Foundations, edited by Pushpam Kumar, 2-17. united Kingdom: earthscan, 2009.
dipper, Ben. “Monitoring and Post-auditing in environmental impact Assessment: A review.” Journal of Environmental Planning and Management 41, no.6 (1998): 731-747.
ehrlich, Paul R. and Anne h. ehrlich. “Nature’s economy and the human economy.” Environmental Resource Economics 39 (2008): 9-16.
environment Canada. “2008 Municipal water Pricing Report.” library and Archives Canada, 2008.
environmental law Clinic, university of victoria faculty of law, and deborah Curran & Company. “Green Bylaws toolkit for Conserving sensitive ecosystems and Green infrastructure.” Prepared for the wetland stewardship Partnership, ducks unlimited Canada, Grasslands Conservation Council of British Columbia, environment Canada, and the Province of British Columbia, 2007.
“ePCoR: okotoks.” www.epcor.ca/en-ca/about-epcor/operations/operations-alberta/okotoks/Pages/default.aspx (accessed october 21, 2010).
farber, stephen C., Robert Costanza, and Matthew A. wilson. “economic and ecological concepts for valuing ecosystem services.” Ecological Economics 41, no 3 (2002): 375-392.
fletcher, James and doug McArthur. Local Prosperity: Options for Municipal Revenue Growth in British Columbia. Produced for sustainable Prosperity, 2010.
fraser Basin Council. “fraser valley Region” www.fraserbasin.bc.ca/regions/fvr.html (accessed March 11, 2011).
Gennaio, Maria-Pia, Anna M. hersperger, and Matthias Burgi. “Containing urban sprawl – evaluating effectiveness of urban growth boundaries set by the swiss land use Plan.” Land Use Policy 26 (2009): 224-232.
Grant, Joe, et al., “the value of Green infrastructure: A guide to recognizing its economic, environmental and social benefits.” Published by the Centre for Neighborhood technology and living Rivers, 2010.
hamilton economic development . “Municipal Programs.” www.investinhamilton.ca/incentive-programs/municipal-programs.html#Brownfields (accessed April 18, 2011).
heal, Geoffrey, Gretchen daily, Paul ehrlich, James salzman, Carol Boggs, Jessica hellman, Jennifer hughes, Claire Kremen, and taylor Ricketts. “Protecting natural capital through ecosystem service districts.” Stanford Environmental Law Journal 20 (2001): 333-364.
henderson, J.Paul, tracy Kyle, and Chris e. underwood. “vancouver landfill: landfill Gas Collection and utilization Project.” www.cityfarmer.org/landfillGas.html (accessed february 3, 2011).
iPCC. “summary for Policymakers.” in Climate Change 2007: Impacts, Adaptation and Vulnerability. Contribution of Working Group II to the Fourth Assessment Report of the Intergovernmental Panel on Climate Change, edited by M.l. Parry, o.f. Canziani, J.P. Palutikof, P.J.van der linden and C.e. hanson, 7-22. Cambridge: Cambridge university Press, 2007. Cambridge, uK, 7-22.
island trust fund. “Crown land Acquisitions.” www.islandstrustfund.bc.ca/crown.cfm (accessed November 9, 2010).
Jamasmie, Cecilia. “living in Biosphere 2. An Artificial ecosystem. orato.” Retrieved october 11, 2010 from www.orato.com/health-science/living-biosphere-2 (accessed october 11, 2010).
Jun, Myung-Jin. “the effects of Portland’s urban Growth Boundary on urban development Patterns and Commuting.” Urban Studies 41, no. 7 (2004): 1333-1348.
Kelleher, Maria, Janet Robins, and John dixie. “taking out the trash: how to Allocate the Costs fairly.” Published by the C.d. howe institute, 2005.
land trust Alliance of B.C. “Conservations covenants: A guide for developers and planning departments – 2009.” http://landtrustalliance.bc.ca/docs/covenants%20for%20developers%20&%20planners%20web%2009.pdf (accessed october 11, 2010).
ledoux, l. and R.K. turner. “valuing ocean and Coastal Resources: Practical examples and issues for further Action.” Ocean and Coastal Management 45 (2002): 583-616.
Local Government Act 1996 (B.C.)
Millenium ecosystem Assessment. A Toolkit for Understanding and Action: Protecting Nature’s Services. Protecting Ourselves. washington: island Press, 2007.
Ministry of Community and Rural development. “integrated Resource Recovery inventory.” www.waterbucket.ca/gi/sites/wbcgi/documents/media/268.pdf (accessed March 11, 2011).
Page 66 n at u r a L C a Pita L P OLi C y r e v ie W
Ministry of environment. “environmental trends in British Columbia: 2007.” victoria, British Columbia.
Ministry of forests, lands and Natural Resource operations. “Community and institutional use of Crown land: free Crown Grants and Nominal Rent tenures.” www.al.gov.bc.ca/clad/tenure_programs/programs/community/guide/apply_nrt.html. (accessed october 11, 2010).
Meidinger, del and Jim Pojar, eds. “ecosystems of British Columbia. special Report series No. 6. British Columbia Ministry of forests.” victoria, British Columbia.
Molnar, Michelle, Catheryn Clarke-Murray, John whitworth, and Jordan tam. “Marine and Coastal ecosystem services: A report on ecosystem services in the Pacific North Coast integrated Management Area (Pncima) on the British Columbia coast.” Prepared for the david suzuki foundation, 2009.
National Round table on the environment and the economy. State of the Debate. Securing Canada’s Natural Capital: A vision for nature conservation in the 21st century. ottawa: National library of Canada, 2003.
Noble, Bram f. “the Canadian experience with seA and sustainability.” environmental impact Assessment Review 22, no. 1 (2002): 3-16.
Northwest hydraulic Consultants. “Cowichan valley Regional district. lower Cowichan/Koksilah River integrated flood Management Plan.” www.cowichanwatershedboard.ca/sites/default/files/lowerCowichan-KoksilahRiverintegratedfloodManagementPlan-finalReport-sept2009.pdf (accessed May 3, 2010).
Noss, Reed f. and Allen y. Cooperrider. Saving nature’s legacy: protecting and restoring biodiversity. Covelo, California: island Press, 1994.
Noss, R.f. “Protected areas: how much is enough?” in National Parks and Protected Areas, edited by R.G. wright, 91-120. Cambridge: Blackwell science, 1996.
okotoks. “town of okotoks.” www.okotoks.ca/sustainable/water/perspective.asp (accessed fegruary 8, 2011).
okotoks. “water and Growth.” www.okotoks.ca/sustainable/water/initiatives.asp (accessed April 18, 2011).
olewiler, Nancy. “the value of Natural Capital in settled Areas of Canada.” Published by ducks unlimited Canada and the Nature Conservancy of Canada, 2004.
olewiler, Nancy. “securing Natural Capital and ecological Goods and services for Canada.” in A Canadian Priorities Agenda, edited by J. leonard, C. Ragan, and f. st-hilaire, 125-160. Montreal, PQ: the institute for Research on Public Policy, 2007.
ontario Ministry of Municipal Affairs and housing. “the Greenbelt.” www.mah.gov.on.ca/Page7087.aspx (accessed March 11, 2011).
Province of British Columbia. Biodiversity guidebook. victoria, B.C.: Queens Printer, 1995.
Rahl, J.B., steven e. Kraft, and Christopher l. lant. The Law and Policy of Ecosystem Services. washington: island Press, 2007.
Regional district of Central okaganan. “terms of Reference: Professional Reports for Planning services, 2006.” www.regionaldistrict.com/docs/planning/handout%20tofR.pdf (accessed february 18, 2011).
Resort Municipality of whistler. “Council green building policy.” www.whistler2010.com/cms-assets/documents/4544-264247.greenbuildingpolicy.pdf (accessed february 3, 2011).
Resort municipality of whistler. “whistler Green Guidelines Moving to the Next step.” www.whistler.ca/index.php?option=com_content&task=view&id=270&itemid=529 (accessed october 6, 2010).
scudder, Geoffrey G.e. “Biodiversity Conservation and Protected Areas in British Columbia.” department of Zoology and Centre for Biodiversity Research, university of British Columbia, 2003.
scudder, Geoffrey.G.e. “Rarity and Richness hot spots in British Columbia” in: Proceedings of the Species at Risk 2004 Pathways to Recovery Conference, edited by t.d. hooper March 2-6, 2004. victoria, B.C.
“sustainable Cowichan: 12 things.” www.12things.ca/12things/12.php (accessed April 18, 2011).
“the friends of the Greenbelt foundation.” www.greenbelt.ca/ (accessed March 11, 2010).
tools of Change. “sustainable okotoks, Alberta.” www.toolsofchange.com/en/case-studies/detail/149 (accessed february 11, 2011).
transport for london. “Central london Congestion Charging: impacts Monitoring. fifth annual report, July 2007.” london, england, 2007.
wackernagel, Mathis, Justin Kitzes, dan Moran, steven Goldfinger, and Mary thomas. “the ecological footprint of cities and regions: comparing resource availability with resource demand.” Environment and Urbanization 18, no. 1 (2006): 103–112.
wilson, sara. “Natural Capital in B.C.’s lower Mainland. valuing the Benefits from Nature.” Prepared for the david suzuki foundation and the Pacific Parklands foundation, 2010.
united Nations. World Population to 2300. New york: united Nations department of economic and social Affairs: Population division. 2004. www.un.org/esa/population/publications/longrange2/worldPop2300final.pdf (accessed July 3, 2011).
this report is the third in a series of david suzuki foundation publications examining the economic value of natural capital – forests, fields, wetlands and waterways – in and around Canada’s urban areas and assessing the essential benefits that these ecosystems provide. the purpose of this report is to evaluate tools and policy options that B.C. local government agencies can use to protect and restore natural capital and ecosystem services. it reviews challenges and opportunities facing local governments and provides three promising policy options.
Printed on 100% post-consumer recycled paper, processed chlorine free.
2211 west 4th Avenue, suite 219 vancouver, B.C., Canada v6K 4s2
t: 604.732.4228 f: 604.732.0752 e: [email protected]
www.davidsuzuki.orgisBN 978-1-897375-43-3