Natural and Cultural Resources · plans. Human access to critical habitats, when necessary, is...
30
Natural and Cultural Resources 6 2015 SITE ENVIRONMENTAL REPORT 6-1 6.1 NATURAL RESOURCE MANAGEMENT PROGRAM The Natural Resource Management Program at BNL promotes stewardship of the natural re- sources found at the Laboratory, and integrates natural resource management and protection with BNL’s scientific mission. The Natural Resource Management Plan (NRMP) describes the program strategy, elements, and planned activities for managing the various natural re- sources found on site. The NRMP is updated every 5 years (BNL 2011), with the next up- date to be completed in 2016. 6.1.1 Identification and Mapping An understanding of an environmental baseline is the foundation of natural resource management planning. BNL uses digital global positioning systems (GPS) and geographic in- formation systems (GIS) to clearly relate vari- ous “layers” of geographic information (e.g., vegetation types, soil condition, habitat, forest health, etc.). This is done to gain insight into interrelationships between the biotic systems and physical conditions at the Laboratory. In 2012, a forest fire was started on the northern part of BNL property, burning ap- proximately 300 acres on site and 700 acres off site. Within 2 days of the fire, natural resource personnel began recording the extent of the fire using GPS and established photo points to begin tracking both fire damage and post-fire recovery. Maps of the fire and photo locations were entered into the GIS for future reference and the burned areas are revisited periodically to track recovery. In addition, a deer exclosure area was established to track impacts of the high deer population on the burn area as it con- tinues to recover. Work associated with tracking impacts from the construction of the Long Island Solar Farm (LISF) at BNL continue to be entered into the GIS as a tool to assist analysis of changes to wildlife populations and vegetation. In 2015, The Brookhaven National Laboratory Natural Resource Management Program is designed to protect and manage flora and fauna and the ecosystems in which they exist. The Laboratory’s natural resource management strategy is based on understanding the site’s resources and on maintaining compliance with applicable regulations. The goals of the program include protecting and monitoring the ecosystem, conducting research, and communicating with personnel and the public on ecological issues. BNL focuses on protecting both Federal and New York State threatened and endangered species on site, as well as continuing the Laboratory’s leadership role within the greater Long Island Central Pine Barrens ecosystem. Monitoring to determine whether current or historical activities are affecting natural resources is also part of the program. In 2015, deer, fish, and vegetation sampling results were consistent with previous years. The overriding goal of the Cultural Resource Management Program is to ensure that proper stewardship of BNL historic resources is established and maintained. Additional goals of the program include maintaining compliance with various historic preservation and archeological laws and regulations, and ensuring the availability of identified resources to personnel and the public for research and interpretation. CHAPTER 6: NATURAL AND CULTURAL RESOURCES
Transcript of Natural and Cultural Resources · plans. Human access to critical habitats, when necessary, is...

Natural and Cultural Resources6
2015 SITE ENVIRONMENTAL REPORT6-1
6.1 NATURAL RESOURCE MANAGEMENT PROGRAM
The Natural Resource Management Program at BNL promotes stewardship of the natural re-sources found at the Laboratory, and integrates natural resource management and protection with BNL’s scientific mission. The Natural Resource Management Plan (NRMP) describes the program strategy, elements, and planned activities for managing the various natural re-sources found on site. The NRMP is updated every 5 years (BNL 2011), with the next up-date to be completed in 2016.
6.1.1 Identification and MappingAn understanding of an environmental
baseline is the foundation of natural resource management planning. BNL uses digital global positioning systems (GPS) and geographic in-formation systems (GIS) to clearly relate vari-ous “layers” of geographic information (e.g., vegetation types, soil condition, habitat, forest
health, etc.). This is done to gain insight into interrelationships between the biotic systems and physical conditions at the Laboratory.
In 2012, a forest fire was started on the northern part of BNL property, burning ap-proximately 300 acres on site and 700 acres off site. Within 2 days of the fire, natural resource personnel began recording the extent of the fire using GPS and established photo points to begin tracking both fire damage and post-fire recovery. Maps of the fire and photo locations were entered into the GIS for future reference and the burned areas are revisited periodically to track recovery. In addition, a deer exclosure area was established to track impacts of the high deer population on the burn area as it con-tinues to recover.
Work associated with tracking impacts from the construction of the Long Island Solar Farm (LISF) at BNL continue to be entered into the GIS as a tool to assist analysis of changes to wildlife populations and vegetation. In 2015,
The Brookhaven National Laboratory Natural Resource Management Program is designed to protect and manage flora and fauna and the ecosystems in which they exist. The Laboratory’s natural resource management strategy is based on understanding the site’s resources and on maintaining compliance with applicable regulations. The goals of the program include protecting and monitoring the ecosystem, conducting research, and communicating with personnel and the public on ecological issues. BNL focuses on protecting both Federal and New York State threatened and endangered species on site, as well as continuing the Laboratory’s leadership role within the greater Long Island Central Pine Barrens ecosystem. Monitoring to determine whether current or historical activities are affecting natural resources is also part of the program. In 2015, deer, fish, and vegetation sampling results were consistent with previous years.
The overriding goal of the Cultural Resource Management Program is to ensure that proper stewardship of BNL historic resources is established and maintained. Additional goals of the program include maintaining compliance with various historic preservation and archeological laws and regulations, and ensuring the availability of identified resources to personnel and the public for research and interpretation.
CHAPTER 6: NATURAL AND CULTURAL RESOURCES

2015 SITE ENVIRONMENTAL REPORT 6-2
CHAPTER 6: NATURAL AND CULTURAL RESOURCES
natural resource personnel and interns continued to look at use of the LISF site by wildlife; use of fence openings by wildlife; changes in bird use; and changes in vegetation.
A wide variety of vegetation, birds, reptiles, amphibians, and mammals inhabit the site. Through implementation of the NRMP, endangered, threatened, and spe-cies of special concern have been identified as having been resident at BNL during the past 30 years or are expected to be present on site (see Table 6-1). The only New York State endangered species confirmed as currently inhabiting Laboratory property is the eastern tiger salamander (Ambystoma t. ti-grinum). Six other New York State endangered species have been identified at BNL in the past or are possibly present including: the Persius duskywing butterfly (Eryn-nis p. persius), crested fringed orchid (Plantathera cristata), Engelman spikerush (Eleocharis engelmannii), fireweed (Erectites heiracifolia var. megalocarpa), dwarf huckleberry (Gaylussacia bigeloviana), and whorled loose-strife (Lysimachia quadrifoli).
Seven New York State threat-ened species have been positively identified on site and three other species are considered likely to be present. Threatened spe-cies include two fish (banded sunfish [Enneacanthus obesus] and swamp darter [Etheostoma fusiforme]) and three plants (stiff-leaved goldenrod [Oligo-neuron rigida], stargrass [Aletris farinose], and eastern showy aster [Eurybia spectabilis]). The northern harrier (Circus cyaneus) is periodically seen in the fall. In-sects listed as threatened include
Table 6-1. New York State Threatened, Endangered, Exploitably Vulnerable, and Species of Special Concern at BNL.
Common Name Scientific NameState
StatusBNL
StatusInsectsBlack-bordered lemon moth Marimatha nigrofimbria SGCN ConfirmedComet darner Anax longipes SGCN ConfirmedFrosted elfin Callophrys iris T LikelyLittle bluet Enallagma minusculum T LikelyMottled duskywing Erynnis martialis SC LikelyNew England bluet Enallagma laterale SGCN LikelyPersius duskywing Erynnis persius persius E LikelyPine Barrens bluet Enallagma recurvatum T ConfirmedPine barrens zanclognatha Zanclognatha martha SGCN ConfirmedScarlet bluet Enallagma pictum T LikelyFish Banded sunfish Enniacanthus obesus T Confirmed Swamp darter Etheostoma fusiforme T Confirmed Amphibians Eastern spadefoot toad Scaphiopus holbrookii SC Confirmed Eastern tiger salamander Ambystoma tigrinum tigrinum E Confirmed Four-toed salamander Hemidactylium scutatum SGCN ConfirmedFowler’s toad Bufo fowleri SGCN ConfirmedMarbled salamander Ambystoma opacum SC Confirmed Reptiles Eastern box turtle Terrapene carolina SC Confirmed Eastern hognose snake Heterodon platyrhinos SC Confirmed Eastern ribbon snake Thamnophis sauritus SGCN ConfirmedNorthern black racer Coluber constrictor SGCN ConfirmedSnapping turtle Chelydra serpentina SGCN ConfirmedSpotted turtle Clemmys guttata SC Confirmed Stinkpot turtle Sternotherus odoratus SGCN Confirmed Worm snake Carphophis amoenus SC Confirmed Birds (nesting, transient, or potentially present) Black-billed cuckoo Coccyzus erythropthalmus SGCN ConfirmedBlue-winged warbler Vermivora pinus SGCN Confirmed Brown thrasher Toxostoma rufum SGCN ConfirmedCooper's hawk Accipiter cooperii SC Confirmed Glossy ibis Plegadis falcinellus SGCN Confirmed Grasshopper sparrow Ammodramus savannarum SC Confirmed Great egret Ardea alba SGCN ConfirmedHorned lark Eremophila alpestris SC Confirmed Northern bobwhite Colinus virginianus SGCN ConfirmedNorthern harrier Circus cyaneus T Confirmed Osprey Pandion haliaetus SC Confirmed Prairie warbler Dendroica discolor SGCN ConfirmedRed-headed woodpecker Melanerpes erythrocephalus SC ConfirmedScarlet tanager Piranga olivacea SGCN ConfirmedSharp-shinned hawk Accipiter striatus SC Confirmed Whip-poor-will Caprimulgus vociferus SC Confirmed Wood thrush Hylocichla mustelina SGCN ConfirmedMammalsNorthern long-eared bat * Myotis septentrionalis FT Confirmed PlantsBayberry Myrica pensylvanica V Confirmed Bracken fern Pteridium alquilinum var.
pseudocaudatumE Possible
(continued on next page)

2015 SITE ENVIRONMENTAL REPORT6-3
CHAPTER 6: NATURAL AND CULTURAL RESOURCES
a damselfly, the Pine Barrens bluet (Enallagma recurvatum), which was confirmed at one of the many coastal plain ponds located on site. Two other damselflies, the little bluet (Enallagma minisculum) and the scarlet bluet (Enallagma pictum) are likely to be present at one or more of the ponds on site. The frosted elfin (Callophrys irus), a butterfly, has been historically present on
site due to its preferred habitat and host plant, wild lupine (Lupi-nus perennis).
A number of other species that are listed as rare, of special con-cern, or exploitably vulnerable by New York State either currently inhabit the site, visit during migra-tion, or have been identified his-torically, as shown in Table 6-1.
BNL historically has had no federally threatened or endan-gered species present on site. On October 2, 2013, the U.S. Fish & Wildlife Service (FWS) published a notice in the Federal Register that the northern long-eared bat (Myotis septentrionalis) be recommended for listing as an Endangered Species under the Federal Endangered Spe-cies Act (ESA). The comment period was extended two times with a final determination listing the northern long-eared bat as a threatened species was published on April 2, 2015 with an effective date of May 4, 2015. A draft rule under section 4(d) of the ESA was published concurrent to the determination of threatened status and provided guidance on man-agement requirements. The draft 4(d) rule was open for comment with expected finalization in early 2016. The northern long-eared bat is known to be present at BNL, having been identified as the first case of white-nosed syndrome found on Long Island in 2011, and has been added to the Labora-tory’s list of protected species.
6.1.2 Habitat Protection and EnhancementBNL has administrative processes in place to
protect on-site habitats and natural resources. Activities to eliminate or minimize negative ef-fects on endangered, threatened, or sensitive species are either incorporated into Laboratory
Table 6-1. New York State Threatened, Endangered, Exploitably Vulnerable, and Species of Special Concern at BNL.
Common Name Scientific NameState
StatusBNL
StatusButterfly weed Asclepias tuberosa ssp.
interiorV Confirmed
Cinnamon fern Osmunda cinnamomea V Confirmed Clayton's fern Osmunda claytoniana V Confirmed Crested fringed orchid Plantathera cristata E Likely Dwarf huckleberry Gaylussacia bigeloviana E ConfirmedEastern showy aster Eurybia spectabilis T ConfirmedEngelman spikerush Eleocharis engelmannii E ConfirmedFireweed Erectites heiracifolia var.
megalocarpaE Possible
Flowering dogwood Cornus florida V Confirmed Green fringed orchid Platanthera lacera V ConfirmedGround pine Dendrolycopodium obscurum V ConfirmedLong-beaked bald-rush Rhynchospora scirpoides R Confirmed Marginal wood fern Dryopteris marginalis V ConfirmedMarsh fern Thelypteris palustris var.
pubescensV Confirmed
Narrow-leafed bush clover Lespedeza augustifolia R Confirmed New York fern Thelypteris novaboracensis V Confirmed Pink lady's slipper Cypripedium acaule V Confirmed Possum haw Viburnum nudum var. nudum E PossibleProstate knotweed Polygonum aviculare ssp.
buxiformeE Possible
Round-leaved sundew Drosera rotundifolia var. rotundifolia
V Confirmed
Royal fern Osmunda regalis V Confirmed Sheep laurel Kalmia angustifolia V Confirmed Small-flowered false foxglove
Agalinis paupercula R Confirmed
Spotted wintergreen Chimaphila maculata V Confirmed Stargrass Aletris farinosa T Confirmed Stiff-leaved goldenrod Oligoneuron rigida T ConfirmedSwamp azalea Rhododendron viscosum V Confirmed Virginia chain-fern Woodwardia virginica V Confirmed Whorled loosestrife Lysimachia quadrifolia E ConfirmedWild lupine Lupinus perennis R ConfirmedWinterberry Ilex verticillata V Confirmed
Notes: Table information based on 6 NYCRR Part 182, NYCRR Part 193, and BNL survey data.* Species added in 2015E = endangeredF = federally threatened
R = rateSC = species of special concernSGCN = species of greatest conservation needT = threatenedV = exploitably vulnerable
(concluded).

2015 SITE ENVIRONMENTAL REPORT 6-4
CHAPTER 6: NATURAL AND CULTURAL RESOURCES
procedures or into specific program or project plans. Human access to critical habitats, when necessary, is limited, and habitats are enhanced to improve survival or increase populations. Routine activities, such as road maintenance, are not performed until the planned activities have been evaluated and determined to be un-likely to affect habitat.
6.1.2.1 Salamander Protection EffortsMany safeguards are in place to protect eastern
tiger salamander breeding areas. BNL staff must review any project planned near eastern tiger salamander habitats, and every effort is made to minimize impacts. A map of the breeding areas is reviewed when new projects are proposed. The map is updated as new information concerning the salamanders is generated through research and monitoring. The current map incorporates buffer areas around tiger salamander habitats of 1,000 feet based on guidance from the New York State Department of Environmental Conservation (NYSDEC). Other efforts to protect this state-endangered species include determining when adult salamanders are migrating toward breeding locations, when metamorphosis has been com-pleted, and when juveniles are migrating after metamorphosis. During these times, construction and maintenance activities near their habitats are postponed or closely monitored.
Water quality testing is conducted as part of the routine monitoring of recharge basins, as discussed in Chapter 5. In cooperation with NYSDEC, habitat surveys have been routinely conducted since 1999. Biologists conducting egg mass and larval surveys have confirmed that 26 on-site ponds are used by eastern tiger salaman-ders. In 2015, egg mass surveys confirmed the presence of salamanders in 3 of the 26 ponds. Whenever possible, ponds with documented egg masses from the spring surveys are revisited in June and July to check for the presence of larval salamanders. Long Island experienced drought conditions in 2015, with virtually all on-site ponds drying up.
6.1.2.2 Banded SunfishBanded sunfish protection efforts include
observing whether adequate water is present
within areas currently identified as sunfish habitat, ensuring that existing vegetation in their habitat is not disturbed, and evaluating all activities taking place in ponds and the Peconic River on site for potential impacts on these habitats. Population estimates are periodically conducted within these waters to determine their current health. During the last population survey in 2011, approximately 6,400 banded sunfish were counted. In 2015, the only known pond with banded sunfish was nearly dry due to drought conditions. A very small depression remained wet throughout the year and may have harbored fish. Surveys to determine the continued presence of the banded sunfish will be conducted in 2016 provided water level conditions in the ponds improve.
6.1.2.3 Migratory BirdsA total of 216 species of birds have been iden-
tified at BNL since 1948; at least 85 species are known to nest on site. Some of these nesting birds have shown declines in their populations nationwide over the past 30 years. The Labora-tory conducts routine monitoring of songbirds along seven permanent bird survey routes in vari-ous habitats on site.
In 2015, monthly surveys were conducted starting at the end of April and extending through the end of August. Two routes as-sociated with the LISF were monitored twice monthly from the end of April through mid-September. These surveys identified 84 songbird species, compared to the 70 species identified in 2014 and 74 species in 2013. A total of 131 bird species have been identified in surveys in the past 15 years; 59 of these spe-cies were present in each of the past 15 years. Variations in the number and species identi-fied during each survey may reflect the time of observation, variations in weather patterns between years, and possible changes in the environment. The three most diverse transects pass near on-site wetlands near the LISF and the Peconic River. The four transects passing through the various forest types on site (white pine, moist pine barrens, and dry pine barrens) showed a less diverse bird community. Bird survey data are stored in an electronic database

2015 SITE ENVIRONMENTAL REPORT6-5
CHAPTER 6: NATURAL AND CULTURAL RESOURCES
for future reference and study. There are few known data on the effects of a
large, utility-scale solar array such as the LISF are known within scientific literature. To assess the effects of the solar farm on local bird popu-lations, the collection of migratory bird data in both the Biology Field transect and the Solar Farm transect is important. The solar farm vegetation and the way it is managed may play a key role as habitat for migratory birds. One species, the indigo bunting (Passerina cyanea), was absent along the Biology Field transect in 2011, but was heard along the Solar Farm tran-sect in 2012, returned to the Biology Field tran-sect in 2013, and was present on both transects in 2014 and 2015. This temporary absence is thought to be due to disturbance from construc-tion activities while building the solar farm.
The eastern bluebird (Sialia sialis) has been identified as a declining species of migratory birds in North America. This is due to loss of habitat and nest site competition from Euro-pean starlings (Sturnus vulgaris) and house sparrows (Passer domesticus). BNL’s NRMP includes habitat enhancement for the eastern bluebird. Since 2000, the Laboratory has in-stalled more than 60 nest boxes around open grassland areas on site to enhance their popu-lation. Although many of these boxes were removed from service in 2010 in preparation for the construction of the LISF, the LISF cre-ated nearly 200 acres of suitable habitat for the eastern blue bird. Forty new boxes were installed around the northern most portions of the LISF in 2012 and are routinely used by bluebirds, house wrens, and tree swallows.
Migratory birds occasionally cause safety and health concerns, particularly Canada geese (Branta canadensis) and several species of migratory birds that occasionally nest on build-ings or in construction areas on site. Approxi-mately 10 years ago, it was determined that the resident Canada goose population at BNL reached large enough numbers that could result in health and safety issues. Beginning in 2007, under a permit from FWS, the Laboratory be-gan managing the resident goose population by limiting the number of eggs that could hatch. Although 20 nests were treated during 2015,
approximately 20 goslings were produced. By the end of 2015, the goose population was esti-mated at just over 100 birds.
6.1.2.4 Northern Long-eared BatAs discussed in Section 6.1.1, the northen
long-eared bat was added to the list of federally threatened species in 2015. BNL began planning for the eventual listing early on and put in place actions to minimize the likelihood of impacting this species. The two most likely activities that could impact this bat are building demolition and prescribed fires. Inspections for the pres-ence of bats are conducted in multiple ways prior to a building demolition.
During spring, summer, and fall, ultrasonic acoustic monitoring is done around buildings to determine if there is bat activity. Regardless of the outcome of acoustic monitoring, a final internal inspection of the buildings is conducted approximately 24 hours prior to demolition to verify the absence of bats. For growing season prescribed fire, acoustic monitoring is done within the burn unit to determine if there is bat activity. If positive results are acquired, surveys of the entire unit are completed to identify po-tential roost trees and appropriate protections are put into place to ensure that bats are not impacted by fire. In 2015, four buildings were demolished without impact to bats and no prescribed fires were conducted due to drought conditions.
Mist netting for bats is also conducted, when possible, during summer months to identify and document which bats are present on site. Mist netting in 2015 resulted in captures of eastern red bat (Lasiurus borealis) and big brown bats (Eptesicus fuscus), but no northern long-eared bats as had occurred in prior years.
6.1.3 Population ManagementIn addition to controlling resident Canada
goose populations described above, the Labora-tory also monitors and manages other popula-tions, including species of interest, to ensure that they are sustained and to control invasive species.
6.1.3.1 Wild Turkey
The forested areas of BNL provide good nesting and foraging habitat for wild turkey

2015 SITE ENVIRONMENTAL REPORT 6-6
CHAPTER 6: NATURAL AND CULTURAL RESOURCES
(Meleagris gallapavo). In 2015, the on-site population was approximately 250 birds. In 2009, the wild turkey population across Suf-folk County, Long Island, was determined to be of sufficient size to support hunting. Each year, NYSDEC manages a 5-day hunting peri-od for several areas across Long Island, which typically results in over 100 birds taken.
6.1.3.2 White-Tailed DeerBNL consistently updates information on
the resident population of white-tailed deer (Odocoileus virginianus). As there are no natural predators on site and hunting is cur-rently not permitted at the Laboratory, there are no significant pressures on the population to migrate beyond their typical home range of approximately 1 square mile. Normally, a population density of 10 to 30 deer per square mile is considered an optimum sustainable level for a given area. This would equate to approximately 80 to 250 deer inhabiting the BNL property under optimal circumstances. This was the approximate density in 1966, when BNL reported an estimate of 267 deer on site (Dwyer 1966). The Laboratory has been conducting routine population surveys of the white-tailed deer since 2000. The fall 2014 sur-vey estimated the population at approximately 830 animals.
Deer overpopulation can affect animal and human health (e.g., animal starvation, Lyme disease from deer ticks, and collision injuries to both humans and animals), species diversity (songbird species reduction due to selective grazing and destruction of habitat by deer), and property damage (collision damage to autos and browsing damage to ornamental plant-ings). Deer related collisions on site are less common than in the past, presumably due to improved vehicular speed controls, employee training, and deer management.
High deer populations are a regional problem, and the Laboratory is just one area on Long Island with such an issue. In 2012, several gov-ernmental entities on eastern Long Island began working to manage deer populations and the USDA-Wildlife Services, in cooperation with NYSDEC and the Suffolk County Farm Bureau,
planned a limited culling operation. Culling was to start in several of Long Island’s east end towns in late 2013, but was delayed to early 2014 due to public concerns about the program. The program eventually resulted in 192 deer taken in just one of the East End towns.
In 2008, BNL began developing a deer management plan which included an option to reduce the population through culling. The planning effort has included engagement of Laboratory employees and guests in discus-sions concerning the need and methods for deer management. In 2012, an Environmental Assessment (EA) under the National Environ-mental Policy Act (NEPA) was completed and sent to New York State for comment. The Final EA was completed in the spring of 2013. Ad-ditionally, under BNL’s permit for deployment of the 4-Poster tick management system issued by NYSDEC, the Laboratory is required to implement a deer management program. Plan-ning for implementing the deer cull continued through 2014 with a contract to reduce the deer population by 300 animals being in place at year’s end and implemented in February 2015. As mentioned above, 300 animals were taken, effectively reducing the population to approximately 530 animals. Furthermore, as many as 100 additional animals did not survive the harsh winter conditions, which resulted in snow cover lasting more than 30 consecutive days. Estimates from fall 2015 surveys indi-cated that the population had been reduced to approximately 500 animals. Additional popula-tion reductions were planned for late 2015, but were precluded due to budgetary constraints.
6.1.4 Compliance Assurance and Potential Impact Assessment
The NEPA review process at BNL ensures that environmental impacts of a proposed ac-tion or activity are adequately evaluated and addressed. The Laboratory uses NEPA reviews when identifying potential environmental im-pacts associated with site activities, especially projects that may result in physical alterations to the landscape and structures. As appropri-ate, stakeholders such as EPA, NYSDEC, Suf-folk County Department of Health Services

2015 SITE ENVIRONMENTAL REPORT6-7
CHAPTER 6: NATURAL AND CULTURAL RESOURCES
(SCDHS), BNL’s Community Advisory Coun-cil, and the Brookhaven Executive Roundtable are involved in reviewing major projects that have the potential for significant environmental impacts. Formal NEPA reviews are coordinated with the State of New York. Preparation of an EA for the continued operation of the Alternat-ing Gradient Synchrotron Complex was started at the end of 2015, with completion expected in 2016.
6.2 UPTON ECOLOGICAL AND RESEARCH RESERVE
The Upton Ecological and Research Reserve (Upton Reserve) consists of 530 acres located on the eastern boundary of the BNL site. The reserve has been designated as an area for the protection of sensitive habitats and a place where researchers can study local ecosystems. The Upton Reserve is home to a wide variety of flora and fauna. It contains wetlands and is largely within the core preservation area of the Long Island Central Pine Barrens. Based on in-formation from a 1994–1995 biological survey of the Laboratory, experts believe the reserve is home to more than 200 plant species and at least 162 species of mammals, birds, fish, rep-tiles, and amphibians (LMS 1995).
The Upton Reserve is managed by BNL and the Foundation for Ecological Research in the Northeast (FERN). Funding is coordinated for research projects that occur within the reserve and the larger pine barrens area of Long Island. Research supported by FERN in 2015 included continued microbial work on soils and sedi-ments of the pine barrens and genetic barcod-ing of Carmans River macroinvertebrates.
6.3 MONITORING FLORA AND FAUNA
The Laboratory routinely conducts surveil-lance monitoring of flora and fauna to determine the effects of past and present activities on site. In addition to surveillance monitoring, routine Comprehensive Environmental Response, Com-pensation and Liability Act (CERCLA)-required monitoring results associated with post-cleanup monitoring of the Peconic River is also con-ducted. Because soil contaminated with a radio-active isotope of cesium (Cs-137) was used in
some BNL landscaping projects in the past, trac-es of Cs-137 can be found in deer and in other animals and plants. At the cellular level, Cs-137 takes the place of potassium (K), an essential nutrient. Most radionuclide tables in this chapter also list analytical results for potassium-40 (K-40), a naturally occurring radioisotope of potas-sium that is commonly found in flora and fauna. Studies indicate that Cs-137 out-competes po-tassium when potassium salts are limited in the environment, which is typical on Long Island. Including K-40 in tables allow for a compari-son with Cs-137 levels and is used, in part, to determine the accuracy of analytical results. The results of the annual sampling conducted under the flora and fauna monitoring program follow.
6.3.1 Deer SamplingWhite-tailed deer in New York State are
typically large, with males weighing, on av-erage, approximately 150 pounds; females typically weigh approximately 100 pounds. However, white-tailed deer on Long Island tend to be much smaller, weighing an average of 80 pounds. The meat available for con-sumption from local deer ranges from 20 to 40 pounds per animal. This fact has implications for calculating the potential radiation dose to consumers of deer meat containing Cs-137, because smaller deer do not provide sufficient amounts of meat (flesh) to support the neces-sary calculations. Samples of meat and liver are taken from each deer, when possible, and are analyzed for Cs-137. Data are reported on a wet-weight basis, as that is the form most likely used for consumption.
Since 1996, BNL has routinely collected deer samples from on- and off-site areas. While most off-site samples are the result of car/deer accidents near the Laboratory, samples from deer taken by hunters beyond BNL boundaries or samples from car/deer accidents greater than 1 mile from BNL have also been made avail-able for analysis. In 1998, a statistical analysis suggested that 40 deer from off site and 25 deer from on site are needed to achieve a sta-tistically sound data set. The number obtained each year has not met this preferred level be-cause sample availability depends on accidents

2015 SITE ENVIRONMENTAL REPORT 6-8
CHAPTER 6: NATURAL AND CULTURAL RESOURCES
between vehicles and deer and people report-ing dead deer.
In 2015, with removal of 300 animals from the deer herd, the Laboratory took the opportu-nity to obtain 49 representative samples from across the site. Figure 6-1 shows the location of all deer samples taken within a 5-mile ra-dius of the Laboratory since 2011, including the 49 taken during deer management actions. Most of the off-site samples are concentrated along the William Floyd Parkway on the west boundary of BNL, whereas most on-site samples are collected near the Laboratory’s main entrance gate and the developed portions of the site. This distribution is due to the fact that people on their way to work see and report dead deer. Vehicle collisions with deer on site occur primarily early or late in the day, when deer are more active and traffic to and from the front gate is greatest.
Based on more than a decade of sampling, deer taken from more than 1 mile from BNL are used for comparison with populations on and near the Laboratory that could acquire Cs-137 from a BNL source. In 2015, 52 deer were obtained on site, of which three were from car/deer accidents and the remainder from targeted sampling of deer removed during deer management activi-ties, three from off-site locations within 1 mile of the Laboratory, and one from greater than 1 mile from the BNL boundary. The results of deer sampling are shown in Table 6-2. The 300 deer that were removed from the local herd through deer management actions were butchered and the meat donated to a ‘hunters for the hungry’ program. Prior to donation, batch samples com-posed of meat samples from five deer/batch were analyzed to ensure Cs-137 content was 1.0 pCi/g, wet weight, or less. (1.0 pCi/g, wet weight, is the 10-year average of deer samples taken from the BNL site and is approximately 15 percent of the New York State Department of Health [NYS-DOH] value of 6.9 pCi/g, wet weight, health criterion established in 1999.) Data from batch sampling are presented in Table 6-3.
6.3.1.1 Cesium-137 in White-Tailed DeerBased on historic and current data, white-
tailed deer sampled at or near the Laboratory
contain higher concentrations of Cs-137 than deer from greater than 1 mile off site. This is most likely because the deer graze on vegetation growing in soil where elevated Cs-137 levels are known to exist. Cesium-137 in soil can be transferred to above-ground plant matter via root uptake, where it then becomes available to browsing/grazing animals or is consumed directly with soil while the animal is grazing. Remediation of contaminated soil areas on site has occurred under the Laboratory’s cleanup program, with all major areas of contaminated soil being remediated by September 2005.
In 2015, Cs-137 concentrations in deer meat samples were obtained from 52 deer on site with a range of values from 0.02 pCi/g, wet weight, to 1.92 pCi/g, wet weight, and an arith-metic average of 0.29 pCi/g, wet weight, as shown in Table 6-2. The wet weight concentra-tion is before a sample is dried for analysis and is the form most likely to be consumed. Dry weight concentrations are typically higher than wet weight values. The highest on-site sample in 2015 (1.92 pCi/g, wet weight) was about 33 percent higher than the highest on-site sample reported in 2014 (1.46 pCi/g, wet weight) and 6 times lower than the highest level ever re-ported in 1996 (11.74 pCi/g, wet weight).
Cs-137 concentrations in off-site deer meat samples are typically separated into two groups: samples taken within 1 mile of BNL (three samples) and samples taken farther away (one sample), as shown in Table 6-2. Concen-trations in meat samples taken within 1 mile ranged from 0.01 pCi/g, wet weight, to 0.22 pCi/g, wet weight, with an arithmetic aver-age of 0.10 pCi/g, wet weight. Because deer on site may routinely travel up to 1 mile off site, the arithmetic average for deer taken on site and within 1 mile of the Laboratory is also calculated; for 2015, this was 0.28 pCi/g, wet weight. The single deer sampled from greater than 1 mile from BNL had non-detectable levels of Cs-137 present in the meat. Figure 6-2 compares the average values of Cs-137 concentrations in meat samples collected in 2015 from four different location groupings. The first year in which the average Cs-137 content from deer taken within 1 mile of the

2015 SITE ENVIRONMENTAL REPORT6-9
CHAPTER 6: NATURAL AND CULTURAL RESOURCES
800
-70 80
0-6
9
800
-84
800
-71
900
-15
400
-17
00.
51
Kilo
met
ers
00.
5M
iles
Figu
re 6-
1. De
er S
ampl
e Loc
atio
ns 20
11-2
015.
Fig
ure
6-1
. Dee
r Sa
mp
le L
oca
tio
ns,
201
1—20
15.
N

2015 SITE ENVIRONMENTAL REPORT 6-10
CHAPTER 6: NATURAL AND CULTURAL RESOURCES
DRAFT
(continued on next page)
Table 6-2. Radiological Analyses of Deer Tissue. (2015)
Sample Location Collection Date TissueK-40
pCi/g (Wet Weight)Cs-137
pCi/g (Wet Weight)BNL, On SiteDeer Cull # 112 location 1 02/08/15 Flesh 2.75±0.32 0.61±0.04
Liver 2.84±0.45 0.11±0.03Deer Cull # 161 location 2 02/08/15 Flesh 3.62±0.41 0.02±0.02
Liver 3.25±0.48 NDDeer Cull # 162 location 2 02/08/15 Flesh 3.00±0.36 0.37±0.03
Liver 1.88±0.32 0.07±0.02Deer Cull # 41 location 3 02/07/15 Flesh 3.60±0.36 0.17±0.02
Liver 1.37±0.35 0.04±0.01Deer Cull # 48 location 4 02/07/15 Flesh 2.97±0.33 0.24±0.02
Liver 3.27±0.44 0.06±0.02Deer Cull # 50 location 4 02/07/15 Flesh 3.15±0.36 0.42±0.03
Liver 2.73±0.33 0.09±0.02Deer Cull # 53 location 5 02/07/15 Flesh 2.67±0.38 0.08±0.02
Liver 3.24±0.35 0.02±0.01Deer Cull # 57 location 6 02/07/15 Flesh 2.97±0.40 0.07±0.02
Liver 2.01±0.36 NDDeer Cull # 58 location 6 02/07/15 Flesh 3.20±0.33 0.05±0.01
Liver 3.41±0.51 NDDeer Cull # 83 location 7 02/07/15 Flesh 2.54±0.36 0.16±0.03
Liver 3.01±0.27 0.04±0.01Deer Cull # 10 location 8 02/07/15 Flesh 3.10±0.41 0.44±0.04
Liver 1.84±0.35 0.06±0.02Deer Cull # 152 location 8 02/08/15 Flesh 3.15±0.36 0.12±0.02
Liver 2.52±0.31 NDDeer Cull # 151 location 8 02/08/15 Flesh 2.60±0.31 0.17±0.02
Liver 1.52±0.24 0.02±0.01Deer Cull # 9 location 9 02/07/15 Flesh 3.12±0.36 0.06±0.02
Liver 3.12±0.38 NDDeer Cull # 5 location 10 02/07/15 Flesh 2.77±0.31 0.21±0.02
Liver 3.01±0.39 0.05±0.01Deer Cull # 6 location 10 02/07/15 Flesh 3.11±0.36 0.74±0.04
Liver 3.09±0.28 0.21±0.02Deer Cull # 2 location 11 02/07/15 Flesh 2.60±0.35 0.21±0.03
Liver 2.30±0.31 0.04±0.01Deer Cull # 3 location 11 02/07/15 Flesh 3.70±0.34 0.16±0.02
Liver 2.24±0.32 NDDeer Cull # 1 location 12 02/07/15 Flesh 3.26±0.48 0.10±0.03
Liver 2.79±0.34 0.02±0.01Deer Cull # 142 location 15 02/08/15 Flesh 2.65±0.31 0.61±0.04
Liver 1.82±0.26 0.07±0.02Deer Cull # 32 location 16 02/07/15 Flesh 2.70±0.33 0.77±0.04
Liver 2.69±0.32 0.14±0.02Deer Cull # 29 location 17 02/07/15 Flesh 2.65±0.33 0.24±0.03
Liver 1.98±0.29 0.08±0.02Deer Cull # 28 location 17 02/07/15 Flesh 2.80±0.38 1.51±0.06
Liver 2.27±0.34 0.28±0.03Deer Cull # 24 location 18 02/07/15 Flesh 3.01±0.47 0.63±0.05
Liver 1.98±0.34 0.10±0.02Deer Cull # 25 location 18 02/07/15 Flesh 3.38±0.37 0.65±0.04
Liver 1.50±0.29 0.08±0.02Deer Cull # 23 location 20 02/07/15 Flesh 2.87±0.36 0.32±0.03
Liver 1.57±0.33 0.06±0.02

2015 SITE ENVIRONMENTAL REPORT6-11
CHAPTER 6: NATURAL AND CULTURAL RESOURCES
Table 6-2. Radiological Analyses of Deer Tissue. (2015)
Sample Location Collection Date TissueK-40
pCi/g (Wet Weight)Cs-137
pCi/g (Wet Weight)Deer Cull # 20 location 21 02/07/15 Flesh 3.18±0.48 0.19±0.04
Liver 2.01±0.35 0.02±0.01Deer Cull # 21 lcation 21 02/07/15 Flesh 3.14±0.40 0.10±0.02
Liver 2.12±0.38 0.04±0.02Deer Cull # 134 location 23 02/08/15 Flesh 3.11±0.38 0.58±0.04
Liver 2.45±0.33 0.11±0.02Deer Cull # 104 location 26 02/07/15 Flesh 2.70±0.40 0.07±0.02
Liver 2.70±0.26 0.02±0.01Deer Cull # 102 location 27 02/07/15 Flesh 1.98±0.29 0.02±0.01
Liver 2.83±0.36 0.06±0.02Deer Cull # 101 location 27 02/07/15 Flesh 3.00±0.41 0.13±0.02
Liver 2.77±0.27 0.03±0.01Deer Cull # 126 location 29 02/08/15 Flesh 2.65±0.33 0.02±0.01
Liver 2.29±0.28 0.02±0.01Deer Cull # 92 location 30 02/07/15 Flesh 3.38±0.33 0.10±0.02
Liver 2.32±0.33 0.04±0.02Deer Cull # 93 location 30 02/07/15 Flesh 2.90±0.36 0.33±0.03
Liver 2.41±0.37 0.06±0.03Deer Cull # 17 location 32 02/07/15 Flesh 3.17±0.36 0.53±0.04
Liver 2.28±0.31 0.08±0.02Deer Cull # 107 location 33 02/08/15 Flesh 3.17±0.35 0.03±0.02
Liver 2.20±0.29 NDDeer Cull # 154 location 33 02/08/15 Flesh 2.49±0.47 0.16±0.03
Liver 2.09±0.32 0.03±0.01Deer Cull # 155 location 33 02/08/15 Flesh 2.71±0.41 0.11±0.02
Liver 2.14±0.36 NDDeer Cull # 158 location 33 02/08/15 Flesh 3.53±0.26 0.03±0.01
Liver 2.8±0.37 NDDeer Cull # 159 location 33 02/08/15 Flesh 3.08±0.36 0.04±0.02
Liver 2.23±0.28 NDDeer Cull # 160 location 33 02/08/15 Flesh 2.96±0.43 0.10±0.02
Liver 2.54±0.30 0.02±0.01Deer Cull # 18 location 34 02/07/15 Flesh 3.27±0.37 0.21±0.03
Liver 1.63±0.24 0.02±0.01Deer Cull # 95 location 35 02/07/15 Flesh 1.88±0.29 0.03±0.01
Liver 3.43±0.38 0.16±0.02Deer Cull # 67 location 36 02/07/15 Flesh 2.55±0.37 0.19±0.03
Liver 1.95±0.31 0.04±0.01Deer Cull # 63 location 37 02/07/15 Flesh 2.75±0.33 0.11±0.02
Liver 2.84±0.46 0.03±0.03Deer Cull # 69 location 38 02/07/15 Flesh 3.62±0.42 0.30±0.03
Liver 3.25±0.49 0.06±0.02Deer Cull # 70 location 38 02/07/15 Flesh 3.00±0.37 0.30±0.03
Liver 1.88±0.33 0.05±0.02Deer Cull # 42 location 39 02/07/15 Flesh 3.60±0.37 0.08±0.02
Liver 1.37±0.36 0.06±0.02Bldg. 1010 04/18/15 Flesh 2.97±0.34 0.02±0.02
Liver 3.27±0.45 NDNWS 03/16/15 Flesh 3.15±0.37 0.12±0.02
Liver 2.73±0.34 0.10±0.02East of Stump Dump 12/22/15 Flesh 2.67±0.39 1.92±0.05
Liver 3.24±0.36 0.43±0.04(continued on next page)

2015 SITE ENVIRONMENTAL REPORT 6-12
CHAPTER 6: NATURAL AND CULTURAL RESOURCES
Laboratory was lower than the on-site aver-age was in 2013, and this result was repeated again in 2014 and 2015. While no definitive explanation can be given to the difference from past results, it could simply be an arti-fact of low sample numbers and randomness in sample acquisition. Although not shown on Figure 6-2, 96 percent of all 56 meat samples taken both on and off site are below 1 pCi/g, wet weight, and 82 percent were less than 0.50 pCi/g, wet weight.
Figure 6-3 presents the 10-year trend of on-site and near off-site Cs-137 averages in deer meat. While 2015 data are comprised of the largest number of samples ever taken, the er-ror around the average is less than 0.5 pCi/g, wet weight, similar to what was seen in 2012 when only nine samples were obtained. The 2015 average is approximately seven times lower than the 2008 average and is 20 percent lower than the 2012 average, which had been the lowest average seen since trending began
in 2000. These sample results continue to indi-cate the effectiveness of cleanup actions across the Laboratory, with the trend being downward from 2006 to 2015.
The effectiveness of the BNL soil cleanup program and the reduction of Cs-137 in deer meat was evaluated by Rispoli, et al. (2014). The average Cs-137 content was shown to be statistically lower than before cleanup. Sam-ples taken at distances greater than 1 mile from the BNL site were shown to remain consistent before and after cleanup, while the on-site and near off-site values were shown to decline. In preparing for monitoring associated with the planned reduction of the deer population, the 10-year average for on-site deer samples was calculated to be 1.0 pCi/g, wet weight, and this value was used to establish release criteria for deer meat made available for donation to the ‘hunters-for-the-hungry’ program.
When possible, liver samples are taken concurrently with meat samples. The liver
(concluded).Table 6-2. Radiological Analyses of Deer Tissue. (2015)
Sample Location Collection Date TissueK-40
pCi/g (Wet Weight)Cs-137
pCi/g (Wet Weight)< 1 Mile from BNLWilliam Floyd Parkway, 0.5 miles north of Long Island Expressway
10/05/15 Flesh 3.20±0.34 0.05±0.01Liver 3.41±0.52 0.04±0.01
William Floyd Parkway, 0.5 miles north of Long Island Expressway
10/15/15 Flesh 2.54±0.37 0.22±0.01
William Floyd Parkway, 100 yards south of Main Gate 10/16/15 Flesh 3.01±0.28 0.01±0.00Liver* 3.10±0.42 0.01±0.00
Longwood High School 03/20/15 Flesh 2.72±0.28 NDAverages by TissueFlesh Averages
All Samples (56) 2.96±2.66 0.27±0.21BNL Average (52) 2.96±2.63 0.29±0.21< 1 Mile Average (3) 3.00±0.26 0.10±0.01BNL + < 1 Mile Average (55) 2.96±2.64 0.28±0.21> 1 Mile Average (1) 2.72±0.28 ND
Liver AveragesAll Samples 2.43±2.51 0.06±0.14BNL Average 2.41±2.51 0.06±0.14< 1 Mile Average 2.90±0.17 0.02±0.01BNL + < 1 Mile Average 2.43±2.51 0.06±0.14
Notes: * Estimated value for Cs-137 based on laboratory qualifiers. All values are shown with a 95% confidence interval. All averages are the arithmetic average with confidence limits using a 2 sigma (95%) propogated error. K-40 occurs naturally in the environment and is presented as a comparison to Cs-137. ND = not detected

2015 SITE ENVIRONMENTAL REPORT6-13
CHAPTER 6: NATURAL AND CULTURAL RESOURCES
Figure 6-2. Comparison of Cs-137 Average Concentrations in Deer Meat, 2015.
Notes: Averages are shown for samples collected at BNL, on site and off site within 1 mile, off site within 1 mile of BNL, and off site greater than 1 mile from BNL.
Numbers in parentheses indicate the number of samples in that data set. All values are presented with a 95% confidence interval. Cs-137 = cesium-137
Figure 6-2. Comparison of Cesium-137 Average Concentrations in Deer Meat (2015).
Notes: Averages are shown for samples collected at BNL, on site and off site within 1 mile, off site within 1 mile of BNL, and off site greater than 1 mile from BNL.Numbers in parentheses indicate the number of samples in that data set.All values are presented with a 95% confidence interval.
0
0.1
0.2
0.3
0.4
0.5
0.6
BNL (52) BNL and off-site < 1 mi. (55) Off-site < 1 mi. (3) Off-site > 1 mi. (1)
Cesiu
m-1
37 C
once
ntra
tion
(pCi
/g, w
et w
eight
)
Figure 6-3. Ten-Year Trend of Cs-137 Concentrations in Deer Meat.
Notes: Averages are shown for samples collected at BNL and within 1 mile. Numbers in parentheses indicate the number of samples in that data set. All values are presented with a 95% confidence interval. Cs-137 = cesium-137
0
0.5
1
1.5
2
2.5
3
Cesiu
m-13
7Co
ncen
tratio
n (p
Ci/g
, wet
weig
ht)
Year (number of samples)

2015 SITE ENVIRONMENTAL REPORT 6-14
CHAPTER 6: NATURAL AND CULTURAL RESOURCES
Batch Number (deer number in sample)
K-40 Cs-137pCi/g (Wet Weight)
Day 1 Batch Sampling 02/09/15
Batch #01 (5,1,2,3,6) 3.43±0.77 0.24±0.05
Batch #02* (4,14,13,9,8) 3.53±0.81 0.11±0.04
Batch #03 (7,11,12,10,15) 3.11±0.67 0.22±0.05
Batch #04* (16,36,31,23,18) 4.05±1.05 0.08±0.07
Batch #05 (22,34,23,20,27) 3.11±1.03 0.20±0.06
Batch #06 (32,37,35,26,25) 3.66±0.76 0.49±0.09
Batch #07 (40,39,30,38,24) 3.06±0.69 0.37±0.06
Batch #08 (28,19,33,17,21) 3.58±0.89 0.89±0.10
Batch #09 (48,50,41,49,47) 4.76±0.91 0.25±0.07
Batch #10 (60,46,44,42,45) 4.00±0.55 0.10±0.05
Batch #11 (57,54,56,51,43) 3.91±0.81 0.36±0.08
Batch #12* (58,59,53,52,55) 3.63±0.68 0.07±0.05
Batch #13* (63,62,68,60,61) 3.11±0.60 0.17±0.04
Batch #14 (67,64,65,69,66) 4.30±0.74 0.37±0.07
Batch #15 (70,80,84,75,71) 3.54±0.57 0.21±0.03
Batch #16 (73,76,81,85,87) 4.04±0.84 0.23±0.07
Batch #17* (86,83,72,77,82) 3.02±0.64 0.14±0.04
Batch #18* (68,78,74,79,88) 3.39±0.58 0.15±0.04
Batch #19 (90,100,96,95,93) 4.31±0.70 0.22±0.04
Batch #20 (98,103,97,94,105) 3.60±0.72 0.20±0.05
Batch #21 (92,91,99,102,104) 3.30±0.62 0.26±0.05
Batch #22 (101,106,112,107,122) 2.73±0.99 0.25±0.06
Batch #23 (110,115,119,120,108) 3.27±0.59 0.30±0.05
Batch #24 (111,118,113,123,124) 4.08±0.95 0.21±0.07
Batch #25 (116,109,117,121,114) 3.19±0.53 0.38±0.05
Batch #26* (130,132,131,127,126) 3.50±0.65 0.18±0.05
Batch #27 (129,128,125,134,142) 3.80±0.65 0.68±0.06
Batch #28 (140,141,135,138,137) 3.47±0.80 0.20±0.06
Batch #29 (139,133,136,145,143) 3.15±0.66 0.42±0.05
Batch #30* (146,147,148,144,150) 2.19±0.96 0.18±0.06
Batch #31* (152,157,156,149,153) 3.79±0.47 0.08±0.03
Batch #32* (160,158,151,155,154) 3.41±0.65 0.12±0.05
Batch #33* (191,162,159,168,164) 3.44±0.54 0.19±0.03
Batch #34 (173,175,170,172,167) 3.53±0.53 0.38±0.04
Batch #35 (163,165,174,171,169) 4.07±0.86 0.43±0.08
Batch Number (deer number in sample)
K-40 Cs-137pCi/g (Wet Weight)
Batch #35 (163,165,174,171,169) 4.07±0.86 0.43±0.08
Batch #36* (179,176,178,166,177) 3.49±0.44 0.07±0.02
Batch #37* (182,180,181,187,188) 4.16±0.65 0.17±0.07
Batch #38* (189,185,184,183,161) 3.22±0.52 0.07±0.02
Batch #39* (192,190,186,195,193) 3.35±0.56 0.09±0.03
Batch #40* (194,196,197,201,203) 3.35±0.61 0.19±0.04
Day 2 Batch Sampling 02/10/15
Batch #41 (219,202,199,200,198) 2.91±0.59 0.34±0.05
Batch #42 (214,207,204,211,220) 2.56±0.57 0.26±0.05
Batch #43* (209,216,217,215,206) 3.69±0.62 0.14±0.03
Batch #44 (227,218,225,205,212) 4.07±0.59 0.35±0.04
Batch #45 (213,223,224,210,221) 3.50±0.54 0.35±0.04
Batch #46 (222,228,226,231,232) 3.72±0.64 0.52±0.06
Batch #47 (236,235,234,233,229) 3.58±0.68 0.34±0.06
Batch #48 (230,239,251,245,240) 3.53±0.67 0.25±0.05
Batch #49* (247,237,242,252,253) 3.69±0.68 0.06±0.04
Batch #50 (254,250,246,238,249) 3.64±0.79 ND
Batch #51* (259,255,241,248,262) 3.57±0.56 0.12±0.03
Batch #52 (244,243,263,266,260) 2.65±0.64 0.21±0.05
Batch #53 (261,257,269,258,264) 3.07±0.77 0.23±0.04
Batch #54* (277,265,271,256,275) 2.89±0.67 0.17±0.04
Batch #55 (270,267,274,272,279) 3.71±0.75 0.22±0.06
Day 3 Batch Sampling 02/11/15
Batch #56* (276,273,268,288,287) 2.91±0.64 0.10±0.05
Batch #57 (280,283,284,282,298) 4.61±10.2 0.44±0.08
Batch #58* (278,285,286,281,300) 2.87±0.64 0.19±0.04
Batch #59 (299,294,291,295,290) 2.76±0.73 0.59±0.08
Batch #60 (297,296,293,292,289) 3.39±0.91 0.55±0.08
Average Concentration 3.48±5.52 0.26±0.42Notes: All values are shown with a 95% confidence interval. K-40 occurs naturally in the environment and is presented as a com-
parison to Cs-137. All averages are the arithmetic average with confidence limits using a
2 sigma (95%) propogated error. ND = not detected* Estimated value for Cs-137 based on laboratory qualifiers.
Table 6-3. Radiological Analysis of Batch Samples from Deer Cull Released for Donation (2015).

2015 SITE ENVIRONMENTAL REPORT6-15
CHAPTER 6: NATURAL AND CULTURAL RESOURCES
generally accumulates Cs-137 at a lower rate than muscle tissue. The typically lower values in liver allow the results to be used as a valid-ity check for meat values (i.e., if liver values are higher than meat values, results can be con-sidered questionable and should be confirmed). In liver samples collected on site in 2015, Cs-137 concentrations ranged from non-detect to 0.43pCi/g, wet weight, with an average of 0.06 pCi/g, wet weight. The off-site Cs-137 concen-tration in liver ranged from non-detect to 0.04 pCi/g, wet weight, with an arithmetic average for off-site liver samples within 1 mile of 0.2 pCi/g, wet weight. No liver samples from deer taken greater than one mile from BNL were acquired in 2015.
The potential radiological dose resulting from deer meat consumption is discussed in Chap-ter 8. The NYSDOH has formally considered the potential public health risk associated with elevated Cs-137 levels in on-site deer, and de-termined that neither hunting restrictions nor formal health advisories are warranted (NYS-DOH 1999). As mentioned above, BNL estab-lished an administrative release criteria of 1.0 pCi/g, wet weight, for meat donated from deer removed from the Laboratory. Table 6-3 pres-ents data from the 60 batch samples produced from the 300 deer removed. The average Cs-137 concentration was 0.26 pCi/g, wet weight, with a range from non-detectable levels to 0.89 pCi/g, wet weight. Approximately 7,500 pounds of meat was donated to the ‘hunters-for-the-hungry’ program.
With respect to the health of on-site deer based on their exposure to radionuclides, the International Atomic Energy Agency (IAEA) has concluded that chronic dose rates of 100 millirad per day to even the most radiosensi-tive species in terrestrial ecosystems are un-likely to cause detrimental effects in animal populations (IAEA 1992). A deer contain-ing a uniform distribution of Cs-137 within muscle tissue at the highest levels observed to date (11.74 pCi/g, wet weight, reported in 1996) would carry a total amount of approxi-mately 0.2 µCi. That animal would receive an absorbed dose of approximately 3 millirad per day, which is only 3 percent of the IAEA
threshold. The deer observed and sampled on site appear to have no health effects from the level of Cs-137 found in their tissues.
6.3.2 Other Animals SampledWhen other animals, such as wild turkey or
Canada geese, are found dead along the roads of BNL and the immediate vicinity due to road mortality, they are tested for Cs-137. No other animals were sampled in 2015.
6.3.3 Fish SamplingBNL maintains an ongoing program for col-
lecting and analyzing fish from the Peconic River and surrounding freshwater bodies. Monitoring of the river is conducted under the environmental surveillance program and the CERCLA post-cleanup program. Surveillance monitoring occurs during even-numbered years and post-cleanup monitoring occurs in odd-numbered years. Therefore, data presented for 2015 consists of CERCLA post-cleanup moni-toring of fish from the Peconic River locations, as well as background monitoring of fish from Lower Lake on the Carmans River.
Samples collected on site were from Area A of the Peconic River just downstream of the former Sewage Treatment Plant (STP) outfall and Area C north of North Street. Vari-ous species of fish were also collected off site from Donahue’s Pond and Lower Lake on the Carmans River (see Figure 5-4 for sampling stations). Lower Lake on the Carmans River is the non-Peconic control site. Sampling is car-ried out under a permit from NYSDEC.
6.3.3.1 Radiological Analysis of Fish
The species collected for radiological analy-sis in 2015 included brown bullhead (Ictalurus nebulosus), chain pickerel (Esox niger), large-mouth bass (Micropterus salmoides), black crappie (Pomoxis nigromaculatus), bluegill (Lepomis macrochirus), and pumpkinseed (Lepomis gibbossu). The edible (fillet) conten-tof each fish was collected for analysis. Gam-ma spectroscopy analysis was performed on all samples. When fish samples were not of suf-ficient volume to conduct all non-radiological and radiological analyses, samples of the same

2015 SITE ENVIRONMENTAL REPORT 6-16
CHAPTER 6: NATURAL AND CULTURAL RESOURCES
species were composited. Table 6-4 presents specific information on the sampling location, species collected, and analytical results. All sample results are presented as wet weight concentrations, and information on the natu-rally occurring radioisotope K-40 is included as a comparison.
Cs-137 levels ranged from non-detected to 0.25 pCi/g, wet weight, from the Peconic River system, and all samples from the Carmans
River had non-detectable levels. Detectable Cs-137 levels in fish ranged from an estimated 0.06 pCi/g in brown bullhead taken from Do-nahue’s Pond to 0.25 pCi/g, wet weight, in a largemouth bass taken from Area C on site. For comparison, the highest recent value of Cs-137 was 0.78 pCi/g, wet weight, in a composite sample of bluegill was taken from Forge Pond in 2011.
To account for the different feeding habits and weight of various species, it is important to compare Cs-137 concentrations and other contaminants in species with similar feed-ing habits (i.e., bottom feeders such as brown
Location/Species K-40 Cs-137BNL, Area A ------ pCi/g (Wet Weight) -----Bluegill* 2.99±0.73 0.13±0.04Pumpkinseed (composite)* 2.76±0.90 0.13±0.05Pumpkinseed (composite)* 2.35±0.81 0.12±0.07Chain Pickerel* 3.79±0.78 0.15±0.05Largemouth Bass (composite)* 4.46±0.90 0.13±0.05Brown Bullhead (composite)* 2.45±0.91 0.14±0.06BNL, Area CBluegill (composite) 3.02±0.75 NDBluegill (composite) 2.96±0.82 NDBlack Crappie* 3.24±1.49 0.17±0.16Largemouth Bass* 3.32±0.80 0.18±0.05Largemouth Bass 3.28±0.84 0.25±0.06Largemouth Bass* 3.12±0.74 0.14±0.05Donahue’s PondBlack Crappie* 3.49±0.76 0.06±0.05Chain Pickerel* 4.53±0.76 0.15±0.04Chain Pickerel* 2.85±0.90 0.08±0.07Chain Pickerel* 3.71±0.55 0.11±0.03Largemouth Bass* 2.48±1.01 0.11±0.06Largemouth Bass* 2.84±0.74 0.10±0.05Largemouth Bass 3.19±1.10 NDBrown Bullhead* 4.51±1.01 0.08±0.06Brown Bullhead* 3.03±0.77 0.08±0.06Brown Bullhead* 2.57±0.75 0.09±0.05Brown Bullhead* 3.10±0.92 0.09±0.06Brown Bullhead* 3.28±0.63 0.07±0.05Brown Bullhead* 2.90±0.78 0.11±0.06Brown Bullhead 2.67±1.18 NDBrown Bullhead* 3.62±0.76 0.08±0.06Brown Bullhead* 3.82±0.83 0.06±0.04
Location/Species K-40 Cs-137Lower Lake, Carmans River ------ pCi/g (Wet Weight) -----Bluegill 2.32±1.02 NDBluegill 2.39±1.00 NDBluegill 3.30±0.50 NDBluegill 3.08±0.73 NDBluegill 2.22±0.91 NDBluegill 3.26±0.75 NDBluegill 2.96±1.29 NDBluegill 2.70±0.71 NDBluegill (composite) 1.92±0.64 NDLargemouth Bass 3.31±0.78 NDLargemouth Bass 3.69±0.91 NDLargemouth Bass 2.79±0.87 NDBrown Bullhead 2.75±0.64 NDBrown Bullhead 2.36±0.86 NDBrown Bullhead 2.44±0.49 NDBrown Bullhead 2.22±0.89 NDBrown Bullhead 2.28±0.70 NDBrown Bullhead 2.44±0.67 NDBrown Bullhead 2.73±0.82 NDBrown Bullhead 2.70±0.74 NDNotes:All samples analyzed as edible portions (fillets), including composite samples. * Estimated value for Cs-137 based on lab qualifiers. K-40 occurs naturally in the environment and is presented as a comparison to Cs-137 Cs-137 = cesium 137 K-40 = potassium 40 ND = not detected based on lab qualifiers
Table 6-4. Post Cleanup Radiological Analysis of Fish from the Peconic River System and Carmans River, Lower Lake.

2015 SITE ENVIRONMENTAL REPORT6-17
CHAPTER 6: NATURAL AND CULTURAL RESOURCES
bullhead should be compared to other bottom feeders). Cesium-137 concentrations in brown bullhead collected at all locations along the Peconic River had values less than 0.14 pCi/g, wet weight. Largemouth bass, the top predator from the Peconic River, showed Cs-137 levels of 0.25 pCi/g, wet weight, or less. Levels of Cs-137 in all fish species appear to be declin-ing, compared to historic values.
Though it is clear from discharge records and sediment sampling that past BNL operations have contributed to anthropogenic (human-caused) radionuclide levels in the Peconic River system, most of these radionuclides were released between the late 1950s and early 1970s. Concentrations continue to decline over time by natural radioactive decay. Cesium-137 has a half-life of 30 years. Discharge moni-toring has demonstrated that no Cs-137 was released from the STP to the Peconic River during 2003 through 2014. Discharges from the STP to the Peconic River were discontin-ued in October 2014. Additionally, the cleanup of both on- and off-site portions of the Peconic River is estimated to have removed approxi-mately 88 percent of the identified Cs-137 in the sediment that was co-located with mercury. Removal of this contamination is expected to result in continued decreases in Cs-137 levels in fish.
6.3.3.2 Fish Population AssessmentThe relative size of fish caught during annual
sampling events are tracked and modifica-tions to future sampling events are made, as necessary, to ensure long-term health of the on-site fish populations. Successful sampling of sufficiently large fish for analysis from 2008 through 2015, even with low water lev-els in the on-site portion of the Peconic River, indicated that populations have maintained themselves. However, the combination of no further STP discharges to the Peconic River and drought conditions have resulted in the on-site portions of the Peconic River to be totally dry and no longer able to support fish. For fish populations to survive and flourish, water lev-els must be substantial enough to allow migra-tion of fish and to maintain their presence for
an extended period of time to replenish popu-lations. New criteria for the collection of fish samples have been developed. These criteria will guide the environmental monitoring ap-proach for fish.
6.3.3.3 Non-Radiological Analysis of FishBeginning in 2005, all fish of sufficient size
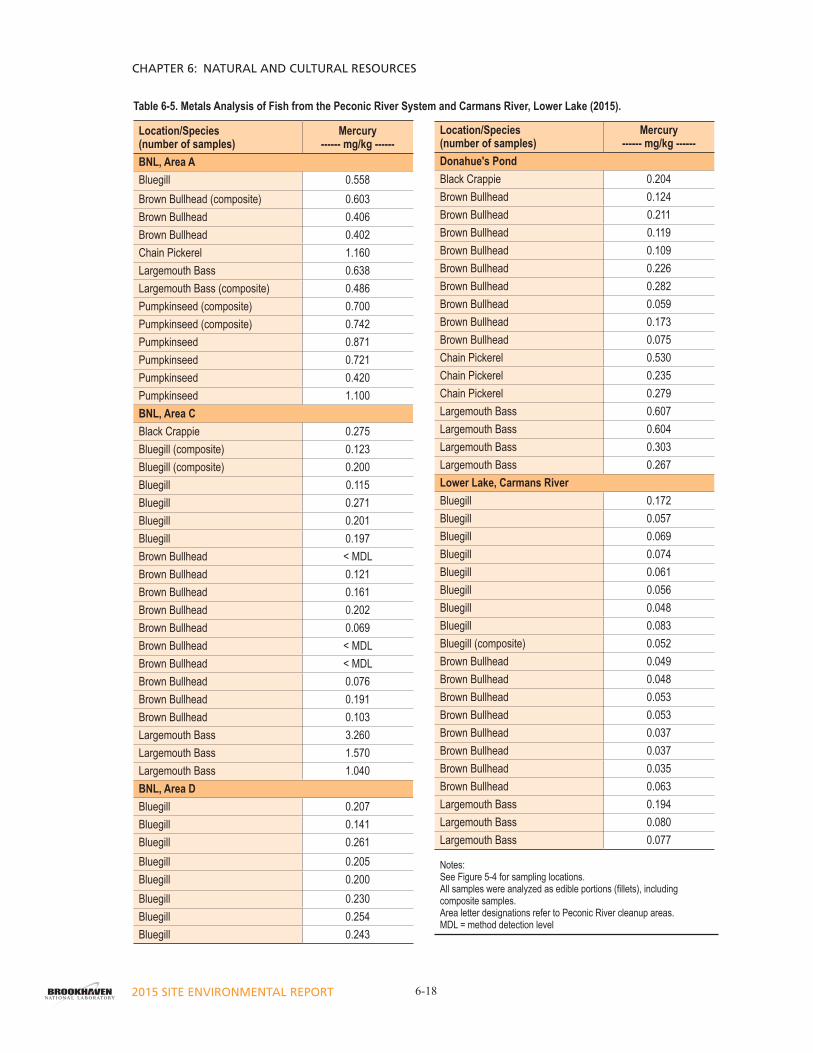
have been analyzed as edible portions (fillets). Due to its known health effects, mercury is the metal of highest concern. Results for 2015 post cleanup monitoring of the Peconic River and a comparison to data from Lower Lake on the Carmans River are shown in Table 6-5. All samples were obtained between April and mid-June. Mercury ranged from 0.40 mg/kg in brown bullhead to 1.16 mg/kg in a chain pick-erel taken from Area A; less than the method detection level (MDL) in brown bullhead to 3.26 mg/kg in a largemouth bass from Area C; from 0.14 mg/kg to 0.26 mg/kg in bluegill from Area D; and from 0.06 mg/kg in a brown bullhead to 0.61 mg/kg in a largemouth bass at Donahue’s Pond. Mercury in control fish taken from Lower Lake on the Carmans River ranged from 0.04 mg/kg in brown bullhead to 0.19 mg/kg in a largemouth bass.
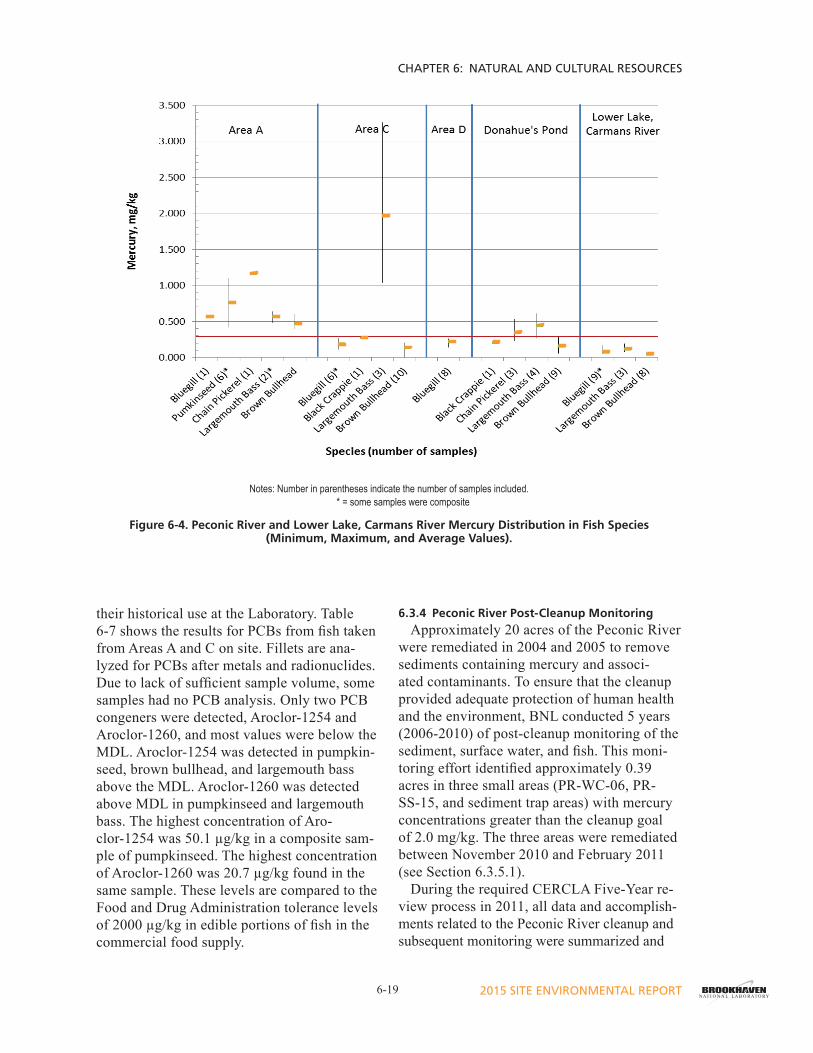
Monitoring data for mercury analysis in fish is presented as a range of results by species and location in Table 6-6 and utilizes the data regardless of whether or not it fell below MDLs in order to facilitate comparisons. The data are presented graphically in Figure 6-4. Data are typically compared to the EPA mercury water criterion of 0.3 mg/kg. Mercury values in on-site fish taken from Area A during 2015 are similar those seen in 2014 but higher than those seen in 2011 and 2012. This increase is most likely due to low water flow conditions in the river since late summer 2011, with limited open water areas and little or no flow off site. Conse-quently, fish have been isolated to the BNL site and any methylated mercury was not diluted by flow. Mercury content in fish between on-and off-site locations indicate that concentrations decrease significantly once off site, and values at Donahue’s Pond are similar to those from Lower Lake on the Carmans River.
On-site fish are monitored for PCBs due to
2015 SITE ENVIRONMENTAL REPORT 6-18
CHAPTER 6: NATURAL AND CULTURAL RESOURCES
Table 6-5. Metals Analysis of Fish from the Peconic River System and Carmans River, Lower Lake (2015).
Location/Species (number of samples)
Mercury------ mg/kg ------
Donahue's PondBlack Crappie 0.204Brown Bullhead 0.124Brown Bullhead 0.211Brown Bullhead 0.119Brown Bullhead 0.109Brown Bullhead 0.226Brown Bullhead 0.282Brown Bullhead 0.059Brown Bullhead 0.173Brown Bullhead 0.075Chain Pickerel 0.530Chain Pickerel 0.235Chain Pickerel 0.279Largemouth Bass 0.607Largemouth Bass 0.604Largemouth Bass 0.303Largemouth Bass 0.267Lower Lake, Carmans RiverBluegill 0.172Bluegill 0.057Bluegill 0.069Bluegill 0.074Bluegill 0.061Bluegill 0.056Bluegill 0.048Bluegill 0.083Bluegill (composite) 0.052Brown Bullhead 0.049Brown Bullhead 0.048Brown Bullhead 0.053Brown Bullhead 0.053Brown Bullhead 0.037Brown Bullhead 0.037Brown Bullhead 0.035Brown Bullhead 0.063Largemouth Bass 0.194Largemouth Bass 0.080Largemouth Bass 0.077
Notes: See Figure 5-4 for sampling locations. All samples were analyzed as edible portions (fillets), including composite samples. Area letter designations refer to Peconic River cleanup areas. MDL = method detection level
Location/Species (number of samples)
Mercury------ mg/kg ------
BNL, Area ABluegill 0.558Brown Bullhead (composite) 0.603Brown Bullhead 0.406Brown Bullhead 0.402Chain Pickerel 1.160Largemouth Bass 0.638Largemouth Bass (composite) 0.486Pumpkinseed (composite) 0.700Pumpkinseed (composite) 0.742Pumpkinseed 0.871Pumpkinseed 0.721Pumpkinseed 0.420Pumpkinseed 1.100BNL, Area CBlack Crappie 0.275Bluegill (composite) 0.123Bluegill (composite) 0.200Bluegill 0.115Bluegill 0.271Bluegill 0.201Bluegill 0.197Brown Bullhead < MDLBrown Bullhead 0.121Brown Bullhead 0.161Brown Bullhead 0.202Brown Bullhead 0.069Brown Bullhead < MDLBrown Bullhead < MDLBrown Bullhead 0.076Brown Bullhead 0.191Brown Bullhead 0.103Largemouth Bass 3.260Largemouth Bass 1.570Largemouth Bass 1.040BNL, Area DBluegill 0.207Bluegill 0.141Bluegill 0.261Bluegill 0.205Bluegill 0.200Bluegill 0.230Bluegill 0.254Bluegill 0.243
2015 SITE ENVIRONMENTAL REPORT6-19
CHAPTER 6: NATURAL AND CULTURAL RESOURCES
their historical use at the Laboratory. Table 6-7 shows the results for PCBs from fish taken from Areas A and C on site. Fillets are ana-lyzed for PCBs after metals and radionuclides. Due to lack of sufficient sample volume, some samples had no PCB analysis. Only two PCB congeners were detected, Aroclor-1254 and Aroclor-1260, and most values were below the MDL. Aroclor-1254 was detected in pumpkin-seed, brown bullhead, and largemouth bass above the MDL. Aroclor-1260 was detected above MDL in pumpkinseed and largemouth bass. The highest concentration of Aro-clor-1254 was 50.1 µg/kg in a composite sam-ple of pumpkinseed. The highest concentration of Aroclor-1260 was 20.7 µg/kg found in the same sample. These levels are compared to the Food and Drug Administration tolerance levels of 2000 µg/kg in edible portions of fish in the commercial food supply.
6.3.4 Peconic River Post-Cleanup MonitoringApproximately 20 acres of the Peconic River
were remediated in 2004 and 2005 to remove sediments containing mercury and associ-ated contaminants. To ensure that the cleanup provided adequate protection of human health and the environment, BNL conducted 5 years (2006-2010) of post-cleanup monitoring of the sediment, surface water, and fish. This moni-toring effort identified approximately 0.39 acres in three small areas (PR-WC-06, PR-SS-15, and sediment trap areas) with mercury concentrations greater than the cleanup goal of 2.0 mg/kg. The three areas were remediated between November 2010 and February 2011 (see Section 6.3.5.1).
During the required CERCLA Five-Year re-view process in 2011, all data and accomplish-ments related to the Peconic River cleanup and subsequent monitoring were summarized and
Notes:Number in parentheses indicate the number of samples included.* = Some samples were composite
Figure 6-4. Peconic River and Lower Lake, Carmans River Mercury Distribution in Fish Species (Minimum, Maximum, and Average Values).
Notes: Number in parentheses indicate the number of samples included. * = some samples were composite
Figure 6-4. Peconic River and Lower Lake, Carmans River Mercury Distribution in Fish Species (Minimum, Maximum, and Average Values).

2015 SITE ENVIRONMENTAL REPORT 6-20
CHAPTER 6: NATURAL AND CULTURAL RESOURCES
reviewed (BNL 2011). The Five-Year Review recommended that reduced monitoring should take place beginning in 2012. The reductions included decreasing sediment sampling to just the three areas associated with the supplemental cleanup; water monitoring was reduced from 30 locations to the current 14, and fish monitor-ing was to alternate years with the surveillance monitoring. The 2015 sediment and surface wa-ter results are described below.
6.3.4.1 Sediment Sampling
Sediment was sampled in June 2015 at three
Peconic River locations associated with the sup-plemental cleanup areas remediated during 2010 and 2011. Radiological analysis (not included in the table) of sediments at all three locations indicate that low levels of Cs-137 are present, ranging from 0.67 pCi/g to 3.71 pCi/g, which are consistent with previous analyses of the river sediments. Analysis of sediment for mer-cury identified values ranging from 0.02 mg/kg to 0.77 mg/kg taken at the 2010/2011 cleanup sites. In 2014, the highest value (7.40 mg/kg) was from a sample taken at the PR-WC-06 area and was above the 2.0 mg/kg cleanup goal for post cleanup confirmatory sampling. This result, along with the fact that concentrations above 2.0 mg/kg were seen at this location in the past, resulted in an effort to determine the extent of mercury in sediment around this point. Additional samples were collected in late 2014, and samples for the delineation of contamina-tion within an area of approximately 200 feet x 35 feet were collected through October 2015. These data are presented in Table 6-8. The area of contamination with sediment concentra-tions above 2.0 mg/kg is shown in Figure 6-5. Sampling results ranged from 0.10 to 23.0 mg/kg. The area of contamination above 2.0 mg/kg covers approximately 2,560 square feet. By the end of 2015, BNL had begun development of
Table 6-6. Mercury Analysis of Fish from the Peconic River System and Lower Lake, Carmans River.
Location/SpeciesMercury
----------μg/kg----------BNL, Area A Min. Max. Avg.Bluegill (1) 0.558 0.558 0.558Brown Bullhead 0.402 0.603 0.470Chain Pickerel (1) 1.160 1.160 1.160Largemouth Bass (2)* 0.486 0.638 0.562Pumkinseed (6)* 0.420 1.100 0.759BNL, Area CBlack Crappie (1) 0.275 0.275 0.275Bluegill (6)* 0.115 0.271 0.185Brown Bullhead (10) 0.000 0.202 0.132Largemouth Bass (3) 1.040 3.260 1.957BNL, Area DBluegill (8) 0.141 0.261 0.218Donahue's PondBlack Crappie (1) 0.204 0.204 0.204Brown Bullhead (9) 0.059 0.282 0.153Chain Pickerel (3) 0.235 0.530 0.348Largemouth Bass (4) 0.267 0.607 0.445Lower Lake, Carmans RiverBluegill (9)* 0.048 0.172 0.075Brown Bullhead (8) 0.035 0.063 0.047Largemouth Bass (3) 0.077 0.194 0.117Notes:See Figure 5-4 for sampling locations.All samples were analyzed as edible portions (fillets), including com-positesamples.Area letter designation refers to Peconic River cleanup areas on site.* One or more samples in the average were composite samples.
Table 6-7. PCB Analysis of Fish from BNL Portions of the Peconic River System. Location/Species
Aroclor-1254 Aroclor-1260
----------μg/kg----------
BNL, Area ABrown Bullhead (composite) 25.1 < MDLPumpkinseed (composite) 50.1 20.7Pumpkinseed (composite) 13.2* < MDLBNL, Area CLargemouth Bass < MDL < MDLLargemouth Bass 30.2 15.2*Largemouth Bass < MDL < MDL
Notes: All samples were analyzed as edible portions (fillets),including com-posite samples. * estimated value for reported analyte based on lab qualifiers MDL = minimum detection limit

2015 SITE ENVIRONMENTAL REPORT6-21
CHAPTER 6: NATURAL AND CULTURAL RESOURCES
Location Sample Date MercuryAnnual Sampling mg/kgST1-80-U20 06/09/15 0.02PR-WC-06-D1-L50 0.77PR-SS-15-U1-L65-0 0.20Extent of Contamination SamplingPR-WC-06-D1-L50-05 01/20/15 5.50PR-WC-06-D1-L50-06 4.20PR-WC-06-D1-L50-07 3.70PR-WC-06-D1-L50-08 0.42PR-WC-06-D1-L50-09 0.42PR-WC-06-D1-L50-10 1.10PR-WC-06-D1-L50-11 03/30/15 18.00PR-WC-06-D1-L50-12 0.50PR-WC-06-D1-L50-13 0.56PR-WC-06-D1-L50-14 0.35PR-WC-06-D1-L50-15 0.12PR-WC-06-D1-L50-16 0.21PR-WC-06-D1-L50-17 0.25PR-WC-06-D1-L50-18 16.00PR-WC-06-D1-L50-25 05/19/15 0.79PR-WC-06-D1-L50-26 0.55PR-WC-06-D1-L50-27 0.21PR-WC-06-D1-L50-28 7.60PR-WC-06-D1-L50-29 6.20PR-WC-06-D1-L50-30 6.20PR-WC-06-D1-L50-31 5.50PR-WC-06-D1-L50-32 6.60PR-WC-06-D1-L50-33 0.21PR-WC-06-D1-L50-34 0.10PR-WC-06-D1-L50-35 06/24/15 16.00PR-WC-06-D1-L50-36 18.00PR-WC-06-D1-L50-37 0.91PR-WC-06-D1-L50-38 13.00PR-WC-06-D1-L50-39 0.16PR-WC-06-D1-L50-40 2.00PR-WC-06-D1-L50-41 0.47PR-WC-06-D1-L50-42 3.50PR-WC-06-D1-L50-43 1.10PR-WC-06-D1-L50-44 2.80PR-WC-06-D1-L50-45 1.30PR-WC-06-D1-L50-46 1.30PR-WC-06-D1-L50-47 0.51PR-WC-06-D1-L50-48 0.27PR-WC-06-D1-L50-49 9.20PR-WC-06-D1-L50-50 1.80PR-WC-06-D1-L50-51 0.66PR-WC-06-D1-L50-52 1.60
Location Sample Date MercuryExtent of Contamination Sampling (continued) mg/kgPR-WC-06-D1-L50-53 0.21PR-WC-06-D1-L50-54 0.74PR-WC-06-D1-L50-55 1.40PR-WC-06-D1-L50-56 0.55PR-WC-06-D1-L50-57 07/16/15 0.30PR-WC-06-D1-L50-58 10.00PR-WC-06-D1-L50-59 3.00PR-WC-06-D1-L50-60 4.20PR-WC-06-D1-L50-61 4.50PR-WC-06-D1-L50-62 3.60PR-WC-06-D1-L50-63 0.43PR-WC-06-D1-L50-64 3.30PR-WC-06-D1-L50-65 4.70PR-WC-06-D1-L50-66 08/19/15 1.20PR-WC-06-D1-L50-67 0.86PR-WC-06-D1-L50-68 1.70PR-WC-06-D1-L50-69 3.60PR-WC-06-D1-L50-70 2.90PR-WC-06-D1-L50-71 0.49PR-WC-06-D1-L50-72 1.70PR-WC-06-D1-L50-73 6.50PR-WC-06-D1-L50-74 1.90PR-WC-06-D1-L50-75 0.32PR-WC-06-D1-L50-76 0.24PR-WC-06-D1-L50-77 0.37PR-WC-06-D1-L50-78 1.40PR-WC-06-D1-L50-79 1.30PR-WC-06-D1-L50-80 3.50PR-WC-06-D1-L50-81 3.10PR-WC-06-D1-L50-82 0.39PR-WC-06-D1-L50-83 0.94PR-WC-06-D1-L50-84 1.30PR-WC-06-D1-L50-85 1.20PR-WC-06-D1-L50-86 3.40PR-WC-06-D1-L50-87 4.30PR-WC-06-D1-L50-88 0.54PR-WC-06-D1-L50-89 0.29PR-WC-06-D1-L50-90 1.40PR-WC-06-D1-L50-91 3.20PR-WC-06-D1-L50-92 2.00PR-WC-06-D1-L50-93 1.80PR-WC-06-D1-L50-94 1.60PR-WC-06-D1-L50-95 5.10PR-WC-06-D1-L50-96 1.70PR-WC-06-D1-L50-97 0.60PR-WC-06-D1-L50-98 09/09/15 0.60
Table 6-8. Peconic River Post-Cleanup Annual and Extent of Contamination Sampling for Mercury.
(continued on next page)

2015 SITE ENVIRONMENTAL REPORT 6-22
CHAPTER 6: NATURAL AND CULTURAL RESOURCES
plans for removal of the contaminated material and continued to communicate with stakehold-ers and regulators.
6.3.4.2 Water Column SamplingSurface water was analyzed in June and July
2015 for total mercury and methyl mercury at three of the 14 Peconic River sampling stations each month. Water column sampling locations are shown on Figure 6-6. Eleven stations could not be sampled in both June and July due to be-ing too shallow or dry and the former STP outfall being removed due to the transfer of discharge to groundwater recharge basins in October 2014. To-tal Suspended Solids (TSS) are reported in Table 6-9 because TSS values can provide an indica-tion of the quality of the sample collection effort. Low TSS indicates a sample was taken without
disturbing bottom sediments, whereas samples with high TSS values might explain, in part, unusually high mercury values due to increased particles that may contain mercury. The total mer-cury concentrations above the former STP outfall were lower than the two samples taken further downstream in both June and July. The typical pattern of declining mercury and methyl mercury concentrations downstream of the former outfall is not apparent in these data, due in part to the lack of sufficient samples collected during the year result-ing from the river being mostly dry.
Methyl mercury is the form of mercury that is bio-available to aquatic organisms. Methyl mer-cury was measured at three monitoring stations in both June and July. In June, methyl mercury ranged from 2.7 ng/L at the station immediately upstream of the former STP outfall to 1.3 ng/L
Location Sample Date MercuryExtent of Contamination Sampling (continued) mg/kgPR-WC-06-D1-L50-99 0.47PR-WC-06-D1-L50-100 2.50PR-WC-06-D1-L50-101 23.00PR-WC-06-D1-L50-102 0.22PR-WC-06-D1-L50-103 10/08/15 4.00PR-WC-06-D1-L50-104 0.87PR-WC-06-D1-L50-105 2.40PR-WC-06-D1-L50-106 3.70PR-WC-06-D1-L50-107 2.10PR-WC-06-D1-L50-108 2.40PR-WC-06-D1-L50-109 0.19PR-WC-06-D1-L50-110 2.60PR-WC-06-D1-L50-111 2.30PR-WC-06-D1-L50-112 1.80PR-WC-06-D1-L50-113 2.70PR-WC-06-D1-L50-114 0.94PR-WC-06-D1-L50-115 3.50PR-WC-06-D1-L50-116 1.00PR-WC-06-D1-L50-117 3.40PR-WC-06-D1-L50-118 1.40PR-WC-06-D1-L50-119 0.18PR-WC-06-D1-L50-120 0.21PR-WC-06-D1-L50-121 1.10PR-WC-06-D1-L50-122 0.77PR-WC-06-D1-L50-123 2.60
Location Sample Date MercuryExtent of Contamination Sampling (continued) mg/kgPR-WC-06-D1-L50-124 2.30PR-WC-06-D1-L50-125 0.55PR-WC-06-D1-L50-126 0.28PR-WC-06-D1-L50-127 3.30PR-WC-06-D1-L50-128 4.50PR-WC-06-D1-L50-129 0.21PR-WC-06-D1-L50-130 Location 0.30PR-WC-06-D1-L50-131 1.00PR-WC-06-D1-L50-132 0.40PR-WC-06-D1-L50-133 3.10PR-WC-06-D1-L50-134 0.44PR-WC-06-D1-L50-135 2.40PR-WC-06-D1-L50-136 0.19PR-WC-06-D1-L50-137 2.40PR-WC-06-D1-L50-138 0.17PR-WC-06-D1-L50-139 2.10PR-WC-06-D1-L50-140 1.10PR-WC-06-D1-L50-141 4.60PR-WC-06-D1-L50-142 1.40PR-WC-06-D1-L50-143 2.30PR-WC-06-D1-L50-144 2.00PR-WC-06-D1-L50-145 2.40PR-WC-06-D1-L50-146 1.40Note: See Figure 6-5 for extent of contamination associated with sampling effort.
Table 6-8. Peconic River Post-Cleanup Annual and Extent of Contamination Sampling for Mercury. (concluded)

2015 SITE ENVIRONMENTAL REPORT6-23
CHAPTER 6: NATURAL AND CULTURAL RESOURCES
Figure 6-5. Peconic River Mercury Contamination.

2015 SITE ENVIRONMENTAL REPORT 6-24
CHAPTER 6: NATURAL AND CULTURAL RESOURCES
PR-W
C-1
4
PR-W
C-1
3PR
-WC
-11
PR-W
C-1
0
PR-W
C-0
9
PR-W
C-0
8PR
-WC
-07
PR-W
C-0
6 PR-W
C-0
5
PR-W
C-0
3
PR-W
C-0
2
PR-W
C-0
4
STP
-EFF
-UV
G
PR-W
C-1
5
PR-W
C-1
2-D
7
00.
51
Kilo
met
ers
00.
250.
5M
iles
Figu
re 6-
. Pec
onic
Rive
r Wat
er S
ampl
e Loc
atio
ns, 2
015.
Fig
ure
6-6
. Pec
on
ic R
iver
Sam
ple
Lo
cati
on
s, 2
015.
N

2015 SITE ENVIRONMENTAL REPORT6-25
CHAPTER 6: NATURAL AND CULTURAL RESOURCES
at the station approximately 2.1 miles below the former STP outfall. In July, methyl mercury values ranged from 1.4 ng/L above the former STP outfall down to 0.48 ng/L approximately 1.1 miles below the former STP outfall.
Continued monitoring of the river for mercury and methyl mercury will be addressed in 2016 during the Five-Year Review process. With the removal of STP discharges to the river, water level conditions in the river are dependent on seasonal precipitation rates and groundwater conditions. The on-site portion of the Peconic River has been mostly dry since June 2015.
6.3.5 Vegetation Sampling6.3.5.1 Grassy Plants and Soil
During 2015, grassy vegetation samples were collected from 12 locations around the Labora-tory (Figure 6-7). All samples were analyzed for Cs-137 (see Table 6-10). Cs-137 content in vegetation ranged from non-detectable to 0.43 pCi/g, wet weight. Five of the 12 samples had
detectable levels of Cs-137. All values are consis-tent with historic monitoring. Monitoring results for grassy vegetation is utilized for the annual dose to biota analysis reported in Chapter 8.
Soil sampling was conducted at the same 12 locations where the grassy vegetation was col-lected and analyzed for Cs-137 (Table 6-10). Cs-137 concentrations in soils ranged from 0.05 pCi/g, dry weight, to 2.84 pCi/g, dry weight. These values were consistent with past soil monitoring results.
6.4 OTHER MONITORING 6.4.1 Basin Sediments
A 5-year cycle for the collection of recharge basin sediment samples was established in 2003. There are 11 recharge basins that receive water discharges that are permitted under the Laboratory’s State Pollutant Discharge Elimi-nation System (SPDES) permit (see Figure 5-5 for outfall locations). Basin sediments were last sampled in 2012 and results were
Table 6-9. Post Cleanup Peconic River Water Column Monitoring (2015).
Location Station DescriptionDist from
STP (miles)
June 2015 July 2015
MercuryMethyl
Mercury TSS MercuryMethyl
Mercury TSS
-------- ng/L -------- mg/L -------- ng/L -------- mg/L
PR-WC-15 Upstream of Forest Path -0.17 SW SW SW SW SW SWPR-WC-14 Upstream of STP -0.13 SW SW SW SW SW SWPR-WC-13 Upstream of STP -0.07 SW SW SW SW SW SWPR-WC-12-D7 Downstream of Sump -0.04 10 2.7 < MDL 3.4 1.4 < MDLSTP-EFF-UVG Grab Sample 0 No Discharge in 2015PR-WC-11DS "50"" downstream of outfall" 0.01 SW SW SW SW SW SWPR-WC-10 West of HMN 0.3 SW SW SW SW SW SWPR-WC-09 Downstream of HMN 0.56 SW SW SW SW SW SWPR-WC-08 South of Area B 0.78 21 1.6 < MDL SW SW SWPR-WC-07 South of Area C 0.96 SW SW SW SW SW SWPR-WC-06 South of Area D 1.1 SW SW SW 4.7 0.48 8PR-WC-05 Downstream of HQ 1.46 SW SW SW SW SW SWPR-WC-04 2nd downstream of HQ 1.7 SW SW SW SW SW SWPR-WC-03 3rd west of Schultz Rd. 2.1 20 1.3 4 26 1.2 7PR-WC-02 2nd west of Schultz Rd. 2.52 SW SW SW SW SW SW
Notes: See Figure 6-5 for Peconic River water sampling locations. MDL= Method Detection Level SW = water too shallow to sample or location was dry

2015 SITE ENVIRONMENTAL REPORT 6-26
CHAPTER 6: NATURAL AND CULTURAL RESOURCES
STP
Old
Filt
er
Bed
STP
Old
Filt
er
Bed
STP
Old
Filt
er
Bed
STP
Old
Filt
er
Bed
STP
Old
Filt
er
Bed
Are
a S
W o
f AG
S
Eas
t Fire
Bre
ak
N o
f Eas
t Fift
h A
ve.
Nor
th o
f B
ldg.
528
P7
Are
a
Wea
ver R
d
Prin
ce P
ath
650
Sum
p
Mea
dow
Mar
sh F
ield
Bro
okha
ven
Ave
. E
ast o
f NO
AA
Eas
t For
e B
reak
@
Pec
onic
Rvi
er
Z-P
ath
N. o
f P
econ
ic R
iver
Pon
d 6P
ond
9
00.
51
Kilo
met
ers
00.
250.
5M
iles
Figu
re 6-
. Veg
etat
ion
Sam
ple L
ocat
ions
, 201
5.Fi
gu
re 6
-7. V
eget
atio
n S
amp
le L
oca
tio
ns,
201
5.
N

2015 SITE ENVIRONMENTAL REPORT6-27
CHAPTER 6: NATURAL AND CULTURAL RESOURCES
summarized in the 2012 Site Environmental Report (BNL, 2013b). The next round of rou-tine basin sampling will be conducted in 2017.
6.4.2 Radiological and Mercury Monitoring of Precipitation
During 2015, precipitation samples were col-lected quarterly at air monitoring Stations P4 and S5 (see Figure 4-2 for station locations). The samples were analyzed for radiological content and total mercury (see Table 6-11). Gross beta activity was measured in samples collected during all four quarters at monitoring stations P4 and S5. Location P4 had a maximum gross beta activity level of 4.61 pCi/L in the third quarter of 2015. Location S5 had a maxi-mum gross beta activity level of 5.72 pCi/L, also in the third quarter. Gross beta, gamma, and strontium-90 (Sr-90) (no detection) activity values were within the range of historically ob-served values at these two locations.
Mercury concentrations in precipitation have been measured at BNL since 2007. Analysis of mercury in precipitation is conducted to docu-ment mercury deposition that is attributable to off-site sources. This information is compared to Peconic River monitoring data and aids in understanding the sources of mercury within the Peconic River watershed. Mercury was detected in all of the precipitation samples collected at both sampling stations. Mercury ranged from 1.97 ng/L at station S5 in October to 18.2 ng/L at station P4 in July. This range is one twelfth to three fourths of the highest value measured in precipitation, 24.6 ng/L, re-corded in 2013.
6.5 WILDLIFE PROGRAMS
BNL sponsors a variety of educational and outreach activities involving natural resources. These programs are designed to help partici-pants understand the ecosystem, foster an in-terest in science, and to provide a meaningful experience for interns in preparation for fur-ther studies or a career. Wildlife programs are conducted at the Laboratory in collaboration with DOE, local agencies, colleges, and high schools. Ecological research is also conducted on site to update the current natural resource
inventory, gain a better understanding of the ecosystem, and guide management planning.
In 2015, BNL hosted 22 student interns and one faculty member. Two of the interns worked with a faculty member from Dowling College as part of the BNL Visiting Faculty Program (VFP) and 20 interns participated in research associated with various projects including sev-eral related to the LISF. The Natural Resource program typically supports two interns in the spring, three in the fall, and the remainder par-ticipate in the summer internship program.
The VFP team continued ongoing work on statistical analysis of migratory bird data and meteorological data to determine the potential for placing one or more wind turbines on site.
Work associated with the LISF involved tracking 24 eastern box turtles outfitted with transmitters to determine home range sizes. Many of the turtles were captured in or near the LISF in order to determine if they utilize habitats found in the facility. Since 2011, stu-dent interns have followed a total of 42 turtles; as a result, BNL is building a very good un-derstanding of their habits. Turtles are also permanently marked to facilitate identification of individual turtles as part of a mark recapture effort. As more turtles are marked, more recap-tures are occurring, providing good long-term movement data.
Interns also conducted surveys in and around the LISF to study the relationship and impacts of this facility on the local ecosystems. Veg-etation data were gathered on paired transects during the summer and fall and paired small mammal trapping grids looked at variations in small mammal populations both inside and outside of the LISF to compare recruitment of small mammals from the forest to the im-mediate interior of the solar farm (one grid on either side of the LISF fence). Paired transects for vegetation allow comparison of vegetation growth and establishment inside and outside of the LISF. In addition, interior transects were established based on the vegetative assem-blage that existed prior to construction.
To facilitate the analysis of the wildlife surveillance data and to develop plans for the placement of transects, trapping grids and

2015 SITE ENVIRONMENTAL REPORT 6-28
CHAPTER 6: NATURAL AND CULTURAL RESOURCES
placement of cameras are used. All surveil-lance data are entered into databases and a GIS is used to visualize the data.
In March 2011, a northern long-eared bat was found on the ground outside a building on site. The bat appeared to have discoloration on the fur around its muzzle and was reported to NYSDEC as a possible incidence of white-nose syndrome. The bat was the first recorded incidence of white-nose syndrome on Long Is-land. As a result, BNL and NYSDEC established permanent acoustical survey routes on Long Island for monitoring. The northern long-eared bat was listed as a threatened species under the Endangered Species Act on April 2, 2015. During summer 2015, a bat specialist captured bats on site using mist-netting. These results were com-pared to 2012-2014 efforts and confirmed that
Table 6-10. Radiological Analysis of Grassy Vegetation and Associated Soils.
Location/Matrix
K-40 Cs-137
pCi/g (Wet Weight)
pCi/g (Wet Weight)
North of Bldg. 528Vegetation 3.84±0.50 NDSoil* 7.26±0.90 0.16±0.06Meadow Marsh FieldVegetation 4.74±0.39 NDSoil 6.43±0.80 0.21±0.05East Fire Break N of East Fifth Ave.Vegetation 3.67±0.47 NDSoil* 6.03±0.70 0.05±0.04Pond 9Vegetation 3.53±0.43 0.43±0.03Soil 11.10±1.45 2.84±0.19Pond 6Vegetation 2.41±0.46 0.42±0.04Soil 12.00±1.20 0.34±0.06650 SumpVegetation* 5.26±0.44 0.05±0.04Soil 6.66±0.80 0.28±0.04Weaver RdVegetation* 4.14±0.33 0.02±0.01Soil 5.28±0.68 0.23±0.05Prince PathVegetation 4.57±0.37 NDSoil 3.33±0.43 0.33±0.04P9 AreaVegetation 3.72±0.39 NDSoil* 8.50±1.06 0.10±0.06Brookhaven Ave. East of NOAAVegetation* 3.08±0.26 0.05±0.01Soil 5.92±0.53 0.89±0.06Z-Path N. of Peconic RiverVegetation 3.84±0.42 NDSoil 4.19±0.58 0.25±0.05East Fire Break @ Peconic RiverVegetation 3.53±0.35 NDSoil* 9.16±0.75 0.13±0.04Notes: All values are shown with a 95% confidence interval. Radiological values for soils are on a ‘dry weight’ basis. K-40 occurs naturally in the environment and is presented as a com-parison to Cs-137. Cs-137 = cesium-137 K-40 = potassium-40 ND = not detected * Estimated value for Cs-137 based on lab qualifiers
Table 6-11. Precipitation Monitoring (Radiological and Mercury).
Location/Period
Gross Alpha Gross Beta Mercury
-------------- pCi/L -------------- ng/LP401/07/15 - - 6.0101/30/15 2.01±1.00 1.87±0.72 -04/10/15 - - 14.1
04/30/15 ND 1.87±0.69 -07/10/15 - - 18.207/30/15 1.82±1.05 4.61±1.0410/06/15 - - 10.110/30/15 ND 1.61±0.74 -S501/07/15 - - 7.2701/30/15 ND 1.90±0.72 -04/10/15 - - 13.504/30/15 ND 1.21±0.66 -07/10/15 - - 11.707/31/15 2.66±1.06 5.72±1.17 -10/06/15 - - 1.9710/30/15 ND 2.07±0.79 -Notes: Method detection limit for mercury is 0.2 ng/L. - = parameter not tested on date ND = not dected P4 = precipitation sampler near BNL apartment area S5 = precipitation sampler near BNL Sewage Treatment Plant

2015 SITE ENVIRONMENTAL REPORT6-29
CHAPTER 6: NATURAL AND CULTURAL RESOURCES
white-nosed syndrome has had a major impact on certain bat species, particularly the northern long-eared bat, which showed a dramatic reduc-tion in population at BNL based upon 15 captures in 2012, 1 in 2013, 2 ‘young of the year’ in 2014, and none in 2015. Reports of northern long-eared bats on Shelter Island were occurring in Decem-ber 2015, suggesting that there is potential for the population to survive and over-winter on Long Island even if at low population densities.
In 2015, BNL continued to participate in several events in support of ecological educa-tion programs including: providing on-site ecology tours; hosting the Twentieth Annual Pine Barrens Research Forum for ecosystems researchers to share and discuss their results; participation in the Sixth Annual Pine Barrens Discovery Day held at the Wertheim National Wildlife Refuge; and assisting the Central Pine Barrens Commission on “A Day in the Life of the Rivers,” which allowed students from mul-tiple school districts to acquire environmental and biological data about the Carmans, Peconic, and Nissequogue Rivers. On four separate days, over 30 partner organizations and agencies, 29 school districts, and over 1,500 students collect-ed scientific information for analysis to be used to portray the status of the rivers and estuary systems. These events provide students hands-on experience with field techniques in catching fish, invertebrate sampling, biodiversity inven-tory, and water chemistry. In addition, BNL is in the 12th year of the Open Space Stewardship Program (OSSP) and worked with 30 schools and over 3,000 students in 2015. The OSSP enables students to engage in activities to solve problems within their local community through scientific discovery, conservation, and steward-ship. The effort integrates outdoor research with school curricula in language arts, civics, com-munity service, and media arts. Participation in OSSP creates an opportunity for many students to enhance their educational experiences as well as to promote the realization that a career in science and technology is accessible with the proper academic coursework and interaction with teachers and field experts who have a pas-sion for discovery and mentorship.
The Laboratory also hosts the annual New
York Wildfire & Incident Management Acad-emy, offered by NYSDEC and the Central Pine Barrens Commission. Using the Incident Com-mand System of wildfire management, this academy trains firefighters in the methods of wildland fire suppression, prescribed fire, and fire analysis. BNL has developed and is imple-menting a Wildland Fire Management Plan. The Laboratory continues the use of prescribed fire for fuel and forest management and is work-ing with NYSDEC to conduct growing season fires in northern and eastern sections of the BNL property. A growing season prescribed fire was planned to take place in June 2015; how-ever, extended drought conditions prevented implementation.
6.6 CULTURAL RESOURCE ACTIVITIES
The BNL Cultural Resource Management (CRM) Program ensures that the Laboratory fully complies with numerous cultural resource regulations. The Cultural Resource Management Plan for Brookhaven National Laboratory (BNL 2013a) guides the management of all of the Laboratory’s historical resources. BNL’s cul-tural resources include buildings and structures, World War I (WWI) earthwork features, the Camp Upton Historical Collection, scien-tific equipment, photo/audio/video archives, and in-stitutional records. As various cultural resources are identified, plans for their long-term steward-ship are developed and implemented. Achieving these goals will ensure that the contributions BNL and the site have made to our history and culture are documented and available for interpretation.
The Laboratory has three structures or sites that have been determined to be eligible for list-ing on the National Register of Historic Places: the Brookhaven Graphite Research Reactor (BGRR) complex, the High Flux Beam Reactor (HFBR) complex, and the WWI training trench-es associated with Camp Upton. The trenches are examples of the few surviving WWI earth-works in the United States.
In 2014, BNL submitted a Section 106 re-view concerning the planned demolition of four structures on site to the New York State Historic Preservation Office (NYSHPO) for review as

2015 SITE ENVIRONMENTAL REPORT 6-30
CHAPTER 6: NATURAL AND CULTURAL RESOURCES
required under the National Historic Preser-vation Act. Although the four buildings were auxiliary support structures associated with the early history of BNL, they were determined not to have played a significant contribution. The NYSHPO requested additional analysis in order to provide concurrence with the finding. Discus-sions with the NYSHPO concluded on the topic in 2015 with a NYSHPO concurrence with the Section 106 findings.
In 2014, the Laboratory loaned the Long Is-land History Museum materials from the Camp Upton Collection covering both World War I and WW II for their display on “Long Island at War.” The materials were returned to BNL early in 2015. A small display on Camp Upton is continually maintained at the Laboratory’s cafeteria and conference center in Berkner Hall. The display is reviewed each year for changes before the Summer Sundays program starts in July. During Summer Sundays 2015, a ‘History of the BNL Site’ and the “Construction of Camp Upton” talks were presented to visitors. The Laboratory also made arrangements for the loan of materials associated with “Tennis for Two,” which is considered to be the first video game. Materials were loaned to the New York Histori-cal Society Museum and Library in New York City, and the Stron Museum, National Museum of Play in Rochester, New York.
The Laboratory undergoes an annual external assessment as part of its ISO 14001 certification, which is discussed in Chapter 2, and in 2014, the Cultural Resource Management program was evaluated. The Cultural Resource Management Plan contains a Standard Operating Procedure (SOP) for the tagging of cultural resource items. This SOP had not been implemented due to staff-ing issues. The assessment listed the finding as a non-conformance and corrective actions were required to ensure that the tagging program was implemented. An intern project was posted at C.W. Post Library Sciences department and an intern was selected and scheduled to start on the project by year’s end. The tagging of historically significant items was implemented in 2015 with new items being tagged as they are identified.
REFERENCES AND BIBLIOGRAPHY
BNL. 2011. Natural Resource Management Plan for Brookhaven National Laboratory. BNL-96320-2011. Brookhaven National Laboratory, Upton, NY.
BNL, 2011. Five-Year Review Report for Brookhaven National Laboratory Superfund Site, March 2011.
BNL. 2013a. Cultural Resource Management Plan for Brookhaven National Laboratory. BNL-100708-2013. Brookhaven National Laboratory, Upton, NY. May 2013.
BNL. 2013b. 2012 Site Environmental Report. BNL-101643-2013. Brookhaven National Laboratory, Upton, NY. October 2013
Dwyer, Norval. 1966. Brookhaven National Laboratory. Long Island Forum (reprint), West Islip, NY.
IAEA. 1992. Effects of Ionizing Radiation on Plants and Animals at Levels Implied by Current Radiation Protection Standards. Technical Report Series No. 332. International Atomic Energy Agency, Vienna.
LMS. 1995. Phase II Sitewide Biological Inventory Report, Final. Lawler, Matusky & Skelly Engineers. Pearl River, NY.
Rispoli, F. J., Zeng, S., Green, T., Higbie, J. “Even birds fol-low pareto’s 80-20 rule.” Significance Statistics Making Sense Feb. 2014.
NYSDOH. 1999. Deer Meat Contaminated with Cesium-137 at Brookhaven National Laboratory. Bureau of Environmental Radiation Protection, New York State Department of Health, Albany, NY.
Rispoli, Fred J., Green Timothy, Fasano, Thomas A., Shah, Vishal, 2014. The effect of environmental remediation on the cesium-137 levels in white-tailed deer. Environmental Science and Pollution Research Oct. 2014, 21(19): 11598-11602.