Natural and Artificial Barriers for Spray Drift Exposure ...€¦ · Natural and Artificial...
16
Natural and Artificial Barriers for Spray Drift Exposure Mitigation in South Australia A Research Project for Primary Industries and Resources South Australia (PIRSA) Andrew Hewitt, PhD Gary Dorr, PhD Peter Hughes Toni Axford, PIRSA The Centre for Pesticide Application and Safety The University of Queensland, Gatton QLD 4343
Transcript of Natural and Artificial Barriers for Spray Drift Exposure ...€¦ · Natural and Artificial...

Natural and Artificial Barriers for Spray Drift Exposure Mitigation in South Australia
A Research Project for Primary Industries and Resources South Australia (PIRSA)
Andrew Hewitt, PhD Gary Dorr, PhD
Peter Hughes Toni Axford, PIRSA
The Centre for Pesticide Application and Safety The University of Queensland, Gatton QLD 4343

Summary A field study was conducted to evaluate the effectiveness of natural and artificial barriers in vineyards for reducing spray drift exposure from two types of sprayer. There was a difference in drift potential between the two sprayers and the two barriers. In agreement with previous studies, the natural vegetation barrier afforded slightly higher drift reduction than the artificial barrier at near-field distances with a slight increase in deposition at a distance of 20 x barrier height. Additional research is recommended to evaluate the effects of additional parameters such as canopy type, meteorological conditions and application practices on drift with and without protective barriers.

Introduction This project was conducted to collect data for the assessment of the effectiveness of natural and artificial barriers for reducing spray drift exposure to urban areas from pesticide application to vineyards in South Australia. Previous research (e.g. Spray Drift Task Force, 1997) has shown that when pesticides are applied using conventional airblast equipment to tree and vine crops, approximately 0.5% of the applied product can move off-target through spray drift. Such movements can be significantly reduced using wrap-around sprayer and other equipment technologies (Hewitt, 2001a). Spray drift exposure in viticulture can be estimated using models such as AgDRIFT (Hewitt, 2002); however, such models only provide limited options for definition of sprayer, canopy and meteorological conditions and ignore the effect of natural and artificial barriers on spray drift. A literature review of previous research suggested that hedges and artificial barriers may reduce spray drift exposure for sensitive areas immediately behind the barrier by 60-90% (Hewitt, 2001b). However, recent modelling in Australia and drift/ air flow studies in Canada and New Zealand (personal communication, Tom Wolf, Agriculture and Agri-Food Canada) suggest that in many cases, far-field drift may actually increase from such barriers as air is directed over the top of the barrier, with deposition at a distance of approximately 20 times the height of the barrier, or as determined by the droplet size, meteorological and surface roughness conditions for the specific application. There is increasing pressure on spray drift management at the rural-urban interface as residential developments approach land occupied for agricultural use. Guidelines have been developed in several states (e.g. Dept of Natural Resources, 1997) for optimization of barriers between urban and rural land. Typically such guidelines recommend that a hedge be considered for interception of spray drift and protection of the urban land from pesticide applications on adjacent rural land. Such a barrier might comprise a vegetated buffer of height 1.5 times that of the spray release height and width 20 m with a 10 m open strip on either side for maintenance and air flow movement. The composition is recommended to include mixed species providing a total optical/ aerodynamic porosity of 30 to 50% with no open spaces at ground or other levels. These barriers are considered suitable for protection of areas immediately in their wake from spray drift as well as offering noise reduction and other benefits. The 20 m width is based on reasonable worst-case drift exposure risk which is usually from aerial application scenarios. Shorter distances may be acceptable for ground-based spraying scenarios and pesticides of low toxicity concern. The present study provided a preliminary investigation of the effectiveness of vegetation and artificial netting barriers on reducing spray drift exposure including a comparison of two types of vineyard sprayer in the Adelaide hills of South Australia. Additional research is recommended to further explore the many factors that determine the effectiveness and optimization of such barriers.
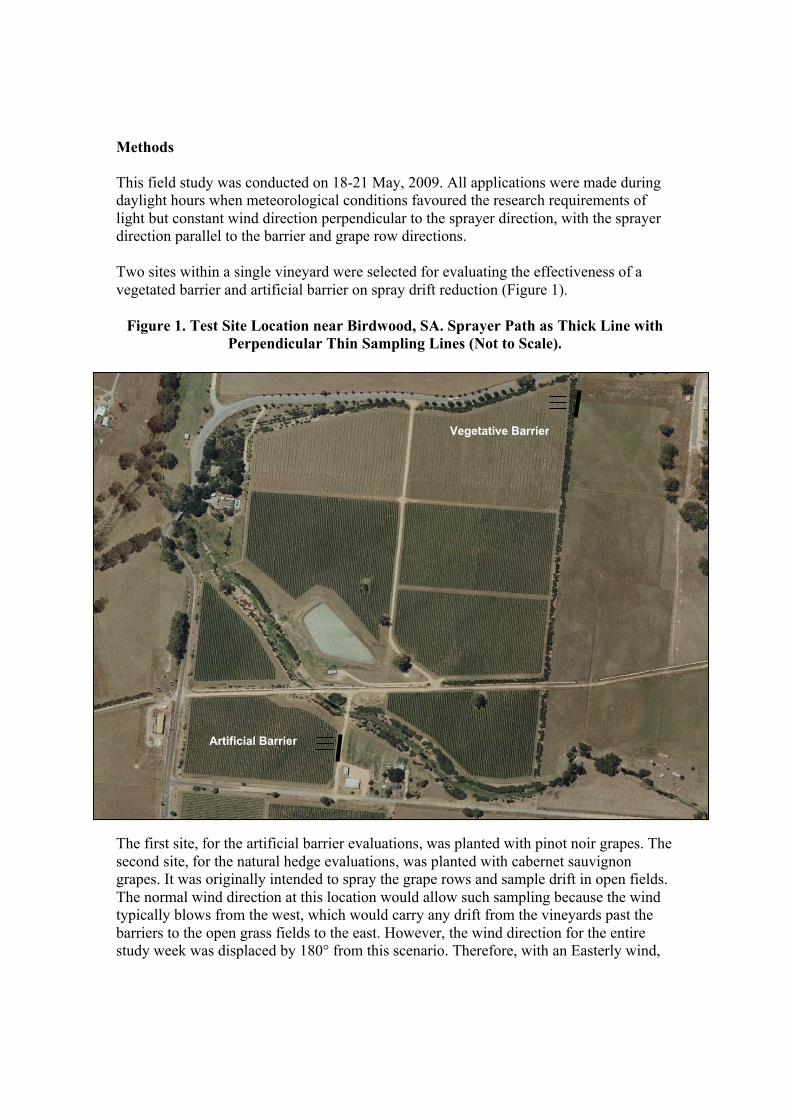
Methods This field study was conducted on 18-21 May, 2009. All applications were made during daylight hours when meteorological conditions favoured the research requirements of light but constant wind direction perpendicular to the sprayer direction, with the sprayer direction parallel to the barrier and grape row directions. Two sites within a single vineyard were selected for evaluating the effectiveness of a vegetated barrier and artificial barrier on spray drift reduction (Figure 1).
Figure 1. Test Site Location near Birdwood, SA. Sprayer Path as Thick Line with Perpendicular Thin Sampling Lines (Not to Scale).
The first site, for the artificial barrier evaluations, was planted with pinot noir grapes. The second site, for the natural hedge evaluations, was planted with cabernet sauvignon grapes. It was originally intended to spray the grape rows and sample drift in open fields. The normal wind direction at this location would allow such sampling because the wind typically blows from the west, which would carry any drift from the vineyards past the barriers to the open grass fields to the east. However, the wind direction for the entire study week was displaced by 180° from this scenario. Therefore, with an Easterly wind,
±
0 0.1 0.20.05
Kilometers
Artificial Barrier
Vegetative Barrier

the sprayer direction was N-S as shown with thick lines immediately to the east of the vineyard sampling blocks, and the three spray drift deposition collection lines were perpendicular to the sprayer path, providing sampling stations at distances of approximately -0.5 (i.e. immediately upwind of the barrier), 2.5, 5, 10, 20, 40, 60 and 80 m to the west (i.e. downwind) of the barrier. The spacing between sampling lines was approximately 6 m (Figure 2). The grape canopies were early-dormant, meaning that some foliage remained on the vines, with a higher foliage density at the Cabernet Sauvignon site than for the Pinot Noir grapes (Figures 3 and 4). The vines were approximately 2 m in height, with a between row spacing of 2.85 m and in-row spacing of 1.9 m. The land was gently sloping, being slightly higher to the SW and sloping downwards to the NE at the Pinot Noir site and flat to gently sloping upwards to the west for the Cabernet Sauvignon site.
Figure 2. Spacing of Sampling Rows – Vegetated Barrier (vineyard side)
Figure 3. Pinot Noir
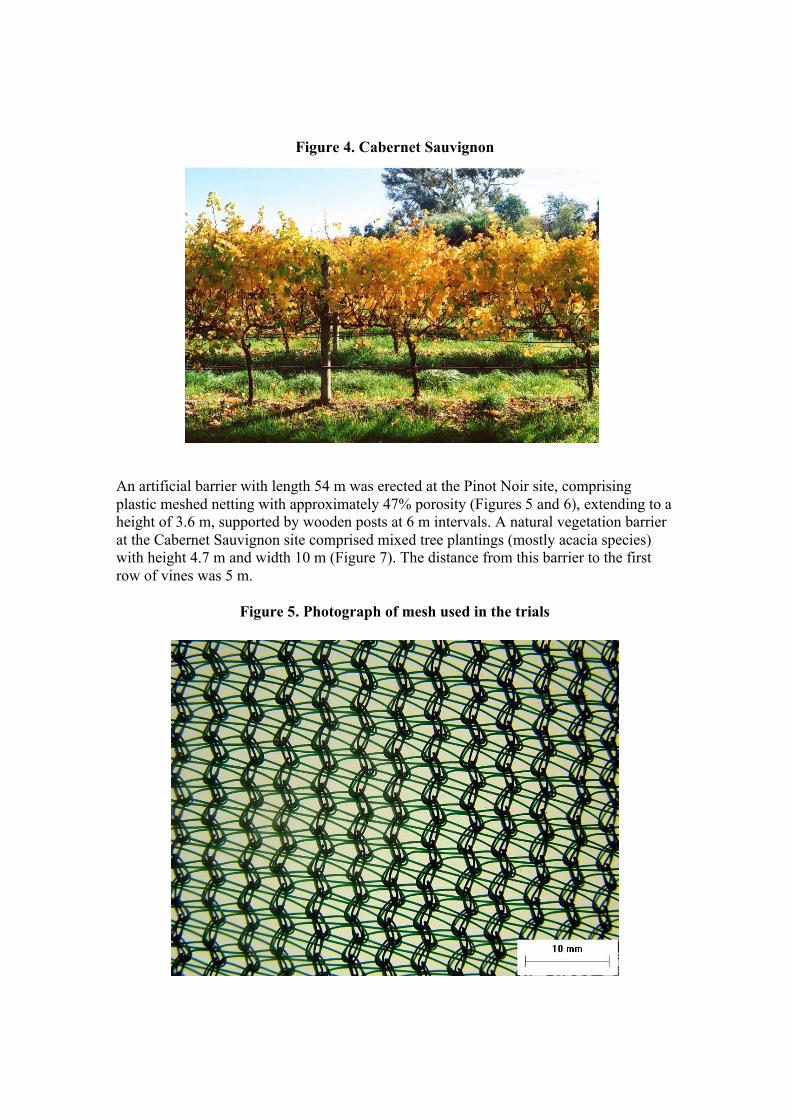
Figure 4. Cabernet Sauvignon An artificial barrier with length 54 m was erected at the Pinot Noir site, comprising plastic meshed netting with approximately 47% porosity (Figures 5 and 6), extending to a height of 3.6 m, supported by wooden posts at 6 m intervals. A natural vegetation barrier at the Cabernet Sauvignon site comprised mixed tree plantings (mostly acacia species) with height 4.7 m and width 10 m (Figure 7). The distance from this barrier to the first row of vines was 5 m.
Figure 5. Photograph of mesh used in the trials
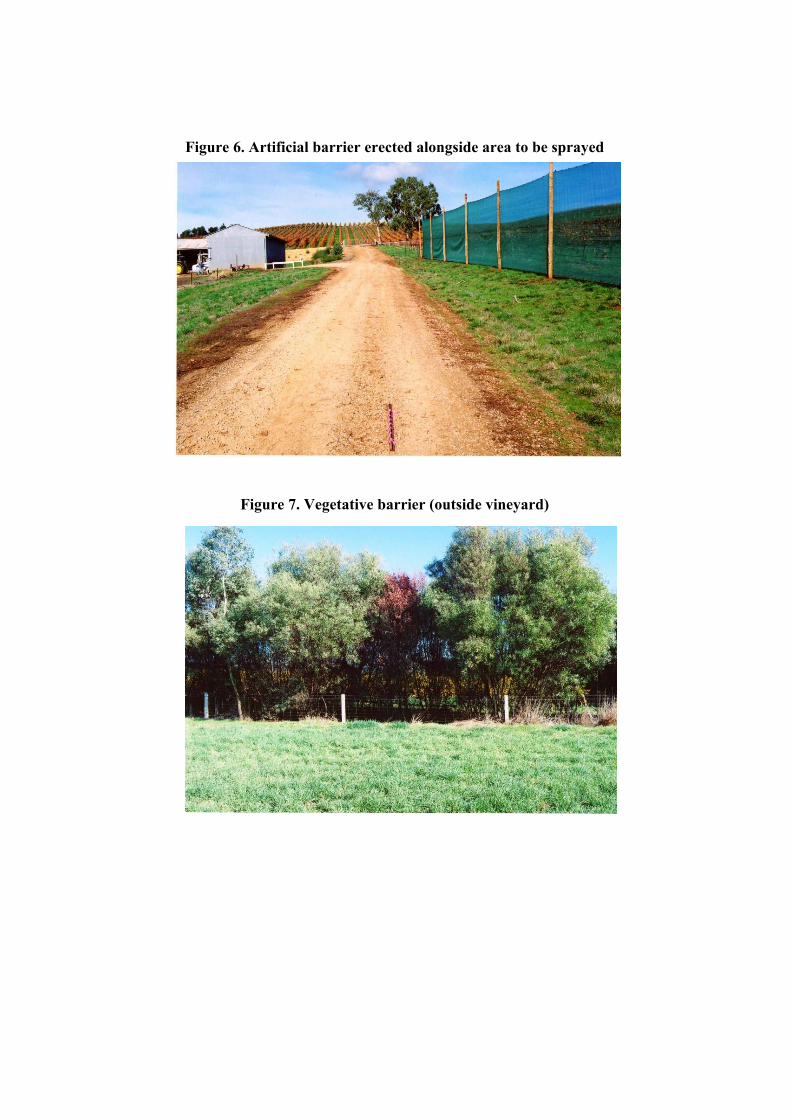
Figure 6. Artificial barrier erected alongside area to be sprayed
Figure 7. Vegetative barrier (outside vineyard)

The sprayer tank was filled with water and Pyranine 10G fluorescent dye at a rate of approximately 1 g/L. Single swath spray applications were made while monitoring the wind speed, wind direction, air temperature and relative humidity. The sprayers were calibrated to deliver an application volume rate of 500 L/ha. Two sprayers were evaluated: a Silvan Turbomiser (Figure 8) and Bertolini (Figure 9).
Figure 8. Silvan Turbomiser sprayer used in this trial
Figure 9. Bertolini sprayer used in this trial

Deposition was sampled using several deposition collectors at a height of 2 m above the ground, and immediately above the ground at the closest sampling distances. Vertical pipe cleaners of length 150 mm and width 6 mm were used to assess airborne spray drift exposure for spray impaction. Horizontal filter papers of area 18.8 cm² were used to assess sedimentation deposition. These collector types provide information on relative drift exposure to vertical surfaces such as plants, buildings and humans (pipe cleaners) and flat aquatic terrestrial surfaces (filter papers). Approximately 15 to 30 minutes following exposure to the spray application, the collectors were removed and placed in clean bags labeled for sample identification and location. To minimize the risk of contamination, clean gloves were worn for sample handling and collection was from the furthest distance (where deposition rates are expected to be lowest) to the closest distance to the spray source. The study included replication through three lines of collectors and two repeat applications for each sprayer/ barrier combination. Samples were analysed within an hour of collection by washing the recovered water-soluble tracer from the collector surfaces in a known volume of water and reading the intensity of fluorescence using a Turner-Sequia model 450 fluorometer. Tank samples were collected from the sprayer tanks for comparison against the collectors placed immediately outside the application area. The spray application order, treatment parameters and meteorological conditions are summarized in Table 1.
Table 1. Treatment Conditions
Appln. No.
Date dd/m/yyyy
Start Time
Windsp. Max (m/s)
Windsp. Min
(m/s)
Windsp. Avg (m/s)
Air Temp (°C)
Sprayer Type
Barrier Type
1 19/5/2009 11:35 1.5 0 0.7 16 Bertolini Artificial 2 19/5/2009 12:22 1.2 0 1 20.5 Bertolini Artificial 3 19/5/2009 2:18 1.5 1 1.3 19 Bertolini None 4 19/5/2009 3:23 1.6 0.9 1.3 18.6 Bertolini None 5 20/5/2009 11:19 2 1.6 1.8 13.3 Silvan None 6 20/5/2009 12:12 2.9 1 2.6 14.6 Silvan None 7 20/5/2009 2:09 1.9 0.9 1.5 14 Silvan Artificial 8 20/5/2009 2:55 2 1.2 1.3 15.7 Silvan Artificial 9 20/5/2009 4:02 0.7 0.6 0.6 14.8 Silvan None
10 21/5/2009 10:39 1.6 0.4 7 16 Bertolini Hedge 11 21/5/2009 11:09 0.8 0.4 0.5 18.2 Bertolini Hedge 12 21/5/2009 1:08 2 0.5 1.1 21.6 Silvan Hedge 13 21/5/2009 1:39 1.7 1.3 1.5 21.6 Silvan Hedge
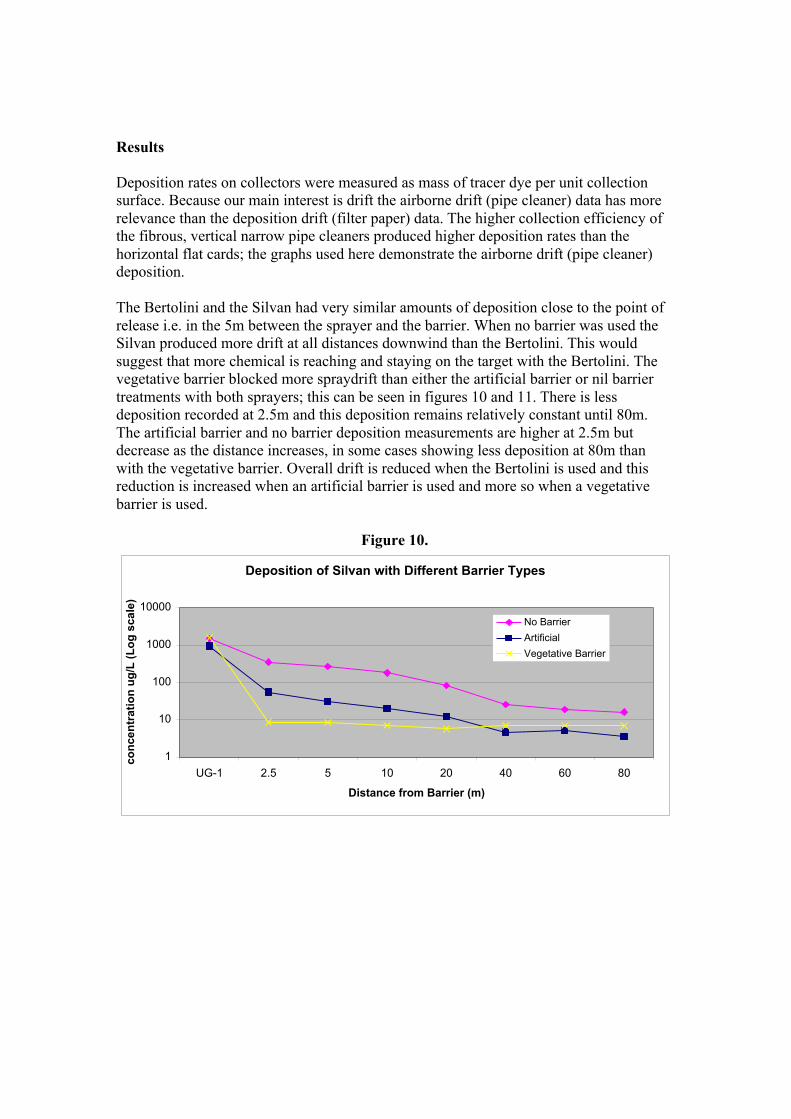
Results Deposition rates on collectors were measured as mass of tracer dye per unit collection surface. Because our main interest is drift the airborne drift (pipe cleaner) data has more relevance than the deposition drift (filter paper) data. The higher collection efficiency of the fibrous, vertical narrow pipe cleaners produced higher deposition rates than the horizontal flat cards; the graphs used here demonstrate the airborne drift (pipe cleaner) deposition. The Bertolini and the Silvan had very similar amounts of deposition close to the point of release i.e. in the 5m between the sprayer and the barrier. When no barrier was used the Silvan produced more drift at all distances downwind than the Bertolini. This would suggest that more chemical is reaching and staying on the target with the Bertolini. The vegetative barrier blocked more spraydrift than either the artificial barrier or nil barrier treatments with both sprayers; this can be seen in figures 10 and 11. There is less deposition recorded at 2.5m and this deposition remains relatively constant until 80m. The artificial barrier and no barrier deposition measurements are higher at 2.5m but decrease as the distance increases, in some cases showing less deposition at 80m than with the vegetative barrier. Overall drift is reduced when the Bertolini is used and this reduction is increased when an artificial barrier is used and more so when a vegetative barrier is used.
Figure 10.
Deposition of Silvan with Different Barrier Types
1
10
100
1000
10000
UG-1 2.5 5 10 20 40 60 80
Distance from Barrier (m)
conc
entr
atio
n ug
/L (L
og s
cale
)
No BarrierArtificialVegetative Barrier
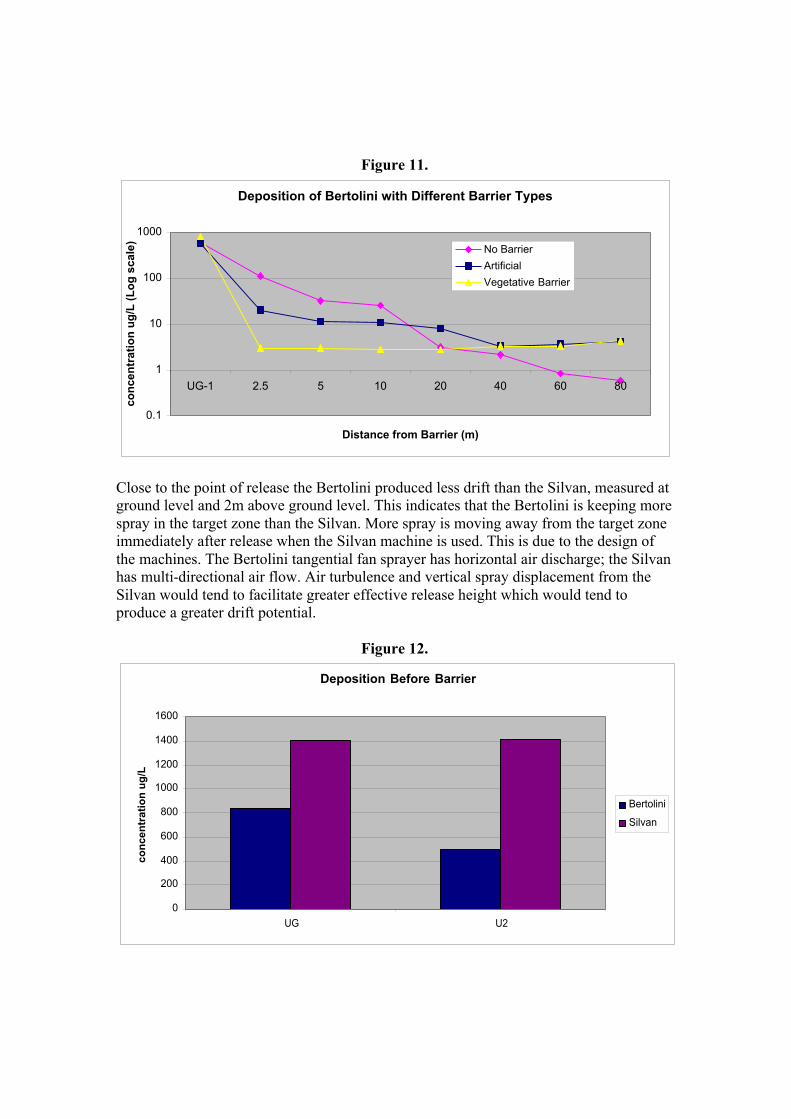
Figure 11.
Deposition of Bertolini with Different Barrier Types
0.1
1
10
100
1000
UG-1 2.5 5 10 20 40 60 80
Distance from Barrier (m)
conc
entr
atio
n ug
/L (L
og s
cale
)
No BarrierArtificialVegetative Barrier
Close to the point of release the Bertolini produced less drift than the Silvan, measured at ground level and 2m above ground level. This indicates that the Bertolini is keeping more spray in the target zone than the Silvan. More spray is moving away from the target zone immediately after release when the Silvan machine is used. This is due to the design of the machines. The Bertolini tangential fan sprayer has horizontal air discharge; the Silvan has multi-directional air flow. Air turbulence and vertical spray displacement from the Silvan would tend to facilitate greater effective release height which would tend to produce a greater drift potential.
Figure 12.
Deposition Before Barrier
0
200
400
600
800
1000
1200
1400
1600
UG U2
conc
entr
atio
n ug
/L
Bertolini
Silvan

Even without a barrier the Bertolini had almost no deposition at a distance of 80m from the barrier, compared to the Silvan which had considerable deposition reaching 80m. No barrier was present to allow development of air turbulence.
Figure 13
Deposition with No Barrier
0.1
1
10
100
1000
10000
UG - 1 2.5 5 10 20 40 60 80
Distance from Point of Spray Release (m)
conc
entr
atio
n ug
/L BertoliniSilvan
Figure 14.
Deposition with No Barrier (After Barrier)
0
50
100
150
200
250
300
350
400
2.5 5 10 20 40 60 80
Distance from Barrier (m)
conc
entr
atio
n ug
/L
BertoliniSilvan

Both sprayers show a very similar pattern of drift when the artificial barrier was used with much less drift seen than when no barrier was present. There is a sharp drop in deposition directly after the barrier and then a gradual decline as the distance increases. Both sprayers show another distinct drop in deposition 40m from the barrier. This is likely to be caused by pattern of turbulence caused by the artificial barrier.
Figure 15.
Deposition with Artificial Barrier
1
10
100
1000
UG - 1 2.5 5 10 20 40 60 80
Distance from Barrier (m)
conc
entr
atio
n ug
/L
Bertolini
Silvan
Figure 16.
Deposition with Artificial Barrier (After Barrier)
0
10
20
30
40
50
60
2.5 5 10 20 40 60 80
Distance from Barrier (m)
conc
entr
atio
n ug
/L
Bertolini
Silvan
The use of a vegetative barrier causes a sharp drop in deposition after the barrier, figure 17. The amount of deposition seen after the barrier stays relatively constant as it moves away from the barrier, figure 18. This is likely to be due to the turbulence caused by the wind moving up and over the barrier. Any spraydrift not caught by the barrier is more likely to move up and over the barrier rather than through it. Very little drift gets past the

barrier but what does is kept in the air for longer and moves with the wind rather than a substantial amount falling directly after the barrier or continuing to fall is it moves away.
Figure 17.
Deposition with Vegetative Barrier
1
10
100
1000
10000
UG - 1 2.5 5 10 20 40 60 80
Distance from Barrier (m)
conc
entr
atio
n ug
/L
Bertolini
Silvan
From 20m on there is a slight increase in the amount of spraydrift, figure 18, this again is likely to be caused by the turbulence caused by the vegetative barrier. The pattern of turbulence caused by the vegetative barrier is different to that caused by the artificial barrier. The different compositions of the two barriers cause a different pattern of deposition after the barrier.
Figure 18.
Deposition of Vegetative Barrier (After Barrier)
0123456789
10
2.5 5 10 20 40 60 80Distance from Barrier (m)
conc
entr
atio
n ug
/L
BertoliniSilvan
Drift from the Silvan sprayer was generally higher than from the Bertolini sprayer. The vegetative barrier was more efficient at impacting drifting droplets than the artificial barrier. In all cases, drift tended to decrease rapidly with distance although there was sometimes a slight increase at far-field distances.

Discussion and Conclusions The Bertolini tangential fan sprayer with horizontal air discharge produced lower drift potential than the multi-directional air flow Silvan sprayer. Air turbulence and vertical spray displacement from the latter would tend to favour droplet trajectories to greater effective release height which would tend to produce a greater drift potential as observed in this study. The selection and setup of equipment relative to a canopy is very important in drift management in spray applications to tree and vine crops. In the absence of a barrier or structures to intercept droplets released by airblast sprayers, droplets can drift with the wind to distances of at least 80 m. An artificial or natural barrier may be effective at intercepting some of these airborne droplets and deflecting the airflow to reduce spray drift potential by 60 to 90%. However, in agreement with previous studies (Tom Wolf, personal communication), drift potential may increase at far-field distances greater than approximately 20 x barrier height due to the impact of the barrier on aerodynamic flow causing an increase in air flow above the height of the barrier at its spatial location. Depending on the toxicity level of concern for the pesticide of interest, such an increase may or may not be of concern because deposition rates at such far-field distances are already very low compared to rates closer to the spray release. The best management strategy to reduce the potential for spraydrift is machinery selection and set up. After this a vegetative barrier will also assist risk management of spraydrift. However, where space is limited or immediate action is required an artificial barrier is a very effective tool for reducing drift potential. It reduces the risk of spraydrift significantly from the risk seen with no barrier and can be removed once a vegetative barrier is established. This study has shown the effect of specific conditions on drift potential for vineyard sprays. It is recommended that additional research be conducted to further explore the impact of other factors on spray drift. These factors could include the following:
• Comparison of multi-swath and single-swath applications where the distance of successive swaths from the barrier may affect the streamline path and trajectory of droplets around the barrier
• Comparison of different sprayer types and settings, especially for air flow and direction relative to canopy foliage and structures. For example, axial fan and tangential fan airblast sprayers with converging and diverging air flows could be compared
• Applications to different canopy and crop types (e.g. fruit trees, grapes, etc) Evaluations with different foliage density conditions (e.g. repeating the study in summer when leaf area index is greater)
• Applications under different meteorological conditions (e.g. relatively high and low wind speeds, and different atmospheric stability conditions)
• Comparison of different barrier configurations and terrain conditions where spray release height relative to barrier can vary throughout the spray block (e.g. sloping land/ complex terrain and flat land).

References Dept of Natural Resources (1997) Planning Guidelines: Separating Agricultural and Residential Land Uses. www.dip.qld.gov.au/docs/ipa/plng_guide_sep_ag.pdf Hewitt, A.J. (2001a) Spray Drift Studies with Orchard Airblast Sprayers. Parasitica vol. 57 (1-2-3), 33-38. ISSN 0031 – 1812. Hewitt, A.J. (2001b) Drift Filtration by Natural and Artificial Collectors: A Literature Review. www.agdrift.com/PDF_FILES/drift%20filtration.PDF Hewitt, A.J. (2002) The Practical Use of AgDRIFT® and Other Drift Exposure Models for Aerial, Ground and Orchard Spray Applications, Australian Journal Ecotoxicology Vol. 8, 7-19. Spray Drift Task Force (1997) A Summary of Airblast Application Studies. www.agdrift.com/PDF_FILES/Airblast.pdf Acknowledgements Shane Kelly – Rural Solutions SA For his tenacity in ensuring this research project overcame all obstacles. Also assistance from his son Ryan. Paul Edwards - Carrington Conveyances For his willingness and support in providing the site the site, machinery and employees. Particular acknowledgement of the assistance of David Cook and Karen Hoffman. Mark Paulusz and Ben Bailey - Gale Pacific For donation of the fabric (artificial barrier) and associated assistance. John Chellew - Kirribilly Viticulture For assistance in providing machinery and assistance from employees, in Particular Trevor Müeller. John Cooper - Coopers of Mount Torrens Farm Supplies For assistance in providing posts for the artificial barrier and associated logistics. Funding for this project provided by PIRSA (Development, Planning and Policy) and the Rural Chemicals Program. Personnel from the Rural Chemicals Program are gratefully acknowledged for providing assistance in the field. Also Geoff Hodgson, Rural Solutions SA. Toni Axford – Rural Chemicals Program For checking the draft report, amending, adding and liaising with C-PAS to collate Nick Brooks – Rural Chemicals Program Project coordinator