
NATO-EAPC Research Fellowship
55
NATO-EAPC Research Fellowship NATO Enlargement: Economic Aspects of Czech Republic’s Co-operation with other PfP Countries Final Report June 30, 2000 Dr. Št pán Müller
Transcript of NATO-EAPC Research Fellowship

NATO-EAPCResearch Fellowship
NATO Enlargement:Economic Aspects of Czech Republic’sCo-operation with other PfP Countries
Final Report
June 30, 2000
Dr. Št�pán Müller

Economic Aspects of the CR co-operation with other PfP Countries
This report was prepared by a team of graduate students, led by Dr. Št�pán Müller.Originally the report was to be prepared in the Czech Management Centre, GraduateSchool of Business, where Dr. Müller was the Academic Dean. He resigned at his positionas of September 1999 and joined CA IB Securities, an investment bank of the Bank Austria– Creditanstalt Group as Managing Director. Therefore a new team was formed, consistingof Radim Habartík, Megan King and Christina Pla�ek, that prepared this report. Finalresponsibility remains, of course, with Dr.Müller.

Economic Aspects of the CR co-operation with other PfP Countries
Contents
Introduction page 1
1. Regional Integration: CEFTA
1.1 Historical Overview 5
1.2 Does CEFTA Have a Future? 7
2. Trade Relations between Principal CEFTA Countries 9
2.1 CR: Trade Relations with Poland 11
2.2 CR: Trade Relations with Hungary 15
2.3 CR: Trade Relations with Slovakia 18
2.4 Conclusions 22
3. Foreign Direct Investments in CEE 23
3.1 Foreign Direct Position of CR 26
3.1.1 FDI Inward Flow 27
3.1.2 FDI Outward Flow 32
3.2 FDI of Other CEFTA Countries 35
3.3 Conclusions 36
4. Concluding Remarks 38
5. Select Bibliography 40
Annex
Economic Aspects of the CR co-operation with other PfP Countries
page 1
Introduction
Following the downfall of the communist regimes in Central and Eastern Europe (CEE)1 in
1989, the long-term pattern of trade relations and established flow of goods has changed
beyond recognition in this region. From their previous near absolute dependence on East
European and above all the Soviet market, these countries have had to re-orient production
from relatively soft and not demanding eastern markets to the competitive and unforgiving
western ones, with very little time for adjustment and even less for learning. Some
countries, especially the focus countries of this study have fared better, others have been
less fortunate.
In this study we will illustrate, by the way of analyses of statistical evidence, that the four
core CEE countries transformed their territorial and commodity external trade structure
relatively successfully. We will show that these core countries were able to establish –
within a few years of the complete dismantling of their previous economic ties – a
functional trade pattern, similar in structure to that of western countries of comparable
economic potential. The pattern of goods in their mutual trade could be considered among
the major development of the countries in question. As the statistical evidence will show, it
now reflects, much better than before, the economic development of the CEE countries. On
the other hand, statistical data and its comparability was the major obstacle from the very
beginning. In order to achieve desired level of comparability, we relied on the data
supplied by CzechTrade, a governmental promotional agency for enhancement of foreign
trade of the Czech Republic. The database not only provided us with data that was
comparable from one year to the other, but it also enabled us to use international statistics
for comparisons between individual CEE countries, because they were based on the same
international classification of goods and services.
1 The abbreviation „CEE“ will be used throughout this study for the „core“ countries of the former Easternblock, namely Poland, Czechoslovakia (Czech and Slovak Republic as of 1993) and Hungary, although werealize that other countries are usually included under such heading, especially countries of South-EastEurope, such as Romania and Bulgaria.

Economic Aspects of the CR co-operation with other PfP Countries
page 2
New regional integration that has been developing among CEE countries could play an
increasingly important role. In this respect the Central European Free Trade Agreement
(CEFTA) is being analyzed, as it provides for most of the data that can be used to such
purpose.
The Partnership for Peace Accord was introduced at the January 1994 Brussels Summit
Meeting of the North Atlantic Council, and it undoubtedly had a significant economic (and
above all political) effect on all countries concerned. The added security for the CEE
countries that became partners to the Accord gave the necessary assurance to the investors,
who in turn brought to these countries increased stability through investments into the
economies of these countries. To quantify or otherwise uncover the dimension of this
economic effect, based on the mutual exchange of goods and services, with our present
databases is very difficult, and we can find only some indirect evidence of it. If and when
the CEE countries are gradually integrated also into the structure of the NATO defense
industry, there may be more clear evidence of this aspect of the strengthening of the trade
relationship between CEE and NATO member countries.2
We felt that a more transparent correlation could be found between the timing of the PfP
Accord and the inflow of Direct Foreign Investments (DFI) into the CEE countries. We
will attempt to bring some evidence of this in Chapter 3.
Since there is hardly any evidence, statistical or factual, of how the PfP membership helped
the countries in question in developing their external trade relations, we will rely in the
following analyses on the CEFTA data, with the underlying understanding that it is also
because of the PfP accord that the CEE countries re-established their economic ties.
Although CEFTA will be the focus of our analyses and most of the statistical data used
will relate to this grouping of countries, the origins of CEFTA require some introduction.
2 One such opportunity may arise quite soon, based on the purchase of advanced supersonic jets for theCzech Air Force. All of the four western companies that offer their products, promise as part of the deal (andalso because they know that the Czech economy cannot finance the enormous costs associated with thepurchase) sizeable off-sets. The economic gains, brought to the country through technology transfer, directinvestments and marketing and management know-how as part of these off-set deals could be to a largeextent attributed to the changed political situation, including the Partnership for Peace Accord.

Economic Aspects of the CR co-operation with other PfP Countries
page 3
CEFTA itself is a product of political endeavors of several countries that tried to move out
of the shadow of their former association with the Soviet Union. In February 1991, the
heads of Poland, Hungary and Czechoslovakia signed a declaration that became later
known according to the place of the summit as “Visegrad Alliance”. From the very
beginning economic co-operation was among the top priorities of the countries. Though
many ambitious plans (international bank, joint production, etc.) were never realized, the
document on the foundation of the Central European Free Trade Agreement, as the most
visible outcome of the Visegrad summit, was signed in November 1992 and came into
effect four month later.
The break-up of Czechoslovakia in December 1992 was a major setback for Visegrad
initiative and froze the organization` s progress for much of the 90` s. It was only in 1998,
after the shakeup in government in the Czech Republic, that Visegrad was reborn. Until
today, although enlargement had been discussed several times, the Visegrad Alliance has
remained between its original three (since 1993 four) founders.
At a recent June 2000 meeting at Stirin, Czech Republic, prime ministers of Visegrad
countries met on two important issues. One concerned the foundation of the Common Fund
for Agricultural Products,3 the other one was the call towards EU to clearly state the
timetable for the EU accession. Three of the four Visegrad countries are the frontrunners
for the EU entry and their joint effort could most likely enhance their stakes. Visegrad
could easily become a political platform for the three countries to make their voice lauder,
providing for the candidate countries a similar platform that the Nordic Council (consisting
of Denmark, Finland and Sweden) gives to the smaller EU countries in Brussels.
In the meantime, however, one of the Visegrad activities, CEFTA, has grown significantly
in its importance for the countries involved. Also, the number of these countries grew from
the original three (four since 1993), i.e. Czechoslovakia (from 1993 Czech and Slovak
Republics), Poland and Hungary to seven, as other countries of the region expressed their
interest and willingness to co-operate under CEFTA agreement. Slovenia joined CEFTA in
1996, Romania became the sixth member country in 1997 and Bulgaria seventh in 1999.
3 Interestingly enough, at the Stirin meeting was accepted for the first time in the history of Visegrad that aformal office be formed, because until now, Visegrad has had no official seat, no paid employees and noformal organization. As the seat for the Fund Bratislava, capital of Slovakia, was chosen.

Economic Aspects of the CR co-operation with other PfP Countries
page 4
In the following chapters we will attempt to illustrate the changes that the countries in
question underwent during the nineties, related to the introduction of the new pattern of
trade flows and economic co-operation between the CEFTA countries, but also in relation
to the outside world, especially the developed market economies.

Economic Aspects of the CR co-operation with other PfP Countries
page 5
1. Regional Integration: CEFTA
1.1 Historical overview
External economic relations of all the countries of the former Council of Mutual Economic
Co-operation (CMEA, Comecon) were heavily distorted in favor of intra-regional trade
flows and strong dependence on the Soviet Union, especially for raw materials and certain
strategic goods. After the political collapse of the Soviet block, mutual trade dropped very
quickly to a historical low at the beginning of the 90`s, and the flow of trade started to
change profoundly. During the last decade, the external trade relations of all the CEFTA
countries underwent an unprecedented change, with the shares of different regions of the
world, namely the former CMEA and Developed Market Economies (ME), especially the
European Union (EU), practically switching their weight and importance in the total trade
of these countries. Tables 1 and 2 give the evidence of that on the example of the Czech
Republic (CR). While the imports of the CR from ME grew almost 2,5 times from 1985,
the share of imports from the former Eastern Europe and USSR to approximately one third
during the same time period. Similar pattern can be traced in exports. During the same time
period, exports from the Czech Republic to ME more than doubled, while exports to the
former Soviet trading block dropped by 50 %.
With the growing share of mutual trade with ME, especially the EU, much less importance
was given to the intra-CEE trade at that time. The role of state institutions in the mutual
trade of these countries - distorted pricing and relying on nonstandard settlement of the
trade due to the lack of convertible currencies, exchange of goods on barter terms or on
some unrealistic conditions - caused diminished interest in developing intra-CEE trade in
the first place. The image (often well-deserved) of second-rate goods that were earmarked
for exports to “Eastern”, i.e. soft markets, did not help either.
Economic Aspects of the CR co-operation with other PfP Countries
page 6
Dissolvement of the CMEA in July 1991 led very quickly also to profound changes in the
conduct of mutual business among the former CMEA member countries. Payments in hard
currencies, market prices and international standards were introduced, including the Most
Favorite Nation clause. It was at this time that the CEFTA concept, based on the creation
of a free trade area rather than on some institutionalization of regional co-operation, was
created.
The principal objective of CEFTA was the gradual establishment of a free trade area, in
accordance with the Article XXIV of GATT. A transition period, ending on January 1,
2001 was stated in the general framework agreement. Industrial goods and agricultural
products were dealt with separately, in Chapters 1 and 2 of the Agreement. CEFTA
envisaged the abolishment of all barriers to mutual trade in the industrial commodities
sector. Bilateral protocols contain several lists of products, grouped according to the pace
of tariff reductions.
Industrial goods were divided into three categories. Group A listed those products in
mutual trade among the CEFTA countries, where the sensitivity to potentially harmful
effects on the economies of the other partner countries was the lowest. This group
represented about 25 % of all the goods exchanged in mutual trade, and the tariffs were
abolished on March 1, 1993, when the agreement entered into force.
Group B of industrial goods, with a medium sensitivity, was to have the tariffs lowered by
one third each year, starting in July 1994. As for the most sensitive group of products, such
as automotive industry, the tariffs were supposed to be lowered by one quarter each year,
so as to completely abolish them by the beginning of 1998. All member countries have
included into bilateral lists such products that they perceived to be important for their
external trade, therefore the bilateral lists did not reflect the group of the most sensitive
products evenly.
Originally, the transition period was slated to end in 2001. However, mostly on the
insistence of the Czech Republic, additional protocol to the Agreement, signed on April 29,
1994 in Budapest, shortened the period from 8 to 5 years.

Economic Aspects of the CR co-operation with other PfP Countries
page 7
The original agreement did not envisage any free trade in agricultural commodities, the
partners were to grant concessions to each other bilaterally and include them in protocols.
The particular conditions of liberalization thus differ across the bilateral relations.
Generally the stipulations of the Agreement do not restrict the respective countries in
pursuance of their national agricultural policies.4
1.2. Does CEFTA have a future?
CEFTA is the most important regional integration established after the downfall of CMEA.
Its foundation was supported by the EU, because through CEFTA, the member countries
should graduate to EU membership.
There are several important functions that CEFTA fulfills:
• It is a forum for political dialogue that helps to overcome some friction between
member states, i.e. Slovak – Hungarian or Hungarian – Romanian relations
• It helps to open dialogue between member countries and potential candidates, such
as Ukraine and Latvia (and their relations with Poland) and also helps to solve
some open matters concerning debts among the former CMEA member countries
• CEFTA co-operation increases the stability and security of the region, and
increases the regional identity. This is exactly why countries like Croatia or
Lithuania also show an interest in joining, because their membership would also
increase their credibility in international relations
• CEFTA plays an informal role of a “training camp” for all countries interested in
joining the EU
• Last, but not least, CEFTA represents a very interesting market, with a
dynamically growing mutual trade
4 Agricultural trade between the EU countries and the 9 accession countries (where all core CEFTA countriesalso belong) should be liberated as of July 1, 2000 in such a way that up to 77 % of agricultural exports fromthe accession countries will be liberated (up from 37 now) and the EU will be able to export freely into thesecountries 37 % of their agricultural exports (up from 20 %). Besides import taxes the EU will also canceltheir export subsidies for products within the allowed quantitative restrictions. CR expects to increase itsexports of agricultural products to the EU by more than half a billion of crowns (about USD 140 million).This new agricultural trade policy will most likely also influence intra-CEFTA trade, as many products thatwere prohibited by taxes to be exported into the EU became part of CEFTA agricultural exchange. Detailedanalyses of agricultural trade between the EU and CEFTA countries and intra-CEFTA trade may confirm thisnext year.

Economic Aspects of the CR co-operation with other PfP Countries
page 8
CEFTA is now in the stage when it will have to re-define its purpose and goals. Four of the
seven member countries of CEFTA are negotiating their accession with the EU, hopefully
within 3-5 years. CEFTA can certainly play a similar role for this transition period that
EFTA had, preparing its members for accession. The problem of those countries that have
not even started the dialogue with EU yet remains, and will not be easy to solve.
In any case, the importance of CEFTA as a first step towards full EU membership remains.
This is also why other countries from Eastern Europe show such interest in joining
CEFTA. In the Brno Summit of CEFTA in 1995 three preconditions for joining this
integration were declared:
• A candidate country must be a member of the World Trade Organization
• A candidate country must have a bilateral agreement on free trade signed with all
CEFTA member countries (Associated membership status allows for this
agreement to be signed with at least one member country)
• A candidate country must have an association agreement signed with the EU,
declaring thus its preparedness for future membership
• A consensus of all member countries in accepting a new candidate, a condition that
should prevent the enlargement of CEFTA against the interest of any individual
member
It seems to be quite clear that CEFTA will not become an alternative to the EU.
Nevertheless, it does not disqualify it as a useful regional integration. Assessments usually
point out its achievement in both political and economics areas, and its preparedness for
further enlargement of mutual trade. There are still many areas in which CEFTA can
increase its usefulness. It seems, however, that it is viewed by many, including the member
countries, as a transitional step on the road to the EU.

Economic Aspects of the CR co-operation with other PfP Countries
page 9
2. Trade Relations between Principal CEFTA Countries
It was very tempting to cover the complete trade structure of all the 7 CEFTA countries.
However, after some initial attempts and analyses it became obvious that the obstacles are
too many, the incompatibility of statistical data being one of the major ones. Therefore, we
concentrated on the mutual trade of the four core countries, because their share of the total
is crucial (and these four countries - by no accident - form also the political body of the
Visegrad Alliance). The distortion of the complete picture is thus in our view smaller than
it could be, if incompatible statistical data were being used.
The importance of foreign trade for individual CEFTA countries is demonstrated in Table
3 in the Annex. It gives the absolute figures for exports, imports and trade balance of six
CEFTA countries. All of them run a deficit of foreign trade, and any lifting of trade
barriers, such as creation of free trade area in their neighborhood, must be perceived as a
positive development.
Table 4 shows the shares of trade CEFTA countries in their total foreign trade, while Table
5 gives the same picture in absolute terms. There are several conclusions that can be
drawn from the data in these tables:
• Exports of the CEFTA countries have expanded quite rapidly (with the exception of
Romania), and their trade balances are being kept under control, with only Polish
balance showing a negative upward trend
• Czech Republic (CR) and Slovak Republic (SR) are the two countries dependent on
mutual CEFTA trade the most. This dependence is given by their previous history
as one economy, but is clearly diminishing, as both countries, especially SR, are
finding new trading partners and markets

Economic Aspects of the CR co-operation with other PfP Countries
page 10
• If mutual trade between CR and SR is disregarded, the share of CEFTA trade in
total foreign trade of all CEFTA countries is gradually growing, in the case of
newly admitted countries more rapidly, reflecting the advantages of the free trade
area
• With the exception of CR and SR (and lately also Hungary), the other countries are
not covering their imports from CEFTA countries with their exports.
It may be generally considered a sign of a developed market economy, if the share of
higher value-added products, such as those listed in the trade classification under SITC
group 5 to SITC 8, in the total trade of a given country is growing. We shall also test the
mutual trade between the four CEE countries also according to this criterion.

Economic Aspects of the CR co-operation with other PfP Countries
page 11
2.1 CR: Trade Relations with Poland
Poland and CR play a significant role in the economic potential of CEFTA. These two
countries account for almost 50 % of the total population of CEFTA 7 (including Slovenia,
Romania and Bulgaria) and for over 50 % of the total foreign trade of these seven
countries. If we take into consideration only the four core countries, as suggested, then
Poland alone covers 60 % of the combined population of CEFTA 4, and CR about 15 %. In
terms of foreign trade, Poland accounts for close to 40 % of the total foreign trade of
CEFTA 4, CR almost 30 %.
It is therefore no surprise that the mutual relations of these two countries influence, to a
large extent, the statistics of CEFTA as a whole.
In order to find out about the extent to which CEFTA, as personification of the new
economic relations between CEE countries after the signing of the Visegrad Alliance,
influenced the mutual trade between individual CEFTA 4 countries, we had to go into the
commodity structure of this trade and its development over time.
Imports:
First we shall analyze the structure of Czech imports from Poland. Graph 1 gives a quick
overview of the development of individual SITC groups over the past seven years. Table 6
in the Annex corresponds with the charts in this graph and gives a more statistically
detailed picture. Table 7 on the other hand specifies the “winners” and “losers” over the
1993-99 period among the individual groups of products, imported from Poland to CR.
Economic Aspects of the CR co-operation with other PfP Countries
page 12
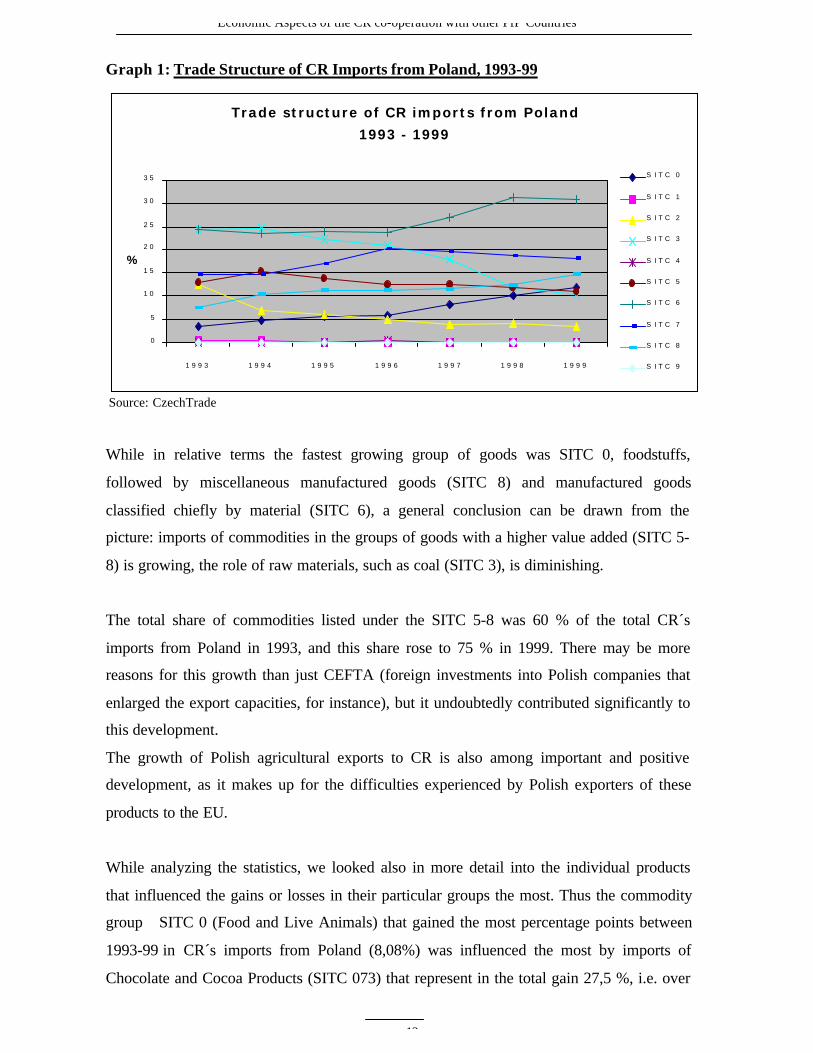
Graph 1: Trade Structure of CR Imports from Poland, 1993-99
Source: CzechTrade
While in relative terms the fastest growing group of goods was SITC 0, foodstuffs,
followed by miscellaneous manufactured goods (SITC 8) and manufactured goods
classified chiefly by material (SITC 6), a general conclusion can be drawn from the
picture: imports of commodities in the groups of goods with a higher value added (SITC 5-
8) is growing, the role of raw materials, such as coal (SITC 3), is diminishing.
The total share of commodities listed under the SITC 5-8 was 60 % of the total CR´s
imports from Poland in 1993, and this share rose to 75 % in 1999. There may be more
reasons for this growth than just CEFTA (foreign investments into Polish companies that
enlarged the export capacities, for instance), but it undoubtedly contributed significantly to
this development.
The growth of Polish agricultural exports to CR is also among important and positive
development, as it makes up for the difficulties experienced by Polish exporters of these
products to the EU.
While analyzing the statistics, we looked also in more detail into the individual products
that influenced the gains or losses in their particular groups the most. Thus the commodity
group SITC 0 (Food and Live Animals) that gained the most percentage points between
1993-99 in CR´s imports from Poland (8,08%) was influenced the most by imports of
Chocolate and Cocoa Products (SITC 073) that represent in the total gain 27,5 %, i.e. over
Trade structure of CR imports from Poland
1993 - 1999
0
5
1 0
1 5
2 0
2 5
3 0
3 5
1 9 9 3 1 9 9 4 1 9 9 5 1 9 9 6 1 9 9 7 1 9 9 8 1 9 9 9
%
S I T C 0
S I T C 1
S I T C 2
S I T C 3
S I T C 4
S I T C 5
S I T C 6
S I T C 7
S I T C 8
S I T C 9

Economic Aspects of the CR co-operation with other PfP Countries
page 13
one quarter of it. Those who shop in Czech supermarkets will not be surprised because the
production strategy of multinational companies allocated the production of certain
chocolate products and chocolate-covered wafers to Poland, from which it is distributed to
neighboring countries in large quantities. The individual products that effect the gains in
other commodity groups may not be as visible in the shops as chocolate bars, but they also
account for a large proportion of the total gain (or loss, as in the case of SITC 3 and 2). In
the case of the decrease of imports of Polish coal and coke (SITC 32) the total loss of this
commodity represents, for instance, full 30 % of the decrease of SITC 3 between 1993-99
(loss of 14 %). For more detailed information on goods that influenced the imports OF CR
from Poland the most (in the way of both gains and losses) see Table 8 in the Annex.
Exports:
Development of Czech exports to Poland confirms the expectations concerning the trade
pattern. The fastest growing product groups are those with the high value-added, such as
Machinery and Transport Equipment (SITC 7), that gained over the course of seven years
7,14 %, but also other goods from the value-added groups were gaining.
Unlike the situation in CR´s imports from Poland, where the higher value-added group of
products (SITC 5-8) rose in seven years from 60 % to 75 % of the total imports, CR
exports to Poland in the same group of products practically have not changed. This group
represented 86,2 % in 1993 and 86,9 % in 1999. Behind these figures - suggesting an even
development - are, however, significant changes in individual groups of products.
Especially Machinery and Transport Equipment (SITC 7) and Chemicals (SITC 5),
experienced a very different development with 7 percentage points growth between 1993-
99 of the former group of commodities and almost 9 percent points drop in the latter.
The situation of Czech exports to Poland is demonstrated in Graph 2 and supported by the
Tables 9 and 10 in the Annex.

Economic Aspects of the CR co-operation with other PfP Countries
page 14
Graph 2: Trade Structure of CR Exports to Poland, 1993-99
Source: CzechTrade
The structure of Czech exports to Poland has changed over the course of seven years
between 1993-99 mainly in the category of SITC 7. The single most significant item in the
exports of this group of commodities is clearly exports of passenger cars (SITC 78) that
accounted for one sixth of the total increase of exports in this category, followed by power
generating machinery (SITC 71). The slight increase in the exports of Czech coal and coke
to Poland is also interesting, especially in comparison with the rather sizeable decrease of
imports of Polish coal to CR.
Poland plays a very significant role in foreign trade of all CEFTA countries, and in mutual
trade with the CR its role seems to intensify. The transformation of industries of these two
countries, in which foreign direct investment (FDI – see chapter 3) is often the decisive
factor in restructuring and hence export potential of many industries in both of these
countries, creates enough space for future enhancement of these contacts.
Trade structure of CR exports to Poland
1993 - 1999
0
5
1 0
1 5
2 0
2 5
3 0
3 5
1 9 9 3 1 9 9 4 1 9 9 5 1 9 9 6 1 9 9 7 1 9 9 8 1 9 9 9
%
S I T C 0
S I T C 1
S I T C 2
S I T C 3
S I T C 4
S I T C 5
S I T C 6
S I T C 7
S I T C 8
S I T C 9

Economic Aspects of the CR co-operation with other PfP Countries
page 15
2.2 CR: Trade Relations with Hungary
The development of Hungarian foreign trade may serve as a clear example of the
advantages CEFTA offers to its active member countries. Especially Hungarian trade with
CR in machinery and transport equipment took off to new heights, with both countries
profiting from this development.
Imports:
The structure of CR imports from Hungary is shown in Graph 3. What strikes immediately
is the practically unprecedented growth of the SITC 7 group (Machinery and Transport
Equipment) between the seven years covered by the statistics. The import of this group of
commodities rose between the 1993-99 by a staggering 30 %, and the share of CR´s
imports of the SITC 5-8 group rose from 42 to almost 80 % between the same years. This
alone confirms the expected advantages of free trade zone created by the foundation of
CEFTA.
Tables 11 and 12 in the Annex give further evidence to the facts mentioned above and
shown in the Graph 3.
Graph 3: Trade Structure of CR Imports from Hungary:
Source: CzechTrade
Trade structure of CR imports from Hungary
1993 - 1999
0
5
1 0
1 5
2 0
2 5
3 0
3 5
4 0
1 9 9 3 1 9 9 4 1 9 9 5 1 9 9 6 1 9 9 7 1 9 9 8 1 9 9 9
%
S I T C 0
S I T C 1
S I T C 2
S I T C 3
S I T C 4
S I T C 5
S I T C 6
S I T C 7
S I T C 8
S I T C 9

Economic Aspects of the CR co-operation with other PfP Countries
page 16
Power generating machinery was behind the sizeable increase of CR´s imports from
Hungary. These machines accounted for a full 50 % increase of the SITC 7 group as a
whole, with paper, paperboard (SITC 64) and metal products (SITC 69) also contributing
to the growth. The biggest drop in imports appears in the group SITC 33, where a
significant reduction of CR´s imports of refinery products (SITC 33 – Petroleum,
petroleum products) lowered the amount imported by more than one third during the years
1993-99. (See Table 13 in the Annex).
Exports:
A situation similar in the structure to imports from Hungary repeats on the side of CR
exports to this country. This time, however, there was an initial drop in the relative share of
goods with higher value-added in the first year of CEFTA existence, because of the
extremely high share of fuel exports (SITC 3). From 1994 on, the high value-added
product groups, such as Machinery and Transport Equipment (SITC 7) and Manufactured
Goods Classified by Material (SITC 6), predominated. The structure of foreign trade
between these two countries followed the trade structure typical of that of developed
market economies.
The total share of higher value-added goods in CR´s exports to Hungary rose from almost
60 % in 1993 to over 80 % in 1999, bringing it to about the same level as this group of
products achieves in the imports from Hungary.
Graph 4 depicts the development of CR´s exports to Hungary, with supporting statistical
data provided by Tables 14 and 15 in the Annex.

Economic Aspects of the CR co-operation with other PfP Countries
page 17
Graph 4: Trade Structure of CR Exports to Hungary:
Source: CzechTrade
On the side of CR´s exports to Hungary, the leading role is played by SITC 7, represented
mainly by passenger cars, but also by power generating machinery. A surprise may come
in the fact that this group of products (SITC 71) increased in importance in CR –
Hungarian trade on both sides, as did the group SITC 64 (Paper, paperboard).
The only group of products that decreased significantly during the 1993-99 period on the
side of CR´s exports to Hungary is trade with coal and coke. For more details see Table 16
in the Annex.
Trade structure of CR exports to Hungary
1993 - 1999
0
5
1 0
1 5
2 0
2 5
3 0
3 5
4 0
1 9 9 3 1 9 9 4 1 9 9 5 1 9 9 6 1 9 9 7 1 9 9 8 1 9 9 9
%
S I T C 0
S I T C 1
S I T C 2
S I T C 3
S I T C 4
S I T C 5
S I T C 6
S I T C 7
S I T C 8
S I T C 9

Economic Aspects of the CR co-operation with other PfP Countries
page 18
2.3 CR: Trade Relations with Slovakia
Hundreds of articles were written and lectures given on the Czech – Slovak partition and
the repercussions it had on the political scene and the economies of both newly created
countries. It may be still too early to write a comprehensive analysis of the peaceful
partition of the country and above all its economy. It was only a coincidence that the ratio
of 2 : 1 for dividing practically everything, all the assets within the formerly united
country could be used, as such was the distribution of population between Czechs and
Slovaks. However, it probably helped to better understand and also to persuade most of
the citizens that there is some relative justice in the division, because the ratio was strictly
followed5.
Although the country was peacefully divided and new governments could resume their
responsibilities, many companies of the new country got into a very difficult situation
starting on day one. Especially for large companies that used to have branches and
daughter companies dispersed in all parts of the country, their formerly intra-company co-
operation became overnight a part of their foreign trade operations.
It is interesting to follow the development of these relations, as reflected in the statistical
figures. Some companies simply compensated their product lines relatively quickly, so as
not to rely on their former subsidiaries in Slovakia that now operated as independent
companies; these companies are now without any direct production ties to Slovakia. Other
companies continued their co-operation and even expanded it, when they found it to be
mutually beneficial trade, using, among other things, the advantages extended by the
existing customs union between the two countries. There are, however, many companies
that did not survived the partition, (or privatization), and have ended up in bankruptcy.
Although it would most likely deserve a separate study, one cannot help but to comment on
the strong survival performance of the industries of both the Czech and Slovak Republics.
The division of the unified Czechoslovakia was done on purely political grounds, without
much respect being paid to economic consequences, which were considered as secondary

Economic Aspects of the CR co-operation with other PfP Countries
page 19
at that moment. The very fact of keeping the economy running may be also perceived as a
tribute to the strength and resilience of the many companies that not only survived, but
came out of this process restructured into modern entities, capable of competition on the
world markets. There were, of course, other companies, often the largest conglomerates,
geared towards producing huge quantities of substandard goods for Eastern markets that
could not have survived in the new conditions of market economy, and failed. Some may
still be resuscitated with the help of foreign investors (and attempts are being made in this
direction for companies like CKD, Tatra, Zetor in the CR, or VSZ and ZTS in Slovakia),
others are already doomed (Poldi Steel in CR is probably the best known example).
Imports:
Unlike other trade relations, the structure of imports from Slovakia (see Graph 5) does not
repeat the trade pattern typical for the trade relations with other CEE countries, such as a
strong reliance on goods with a higher value-added. With the exception of the group SITC
6 (Manufactured Goods Classified by Material) that upholds its predominant position in
the mutual trade (and relates to the times of united economy of both countries), other
groups of goods stagnated or even lowered their share in the total trade. Quite surprisingly,
the chief example of this development is the group SITC 7 (Machinery and Transport
Equipment). It is exceptionally (compared with the other trade relations among developed
countries generally, and trade relations among the other CEE countries in particular) the
main ”loser“ among the other groups of goods.
We believe that the partition of the Czechoslovak economy and its consequences,
mentioned above, are the main reason for such development. The pattern found in the
SITC 7 group can be extended to the whole SITC 5-8. While in 1993 CR´s imports of these
commodities from Slovakia represented 82 % of the total (i.e. way above the similar share
for Poland and Hungary), in 1999 the percentage went down to about 75 %, already
comparable within a few percentage points with the share of the two other countries.
Graph 5 below, together with the Tables 17 and 18 in the Annex, shows the development
of CR´s imports from Slovakia.
5 Sometimes even to such absurd details such as partition of archives.

Economic Aspects of the CR co-operation with other PfP Countries
page 20
Graph 5: Trade Structure of CR Imports from Slovakia:
Source: CzechTrade
The group of products that accounts for the largest increase in imports (albeit modest in
comparison with the trade with other CEFTA countries) during the 1993-99 period was
SITC 3, i.e. Fuels, Lubricants and Related Materials. If we go deeper into the statistics,
then is the increased imports of petrol from the Slovnaft refinery quite clearly the major
factor.
On the opposite side, the group of products, imports of which shrank by 7 % during the
period was electrical machinery, apparatuses and appliances (SITC 77). More detailes are
provided in Table 19 in the Annex.
Exports:
When compared with the situation in imports, the commodity structure of Czech exports to
Slovakia has not undergone any major changes in the past eight years. Export of machines
and transport equipment, both summarized under the SITC 7 group of goods, continues to
dominate the exports and accounts for almost one third of the total. The only other
commodity group that comes close in absolute terms is SITC 6, Manufactured Goods
Classified by Material. These two groups represent more than one half of all the CR´s
exports to Slovakia, with the share of these commodity groups on the total export changing
only slightly, from 77 % in 1993 to almost 80 % in 1999.
Trade structure of CR imports from Slovakia
1993 - 1999
0
5
1 0
1 5
2 0
2 5
3 0
3 5
4 0
4 5
1 9 9 3 1 9 9 4 1 9 9 5 1 9 9 6 1 9 9 7 1 9 9 8 1 9 9 9
%
S I T C 0
S I T C 1
S I T C 2
S I T C 3
S I T C 4
S I T C 5
S I T C 6
S I T C 7
S I T C 8
S I T C 9

Economic Aspects of the CR co-operation with other PfP Countries
page 21
Graph 6 and Tables 20 and 21 in the Annex give some further evidence to the described
development.
Graph 6: Trade Structure of CR Exports to Slovakia:
Source: CzechTrade
The group of products that gained the most in CR´s exports to all the countries in question
is without exception SITC 7, and, more specifically, the export of road vehicles (SITC 78).
In the case of CR, it is the exceptional performance of the major passenger car maker in the
CR, Skoda Auto, part of the Volkswagen Group, that accounts for this increase. The fact
that the export of Skoda cars represents more than 10 % of total exports of the CR speaks
for itself, not to mention the fact that it also helped to improve the quality and overall
performance of local suppliers of parts, who now export part of their production.
In the case of trade with Slovakia both the “winners” and “losers” gained and lost
relatively small percentage of the total trade, as the structure (perhaps with the exception of
the passenger cars) remained quite flat. (See Table 22 in the Annex).
Unlike the other two CEFTA countries, Slovakia enjoys the advantage of customs union in
the mutual economic relations with CR. This undoubtedly opens more room for trade
expansion between these two countries, but on the other hand creates friction in contacts
with the EU. There is little evidence that the customs union generally influences trade of
Trade structure of CR exports to Slovakia 1993-1999
0
5
1 0
1 5
2 0
2 5
3 0
3 5
1 9 9 3 1 9 9 4 1 9 9 5 1 9 9 6 1 9 9 7 1 9 9 8 1 9 9 9
%
S I T C 0
S I T C 1
S I T C 2
S I T C 3
S I T C 4
S I T C 5
S I T C 6
S I T C 7
S I T C 8
S I T C 9

Economic Aspects of the CR co-operation with other PfP Countries
page 22
the CR and Slovakia in a way that would negatively affect the trade relations with other
countries. The customs union is basically a tool that allows these two countries and their
companies to overcome the negative effects of the division of the country. If and when
one or both of CR or SR enter the EU, the question of customs union will be solved by
itself, if it has not already been solved.
2.4 Conclusions
Even with the limited evidence we have from the analyses of the mutual trade between
Czech Republic and its three major trading partners among the CEFTA countries it is quite
safe to conclude that CEFTA represents a welcome alternative to the orientation of trade
flows, easing a somewhat one-sided reliance on trade with the EU (and Germany, in
particular).
However, even with that in mind, foreign trade of CR can still be characterized as heavily
dependent on trade with EU countries, especially Germany (over one third of all CR´s
imports and almost 40 % of exports go to this country alone). CEFTA trade and its
development thus offers a chance to a better geographical distribution of the flow of trade,
decreasing the negative effects of pegging one country´s economy too closely to an
economic cycle of another one at the same time also.
Another conclusion that comes out of the analyses is the dependence of CR exports on
only a few commodities. The 20 most important export commodities account for almost 60
% of all exports, passenger cars covering 11 % themselves. While it is a positive result in
the fact that most of these commodities are from the higher value-added groups, sensitivity
to shifts in demand on world markets would call for a broadening of the number of
exportable products and more even distribution of the risk of a drop in demand for these
products.

Economic Aspects of the CR co-operation with other PfP Countries
page 23
3. Foreign Direct Investments in CEE
While we were able to compare the pattern of foreign trade relations of individual CEE
countries with their previous performance and assess the changes brought about by the
transformation of their economies, foreign direct investment (FDI) is a phenomenon almost
unknown (with some exception for Poland) in the former socialist countries of Central and
Eastern Europe. It was only during the nineties that the inflow of FDI into the CEE
countries made it possible to measure it as to its quantity, distribution according to
industries and country of origin.
Another important difference between analyses of statistical data on foreign trade of
individual countries or trading blocks and information on FDI is that published data for
FDI has a much lower level of compatibility. In order to reach some comparable results,
we have been using the standard methodological procedure, used by the Czech National
Bank, as described below.
Foreign Direct Investment represents a share of at least 10 % or higher of a foreign
investor in the equity capital company, in which the investor has a lasting interest and
participates in the management of that company. It means that a foreign direct investor
does not need to own the controlling stake or the largest stake in the company. Reinvested
earnings and other capital are also considered an integral part of FDI. The composition of
FDI can thus be expressed by the following relationship:
FDI = equity capital + reinvested earnings + other capital
• Equity capital includes a non-resident's share of equity in the company and all the
shares in its subsidiaries
• Reinvested earnings consist of current year's profit after tax, plus retained profit
from previous years, minus current year's loss and accumulated losses from
previous years minus dividends

Economic Aspects of the CR co-operation with other PfP Countries
page 24
• Other capital consists of accepted and provided credits, including debt securities
and supplier's credits between direct investors and companies in which they have
ownership interests (including subsidiaries).
An important difference between foreign trade of the CEE countries and their FDI is the
gap between “imports” and “exports” of FDI. While in foreign trade relations the balance
between inflow and outflow of goods is relatively even and countries are usually trying to
keep this balance within certain boundaries, in the case of CEE countries the inflow of FDI
is a multiple of the outflow.
This net inflow of FDI represents an important factor for the manageability of external
imbalances, especially the current account deficit. Especially in Hungary and Poland, and
since 1998 also in CR, the net inflow of FDI has helped these countries to balance their
trade deficits.
All CEE countries have a shortage of domestic capital, and without foreign financial
resources they could hardly achieve sustainable long-term economic growth. Moreover,
evidence indicates that FDI inflows complement, rather than substitute, for domestic
investments.
FDI therefore contributes to the transition and economic development of CEE in three
major ways:
• FDI directly increase capital accumulation
• FDI raise the productivity and are beneficial for export performance of the
economy
• FDI generate technological and organizational benefits for domestic enterprises.
The positive influence of FDI on the domestic economy is not only in the quantity of FDI
inflows, but also in their quality. Most important are the areas of enterprise restructuring
and increased productivity, marketing and corporate governance. Foreign investors tend to
restructure companies faster, they invest more, operate capital more intensively and have a
higher labor productivity. They usually pay better wages, and through attracting more
qualified workers, have a better human capital to support their activities.

Economic Aspects of the CR co-operation with other PfP Countries
page 25
According to the World Development Indicators published by the World Bank, only two
CEE countries had any FDI in 1990, Poland and CR. In 1998 for three of them, Poland,
Hungary and CR, FDI represented almost one sixth of their total gross domestic
investments, with Slovakia still lacking behind with only 7 %. For further detail see Table
24 in Annex.

Economic Aspects of the CR co-operation with other PfP Countries
page 26
3.1. Foreign Direct Investment position of CR
Statistical evidence about the FDI position of the CR does not usually go back beyond
1993. Before that date there was very little FDI, and the division of Czechoslovakia
allowed for the two new countries to start their statistics anew.
The macroeconomic situation in CR, with depressed prices on the stock exchange, a well-
educated and cheap work force, a strategic location on the crossroads of Europe and the
probability of relatively quick accession into the EU made CR an interesting location for
foreign investors. After some changes in the investment climate, it seems that the
following actions need to be addressed more actively in order to persuade foreign investors
to bring more capital:
• Complete the privatization of banking system
• Strengthen corporate governance, make managers responsible to owners
• Better protect minority investors
• Improve and apply bankruptcy law and procedures
• Strengthen capital markets regulations
• Enforce recent legal, policy and institutional reforms
• Improve the investment promotion program
The social-democratic government, formed after the elections in July 1998 intensified the
effort of previous caretaker government of Prime Minister Tošovský, who came into power
after the center-right government of PM Klaus was dismissed in 1997. While PM Klaus
considered any investment incentives for foreign investors as not important, the new
government put a strong emphasis on bringing in more FDI and offering the same amount
of incentives as other CEE countries, to which CR was loosing most of the investors.
The incentive package to promote investment, and above all FDI, was introduced in the
Spring of 1998. After several minor improvements the program offers the following
incentives to manufacturing investors:

Economic Aspects of the CR co-operation with other PfP Countries
page 27
• Corporate tax relief for up to 10 years
• Location in customs-free zones
• Duty free imports of machinery and equipment
• Job-creation grants (up to 50 % of training costs, depending on the unemployment
in the location)
• Provision of low-cost building/land and/or infrastructure
In order to be eligible for any of the incentives, an investor has to meet certain criteria,
specified by the government. The recent development showed that the incentive program
works.
3.1.1. FDI Inward Flow
The Czech National Bank (CNB) statistical survey reports for January 1, 1993, when the
CR was founded, the FDI position as USD 2,889 billion. Over the years this position
continued to grow and the preliminary figure for 1999 stands already at USD 13,75 billion,
i.e. almost fivefold increase. Quite interesting is also the development of this position over
the years. The increased inflow clearly intensified after the government approved
incentives for foreign investors in 1998 and put CR on par with the other CEE countries
that have been offering incentives to foreign investors already from the beginning. (See
Graph 7 and also Table 25 in the Annex).
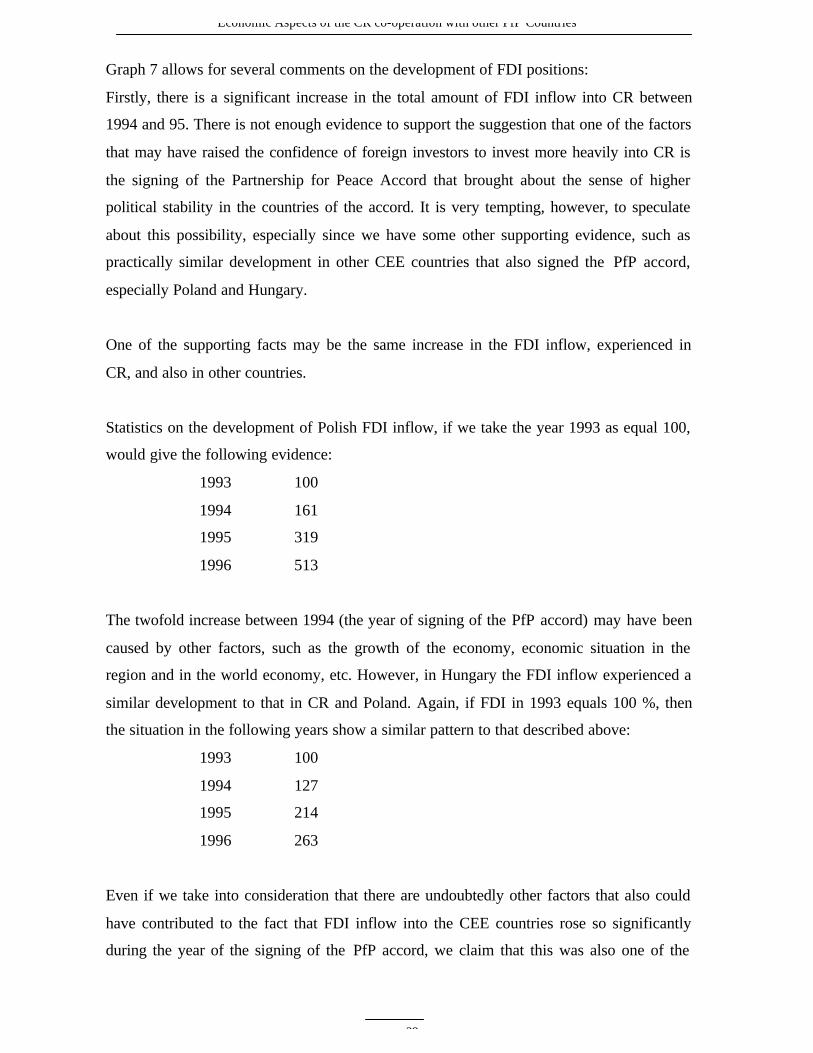
Graph 7: FDI Positions in the CR in 1993-99
*preliminary data
Source: Czech National Bank
F D I posit ions in the Czech Republ ic in 1993 - 1999
(USD mil l ion)
0
2 0 0 0
4 0 0 0
6 0 0 0
8 0 0 0
1 0 0 0 0
1 2 0 0 0
1 4 0 0 0
1 6 0 0 0
A s t o
1 . 1 . 1 9 9 3
1 9 9 3 1 9 9 4 1 9 9 5 1 9 9 6 1 9 9 7 1 9 9 8 1 9 9 9 *
US
D m
illio
n
Economic Aspects of the CR co-operation with other PfP Countries
page 28
Graph 7 allows for several comments on the development of FDI positions:
Firstly, there is a significant increase in the total amount of FDI inflow into CR between
1994 and 95. There is not enough evidence to support the suggestion that one of the factors
that may have raised the confidence of foreign investors to invest more heavily into CR is
the signing of the Partnership for Peace Accord that brought about the sense of higher
political stability in the countries of the accord. It is very tempting, however, to speculate
about this possibility, especially since we have some other supporting evidence, such as
practically similar development in other CEE countries that also signed the PfP accord,
especially Poland and Hungary.
One of the supporting facts may be the same increase in the FDI inflow, experienced in
CR, and also in other countries.
Statistics on the development of Polish FDI inflow, if we take the year 1993 as equal 100,
would give the following evidence:
1993 100
1994 161
1995 319
1996 513
The twofold increase between 1994 (the year of signing of the PfP accord) may have been
caused by other factors, such as the growth of the economy, economic situation in the
region and in the world economy, etc. However, in Hungary the FDI inflow experienced a
similar development to that in CR and Poland. Again, if FDI in 1993 equals 100 %, then
the situation in the following years show a similar pattern to that described above:
1993 100
1994 127
1995 214
1996 263
Even if we take into consideration that there are undoubtedly other factors that also could
have contributed to the fact that FDI inflow into the CEE countries rose so significantly
during the year of the signing of the PfP accord, we claim that this was also one of the

Economic Aspects of the CR co-operation with other PfP Countries
page 29
contributing factors. Without more detailed study it would be, however, difficult to give
more concrete evidence.
Secondly, the curve in Graph 7 draws attention to the dramatic increase in amounts of FDI
flowing into CR after 1997. It was the year of significant political changes in CR and also a
year of complete revision of incentive plans for foreign investors. The evidence in the form
of dramatic increase of FDI inflow in 1998 and especially 1999 testifies that the steps were
taken in the right direction. (See Graph 8 and also Table 26 in the Annex).
Graph 8: FDI Inward Flows into CR in 1993-99
Source: Czech National Bank
While absolute amounts of FDI have grown, it may also be worth looking into the
geographical distribution of these investments. The latest available data allows for the
structure only till the end of 1998, when Germany and The Netherlands dominated the
scene. In 1999 several new important investors appeared, among them the KBC Bank from
Belgium, with USD 1,1 billion invested into the purchase of the third largest Czech bank,
CSOB, by far the largest single investor in that year and Austrian Erste Bank that bought in
privatization second largest Czech bank, �eská Spo�itelna (for much less money, due to
bad loans in the portfolio).
The geographical distribution of countries with the largest export of capital into CR
appears on Graph 9, which follows.
F D I i n w a r d f l o w s i n 1 9 9 3 - 1 9 9 9
(U S D m i l l i o n )
0
1 0 0 0
2 0 0 0
3 0 0 0
4 0 0 0
5 0 0 0
6 0 0 0
1 9 9 3 1 9 9 4 1 9 9 5 1 9 9 6 1 9 9 7 1 9 9 8 1 9 9 9 *
US
D m
illio
n
Economic Aspects of the CR co-operation with other PfP Countries
page 30
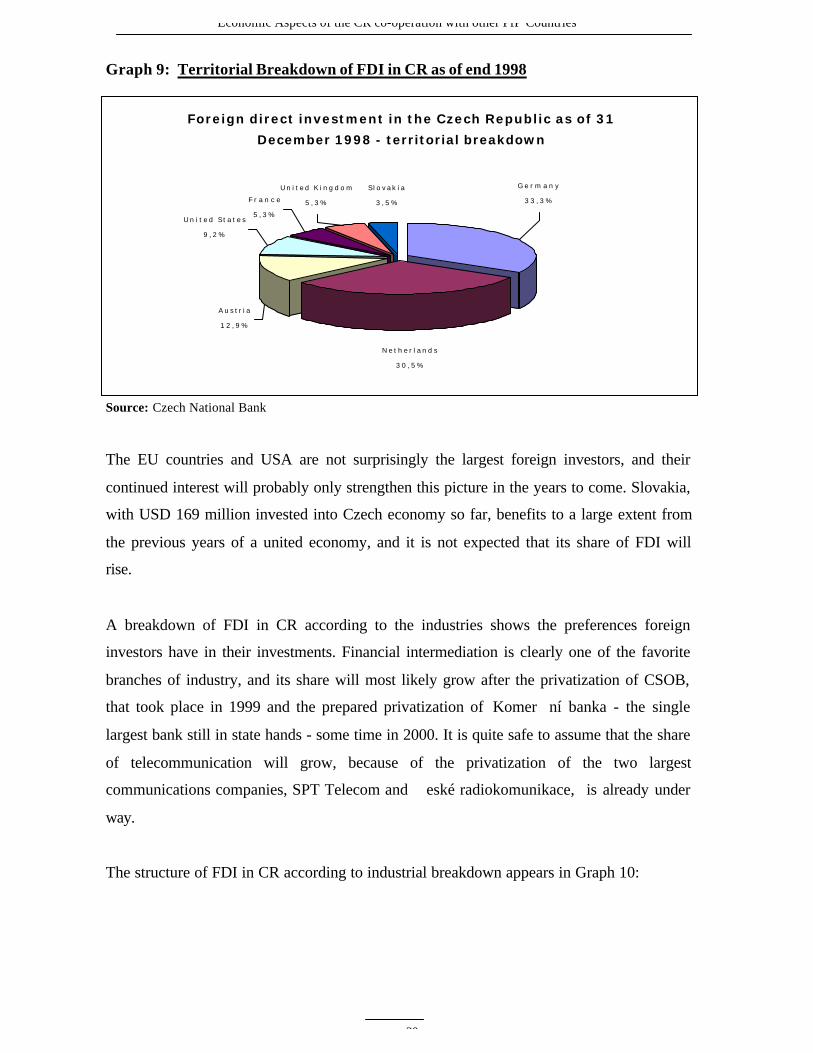
Graph 9: Territorial Breakdown of FDI in CR as of end 1998
Source: Czech National Bank
The EU countries and USA are not surprisingly the largest foreign investors, and their
continued interest will probably only strengthen this picture in the years to come. Slovakia,
with USD 169 million invested into Czech economy so far, benefits to a large extent from
the previous years of a united economy, and it is not expected that its share of FDI will
rise.
A breakdown of FDI in CR according to the industries shows the preferences foreign
investors have in their investments. Financial intermediation is clearly one of the favorite
branches of industry, and its share will most likely grow after the privatization of CSOB,
that took place in 1999 and the prepared privatization of Komer�ní banka - the single
largest bank still in state hands - some time in 2000. It is quite safe to assume that the share
of telecommunication will grow, because of the privatization of the two largest
communications companies, SPT Telecom and �eské radiokomunikace, is already under
way.
The structure of FDI in CR according to industrial breakdown appears in Graph 10:
Foreign direct investment in the Czech Republic as of 31
December 1998 - territorial breakdown
S l o v a k i a
3 , 5 %
U n i t e d K i n g d o m
5 , 3 %
A u s t r i a
1 2 , 9 %
N e t h e r l a n d s
3 0 , 5 %
U n i t e d S t a t e s
9 , 2 %
F r a n c e
5 , 3 %
G e r m a n y
3 3 , 3 %

Economic Aspects of the CR co-operation with other PfP Countries
page 31
Graph 10: Breakdown by Industry of FDI in CR as of end 1998
Source: Czech National Bank
The latest data available for 1999 are still only preliminary, but they confirm the positive
development of FDI in CR. The total of FDI for the year is a record USD 4,88 billion and
in the territorial breakdown, Belgium already assumes its position given by the purchase of
CSOB bank. The breakdown by industry financial institutions appears among the leading
branches as well.
There may be an additional supporting argument for a record inflow of FDI to CR in 1999.
This is the year when CR (and Poland and Hungary) joined NATO. It may be argued that
again, as in 1994, when PfP accord was signed, this additional tie towards the politically
and economically stable organization of NATO brought the necessary assurance to the
investors that their capital will be safe and that they will understand the laws under which
the investment is made.
It is clearly only a speculation that would need to be supported by some statistical evidence
in the years to come, but even in the absence of such evidence it makes sense to assume
that such an important political step, as joining of NATO undoubtedly represents, will have
positive economic aspects.
Tables 27 and 28 in the Annex give the territorial and industrial breakdown of FDI into CR
in 1999.
Foreign direct investment in the Czech republic as of 31
December 1998 - breakdown by industry
F i n a n c i a l i n t e r m e d i a t i o n
2 2 %
M a n u f a c t u r e o f o t h e r
n o n - m e t a l l i c m i n e r a l
p r o d u c t s
1 6 %
W h o l e s a l e t r a d e a n d
c o m m i s s i o n t r a d e
1 7 %
M a n u f a c t u r e o f m o t o r
v e h i c l e s , t r a i l e r s a n d
s e m i t r a i l e r s
1 2 %P o s t a n d
t e l e c o m m u n i c a t i o n s
1 4 %
M a n u f a c t u r e o f f o o d
p r o d u c t s a n d b e v e r a g e s
1 0 %
R e t a i l t r a d e
9 %

Economic Aspects of the CR co-operation with other PfP Countries
page 32
3.1.2. FDI Outward Flow
The situation in 1993 was such that the newly established state had right from the very
beginning some FDI abroad, due to the cross-ownership between the Czech and Slovak
governments and companies. Therefore, the initial position of Czech FDI abroad was USD
91,2 million as of January 1, 1993. This position grew over years to preliminary figure for
1999 of USD 908,1 million.
None of the CEE countries, CR notwithstanding, has been a major exporter of capital to
other countries. Nevertheless, there are some interesting data providing more insight into
the outflow of FDI from CR during the past years.
From the data shown in Graph 11, it is quite clear that Slovakia is the single largest
recipient of Czech FDI. Perhaps surprisingly Slovenia ranks second, followed by country
that one would expect on such a list, Germany.
Graph 11: CR Direct Investments Abroad as of End 1998 – Territorial Breakdown
Source: Czech National Bank
However, quite interesting is another fact: Slovakia and Poland accounted in 1998 for 25
% of all Czech FDI, and if we include Slovenia and Hungary, CEFTA countries represent
C R d i r e c t i n v e s t m e n t a b r o a d a s o f 3 1 D e c e m b e r 1 9 9 8 -
te r r i to r ia l b reakdown
S l o v a k i a
2 1 %
S l o v e n i a
1 9 %G e r m a n y
9 %
O t h e r
3 4 %
L i e c h e n s t e i n
3 %
P o l a n d
4 % B r i t i s h V i r g i n
I s l a n d s
4 %
S e y c h e l l e s
6 %
Economic Aspects of the CR co-operation with other PfP Countries
page 33
45 % of FDI of CR abroad. The other more significant recipient countries (with the
exception of Germany) in the statistics suggest that rather than capital input into economies
of these countries there is more speculative investment and/or tax optimization behind such
FDI. Clearly countries such as Seychelles, British Virgin Islands or Liechtenstein do not
belong among the standard FDI recipients, especially in the case of capital exports from
the capital starvedcountries of CEE.
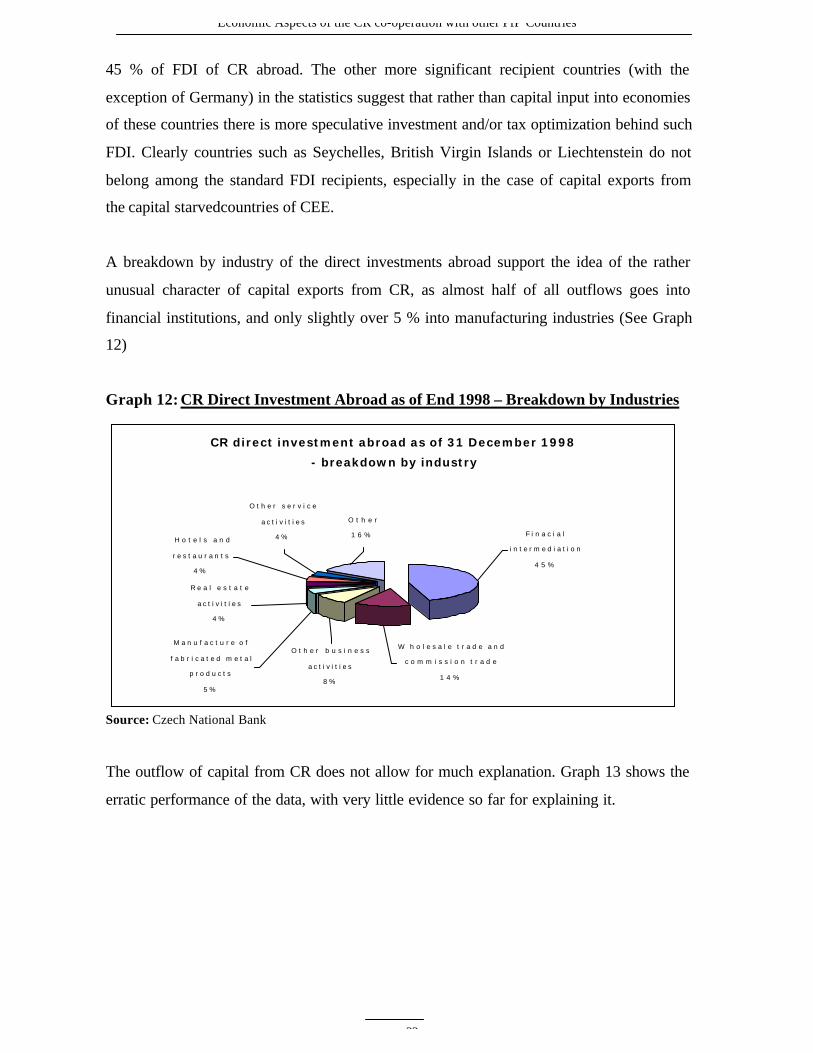
A breakdown by industry of the direct investments abroad support the idea of the rather
unusual character of capital exports from CR, as almost half of all outflows goes into
financial institutions, and only slightly over 5 % into manufacturing industries (See Graph
12)
Graph 12: CR Direct Investment Abroad as of End 1998 – Breakdown by Industries
Source: Czech National Bank
The outflow of capital from CR does not allow for much explanation. Graph 13 shows the
erratic performance of the data, with very little evidence so far for explaining it.
CR direct investment abroad as of 31 December 1998
- breakdown by industry
R e a l e s t a t e
a c t i v i t i e s
4 %
O t h e r b u s i n e s s
a c t i v i t i e s
8 %
M a n u f a c t u r e o f
f a b r i c a t e d m e t a l
p r o d u c t s
5 %
H o t e l s a n d
r e s t a u r a n t s
4 %
O t h e r s e r v i c e
a c t i v i t i e s
4 %
O t h e r
1 6 %
W h o l e s a l e t r a d e a n d
c o m m i s s i o n t r a d e
1 4 %
F i n a c i a l
i n t e r m e d i a t i o n
4 5 %

Economic Aspects of the CR co-operation with other PfP Countries
page 34
Graph 13: CR FDI Outflows in 1993-99
Source: Czech National Bank*preliminary data
The following graph compares the inward flows of capital with the outflows. As was
suggested before, the amounts of inflow capital outnumber the outflows, which at this
stage of development and transformation of the economy of CEFTA countries is definitely
a positive and stabilizing factor. Problems may arise, when the investors start repatriating
their invested capital, if by that time the countries in question will not be capable of
generating a similar inflow of dividends from their own capital invested abroad.
Graph 14 depicts the growing gap between inflow and outflow of FDI into CR.
Graph 14: FDI Inward/Outward Flows in 1993-99
Source: Czech National Bank
*preliminary data
FDI outward f lows in 1993 - 1999
(USD mi l l ion)
0
5 0
1 0 0
1 5 0
2 0 0
2 5 0
1 9 9 3 1 9 9 4 1 9 9 5 1 9 9 6 1 9 9 7 1 9 9 8 1 9 9 9 *
US
D m
illio
n
F D I inward / outward f lows in 1993 - 1999
0
1 0 0 0
2 0 0 0
3 0 0 0
4 0 0 0
5 0 0 0
6 0 0 0
1 9 9 3 1 9 9 4 1 9 9 5 1 9 9 6 1 9 9 7 1 9 9 8 1 9 9 9 *
US
D m
illio
n
I n w a r d f l o w s
O u t w a r d f l o w s

Economic Aspects of the CR co-operation with other PfP Countries
page 35
3.2. FDI of other CEFTA Countries
Statistical evidence of FDI for most of the CEFTA countries is even more scarce than in
the case of foreign trade statistics. Therefore we will present only some basic data to show
that the underlying tendencies are similar in all CEFTA countries, especially after CR
accepted also the philosophy that FDI need some incentives to be attracted.
Poland has been the recipient of the largest amount of FDI among the CEFTA countries.
By the end of 1998, to which comparable data for all CEFTA countries exist, Poland
attracted more than USD 30,7 million and according to the preliminary data for 1999, the
total FDI in Poland between 1990-99 amount to USD 38,9 billion, with 1999 alone
accounting for almost USD 8,3 billion.
89 % of all FDI to Poland come from OECD countries, with 59,3 % belonging to EU
countries. Unlike CR, quite large investors on Polish territory are Russian companies, with
Gazprom being the third largest investor, due to the continued pipeline construction.
Almost half of all FDI is invested into manufacturing industries (foodstuffs, transport
equipment), the financial sector being second with some 15 % of the total.
Hungary still leads CEFTA countries in FDI inflow per capita (USD 1 940 according to the
latest data from the Vienna Institute for Comparative Studies), but it is being quickly
followed by CR (USD 1 654 in 1999) and Slovenia (USD 1 508).
Hungary is further ahead in privatization of utilities than the other CEFTA countries and
therefore their share of FDI in this part of their economy is much higher than in Poland,
CR and Slovakia. (14,5 % in the case of Hungary and less than 5 % in all the other
countries).
Territorial distribution of FDI into Hungary is similar to the other CEFTA countries, with
the predominance of EU and US investments. The only country that records more
investments into Hungary than into other CEE countries is Switzerland, with sizeable FDI
into Hungarian pharmaceutical industry.

Economic Aspects of the CR co-operation with other PfP Countries
page 36
Slovakia has the smallest amount of FDI (with less than USD 2 billion) among all CEE
countries, partly due to the uncertainties connected with the political situation. This has
been solved in the last few years and the new democratic government is eager to bring into
the country more capital from abroad. The other unusual feature than distinguishes
Slovakia is the fact that it is the only CEE country to list another CEE country (CR) as one
of the larger FDI contributors. Otherwise the main FDI providers are the same as in other
CEE countries, i.e. Germany, Austria, USA and The Netherlands. Half of all FDI in
Slovakia went into manufacturing industries, the second largest recipient of FDI being
financial sector.
3.3 Conclusions:
FDI has been a success story for most of the CEE countries. There is enough evidence to
prove that companies under foreign ownership perform better in most indicators, such as
productivity of labor, export performance, etc. Does that mean that attracting more foreign
capital would solve all the CEE problems? Certainly not likely.
First of all, there have been different approaches to FDI in different CEE countries (or
other countries of the world, such as in South East Asia) and it is impossible to say where
the maximum benefits for the host country start. Countries cannot rely on FDI alone, as
this could create a dual economy, with modern, performing enterprises belonging to
foreign capital and slowly dying old companies, unable to transform themselves without an
inflow of fresh capital.
There are interesting similarities in all CEE countries in regards to FDI:
• FDI was directed to similar industries, above all into automotive sector
• Most of the industries of FDI interest were dominated by multinationals
• All CEE countries introduced a number of incentives in order to attract FDI
• Privatization was often the key according to which industries attracted FDI
Economic Aspects of the CR co-operation with other PfP Countries
page 37
FDI offers an interesting tool to measure the level of participation of a given country in the
processes of internationalization. The amount of FDI depends on a number of factors, such
as
• Political situation and risks associated with investments in the given country
• Efficiency of the recipient economy and its overall development
• Rating of the country and its image
• Membership in international organizations and regional associations
There are other, more refined factors, according to which the country is being considered
as a potential recipient of FDI, but the above mentioned are probably the most universal
ones. It is also according to them that the individual CEE countries are being assessed and
found worthy of FDI. The competition for available capital is enormous, and many
investors take only a short-term view.
We believe that if all the factors, including the medium to long term ones are being taken
into consideration, CEE countries stand a good chance of becoming one of the sought after
areas of capital investments, because they have several factors speaking in their favor that
may not be easily found in other regions of the world:
• Long industrial tradition with well educated work force
• Political stability given also by their acceptance into NATO (Slovakia excluded)
• EU accession within a foreseeable future that would immediately move them into
another category of developed countries
• Policy coordination through CEFTA that should assure a more advantageous
treatment in dealings on international stage.

Economic Aspects of the CR co-operation with other PfP Countries
page 38
4. Concluding Remarks
When we discussed the possible topic for a study that would cover some issues related to
the NATO and its partnership with CEE countries, the economic aspects of such a
relationship seemed to be an obvious choice.
As we progressed towards finding some concrete evidence, it became obvious that some
direct correlation between the economic aspects of the development between NATO and
the Partnership for Peace Accord will be very difficult to find. This is not because we
would not believe into such correlation, but because the evidence is too scarce and
dispersed among other data in such a way that it practically does not allow for any
statistical research.
We have tried to prove that:
• There is some evidence of the signing of the PfP Accord influencing the economic
performance of the CEE countries that were part of the agreement
• The increased security that was brought about by the signing of PfP accord by the
CEE countries and strengthened in 1999 by joining of NATO increased the
attractiveness of CEE countries as trading partners.
Although we could not bring enough evidence of such shift in the international position of
CEE countries that would confirm the correctness of the hypothesis, we feel that there are
some conclusions that may justify the effort being taken in preparing this report.
We brought the evidence of positive development of CEFTA 4 intra-trade relations, as well
as the improved position of the CEE countries within the international trade, supported by
statistical data. While it may be too early to prove on some time series the envisaged
correlation this report may serve as a stepping stone for some further research later, when
the data will be available and more clear for interpretation.

Economic Aspects of the CR co-operation with other PfP Countries
page 39
Similar expectation went into the FDI analyses that were analyzed in order to bring some
evidence of a positive development after the signing of the PfP accord. Although in the
case of some countries, CR being one of them, the correlation seemed to apply, there are
many other factors that could override and indeed completely reverse the suggested trends.
Also in this case it seems to be too early to bring any concrete conclusions as to the effects
of the PfP accord on the economic performance of individual countries.
We believe, however, that with the CEE countries (except for Slovakia) being members of
NATO (as of 1999) the international situation of the CEE countries and their trading
position will gradually be changing, as these countries will become more and more
recognized as standard partners both politically and economically.
It is difficult now and will be difficult also in the future to distinguish between the effects
brought about by NATO membership and by EU accession, as NATO will probably play
more important role in the politically based decision of economic relations of CEE
countries. The overall effects should, however, lead to noticeably improved performance of
the CEE countries, this improvement being attributable to a certain degree to NATO. How
large this proportion would be is practically impossible to say, but further analyses later on
could bring more evidence.

Economic Aspects of the CR co-operation with other PfP Countries
page 40
Select Bibliography
Central European Business Weekly, 1998-2000
Czech Republic: Toward EU Accession, Main Report, The World Bank, Washington,
D.C., 1999
CzechTrade Databases 1993-99
Dangerfield, M.: CEFTA: Towards and Beyond the Eastward Enlargement of the
European Union, paper presented to the 3rd EPRC/ISA Conference,
Vienna, September 1998
Dangerfield, M.: Integrating the “New” Europe: What Role (If Any) Does The CEFTA
Have?, paper presented at the conference, University of Salford,
February 1999
Hošková, A.: Komparácia vývoja priamych zahrani�ných investícií na Slovensku a v
transformujúcich sa ekonomikách (Comparison of Development of FDI
in Slovakia and transforming economies), NBS, Bratislava 2000
Hunya,G.: Recent Development of FDI and Privatization, Monthly Report, Vienna
Institute for Comparative Economic Studies, 12/1998
Investi�ní p�íle�itosti v �eské republice (Investment Opportunities in the Czech
Republic), Proceedings of Conference held at University of Economics,
Prague, 1999
Iša, J. et al.: Perspectives of further CEFTA Development from the Point of View of
EU Approach to the Accession of New Members, Institute of Slovak
and World Economy, Bratislava 1998
Kalínská, E.: Investment Inflows and Privatization Process Impact On Countries in
Transition, World of Economy, 35/1999
Myant, M.: Czech Enterprises: The Barriers To Restructuring, Prague Economic
Papers 2/1999
OECD Economic Outlook 1999
OECD Economic Surveys 2000: Czech Republic
OECD Economic Surveys 1999: Hungary
OECD Economic Surveys 1999: Slovak Republic

Economic Aspects of the CR co-operation with other PfP Countries
page 41
Role of CEFTA in the Process of EU Enlargement, International Conference held at the
University of Economics, Prague, May 1999
Statistical Yearbook of the Czech Republic, 1999
Statistical Yearbook of the Slovak Republic, 1999
Statistical Yearbook of Poland, 1999
Statistical Yearbook of Poland, 1995
The World Bank: World Development Indicators 2000
http://www.cnb.cz/
http://www.czechinvest.org/
http://www.czso.cz/
http://www.foreign-trade.com/unstats.HTM
http://www.gm.hu/hunec/v27n2/cefta.htm
http://www.gm.hu/investor/e/eco-2.htm
http://www.ijs.si/cefta/
http://www.itd.hu/
http://www.ksh.hu/eng/index.html
http://www.meh.hu/default.htm
http://www.mnb.hu/
http://www.mpo.cz/
http://www.nbp.pl/home_en.html
http://www.nbs.sk/INDEXA.HTM
http://www.oecd.org/ech/index_2.htm
http://www.otan.nato.int/docu/colloq/1997/97-2-1.htm
http://www.paiz.gov.pl/
http://www.stat.gov.pl/
http://www.statistics.sk/
http://www.syslab.ceu.hu/
http://www.tpo.cz/

Annex
page I
List of tables:
Table 1: Development of Imports of Czech Republic with Selected Regions of theWorld (%)
Table 2: Development of Exports of Czech Republic with Selected Regions of theWorld (%)
Table 3: Foreign trade of individual member countries of CEFTATable 4: Shares of CEFTA countries in foreign trade of individual CEFTA countriesTable 5: Foreign trade of individual CEFTA countries with CEFTA as a wholeTable 6: CR: Trade structure in imports from Poland 1993 – 1999 (in %)Table 7: Gains / Losses in share between 1993 and 1999 in %Table 8: CR: Gains/Losses in Imports from Poland between 1993 and 1999 in
SITC categoriesTable 9: CR: Trade structure in exports to Poland 1993 – 1999 in %Table 10: Gains / Losses in share between 1993 – 1999 in %TABLE 11: CR: GAINS/LOSSES IN EXPORTS TO POLAND BETWEEN 1993 AND 1999 IN
SITC CATEGORIESTable 12: CR: Trade structure in imports from Hungary 1993 – 1999 in %Table 13: Gains / Losses in share between 1993 and 1999 in %Table 14: CR: Gains/Losses in imports from Hungary between 1993 and 1999 in
SITC categoriesTable 15: CR: Trade structure in exports to Hungary 1993 – 1999 in %Table 16: Gains / Losses in share between 1993 and 1999 in %Table 17: CR: Gains/Losses in exports to Hungary between 1993 and 1999 in SITC
categoriesTable 18: CR: Trade structure in imports from Slovakia 1993 - 1999 in %Table 19: Gains / Losses in share between 1993 and 1999 in %Table 20: CR: Gains/Losses in Imports from Slovakia between 1993 and 1999 in
SITC categoriesTable 21: CR: Trade structure in exports to Slovakia 1993 – 1999 in %Table 22: Gains / Losses in share between 1993 and 1999 in %Table 23: CR: Gains/Losses in exports to Slovakia between 1993 and 1999 in SITC
categoriesTable 24: FDI in CEFTA countriesTable 25: CR: FDI position in the Czech republic in 1993 – 1999 (USD million)Table 26: CR: FDI inward flows in 1993 - 1999 (USD million)Table 27: FDI inflows into CR in 1999 – breakdown by industry (preliminary data)Table 28: FDI inflows into CR in 1999 – territorial breakdown (preliminary data)

Annex
page II
SITC 0 – Food and live animalsSITC 1 – Beverages and tobaccoSITC 2 – Crude materials, inedible, except fuelsSITC 3 – Mineral fuels, lubricants and related materialsSITC 4 – Animal and vegetable oils, fats and waxesSITC 5 – Chemicals and related products, n.e.s.SITC 6 – Manufactured goods classified chiefly by materialSITC 7 – Machinery and transport equipmentSITC 8 – Miscellaneous manufactured articlesSITC 9 – Commodities and transactions not classified elsewhere in SITC
Table 1: Development of Imports of Czech Republic with Selected Regions of the World (%):
1985 1989 1991 1993 1995 1998
ME of which EUDECEE+CIS CEFTA Slovakia
30,525,35,960,7
--
37,331,87,651,3
--
57,549,98,432,9
--
64,256,24,530,720,215,9
69,261,14,425,516,411,8
72,163,44,921,014,07,2
Notes:ME = Developed Market EconomiesDE = Developing EconomiesCEE+CIS = former East Europe + USSR
Percentage points remaining to 100 reflect the share of countries with state trading system, especially China.From 1993 figures include also Slovak Republic.Source: Czech Statistical Office, Statistical Yearbook 1999
Table 2: Development of Exports of Czech Republic with Selected Regions of the World (%):
1985 1989 1991 1993 1995 1998
ME of which EUDECEE+CIS CEFTA Slovakia
31,826,810,054,7
--
37,031,98,949,8
--
55,250,88,634,8
--
57,552,77,832,625,821,6
66,060,95,428,021,613,9
69,164,24,226,319,910,6
Notes: See Table 1Source: Czech Statistical Office, Statistical Yearbook 1999

Annex
page III
Table 3: Foreign trade of individual member countries of CEFTAExports Imports Trade Balance
1996 1997 1998 1996 1997 1998 1996 1997 1998Country
USD billion (current prices)
Czech Republic 21,91 22,78 26,36 27,72 27,17 28,82 -5,81 -4,39 -2,46
Hungary 15,70 19,10 23,01 18,14 21,23 27,71 -2,44 -2,13 -2,70
Poland 24,44 25,75 28,23 37,14 42,31 47,05 -12,70 -16,56 -18,82
Romania 8,08 8,43 8,30 11,43 11,28 11,82 -3,35 -2,85 -3,52
Slovakia 8,83 8,25 10,67 11,12 10,26 12,96 -2,29 -2,01 -2,29
Slovenia 8,31 8,37 9,05 9,42 9,37 10,10 -1,11 -1,00 -1,05Source: CESTAT, Statistical Bulletin
Table 4: Shares of CEFTA countries in foreign trade of individual CEFTA countriesThe shares of trade with CEFTA countries in total foreign trade of individual CEFTA countries
Exports Imports
1996 1997 1998 1996 1997 1998
Exports, imports total = 100,0 percentage shares
Czech Republic 22,8 22,1 19,9 14,6 14,9 14,1
Hungary 7,4 7,3 8,9 6,9 6,5 6,9
Poland 6,4 6,7 7,2 6,0 6,3 6,3
Romania 3,6 4,1 4,4 4,7 5,7 8,8
Slovakia 42,1 41,0 31,8 29,7 29,1 25,0
Slovenia 5,7 5,7 6,5 6,8 7,4 7,2Source: CESTAT, Statistical Bulletin
Table 5: Foreign trade of individual CEFTA countries with CEFTA as a whole
Exports Imports Trade BalanceImport
coverage byexports
1996 1997 1998 1996 1997 1998 1996 1997 1998 1996 1998
USD billion (current prices)
Czech Republic 5,00 5,03 5,25 4,04 4,06 4,06 0,96 0,97 1,19 124 129
Hungary 1,16 1,39 2,04 1,25 1,38 1,77 -0,09 0,01 0,27 93 115
Poland 1,56 1,74 2,03 2,23 2,65 2,97 -0,67 -0,91 -0,94 70 68
Romania 0,29 0,34 0,37 0,54 0,64 1,04 -0,25 -0,30 -0,67 54 35
Slovakia 3,72 3,38 3,40 3,31 2,99 3,24 0,41 0,39 0,16 112 105
Slovenia 0,47 0,48 0,59 0,64 0,69 0,73 -0,17 -0,21 -0,14 74 81
Source: CESTAT, Statistical Bulletin

Annex
page IV
Table 6: CR: Trade structure in imports from Poland 1993 – 1999 (in %)1993 1994 1995 1996 1997 1998 1999
SITC 0 3,55 4,69 5,32 5,62 7,93 10,02 11,63SITC 1 0,34 0,17 0,03 0,05 0,04 0,07 0,12SITC 2 12,21 6,82 5,96 4,98 3,69 3,91 3,30SITC 3 24,44 24,56 22,44 21,08 17,87 11,75 10,37SITC 4 0,00 0,01 0,13 0,16 0,09 0,14 0,07SITC 5 13,04 15,23 13,78 12,47 12,23 11,84 11,01SITC 6 24,36 23,43 24,16 23,86 27,00 31,31 30,94SITC 7 14,71 14,70 17,03 20,51 19,69 18,59 17,93SITC 8 7,34 10,40 11,15 11,23 11,46 12,37 14,61SITC 9 0,01 0,00 0,00 0,04 0,00 0,00 0,00
SITC 0-9 100,00 100,00 100,00 100,00 100,00 100,00 100,00Source: CzechTrade
Table 7: Gains / Losses in share between 1993 and 1999 in %SITC 0 8,08SITC 8 7,27SITC 6 6,58SITC 7 3,22SITC 4 0,07
SITC 9 -0,01SITC 1 -0,22SITC 5 -2,03SITC 2 -8,91SITC 3 -14,07
Source: CzechTrade
Table 8: CR: Gains/Losses in Imports from Poland between 1993 and 1999 in SITCcategories
SITCCommodity
Group
Changes of Sharein Total Imports
Changes of sharein relevant SITC
commodity groupFood and live animals
Coffee, tea, cocoa, spices Chocolate and cocoa productsMiscellaneous manufactured articles Furniture and parts of itManufactured goods classified by material Iron and steelMachinery and transport equipment Road vehicles, parts of it
007073882667778
8,08%1,98%1,04%7,27%
5%6,58%
8%3,22%3,4%
16,4%27,5%
27%
25%
17%
Fuels, lubricants and related materials Coal, coke, briquettesNon-edible crude materials Pulp and waste paper Crude fertilizers, crude minerals
33222527
-14,07%-13,7%-8,91%-2,62%-4,5%
-30%
-16%-6,83%
Source: CzechTrade

Annex
page V
Table 9: CR: Trade structure in exports to Poland 1993 – 1999 in %1993 1994 1995 1996 1997 1998 1999
SITC 0 6,95 3,92 10,18 4,22 4,36 5,46 5,31SITC 1 0,25 0,07 0,12 0,19 0,19 0,18 0,19SITC 2 4,46 3,39 3,31 2,50 1,78 1,70 1,78SITC 3 1,74 6,59 7,22 6,67 5,56 6,36 5,35SITC 4 0,40 0,18 0,09 1,02 0,81 0,81 0,53SITC 5 25,38 24,18 22,95 23,41 18,74 16,89 16,51SITC 6 29,42 31,41 29,19 30,98 32,17 31,43 31,98SITC 7 22,95 22,68 19,91 25,15 29,87 29,41 30,09SITC 8 8,45 7,57 7,03 5,85 6,52 7,75 8,27SITC 9 0,00 0,00 0,00 0,01 0,00 0,00 0,00
SITC 0-9 100,00 100,00 100,00 100,00 100,00 99,99 100,00Source: CzechTrade
Table 10: Gains / Losses in share between 1993 – 1999 in %SITC 7 7,14SITC 3 3,61SITC 6 2,56SITC 4 0,13SITC 9 0,00
SITC 1 -0,06SITC 8 -0,18SITC 0 -1,65SITC 2 -2,68SITC 5 -8,88
Source: CzechTrade
Table 11: CR: Gains/Losses in exports to Poland between 1993 and 1999 in SITC categoriesSITC
CommodityGroup
Changes of Sharein Total Imports
Changes of sharein relevant SITC
commodity groupMachinery and transport equipment Road vehicles, parts of it Power generating machineryFuels, lubricants and related materials Coal, coke, briquettesManufactured goods classified by material Paper, paperboard, articles thereof
77871332664
7,14%6,74%2,73%2,61%1,98%2,56%3,17%
14,93%7,1%
24,03%
9,64%Chemicals and related products Organic chemicals Dyeing, tanning and col. materials
55153
-8,88%-3,24%-1,4%
-4,04%-3,9%
Source: CzechTrade

Annex
page VI
Table 12: CR: Trade structure in imports from Hungary 1993 – 1999 in %1993 1994 1995 1996 1997 1998 1999
SITC 0 8,93 19,73 19,73 24,46 22,21 18,35 15,97SITC 1 7,45 2,24 2,24 1,98 1,14 1,27 1,34SITC 2 3,30 3,81 3,81 3,55 2,19 2,08 1,57SITC 3 37,91 2,66 2,66 2,10 6,49 6,01 2,14SITC 4 0,30 1,12 1,12 0,50 0,30 0,26 0,23SITC 5 14,92 23,70 23,70 18,06 17,05 15,84 13,86SITC 6 12,09 21,49 21,49 21,78 20,08 21,29 19,65SITC 7 8,77 13,96 13,96 16,58 21,83 26,37 36,73SITC 8 6,33 11,29 11,29 11,00 8,71 8,53 8,52SITC 9 0,00 0,00 0,00 0,00 0,00 0,00 0,00
SITC 0-9 100,00 100,00 100,00 100,00 100,00 100,00 100,00
Source: CzechTrade
Table 13: Gains / Losses in share between 1993 and 1999 in %SITC 7 27,96SITC 6 7,56SITC 0 7,04SITC 8 2,19SITC 9 0,00
SITC 4 -0,07SITC 5 -1,06SITC 2 -1,73SITC 1 -6,11SITC 3 -35,77
Source: CzechTrade
Table 14: CR: Gains/Losses in imports from Hungary between 1993 and 1999 in SITCcategories
SITCCommodity
Group
Changes of Sharein Total Imports
Changes of sharein relevant SITC
commodity groupMachinery and transport equipment Power generating machinery Internal combust enginesManufactured goods classified by material Paper, paperboard, articles thereof Manufactures of metal n.e.s.Food and live animals Vegetables and fruit
77171366469005
27,96%20,43%20,1%7,65%2,03%2,83%7,04%2,19%
49,83%82,28%
3,54%7,48%
5,83%Fuels, lubricants and related materials Petroleum, petroleum products Heavy petrol / bitum oilsBeverages and tobacco Tobacco and tobacco manufactures
333334112
-35,77%-37,48%-37,33%-6,11%-5,97%
-85,65%-17,74%
-74,38%Source: CzechTrade
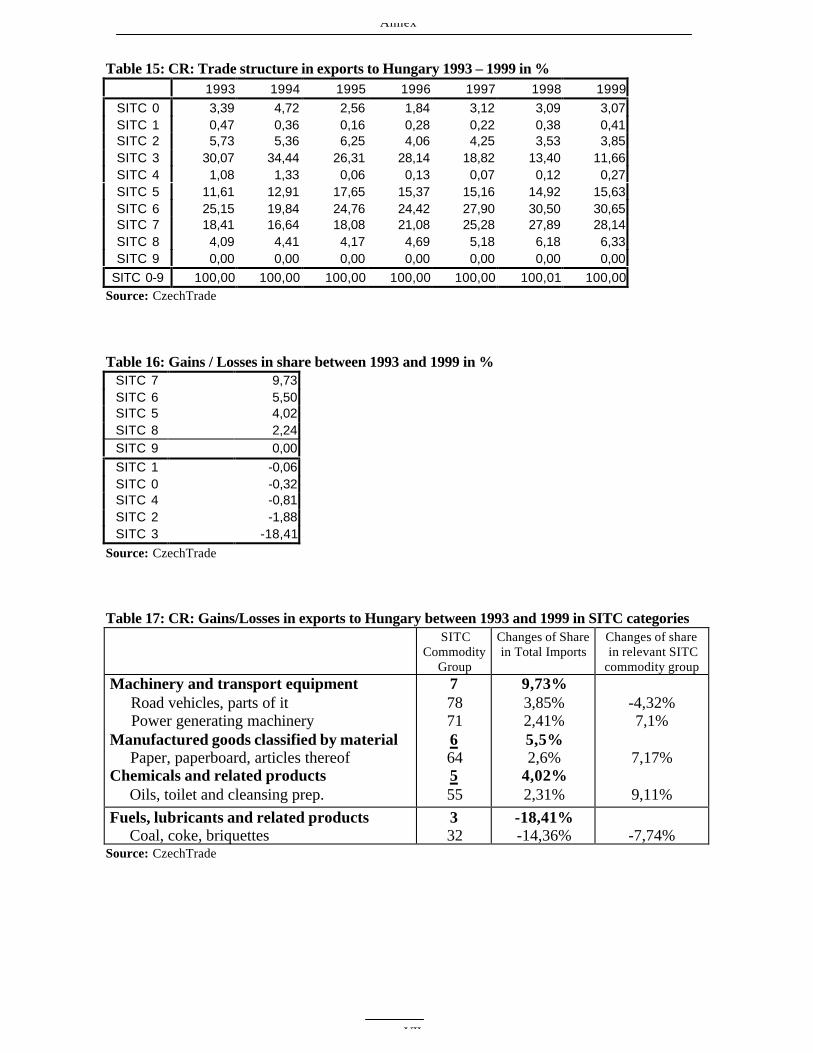
Annex
page VII
Table 15: CR: Trade structure in exports to Hungary 1993 – 1999 in %1993 1994 1995 1996 1997 1998 1999
SITC 0 3,39 4,72 2,56 1,84 3,12 3,09 3,07SITC 1 0,47 0,36 0,16 0,28 0,22 0,38 0,41SITC 2 5,73 5,36 6,25 4,06 4,25 3,53 3,85SITC 3 30,07 34,44 26,31 28,14 18,82 13,40 11,66SITC 4 1,08 1,33 0,06 0,13 0,07 0,12 0,27SITC 5 11,61 12,91 17,65 15,37 15,16 14,92 15,63SITC 6 25,15 19,84 24,76 24,42 27,90 30,50 30,65SITC 7 18,41 16,64 18,08 21,08 25,28 27,89 28,14SITC 8 4,09 4,41 4,17 4,69 5,18 6,18 6,33SITC 9 0,00 0,00 0,00 0,00 0,00 0,00 0,00
SITC 0-9 100,00 100,00 100,00 100,00 100,00 100,01 100,00Source: CzechTrade
Table 16: Gains / Losses in share between 1993 and 1999 in %SITC 7 9,73SITC 6 5,50SITC 5 4,02SITC 8 2,24SITC 9 0,00
SITC 1 -0,06SITC 0 -0,32SITC 4 -0,81SITC 2 -1,88SITC 3 -18,41
Source: CzechTrade
Table 17: CR: Gains/Losses in exports to Hungary between 1993 and 1999 in SITC categoriesSITC
CommodityGroup
Changes of Sharein Total Imports
Changes of sharein relevant SITC
commodity groupMachinery and transport equipment Road vehicles, parts of it Power generating machineryManufactured goods classified by material Paper, paperboard, articles thereofChemicals and related products Oils, toilet and cleansing prep.
77871664555
9,73%3,85%2,41%5,5%2,6%
4,02%2,31%
-4,32%7,1%
7,17%
9,11%Fuels, lubricants and related products Coal, coke, briquettes
332
-18,41%-14,36% -7,74%
Source: CzechTrade

Annex
page VIII
Table 18: CR: Trade structure in imports from Slovakia 1993 - 1999 in %1993 1994 1995 1996 1997 1998 1999
SITC 0 5,50 6,06 5,27 4,70 4,50 5,58 6,23SITC 1 1,41 1,83 1,55 1,25 1,78 1,88 2,21SITC 2 4,30 4,75 4,52 3,85 3,23 3,95 4,02SITC 3 6,61 5,41 6,11 7,02 8,52 8,15 12,35SITC 4 0,17 0,18 0,24 0,32 0,30 0,51 0,49SITC 5 14,42 15,83 17,01 15,84 15,66 14,96 14,90SITC 6 34,02 37,59 38,86 37,98 38,46 40,59 36,03SITC 7 23,75 19,13 18,03 20,47 20,50 17,79 16,71SITC 8 9,82 9,21 8,39 8,55 6,99 6,53 6,97SITC 9 0,00 0,02 0,02 0,03 0,05 0,07 0,09
SITC 0-9 100,00 100,00 100,00 100,00 99,99 100,01 100,00Source: CzechTrade
Table 19: Gains / Losses in share between 1993 and 1999 in %SITC 3 5,74SITC 6 2,01SITC 1 0,80SITC 0 0,73SITC 5 0,48SITC 4 0,32SITC 9 0,09
SITC 2 -0,28SITC 8 -2,85SITC 7 -7,05
Source: CzechTrade
Table 20: CR: Gains/Losses in Imports from Slovakia between 1993 and 1999 in SITCcategories
SITCCommodity
Group
Changes of Sharein Total Imports
Changes of sharein relevant SITC
commodity groupFuels, lubricants and related materials Petroleum, petroleum products Electric currentManufactured goods classified by material Paper, paperboard, articles thereof Non-metallic min. manufactures n.e.s.
3333566466
5,74%4,96%0,62%2,01%2,5%1,72%
-4,39%4,99%
6,46%4,32%
Machinery and transport equipment Elec. machinery, app. and appliancesMiscellaneous manufactured articles Prof., scient. & contr. instruments
777887
-7,05%-2,41%-2,85%-0,92%
-3,36%
-6,96%Source: CzechTrade

Annex
page IX
Table 21: CR: Trade structure in exports to Slovakia 1993 – 1999 in %1993 1994 1995 1996 1997 1998 1999
SITC 0 7,56 6,21 7,00 6,91 6,61 8,05 8,29SITC 1 2,51 2,49 2,37 2,64 3,07 2,87 3,86SITC 2 2,18 2,86 3,17 2,83 2,59 2,27 2,67SITC 3 10,19 8,79 7,66 6,38 6,05 5,41 5,30SITC 4 0,41 0,64 0,25 0,26 0,28 0,37 0,32SITC 5 12,35 14,96 13,60 12,94 12,45 12,32 13,52SITC 6 25,08 26,75 29,43 28,73 25,22 26,99 24,89SITC 7 27,32 27,40 27,40 28,97 33,13 30,87 30,29SITC 8 12,34 9,84 9,09 10,16 10,45 10,69 10,79SITC 9 0,06 0,05 0,02 0,19 0,15 0,15 0,08
SITC 0-9 100,00 100,00 99,99 100,00 100,00 99,99 100,00Source: CzechTrade
Table 22: Gains / Losses in share between 1993 and 1999 in %SITC 7 2,97SITC 1 1,35SITC 5 1,17SITC 0 0,73SITC 2 0,49SITC 9 0,02
SITC 4 -0,09SITC 6 -0,19SITC 8 -1,55SITC 3 -4,90
Source: CzechTrade
Table 23: CR: Gains/Losses in exports to Slovakia between 1993 and 1999 in SITC categoriesSITC
CommodityGroup
Changes of Sharein Total Imports
Changes of sharein relevant SITC
commodity groupMachinery and transport equipment Road vehicles, parts of it Other transport equipmentBeverages and tobacco Tobacco and tobacco manufactures
77879112
2,97%4,94%0,69%1,35%1,67%
13,55%1,95%
30,22%Fuels, lubricants and related products Coal, coke, briquettesMiscellaneous manufactured articles Apparel and clothing accessories
332884
-4,9%-4,51%-1,5%-1,11%
-5,99%
-7,3%Source: CzechTrade

Annex
page X
Table 24: FDI in CEFTA countriesFDI (% of gross
domesticinvestment)
% of GDP FDI in mill. USDGross FDI (% of
PPP GDP)
1980 1998 1980 1998 1990 1998 1988 1998
Bulgaria - 22,2 - 3,3 4 401 0 1
Czech Republic 0 15,1 0 4,5 207 2554 - 2
Hungary 0 13,1 0 4 0 1936 0 2,3
Latvia - 24,3 - 3,6 - 357 - 3,1
Lithuania - 35,7 - 8,6 - 926 - 3,9
Poland 0,2 15,2 0 4 89 6365 0 2,5
Romania - 30,1 - 5,3 0 2031 0 1,6
Slovak Republic - 7 - 2,8 0 562 - 1,7
Slovenia - 3,4 - 0,8 - 165 - 0,6Source: World Development Indicators 2000, World Bank
Table 25: CR: FDI position in the Czech republic in 1993 – 1999 (USD million)Year Equity capital Reinvested earnings Other capital Total
As to 1.1.1993 2889,0 - - 2889,01993 3423,1 - - 3423,1
1994 4546,8 - - 4546,8
1995 7350,0 - - 7350,01996 8572,4 - - 8572,4
1997 7955,7 263,4 1014,7 9233,8
1998 11719,3 426,5 2155,4 14375,01999* 13750,7 634,9 1858,0 16246,2
Source: Czech National Bank*preliminary dataNote: Equity capital contains also foreign investor's shares in subsidiaries and associates
Table 26: CR: FDI inward flows in 1993 - 1999 (USD million)
Year Equity capitalReinvestedearnings
1993 653,5 -
1994 868,5 -
1995 2562,2 -1996 1428,4 -
1997 1300,4 -
1998 2539,6 180,21999* 4877,0 231,2
Source: Czech National Bank*preliminary data

Annex
page XI
Table 27: FDI inflows into CR in 1999 – breakdown by industry (preliminary data)
mill. USD %
Business and business services 1230,3 25,2
Financial intermediation 1217,2 25,0
Manufacture and distribution ofelectricity, gas and water
438,9 9,0
Food production 216,2 4,4
Manufacture of non-metalmineral products
170,3 3,5
Hotels and restaurants 162,9 3,3
Manufacture of vehicles 143,8 2,9
Real estate activities 128,2 2,6
Other 1169,2 24,0
Total 4877,0 100,0
Table 28: FDI inflows into CR in 1999 – territorial breakdown (preliminary data)
mill. USD %
Belgium 1235,9 25,3
Germany 781,1 16,0
Netherlands 729,4 15,0
Austria 630,9 12,9
USA 561,5 11,5
Switzerland 305,4 6,3
United Kingdom 168,8 3,5
France 162,2 3,3
Others 301,8 6,2
Total 4877,0 100,0


