oil spill map for indian sea region based on bhuvan- geographic ...

ww
w.n
rsc.
gov.
in
p i x e l 2 p e o p l e
1
NEWSLETTERNATIONAL REMOTE SENSING CENTRENATIONAL REMOTE SENSING CENTREIndian Space Research Organisation
inform inspire engageeducate innovate Volume 7 Issue 2
OC
T - D
EC 2
017
Shri A S Kiran Kumar, Secretary DOS & Chairman ISRO, addressing the students & participants during concluding
session of World Space Week Celebrations at Earth station, Shadnagar thru Video Conference from New Delhi
World Space Week Celebrations 1.
Bhuvan Data Centre at NRSC, Shadnagar2.
New Square Wave Targets3.
ISRO’S Gagan Hyperlapse Imaging System 4.
(I-GHIS)
RS Based Watershed Monitoring under 5.
Pradhan Mantri Krishi SinchayeeYojana
RISAT-1 Level-2A Enhanced Terrain Corrected 6.
Geo - Referenced Products
Image Rating Parameter for High Resolution 7.
Sensor Data
Geospatial Technology Applications In Crop 8.
Insurance
2
4
5
6
7
8
9
10
Title Page
from the director’s desk
pixelpeople
IndexIt gives me immense pleasure to see that the latest issue of P2P is in your hands citing some of the recent activities of NRSC. Let me start conveying you few developments around us.
NRSC celebrated World Space Week-2017 in a grand way spreading
awareness about Space and ISROs programs among young minds of the country. Our Antarctica Team of 3 Scientists have just returned to a grand welcome and new team has taken over the activities of our Ground station at Antarctica. Ms. Mangalamani is first woman employee of NRSC to participate in one-year expedition and offer her services. Her interview on her Antarctica expedition experiences was also telecasted by BBC.
I like to share that our both aircraft were flown nearly 337 hours in the last year and a large scale geospatial database has been generated for 6 towns under AMRUT project and is in progress for another 12 towns. We have developed a HYPERLAPSE imaging system for 3D field data collection useful in generating geotagged panaromic walkthroughs and 3600 virtual tours.
In year 2017, we have signed 20 MoUs with Central and State Govts agencies/departments towards supporting them for use of Geospatial technology for G-governance, E-governance and Ease of doing things.
Let me conclude with some recognition for our works. NRSC had received Skoch Merit & Platinum Awards for MNREGA & NDEM Projects and Skoch Organisation Level Award for E-Governance. Also, Regional Centre West on behalf of Chairman, ISRO had taken Annual One Globe Award for Excellence in R&D: in recognition of initiatives taken up ‘to transform India into global scientific hub, aerospace R&D, GAGAN & Bhuvan’. NRSC was awarded ‘Asia Geospatial Leadership Award - Space technology & application’ for Bhuvan Geoportal.
In this P2P issue, some of our recent and ongoing activities are presented.
I wish you all happy new year-2018 and reading this informative contents.
-Dr. Y.V.N. Krishna Murthy, Director, NRSC
p i x e l 2 p e o p l ew
ww
.nrs
c.go
v.in
2
p i x e l 2 p e o p l e
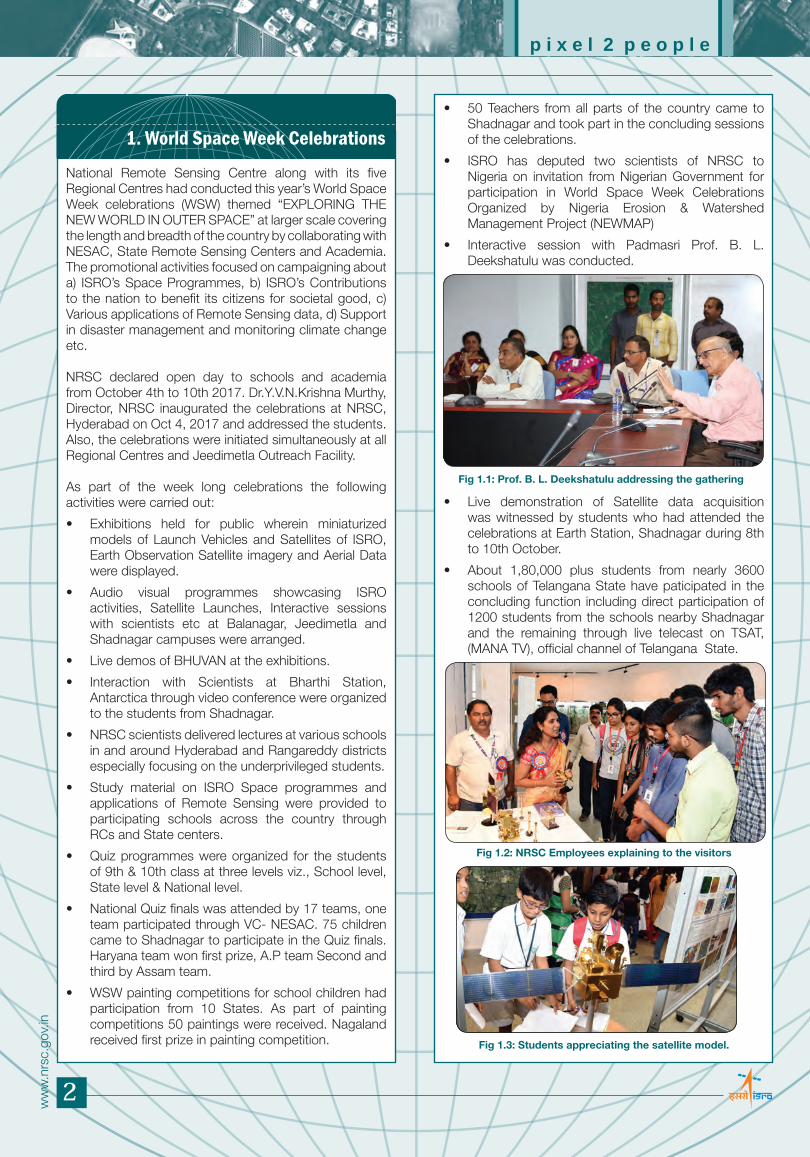
National Remote Sensing Centre along with its five Regional Centres had conducted this year’s World Space Week celebrations (WSW) themed “EXPLORING THE NEW WORLD IN OUTER SPACE” at larger scale covering the length and breadth of the country by collaborating with NESAC, State Remote Sensing Centers and Academia. The promotional activities focused on campaigning about a) ISRO’s Space Programmes, b) ISRO’s Contributions to the nation to benefit its citizens for societal good, c) Various applications of Remote Sensing data, d) Support in disaster management and monitoring climate change etc.
NRSC declared open day to schools and academia from October 4th to 10th 2017. Dr.Y.V.N.Krishna Murthy, Director, NRSC inaugurated the celebrations at NRSC, Hyderabad on Oct 4, 2017 and addressed the students. Also, the celebrations were initiated simultaneously at all Regional Centres and Jeedimetla Outreach Facility.
As part of the week long celebrations the following activities were carried out:
Exhibitions held for public wherein miniaturized •models of Launch Vehicles and Satellites of ISRO, Earth Observation Satellite imagery and Aerial Data were displayed.
Audio visual programmes showcasing ISRO •activities, Satellite Launches, Interactive sessions with scientists etc at Balanagar, Jeedimetla and Shadnagar campuses were arranged.
Live demos of BHUVAN at the exhibitions. •
Interaction with Scientists at Bharthi Station, •Antarctica through video conference were organized to the students from Shadnagar.
NRSC scientists delivered lectures at various schools •in and around Hyderabad and Rangareddy districts especially focusing on the underprivileged students.
Study material on ISRO Space programmes and •applications of Remote Sensing were provided to participating schools across the country through RCs and State centers.
Quiz programmes were organized for the students •of 9th & 10th class at three levels viz., School level, State level & National level.
National Quiz finals was attended by 17 teams, one •team participated through VC- NESAC. 75 children came to Shadnagar to participate in the Quiz finals. Haryana team won first prize, A.P team Second and third by Assam team.
WSW painting competitions for school children had •participation from 10 States. As part of painting competitions 50 paintings were received. Nagaland received first prize in painting competition.
50 Teachers from all parts of the country came to •Shadnagar and took part in the concluding sessions of the celebrations.
ISRO has deputed two scientists of NRSC to •Nigeria on invitation from Nigerian Government for participation in World Space Week Celebrations Organized by Nigeria Erosion & Watershed Management Project (NEWMAP)
Interactive session with Padmasri Prof. B. L. •Deekshatulu was conducted.
Live demonstration of Satellite data acquisition •was witnessed by students who had attended the celebrations at Earth Station, Shadnagar during 8th to 10th October.
About 1,80,000 plus students from nearly 3600 •schools of Telangana State have paticipated in the concluding function including direct participation of 1200 students from the schools nearby Shadnagar and the remaining through live telecast on TSAT, (MANA TV), official channel of Telangana State.
1. World Space Week Celebrations
Fig 1.1: Prof. B. L. Deekshatulu addressing the gathering
Fig 1.3: Students appreciating the satellite model.
Fig 1.2: NRSC Employees explaining to the visitors

ww
w.n
rsc.
gov.
in
p i x e l 2 p e o p l e
3
Dr R Praveen Kumar, IPS, Secretary TSWRS, was •the Chief Guest for the concluding session of the celebrations and also distributed prizes to the winners of Quiz competitions and certificates to the participants.
Shri A S Kiran Kumar, Secretary DOS & Chairman-•ISRO had participated in the valedictory function through Video Conference from New Delhi and addressed the students participating in the function.
Overall, the outreach to students is about •4,19,536 numbers. Fig 1.4: Dr. R Praveen Kumar, IPS, Secretary TSWRS, Chief
Guest for the concluding session, addressing the students
Fig 1.5: Students who gave cultural performances during concluding session of World Space Week at Shadnagar.
ISRO has deputed Dr K Mruthyunjaya Reddy and Sri D Giri Babu of NRSC to Abhuja, Nigeria on the invitation of Nigerian Government for participating in the World Space Week Celebrations Organized by Nigeria Erosion & Watershed Management Project (NEWMAP). As part of their visit, they have delivered lectures on ISRO Programmes, applications of Bhuvan and Monitoring of Rural Development Programmes. Discussions were also held for possible collaboration between NRSC/ ISRO and Nigeria Erosion & Watershed Management Project (NEWMAP).
Fig 1.6: ISRO Scientists with Nigerian students.
Fig 1.7: ISRO Scientists with High level delegation at Abhuja
Fig 1.8: WSW Participants at Abhuja, Nigeria.
NRSC Scientists participate in World Space Week Celebrations Organized by Nigeria Erosion and Watershed Management Project (NEWMAP)

p i x e l 2 p e o p l ew
ww
.nrs
c.go
v.in
4
p i x e l 2 p e o p l e
Bhuvan, Indian Geo-Spatial Portal of ISRO was launched on 09, August 2009. Over the years, Bhuvan has grown in terms of data hosted, web applications, services and users. Today, Bhuvan has 95 different web applications which are regularly accessed by users. More than 35 Lakh unique users visited Bhuvan in the year 2017. Bhuvan services are hosted from Bhuvan Data Centre in NRSC Balanagar. The spread of users across the country is shown in Fig 2.1.
Considering the growth of Bhuvan in terms of applications and its users, a new Data Centre at Shadnagar with highly scalable architecture using state-of-the-art technology was installed. Bhuvan data centre at Shadnagar is co-located with Integrated Multi Mission Ground Segment for Earth Observation Satellites (IMGEOS) Data Centre facility. Pictorial representation is shown in Fig 2.2.
Major features of this infrastructure:
1. Computation Capacity: 100 servers are operational with 8 servers as fault tolerant for increased High availability. The design provides application availability during failure of limited hardware (server).
2. Load Balancing: Servers are optimally loaded for servicing applications with Hardware load balancer.
3. Storage Architecture: Three-tier storage architecture was implemented for this data centre. First tier contains 30 TB of high speed Flash storage, second tier contains 100 TB SAS storage and Third tier consists of a Tape library. Backup NAS storage of 40 TB is also available. Additional 160TB storage is installed for satellite data processing.
4. Parallel File System: General Parallel File System (GPFS) was implemented for providing storage to all 100 Bhuvan servers to provide high performance, higher input/output performance, high availability, support for heterogeneous clusters and hierarchical storage manager (HSM).
5. No Single Point Failure: To ensure this, every device is planned with redundancy and is configured in high availability mode.
6. Global Site Load Balancing: Bhuvan nodes are established at Regional Remote Sensing Centres at Kolkata, Bangalore, Nagpur and Jodhpur. Implementation of five other Bhuvan nodes is also planned in the next two years. All these nodes will share the user load among themselves by global site load balancing (GSLB) method. In this method, health metrics will be shared among all the remote data centres and the GLSB device decides which data centre the user request should land on.
7. Link Load Balancing: This infrastructure has the capacity to operate using multiple internet lines from different internet service providers using link load balancer device to serve the application to user in quick & optimal internet route.
8. Security: Users from across the world can access the services hosted in this data centre. Security devices like Web-Application-Firewall (WAF) and Intrusion-Detection/Prevention-System features in firewall are build into this infrastructure for preventing cyber security attacks.
9. Data Centre Management: Asset management solution using sensors, network monitoring software to monitor the proper functioning of all the systems, network operations centre was implemented.
10.Load Testing: It is important to know how much load a web application can handle before deployment and accordingly Load-Testing using simulator software was carried out simulating user load.This new Data centre is planned to be augmented with 500 servers and 1500 TB of storage in the next five years for further enhancing services of Bhuvan.
Fig 2.1: Bhuvan Users in Year 2017, Red dots indicate areas of High number of Bhuvan users; Blue dots indicate the areas of
low density of users
2. Bhuvan Data Centre at NRSC Shadnagar
Fig 2.2: Generic view of Bhuvan Data Centre Architecture

ww
w.n
rsc.
gov.
in
p i x e l 2 p e o p l e
5
New Square wave response Targets and parameter derivation for High resolution Multi spectral data
It is very important to understand and quantify the Square response the High resolution multi spectral imaging system of Cartsat-2 series platforms as the total system square wave response characterizes the radiance recording capability for a given contrast and size of the targets. Towards characterizing 1.6m multispectral imaging square wave response of Cartosat-2 series sensors, customized targets were designed and developed. Satellite data acquisition was carried out for the Cartosat-2 series missions with different roll tilt angles over a period of six months with the opportunities of coverage and clear sky conditions over the targets deployed in the IMGEOS CAL Site imaging the targets.
Sensor SWR and MTF characterization was carried out in the lab during prelaunch for those missions and the repsonse of the system during post launch phase ( in orbit performance) was compared and confirmed to estimate the overall system performance. This parameter helped in understanding the overall system response as well as restoration process of data acquired by the system which improves the radiometric quality of the data product. In the operational phase, the activity is being carried out periodically to understand the degradations, if any, of the on-board electronic system and to ensure the data quality throughout operational phase.
Design of targets: Target material selection was very
critical in view of long term usage, portability and its radiometric response. The surface should not be too smooth which leads to glint issues in acquired data. Very low response target with black colour and very high response target with white colour were created for estimating the response of the system at the highest contrast change. Bar Targets were designed, with one pixel size in width and five pixel size in length for each bar. 5 bars are added as Black/White/Black/White/Black for making one SWR target. 4 transitions can be observed in one direction. 2 such targets can cover both along track and across track direction. Each target used for evaluation are of 8mx8m size.
Fig 3.1 depicts the preparation of target deployment on ground for data collection from high resolution sensors. Fig 3.2 shows the image of the targets generated from the acquired high resolution multi spectral and PAN data. Fig 3.3 details the peaks or transitions observed in the acquired through which SWR response of system in orbit was computed.
The material and methods will be continued to establish the square wave response of the agile High Resolution satellite platforms for the upcoming missions.
Fig 3.1: SWR Target deployed on ground for high resolution data acquisition
3. New Square Wave Response Targets
Fig 3.2: SWR Targets as acquired by high resolution sensors Fig 3.3: Response transition as observed in acquired data
SWR Targets deployed in along track and across track direction.

p i x e l 2 p e o p l ew
ww
.nrs
c.go
v.in
6
p i x e l 2 p e o p l e
Isro Gagan Hyperlapse Imaging System (I-GHIS) is an indigenous low cost 360˚ image acquisition system which was conceptualized, designed, developed and operationalized inhouse. It integrates GAGAN corrected GPS coordinates and hyper-lapse imagery for generation of interactive geotagged panoramas, walk throughs and 360˚ virtual tours as a virtual reality solution on ISRO’s Bhuvan, the Indian Earth Observation Data Visualization Portal and also for Location Based Services (LBS) applications.
Salient Features: I-GHIS Version-1 was realized with eight cameras (Fig 4.1) mounted on an octagonal camera rig to acquire 12MP still images and HD (4K resolution) video footages at frame rates ranging from 30 to 240 fps based on resolution selected. The camera rig, designed in-house, weighs only 1.4 kg and realized through 3D printing technology.
The system is mountable on SUVs/MUVs, Helmet, Tripod and UAV for various applications. The generated panoramas are weaved and linked via hotspots (GAGAN based locations) to create 360o Virtualization Reality tours for visualization. VR tours were generated for the following places and uploaded on Bhuvan (Fig 4.2).
Salarjung Museum for Cultural Ministry •
Rajasthan Forts for Cultural Ministry: Kumbhalgarh •fort, Chittorgarh fort, Mandore fort, Mehrangarh fort (Fig 4.3), Jaswant Thada and Umaid Bhawan Palace.
4. ISRO’S Gagan Hyperlapse Imaging System (I-GHIS)
Fig 4.1: 8-camera I-GHIS system
Also, VR tours were generated for New Delhi Railway Station for Ministry of Railways and SDSC-SHAR campus for internal comsumption of ISRO.
An advanced version of I-GHIS was realized with six cameras shown in Fig 4.4 along with Gagan module; four cameras on horizontal plane and two on vertical.
Technology Transfer Initiative: As a next logical step, to scale up this activity at PAN India level for different applications, a Technology Transfer Proposal has been initiated to transfer the technology to potential industries and academia.Fig 4.2 Virtual Tours on Bhuvan
A
Fig 4.3: Panoramic View of Mehrangarh Fort imaged by 8-camera IGHIS
Fig 4.4 : Advanced 6-camera I-GHIS with 4 cameras in horizontal plane and 2-cameras in vertical plane
Fig 4.5: 3D visualization of Aarthi at Daswamedh Ghat, Varanasi generated from 6-camera I-GHIS

ww
w.n
rsc.
gov.
in
p i x e l 2 p e o p l e
7
help to bring in seamless information on watershed activities to decision maker’s desk.
Till date 8.1Lakh geo tag points have been uploaded using Drishti App. In total, 6700 satellite images of different time series have been hosted on Srishti portal. Satellite images have been acquired for 2013-14 onwards every year.
Monitoring the Management Interventions: The Technological framework for monitoring the IWMP Watersheds using Srishti and Drishti interfaces was the first of its kind using the Bhuvan platform and is now well established and the DoLR/MoRD/GoI, SLNAs and the District Agencies are using the platforms extensively. Monitoring Watersheds management is being carried out successfully through the established framework. Even a citizen can download the Android app and upload his/her view on the activities done thus enabling total transparency in the system. As part of the effort, State level Remote Sensing Centres are collaborating with NRSC to analyse the project situations and generate reports summarizing the key impacts and changes observed in the study. Towards this, capacity has been built in centers along with support documentation. Till date 130 summary reports have been generated and provided to Ministry.
Impact analysis is being carried out using high resolution color images using online/offline approach with respect to geotag location and information.
5. RS Based Watershed Monitoring under Pradhan Mantri Krishi Sinchayee Yojana
Introduction: Watershed Management is an integrated approach for conserving soil and water so that ecosystem amelioration is achieved in rural landscape, through a participatory approach. Application of geospatial technology has been strongly associated with this paradigm since its inception for planning and success in monitoring the progress through high resolution remote sensing based methods as in Sujala project. Buoyed with this information as well as due to countrywide need for monitoring 8200 projects spread across India, Department of Land Resources (DoLR), Ministry of Rural Development (MoRD) , Govt of India desired NRSC to provide Geo-spatial solution to monitor impact of the watershed management interventions. This is the first initiative in geospatial based governance of national scale. Earlier the initiative was known as Integrated Watershed Management Programme (IWMP), while it is been reframed as Watershed Development Component of Pradhan Mantri Krishi Sinchayee Yojana (PMKSY) which addresses core soil and water conservation domain apart from Mission Water Conservation of MGNREGA, Per Drop More Crop (PDMC) and Har Khet Ko Pani (HKKP).
Web enabled Geospatial Information Portal: Accordingly, NRSC/ ISRO in partnership with DoLR has designed and developed the required technological interventions in this regard. Monitoring and evaluation is being done through a component in Bhuvan Geo-Web portal, called SRISHTI. In addition, Android based smart phone Application named DRISHTI has also been developed for geo tagged photography which can capture image along with user updated information and send to Web GIS server. While Srishti corresponds to the landscape level view one gets by satellite imaging presented as greened up expanse, Drishti supports through geo-tagged vision uploading field reality.
Srishti hosts range of IWMP related GIS database categories in addition to the annual high resolution images in 2.5 m color resolution. Functionaries at state level (called SLNA, State Level Nodal Agencies) and below (called WCDC/PIA, Watershed cell cum Data Centre or Project Implementing Agency) can upload various types of information on watershed projects and related biophysical aspects, for a wider access, display and updation across chain of the organization. Drishti app available as download from Bhuvan uses global positioning system signals of smart phone and geo tags the captured photograph. Ancillary information on each element monitored can be updated using a standard format. This tool can compensate for the gaps in space based imaging and
Fig 5.1. Bhuvan interface depicting geotag details of an asset created under IWMP programme
Fig 5.2. Dug Out Ponds under NRM in IWMP Kurnool 2009-10 Project clearly observed using Bhuvan High
Resolution Image Sequence
p i x e l 2 p e o p l ew
ww
.nrs
c.go
v.in
8
p i x e l 2 p e o p l e
Fig 6.1. Bhuvan interface depicting geotag details of an asset created under IWMP programme
Radar Imaging Satellite-1 (RISAT-1), C-band SAR launched on 26 April 2012, is the first Indian Microwave remote sensing satellite catering to civilian land applications associated with agriculture, forestry and disaster management. This satellite was serving the national and international community for various applications. Different levels of products (Level-0 RAW, Level-1 SLC [Single look complex], Level-1 ground range and Level-2 terrain corrected geo referenced) are being supplied to users from the archived data based on their applications.
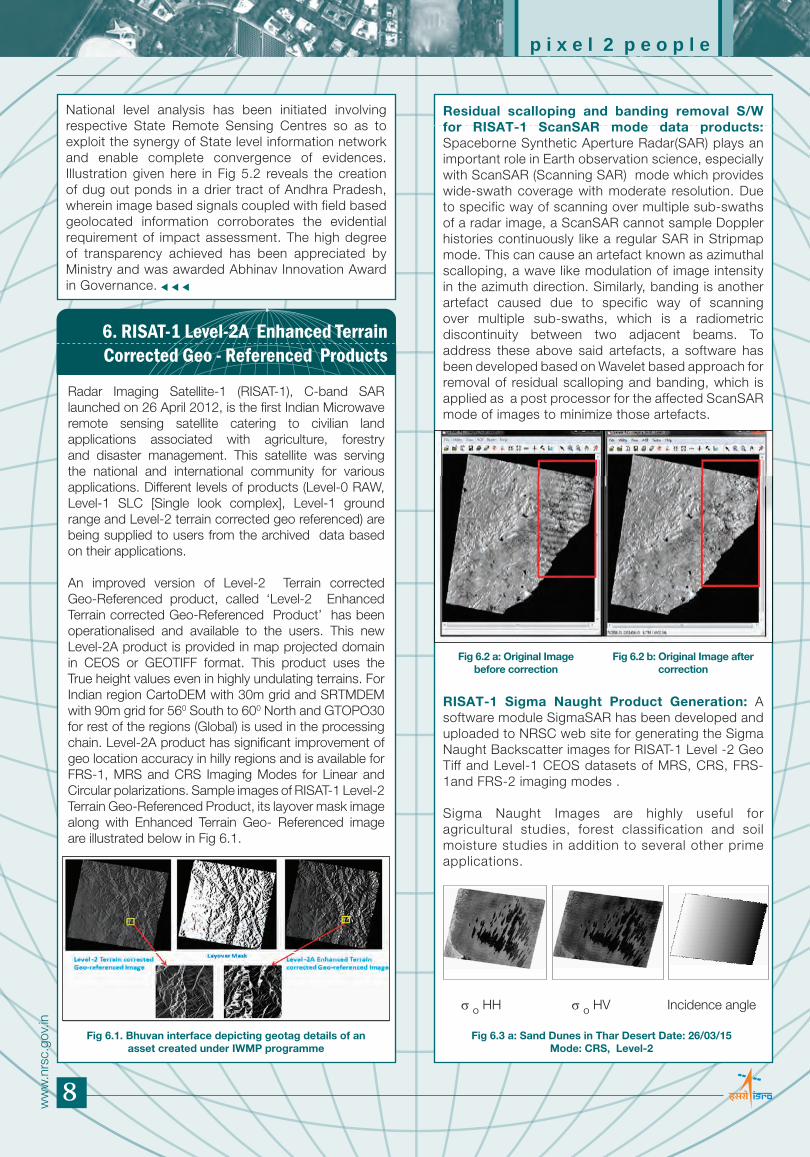
An improved version of Level-2 Terrain corrected Geo-Referenced product, called ‘Level-2 Enhanced Terrain corrected Geo-Referenced Product’ has been operationalised and available to the users. This new Level-2A product is provided in map projected domain in CEOS or GEOTIFF format. This product uses the True height values even in highly undulating terrains. For Indian region CartoDEM with 30m grid and SRTMDEM with 90m grid for 560 South to 600 North and GTOPO30 for rest of the regions (Global) is used in the processing chain. Level-2A product has significant improvement of geo location accuracy in hilly regions and is available for FRS-1, MRS and CRS Imaging Modes for Linear and Circular polarizations. Sample images of RISAT-1 Level-2 Terrain Geo-Referenced Product, its layover mask image along with Enhanced Terrain Geo- Referenced image are illustrated below in Fig 6.1.
Residual scalloping and banding removal S/W for RISAT-1 ScanSAR mode data products: Spaceborne Synthetic Aperture Radar(SAR) plays an important role in Earth observation science, especially with ScanSAR (Scanning SAR) mode which provides wide-swath coverage with moderate resolution. Due to specific way of scanning over multiple sub-swaths of a radar image, a ScanSAR cannot sample Doppler histories continuously like a regular SAR in Stripmap mode. This can cause an artefact known as azimuthal scalloping, a wave like modulation of image intensity in the azimuth direction. Similarly, banding is another artefact caused due to specific way of scanning over multiple sub-swaths, which is a radiometric discontinuity between two adjacent beams. To address these above said artefacts, a software has been developed based on Wavelet based approach for removal of residual scalloping and banding, which is applied as a post processor for the affected ScanSAR mode of images to minimize those artefacts.
RISAT-1 Sigma Naught Product Generation: A software module SigmaSAR has been developed and uploaded to NRSC web site for generating the Sigma Naught Backscatter images for RISAT-1 Level -2 Geo Tiff and Level-1 CEOS datasets of MRS, CRS, FRS-1and FRS-2 imaging modes .
Sigma Naught Images are highly useful for agricultural studies, forest classification and soil moisture studies in addition to several other prime applications.
s O HH s O HV Incidence angle
6. RISAT-1 Level-2A Enhanced Terrain Corrected Geo - Referenced Products
National level analysis has been initiated involving respective State Remote Sensing Centres so as to exploit the synergy of State level information network and enable complete convergence of evidences. Illustration given here in Fig 5.2 reveals the creation of dug out ponds in a drier tract of Andhra Pradesh, wherein image based signals coupled with field based geolocated information corroborates the evidential requirement of impact assessment. The high degree of transparency achieved has been appreciated by Ministry and was awarded Abhinav Innovation Award in Governance.
Fig 6.2 a: Original Image before correction
Fig 6.2 b: Original Image after correction
Fig 6.3 a: Sand Dunes in Thar Desert Date: 26/03/15Mode: CRS, Level-2

ww
w.n
rsc.
gov.
in
p i x e l 2 p e o p l e
9
1.6m resolution MX data ratings: NIIRS (B1/B2/B3/B4): 4.24 / 4.34/4.28/6.49
NIIRS 1 Criteria Distinguish between major land use classes (e.g., urban, agricultural, forest, water, barren). Detect a medium-sized port facility. Distinguish between runways and taxiways at a large airfield. Identify large area drainage patterns by type (e.g., dendritic, trellis, radial).NIIRS 2 Criteria Identify large (i.e., greater than 160 acre) center-pivot irrigated fields during the growing season. Detect large buildings (e.g., hospitals, factories). Identify road patterns, like clover leafs, on major highway systems. Detect ice-breaker tracks. Detect the wake from a large (e.g., greater than 300’) ship.NIIRS 3 Criteria Detect large area (i.e., larger than 160 acres) contour plowing. Detect individual houses in residential neighborhoods. Detect trains or strings of standard rolling stock on railroad tracks (not individual cars).NIIRS 4 Criteria Identify farm buildings as barns, silos, or residences. Count unoccupied railroad tracks along right-of-way or in a railroad yard. Detect basketball court, tennis court, volleyball court in urban areas.
Fig 7.1: Satellite Images of different complexities
7. Image Rating Parameter for High Resolution Sensor Data
The National Imagery Interpretability Rating Scale (NIIRS) is a subjective scale used for rating the quality of imagery acquired from various types of imaging systems. It defines different levels of image quality/interpretability based on the types of tasks an analyst can perform. The idea is that imagery analysts should be able to perform more demanding interpretation tasks as the quality of the imagery increases. The NIIRS consists of 10 levels, from 0 (worst quality) to 9 (best quality). As different types of imagery support different types of interpretation tasks, individual NIIRS has been developed for four major imaging types: Visible, radar, infra red and multispectral. NIIRS rating also varies based on the information content complexity.
NIIRS factor is very important for high resolution data to understand the QA/data applicability aspects. With the available options for data products, globally, to users for their applications, it is very essential to estimate this parameter for rating IRS images to make users prefer IRS data over other options.
A method was developed with the available open source to estimate ratings for high resolution IRS optical data products. Table-7.1 describes the image ratings obtained for various complexities/modes of PAN data. This method is also used for estimating NIIRS ratings for multispectral optical data of 1.6m resolution.
Table-7.1: NIIRS rating for various complexities of images for 0.6m PAN Data.
s O HH HH s O HH Incidence angle
Fig 6.3 b: Haridwar & Surrounding area,
Date : 02/11/2015, Mode: FRS-1, Level-1-MLG
Var ious studies, software and model developed for RISAT-1 wi l l be very useful for future RISAT missions also .
Sample/ NIIRS Rating
1-Mode-12-Mode-23-Mode-34-Mode-45-Mode-56-Mode-6
4.7074.1764.733.3933.7933.851
Cartosat - 2S Image of Kishangarh, Rajasthan

p i x e l 2 p e o p l ew
ww
.nrs
c.go
v.in
10
p i x e l 2 p e o p l e
8. Geospatial Technology Applications In Crop Insurance
Innovations and investments in agriculture sector are possible only when insurance mechanism exists. Crop insurance has become an indispensable risk reducing instrument in agriculture which is exposed to multiple hazards leading to frequent crop losses. Yield based crop insurance follows area-yield approach, in which, the indemnity is based on the yield loss experienced at the insurance unit level and not at the individual farmer level. Similarly, weather based insurance follows area-weather approach. These index based insurance schemes either weather or yield are faced with serious problems of basis risk and non-availability of historical data, making the scalability and sustainability of agricultural insurance in the long run, a big challenge. Therefore, the need for developing innovative crop insurance products has been widely recognized by both developed and developing nations in recent years.
Pradhan Mantri Fasal Beema Yojana (PMFBY), being implemented in most part of the country, from kharif 2016, is a revolutionary step towards improving agriculture insurance in the country. Small field sizes, high variability in yields and frequent weather aberrations have made technology application inevitable for implementing crop insurance. PMFBY guidelines (available at http://agri-insurance.gov.in/pmfby.aspx) have indicated use of
NIIRS 4 Criteria Identify individual tracks, rail pairs, control towers, switching points in rail yards. Detect jeep trails through grassland.NIIRS 5 Criteria Identify Christmas tree plantations. Identify individual rail cars by type (e.g., gondola, flat, box) and locomotives by type (e.g., steam, diesel). Detect open bay doors of vehicle storage buildings.NIIRS 6 Criteria Detect narcotics intercropping based on texture. Distinguish between row (e.g., corn, soybean) crops and small grain (e.g., wheat, oats) crops. Identify automobiles as sedans or station wagons.NIIRS 7 Criteria Identify individual mature cotton plants in a known cotton field. Identify individual railroad ties.NIIRS 8 Criteria Count individual baby pigs. Identify a USGS benchmark set in a paved surface. Identify grill detailing and/or the license plate on a passenger/truck type vehicleNIIRS 9 Criteria Identify individual grain heads on small grain (e.g., wheat, oats, barley). Identify individual barbs on a barbed wire fence. Detect individual spikes in railroad ties.
technologies in crop insurance as mandatory. Remote Sensing, Mobile, Geospatial tools and drones have been identified to be potential technologies to support crop insurance system in the country.
NRSC took several initiatives in recent years to demonstrate the technology capabilities to meet the information requirements of crop insurance. These activities include (a) Pilot studies in different districts using satellite data, (b) Development and implementation of Mobile technology for field data collection for improving crop cutting experiments, yield estimation and crop loss assessment, (c) Training to the field level personnel of State Departments on mobile based field data collection, (d) Collaborative studies with Agricultural Insurance Company of India Limited to improve crop insurance with remote sensing and GIS technologies, (e) Awareness-cum-training to the stake holders on technology utilisation, (f) Development of a Decision Support System for crop insurance for Odisha state and (g) Conducting special studies as and when needed by the States.
Technology interventions can take place in the following segments of crop insurance value chain; (1) Insurance rate computation and premium discovery using drought/flood hazard and vulnerability maps, (2) Cadastral level analysis for monitoring and expansion of insurance coverage and timely settlement of claims, (3) Prevented/failed sowing risk assessment using satellite and weather indices, (4) Crop mapping and area discrepancy analysis using moderate resolution satellite data, (5) Mid-season adversaries based on satellite indices and field information, (6) Crop loss due to natural calamities using satellite based flood and drought assessments, (7) Localized risk with weather data and Mobile collected field data, (8) Crop Cutting Experiments for crop yield estimation with mobile based field data and satellite derived indices.
The Officers/Analysts of Crop Insurance Companies were given awareness-cum-training through a workshop on utilization of the technology in crop insurance. Subsequently, NRSC has been supporting the companies in decision making for crop insurance using Geo-spatial technologies.
Measurement of crop yield in the insurance unit for indemnity fixation is a real challenge. Crop yield estimation in the insurance units is done by conducting Crop Cutting Experiments (CCE) in the field-plots selected through a sampling scheme. The capabilities of the currently available satellite data sets, weather data sets, geospatial tools and techniques suggest the scope for improving the indemnity assessment methodologies.
High temporal resolution multispectral satellite data like Planetscope has been utilized for deriving temporal NDVI profiles of wheat crop which can act as proxy to the crop vigour and yield. Local weather conditions, crop management practices, soil, variety/hybrid, water

ww
w.n
rsc.
gov.
in
p i x e l 2 p e o p l e
11
related parameters, etc. are important yield determinants but their effect is not completely manifested in any single index. Therefore, a multi-parameter approach involving spectral indices, weather data and local crop growing conditions need to be explored to build a yield proxy index in the insurance units. Research on developing crop yield proxies for insurance purpose is in progress at NRSC. A composite yield index for jowar and cotton crops was developed using rainfall, rainy days, soil, irrigation parameters and satellite based crop condition. While the initial observations are encouraging, the index is being validated and standardised for operational use. Once successful, these kinds of indices would improve the crop yield assessment in the insurance units with objectivity.
Crop Insurance Decision Support System (CIDSS) is a web-enabled spatial Decision Support System with multi-source data, information products and services to address different components in the crop insurance value-chain, being developed by NRSC for the Department of Agriculture, Government of Odisha. It is a single window system for all technology interventions in crop insurance and immensely benefits the State Government for improving the crop insurance mechanism. Integration of different satellite based products and other datasets, mobile collected field data and Crop Cutting Experiments data using automated or semi-automated procedures and development of decision rules for visualisations and computations to support the crop insurance requirements is the main thrust in the proposed system. It is also envisaged to provide training to the State for effective use of Decision Support System on operational basis. It is a major initiative to facilitate the states with the use of technologies in crop insurance.
Three of the DSS modules namely (a) Agriculture outlook, (b) Crop performance and (3) CCE verification have been demonstrated online through Bhuvan portal to the Department of Agriculture, Government of Odisha.
Agriculture outlook module - Generation of maps, •statistics and reports related to weather conditions, satellite derived crop conditions (June to end of season) on fortnightly/monthly basis, decision tools, crop-generic, information products on drought and floods.
Crop performance module - Crop specific, generation •of maps, statistics and reports related to weather conditions; satellite derived crop condition etc. indicating the end of the season crop performance; enables identification of villages under different categories of crop performance, decision tools and report generation
CCE verification module - Evidence based verification •of CCE data quality, village level verification, decision tools and report generation
Geospatial technology is going to be a game changer in the crop insurance and benefits all stake holders. Currently, technology utilisation is at low scale in the crop insurance. Many insurance companies and states have started the adoption of remote sensing and drones data along with Mobile app collected field observations. In the years to come, technology utilisation in crop insurance is expected to grow exponentially. A large number of Organisations are associated with data collection in crop insurance leading to big pool of multi-source data. For example, lakhs of crop yield data in geo-coded form have been collected by State Agriculture Departments under crop insurance. Spatial analytics, data mining, data engineering, evidence based tools etc. could churn out useful information products to make the crop insurance mechanism more robust and transparent. There is scope for developing new business models with the support of technologies to boost the agriculture insurance in the country.
Fig 8.1: Wheat yield variation captured by temporal NDVI profile derived from high spatial & temporal resolution Planetscope data for the 10 CCE Plots in Baghera Village in Ujjain district,
rabi 2016-17.
Fig 8.2: CIDSS dashboard and CCE verification module of CIDSS

p i x e l 2 p e o p l ew
ww
.nrs
c.go
v.in
12
p i x e l 2 p e o p l e
12
ww
w.n
rsc.
gov.
in
11 ww
w.n
rsc.
gov.
in
ISSN 0974 9802
P2P Editorial BoardK. Mruthyunjaya Reddy C. S. PadmavathiThara NairD. Giri BabuJ. Narendran
Abhishek ChakraborthyT. R. KiranchandHansraj MeenaP. MaheshJaya SaxenaK. V. Raghavendra
CS. MurthyE. Vijayasekhar Reddy
Printed at MPF, PPEG, NRSC
FeedbackPlease post your comments to [email protected]
ContributorsD. Giri BabuB. Santhi SreeJ. NarendranG.S. PujarE.V.S. Sita Kumari
National Remote Sensing CentreIndian Space Research OrganisationDept. of Space, Govt of IndiaBalanagar, Hyderabad - 500 037.www.nrsc.gov.in
Cartosat - 2S(D) Acquired image of Raipur, Nellore Dist. Andhra Pradesh.