
National Women’s Annual Clinical Report 2010 Prof J Quinlivan.
26
National Women’s Annual Clinical Report 2010 Prof J Quinlivan
-
Upload
louisa-wheeler -
Category
Documents
-
view
214 -
download
0
Transcript of National Women’s Annual Clinical Report 2010 Prof J Quinlivan.

National Women’s Annual Clinical Report 2010
Prof J Quinlivan

Acknowledgements• Kirsty Walsh: Acting General
Manager, Clinical Services Women’s health
• Carolyn Whiteman: Service Manager Newborn Service Paediatric Intensive Care, Paediatrics and Congenital Cardiac Service
• Malcolm Battin: Clinical Director Newborn Service
• Jenny McDougall: Clinical Director Obstetrics
• Mahesh Harilall: Clinical Director Gynaecology
• Pam Hewlett: Acting Clinical Leader Midwifery
• Lesley McCowan: Head of Department of Obstetrics and Gynaecology
Marjet Pot: Project Co-ordinatorLynn Sadler: EpidemiologistAndrea Hickman: Data management/Analyst

Overview
• 7709 mothers delivered 7866 babies.
• No major changes in pattern of delivery modality since 2002.

Some excellent results
• General– Breast feeding– Quit campaign
• Low complication rates in – General Gynaecology– Gynaecology Oncology
• Obstetrics– HIE (below benchmark)– VBAC (above benchmark)

Breast feeding
• Baby friendly hospital initiative• 81.6% of mothers achieved ‘exclusive
breastfeeding’ on discharge from NW.• WHA Benchmark 77%

Smoking and better help for smokers to quit• New program “Better Help for Smokers
to Quit.”• Emphasis on documentation
of the ABC of smoking cessation.• Referrals to ADHB
Smokefree Pregnancy Service.

Summary statistics maternity
Indicator WHA NW 2010 N=7709
NW Public 2010N=2329
Preterm birth 11.7-11.9
10.1 17.1
HIE (Gd 2/3) 0.10 0.06 0.08
CS 28-29.6 32.3 33.3

Summary statistics 2
Indicator WHA NW 2010 N=7709
NW Public 2010N=2329
VBAC 7.9-9.1 10.1 10.8
Maternal age 23.4-23.8
31.1 25.1
Episiotomy 17.8-18.6
24.0 14.9
3rd/4th degree tears
2.8-3.5 2.3 2.1

Summary statistics 3
Indicator WHA NW 2010 N=7709
NW Public 2010N=2329
PPH 1000-1500 Vaginal births
1.9-2.4 3.1 4
PPH >1500 Vaginal births
1.4-1.7 2.7 4
PPH 500-1500 CS
49.4 67 74.6
TransfusionAll births
1.6-2.1 2.5 3.8

Closing the audit gap
1. Maternal age2. Perineal care3. Post partum haemorrhage4. Induction of labour for post dates5. Urogynaecology mesh

Maternal age at NW
• Older population of women giving birth• Big rise in women aged 35-39years• Corresponding fall in women aged 21-
25 years
21-25 years 35-40 years
1991/1992 22-23% 9-10%
2009/2010 12-13% 23-24%
Differing health concerns• Older pregnant women are more
likely to have:– tertiary education, – higher family income.
• The main obstetric worries centre on:– Miscarriage, – Structural and genetic abnormalities,– Physical demands of caring for a new
baby,– Post partum recovery.
» Loke AY, Poon CF. J Clin Nurs 2011; 20: 1141-50

Maternal Age and Medical Risk
• Older women report less satisfaction with pregnancy risk counselling.
• Counselling for risk is complex• Genetic disease and miscarriage may
be identified early• Dissatisfaction arises from unexpected
complications arising from the diagnosis of an underlying disease such as diabetes and hypertension.
– O ’Reilly-Green C, Cohen WR. Obst Gynecol Clinics North Am 1993; 20:313-31.
Worries about stillbirth
• Systematic review of 31 retrospective cohort and 6 case control studies found that greater maternal age was associated with increased risk of still birth.
• Relative risks vary from 1.20 to 4.53.» Huang L et al. CMAJ 2008; 178: 165-172.

Adverse neonatal outcome
• Retrospective study comparing outcomes of women aged <35, 35-40, and >40.
• 45,033 nulliparous women, singleton pregnancy.
• Significant linear association documented between advanced maternal age and:– IUGR, LBW, congenital malformations,
perinatal mortality.– Most of the risk driven by gestational age at
delivery, presence of IUGR and malformations.» Salem YS et al. Arch Gynecol Obstet 2011; 282: 755-9

Perinatal death from intrapartum anoxia at term• Retrospective cohort study of 1,043,002
women with singleton term cephalic infants.• Compared with women aged 25-34 years,
older women had a increased risk of delivery related perinatal death at term– OR 2.20 95%CI 1.42-3.40
• Excess risk explained by intrapartum anoxia– Primip OR 5.34 95%CI 2.34-12.20– Multip 2.14 95%CI 0.99-4.60
» Pasupathy D et al J Epid Com Med 2011; 65: 241-5.
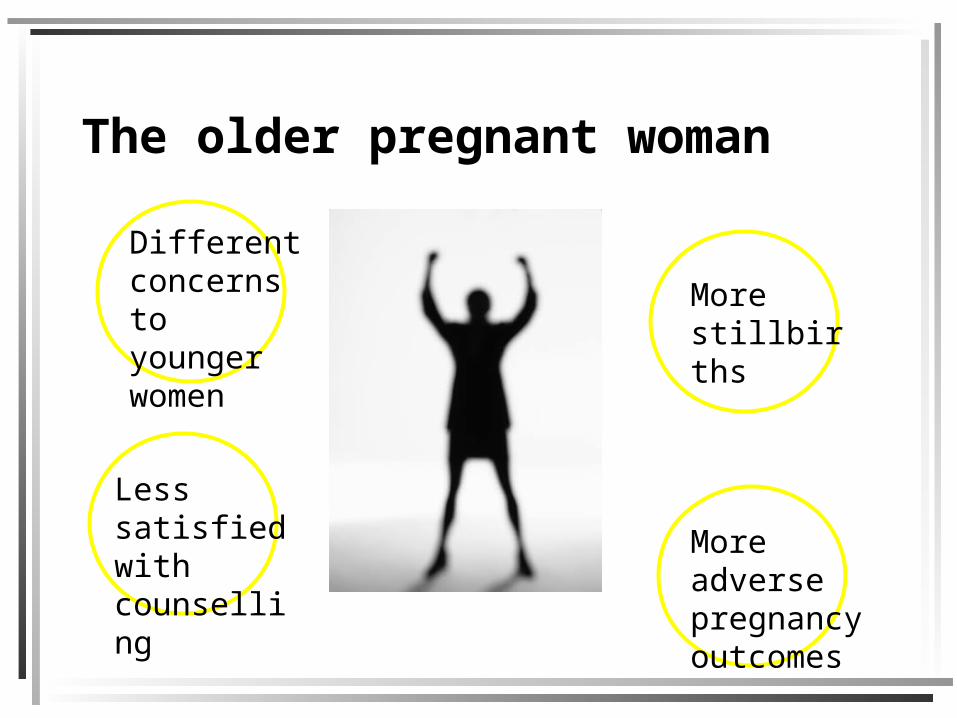
The older pregnant woman
Different concerns to younger women
Less satisfied with counselling
More stillbirths
More adverse pregnancy outcomes

Given the progressive change in demographics, how do you ensure you deliver a service that meets the needs of the older demographic?
35-40 years
1991/1992 9-10%
2009/2010 23-24%
2030 ?? 40% ??
Perineal Care at NW Why is it a case of chalk & cheese?
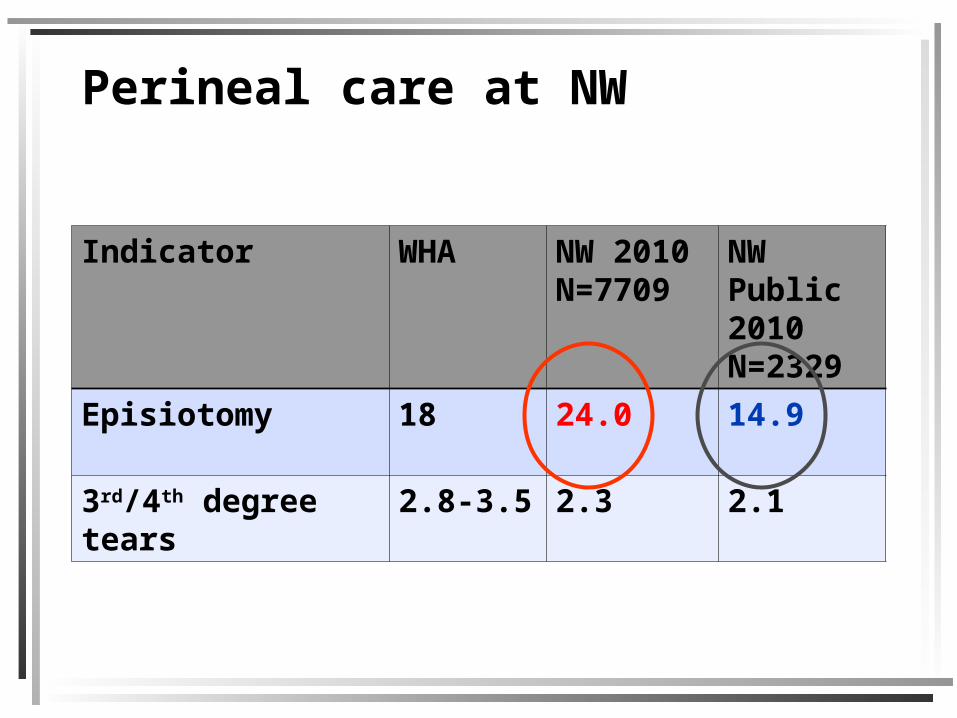
Perineal care at NW
Indicator WHA NW 2010 N=7709
NW Public 2010N=2329
Episiotomy 18 24.0 14.9
3rd/4th degree tears
2.8-3.5 2.3 2.1

Episiotomy rates by LMC at birth
Indicator Total Episiotomy
3rd/4th degree tear
Independent midwife
2737 24.6% 2.6%
Private Obstetrician
862 37.7% 2.0%
NW Community 1060 15.2% 2.5%
BM: Episiotomy = 18%

Perineal care • >85% of women having a
vaginal birth experience perineal trauma.
• 1/3 of women require suturing following vaginal delivery.
• Perineal trauma may cause long term problems– 10% long term pain– 25% dyspareunia or urinary
problems– 10% fecal incontinence
» Best Practice Perineal Care Key points
Outcomes from the new NW Perineal Tear Clinic
• Commenced October 2010• ACC funded• Aim to review all 3rd/4th degree tears and
complicated perineal injuries at 6/52 and 4/12.
• Clinic saw 72 women from October to end of 2010
• Where indicated, women were referred to a psychologist or rectal surgeon.

Best practice advice
• Restricting use of episiotomy reduces the risk of posterior perineal trauma
• Episiotomies should only be used when there are clear maternal or fetal indications. This policy increases the likelihood of an intact perineum and does not increase the risk of 3rd degree tears
– Best Practice Perineal Care Key points

Best practice advice
• Midline incisions may be more likely to result in severe tears.
• Vaccum delivery reduces the rate of severe perineal trauma compared to forceps delivery but increases the risk of cephalhaematoma and retinal haemorrhage in the newborn.
• Continuous support during labour reduces the rate of assisted birth and therefore of perineal trauma.
– Best Practice Perineal Care Key points

Best Practice and Episiotomy
Must be able to identify the INDICATION.Episiotomy
Indication (circle if yes)
NoYes
Delay 2nd stageFetal distress CTGFetal distress pH/LactateAssisted vaginal deliveryPatient tearing posteriorlyOther _______________

![Pauline Hawthorne (nee Quinlivan) 1980s Pupil Mrs Garvin 40 ...532590]p5.pdfPauline Hawthorne (nee Quinlivan) 1980s Pupil By Chloe Dinning and Laila Millar I remember many teachers](https://static.fdocuments.net/doc/165x107/604e77f543166225e31d8b40/pauline-hawthorne-nee-quinlivan-1980s-pupil-mrs-garvin-40-532590p5pdf-pauline.jpg)


