National Urgent Care Chart Survey - Practice Management JUCM Urgent Care Chart Research.pdf ·...
26
National Urgent Care Chart Survey June 2010
Transcript of National Urgent Care Chart Survey - Practice Management JUCM Urgent Care Chart Research.pdf ·...

National Urgent Care Chart Survey
June 2010

Scope of the Survey
This survey was designed to identify:• Demographics of patients presenting to urgent care
centers
• What their presenting complaints were
• What diagnoses were most common
• What prescriptions were actually written
• What OTCs were recommended
• What procedures and tests were performed

Design & Methodology
Survey Design: The survey methodology and data abstraction form were designed by researcher Robin M. Weinick, PhD. Dr Weinick is an Assistant Professor at Harvard Medical School and a Senior Scientist at the Institute for Health Policy, Massachusetts General Hospital.
Methodology:
• 1,589blinded patient charts• Drawn on an nth basis from a database of over 1.8 million patient
charts as accessed through a large, billing processing company• Original database spanned over 250 different urgent care clinics,
located in 37 different states• Randomized charts drawn from the 12 month period January –
December 2009. For each chart, specific data were abstracted andentered into the survey database by a Registered Nurse

Patient Gender
Male43%
Female57%

Patient Age Breakout
1814
25
33
11
0
10
20
30
40
Infant to
13
14-22 23-35 36-59 60+

New or Established PatientNew or Established PatientNew or Established PatientNew or Established Patient
New43%
Established57%

Percentage of Visits by Month10101010
9999 9999
8888
7777
8888
6666
7777
9999
10101010
8888
7777
0000
1111
2222
3333
4444
5555
6666
7777
8888
9999
10101010
JanuaryFebru
aryMarch
April
May
June
July
August
September
OctoberNovem
ber
Decem
ber
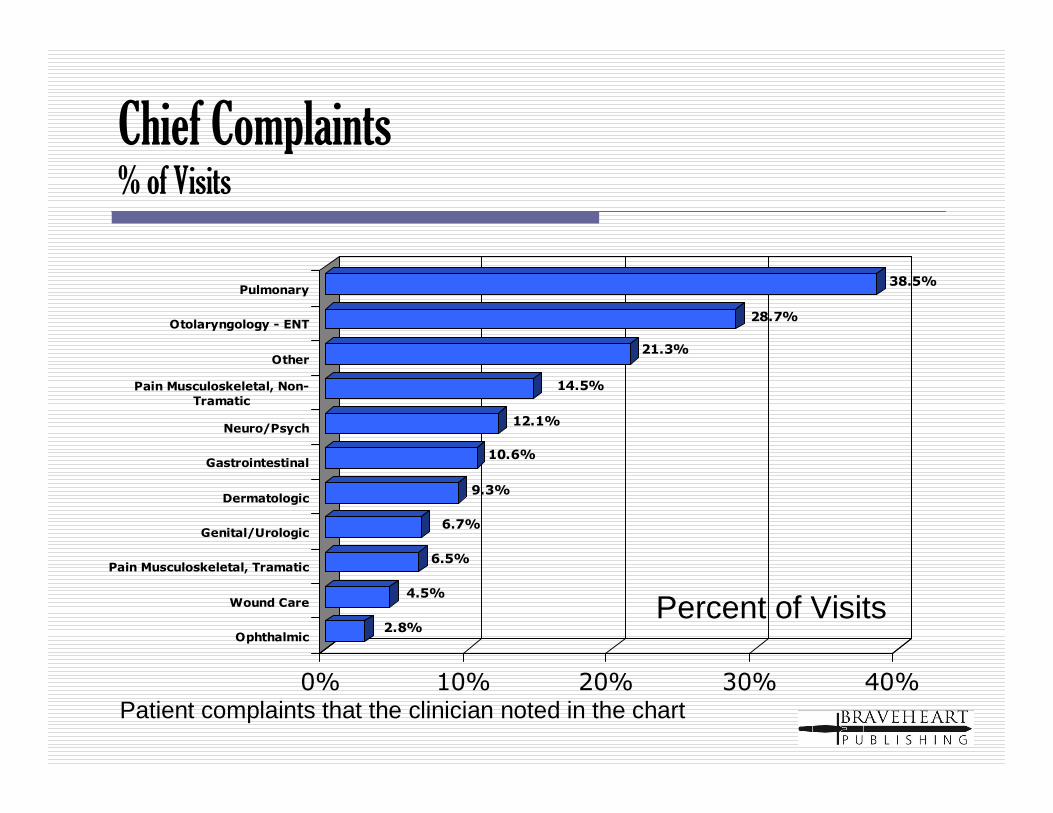
Chief Complaints % of Visits
2.8%
4.5%
6.5%
6.7%
9.3%
10.6%
12.1%
14.5%
21.3%
28.7%
38.5%
0% 10% 20% 30% 40%
Pulmonary
Otolaryngology - ENT
Other
Pain Musculoskeletal, Non-
Tramatic
Neuro/Psych
Gastrointestinal
Dermatologic
Genital/Urologic
Pain Musculoskeletal, Tramatic
Wound Care
Ophthalmic
Patient complaints that the clinician noted in the chart
Percent of Visits

Chief Complaints (Projected Total Volume, 2009)
4.0
6.4
9.2
9.5
13.2
15.1
17.2
20.6
30.2
40.8
54.7
0 10 20 30 40 50 60
Pulmonary
Otolaryngology - ENT
Other
Pain Musculoskeletal, Non-
Tramatic
Neuro/Psych
Gastrointestinal
Dermatologic
Genital/Urologic
Pain Musculoskeletal, Tramatic
Wound Care
Ophthalmic
Projections based on 142 Million patient visits to 9,100 urgent care clinics annually
Millions
Average 1.56 Complaints per Visit
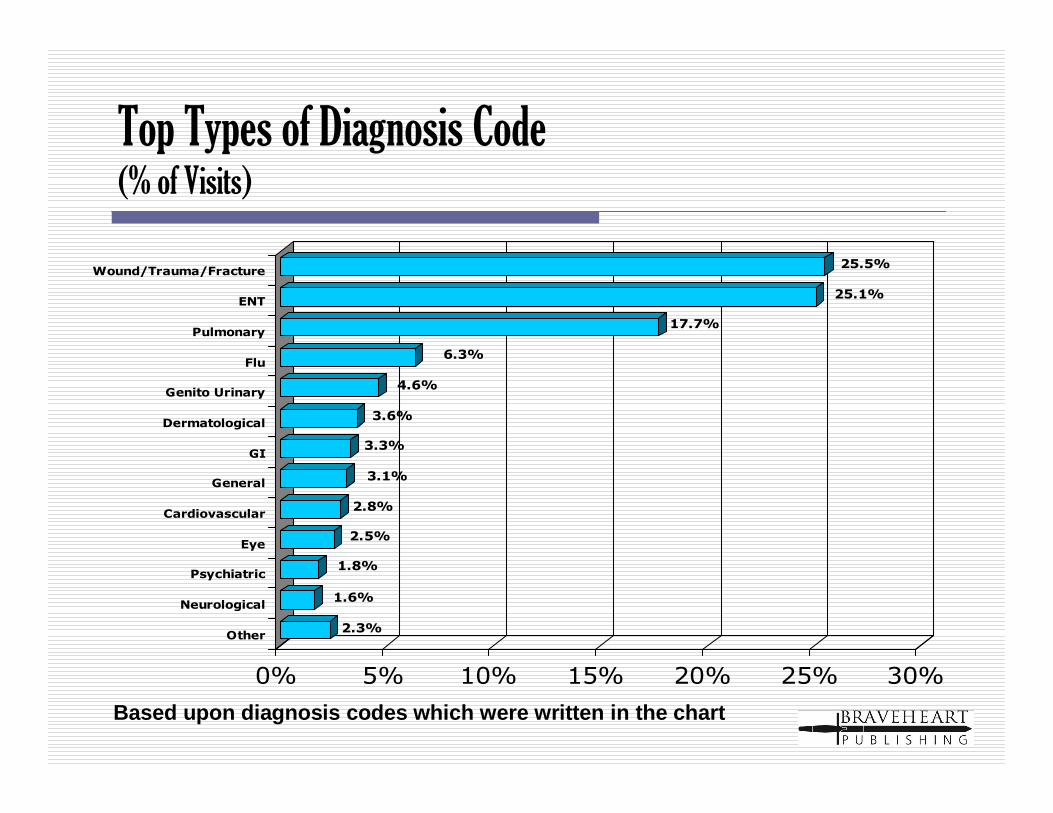
Top Types of Diagnosis Code (% of Visits)
2.3%
1.6%
1.8%
2.5%
2.8%
3.1%
3.3%
3.6%
4.6%
6.3%
17.7%
25.1%
25.5%
0% 5% 10% 15% 20% 25% 30%
Wound/Trauma/Fracture
ENT
Pulmonary
Flu
Genito Urinary
Dermatological
GI
General
Cardiovascular
Eye
Psychiatric
Neurological
Other
Based upon diagnosis codes which were written in the chart

Top Diagnosis Codes - Detail (% of Visits)
1.7%
2.1%
2.2%
2.4%
2.7%
3.2%
3.6%
3.8%
5.4%
6.4%
6.4%
6.5%
6.5%
6.8%
6.9%
0% 1% 2% 3% 4% 5% 6% 7% 8%
Sinusitis
Musculoskeletal Pain
Sprain
Upper Respiratory Infection
Bronchitis
Pharyngitis
Otitis
Wound
Contusion
Gastric Disorder
Cellulitis
Cough
Conjunctivitis
Genito Urinary Disorder
Dermatitis
Based upon actual diagnosis codes written in the chart
Percent of Visits

Top Diagnosis Codes - Detail (% of Visits) continued
1.1%
1.1%
1.2%
1.3%
1.3%
1.4%
1.4%
1.5%
1.5%
1.6%
1.6%
1.6%
1.6%
1.7%
1.7%
0% 1% 2% 3% 4% 5% 6% 7% 8%
Influenza
Strep Throat
Viral Infection
Fever
Psychiatric Disorder
Rhinitis
Abdominal Pain
Fracture
Urinary Tract Infection
Hypertension
Ear Disorder
Other
Skin Disorder
Headache
Cystitis
Based upon actual diagnosis codes written in the chart
Percent of Visits

Top Types of Prescriptions Written (% of Visits)
0.4%
0.5%
0.6%
0.6%
0.9%
1.5%
2.0%
2.1%
3.3%
3.3%
4.1%
6.7%
9.4%
9.9%
10.3%
12.1%
53.8%
0% 10% 20% 30% 40% 50% 60%
Antibiotics
Non-Narcotic Analgesics
Allergy/Flu
Narcotic Analgesics
Corticosteroids
Cough
Asthma
Gastrointestinal
Neuro/Psych
Cardiovascular
Ophthalmologic
Gynecological
Dermatological
Antivirals
Other
Antifungals
Otic
Based upon prescriptions noted in the chart
Percent of Visits

Top Types of Prescriptions Written (Projected Total Volume, 2009)
0.6
0.7
0.9
0.9
1.3
2.1
2.8
3.0
4.6
4.6
5.8
9.5
13.4
14.0
14.6
17.2
76.4
0 10 20 30 40 50 60 70 80
Antibiotics
Non-Narcotic Analgesics
Allergy/Flu
Narcotic Analgesics
Corticosteroids
Cough
Asthma
Gastrointestinal
Neuro/Psych
Cardiovascular
Ophthalmologic
Gynecological
Dermatological
Antivirals
Other
Antifungals
Otic
Projections based on 142 Million patient visits to ~9,100 urgent care clinics annually
Millions of Prescriptions
Average 1.22 Prescriptions per Visit

Top Chemical Entities Prescribed, 1 – 20 (Brands and Generics rolled together)
Projections based on 142 Million patient visits to ~9,100 urgent care clinics annually
Rank Top Branded Name Chemical Entity Percent of Visits Projected Rx's
1 ZITHROMAX azithromycin 14.3% 20,375,079
2 AUGMENTIN amoxicillin 12.3% 17,515,419
3 VICODIN acetaminophen and hydrocodone 6.0% 8,489,616
4 BACTRIM sulfamethoxazole trimethoprim 4.6% 6,523,600
5 PREDNISONE prednisone 4.5% 6,434,235
6 PROAIR HFA albuterol 3.8% 5,451,227
7 CEPHALEXIN cephalexin 3.5% 5,004,405
8 MOTRIN ibuprofen 3.2% 4,557,583
9 CIPRO ciprofloxacin 3.0% 4,200,126
10 TUSSICAPS chloropheniramine and hydrocodone 2.7% 3,842,668
11 LEVAQUIN levofloxacin 2.4% 3,395,846
12 NAPROSYN naporoxen 2.4% 3,395,846
13 TAMIFLU oseltamivir 2.3% 3,306,482
14 OMNICEF cefdinir 2.2% 3,127,753
15 FLEXERIL cyclobenzaprine 2.2% 3,127,753
16 MEDROL methylprednisone 2.2% 3,127,753
17 DOXYCYCLINE Doxycycline 2.0% 2,770,296
18 BENADRYL diphenhydramine 1.7% 2,412,838
19 FLONASE Fluticasone propionate 1.6% 2,234,110
20 PHENERGAN promethazine 1.6% 2,234,110

Projections based on 142 Million patient visits to ~9,100 urgent care clinics annually
Rank Top Branded Name Chemical Entity Percent of Visits Projected Rx's
21 BIAXIN clarithromycin 1.4% 2,055,381
22 ULTRAM tramadol 1.4% 2,055,381
23 TESSALON benzonatate 1.4% 1,966,016
24 PHENERGAN W/ CODEINE promethazine and codeine 1.4% 1,966,016
25 HYCODAN hydrocodone 1.3% 1,876,652
26 ASMANEX TWISTHALER mometasone 1.3% 1,876,652
27 AVELOX moxifloxacin 1.3% 1,787,288
28 DIFLUCAN fluconazole 0.9% 1,340,466
29 BACTROBAN mupirocin 0.9% 1,340,466
30 ALLEGRA fexofenadine 0.9% 1,251,101
31 CORTISPORIN neomycin polymyxin B hydrocortisone 0.8% 1,161,737
32 ERYTHROMYCIN erythromycin 0.8% 1,072,373
33 PERCOCET oxycodone and acetominophen 0.8% 1,072,373
34 HYDROCHLOROTHIAZIDE hydrochlorothiazide 0.7% 983,008
35 CEFTIN cefuroxime 0.6% 893,644
36 CLEOCIN clindamycin 0.6% 893,644
37 ATARAX hydroxyzine hydrochloride 0.6% 893,644
38 FLAGYL metronidazole 0.6% 893,644
39 SINGULAIR montelukast 0.6% 893,644
40 ZOFRAN odansetron 0.6% 893,644
Top Chemical Entities Prescribed, 21 - 40(Brands and Generics rolled together)

Top Categories of OTC Recommendations (% of Visits)
0.4%
0.4%
0.4%
0.7%
0.8%
1.3%
2.1%
2.3%
2.9%
5.1%
6.6%
6.7%
11.6%
12.8%
14.7%
0% 5% 10% 15%
Fluids
NSAID
Acetaminophen
Heat/Ice Packs
Allergy/Antihistamines
Cough
Other
Cold/Flu
Gargle/Spray for Throat
Wound Care
Antibiotic Ointment
Gastro
Derm Products
Ear Products
Nasal Spray
Based upon OTC recommendations noted in the chart
Percent of Visits

Top Categories of OTC Recommendations(Projected Total Volume, 2009)
0.8
1.2
1.3
1.3
1.9
2.1
2.1
2.9
3.2
5.2
6.4
7.8
9.6
15.4
20.9
0 5 10 15 20 25
Fluids
Tylenol
Motrin
Heat/Ice Packs
Mucinex All Forms
Ibuprofen
Robitussin All Forms
Advil
Claritin All Forms
Gargle
Zyrtec
Rondec DM
Sudefed
Pyridium
Bacitracin
Projections based on 142 Million patient visits to ~9,100 urgent care clinics annually
Millions of Recommendations
Average 0.69 OTC Recommendations per Visit

Top OTC Brand Recommendations Detail(Projected Total Volume, 2009)
OTC Name Projected Recommendations1 Fluids 20,911,2652 Tylenol 15,370,6733 Motrin 9,561,9894 Heat/ice packs 7,774,7015 Mucinex All Forms 6,434,2356 Ibuprofen 5,183,1347 Robitussin All Forms 3,217,1188 Advil 2,859,6609 Claritin All Forms 2,055,381
10 Zyrtec 1,876,65211 Rondec DM 1,340,46612 Sudafed 1,340,46613 pyridium 1,161,73714 Bacitracin 804,27915 Afrin 536,18616 Aleve 536,18617 Chloraseptic 446,82218 Auralgan 268,09319 Neosporin 268,09320 Cortizone 10 178,72921 Debrox 178,729
Projections based on 142 Million patient visits to ~9,100 urgent care clinics annually

Top Procedures (% of Visits)
2.2%
1.2%
3.0%
3.5%
3.9%
7.6%
10.5%
11.2%
14.5%
18.8%
23.2%
32.3%
0% 5% 10% 15% 20% 25%
Injection
Rapid Test
Oximetry
X-Ray
Blood Test
Urinalysis
Splints/Bandages/Casts
Vaccine
Inhalation Tx
Wound Repair
Foreign Body Removal
Other
Based upon procedure codes which were written in the chart
Percent of Visits

Top Procedures(Projected Total Volume, 2009)
3.04
1.70
1.79
4.20
4.92
5.54
10.81
14.92
15.91
20.64
26.63
32.89
45.84
0 10 20 30 40 50
Injection
Rapid Test
Oximetry
X-Ray
Blood Test
Urinalysis
Splints/Bandages/Casts
Vaccine
Inhalation Treatment
Wound Repair
Other
Foreign Body Removal
Other
Projections based on 142 Million patient visits to 9,100 urgent care clinics annually
Millions of Procedures

Top Blood Tests(Projected Total Volume, 2009)
0.09
0.18
0.27
0.54
1.61
2.23
5.00
5.99
0 1 2 3 4 5 6
CBC
Venipuncture (unspecified
test)
CMP
Heterophile Antibodies
Lipid Panel
Basic Metabolic Panel
Hemoglobin (A1C)
Reagent Strip/Blood
Glucose
Projections based on 142 Million patient visits to 9,100 urgent care clinics annually
Millions

Top Lab Tests(Projected Total Volume, 2009)
0.27
0.63
0.71
0.80
14.92
15.10
0 2 4 6 8 10 12 14 16
Rapid Strep A
Rapid Flu
Throat Culture
Glucometer
Drug Screen
Detection of Infectious
Agents via DNA
Projections based on 142 Million patient visits to 9,100 urgent care clinics annually
Millions
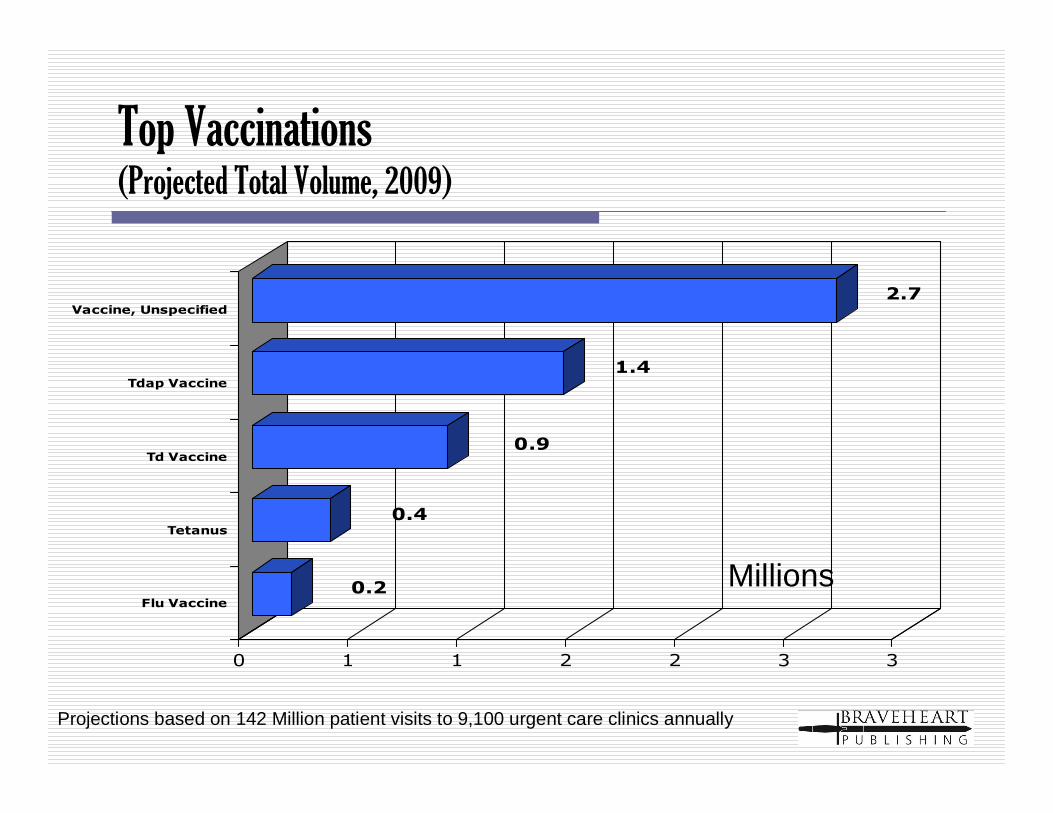
Top Vaccinations(Projected Total Volume, 2009)
0.2
0.4
0.9
1.4
2.7
0 1 1 2 2 3 3
Vaccine, Unspecified
Tdap Vaccine
Td Vaccine
Tetanus
Flu Vaccine
Projections based on 142 Million patient visits to 9,100 urgent care clinics annually
Millions

Disposition of Visits
1%
2%
6%
7%
12%
69%
0% 10% 20% 30% 40% 50% 60% 70%
Follow up Visit PRN
Follow up Visit Scheduled
Refer to Primary Care
Physician
Refer to Specialist
Refer to the ER
Telephone Follow up

The Braveheart Group - Bio
• Peter Murphy– Former Publisher of JAMA and American Medical News –
12 years– Former VP/GM of Advanstar Medical Economics’ Primary
Care Group – 2 years
• Stuart Williams– Former Director of Sales at American Medical Association –
10 years– Former Publisher of Medical Economics Magazine and
Patient Care Magazine – 2 years
41 Years of Combined Medical Publishing Experience
Contact Peter Murphy or Stuart Williams:Peter: 201-847-1934 or [email protected]: 201-529-4004 or [email protected]