National Therapeutic Indicators and Additional … · provide was updated by SIGN/BTS and this...
58
1 National Therapeutic Indicators and Additional Prescribing Measures 2017/18 - Early Release Document
Transcript of National Therapeutic Indicators and Additional … · provide was updated by SIGN/BTS and this...

1
National Therapeutic Indicators and
Additional Prescribing Measures
2017/18 - Early Release Document

2
National Therapeutic Indicators 2017-18
National Therapeutic Indicators (NTIs) and Additional Prescribing Measures (APMs) use prescription
data to provide a measure of prescribing activity in specified therapeutic areas and a comparison
across the GP practices in Scotland, Health Boards within Scotland and GP practices within these
Health Boards. These are then made available to Health Boards, Health and Social Care Partnerships,
GP practice clusters and GP practices for use in quality improvement initiatives and medicines
management work. The relevant NTIs and APMs are included in the national prescribing strategy
documents for Polypharmacy, Diabetes, Respiratory Medicine and Chronic Pain. They complement
the national Realistic Medicine agenda and the Scottish Patient Safety Programme for Primary Care.
National prescribing indicators have been developed for 5 years, initially as part of the Scottish
Government Quality and Efficiency Programme and more recently as part of the Effective Prescribing
and Therapeutics Branch. These indicators cover core therapeutic areas including proton pump
inhibitors, inhalers, hypnotics/anxiolytics, analgesics, antibiotics, antidiabetic drugs, non-steroidal
anti-inflammatory drugs and antimicrobial wound management products.
The availability of patient-level data from the national Prescription Information System provides an
opportunity to develop measures that directly address patient safety issues, particularly the
prescribing of drug combinations that are known to increase the risk of adverse drug reactions. As
the capture of data required for this patient-level analysis (the CHI number) is not consistently high
across all GP Practices in Scotland, these are designated Additional Prescribing Measures; they
complement the process and quality indicators. Other areas of analysis are designated prescribing
measures where the patient-level analysis encourages review (e.g. long-term opioid analgesics) or
where the measure complements an indicator (e.g. encouraging the prescribing of 2 mg diazepam
tablets to support patient-centred management plans to reduce anxiolytic prescribing).
These NTIs and APMs for 2017-18 were developed at the end of 2016 by a reference group of
representatives from Health Boards across Scotland. They reviewed prescribing trends including the
changes in prescribing patterns that could be attributed to specific NTIs and APMs. They also
considered national prescribing strategy documents and prescribing indicators used in other UK
countries.
The NTI for total antibiotic prescribing is used by Scottish Governments Directorates as a HEAT
target in collaboration with the Scottish Antimicrobial Prescribing Group (SAPG).
Sean MacBride-Stewart Prescribing Adviser Effective Prescribing & Therapeutics Branch Directorate for Health Finance August 2017
Simon Hurding Clinical Lead

3
Background
This report details the NTIs and APMs developed for the 2017-2018 financial year. In the first section
a summary of the NTIs and APMs is presented. The second section provides a summary of the
variation in prescribing of GP practices within each Health Board and across Scotland for the period
October to December 2016.
NHS staff with access to the national Prescription Information Systems (PIS or PRISMs) can run
reports from the NHS NSS Business Intelligence Reporting platform (https://www.bo.scot.nhs.uk) to
get GP practice data. Currently these include analysis of GP practices within selected Health Boards
and Community Health Partnerships. When details of the Health and Social Care Partnerships and GP
Practice Clusters are available in PIS/PRISMS then the reports will be updated.
Compared to the previous year, there are few changes to these indicators and measures,
background to these can be found in the published report for 2016-17.
Notable changes are the updating of the indicators for inhaled corticosteroids. In 2016 updated
SIGN guidelines for asthma were published. The classification of steroid inhaler by the dose they
provide was updated by SIGN/BTS and this change is reflected in the respiratory NTI and APM that
measure the prescribing of inhaled corticosteroids. SIGN state that administration of medium or high
dose inhaled steroids to children may be associated with systemic side effects (including growth
failure and adrenal suppression) and because of this these children should be under the care of a
specialist paediatrician for the duration of the treatment.1
1 BTS/SIGN Asthma Guideline 2016 available from https://www.brit-thoracic.org.uk/document-library/clinical-
information/asthma/btssign-asthma-guideline-2016

4
Acknowledgments
The National Therapeutic Indicators (NTIs) are developed and maintained by the Effective
Prescribing and Therapeutics Branch, Scottish Government. Mr Sean MacBride-Stewart provides
pharmaceutical leadership, Dr Simon B Hurding provides clinical leadership and Mr Paul Paxton
provide data analysis expertise.
Consensus is provided by working with the NTI Reference Group. In addition we wish to
acknowledge the support of the Scottish Prescribing Advisors Association, The Scottish Antimicrobial
Prescribing Group, the National Chronic Pain Prescribing Strategy Group and the Controlled Drugs
Accountable Officer Network Scotland.
Thanks to all involved for their time, patience and expertise.
The NTI Reference Group
Sean MacBride-Stewart, NHS Greater Glasgow and Clyde, Chair
Karen Box, NHS Grampian
Keith Burns, NHS Western Isles
Kenny Halliday, NHS Tayside
Heather Harrison, NHS Greater Glasgow and Clyde
Findlay Hickey, NHS Highland
Caroline Hind, NHS Grampian
Isobel Kinghorn, NHS Greater Glasgow and Clyde
Gordon Loughran, NHS Dumfries and Galloway
Keith Maclure, NHS Borders
David Maxwell, Healthcare Improvement Scotland
Stephen McBurney, NHS Lothian
Jennifer McCaig, NHS Ayrshire and Arran
Tony McDavitt, NHS Shetland
Sheena McKiernan, NHS Ayrshire and Arran
Stuart McTaggart, NHS National Services Scotland
Barry Melia, NHS National Services Scotland
Anne Milne, NHS Lanarkshire
Paul Paxton, NHS National Services Scotland
Margaret Ryan, NHS Greater Glasgow and Clyde
Alastair Taylor, NHS Greater Glasgow and Clyde
Sheila Tennant, NHS Greater Glasgow and Clyde
Claire Thomas, NHS Wales
Audrey Thompson, NHS Greater Glasgow and Clyde
Anne Thomson, NHS Greater Glasgow and Clyde
Iain Watt, NHS Forth Valley
Cover image courtesy of Piyachok Thawornmat at FreeDigitalPhotos.net

5
NTIs 2017-18
De
sire
d c
han
ge in
in
dic
ato
r /
me
asu
re
APMs 2017-18
De
sire
d c
han
ge in
in
dic
ato
r /
me
asu
re
Gastrointestinal Proton Pump Inhibitors: DDDs per 1,000 LS per day*
↓
Cardiovascular
Oral anticoagulant: number of patients prescribed an antiplatelet also prescribed an oral anticoagulant but without gastroprotection as percentage of all patients prescribed an oral anticoagulant
↓
Respiratory
High Dose Corticosteroid Inhalers: high dose corticosteroid inhalers as a percentage of all corticosteroid inhalers (items) (2016 SIGN/BTS classification) UPDATED
↓
Medium and high dose corticosteroid inhalers: medium and high dose corticosteroid inhalers prescribed to children (aged < 12 years) as a percentage of all children prescribed inhaled corticosteroids (2016 SIGN/BTS classification) UPDATED
↓
Short Acting Beta-Agonist (SABA) Inhalers: number of patients prescribed more than 12 SABA inhalers in a year as a percentage of all patients prescribed SABAs
↓
CNS - psychotropic Hypnotics and Anxiolytics: DDDs per 1,000 LS per day*
↓
Hypnotics and Anxiolytics: diazepam 2mg tablets as a percentage of all diazepam tablets (items)
↑
Antipsychotics: antipsychotic prescribing to patients aged ≥75 years as a percentage of all people aged ≥75 years
↓
CNS - analgesic
Opioid analgesics: strong opioids (including tramadol preparations) DDDs per 1,000 LS per day†*
↓↑
Opioid analgesics: morphine as a percentage of all morphine, oxycodone, fentanyl, tapentadol, and hydromorphine (DDDs)
↑
Opioid analgesics: step 2 opioids (other than strong opioids) DDDs per 1,000 LS per day*
↓↑
Opioid analgesics: number of patients prescribed average daily dose of opioid equivalent to ≥ 120mg per day of morphine as a % of all patients prescribed step 2 and strong opioids††
↓↑
Opioid analgesics: number of patients prescribed strong opioids (including tramadol preparations) long term (>2 years) as a percentage of all patients prescribed strong opioids
↓
Gabapentanoids: pregabalin and gabapentin DDDs per 1,000 LS per day*
↓
Gabapentanoids: number of people prescribed more than the maximal recommended dose (>2 DDDs) per day of gabapentanoid as a percentage of all people prescribed a gabapentanoids (6 months) UPDATED
↓↑
CNS - adverse effects
Antimuscarinics: drugs for urinary frequency, enuresis, and incontinence (BNF 4.7.2 excluding duloxetine and mirabegron) DDDs per 1,000 LS per day*
Anticholinergics: number of patients aged ≥75 dispensed >10 items of strong or very strong anticholinergics (mARS 3&2) in 12 months as a percentage of all people aged ≥75 years
↓
Antibiotics Antibiotics: total antibiotic script items per 1,000 LS per day
↓ Antibiotics: number of people > 4 antibiotics per annum per 1,000 LS
↓

6
NTIs 2017-18
De
sire
d c
han
ge in
in
dic
ato
r /
me
asu
re
APMs 2017-18
De
sire
d c
han
ge in
in
dic
ato
r /
me
asu
re
Antibiotics: 4C antibiotics script items per 1,000 LS per 100 days
↓ Antibiotics: number of adult women prescribed a 3-day course of acute UTI antibiotics as a percentage of all adult women prescribed acute UTI antibiotics
↑ Antibiotics: UTI antibiotics (trimethoprim/nitrofurantoin) script items per 1,000 LS per day NEW
↓
Antidiabetics Antidiabetic Drugs: metformin as percentage of all anti-diabetic drugs (DDDs)
↑
SMBG: average cost per day of blood glucose test strips per patient prescribed antidiabetic drugs and/or insulins
↓
SMBG: number of patients prescribed blood glucose test strips who are not prescribed treatments for diabetes (insulins and/or antidiabetic drugs) or are only prescribed metformin as a percentage of all patients prescribed blood glucose test strips
↓
SMBG: number of patients prescribed insulin not prescribed blood glucose test strips as a percentage of patients prescribed insulin
↓
Musculoskeletal NSAIDs: DDDs per 1,000 LS per day* ↓
NSAIDs: NSAID prescribing to patients aged ≥65 years prescribed an ACE inhibitor/angiotensin receptor blocker and a diuretic as a percentage of all people aged ≥65 years
↓
NSAIDs: NSAID prescribing to patients aged ≥65 years prescribed an antiplatelet without gastroprotection as a percentage of all people aged ≥65 years
↓
NSAIDs: NSAID prescribing to patients aged ≥75 years without gastroprotection as a percentage of all people aged ≥75 years
↓
NSAIDs: NSAID prescription to patients prescribed an oral anticoagulant without gastroprotection as a percentage of all patients prescribed an oral anticoagulant
↓
Wound Management
Antimicrobial Wound Products: Antimicrobial wound products as percentage of total wound products (items)
↓
*these measures will also be made available using the population figures that have been weighted to account for prescribing need and are available within the PRISMS dataset. LS – List Size

7
† the following two measures will be reported in the analysis for this NTI
De
sire
d c
han
ge in
ind
icat
or
/ m
eas
ure
CNS - analgesic Opioid analgesics: strong opioids (excluding tramadol preparations) DDDs per 1,000 LS per
day*
↓↑
CNS - analgesic Opioid analgesics: tramadol DDDs per 1,000 LS per day* ↓↑
†† the following measure will be reported in the analysis for this APM
De
sire
d c
han
ge in
ind
icat
or
/ m
eas
ure
CNS - analgesic Opioid analgesics: number of patients prescribed average daily dose of opioid equivalent to ≥ 50mg per day of morphine as a % of all patients prescribed step 2 and strong opioids
↓↑
These NTIs/APMs from 2016-17 were removed
- NSAIDs including Cox-2 inhibitors: Ibuprofen and naproxen as a percentage of all NSAIDs (DDDs)
- Black triangle medicines as a percentage of all medicines from BNF chapters 1-7 & 9-13 (items)
8
Contents Gastrointestinal - NTI ............................................................................................................................ 12
Proton Pump Inhibitors: DDDs per 1,000 list size per day ................................................................ 12
Gastrointestinal - NTI ............................................................................................................................ 13
Proton Pump Inhibitors: DDDs per 1,000 weighted list size per day ................................................ 13
Cardiovascular - APM ............................................................................................................................ 14
Oral anticoagulant: number of patients prescribed an antiplatelet also prescribed an oral
anticoagulant but without gastroprotection as percentage of all patients prescribed an oral
anticoagulant .................................................................................................................................... 14
Respiratory - NTI ................................................................................................................................... 15
High Dose Corticosteroid Inhalers: high dose corticosteroid inhalers as a percentage of all
corticosteroid inhalers (items) (using 2016 SIGN/BTS classification of inhaled corticosteroids) ..... 15
Respiratory - APM ................................................................................................................................. 16
Medium and high dose corticosteroid inhalers: medium and high dose corticosteroid inhalers
prescribed to children (aged < 12 years) as a percentage of all children prescribed inhaled
corticosteroids (using 2016 SIGN/BTS classification of inhaled corticosteroids) ............................. 16
Respiratory - APM ................................................................................................................................. 18
Short Acting Beta-Agonist (SABA) Inhalers: number of patients prescribed more than 12 SABA
inhalers in a year as a percentage of all patients prescribed SABAs ............................................ 18
CNS (psychotropic) - NTI ....................................................................................................................... 19
Hypnotics and Anxiolytics: DDDs per 1,000 list size per day ............................................................ 19
CNS (psychotropic) - NTI ....................................................................................................................... 21
Hypnotics and Anxiolytics: DDDs per 1,000 weighted list size per day ............................................ 21
CNS (psychotropic) - APM ..................................................................................................................... 23
Hypnotics and Anxiolytics: diazepam 2mg tablets as a percentage of all diazepam tablets (items) 23
CNS (psychotropic) - APM ..................................................................................................................... 24
Antipsychotics: antipsychotic prescribing to patients aged ≥75 years as a percentage of all people
aged ≥75 years .................................................................................................................................. 24
CNS (analgesic) - NTI ............................................................................................................................. 25
Opioid analgesics: strong opioids (including tramadol preparations) DDDs per 1,000 list size per
day ..................................................................................................................................................... 25
CNS (analgesic) - NTI ............................................................................................................................. 26
Opioid analgesics: strong opioids (including tramadol preparations) DDDs per 1,000 weighted list
size per day ....................................................................................................................................... 26
CNS (analgesic) – NTI variant ................................................................................................................ 27
Opioid analgesics: strong opioids (excluding tramadol preparations) DDDs per 1,000 list size per
day ..................................................................................................................................................... 27
CNS (analgesic) – NTI variant ................................................................................................................ 28
9
Opioid analgesics: strong opioids (excluding tramadol preparations) DDDs per 1,000 weighted list
size per day ....................................................................................................................................... 28
CNS (analgesic) – NTI variant ................................................................................................................ 29
Opioid analgesics: tramadol DDDs per 1,000 list size per day .......................................................... 29
CNS (analgesic) – NTI variant ................................................................................................................ 30
Opioid analgesics: tramadol DDDs per 1,000 weighted list size per day .......................................... 30
CNS (analgesic) – NTI ............................................................................................................................ 31
Opioid analgesics: step 2 opioids (other than strong opioids) DDDs per 1,000 list size per day ...... 31
CNS (analgesic) – NTI ............................................................................................................................ 32
Opioid analgesics: step 2 opioids (other than strong opioids) DDDs per 1,000 weighted list size per
day ..................................................................................................................................................... 32
CNS (analgesic) – NTI ............................................................................................................................ 33
Gabapentanoids: pregabalin and gabapentin DDDs per 1,000 list size per day ............................... 33
CNS (analgesic) – NTI ............................................................................................................................ 34
Gabapentanoids: pregabalin and gabapentin DDDs per 1,000 weighted list size per day ............... 34
CNS (analgesic) – APM .......................................................................................................................... 35
Opioid analgesics: morphine as a percentage of all morphine, oxycodone, fentanyl, tapentadol,
and hydromorphone (DDDs) ............................................................................................................. 35
CNS (analgesic) – APM .......................................................................................................................... 36
Opioid analgesics: number of patients prescribed average daily dose of opioid equivalent to ≥
120mg per day of morphine as a % of all patients prescribed step 2 and strong opioids ................ 36
CNS (analgesic) – APM variant .............................................................................................................. 37
Opioid analgesics: number of patients prescribed average daily dose of opioid equivalent to ≥
50mg per day of morphine as a % of all patients prescribed step 2 and strong opioids .................. 37
CNS (analgesic) – APM .......................................................................................................................... 38
Opioid analgesics: number of patients prescribed strong opioids (including tramadol preparations)
long term (>2 years) as a percentage of all patients prescribed strong opioids .............................. 38
CNS (analgesic) – APM .......................................................................................................................... 39
CNS (adverse effects) - NTI ................................................................................................................... 40
Antimuscarinics: drugs for urinary frequency, enuresis, and incontinence (BNF 4.7.2 excluding
duloxetine and mirabegron) DDDs per 1,000 list size per day ......................................................... 40
CNS (adverse effects) - NTI ................................................................................................................... 41
Antimuscarinics: drugs for urinary frequency, enuresis, and incontinence (BNF 4.7.2 excluding
duloxetine and mirabegron) DDDs per 1,000 weighted list size per day ......................................... 41
CNS (adverse effects) - APM ................................................................................................................. 42
Anticholinergics: number of patients aged ≥75 prescribed >10 items of strong or very strong
anticholinergics (mARS 3&2) in 12 months as a percentage of all people aged ≥75 years .............. 42

10
Antibiotics - NTI ..................................................................................................................................... 43
Antibiotics: total antibiotic script items per 1,000 list size per day .................................................. 43
Antibiotics - NTI ..................................................................................................................................... 44
Antibiotics: 4C antibiotics script items per 1,000 list size per 100 days ........................................... 44
Antibiotics - NTI ..................................................................................................................................... 45
Antibiotics: UTI antibiotics (trimethoprim/nitrofurantoin) script items per 1,000 list size per day 45
Antibiotics - APM .................................................................................................................................. 46
Antibiotics: number of people prescribed > 4 antibiotics per annum per 1,000 list size ................. 46
Antibiotics - APM .................................................................................................................................. 47
Antibiotics: number of adult women prescribed a 3-day course of acute UTI antibiotics as a
percentage of all adult women prescribed acute UTI antibiotics ..................................................... 47
Antidiabetics - NTI ................................................................................................................................. 48
Antidiabetic Drugs: metformin as percentage of all anti-diabetic drugs (DDDs) ............................. 48
Antidiabetics - APM .............................................................................................................................. 49
Self-Monitoring of Blood Glucose (SMBG): average cost per day of blood glucose test strips per
patient prescribed antidiabetic drugs and/or insulins ...................................................................... 49
Antidiabetics - APM .............................................................................................................................. 50
Self-Monitoring of Blood Glucose (SMBG): number of patients prescribed blood glucose test strips
who are not prescribed treatments for diabetes (insulins and/or antidiabetic drugs) or are only
prescribed metformin as a percentage of all patients prescribed blood glucose test strips ........... 50
Antidiabetics - APM .............................................................................................................................. 51
Self-Monitoring of Blood Glucose (SMBG): number of patients prescribed insulin not prescribed
blood glucose test strips as a percentage of patients prescribed insulin ......................................... 51
Musculoskeletal - NTI ............................................................................................................................ 52
NSAIDs: DDDs per 1,000 list size per day .......................................................................................... 52
Musculoskeletal - NTI ............................................................................................................................ 53
NSAIDs: DDDs per 1,000 weighted list size per day .......................................................................... 53
Musculoskeletal – APM ......................................................................................................................... 54
NSAIDs: NSAID prescribing to patients aged ≥65 years prescribed an ACE inhibitor/angiotensin
receptor blocker and a diuretic as a percentage of all people aged ≥65 years ............................... 54
Musculoskeletal – APM ......................................................................................................................... 55
NSAIDs: NSAID prescribing to patients aged ≥65 years prescribed an antiplatelet without
gastroprotection as a percentage of all people aged ≥65 years ...................................................... 55
Musculoskeletal – APM ......................................................................................................................... 56
NSAIDs: NSAID prescribing to patients aged ≥75 years without gastroprotection as a percentage of
all people aged ≥75 years ................................................................................................................. 56
Musculoskeletal – APM ......................................................................................................................... 57
11
NSAIDs: NSAID prescription to patients prescribed an oral anticoagulant without gastroprotection
as a percentage of all patients prescribed an oral anticoagulant ..................................................... 57
Wound Management - NTI ................................................................................................................... 58
Antimicrobial Wound Products: antimicrobial wound products as percentage of total wound
products (items) ................................................................................................................................ 58
12
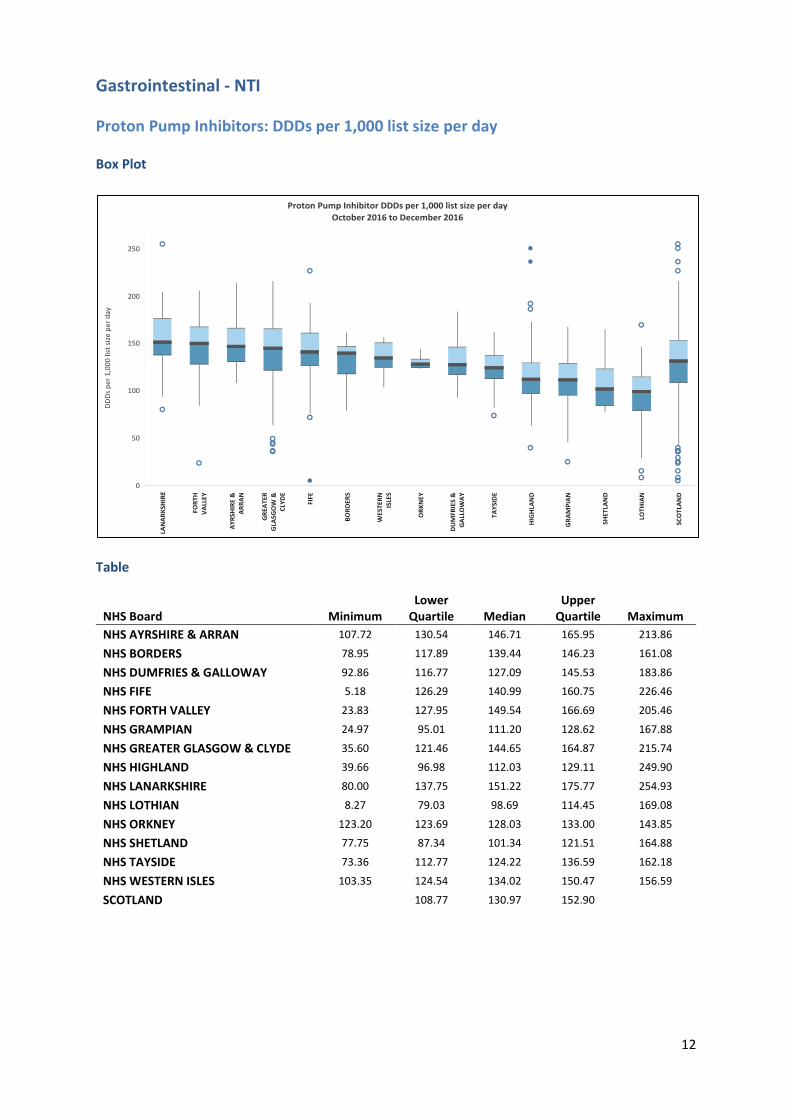
Gastrointestinal - NTI
Proton Pump Inhibitors: DDDs per 1,000 list size per day
Box Plot
Table
NHS Board Minimum Lower
Quartile Median Upper
Quartile Maximum
NHS AYRSHIRE & ARRAN 107.72 130.54 146.71 165.95 213.86
NHS BORDERS 78.95 117.89 139.44 146.23 161.08
NHS DUMFRIES & GALLOWAY 92.86 116.77 127.09 145.53 183.86
NHS FIFE 5.18 126.29 140.99 160.75 226.46
NHS FORTH VALLEY 23.83 127.95 149.54 166.69 205.46
NHS GRAMPIAN 24.97 95.01 111.20 128.62 167.88
NHS GREATER GLASGOW & CLYDE 35.60 121.46 144.65 164.87 215.74
NHS HIGHLAND 39.66 96.98 112.03 129.11 249.90
NHS LANARKSHIRE 80.00 137.75 151.22 175.77 254.93
NHS LOTHIAN 8.27 79.03 98.69 114.45 169.08
NHS ORKNEY 123.20 123.69 128.03 133.00 143.85
NHS SHETLAND 77.75 87.34 101.34 121.51 164.88
NHS TAYSIDE 73.36 112.77 124.22 136.59 162.18
NHS WESTERN ISLES 103.35 124.54 134.02 150.47 156.59
SCOTLAND 108.77 130.97 152.90

13
Gastrointestinal - NTI
Proton Pump Inhibitors: DDDs per 1,000 weighted list size per day
Box Plot
Table
NHS Board Minimum Lower
Quartile Median Upper
Quartile Maximum
NHS AYRSHIRE & ARRAN 105.12 123.19 133.18 143.83 178.20
NHS BORDERS 98.36 126.50 144.30 153.37 165.98
NHS DUMFRIES & GALLOWAY 98.08 112.48 117.70 133.89 148.51
NHS FIFE 104.97 126.62 135.06 153.98 214.46
NHS FORTH VALLEY 64.38 138.46 149.83 159.25 184.49
NHS GRAMPIAN 48.38 114.89 128.61 139.47 185.71
NHS GREATER GLASGOW & CLYDE 42.26 112.53 128.46 141.79 204.80
NHS HIGHLAND 41.89 94.89 107.63 124.16 207.79
NHS LANARKSHIRE 69.91 124.36 142.30 157.84 196.96
NHS LOTHIAN 21.53 90.03 108.53 118.95 142.98
NHS ORKNEY 103.88 120.06 127.63 130.55 149.13
NHS SHETLAND 92.16 100.44 106.33 137.02 161.68
NHS TAYSIDE 91.11 117.23 129.75 134.27 166.50
NHS WESTERN ISLES 91.01 104.73 115.47 126.79 146.24
SCOTLAND 110.54 126.60 142.47
14
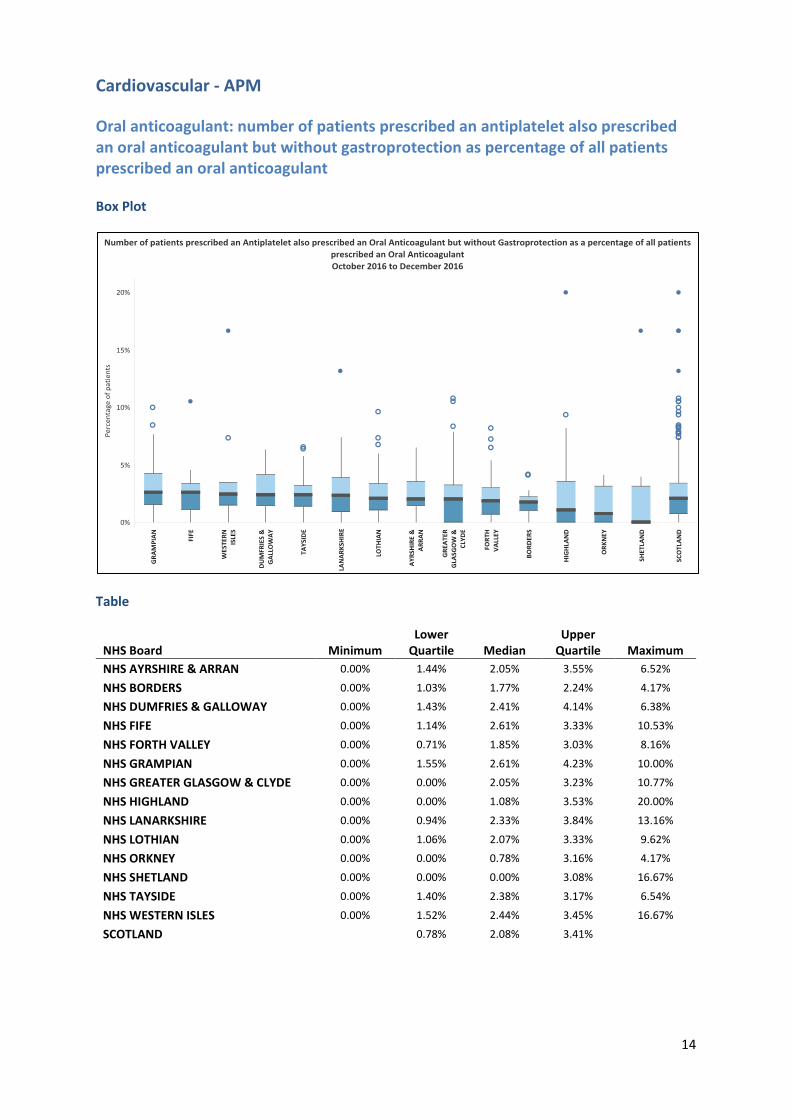
Cardiovascular - APM
Oral anticoagulant: number of patients prescribed an antiplatelet also prescribed an oral anticoagulant but without gastroprotection as percentage of all patients prescribed an oral anticoagulant
Box Plot
Table
NHS Board Minimum Lower
Quartile Median Upper
Quartile Maximum
NHS AYRSHIRE & ARRAN 0.00% 1.44% 2.05% 3.55% 6.52%
NHS BORDERS 0.00% 1.03% 1.77% 2.24% 4.17%
NHS DUMFRIES & GALLOWAY 0.00% 1.43% 2.41% 4.14% 6.38%
NHS FIFE 0.00% 1.14% 2.61% 3.33% 10.53%
NHS FORTH VALLEY 0.00% 0.71% 1.85% 3.03% 8.16%
NHS GRAMPIAN 0.00% 1.55% 2.61% 4.23% 10.00%
NHS GREATER GLASGOW & CLYDE 0.00% 0.00% 2.05% 3.23% 10.77%
NHS HIGHLAND 0.00% 0.00% 1.08% 3.53% 20.00%
NHS LANARKSHIRE 0.00% 0.94% 2.33% 3.84% 13.16%
NHS LOTHIAN 0.00% 1.06% 2.07% 3.33% 9.62%
NHS ORKNEY 0.00% 0.00% 0.78% 3.16% 4.17%
NHS SHETLAND 0.00% 0.00% 0.00% 3.08% 16.67%
NHS TAYSIDE 0.00% 1.40% 2.38% 3.17% 6.54%
NHS WESTERN ISLES 0.00% 1.52% 2.44% 3.45% 16.67%
SCOTLAND 0.78% 2.08% 3.41%

15
Respiratory - NTI
High Dose Corticosteroid Inhalers: high dose corticosteroid inhalers as a percentage of all corticosteroid inhalers (items) (using 2016 SIGN/BTS classification of inhaled corticosteroids)
Box Plot
Table
NHS Board Minimum Lower
Quartile Median Upper
Quartile Maximum
NHS AYRSHIRE & ARRAN 6.01% 16.33% 20.54% 24.06% 34.22%
NHS BORDERS 10.30% 15.03% 18.68% 23.64% 37.72%
NHS DUMFRIES & GALLOWAY 1.78% 7.91% 12.50% 18.53% 29.97%
NHS FIFE 0.00% 11.62% 15.36% 18.73% 31.34%
NHS FORTH VALLEY 2.94% 13.16% 16.38% 22.39% 31.43%
NHS GRAMPIAN 4.52% 15.28% 19.82% 23.98% 35.40%
NHS GREATER GLASGOW & CLYDE 5.59% 14.19% 18.61% 23.05% 45.93%
NHS HIGHLAND 0.00% 16.31% 21.89% 27.96% 59.46%
NHS LANARKSHIRE 5.32% 10.41% 12.96% 16.22% 28.40%
NHS LOTHIAN 5.88% 14.66% 19.94% 24.03% 33.33%
NHS ORKNEY 9.09% 19.69% 22.32% 26.52% 39.13%
NHS SHETLAND 8.78% 12.93% 17.35% 22.36% 23.46%
NHS TAYSIDE 2.70% 9.95% 12.89% 17.05% 26.32%
NHS WESTERN ISLES 5.56% 14.58% 23.39% 36.07% 48.39%
SCOTLAND 12.95% 17.72% 22.92%

16
Respiratory - APM
Medium and high dose corticosteroid inhalers: medium and high dose corticosteroid inhalers prescribed to children (aged < 12 years) as a percentage of all children prescribed inhaled corticosteroids (using 2016 SIGN/BTS classification of inhaled corticosteroids)
Box Plot
Box Plot (excluding 4 Highland 100% outliers - each practice had 1 patient)

17
Table
NHS Board Minimum Lower
Quartile Median Upper
Quartile Maximum
NHS AYRSHIRE & ARRAN 0.00% 0.00% 6.16% 9.09% 33.33%
NHS BORDERS 0.00% 0.00% 0.00% 8.71% 25.00%
NHS DUMFRIES & GALLOWAY 0.00% 0.00% 5.88% 9.09% 33.33%
NHS FIFE 0.00% 0.00% 0.00% 2.94% 14.81%
NHS FORTH VALLEY 0.00% 0.00% 3.23% 6.90% 25.00%
NHS GRAMPIAN 0.00% 0.00% 3.33% 8.00% 50.00%
NHS GREATER GLASGOW & CLYDE 0.00% 0.00% 0.00% 7.77% 33.33%
NHS HIGHLAND 0.00% 0.00% 0.00% 9.09% 100.00%
NHS LANARKSHIRE 0.00% 6.88% 13.04% 20.98% 42.86%
NHS LOTHIAN 0.00% 0.00% 0.00% 4.88% 33.33%
NHS ORKNEY 0.00% 0.00% 0.00% 0.00% 0.00%
NHS SHETLAND 0.00% 0.00% 0.00% 4.70% 20.00%
NHS TAYSIDE 0.00% 0.00% 3.77% 7.69% 33.33%
NHS WESTERN ISLES 0.00% 0.00% 0.00% 2.94% 14.29%
SCOTLAND 0.00% 2.50% 9.09%

18
Respiratory - APM
Short Acting Beta-Agonist (SABA) Inhalers: number of patients prescribed more than 12 SABA inhalers in a year as a percentage of all patients prescribed SABAs
Box Plot
Table
NHS Board Minimum Lower
Quartile Median Upper
Quartile Maximum
NHS AYRSHIRE & ARRAN 5.25% 9.92% 11.79% 15.06% 19.42%
NHS BORDERS 3.85% 6.91% 9.26% 12.30% 16.69%
NHS DUMFRIES & GALLOWAY 4.71% 9.92% 12.03% 13.23% 21.03%
NHS FIFE 3.36% 7.66% 9.56% 10.94% 14.71%
NHS FORTH VALLEY 1.33% 6.68% 8.18% 10.95% 17.41%
NHS GRAMPIAN 0.00% 6.07% 8.02% 10.15% 16.30%
NHS GREATER GLASGOW & CLYDE 2.35% 8.24% 10.56% 14.02% 27.59%
NHS HIGHLAND 0.00% 6.51% 9.28% 11.96% 22.76%
NHS LANARKSHIRE 3.49% 7.44% 9.15% 11.86% 21.04%
NHS LOTHIAN 0.85% 8.12% 10.14% 11.99% 21.46%
NHS ORKNEY 0.00% 4.55% 6.18% 9.75% 11.27%
NHS SHETLAND 3.23% 6.89% 7.98% 8.60% 9.61%
NHS TAYSIDE 3.36% 8.73% 10.68% 13.06% 20.07%
NHS WESTERN ISLES 8.32% 10.48% 13.89% 14.75% 23.33%
SCOTLAND 7.61% 9.93% 12.68%

19
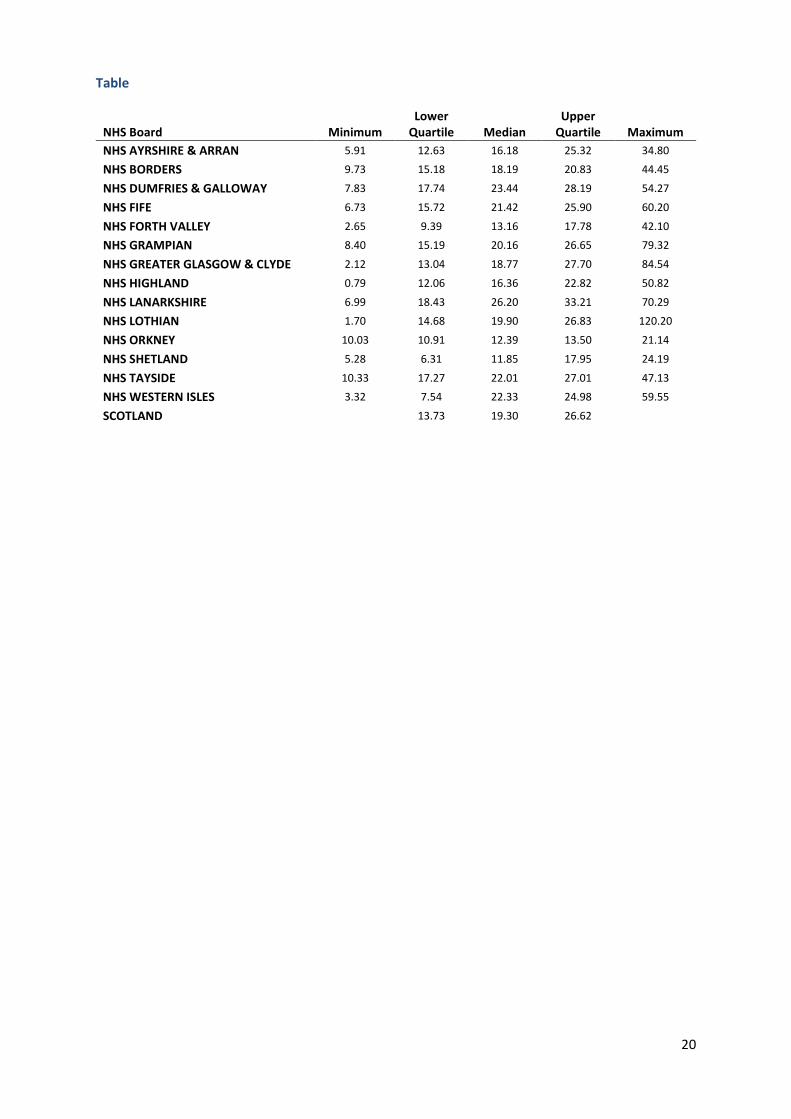
CNS (psychotropic) - NTI
Hypnotics and Anxiolytics: DDDs per 1,000 list size per day
Box Plot
Box Plot (excluding Lothian 120.2 outlier)
20
Table
NHS Board Minimum Lower
Quartile Median Upper
Quartile Maximum
NHS AYRSHIRE & ARRAN 5.91 12.63 16.18 25.32 34.80
NHS BORDERS 9.73 15.18 18.19 20.83 44.45
NHS DUMFRIES & GALLOWAY 7.83 17.74 23.44 28.19 54.27
NHS FIFE 6.73 15.72 21.42 25.90 60.20
NHS FORTH VALLEY 2.65 9.39 13.16 17.78 42.10
NHS GRAMPIAN 8.40 15.19 20.16 26.65 79.32
NHS GREATER GLASGOW & CLYDE 2.12 13.04 18.77 27.70 84.54
NHS HIGHLAND 0.79 12.06 16.36 22.82 50.82
NHS LANARKSHIRE 6.99 18.43 26.20 33.21 70.29
NHS LOTHIAN 1.70 14.68 19.90 26.83 120.20
NHS ORKNEY 10.03 10.91 12.39 13.50 21.14
NHS SHETLAND 5.28 6.31 11.85 17.95 24.19
NHS TAYSIDE 10.33 17.27 22.01 27.01 47.13
NHS WESTERN ISLES 3.32 7.54 22.33 24.98 59.55
SCOTLAND 13.73 19.30 26.62

21
CNS (psychotropic) - NTI
Hypnotics and Anxiolytics: DDDs per 1,000 weighted list size per day
Box Plot
Box Plot (excluding Lothian 163.95 outlier)

22
Table
NHS Board Minimum Lower
Quartile Median Upper
Quartile Maximum
NHS AYRSHIRE & ARRAN 5.24 11.53 14.99 23.67 33.18
NHS BORDERS 10.00 16.08 19.13 22.00 51.89
NHS DUMFRIES & GALLOWAY 7.33 16.97 19.84 27.25 50.27
NHS FIFE 6.75 16.52 21.61 28.13 54.81
NHS FORTH VALLEY 2.93 10.10 13.66 17.84 35.38
NHS GRAMPIAN 9.92 17.67 22.24 29.43 98.72
NHS GREATER GLASGOW & CLYDE 1.92 12.03 17.53 24.34 60.41
NHS HIGHLAND 0.71 11.15 16.21 21.86 41.12
NHS LANARKSHIRE 5.84 17.29 23.37 29.98 70.61
NHS LOTHIAN 4.29 17.73 21.33 29.37 163.95
NHS ORKNEY 8.98 10.29 11.00 14.15 21.88
NHS SHETLAND 5.64 6.87 13.23 21.36 24.00
NHS TAYSIDE 10.94 18.30 22.44 26.59 45.75
NHS WESTERN ISLES 2.92 5.72 19.68 23.06 48.09
SCOTLAND 13.77 19.21 26.14

23
CNS (psychotropic) - APM
Hypnotics and Anxiolytics: diazepam 2mg tablets as a percentage of all diazepam tablets (items)
Box Plot
Table
NHS Board Minimum Lower
Quartile Median Upper
Quartile Maximum
NHS AYRSHIRE & ARRAN 31.43% 45.53% 52.71% 61.67% 83.87%
NHS BORDERS 38.51% 44.41% 48.86% 56.03% 65.93%
NHS DUMFRIES & GALLOWAY 18.82% 36.21% 50.00% 55.50% 76.60%
NHS FIFE 23.57% 45.23% 52.38% 61.97% 82.63%
NHS FORTH VALLEY 21.43% 48.37% 57.07% 66.25% 86.67%
NHS GRAMPIAN 0.00% 37.91% 49.07% 55.01% 83.22%
NHS GREATER GLASGOW & CLYDE 23.47% 62.61% 71.14% 81.03% 100.00%
NHS HIGHLAND 0.00% 40.24% 52.01% 64.45% 100.00%
NHS LANARKSHIRE 15.89% 50.16% 64.99% 75.96% 98.93%
NHS LOTHIAN 21.08% 45.77% 53.77% 65.26% 95.80%
NHS ORKNEY 29.79% 51.30% 56.18% 64.87% 75.00%
NHS SHETLAND 20.00% 53.02% 65.97% 70.29% 82.74%
NHS TAYSIDE 33.33% 46.08% 55.71% 63.89% 81.08%
NHS WESTERN ISLES 25.71% 30.00% 35.25% 57.22% 76.32%
SCOTLAND 46.93% 57.72% 70.51%

24
CNS (psychotropic) - APM
Antipsychotics: antipsychotic prescribing to patients aged ≥75 years as a percentage of all people aged ≥75 years
Box Plot
Table
NHS Board Minimum Lower
Quartile Median Upper
Quartile Maximum
NHS AYRSHIRE & ARRAN 0.00% 1.42% 1.92% 2.77% 6.10%
NHS BORDERS 0.00% 0.61% 1.57% 1.99% 3.85%
NHS DUMFRIES & GALLOWAY 0.00% 1.32% 1.83% 2.50% 4.09%
NHS FIFE 0.00% 1.24% 1.92% 2.51% 5.28%
NHS FORTH VALLEY 0.00% 1.58% 2.67% 3.55% 17.65%
NHS GRAMPIAN 0.00% 2.03% 3.11% 4.43% 21.05%
NHS GREATER GLASGOW & CLYDE 0.00% 1.61% 2.44% 3.36% 17.83%
NHS HIGHLAND 0.00% 1.22% 2.44% 3.54% 9.05%
NHS LANARKSHIRE 0.00% 1.51% 2.34% 3.63% 8.72%
NHS LOTHIAN 0.00% 1.53% 2.58% 3.84% 12.68%
NHS ORKNEY 0.00% 1.17% 2.04% 2.08% 2.42%
NHS SHETLAND 1.41% 2.29% 2.64% 3.25% 6.87%
NHS TAYSIDE 0.00% 2.20% 2.96% 3.40% 12.28%
NHS WESTERN ISLES 2.04% 2.31% 2.88% 3.47% 4.46%
SCOTLAND 1.50% 2.40% 3.37%

25
CNS (analgesic) - NTI
Opioid analgesics: strong opioids (including tramadol preparations) DDDs per 1,000 list size per day
Box Plot
Table
NHS Board Minimum Lower
Quartile Median Upper
Quartile Maximum
NHS AYRSHIRE & ARRAN 6.82 18.30 22.47 29.59 39.20
NHS BORDERS 3.83 11.21 13.67 18.98 21.63
NHS DUMFRIES & GALLOWAY 9.87 18.29 23.47 27.11 49.73
NHS FIFE 0.53 14.19 21.29 27.99 42.38
NHS FORTH VALLEY 0.87 10.26 14.88 19.29 29.16
NHS GRAMPIAN 2.68 8.49 11.86 15.58 34.89
NHS GREATER GLASGOW & CLYDE 1.03 9.96 14.95 19.13 39.08
NHS HIGHLAND 0.29 9.57 14.85 20.19 44.08
NHS LANARKSHIRE 8.25 15.41 18.85 22.72 33.89
NHS LOTHIAN 0.55 7.40 11.82 16.58 32.55
NHS ORKNEY 5.68 8.27 10.98 13.27 16.45
NHS SHETLAND 4.01 8.21 11.03 15.21 24.86
NHS TAYSIDE 10.71 15.92 17.73 22.62 46.24
NHS WESTERN ISLES 8.87 17.69 21.47 26.87 33.35
SCOTLAND 10.94 15.83 20.99

26
CNS (analgesic) - NTI
Opioid analgesics: strong opioids (including tramadol preparations) DDDs per 1,000 weighted list size per day
Box Plot
Table
NHS Board Minimum Lower
Quartile Median Upper
Quartile Maximum
NHS AYRSHIRE & ARRAN 6.10 16.73 19.67 26.26 33.60
NHS BORDERS 4.77 11.62 14.79 19.17 26.56
NHS DUMFRIES & GALLOWAY 11.41 17.42 21.30 25.58 39.38
NHS FIFE 10.76 14.55 20.96 27.07 40.14
NHS FORTH VALLEY 2.36 10.43 14.59 18.02 24.51
NHS GRAMPIAN 5.19 10.58 13.69 16.59 39.80
NHS GREATER GLASGOW & CLYDE 1.27 9.69 12.82 16.13 30.16
NHS HIGHLAND 0.31 9.99 13.98 19.46 35.67
NHS LANARKSHIRE 6.79 13.34 17.53 20.90 31.96
NHS LOTHIAN 1.45 8.42 13.06 17.64 26.87
NHS ORKNEY 4.76 8.73 10.62 13.10 14.92
NHS SHETLAND 4.45 8.18 12.72 18.12 24.38
NHS TAYSIDE 11.34 16.58 18.00 22.34 44.75
NHS WESTERN ISLES 7.48 15.01 19.82 26.14 27.57
SCOTLAND 11.21 15.08 19.65
27
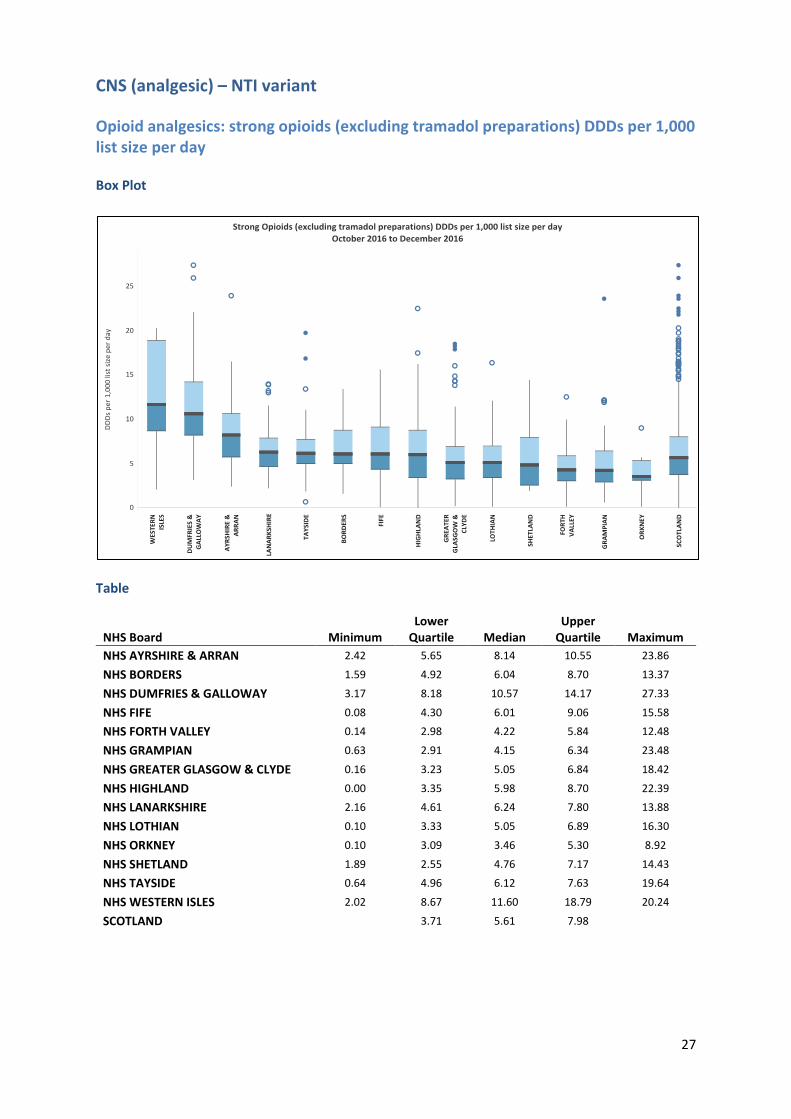
CNS (analgesic) – NTI variant
Opioid analgesics: strong opioids (excluding tramadol preparations) DDDs per 1,000 list size per day
Box Plot
Table
NHS Board Minimum Lower
Quartile Median Upper
Quartile Maximum
NHS AYRSHIRE & ARRAN 2.42 5.65 8.14 10.55 23.86
NHS BORDERS 1.59 4.92 6.04 8.70 13.37
NHS DUMFRIES & GALLOWAY 3.17 8.18 10.57 14.17 27.33
NHS FIFE 0.08 4.30 6.01 9.06 15.58
NHS FORTH VALLEY 0.14 2.98 4.22 5.84 12.48
NHS GRAMPIAN 0.63 2.91 4.15 6.34 23.48
NHS GREATER GLASGOW & CLYDE 0.16 3.23 5.05 6.84 18.42
NHS HIGHLAND 0.00 3.35 5.98 8.70 22.39
NHS LANARKSHIRE 2.16 4.61 6.24 7.80 13.88
NHS LOTHIAN 0.10 3.33 5.05 6.89 16.30
NHS ORKNEY 0.10 3.09 3.46 5.30 8.92
NHS SHETLAND 1.89 2.55 4.76 7.17 14.43
NHS TAYSIDE 0.64 4.96 6.12 7.63 19.64
NHS WESTERN ISLES 2.02 8.67 11.60 18.79 20.24
SCOTLAND 3.71 5.61 7.98
28
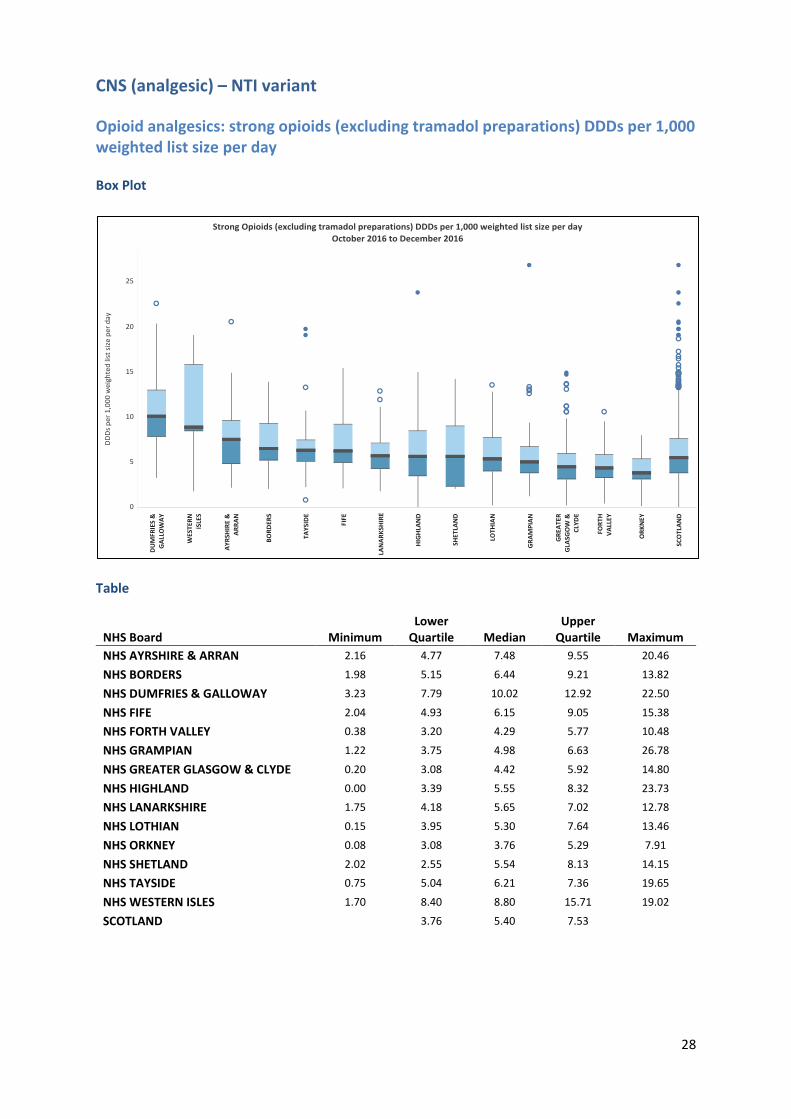
CNS (analgesic) – NTI variant
Opioid analgesics: strong opioids (excluding tramadol preparations) DDDs per 1,000 weighted list size per day
Box Plot
Table
NHS Board Minimum Lower
Quartile Median Upper
Quartile Maximum
NHS AYRSHIRE & ARRAN 2.16 4.77 7.48 9.55 20.46
NHS BORDERS 1.98 5.15 6.44 9.21 13.82
NHS DUMFRIES & GALLOWAY 3.23 7.79 10.02 12.92 22.50
NHS FIFE 2.04 4.93 6.15 9.05 15.38
NHS FORTH VALLEY 0.38 3.20 4.29 5.77 10.48
NHS GRAMPIAN 1.22 3.75 4.98 6.63 26.78
NHS GREATER GLASGOW & CLYDE 0.20 3.08 4.42 5.92 14.80
NHS HIGHLAND 0.00 3.39 5.55 8.32 23.73
NHS LANARKSHIRE 1.75 4.18 5.65 7.02 12.78
NHS LOTHIAN 0.15 3.95 5.30 7.64 13.46
NHS ORKNEY 0.08 3.08 3.76 5.29 7.91
NHS SHETLAND 2.02 2.55 5.54 8.13 14.15
NHS TAYSIDE 0.75 5.04 6.21 7.36 19.65
NHS WESTERN ISLES 1.70 8.40 8.80 15.71 19.02
SCOTLAND 3.76 5.40 7.53

29
CNS (analgesic) – NTI variant
Opioid analgesics: tramadol DDDs per 1,000 list size per day
Box Plot
Table
NHS Board Minimum Lower
Quartile Median Upper
Quartile Maximum
NHS AYRSHIRE & ARRAN 4.41 11.09 15.32 18.70 25.62
NHS BORDERS 2.24 6.32 7.48 8.98 11.72
NHS DUMFRIES & GALLOWAY 3.74 8.82 10.78 14.13 24.58
NHS FIFE 0.46 10.25 13.81 18.11 28.76
NHS FORTH VALLEY 0.73 6.69 9.74 12.79 17.85
NHS GRAMPIAN 2.05 5.21 7.44 9.99 19.73
NHS GREATER GLASGOW & CLYDE 0.87 6.17 9.28 12.70 24.46
NHS HIGHLAND 0.00 5.80 8.20 11.57 28.00
NHS LANARKSHIRE 2.57 9.83 12.11 14.71 25.25
NHS LOTHIAN 0.16 3.61 6.26 10.30 17.83
NHS ORKNEY 4.83 5.23 7.20 7.85 8.74
NHS SHETLAND 1.95 4.90 6.34 7.17 12.73
NHS TAYSIDE 6.40 9.65 11.53 15.60 26.60
NHS WESTERN ISLES 6.72 8.08 9.02 11.96 14.35
SCOTLAND 6.63 9.66 13.13

30
CNS (analgesic) – NTI variant
Opioid analgesics: tramadol DDDs per 1,000 weighted list size per day
Box Plot
Table
NHS Board Minimum Lower
Quartile Median Upper
Quartile Maximum
NHS AYRSHIRE & ARRAN 3.94 10.04 14.43 16.74 23.01
NHS BORDERS 2.79 6.71 7.48 10.03 13.94
NHS DUMFRIES & GALLOWAY 4.32 8.35 10.28 13.15 22.77
NHS FIFE 6.31 10.31 13.71 17.61 27.24
NHS FORTH VALLEY 1.98 7.44 9.84 12.00 17.37
NHS GRAMPIAN 2.44 6.37 8.86 10.98 19.90
NHS GREATER GLASGOW & CLYDE 1.07 6.02 8.12 10.62 18.57
NHS HIGHLAND 0.00 5.98 7.94 10.64 28.42
NHS LANARKSHIRE 2.25 9.10 11.23 13.75 23.14
NHS LOTHIAN 0.42 4.26 7.46 10.21 17.91
NHS ORKNEY 4.68 5.13 6.68 7.39 9.05
NHS SHETLAND 2.16 5.01 7.41 8.63 15.11
NHS TAYSIDE 6.74 10.49 12.24 16.01 25.74
NHS WESTERN ISLES 5.77 6.21 8.71 9.80 11.87
SCOTLAND 6.73 9.27 12.25
31
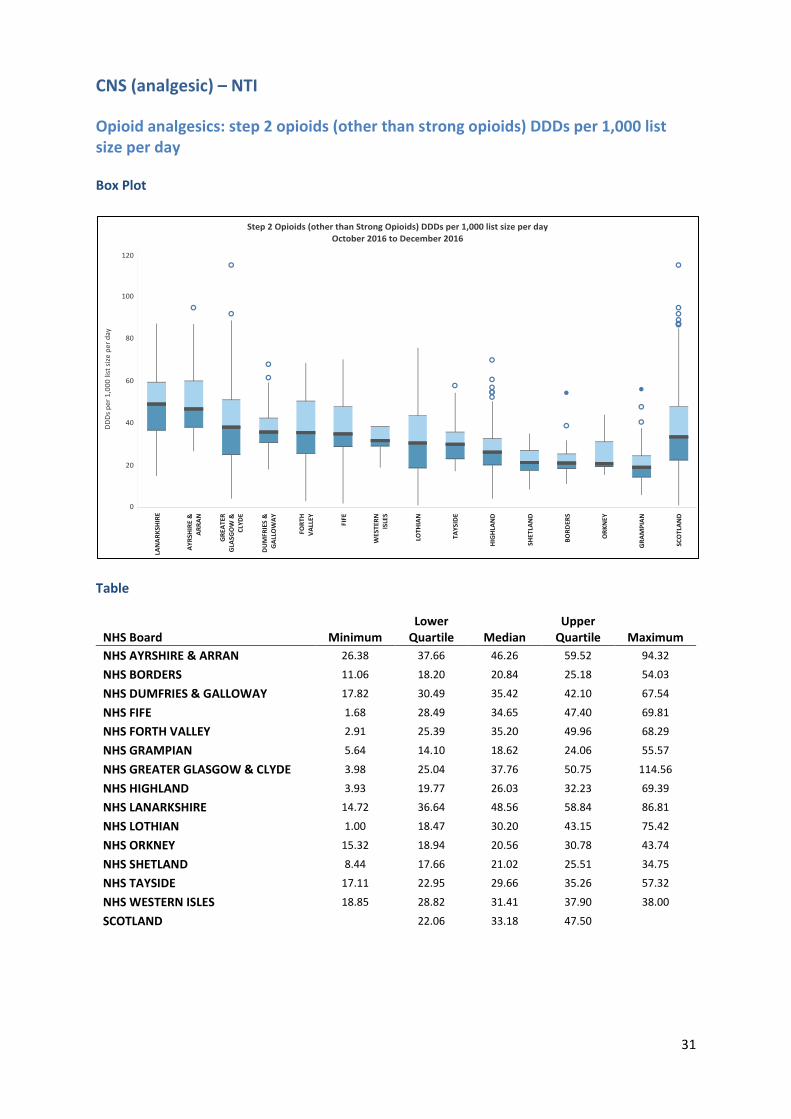
CNS (analgesic) – NTI
Opioid analgesics: step 2 opioids (other than strong opioids) DDDs per 1,000 list size per day
Box Plot
Table
NHS Board Minimum Lower
Quartile Median Upper
Quartile Maximum
NHS AYRSHIRE & ARRAN 26.38 37.66 46.26 59.52 94.32
NHS BORDERS 11.06 18.20 20.84 25.18 54.03
NHS DUMFRIES & GALLOWAY 17.82 30.49 35.42 42.10 67.54
NHS FIFE 1.68 28.49 34.65 47.40 69.81
NHS FORTH VALLEY 2.91 25.39 35.20 49.96 68.29
NHS GRAMPIAN 5.64 14.10 18.62 24.06 55.57
NHS GREATER GLASGOW & CLYDE 3.98 25.04 37.76 50.75 114.56
NHS HIGHLAND 3.93 19.77 26.03 32.23 69.39
NHS LANARKSHIRE 14.72 36.64 48.56 58.84 86.81
NHS LOTHIAN 1.00 18.47 30.20 43.15 75.42
NHS ORKNEY 15.32 18.94 20.56 30.78 43.74
NHS SHETLAND 8.44 17.66 21.02 25.51 34.75
NHS TAYSIDE 17.11 22.95 29.66 35.26 57.32
NHS WESTERN ISLES 18.85 28.82 31.41 37.90 38.00
SCOTLAND 22.06 33.18 47.50

32
CNS (analgesic) – NTI
Opioid analgesics: step 2 opioids (other than strong opioids) DDDs per 1,000 weighted list size per day
Box Plot
Table
NHS Board Minimum Lower
Quartile Median Upper
Quartile Maximum
NHS AYRSHIRE & ARRAN 23.56 35.69 44.83 54.89 75.00
NHS BORDERS 11.57 18.72 21.56 26.69 67.82
NHS DUMFRIES & GALLOWAY 20.60 29.05 32.99 38.48 56.92
NHS FIFE 17.42 29.06 35.70 44.50 65.83
NHS FORTH VALLEY 7.87 26.73 34.35 49.55 62.98
NHS GRAMPIAN 8.46 17.31 20.69 25.23 56.05
NHS GREATER GLASGOW & CLYDE 4.63 23.38 34.23 42.42 79.82
NHS HIGHLAND 4.15 19.93 24.69 30.33 62.00
NHS LANARKSHIRE 12.86 34.67 43.34 52.91 87.21
NHS LOTHIAN 2.62 21.66 31.02 47.81 66.58
NHS ORKNEY 15.85 18.22 23.02 28.57 36.64
NHS SHETLAND 9.02 19.54 24.08 29.65 34.07
NHS TAYSIDE 18.03 24.03 29.28 35.74 55.65
NHS WESTERN ISLES 16.60 26.47 28.11 30.61 38.31
SCOTLAND 22.73 31.88 42.88

33
CNS (analgesic) – NTI
Gabapentanoids: pregabalin and gabapentin DDDs per 1,000 list size per day
Box Plot
Table
NHS Board Minimum Lower
Quartile Median Upper
Quartile Maximum
NHS AYRSHIRE & ARRAN 7.32 13.07 18.37 22.44 35.15
NHS BORDERS 7.58 15.09 19.37 22.37 27.16
NHS DUMFRIES & GALLOWAY 8.25 13.77 16.35 18.44 32.05
NHS FIFE 1.69 14.61 20.26 25.96 45.78
NHS FORTH VALLEY 1.90 13.40 17.40 23.90 34.39
NHS GRAMPIAN 3.24 8.39 10.61 12.59 21.49
NHS GREATER GLASGOW & CLYDE 2.35 11.17 16.87 22.47 40.07
NHS HIGHLAND 0.00 8.65 12.55 16.04 38.13
NHS LANARKSHIRE 7.64 16.25 20.16 27.38 51.05
NHS LOTHIAN 0.82 9.73 13.92 18.25 31.48
NHS ORKNEY 7.16 9.67 12.52 17.45 28.89
NHS SHETLAND 2.50 6.58 11.01 13.67 19.59
NHS TAYSIDE 8.59 15.58 20.24 27.34 42.89
NHS WESTERN ISLES 2.94 9.74 12.75 16.02 27.84
SCOTLAND 11.36 16.16 21.74

34
CNS (analgesic) – NTI
Gabapentanoids: pregabalin and gabapentin DDDs per 1,000 weighted list size per day
Box Plot
Table
NHS Board Minimum Lower
Quartile Median Upper
Quartile Maximum
NHS AYRSHIRE & ARRAN 6.55 12.56 16.67 20.27 30.66
NHS BORDERS 9.44 15.63 20.74 22.99 29.72
NHS DUMFRIES & GALLOWAY 7.04 13.55 14.98 17.10 27.03
NHS FIFE 9.92 15.16 19.52 24.69 44.15
NHS FORTH VALLEY 5.12 14.00 18.56 23.56 31.74
NHS GRAMPIAN 4.94 9.61 11.83 13.77 21.81
NHS GREATER GLASGOW & CLYDE 2.73 11.18 14.81 18.79 41.04
NHS HIGHLAND 0.00 8.39 12.20 15.05 35.14
NHS LANARKSHIRE 6.67 15.23 19.03 24.42 42.25
NHS LOTHIAN 1.58 11.15 15.38 18.41 31.06
NHS ORKNEY 7.09 9.30 14.03 16.83 24.20
NHS SHETLAND 3.14 7.66 11.87 14.51 17.84
NHS TAYSIDE 10.13 16.66 21.59 26.85 41.66
NHS WESTERN ISLES 2.59 8.99 11.77 13.15 23.01
SCOTLAND 11.86 15.55 20.24
35
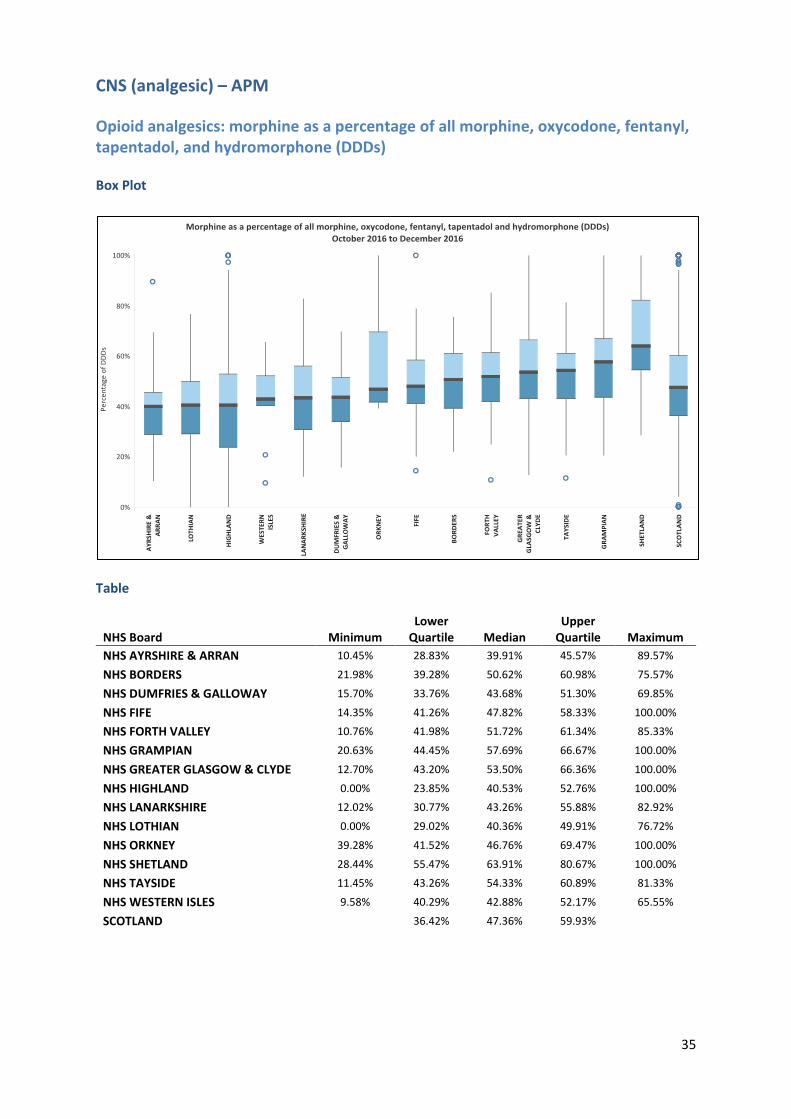
CNS (analgesic) – APM
Opioid analgesics: morphine as a percentage of all morphine, oxycodone, fentanyl, tapentadol, and hydromorphone (DDDs)
Box Plot
Table
NHS Board Minimum Lower
Quartile Median Upper
Quartile Maximum
NHS AYRSHIRE & ARRAN 10.45% 28.83% 39.91% 45.57% 89.57%
NHS BORDERS 21.98% 39.28% 50.62% 60.98% 75.57%
NHS DUMFRIES & GALLOWAY 15.70% 33.76% 43.68% 51.30% 69.85%
NHS FIFE 14.35% 41.26% 47.82% 58.33% 100.00%
NHS FORTH VALLEY 10.76% 41.98% 51.72% 61.34% 85.33%
NHS GRAMPIAN 20.63% 44.45% 57.69% 66.67% 100.00%
NHS GREATER GLASGOW & CLYDE 12.70% 43.20% 53.50% 66.36% 100.00%
NHS HIGHLAND 0.00% 23.85% 40.53% 52.76% 100.00%
NHS LANARKSHIRE 12.02% 30.77% 43.26% 55.88% 82.92%
NHS LOTHIAN 0.00% 29.02% 40.36% 49.91% 76.72%
NHS ORKNEY 39.28% 41.52% 46.76% 69.47% 100.00%
NHS SHETLAND 28.44% 55.47% 63.91% 80.67% 100.00%
NHS TAYSIDE 11.45% 43.26% 54.33% 60.89% 81.33%
NHS WESTERN ISLES 9.58% 40.29% 42.88% 52.17% 65.55%
SCOTLAND 36.42% 47.36% 59.93%
36
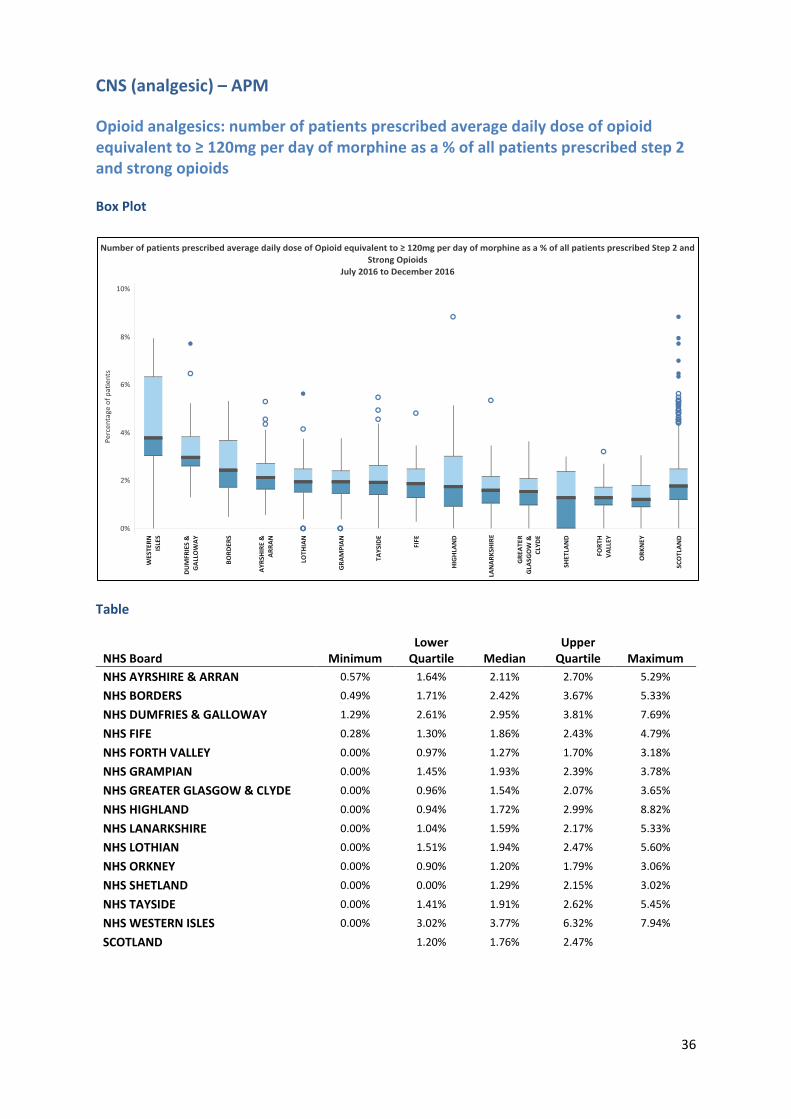
CNS (analgesic) – APM
Opioid analgesics: number of patients prescribed average daily dose of opioid equivalent to ≥ 120mg per day of morphine as a % of all patients prescribed step 2 and strong opioids
Box Plot
Table
NHS Board Minimum Lower
Quartile Median Upper
Quartile Maximum
NHS AYRSHIRE & ARRAN 0.57% 1.64% 2.11% 2.70% 5.29%
NHS BORDERS 0.49% 1.71% 2.42% 3.67% 5.33%
NHS DUMFRIES & GALLOWAY 1.29% 2.61% 2.95% 3.81% 7.69%
NHS FIFE 0.28% 1.30% 1.86% 2.43% 4.79%
NHS FORTH VALLEY 0.00% 0.97% 1.27% 1.70% 3.18%
NHS GRAMPIAN 0.00% 1.45% 1.93% 2.39% 3.78%
NHS GREATER GLASGOW & CLYDE 0.00% 0.96% 1.54% 2.07% 3.65%
NHS HIGHLAND 0.00% 0.94% 1.72% 2.99% 8.82%
NHS LANARKSHIRE 0.00% 1.04% 1.59% 2.17% 5.33%
NHS LOTHIAN 0.00% 1.51% 1.94% 2.47% 5.60%
NHS ORKNEY 0.00% 0.90% 1.20% 1.79% 3.06%
NHS SHETLAND 0.00% 0.00% 1.29% 2.15% 3.02%
NHS TAYSIDE 0.00% 1.41% 1.91% 2.62% 5.45%
NHS WESTERN ISLES 0.00% 3.02% 3.77% 6.32% 7.94%
SCOTLAND 1.20% 1.76% 2.47%

37
CNS (analgesic) – APM variant
Opioid analgesics: number of patients prescribed average daily dose of opioid
equivalent to ≥ 50mg per day of morphine as a % of all patients prescribed step 2
and strong opioids
Box Plot
Table
NHS Board Minimum Lower
Quartile Median Upper
Quartile Maximum
NHS AYRSHIRE & ARRAN 2.80% 5.75% 7.54% 8.41% 12.02%
NHS BORDERS 3.92% 6.91% 8.76% 10.83% 12.47%
NHS DUMFRIES & GALLOWAY 5.00% 7.59% 8.57% 10.97% 12.99%
NHS FIFE 3.77% 6.68% 7.71% 8.77% 10.65%
NHS FORTH VALLEY 1.69% 5.01% 6.15% 7.30% 9.20%
NHS GRAMPIAN 2.27% 5.94% 7.21% 8.15% 14.29%
NHS GREATER GLASGOW & CLYDE 0.00% 4.33% 5.57% 6.83% 11.36%
NHS HIGHLAND 0.00% 4.66% 6.16% 8.66% 27.27%
NHS LANARKSHIRE 2.15% 5.24% 6.22% 7.62% 12.02%
NHS LOTHIAN 0.97% 5.09% 6.46% 7.84% 12.62%
NHS ORKNEY 0.00% 4.03% 5.86% 6.15% 7.14%
NHS SHETLAND 1.79% 5.72% 7.20% 9.68% 11.02%
NHS TAYSIDE 5.13% 7.06% 7.87% 8.96% 14.26%
NHS WESTERN ISLES 2.70% 7.68% 10.63% 11.11% 16.84%
SCOTLAND 5.09% 6.61% 8.08%

38
CNS (analgesic) – APM
Opioid analgesics: number of patients prescribed strong opioids (including tramadol preparations) long term (>2 years) as a percentage of all patients prescribed strong opioids
Box Plot
Table
NHS Board Minimum Lower
Quartile Median Upper
Quartile Maximum
NHS AYRSHIRE & ARRAN 9.12% 21.48% 23.81% 27.05% 33.33%
NHS BORDERS 7.69% 19.92% 21.60% 23.57% 30.30%
NHS DUMFRIES & GALLOWAY 14.91% 19.77% 23.89% 27.43% 37.50%
NHS FIFE 12.25% 19.50% 22.52% 27.21% 35.62%
NHS FORTH VALLEY 6.85% 20.37% 23.52% 27.27% 41.38%
NHS GRAMPIAN 5.88% 17.48% 21.63% 24.83% 30.82%
NHS GREATER GLASGOW & CLYDE 8.51% 20.98% 24.40% 27.79% 41.90%
NHS HIGHLAND 0.00% 17.84% 21.78% 25.76% 39.73%
NHS LANARKSHIRE 16.53% 24.19% 26.09% 30.37% 43.28%
NHS LOTHIAN 5.32% 14.38% 17.42% 20.15% 28.78%
NHS ORKNEY 8.33% 15.36% 21.93% 23.65% 25.33%
NHS SHETLAND 4.65% 14.94% 19.21% 21.86% 23.01%
NHS TAYSIDE 13.79% 21.50% 24.42% 27.74% 37.38%
NHS WESTERN ISLES 13.19% 21.18% 22.49% 23.45% 24.37%
SCOTLAND 18.94% 22.88% 26.65%
39
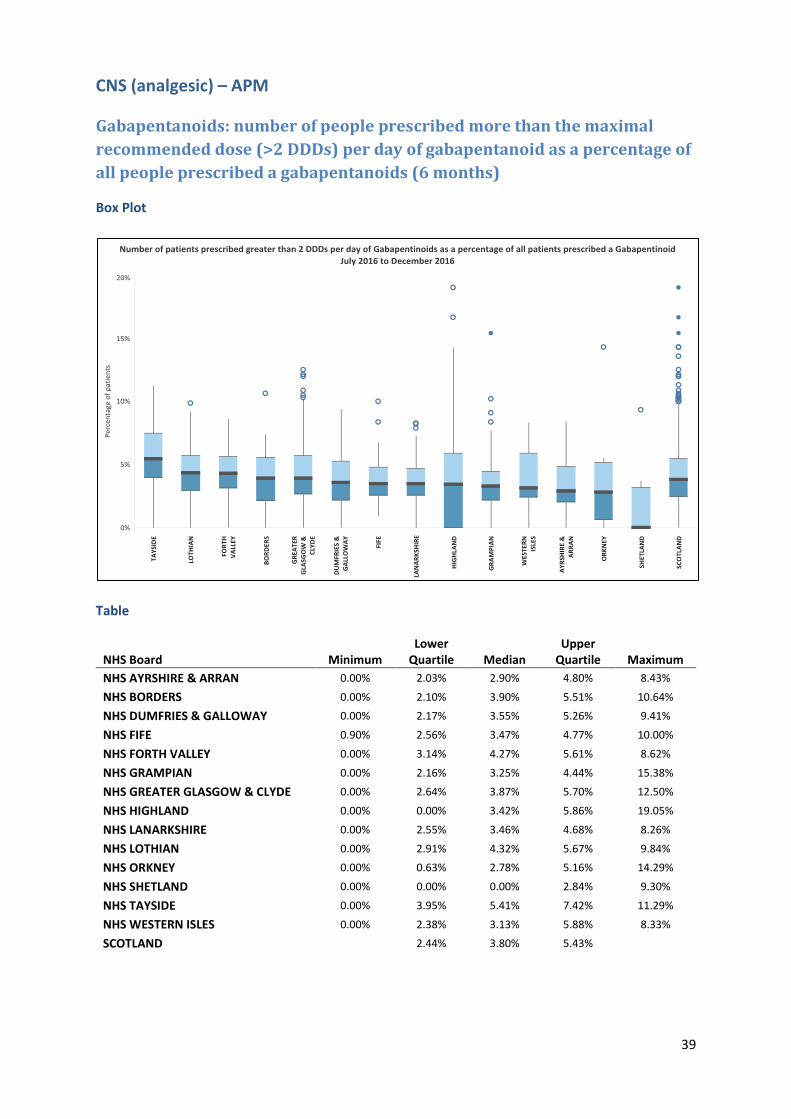
CNS (analgesic) – APM
Gabapentanoids: number of people prescribed more than the maximal
recommended dose (>2 DDDs) per day of gabapentanoid as a percentage of
all people prescribed a gabapentanoids (6 months)
Box Plot
Table
NHS Board Minimum Lower
Quartile Median Upper
Quartile Maximum
NHS AYRSHIRE & ARRAN 0.00% 2.03% 2.90% 4.80% 8.43%
NHS BORDERS 0.00% 2.10% 3.90% 5.51% 10.64%
NHS DUMFRIES & GALLOWAY 0.00% 2.17% 3.55% 5.26% 9.41%
NHS FIFE 0.90% 2.56% 3.47% 4.77% 10.00%
NHS FORTH VALLEY 0.00% 3.14% 4.27% 5.61% 8.62%
NHS GRAMPIAN 0.00% 2.16% 3.25% 4.44% 15.38%
NHS GREATER GLASGOW & CLYDE 0.00% 2.64% 3.87% 5.70% 12.50%
NHS HIGHLAND 0.00% 0.00% 3.42% 5.86% 19.05%
NHS LANARKSHIRE 0.00% 2.55% 3.46% 4.68% 8.26%
NHS LOTHIAN 0.00% 2.91% 4.32% 5.67% 9.84%
NHS ORKNEY 0.00% 0.63% 2.78% 5.16% 14.29%
NHS SHETLAND 0.00% 0.00% 0.00% 2.84% 9.30%
NHS TAYSIDE 0.00% 3.95% 5.41% 7.42% 11.29%
NHS WESTERN ISLES 0.00% 2.38% 3.13% 5.88% 8.33%
SCOTLAND 2.44% 3.80% 5.43%

40
CNS (adverse effects) - NTI
Antimuscarinics: drugs for urinary frequency, enuresis, and incontinence (BNF 4.7.2 excluding duloxetine and mirabegron) DDDs per 1,000 list size per day
Box Plot
Table
NHS Board Minimum Lower
Quartile Median Upper
Quartile Maximum
NHS AYRSHIRE & ARRAN 8.66 11.73 14.06 15.48 37.04
NHS BORDERS 7.23 10.63 15.03 17.77 24.41
NHS DUMFRIES & GALLOWAY 5.00 8.64 9.97 12.81 21.88
NHS FIFE 0.46 11.69 13.81 17.01 27.61
NHS FORTH VALLEY 1.24 10.87 15.68 17.78 23.63
NHS GRAMPIAN 2.55 9.63 12.09 13.46 21.62
NHS GREATER GLASGOW & CLYDE 1.81 8.93 11.40 13.86 27.08
NHS HIGHLAND 0.00 7.80 10.69 13.89 31.54
NHS LANARKSHIRE 2.15 9.50 11.61 13.91 27.20
NHS LOTHIAN 0.38 10.06 12.96 16.25 22.50
NHS ORKNEY 6.99 7.77 11.08 11.91 15.31
NHS SHETLAND 0.59 2.96 6.28 7.75 11.68
NHS TAYSIDE 8.12 10.95 13.74 16.19 27.31
NHS WESTERN ISLES 4.54 8.87 10.46 17.19 23.10
SCOTLAND 9.42 12.03 15.17

41
CNS (adverse effects) - NTI
Antimuscarinics: drugs for urinary frequency, enuresis, and incontinence (BNF 4.7.2
excluding duloxetine and mirabegron) DDDs per 1,000 weighted list size per day
Box Plots
Table
NHS Board Minimum Lower
Quartile Median Upper
Quartile Maximum
NHS AYRSHIRE & ARRAN 6.72 10.66 12.73 14.27 31.77
NHS BORDERS 9.00 11.16 15.49 17.62 24.30
NHS DUMFRIES & GALLOWAY 4.83 8.65 9.44 11.19 18.62
NHS FIFE 6.61 11.47 14.25 16.80 25.14
NHS FORTH VALLEY 3.34 12.14 15.08 17.57 26.38
NHS GRAMPIAN 4.94 11.49 13.36 15.15 23.84
NHS GREATER GLASGOW & CLYDE 2.16 7.89 10.06 12.39 22.15
NHS HIGHLAND 0.00 7.52 10.54 13.40 20.27
NHS LANARKSHIRE 1.88 8.51 10.86 13.10 21.46
NHS LOTHIAN 1.00 11.49 14.26 17.30 22.37
NHS ORKNEY 5.86 8.08 9.83 11.94 15.18
NHS SHETLAND 0.66 3.30 6.95 8.61 13.22
NHS TAYSIDE 8.16 11.90 13.77 16.45 27.81
NHS WESTERN ISLES 3.83 7.16 9.65 14.81 17.52
SCOTLAND 9.23 11.82 14.82

42
CNS (adverse effects) - APM
Anticholinergics: number of patients aged ≥75 prescribed >10 items of strong or very strong anticholinergics (mARS 3&2) in 12 months as a percentage of all people aged ≥75 years
Box Plot
Table
NHS Board Minimum Lower
Quartile Median Upper
Quartile Maximum
NHS AYRSHIRE & ARRAN 0.86% 4.81% 6.80% 8.69% 19.14%
NHS BORDERS 3.62% 5.92% 7.69% 11.50% 16.36%
NHS DUMFRIES & GALLOWAY 4.43% 6.88% 8.51% 10.30% 17.81%
NHS FIFE 3.28% 4.77% 5.93% 7.07% 17.28%
NHS FORTH VALLEY 2.32% 5.36% 7.46% 10.20% 14.06%
NHS GRAMPIAN 1.37% 4.32% 5.57% 6.67% 12.99%
NHS GREATER GLASGOW & CLYDE 1.91% 6.67% 9.20% 11.59% 22.79%
NHS HIGHLAND 0.00% 5.69% 7.69% 12.83% 33.33%
NHS LANARKSHIRE 1.96% 5.69% 7.86% 10.47% 19.61%
NHS LOTHIAN 0.00% 2.62% 3.92% 6.29% 13.36%
NHS ORKNEY 2.48% 3.78% 4.90% 6.66% 11.54%
NHS SHETLAND 4.05% 5.46% 8.17% 9.71% 10.91%
NHS TAYSIDE 2.89% 4.73% 6.06% 7.30% 16.39%
NHS WESTERN ISLES 4.88% 6.93% 11.30% 11.83% 15.04%
SCOTLAND 4.94% 6.97% 9.87%

43
Antibiotics - NTI
Antibiotics: total antibiotic script items per 1,000 list size per day
Box Plot
Table
NHS Board Minimum Lower
Quartile Median Upper
Quartile Maximum
NHS AYRSHIRE & ARRAN 1.37 1.80 2.06 2.31 3.10
NHS BORDERS 1.31 1.64 1.77 2.17 2.78
NHS DUMFRIES & GALLOWAY 1.42 1.75 2.00 2.31 2.97
NHS FIFE 0.17 1.47 1.74 2.17 2.76
NHS FORTH VALLEY 1.04 1.42 1.82 1.98 2.66
NHS GRAMPIAN 0.93 1.46 1.69 1.99 3.17
NHS GREATER GLASGOW & CLYDE 0.82 1.63 1.99 2.34 4.05
NHS HIGHLAND 0.64 1.43 1.70 2.01 3.34
NHS LANARKSHIRE 1.19 1.88 2.18 2.48 4.38
NHS LOTHIAN 0.59 1.38 1.63 1.87 2.71
NHS ORKNEY 1.06 1.44 1.50 1.64 1.72
NHS SHETLAND 1.61 1.74 1.84 1.97 2.04
NHS TAYSIDE 1.11 1.60 1.77 1.99 2.44
NHS WESTERN ISLES 1.51 1.66 1.83 1.92 2.25
SCOTLAND 1.58 1.85 2.18

44
Antibiotics - NTI
Antibiotics: 4C antibiotics script items per 1,000 list size per 100 days
Box Plot
Table
NHS Board Minimum Lower
Quartile Median Upper
Quartile Maximum
NHS AYRSHIRE & ARRAN 6.96 13.33 15.99 20.71 34.05
NHS BORDERS 10.41 14.79 17.66 22.50 32.40
NHS DUMFRIES & GALLOWAY 6.88 13.16 16.36 20.43 38.93
NHS FIFE 3.08 11.51 13.54 19.49 35.17
NHS FORTH VALLEY 3.28 10.75 13.97 17.96 28.59
NHS GRAMPIAN 2.97 8.61 11.35 15.21 37.43
NHS GREATER GLASGOW & CLYDE 2.36 9.52 12.30 16.72 33.45
NHS HIGHLAND 4.98 12.94 17.07 22.73 51.70
NHS LANARKSHIRE 5.19 11.74 14.81 19.47 40.49
NHS LOTHIAN 4.58 10.92 13.98 16.84 33.89
NHS ORKNEY 4.79 8.05 11.29 16.30 19.92
NHS SHETLAND 8.83 9.94 11.76 13.97 22.54
NHS TAYSIDE 3.46 6.62 7.73 9.89 17.47
NHS WESTERN ISLES 11.83 15.78 17.80 21.77 28.36
SCOTLAND 10.05 13.77 17.77

45
Antibiotics - NTI
Antibiotics: UTI antibiotics (trimethoprim/nitrofurantoin) script items per 1,000 list size per day
Box Plot
Table
NHS Board Minimum Lower
Quartile Median Upper
Quartile Maximum
NHS AYRSHIRE & ARRAN 0.25 0.34 0.39 0.45 0.60
NHS BORDERS 0.22 0.28 0.31 0.34 0.43
NHS DUMFRIES & GALLOWAY 0.21 0.35 0.39 0.47 0.65
NHS FIFE 0.03 0.28 0.32 0.39 0.55
NHS FORTH VALLEY 0.14 0.26 0.33 0.37 0.52
NHS GRAMPIAN 0.13 0.29 0.33 0.38 0.67
NHS GREATER GLASGOW & CLYDE 0.10 0.31 0.38 0.44 1.00
NHS HIGHLAND 0.06 0.28 0.33 0.43 0.89
NHS LANARKSHIRE 0.19 0.31 0.35 0.40 0.96
NHS LOTHIAN 0.08 0.25 0.30 0.35 0.46
NHS ORKNEY 0.24 0.29 0.35 0.41 0.50
NHS SHETLAND 0.22 0.35 0.39 0.52 0.61
NHS TAYSIDE 0.20 0.29 0.34 0.38 0.50
NHS WESTERN ISLES 0.30 0.39 0.40 0.47 0.57
SCOTLAND 0.29 0.35 0.41

46
Antibiotics - APM
Antibiotics: number of people prescribed > 4 antibiotics per annum per 1,000 list size
Box Plot
Table
NHS Board Minimum Lower
Quartile Median Upper
Quartile Maximum
NHS AYRSHIRE & ARRAN 17.41 22.57 28.29 34.59 57.64
NHS BORDERS 18.64 22.09 24.55 32.37 37.99
NHS DUMFRIES & GALLOWAY 11.98 22.69 25.52 30.25 41.45
NHS FIFE 11.29 19.39 22.49 27.87 46.52
NHS FORTH VALLEY 9.09 17.98 23.34 27.74 41.18
NHS GRAMPIAN 5.75 17.31 19.84 24.05 49.20
NHS GREATER GLASGOW & CLYDE 8.64 21.58 27.51 34.13 57.64
NHS HIGHLAND 5.78 17.96 22.26 28.62 44.53
NHS LANARKSHIRE 16.44 24.20 28.57 34.50 80.78
NHS LOTHIAN 3.03 17.92 22.85 26.35 40.07
NHS ORKNEY 8.66 16.37 18.62 21.19 24.83
NHS SHETLAND 12.13 18.52 26.97 29.70 41.88
NHS TAYSIDE 11.27 21.10 25.03 28.10 45.54
NHS WESTERN ISLES 21.93 26.07 28.04 28.99 42.55
SCOTLAND 20.00 25.07 31.01

47
Antibiotics - APM
Antibiotics: number of adult women prescribed a 3-day course of acute UTI antibiotics as a percentage of all adult women prescribed acute UTI antibiotics
NHS Board Minimum Lower
Quartile Median Upper
Quartile Maximum
NHS AYRSHIRE & ARRAN 0.00% 53.43% 63.64% 72.88% 87.50%
NHS BORDERS 13.89% 50.74% 63.69% 75.36% 88.89%
NHS DUMFRIES & GALLOWAY 3.23% 22.31% 44.19% 58.18% 81.82%
NHS FIFE 0.00% 39.39% 55.36% 76.74% 89.58%
NHS FORTH VALLEY 27.78% 63.40% 74.60% 81.48% 96.67%
NHS GRAMPIAN 4.21% 40.58% 57.81% 68.66% 85.00%
NHS GREATER GLASGOW & CLYDE 9.09% 64.67% 74.18% 81.20% 100.00%
NHS HIGHLAND 0.00% 37.94% 53.11% 68.64% 100.00%
NHS LANARKSHIRE 0.00% 43.40% 65.22% 76.88% 89.43%
NHS LOTHIAN 31.17% 66.29% 76.24% 84.00% 96.49%
NHS ORKNEY 21.21% 28.61% 47.22% 56.05% 100.00%
NHS SHETLAND 20.00% 43.39% 50.35% 64.69% 67.78%
NHS TAYSIDE 8.47% 64.24% 76.12% 82.03% 94.95%
NHS WESTERN ISLES 7.69% 35.29% 71.00% 82.35% 92.31%
SCOTLAND 50.00% 68.42% 78.95%

48
Antidiabetics - NTI
Antidiabetic Drugs: metformin as percentage of all anti-diabetic drugs (DDDs)
Box Plot
Table
NHS Board Minimum Lower
Quartile Median Upper
Quartile Maximum
NHS AYRSHIRE & ARRAN 37.57% 46.24% 50.26% 53.51% 62.12%
NHS BORDERS 43.92% 46.86% 48.75% 52.11% 62.31%
NHS DUMFRIES & GALLOWAY 32.86% 49.26% 52.27% 56.73% 64.97%
NHS FIFE 0.00% 45.66% 48.83% 53.52% 62.00%
NHS FORTH VALLEY 30.10% 40.63% 44.30% 47.05% 55.79%
NHS GRAMPIAN 32.99% 41.52% 44.39% 48.89% 60.43%
NHS GREATER GLASGOW & CLYDE 29.82% 42.76% 45.98% 48.79% 64.25%
NHS HIGHLAND 33.15% 46.75% 51.29% 57.34% 68.63%
NHS LANARKSHIRE 34.95% 42.77% 46.72% 49.30% 58.07%
NHS LOTHIAN 31.11% 47.46% 51.41% 55.01% 68.90%
NHS ORKNEY 41.77% 46.72% 49.40% 52.90% 64.55%
NHS SHETLAND 41.97% 48.01% 54.44% 62.57% 76.37%
NHS TAYSIDE 37.61% 46.38% 49.96% 53.12% 61.13%
NHS WESTERN ISLES 28.94% 49.25% 50.75% 51.62% 65.90%
SCOTLAND 44.07% 47.77% 52.16%

49
Antidiabetics - APM
Self-Monitoring of Blood Glucose (SMBG): average cost per day of blood glucose test strips per patient prescribed antidiabetic drugs and/or insulins
Box Plot
Table
NHS Board Minimum Lower
Quartile Median Upper
Quartile Maximum
NHS AYRSHIRE & ARRAN £0.12 £0.16 £0.18 £0.20 £0.27
NHS BORDERS £0.13 £0.23 £0.25 £0.29 £0.46
NHS DUMFRIES & GALLOWAY £0.12 £0.19 £0.21 £0.23 £0.38
NHS FIFE £0.00 £0.18 £0.20 £0.23 £0.36
NHS FORTH VALLEY £0.12 £0.19 £0.22 £0.26 £0.53
NHS GRAMPIAN £0.16 £0.27 £0.30 £0.34 £0.60
NHS GREATER GLASGOW & CLYDE £0.03 £0.15 £0.18 £0.22 £0.41
NHS HIGHLAND £0.08 £0.21 £0.27 £0.33 £0.45
NHS LANARKSHIRE £0.06 £0.18 £0.22 £0.26 £0.34
NHS LOTHIAN £0.18 £0.26 £0.31 £0.33 £0.80
NHS ORKNEY £0.10 £0.21 £0.25 £0.34 £0.50
NHS SHETLAND £0.15 £0.31 £0.33 £0.39 £0.48
NHS TAYSIDE £0.13 £0.19 £0.22 £0.25 £0.32
NHS WESTERN ISLES £0.23 £0.37 £0.37 £0.39 £0.47
SCOTLAND £0.18 £0.23 £0.29

50
Antidiabetics - APM
Self-Monitoring of Blood Glucose (SMBG): number of patients prescribed blood
glucose test strips who are not prescribed treatments for diabetes (insulins and/or
antidiabetic drugs) or are only prescribed metformin as a percentage of all patients
prescribed blood glucose test strips
Box Plot
Table
NHS Board Minimum Lower
Quartile Median Upper
Quartile Maximum
NHS AYRSHIRE & ARRAN 2.70% 7.36% 9.71% 13.35% 21.05%
NHS BORDERS 0.00% 7.14% 10.81% 13.33% 26.67%
NHS DUMFRIES & GALLOWAY 3.45% 6.94% 10.26% 13.33% 30.77%
NHS FIFE 0.00% 6.25% 7.94% 8.99% 20.00%
NHS FORTH VALLEY 2.56% 7.27% 9.68% 14.14% 20.00%
NHS GRAMPIAN 0.00% 9.80% 11.94% 15.93% 28.24%
NHS GREATER GLASGOW & CLYDE 0.00% 5.88% 9.28% 12.63% 31.08%
NHS HIGHLAND 0.00% 4.55% 8.50% 12.25% 33.33%
NHS LANARKSHIRE 0.00% 4.88% 7.18% 11.29% 35.12%
NHS LOTHIAN 0.00% 8.04% 11.11% 14.29% 30.00%
NHS ORKNEY 0.00% 10.66% 13.56% 15.25% 20.51%
NHS SHETLAND 0.00% 5.77% 11.31% 18.34% 26.09%
NHS TAYSIDE 2.25% 7.82% 9.77% 11.66% 23.29%
NHS WESTERN ISLES 0.00% 7.14% 10.00% 14.89% 24.24%
SCOTLAND 6.56% 9.52% 13.21%

51
Antidiabetics - APM
Self-Monitoring of Blood Glucose (SMBG): number of patients prescribed insulin
not prescribed blood glucose test strips as a percentage of patients prescribed
insulin
Box Plot
Table
NHS Board Minimum Lower
Quartile Median Upper
Quartile Maximum
NHS AYRSHIRE & ARRAN 13.24% 20.50% 25.32% 28.89% 40.91%
NHS BORDERS 7.69% 11.01% 14.29% 17.91% 26.09%
NHS DUMFRIES & GALLOWAY 0.00% 15.00% 18.28% 24.44% 31.25%
NHS FIFE 5.56% 19.78% 24.07% 27.03% 100.00%
NHS FORTH VALLEY 5.00% 17.91% 21.31% 25.00% 41.67%
NHS GRAMPIAN 0.00% 15.02% 17.26% 22.40% 30.77%
NHS GREATER GLASGOW & CLYDE 4.35% 17.65% 21.70% 27.93% 55.56%
NHS HIGHLAND 0.00% 13.12% 18.79% 24.06% 50.00%
NHS LANARKSHIRE 0.00% 16.60% 20.50% 23.89% 55.56%
NHS LOTHIAN 7.89% 16.67% 20.37% 24.32% 35.71%
NHS ORKNEY 10.53% 23.47% 29.03% 31.62% 100.00%
NHS SHETLAND 0.00% 10.79% 13.89% 18.23% 26.67%
NHS TAYSIDE 13.04% 19.71% 22.12% 27.37% 37.04%
NHS WESTERN ISLES 0.00% 6.67% 14.86% 20.48% 31.25%
SCOTLAND 16.67% 20.83% 25.53%

52
Musculoskeletal - NTI
NSAIDs: DDDs per 1,000 list size per day
Box Plot
Table
NHS Board Minimum Lower
Quartile Median Upper
Quartile Maximum
NHS AYRSHIRE & ARRAN 20.76 36.19 44.59 57.04 91.94
NHS BORDERS 15.88 22.68 31.89 38.06 52.78
NHS DUMFRIES & GALLOWAY 17.43 25.31 36.68 46.75 81.89
NHS FIFE 3.10 24.39 32.77 42.30 72.94
NHS FORTH VALLEY 5.64 27.03 32.70 42.98 68.83
NHS GRAMPIAN 9.82 26.72 33.93 44.00 72.98
NHS GREATER GLASGOW & CLYDE 9.92 29.92 38.95 51.23 82.90
NHS HIGHLAND 14.24 28.31 33.32 42.53 92.49
NHS LANARKSHIRE 21.74 34.11 41.13 50.58 82.65
NHS LOTHIAN 2.67 14.69 20.30 28.33 57.82
NHS ORKNEY 26.42 33.49 35.50 44.51 54.80
NHS SHETLAND 22.46 33.64 36.60 43.65 60.41
NHS TAYSIDE 10.24 24.25 29.22 34.23 43.68
NHS WESTERN ISLES 19.00 37.96 41.20 52.12 59.90
SCOTLAND 26.20 35.02 45.14

53
Musculoskeletal - NTI
NSAIDs: DDDs per 1,000 weighted list size per day
Box Plot
Table
NHS Board Minimum Lower
Quartile Median Upper
Quartile Maximum
NHS AYRSHIRE & ARRAN 15.54 33.61 43.62 54.07 89.08
NHS BORDERS 16.17 25.40 31.88 40.30 54.60
NHS DUMFRIES & GALLOWAY 17.18 26.05 35.38 42.00 75.85
NHS FIFE 15.47 24.92 34.47 43.34 69.07
NHS FORTH VALLEY 15.22 27.69 34.82 42.70 76.43
NHS GRAMPIAN 19.03 31.51 39.82 47.66 74.95
NHS GREATER GLASGOW & CLYDE 11.77 28.96 34.01 43.03 78.96
NHS HIGHLAND 13.93 26.57 32.68 40.62 91.03
NHS LANARKSHIRE 20.47 31.12 38.00 46.97 67.51
NHS LOTHIAN 6.95 16.47 22.17 29.82 55.13
NHS ORKNEY 27.34 30.45 31.59 45.34 55.61
NHS SHETLAND 23.99 38.95 43.70 50.90 55.02
NHS TAYSIDE 11.29 24.25 30.02 35.10 47.83
NHS WESTERN ISLES 16.01 32.66 33.86 48.38 54.55
SCOTLAND 26.25 33.70 43.02

54
Musculoskeletal – APM
NSAIDs: NSAID prescribing to patients aged ≥65 years prescribed an ACE inhibitor/angiotensin receptor blocker and a diuretic as a percentage of all people aged ≥65 years
Box Plot
Table
NHS Board Minimum Lower
Quartile Median Upper
Quartile Maximum
NHS AYRSHIRE & ARRAN 0.00% 0.47% 0.75% 1.35% 4.67%
NHS BORDERS 0.00% 0.20% 0.28% 0.62% 1.26%
NHS DUMFRIES & GALLOWAY 0.00% 0.33% 0.59% 0.76% 2.28%
NHS FIFE 0.00% 0.26% 0.58% 0.96% 2.10%
NHS FORTH VALLEY 0.00% 0.15% 0.32% 0.66% 1.99%
NHS GRAMPIAN 0.00% 0.40% 0.68% 0.92% 1.96%
NHS GREATER GLASGOW & CLYDE 0.00% 0.43% 0.77% 1.11% 2.73%
NHS HIGHLAND 0.00% 0.27% 0.51% 0.96% 2.75%
NHS LANARKSHIRE 0.00% 0.31% 0.50% 0.86% 2.72%
NHS LOTHIAN 0.00% 0.25% 0.35% 0.66% 1.80%
NHS ORKNEY 0.00% 0.58% 0.69% 1.09% 1.42%
NHS SHETLAND 0.00% 0.31% 1.15% 1.56% 4.03%
NHS TAYSIDE 0.00% 0.23% 0.42% 0.66% 1.46%
NHS WESTERN ISLES 0.35% 0.50% 1.27% 1.72% 2.13%
SCOTLAND 0.30% 0.55% 0.92%

55
Musculoskeletal – APM
NSAIDs: NSAID prescribing to patients aged ≥65 years prescribed an antiplatelet without gastroprotection as a percentage of all people aged ≥65 years
Box Plot
Table
NHS Board Minimum Lower
Quartile Median Upper
Quartile Maximum
NHS AYRSHIRE & ARRAN 0.00% 0.15% 0.25% 0.41% 2.00%
NHS BORDERS 0.00% 0.00% 0.12% 0.25% 0.63%
NHS DUMFRIES & GALLOWAY 0.00% 0.16% 0.36% 0.48% 1.79%
NHS FIFE 0.00% 0.06% 0.16% 0.28% 0.70%
NHS FORTH VALLEY 0.00% 0.00% 0.15% 0.23% 0.83%
NHS GRAMPIAN 0.00% 0.18% 0.29% 0.45% 3.90%
NHS GREATER GLASGOW & CLYDE 0.00% 0.11% 0.25% 0.48% 3.87%
NHS HIGHLAND 0.00% 0.00% 0.23% 0.39% 2.13%
NHS LANARKSHIRE 0.00% 0.10% 0.24% 0.34% 0.86%
NHS LOTHIAN 0.00% 0.06% 0.15% 0.25% 0.98%
NHS ORKNEY 0.00% 0.00% 0.55% 0.60% 0.96%
NHS SHETLAND 0.00% 0.08% 0.42% 0.59% 1.10%
NHS TAYSIDE 0.00% 0.05% 0.10% 0.18% 0.61%
NHS WESTERN ISLES 0.00% 0.07% 0.46% 0.53% 1.40%
SCOTLAND 0.07% 0.21% 0.38%

56
Musculoskeletal – APM
NSAIDs: NSAID prescribing to patients aged ≥75 years without gastroprotection as a percentage of all people aged ≥75 years
Box Plot
Table
NHS Board Minimum Lower
Quartile Median Upper
Quartile Maximum
NHS AYRSHIRE & ARRAN 0.00% 0.74% 1.29% 2.23% 5.78%
NHS BORDERS 0.00% 0.31% 0.55% 0.96% 3.33%
NHS DUMFRIES & GALLOWAY 0.00% 0.86% 1.83% 2.66% 6.49%
NHS FIFE 0.00% 0.34% 0.63% 1.23% 5.34%
NHS FORTH VALLEY 0.00% 0.15% 0.49% 0.94% 3.05%
NHS GRAMPIAN 0.00% 0.90% 1.45% 2.11% 11.11%
NHS GREATER GLASGOW & CLYDE 0.00% 0.40% 0.87% 1.64% 11.11%
NHS HIGHLAND 0.00% 0.67% 1.35% 2.12% 6.98%
NHS LANARKSHIRE 0.00% 0.56% 1.06% 1.67% 6.25%
NHS LOTHIAN 0.00% 0.46% 0.74% 1.30% 4.49%
NHS ORKNEY 0.00% 0.20% 1.02% 2.62% 3.55%
NHS SHETLAND 0.00% 0.11% 1.10% 2.33% 3.29%
NHS TAYSIDE 0.00% 0.35% 0.67% 0.98% 3.98%
NHS WESTERN ISLES 0.76% 0.87% 1.47% 2.40% 9.52%
SCOTLAND 0.45% 0.93% 1.66%

57
Musculoskeletal – APM
NSAIDs: NSAID prescription to patients prescribed an oral anticoagulant without gastroprotection as a percentage of all patients prescribed an oral anticoagulant
Box Plot
Table
NHS Board Minimum Lower
Quartile Median Upper
Quartile Maximum
NHS AYRSHIRE & ARRAN 0.00% 0.00% 0.00% 0.10% 0.42%
NHS BORDERS 0.00% 0.00% 0.00% 0.07% 0.30%
NHS DUMFRIES & GALLOWAY 0.00% 0.00% 0.00% 0.20% 0.46%
NHS FIFE 0.00% 0.00% 0.00% 0.10% 0.39%
NHS FORTH VALLEY 0.00% 0.00% 0.00% 0.07% 0.51%
NHS GRAMPIAN 0.00% 0.00% 0.00% 0.12% 0.43%
NHS GREATER GLASGOW & CLYDE 0.00% 0.00% 0.00% 0.10% 0.47%
NHS HIGHLAND 0.00% 0.00% 0.00% 0.15% 1.27%
NHS LANARKSHIRE 0.00% 0.00% 0.00% 0.00% 0.40%
NHS LOTHIAN 0.00% 0.00% 0.00% 0.09% 0.47%
NHS ORKNEY 0.00% 0.00% 0.00% 0.13% 0.24%
NHS SHETLAND 0.00% 0.00% 0.00% 0.00% 0.51%
NHS TAYSIDE 0.00% 0.00% 0.00% 0.10% 0.24%
NHS WESTERN ISLES 0.00% 0.00% 0.00% 0.30% 1.04%
SCOTLAND 0.00% 0.00% 0.10%

58
Wound Management - NTI
Antimicrobial Wound Products: antimicrobial wound products as percentage of total wound products (items)
Box Plot
Table
NHS Board Minimum Lower
Quartile Median Upper
Quartile Maximum
NHS AYRSHIRE & ARRAN 7.61% 15.45% 19.21% 21.72% 35.71%
NHS BORDERS 4.17% 8.44% 9.95% 13.71% 24.68%
NHS DUMFRIES & GALLOWAY 4.17% 11.21% 13.13% 16.20% 24.62%
NHS FIFE 0.00% 9.17% 11.26% 14.19% 21.05%
NHS FORTH VALLEY 0.00% 15.19% 18.75% 22.27% 36.07%
NHS GRAMPIAN 9.02% 14.40% 17.93% 20.68% 30.00%
NHS GREATER GLASGOW & CLYDE 0.00% 10.24% 14.58% 19.55% 33.33%
NHS HIGHLAND 0.00% 6.35% 12.16% 18.68% 50.00%
NHS LANARKSHIRE 0.00% 8.52% 11.97% 15.80% 25.29%
NHS LOTHIAN 0.00% 5.56% 8.57% 11.11% 27.27%
NHS ORKNEY 9.52% 14.19% 17.20% 19.71% 28.57%
NHS SHETLAND 1.14% 8.42% 13.15% 18.61% 36.54%
NHS TAYSIDE 0.00% 8.90% 10.73% 14.60% 23.02%
NHS WESTERN ISLES 7.69% 16.54% 16.99% 18.15% 29.58%
SCOTLAND 9.09% 13.52% 17.86%