National Survey of School Counselors and …media.collegeboard.com/digitalServices/pdf/nosca/...The...
96
HART RESEARCH ASSOCIATES The College Board National Office for School Counselor Advocacy (NOSCA) The College Board 2012 National Survey of School Counselors and Administrators Report on Survey Findings: Barriers and Supports to School Counselor Success
Transcript of National Survey of School Counselors and …media.collegeboard.com/digitalServices/pdf/nosca/...The...
HARTRESEARCHA S S O C I A T E S
The College Board National Office for School Counselor Advocacy (NOSCA)
The College Board 2012 National Survey of School Counselors and AdministratorsReport on Survey Findings: Barriers and Supports to School Counselor Success
About the Kresge Foundation
The Kresge Foundation is a $2.9 billion private, national foundation that seeks to influence the quality of life for future generations through its support of nonprofit organizations in six fields of interest: arts and culture, community development, education, the environment, health, and human services. Fostering greater access to and success in postsecondary education for low-income, minority and first-generation college students is the focus of Kresge’s Education grantmaking. In 2010, Kresge awarded more than $23 million in grants to support higher education in the United States and South Africa.
For more information, please visit www.kresge.org.
The Annual Survey of School Counselors was made possible with support from the Kresge Foundation. The College Board Advocacy & Policy Center is grateful for the Kresge Foundation’s commitment to this important work.
The College Board 2012 National Survey of School Counselors and AdministratorsReport on Survey Findings: Barriers and Supports to School Counselor Success
Produced for the College Board Advocacy & Policy Center by Peter D. Hart Research Associates
October 2012
HARTRESEARCHA S S O C I A T E S
2 | Report on Survey Findings
AcknowledgmentsThe College Board Advocacy & Policy Center and its National Office for School Counselor Advocacy, together with Civic Enterprises and Peter D. Hart Research Associates, would like to give special thanks to everyone who worked to author and create this outstanding report. Specifically, we would like to thank each of the following for the contributions and assistance in making this report a reality, including: Patricia Martin, assistant vice president at the College Board Advocacy & Policy Center National Office for School Counselor Advocacy (NOSCA); Vivian Lee, senior director at the College Board Advocacy & Policy Center National Office for School Counselor Advocacy (NOSCA); the remaining NOSCA team; John Bridgeland, president and CEO at Civic Enterprises; Mary Bruce, education policy analyst at Civic Enterprises; Geoff Garin, president of Hart Research; Allan Rivlin, partner at Hart Research; Corrie Hunt, senior analyst at Hart Research; and James Hazzard, assistant analyst at Hart Research.
The College Board, together with Civic Enterprises and Peter D. Hart Research Associates, would like to thank the more than 3,300 educators, including counselors and administrators, who participated in the national survey and focus groups and who shared their thoughts and reflections with courage and honesty.
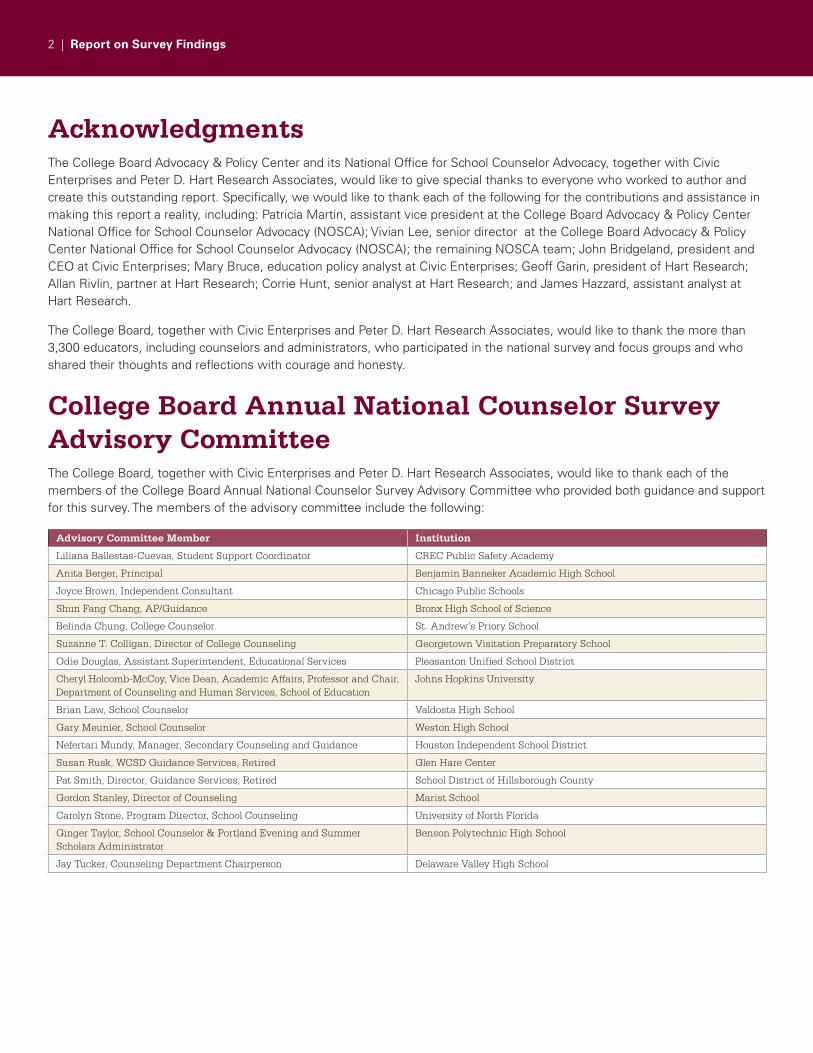
College Board Annual National Counselor Survey Advisory CommitteeThe College Board, together with Civic Enterprises and Peter D. Hart Research Associates, would like to thank each of the members of the College Board Annual National Counselor Survey Advisory Committee who provided both guidance and support for this survey. The members of the advisory committee include the following:
Advisory Committee Member Institution
Liliana Ballestas-Cuevas, Student Support Coordinator CREC Public Safety Academy
Anita Berger, Principal Benjamin Banneker Academic High School
Joyce Brown, Independent Consultant Chicago Public Schools
Shun Fang Chang, AP/Guidance Bronx High School of Science
Belinda Chung, College Counselor St. Andrew’s Priory School
Suzanne T. Colligan, Director of College Counseling Georgetown Visitation Preparatory School
Odie Douglas, Assistant Superintendent, Educational Services Pleasanton Unified School District
Cheryl Holcomb-McCoy, Vice Dean, Academic Affairs, Professor and Chair, Department of Counseling and Human Services, School of Education
Johns Hopkins University
Brian Law, School Counselor Valdosta High School
Gary Meunier, School Counselor Weston High School
Nefertari Mundy, Manager, Secondary Counseling and Guidance Houston Independent School District
Susan Rusk, WCSD Guidance Services, Retired Glen Hare Center
Pat Smith, Director, Guidance Services, Retired School District of Hillsborough County
Gordon Stanley, Director of Counseling Marist School
Carolyn Stone, Program Director, School Counseling University of North Florida
Ginger Taylor, School Counselor & Portland Evening and Summer Scholars Administrator
Benson Polytechnic High School
Jay Tucker, Counseling Department Chairperson Delaware Valley High School
The College Board National Survey of School Counselors and Administrators 2012 | 3
The Eight Components of a College and Career Readiness Approach to Counseling and Specific Example ActivitiesCounselors express strong personal commitment to the eight components and example activities but feel they achieve only limited success.
• A large majority of school counselors say that they are personally committed to each of the eight components developed by NOSCA as indicated by a rating of eight or higher on a zero-to-10 scale. High school counselors show the most personal commitment to advancing students’ academic planning for college and career readiness (92%), providing early and ongoing information about college and career exploration and selection processes (91%), and ensuring that students and families have an early and ongoing understanding of college and career admission processes (90%).
• Although middle school counselors are devoted to setting their students up to succeed in college and career, they express lower levels of commitment to the eight components than their high school counterparts. Compared with high school counselors, middle school counselors are notably less committed to preparing students for college and career admission processes and college affordability planning.
• Counselors by and large reinforce their commitment to the broad components with a strong personal commitment to concrete and specific examples of activities for achieving each component. However, on several specific example activities, fewer counselors rate their personal commitment as an eight or higher on a zero-to-10 scale than they rated their commitment to the broader components. High school counselors showed relatively lower levels of commitment on working with teachers to improve recommendations and incorporate elements of college applications into their course work (60%), providing test preparation to students (57%), and using student FAFSA completion data to monitor application progress and to review aid reports (44%).
• School counselors’ self-reported personal success in achieving each of the eight components falls short of their personal commitment. They see the largest disparity between their own commitment (81%) and success (58%) in helping students transition from high school graduation to college enrollment.
A majority of school counselors say they need further training and greater resource support to achieve full success in the eight components and to ensure that all students graduate from high school ready to succeed in college and career.
• Before counselors can implement these components effectively, they must acquire the requisite training and knowledge base. At least 40% — and in many cases
Introduction: What Supports and What Are the Barriers to Counselor and Student Success?The Second College Board National Office for School Counselor Advocacy (NOSCA) National Survey of School Counselors builds on the 2011 National Survey in many important ways. Most notably, it adds to the perspectives of high school and middle school counselors by bringing in the perspectives of school administrators (principals, vice principals, and assistant principals), but the story is far less one of contrasting views and differing priorities than one of convergent views and shared priorities. School counselors and school administrators in public and private middle schools and high schools in all 50 states completed surveys, offering results that are nationally representative. Where responses differ among groups or between counselors and administrators, they are fully noted, but in most cases the differences are ones of degree. On the whole, counselors and administrators identify the same challenges and share the same goals.
The 2011 survey uncovered strong support for a broad range of goals for student counseling but also identified important gaps in counselors’ assessments of the success their schools were experiencing in reaching those goals. The goal of this survey is to identify the barriers to success, as well as the supports and to identify strategies for improvement. Rather than finding a single breakdown in the path to success, the survey reveals a more nuanced picture in which counselors are more committed to some specific strategies than others, gaps in training are identified for some specific areas, and lack of resources help explain some areas where success is judged to be more limited. The following overview presents key findings from the report.
4 | Report on Survey Findings
more than half — of school counselors say that they need some or extensive additional training for each of the eight components. The largest training deficits appear in transitioning students from high school graduation to college enrollment and college affordability planning.
• While many counselors want to receive further training in the broader eight components, high school counselors overall fare better when it comes to training in the specific example items. On all but one of the example action items, a majority of high school counselors say that they are trained well enough to do each activity effectively. High school and middle school counselors alike feel the least trained in the specific example item for “college affordability planning.”
• A strong relationship exists between the availability of resources high schools have for supporting the example strategies associated with the eight components and high schools’ success in ensuring that the activities happen effectively enough to help all students succeed. Even after controlling for high school counselors’ commitment, training, administrative support, and district support, resources are the strongest and most significant predictor of success in accomplishing the specific activities.
Despite college affordability planning being a major part of the college and career readiness process, the most problematic specific activity for counselors is using student FAFSA data to monitor application progress and ensure that students receive and review aid reports.
• The specific example item for high school counselors’ college affordability planning, “using student FAFSA completion data to monitor application completion, to make application updates and corrections, and to ensure that students receive and review aid reports” scored lowest among counselors’ ratings of specific activities for personal commitment, training, and available resources.
• In contrast, high school counselors at disadvantaged schools are ready to lead the way in showing other counselors and schools how to more effectively use student FAFSA data to monitor application progress and review aid reports. High school counselors at schools with at least 75% of the student body on free or reduced-price lunch report greater success, stronger commitment, more training, and more administrative and district support for achieving this activity.
Counselors in disadvantaged schools are in greater need of more support from their school districts, more training, and more resources in order to accomplish the eight components.
• With the exception of the specific example activity for college affordability planning, counselors at schools with at least 75% of the student body on free or reduced-price lunch see lower levels of support from their school districts, report greater need for further training, and report fewer resources for supporting most of the eight components and the other seven specific example activities.
• High school counselors in disadvantaged schools particularly struggle when it comes to ensuring that all students have a program of study that meets requirements for in-state universities or creates pathways to industry and technology licenses and certifications. This critical part of preparing students for college and career success warrants further attention from school administrators and districts in terms of providing more training and resources to counselors in disadvantaged schools.
Comparing Counselors’ and Administrators’ Views on the Education System and Implementing a College and Career Readiness Approach to CounselingSchool counselors and administrators share the same vision of an ideal education system but administrators evaluate their school more favorably than do counselors on the degree to which reality matches their ideals.
• School administrators (93%) overwhelmingly agree with school counselors in the 2011 survey (92%) that the ideal mission of the education system should be “ensuring that all students complete the 12th grade ready to succeed in college and career,” as indicated by a rating of eight or higher on a zero-to-10 scale.
• Compared with school counselors, however, administrators see their school as far more successful in achieving these goals. While fewer than half (47%) of counselors say that “ensuring that all students complete the 12th grade ready to succeed in college and career” fits the reality of their school, fully 71% of school administrators (a difference of 24 points) say this fits the reality of their school.
The College Board National Survey of School Counselors and Administrators 2012 | 5
Administrators support counselors’ adopting the eight components and specific activities and want counselors to take the lead in implementing a college and career readiness counseling agenda.
• More than 3 in 4 (76%) school administrators say they can see themselves committing to the approach outlined in the eight components and their specific activities.
• On each of the individual eight components, at least 7 in 10 school administrators rate themselves as an eight or higher on a zero-to-10 scale regarding the extent to which they support school counselors in their school incorporating each of the eight components into their counseling practice.
• High school administrators also overwhelmingly support their counselors engaging in the specific example activities associated with the eight components, to a degree much higher, in fact, than the counselors estimate from their administrators.
• Virtually all school administrators (98%) agree that “it is important for school counselors to exercise leadership in advocating for students’ access to rigorous academic preparation, as well as other college and career readiness counseling, even if others in the school do not see counselors in a leadership role.”
Counselor AccountabilityInconsistency characterizes current accountability systems for school counselors.
• One in 5 (19%) counselors admits that they do not currently have a system of accountability set up for counselors in their school. Slightly more than half (53%) say that the system of accountability in their school is focused more on student outcomes than counseling activities, and 23% say their school focuses on both student outcomes and counseling activities about equally. Only 5% say the system of accountability in their school is more focused on counseling activities.
• Despite reporting that their accountability systems are more focused on student outcomes, counselors are far more likely to choose examples of counseling activities than student outcomes when asked about specific measures. The top three measures counselors most commonly say they are held accountable to are not
student-outcome–centric: school counseling program development (74% of counselors), administrative and clerical tasks (69%), and coordinating tests (60%).
Counselors are more likely to support accountability measures related to practicing specific example activities associated with the eight components than specific measures of student outcome.
• With the exception of using FAFSA completion data to monitor students’ application progress and review aid reports (receiving only 54% of high school counselors’ support), at least two-thirds of counselors say that every specific example activity is a fair way to assess counselor effectiveness.
• The top three student outcome measures identified by high school counselors as a fair way to assess counselor effectiveness are transcript audits of graduation readiness (60%), completion of a college-prep sequence of courses (59%), and students’ gaining access to advanced classes and tests (58%). Middle school counselors, in contrast, struggle to find measures of accountability as fair; even middle school completion rates — the highest scoring outcome measure — receive the endorsement by fewer than half (46%) of middle school counselors.
• On every metric, however, counselors who say that their current system of accountability focuses on both student outcomes and counselor activities about equally are more likely to think the metric is fair than counselors who only focus on student outcomes.
A strong relationship exists between perceived efficacy and assessments of fairness of student outcome measures of accountability.
• A majority of counselors believe the counselors in their school could be effective at improving nearly every option given, including college application rates (82% give a rating of eight or higher on a zero-to-10 scale), access to upper-level classes (81%), and the completion of a college-prep sequence of courses (83%), provided they had the necessary administrative and resource support.
• The more counselors believe they can be effective in improving a specific outcome measure, the more likely they are to see that same measure as a fair way to assess school counselors’ effectiveness. For example, one of the highest rated measures for efficacy and accountability fairness is completion of college-prep
6 | Report on Survey Findings
courses: 83% of high school counselors believe they could improve completion rates, while 59% rate this as a fair measure of accountability. Conversely, one of the lowest rated measures for high school counselors is graduate employment rates: only 48% believe they could improve graduate employment rates and just 23% believe this is a fair measure of accountability.
Other Key Findings from the Survey, Including Equity and Core StandardsA substantial gap exists between counselors’ personal commitment to equity and their success in achieving equity in their schools. There also is room for improvement when it comes to implementing the eight components and specific example activities in a way that ensures equity for all students.
• Nearly 9 in 10 (88%) school counselors say that “making sure that students from low-income, disadvantaged, and immigrant backgrounds get the extra attention and support they need to achieve success equal to other students” is extremely important. Counselors who are minorities themselves (96% of African American counselors) or who work in schools in which minority students (93%) are the majority are even more likely to place great import on equity.
• By 21 points, counselors are more likely to say that equity is important to them personally (88%) than that they believe they are personally successful in achieving equity in their school (67%).
• When asked about equity in reference to the eight components and specific example activities, a smaller proportion, albeit still a majority, show the same levels of personal commitment and success. More than half of school counselors say they know how to identify students who need the most help (59%), they know how to apply these interventions to suit the diverse cultural and academic needs of their students (57%), and they prioritize equity when implementing the eight components (56%).
Counselors express a need and a desire to receive further training in the Common Core State Standards.
• Few counselors can be considered experts on the Common Core State Standards; only 37% would rate themselves as an 8, 9, or 10 in terms of knowledge
about Common Core State Standards. Even fewer have received training (30% rate as an eight or higher).
• Reflecting their lack of training and knowledge, a strong majority (59%) of school counselors believe that they need further training in the Common Core State Standards.
• While administrators are more knowledgeable about the Common Core State Standards, they support counselors in their school receiving further training. Nearly 9 in 10 (88%) administrators say that school counselors should receive training in the Common Core State Standards.
Collaborations with teachers, family, and members of the community represent both a challenge and an untapped resource for school counselors.
• Thinking about the eight components and specific example activities as one overall approach to counseling students, counselors see the largest deficiencies in support and collaborations with outside groups. Furthermore, these collaborations prove even more difficult for middle school counselors.
• Just 2 in 5 (41%) school counselors say that the teachers in their schools supports the kinds of interventions described in the eight components and specific example activities. Furthermore, only 44% of high school counselors rate themselves as successful in working with teachers to include elements of college applications into courses and to write effective recommendations for students.
• Only half (49%) of high school counselors and only 39% of middle school counselors say they know how to apply these interventions in ways that keep students’ parents and families actively involved. Family and parent involvement appears to be especially lacking not only at middle schools but in high schools with lower rates of college attendance.
• The most challenging and perhaps the most multidimensional aspect explored with counselors involves their collaboration with potential service providers outside their school. Only 31% of counselors (32% high school, 30% middle school) say that they “intentionally collaborate with governmental, community, and nonprofit organizations and businesses to match their programs and services to support these types of interventions.”
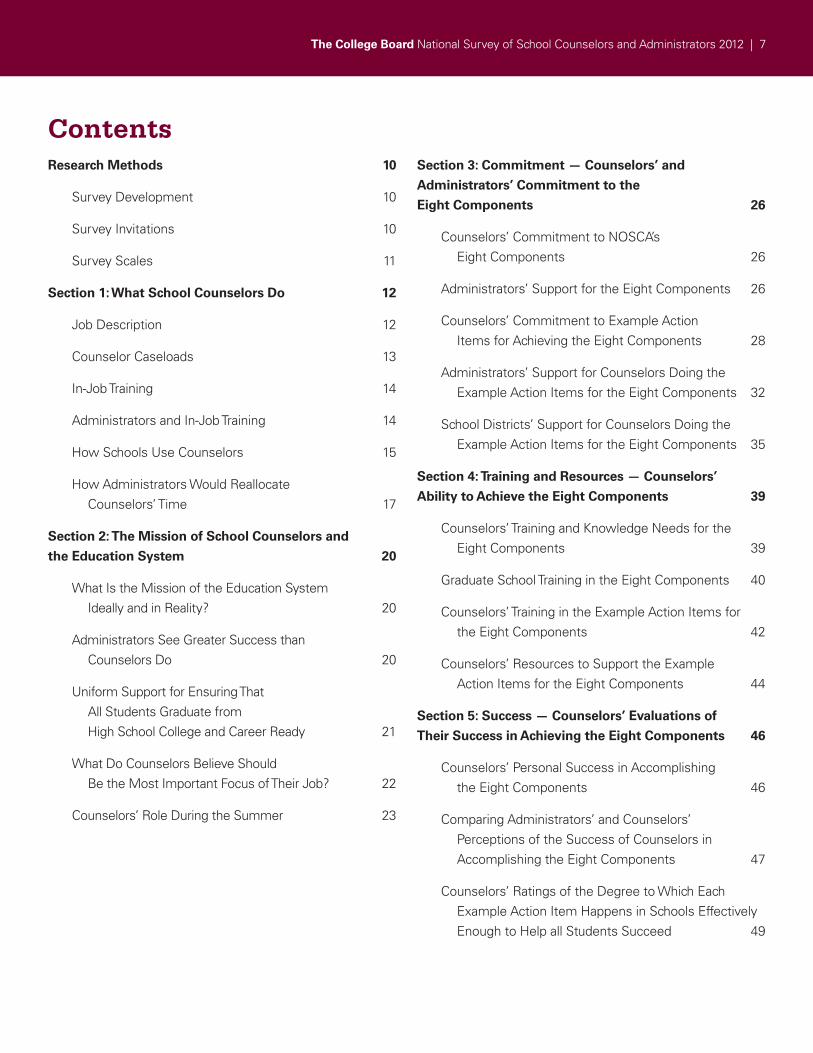
The College Board National Survey of School Counselors and Administrators 2012 | 7
ContentsResearch Methods 10
Survey Development 10
Survey Invitations 10
Survey Scales 11
Section 1: What School Counselors Do 12
Job Description 12
Counselor Caseloads 13
In-Job Training 14
Administrators and In-Job Training 14
How Schools Use Counselors 15
How Administrators Would Reallocate Counselors’ Time 17
Section 2: The Mission of School Counselors and
the Education System 20
What Is the Mission of the Education System Ideally and in Reality? 20
Administrators See Greater Success than Counselors Do 20
Uniform Support for Ensuring That All Students Graduate from High School College and Career Ready 21
What Do Counselors Believe Should Be the Most Important Focus of Their Job? 22
Counselors’ Role During the Summer 23
Section 3: Commitment — Counselors’ and
Administrators’ Commitment to the
Eight Components 26
Counselors’ Commitment to NOSCA’s Eight Components 26
Administrators’ Support for the Eight Components 26
Counselors’ Commitment to Example Action Items for Achieving the Eight Components 28
Administrators’ Support for Counselors Doing the Example Action Items for the Eight Components 32
School Districts’ Support for Counselors Doing the Example Action Items for the Eight Components 35
Section 4: Training and Resources — Counselors’
Ability to Achieve the Eight Components 39
Counselors’ Training and Knowledge Needs for the Eight Components 39
Graduate School Training in the Eight Components 40
Counselors’ Training in the Example Action Items for the Eight Components 42
Counselors’ Resources to Support the Example Action Items for the Eight Components 44
Section 5: Success — Counselors’ Evaluations of
Their Success in Achieving the Eight Components 46
Counselors’ Personal Success in Accomplishing the Eight Components 46
Comparing Administrators’ and Counselors’ Perceptions of the Success of Counselors in Accomplishing the Eight Components 47
Counselors’ Ratings of the Degree to Which Each Example Action Item Happens in Schools Effectively Enough to Help all Students Succeed 49
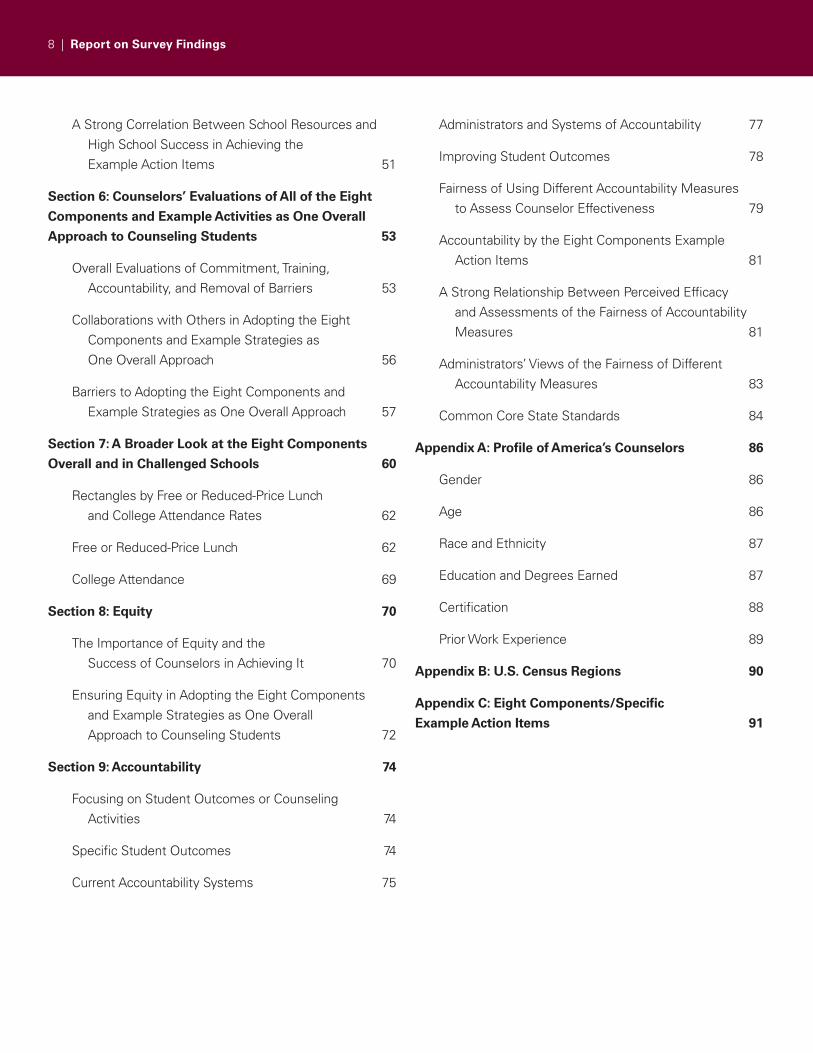
8 | Report on Survey Findings
A Strong Correlation Between School Resources and High School Success in Achieving the Example Action Items 51
Section 6: Counselors’ Evaluations of All of the Eight
Components and Example Activities as One Overall
Approach to Counseling Students 53
Overall Evaluations of Commitment, Training, Accountability, and Removal of Barriers 53
Collaborations with Others in Adopting the Eight Components and Example Strategies as One Overall Approach 56
Barriers to Adopting the Eight Components and Example Strategies as One Overall Approach 57
Section 7: A Broader Look at the Eight Components
Overall and in Challenged Schools 60
Rectangles by Free or Reduced-Price Lunch and College Attendance Rates 62
Free or Reduced-Price Lunch 62
College Attendance 69
Section 8: Equity 70
The Importance of Equity and the Success of Counselors in Achieving It 70
Ensuring Equity in Adopting the Eight Components and Example Strategies as One Overall Approach to Counseling Students 72
Section 9: Accountability 74
Focusing on Student Outcomes or Counseling Activities 74
Specific Student Outcomes 74
Current Accountability Systems 75
Administrators and Systems of Accountability 77
Improving Student Outcomes 78
Fairness of Using Different Accountability Measures to Assess Counselor Effectiveness 79
Accountability by the Eight Components Example Action Items 81
A Strong Relationship Between Perceived Efficacy and Assessments of the Fairness of Accountability Measures 81
Administrators’ Views of the Fairness of Different Accountability Measures 83
Common Core State Standards 84
Appendix A: Profile of America’s Counselors 86
Gender 86
Age 86
Race and Ethnicity 87
Education and Degrees Earned 87
Certification 88
Prior Work Experience 89
Appendix B: U.S. Census Regions 90
Appendix C: Eight Components/Specific
Example Action Items 91

The College Board National Survey of School Counselors and Administrators 2012 | 9
10 | Report on Survey Findings
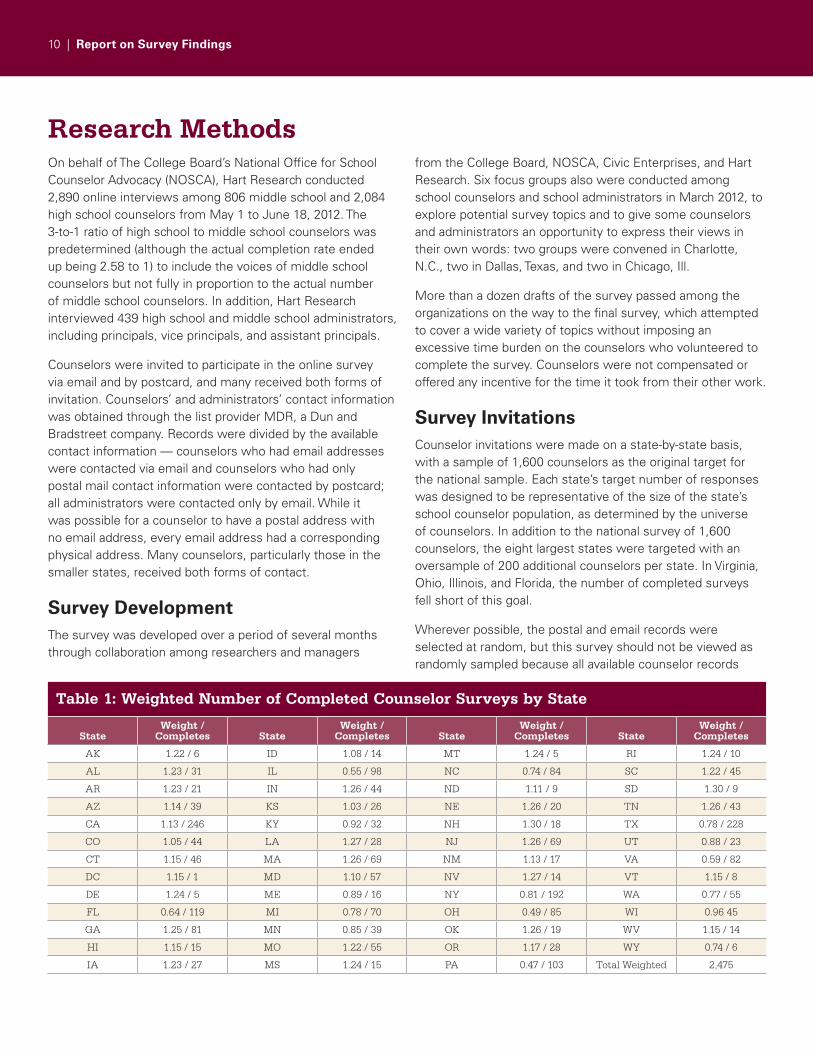
Research MethodsOn behalf of The College Board’s National Office for School Counselor Advocacy (NOSCA), Hart Research conducted 2,890 online interviews among 806 middle school and 2,084 high school counselors from May 1 to June 18, 2012. The 3-to-1 ratio of high school to middle school counselors was predetermined (although the actual completion rate ended up being 2.58 to 1) to include the voices of middle school counselors but not fully in proportion to the actual number of middle school counselors. In addition, Hart Research interviewed 439 high school and middle school administrators, including principals, vice principals, and assistant principals.
Counselors were invited to participate in the online survey via email and by postcard, and many received both forms of invitation. Counselors’ and administrators’ contact information was obtained through the list provider MDR, a Dun and Bradstreet company. Records were divided by the available contact information — counselors who had email addresses were contacted via email and counselors who had only postal mail contact information were contacted by postcard; all administrators were contacted only by email. While it was possible for a counselor to have a postal address with no email address, every email address had a corresponding physical address. Many counselors, particularly those in the smaller states, received both forms of contact.
Survey DevelopmentThe survey was developed over a period of several months through collaboration among researchers and managers
from the College Board, NOSCA, Civic Enterprises, and Hart Research. Six focus groups also were conducted among school counselors and school administrators in March 2012, to explore potential survey topics and to give some counselors and administrators an opportunity to express their views in their own words: two groups were convened in Charlotte, N.C., two in Dallas, Texas, and two in Chicago, Ill.
More than a dozen drafts of the survey passed among the organizations on the way to the final survey, which attempted to cover a wide variety of topics without imposing an excessive time burden on the counselors who volunteered to complete the survey. Counselors were not compensated or offered any incentive for the time it took from their other work.
Survey InvitationsCounselor invitations were made on a state-by-state basis, with a sample of 1,600 counselors as the original target for the national sample. Each state’s target number of responses was designed to be representative of the size of the state’s school counselor population, as determined by the universe of counselors. In addition to the national survey of 1,600 counselors, the eight largest states were targeted with an oversample of 200 additional counselors per state. In Virginia, Ohio, Illinois, and Florida, the number of completed surveys fell short of this goal.
Wherever possible, the postal and email records were selected at random, but this survey should not be viewed as randomly sampled because all available counselor records
Table 1: Weighted Number of Completed Counselor Surveys by State
StateWeight /
Completes StateWeight /
Completes StateWeight /
Completes StateWeight /
Completes
AK 1.22 / 6 ID 1.08 / 14 MT 1.24 / 5 RI 1.24 / 10
AL 1.23 / 31 IL 0.55 / 98 NC 0.74 / 84 SC 1.22 / 45
AR 1.23 / 21 IN 1.26 / 44 ND 1.11 / 9 SD 1.30 / 9
AZ 1.14 / 39 KS 1.03 / 26 NE 1.26 / 20 TN 1.26 / 43
CA 1.13 / 246 KY 0.92 / 32 NH 1.30 / 18 TX 0.78 / 228
CO 1.05 / 44 LA 1.27 / 28 NJ 1.26 / 69 UT 0.88 / 23
CT 1.15 / 46 MA 1.26 / 69 NM 1.13 / 17 VA 0.59 / 82
DC 1.15 / 1 MD 1.10 / 57 NV 1.27 / 14 VT 1.15 / 8
DE 1.24 / 5 ME 0.89 / 16 NY 0.81 / 192 WA 0.77 / 55
FL 0.64 / 119 MI 0.78 / 70 OH 0.49 / 85 WI 0.96 45
GA 1.25 / 81 MN 0.85 / 39 OK 1.26 / 19 WV 1.15 / 14
HI 1.15 / 15 MO 1.22 / 55 OR 1.17 / 28 WY 0.74 / 6
IA 1.23 / 27 MS 1.24 / 15 PA 0.47 / 103 Total Weighted 2,475
The College Board National Survey of School Counselors and Administrators 2012 | 11
were sent invitations in a large number of states. In the smaller states, only a fraction of the total population was sent a postal invitation. However, in several of the oversample states, the postal invitations exhausted the available number of counselors. Further, all available counselors were sent email invitations, exhausting the national sample of email contacts.
The first email wave and postcard wave were sent out May 1, 2012. Those who received a postcard also received a follow-up postcard, while those receiving emails could have received up to five additional emails, with two of those waves including an expanded population encompassing the entire available universe. The final wave was sent only to schools still in session on June 13, 2012.
In total, approximately 68,918 counselors received at least one postal or email invitation to take the survey, with a 4.19% completed interview response rate. In addition to the 2,890 completed interviews, 127 interviews were stopped because the respondent failed a screening question, and 2,896 interviews were stopped by respondents.
Administrators also were selected at random from the national sample, with the number of invitations per state proportional to the state size. The first email wave was sent to 40,663 administrators on May 17, 2012, with only one
additional wave afterwards that was inclusive of the original sample selection. The survey closed with 439 completed interviews, giving a total response rate of 1.08%. In addition, 41 interviews were stopped by a screening question and 503 interviews were terminated by the respondent or timed out before the survey was completed.
Survey ScalesMany questions in this survey ask for ratings on a zero-to-10 scale. Whenever we present these results, we report the proportion giving a rating of eight or higher because this indicates full or nearly full agreement; a rating of six or seven, while indicating general agreement, also could indicate a barrier in the form of incomplete endorsement. There are two exceptions to this rule: The first exception is a case in which the counselor is rating others’ commitment — either the administrators or school district. We set the bar lower for counselors’ perceptions of administrators’ support to assess simply whether counselors see administrators as “on their side” (indicated by a six or higher). The second exception is acceptance of various accountability measures where a six indicates that the measure is acceptable.
12 | Report on Survey Findings
Section 1: What School Counselors DoSchool counselors are jacks-of-all-trades in their schools, according to one high school counselor from Charlotte. The results of the 2012 National Survey of School Counselors corroborate this view; in addition to supporting students’ social-emotional and academic development, counselors provide administrative support, fill in for teachers, coordinate tests, and act as a liaison between schools and communities, among many other responsibilities. Although their efforts do not go unnoticed by administrators, many counselors and administrators alike believe that changes should be made to counselors’ job responsibilities to attain the goal of an education system in which all students graduate from high school ready to succeed in college and career.
When asked in a focus group exercise to describe what counselors actually do and what they should be doing, a high school counselor in Charlotte captured both the feeling of being spread thin and the desire to devote more time to working directly with students:
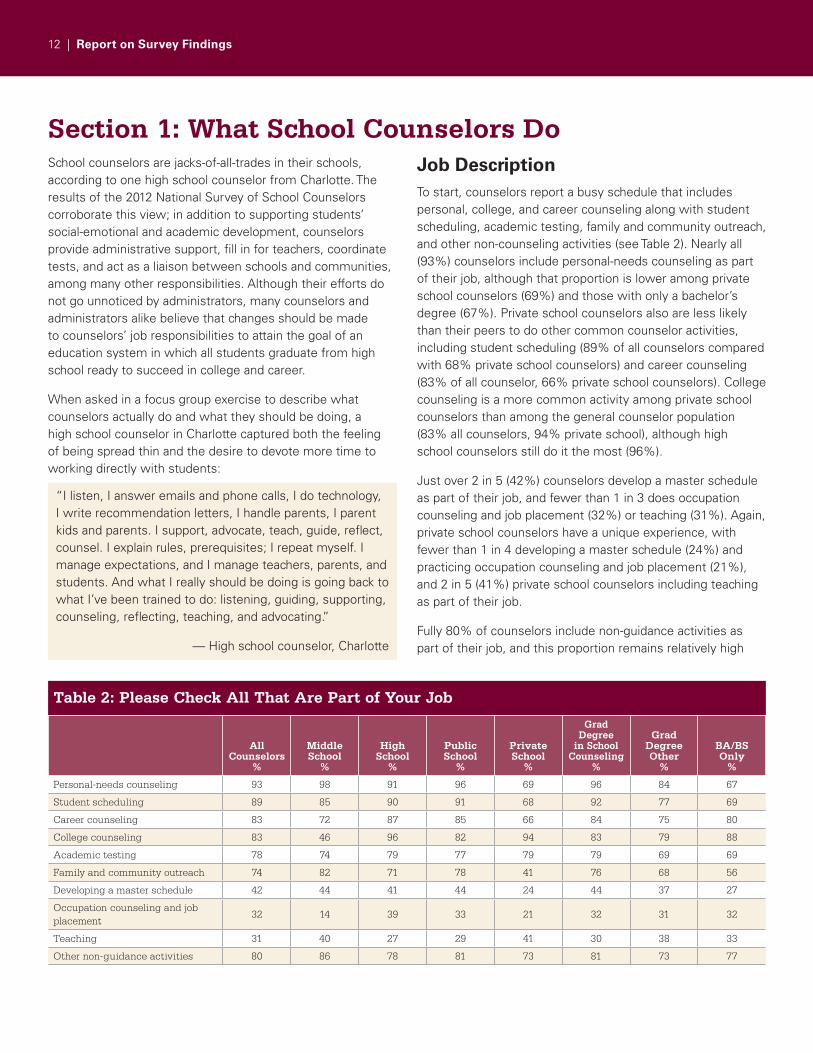
Job DescriptionTo start, counselors report a busy schedule that includes personal, college, and career counseling along with student scheduling, academic testing, family and community outreach, and other non-counseling activities (see Table 2). Nearly all (93%) counselors include personal-needs counseling as part of their job, although that proportion is lower among private school counselors (69%) and those with only a bachelor’s degree (67%). Private school counselors also are less likely than their peers to do other common counselor activities, including student scheduling (89% of all counselors compared with 68% private school counselors) and career counseling (83% of all counselor, 66% private school counselors). College counseling is a more common activity among private school counselors than among the general counselor population (83% all counselors, 94% private school), although high school counselors still do it the most (96%).
Just over 2 in 5 (42%) counselors develop a master schedule as part of their job, and fewer than 1 in 3 does occupation counseling and job placement (32%) or teaching (31%). Again, private school counselors have a unique experience, with fewer than 1 in 4 developing a master schedule (24%) and practicing occupation counseling and job placement (21%), and 2 in 5 (41%) private school counselors including teaching as part of their job.
Fully 80% of counselors include non-guidance activities as part of their job, and this proportion remains relatively high
Table 2: Please Check All That Are Part of Your Job
All Counselors
%
Middle School
%
High School
%
Public School
%
Private School
%
Grad Degree
in School Counseling
%
Grad Degree Other
%
BA/BS Only
%
Personal-needs counseling 93 98 91 96 69 96 84 67
Student scheduling 89 85 90 91 68 92 77 69
Career counseling 83 72 87 85 66 84 75 80
College counseling 83 46 96 82 94 83 79 88
Academic testing 78 74 79 77 79 79 69 69
Family and community outreach 74 82 71 78 41 76 68 56
Developing a master schedule 42 44 41 44 24 44 37 27
Occupation counseling and job placement
32 14 39 33 21 32 31 32
Teaching 31 40 27 29 41 30 38 33
Other non-guidance activities 80 86 78 81 73 81 73 77
“I listen, I answer emails and phone calls, I do technology, I write recommendation letters, I handle parents, I parent kids and parents. I support, advocate, teach, guide, reflect, counsel. I explain rules, prerequisites; I repeat myself. I manage expectations, and I manage teachers, parents, and students. And what I really should be doing is going back to what I’ve been trained to do: listening, guiding, supporting, counseling, reflecting, teaching, and advocating.”
— High school counselor, Charlotte
The College Board National Survey of School Counselors and Administrators 2012 | 13
across public and private schools, high and middle schools, and counselors’ own education levels.
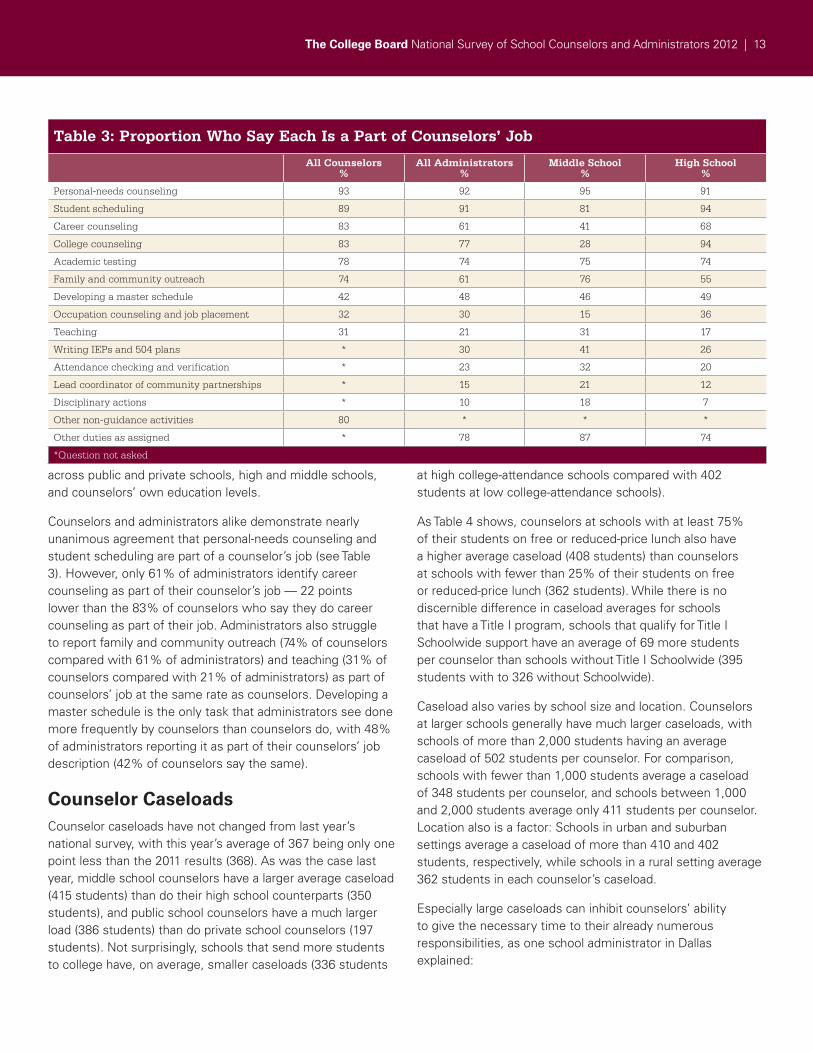
Counselors and administrators alike demonstrate nearly unanimous agreement that personal-needs counseling and student scheduling are part of a counselor’s job (see Table 3). However, only 61% of administrators identify career counseling as part of their counselor’s job — 22 points lower than the 83% of counselors who say they do career counseling as part of their job. Administrators also struggle to report family and community outreach (74% of counselors compared with 61% of administrators) and teaching (31% of counselors compared with 21% of administrators) as part of counselors’ job at the same rate as counselors. Developing a master schedule is the only task that administrators see done more frequently by counselors than counselors do, with 48% of administrators reporting it as part of their counselors’ job description (42% of counselors say the same).
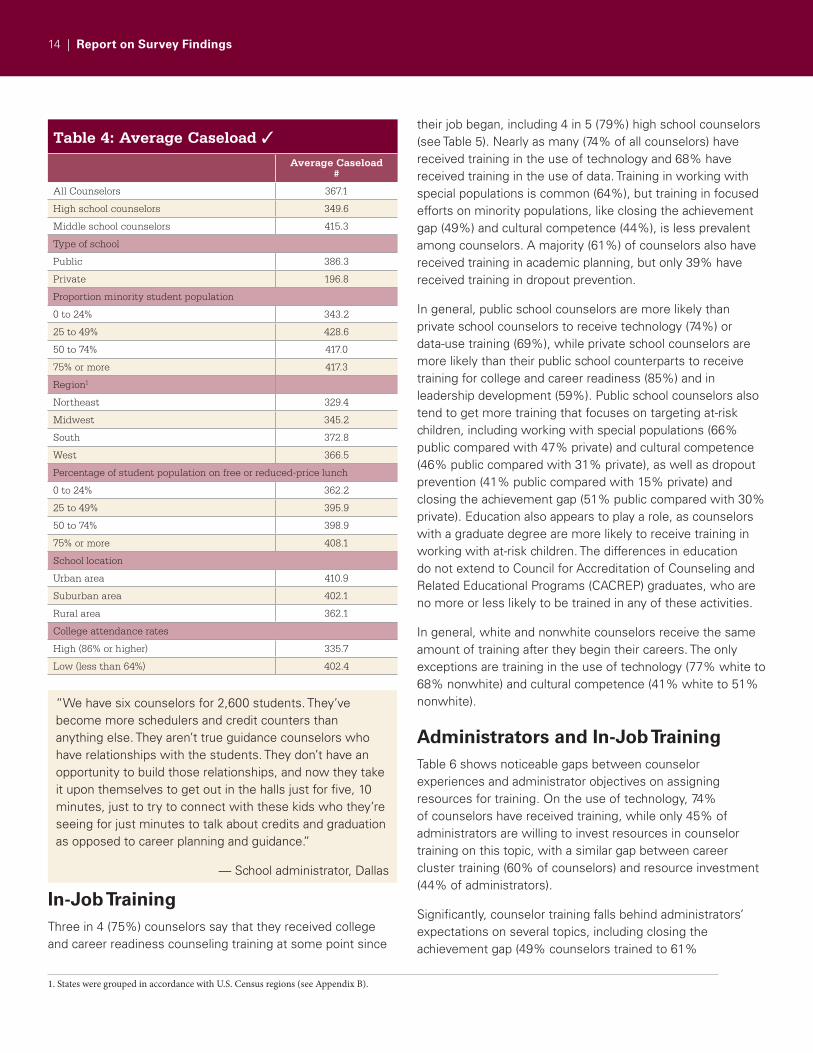
Counselor CaseloadsCounselor caseloads have not changed from last year’s national survey, with this year’s average of 367 being only one point less than the 2011 results (368). As was the case last year, middle school counselors have a larger average caseload (415 students) than do their high school counterparts (350 students), and public school counselors have a much larger load (386 students) than do private school counselors (197 students). Not surprisingly, schools that send more students to college have, on average, smaller caseloads (336 students
at high college-attendance schools compared with 402 students at low college-attendance schools).
As Table 4 shows, counselors at schools with at least 75% of their students on free or reduced-price lunch also have a higher average caseload (408 students) than counselors at schools with fewer than 25% of their students on free or reduced-price lunch (362 students). While there is no discernible difference in caseload averages for schools that have a Title I program, schools that qualify for Title I Schoolwide support have an average of 69 more students per counselor than schools without Title I Schoolwide (395 students with to 326 without Schoolwide).
Caseload also varies by school size and location. Counselors at larger schools generally have much larger caseloads, with schools of more than 2,000 students having an average caseload of 502 students per counselor. For comparison, schools with fewer than 1,000 students average a caseload of 348 students per counselor, and schools between 1,000 and 2,000 students average only 411 students per counselor. Location also is a factor: Schools in urban and suburban settings average a caseload of more than 410 and 402 students, respectively, while schools in a rural setting average 362 students in each counselor’s caseload.
Especially large caseloads can inhibit counselors’ ability to give the necessary time to their already numerous responsibilities, as one school administrator in Dallas explained:
Table 3: Proportion Who Say Each Is a Part of Counselors’ Job
All Counselors%
All Administrators%
Middle School%
High School%
Personal-needs counseling 93 92 95 91
Student scheduling 89 91 81 94
Career counseling 83 61 41 68
College counseling 83 77 28 94
Academic testing 78 74 75 74
Family and community outreach 74 61 76 55
Developing a master schedule 42 48 46 49
Occupation counseling and job placement 32 30 15 36
Teaching 31 21 31 17
Writing IEPs and 504 plans * 30 41 26
Attendance checking and verification * 23 32 20
Lead coordinator of community partnerships * 15 21 12
Disciplinary actions * 10 18 7
Other non-guidance activities 80 * * *
Other duties as assigned * 78 87 74
*Question not asked
14 | Report on Survey Findings
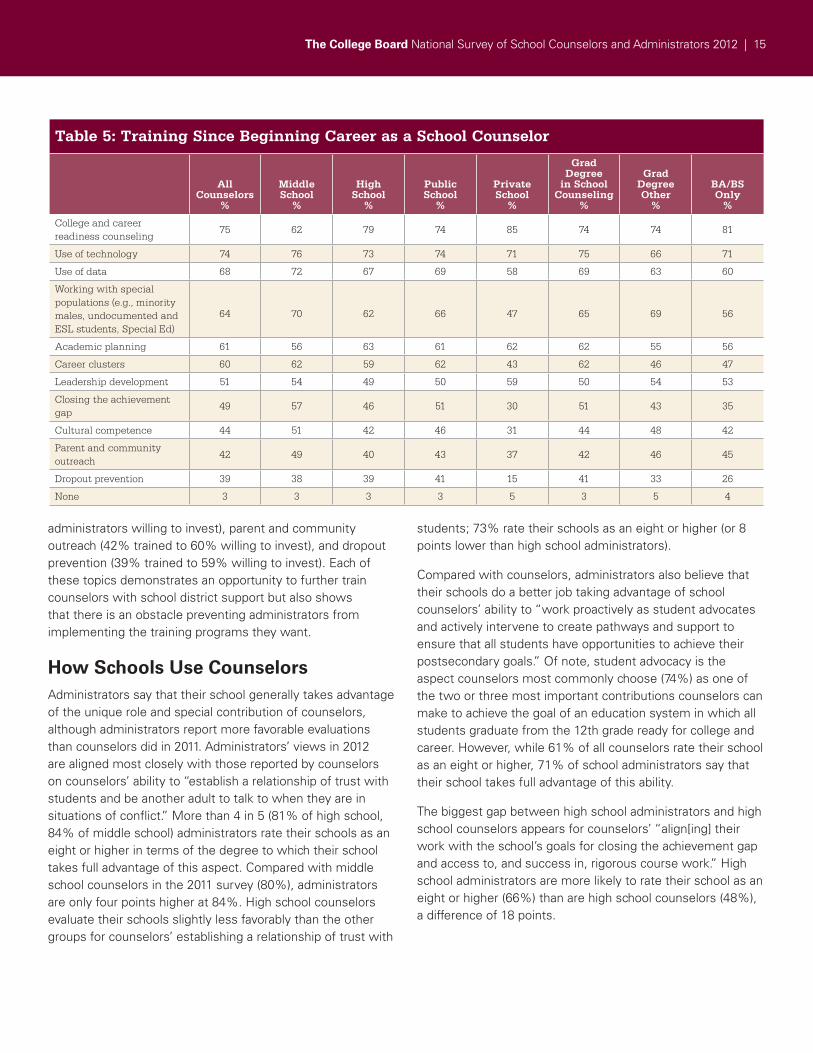
In-Job TrainingThree in 4 (75%) counselors say that they received college and career readiness counseling training at some point since
their job began, including 4 in 5 (79%) high school counselors (see Table 5). Nearly as many (74% of all counselors) have received training in the use of technology and 68% have received training in the use of data. Training in working with special populations is common (64%), but training in focused efforts on minority populations, like closing the achievement gap (49%) and cultural competence (44%), is less prevalent among counselors. A majority (61%) of counselors also have received training in academic planning, but only 39% have received training in dropout prevention.
In general, public school counselors are more likely than private school counselors to receive technology (74%) or data-use training (69%), while private school counselors are more likely than their public school counterparts to receive training for college and career readiness (85%) and in leadership development (59%). Public school counselors also tend to get more training that focuses on targeting at-risk children, including working with special populations (66% public compared with 47% private) and cultural competence (46% public compared with 31% private), as well as dropout prevention (41% public compared with 15% private) and closing the achievement gap (51% public compared with 30% private). Education also appears to play a role, as counselors with a graduate degree are more likely to receive training in working with at-risk children. The differences in education do not extend to Council for Accreditation of Counseling and Related Educational Programs (CACREP) graduates, who are no more or less likely to be trained in any of these activities.
In general, white and nonwhite counselors receive the same amount of training after they begin their careers. The only exceptions are training in the use of technology (77% white to 68% nonwhite) and cultural competence (41% white to 51% nonwhite).
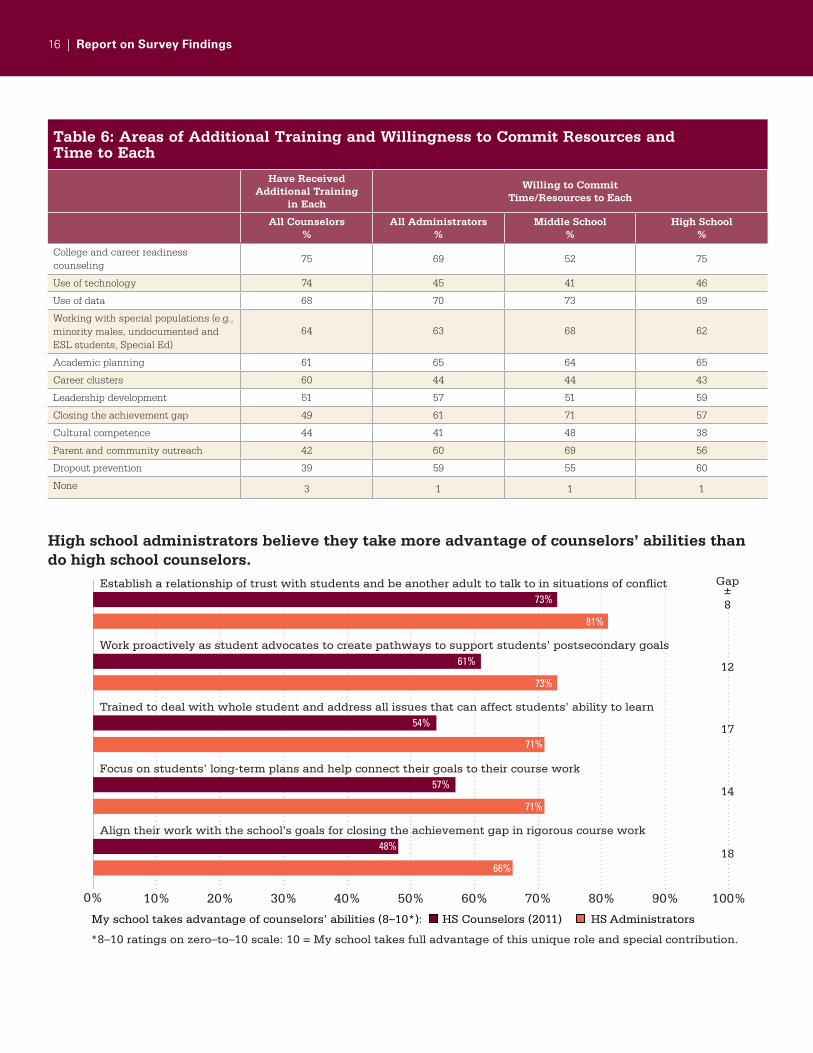
Administrators and In-Job TrainingTable 6 shows noticeable gaps between counselor experiences and administrator objectives on assigning resources for training. On the use of technology, 74% of counselors have received training, while only 45% of administrators are willing to invest resources in counselor training on this topic, with a similar gap between career cluster training (60% of counselors) and resource investment (44% of administrators).
Significantly, counselor training falls behind administrators’ expectations on several topics, including closing the achievement gap (49% counselors trained to 61%
Table 4: Average Caseload ✓
Average Caseload#
All Counselors 367.1
High school counselors 349.6
Middle school counselors 415.3
Type of school
Public 386.3
Private 196.8
Proportion minority student population
0 to 24% 343.2
25 to 49% 428.6
50 to 74% 417.0
75% or more 417.3
Region1
Northeast 329.4
Midwest 345.2
South 372.8
West 366.5
Percentage of student population on free or reduced-price lunch
0 to 24% 362.2
25 to 49% 395.9
50 to 74% 398.9
75% or more 408.1
School location
Urban area 410.9
Suburban area 402.1
Rural area 362.1
College attendance rates
High (86% or higher) 335.7
Low (less than 64%) 402.4
1. States were grouped in accordance with U.S. Census regions (see Appendix B).
“We have six counselors for 2,600 students. They’ve become more schedulers and credit counters than anything else. They aren’t true guidance counselors who have relationships with the students. They don’t have an opportunity to build those relationships, and now they take it upon themselves to get out in the halls just for five, 10 minutes, just to try to connect with these kids who they’re seeing for just minutes to talk about credits and graduation as opposed to career planning and guidance.”
— School administrator, Dallas
The College Board National Survey of School Counselors and Administrators 2012 | 15
administrators willing to invest), parent and community outreach (42% trained to 60% willing to invest), and dropout prevention (39% trained to 59% willing to invest). Each of these topics demonstrates an opportunity to further train counselors with school district support but also shows that there is an obstacle preventing administrators from implementing the training programs they want.
How Schools Use CounselorsAdministrators say that their school generally takes advantage of the unique role and special contribution of counselors, although administrators report more favorable evaluations than counselors did in 2011. Administrators’ views in 2012 are aligned most closely with those reported by counselors on counselors’ ability to “establish a relationship of trust with students and be another adult to talk to when they are in situations of conflict.” More than 4 in 5 (81% of high school, 84% of middle school) administrators rate their schools as an eight or higher in terms of the degree to which their school takes full advantage of this aspect. Compared with middle school counselors in the 2011 survey (80%), administrators are only four points higher at 84%. High school counselors evaluate their schools slightly less favorably than the other groups for counselors’ establishing a relationship of trust with
students; 73% rate their schools as an eight or higher (or 8 points lower than high school administrators).
Compared with counselors, administrators also believe that their schools do a better job taking advantage of school counselors’ ability to “work proactively as student advocates and actively intervene to create pathways and support to ensure that all students have opportunities to achieve their postsecondary goals.” Of note, student advocacy is the aspect counselors most commonly choose (74%) as one of the two or three most important contributions counselors can make to achieve the goal of an education system in which all students graduate from the 12th grade ready for college and career. However, while 61% of all counselors rate their school as an eight or higher, 71% of school administrators say that their school takes full advantage of this ability.
The biggest gap between high school administrators and high school counselors appears for counselors’ “align[ing] their work with the school’s goals for closing the achievement gap and access to, and success in, rigorous course work.” High school administrators are more likely to rate their school as an eight or higher (66%) than are high school counselors (48%), a difference of 18 points.
Table 5: Training Since Beginning Career as a School Counselor
AllCounselors
%
MiddleSchool
%
HighSchool
%
PublicSchool
%
Private School
%
Grad Degree
in School Counseling
%
Grad Degree Other
%
BA/BS Only
%
College and career readiness counseling
75 62 79 74 85 74 74 81
Use of technology 74 76 73 74 71 75 66 71
Use of data 68 72 67 69 58 69 63 60
Working with special populations (e.g., minority males, undocumented and ESL students, Special Ed)
64 70 62 66 47 65 69 56
Academic planning 61 56 63 61 62 62 55 56
Career clusters 60 62 59 62 43 62 46 47
Leadership development 51 54 49 50 59 50 54 53
Closing the achievement gap
49 57 46 51 30 51 43 35
Cultural competence 44 51 42 46 31 44 48 42
Parent and community outreach
42 49 40 43 37 42 46 45
Dropout prevention 39 38 39 41 15 41 33 26
None 3 3 3 3 5 3 5 4
16 | Report on Survey Findings
0% 10% 20% 30% 40% 50% 60% 70% 80% 90% 100%
73%
81%
61%
73%
54%
High school administrators believe they take more advantage of counselors’ abilities than do high school counselors.
*8–10 ratings on zero–to–10 scale: 10 = My school takes full advantage of this unique role and special contribution.
Align their work with the school’s goals for closing the achievement gap in rigorous course work
Focus on students’ long-term plans and help connect their goals to their course work
Trained to deal with whole student and address all issues that can affect students’ ability to learn
Work proactively as student advocates to create pathways to support students’ postsecondary goals
Establish a relationship of trust with students and be another adult to talk to in situations of con�ict
71%
57%
71%
48%
66%
My school takes advantage of counselors’ abilities (8–10*): HS Administrators HS Counselors (2011)
Gap±8
12
17
14
18
Table 6: Areas of Additional Training and Willingness to Commit Resources and Time to Each
Have Received Additional Training
in Each
Willing to Commit Time/Resources to Each
All Counselors%
All Administrators%
Middle School%
High School%
College and career readiness counseling
75 69 52 75
Use of technology 74 45 41 46
Use of data 68 70 73 69
Working with special populations (e.g., minority males, undocumented and ESL students, Special Ed)
64 63 68 62
Academic planning 61 65 64 65
Career clusters 60 44 44 43
Leadership development 51 57 51 59
Closing the achievement gap 49 61 71 57
Cultural competence 44 41 48 38
Parent and community outreach 42 60 69 56
Dropout prevention 39 59 55 60
None 3 1 1 1
The College Board National Survey of School Counselors and Administrators 2012 | 17
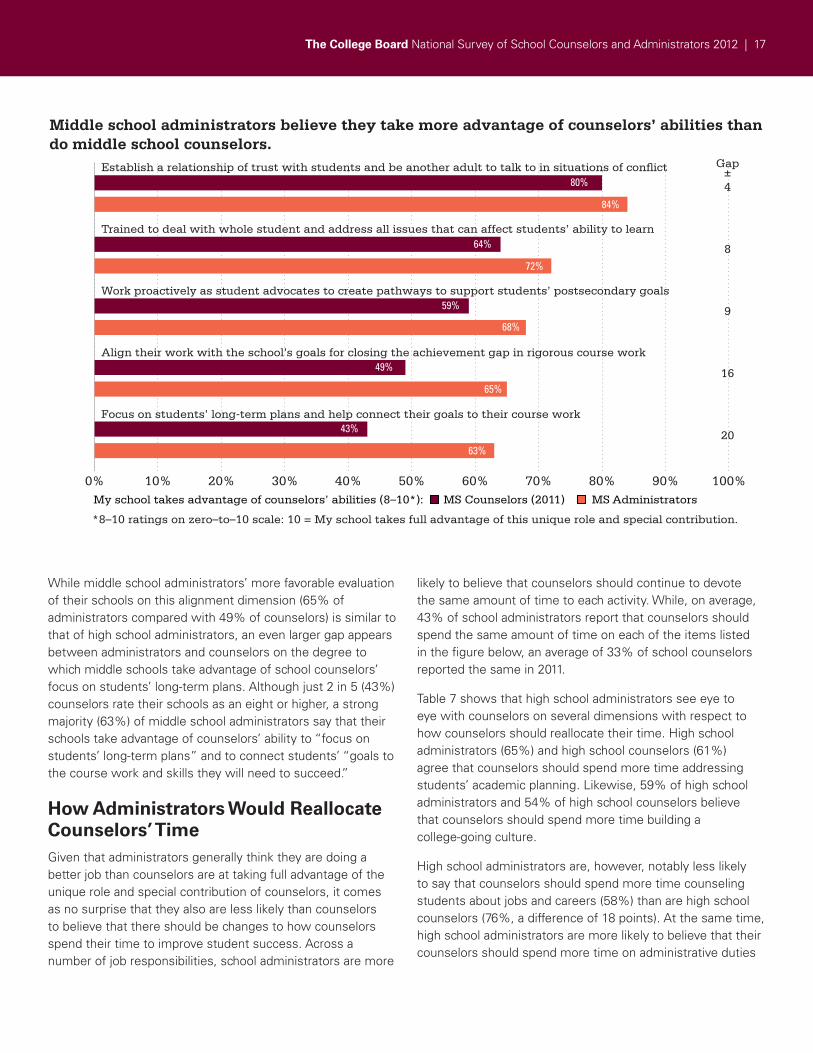
While middle school administrators’ more favorable evaluation of their schools on this alignment dimension (65% of administrators compared with 49% of counselors) is similar to that of high school administrators, an even larger gap appears between administrators and counselors on the degree to which middle schools take advantage of school counselors’ focus on students’ long-term plans. Although just 2 in 5 (43%) counselors rate their schools as an eight or higher, a strong majority (63%) of middle school administrators say that their schools take advantage of counselors’ ability to “focus on students’ long-term plans” and to connect students’ “goals to the course work and skills they will need to succeed.”
How Administrators Would Reallocate Counselors’ TimeGiven that administrators generally think they are doing a better job than counselors are at taking full advantage of the unique role and special contribution of counselors, it comes as no surprise that they also are less likely than counselors to believe that there should be changes to how counselors spend their time to improve student success. Across a number of job responsibilities, school administrators are more
likely to believe that counselors should continue to devote the same amount of time to each activity. While, on average, 43% of school administrators report that counselors should spend the same amount of time on each of the items listed in the figure below, an average of 33% of school counselors reported the same in 2011.
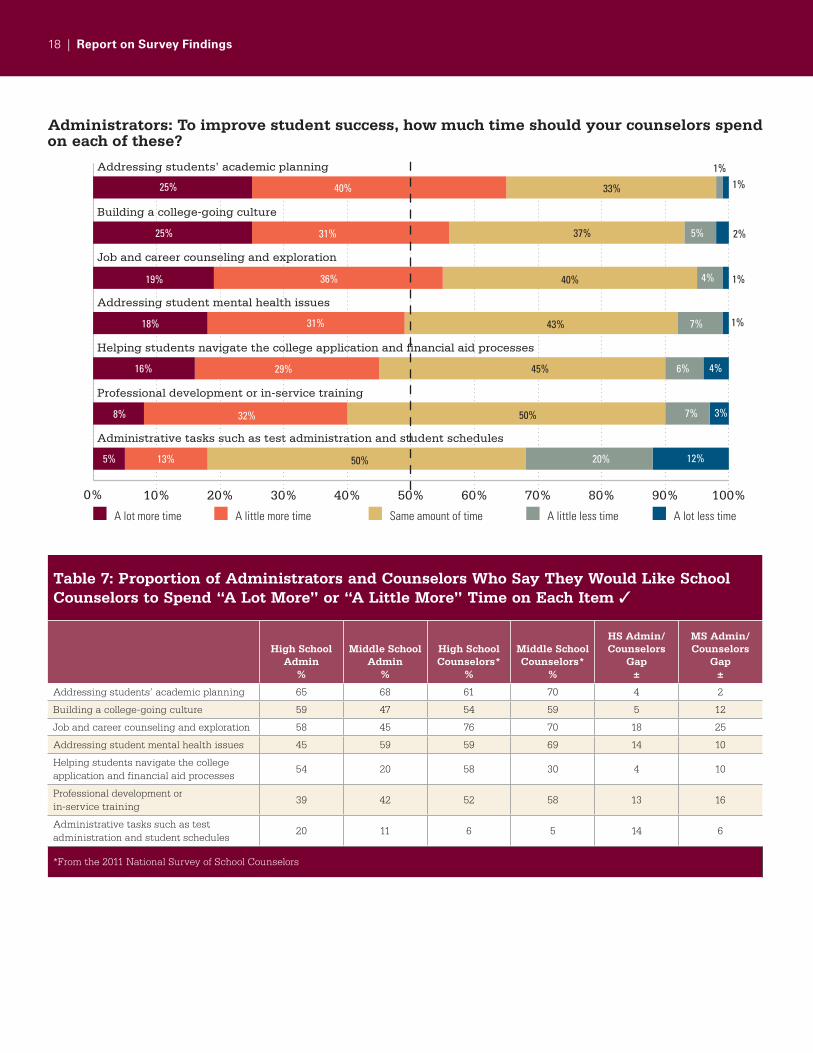
Table 7 shows that high school administrators see eye to eye with counselors on several dimensions with respect to how counselors should reallocate their time. High school administrators (65%) and high school counselors (61%) agree that counselors should spend more time addressing students’ academic planning. Likewise, 59% of high school administrators and 54% of high school counselors believe that counselors should spend more time building a college-going culture.
High school administrators are, however, notably less likely to say that counselors should spend more time counseling students about jobs and careers (58%) than are high school counselors (76%, a difference of 18 points). At the same time, high school administrators are more likely to believe that their counselors should spend more time on administrative duties
0% 10% 20% 30% 40% 50% 60% 70% 80% 90% 100%
Middle school administrators believe they take more advantage of counselors’ abilities than do middle school counselors.
*8–10 ratings on zero–to–10 scale: 10 = My school takes full advantage of this unique role and special contribution.
Establish a relationship of trust with students and be another adult to talk to in situations of con�ict
Trained to deal with whole student and address all issues that can affect students’ ability to learn
Work proactively as student advocates to create pathways to support students’ postsecondary goals
Align their work with the school’s goals for closing the achievement gap in rigorous course work
Focus on students’ long-term plans and help connect their goals to their course work
80%
84%
64%
72%
59%
68%
49%
65%
43%
63%
My school takes advantage of counselors’ abilities (8–10*): MS Administrators MS Counselors (2011)
Gap±4
8
9
16
20
18 | Report on Survey Findings
Addressing students’ academic planning
Building a college-going culture
Job and career counseling and exploration
Addressing student mental health issues
Helping students navigate the college application and �nancial aid processes
Professional development or in-service training
Administrative tasks such as test administration and student schedules
Administrators: To improve student success, how much time should your counselors spend on each of these?
0% 10% 20% 30% 40% 50% 60% 70% 80% 90% 100%
1%
25%
25%
19%
18%
16%
8%
5%
5%
4%
7%
6%
7%
1%
2%
1%
1%
4%
33%
37%
40%
43%
45%
50%
50%
40%
31%
36%
31%
29%
32%
13% 20%
3%
12%
A little less timeSame amount of timeA lot more time A little more time A lot less time
Table 7: Proportion of Administrators and Counselors Who Say They Would Like School Counselors to Spend “A Lot More” or “A Little More” Time on Each Item ✓
High School Admin
%
Middle School Admin
%
High School Counselors*
%
Middle School Counselors*
%
HS Admin/ Counselors
Gap±
MS Admin/ Counselors
Gap±
Addressing students’ academic planning 65 68 61 70 4 2
Building a college-going culture 59 47 54 59 5 12
Job and career counseling and exploration 58 45 76 70 18 25
Addressing student mental health issues 45 59 59 69 14 10
Helping students navigate the college application and financial aid processes
54 20 58 30 4 10
Professional development or in-service training
39 42 52 58 13 16
Administrative tasks such as test administration and student schedules
20 11 6 5 14 6
*From the 2011 National Survey of School Counselors
The College Board National Survey of School Counselors and Administrators 2012 | 19
(20%, compared with just 6% of high school counselors). This is likely to be a point of contention between high school administrators and counselors, as we already have seen that counselors report a disapproval of administrative duties in no uncertain terms. In 2011, about two-thirds (65%) of high school counselors said that they should spend less time on administrative tasks.
With the exception of administrative tasks, which fewer middle school administrators believe their counselors should spend more time on (11%, compared with 5% of middle school counselors), middle school administrators generally are less likely than their counselors to believe their counselors should spend more time on a variety of activities. As Table 7 shows, whereas just 45% of middle school administrators believe that counselors should spend more time engaging in job and career counseling and exploration, 70% (25 points higher) of middle school counselors said they thought they should spend more time on this. Similarly, middle school administrators are less likely to believe that their counselors should spend more time on professional development and in-service training (42%) than middle school counselors (58%, 16 points higher).
20 | Report on Survey Findings
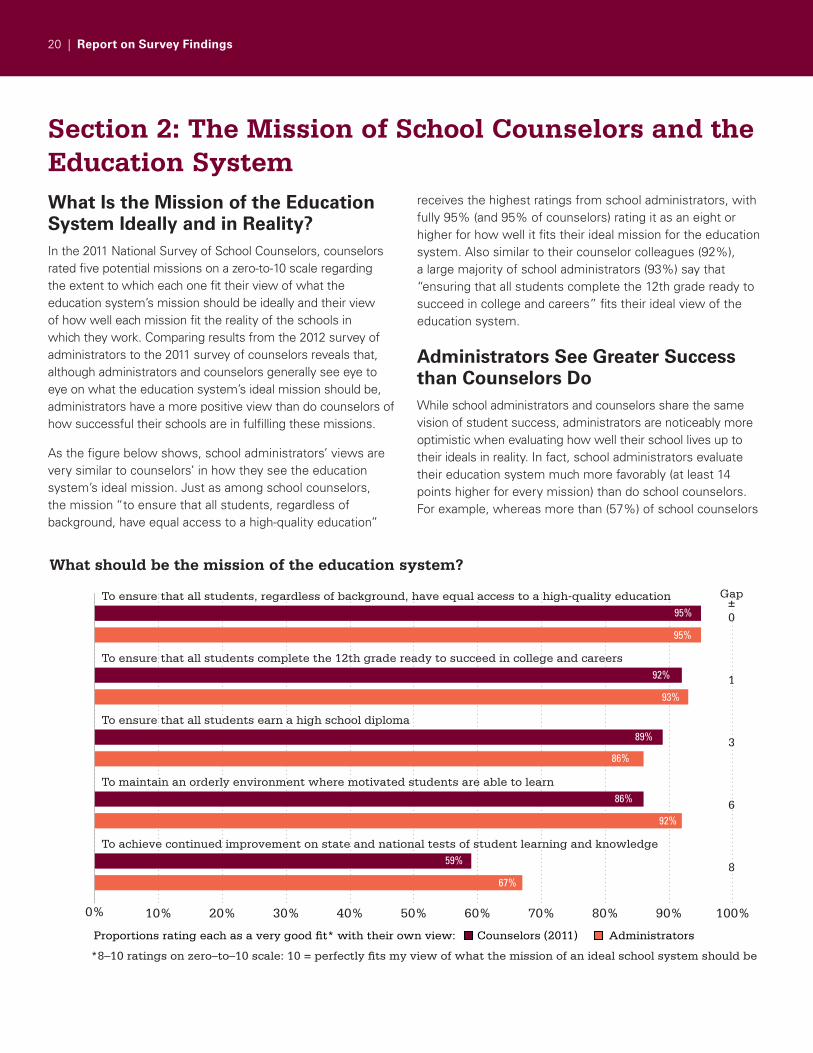
Section 2: The Mission of School Counselors and the Education SystemWhat Is the Mission of the Education System Ideally and in Reality?In the 2011 National Survey of School Counselors, counselors rated five potential missions on a zero-to-10 scale regarding the extent to which each one fit their view of what the education system’s mission should be ideally and their view of how well each mission fit the reality of the schools in which they work. Comparing results from the 2012 survey of administrators to the 2011 survey of counselors reveals that, although administrators and counselors generally see eye to eye on what the education system’s ideal mission should be, administrators have a more positive view than do counselors of how successful their schools are in fulfilling these missions.
As the figure below shows, school administrators’ views are very similar to counselors’ in how they see the education system’s ideal mission. Just as among school counselors, the mission “to ensure that all students, regardless of background, have equal access to a high-quality education”
receives the highest ratings from school administrators, with fully 95% (and 95% of counselors) rating it as an eight or higher for how well it fits their ideal mission for the education system. Also similar to their counselor colleagues (92%), a large majority of school administrators (93%) say that “ensuring that all students complete the 12th grade ready to succeed in college and careers” fits their ideal view of the education system.
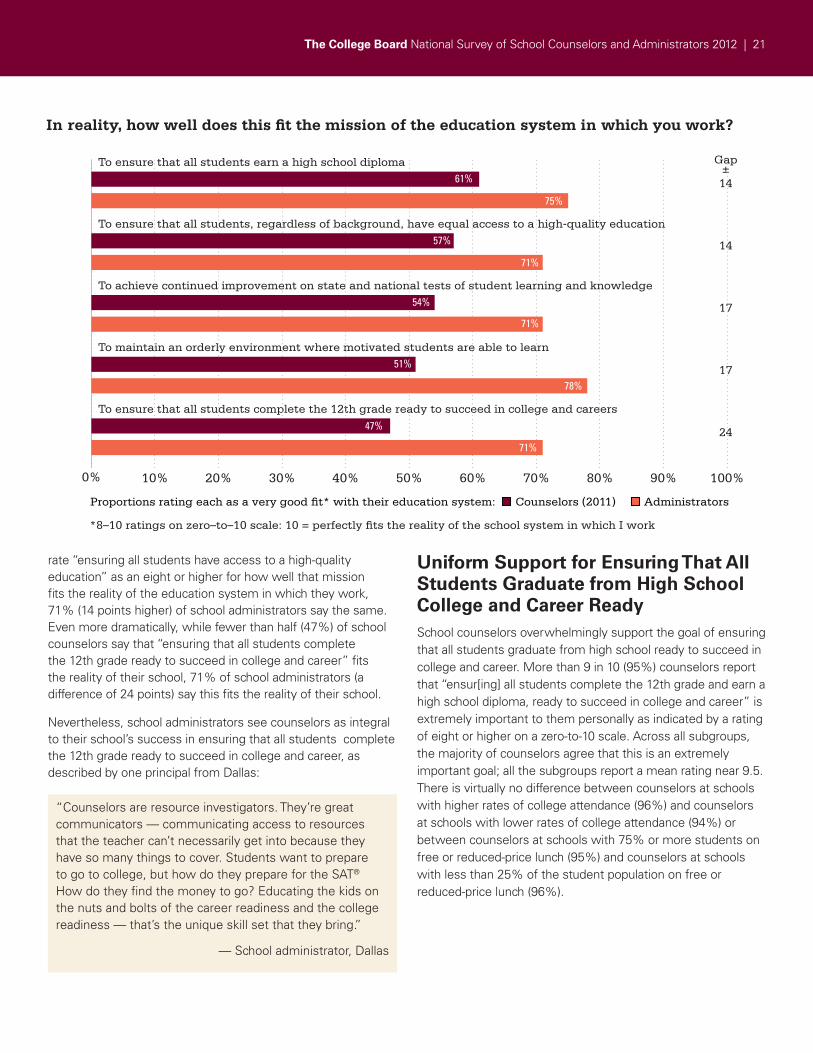
Administrators See Greater Success than Counselors DoWhile school administrators and counselors share the same vision of student success, administrators are noticeably more optimistic when evaluating how well their school lives up to their ideals in reality. In fact, school administrators evaluate their education system much more favorably (at least 14 points higher for every mission) than do school counselors. For example, whereas more than (57%) of school counselors
0% 10% 20% 30% 40% 50% 60% 70% 80% 90% 100%
What should be the mission of the education system?
*8–10 ratings on zero–to–10 scale: 10 = perfectly �ts my view of what the mission of an ideal school system should be
To achieve continued improvement on state and national tests of student learning and knowledge
To maintain an orderly environment where motivated students are able to learn
To ensure that all students earn a high school diploma
To ensure that all students complete the 12th grade ready to succeed in college and careers
To ensure that all students, regardless of background, have equal access to a high-quality education95%
95%
92%
93%
89%
86%
86%
92%
59%
67%
Proportions rating each as a very good �t* with their own view:
Administrators Counselors (2011)
Gap±0
1
3
6
8
The College Board National Survey of School Counselors and Administrators 2012 | 21
rate “ensuring all students have access to a high-quality education” as an eight or higher for how well that mission fits the reality of the education system in which they work, 71% (14 points higher) of school administrators say the same. Even more dramatically, while fewer than half (47%) of school counselors say that “ensuring that all students complete the 12th grade ready to succeed in college and career” fits the reality of their school, 71% of school administrators (a difference of 24 points) say this fits the reality of their school.
Nevertheless, school administrators see counselors as integral to their school’s success in ensuring that all students complete the 12th grade ready to succeed in college and career, as described by one principal from Dallas:
Uniform Support for Ensuring That All Students Graduate from High School College and Career ReadySchool counselors overwhelmingly support the goal of ensuring that all students graduate from high school ready to succeed in college and career. More than 9 in 10 (95%) counselors report that “ensur[ing] all students complete the 12th grade and earn a high school diploma, ready to succeed in college and career” is extremely important to them personally as indicated by a rating of eight or higher on a zero-to-10 scale. Across all subgroups, the majority of counselors agree that this is an extremely important goal; all the subgroups report a mean rating near 9.5. There is virtually no difference between counselors at schools with higher rates of college attendance (96%) and counselors at schools with lower rates of college attendance (94%) or between counselors at schools with 75% or more students on free or reduced-price lunch (95%) and counselors at schools with less than 25% of the student population on free or reduced-price lunch (96%).
In reality, how well does this �t the mission of the education system in which you work?
*8–10 ratings on zero–to–10 scale: 10 = perfectly �ts the reality of the school system in which I work
To ensure that all students complete the 12th grade ready to succeed in college and careers
To maintain an orderly environment where motivated students are able to learn
To achieve continued improvement on state and national tests of student learning and knowledge
To ensure that all students, regardless of background, have equal access to a high-quality education
To ensure that all students earn a high school diploma
Proportions rating each as a very good �t* with their education system:
Administrators Counselors (2011)
Gap±14
14
17
17
24
0% 10% 20% 30% 40% 50% 60% 70% 80% 90% 100%
71%
47%
78%
51%
71%
61%
75%
57%
71%
54%
“Counselors are resource investigators. They’re great communicators — communicating access to resources that the teacher can’t necessarily get into because they have so many things to cover. Students want to prepare to go to college, but how do they prepare for the SAT® How do they find the money to go? Educating the kids on the nuts and bolts of the career readiness and the college readiness — that’s the unique skill set that they bring.”
— School administrator, Dallas
22 | Report on Survey Findings
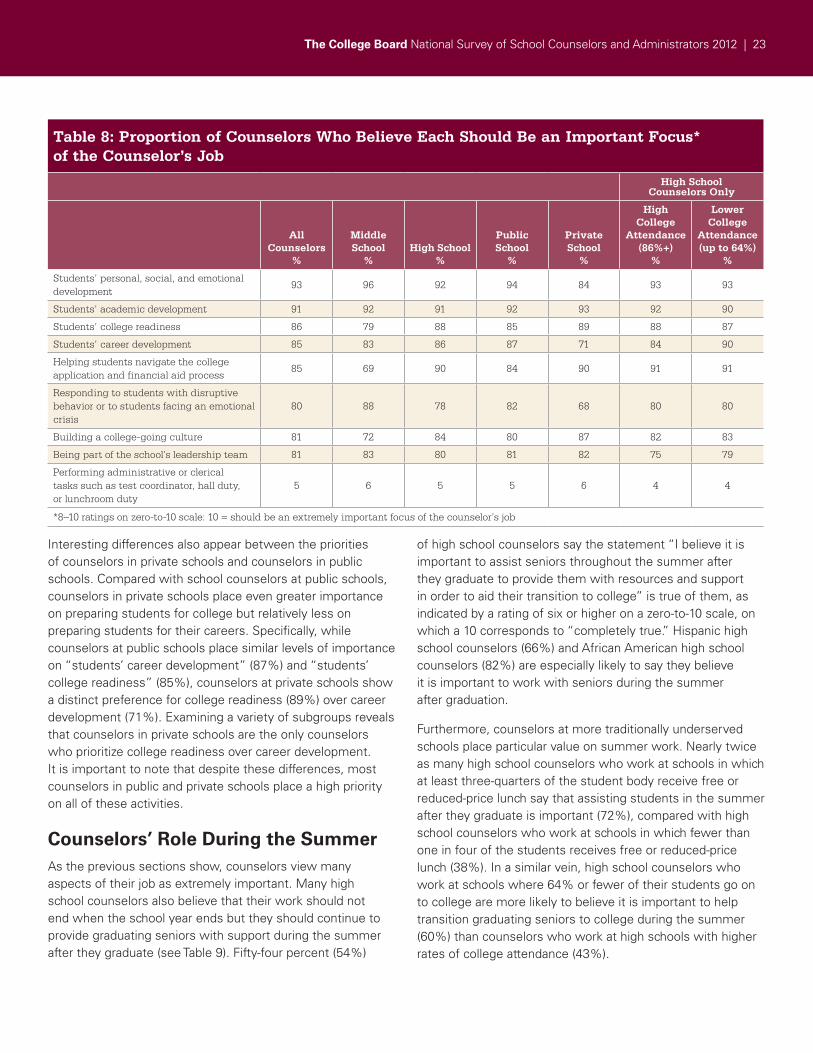
What Do Counselors Believe Should Be the Most Important Focus of Their Job?As noted earlier, school counselors have a host of responsibilities, some of which it could be argued are more directly related to improving student success than others. To understand what counselors believe their unique role and special contribution to education should be, the survey offered nine potential domains for counselors to rate the degree to which they believe each should be an important focus of the counselor’s job.
The first point to note in reviewing Table 8 is that counselors believe their role in schools should be multifaceted and that many aspects are of great importance. In fact, at least 80% of school counselors rate all but one of the components as an eight or higher on a zero-to-10 scale, on which a “10” means the component should be an extremely important focus of the school counselor’s job. Topping this list are “students’ personal, social, and emotional development” (93%) and “students’ academic development” (91%), both of which receive ratings of eight or higher from more than 9 in 10 counselors. School counselors also report that preparing students to succeed in college and career is an extremely important part of their job. Approximately the same proportion of counselors overall say that “students’ college readiness” (86%) and “students’ career development” (85%) should be important parts of their job.
Counselors also are prepared to take a leadership role in their schools. More than 4 in 5 (81%) say that “being part of the school’s leadership team” should be an extremely important focus of the counselor’s job. And importantly, school administrators agree. Virtually all (98%) school administrators agree (79% strongly agree) that “it is important for school counselors to exercise leadership in advocating for students’ access to rigorous academic preparation, as well as other college and career readiness counseling, even if others in the school don’t see counselors in this leadership role.”
In stark contrast to all the other aspects of the counselors’ job, “performing administrative or clerical tasks such as test coordinator, hall duty, or lunchroom duty” stands out because of the few counselors who believe this should be a focus of their job. Only 5% of all counselors rate “performing administrative and clerical duties” as an eight or higher, while a full 87% rate it as a zero to five. This result echoes the finding from the 2011 survey of school counselors in which two-thirds (67%) of school counselors reported that they would like to spend less time on administrative tasks such as test administration and student schedules.
As Table 8 shows, middle and high school counselors prioritize different aspects of their job. Middle school counselors are especially likely to say they value supporting students’ personal development and helping students deal with personal problems. While high school counselors rate “students’ personal, social, and emotional development” highest (92%) of all their job aspects, 96% of middle school counselors rate this as an eight or higher. Similarly, middle school counselors (88% compared with 78% of high school counselors) are more likely to believe that “responding to students with disruptive behavior or to students facing an emotional crisis” is an extremely important part of their job. High school counselors, in contrast, are more likely to prioritize “helping students navigate the college application and financial aid processes” (90% compared with 69% of middle school counselors) and “building a college-going culture” (84% compared with 72% of middle school counselors).
“I strongly agree that we should be leaders for advocacy for our students, whether it is to get into the highest-level course that they have or to make sure that there are enough courses offered for the middle-of-the-road and the lower-performing students, so that they have as many opportunities to be challenged at their level as the high-achieving students.”
— High school counselor, Charlotte
“I think the key is how social–emotional development can help with the academics. The teachers are there for the academics, but we can help kids be prepared for life so they can learn. We’re a Title I school and sometimes students come to school and they don’t have food. We help them get the things that they need so they can learn.”
— Middle school counselor, Dallas
“I think a counselor in the ideal is able to touch on the social–emotional piece in children and is able to help students matriculate to high school, help with the application process, and so forth. But, unfortunately, in my experience, they’ve become case managers. They end up dealing with paperwork and IEPs, and they’re dealing with multiple jobs as one individual.”
— School administrator, Chicago
The College Board National Survey of School Counselors and Administrators 2012 | 23
Interesting differences also appear between the priorities of counselors in private schools and counselors in public schools. Compared with school counselors at public schools, counselors in private schools place even greater importance on preparing students for college but relatively less on preparing students for their careers. Specifically, while counselors at public schools place similar levels of importance on “students’ career development” (87%) and “students’ college readiness” (85%), counselors at private schools show a distinct preference for college readiness (89%) over career development (71%). Examining a variety of subgroups reveals that counselors in private schools are the only counselors who prioritize college readiness over career development. It is important to note that despite these differences, most counselors in public and private schools place a high priority on all of these activities.
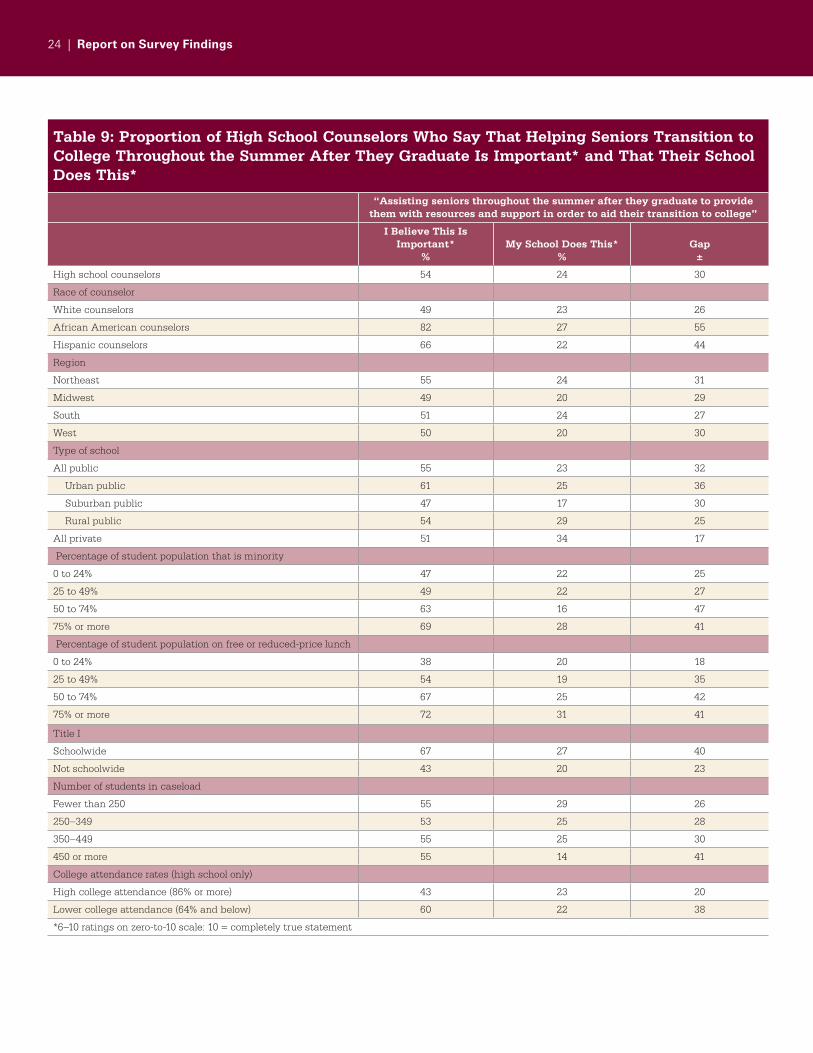
Counselors’ Role During the SummerAs the previous sections show, counselors view many aspects of their job as extremely important. Many high school counselors also believe that their work should not end when the school year ends but they should continue to provide graduating seniors with support during the summer after they graduate (see Table 9). Fifty-four percent (54%)
of high school counselors say the statement “I believe it is important to assist seniors throughout the summer after they graduate to provide them with resources and support in order to aid their transition to college” is true of them, as indicated by a rating of six or higher on a zero-to-10 scale, on which a 10 corresponds to “completely true.” Hispanic high school counselors (66%) and African American high school counselors (82%) are especially likely to say they believe it is important to work with seniors during the summer after graduation.
Furthermore, counselors at more traditionally underserved schools place particular value on summer work. Nearly twice as many high school counselors who work at schools in which at least three-quarters of the student body receive free or reduced-price lunch say that assisting students in the summer after they graduate is important (72%), compared with high school counselors who work at schools in which fewer than one in four of the students receives free or reduced-price lunch (38%). In a similar vein, high school counselors who work at schools where 64% or fewer of their students go on to college are more likely to believe it is important to help transition graduating seniors to college during the summer (60%) than counselors who work at high schools with higher rates of college attendance (43%).
Table 8: Proportion of Counselors Who Believe Each Should Be an Important Focus* of the Counselor’s Job
High School Counselors Only
All Counselors
%
Middle School
%High School
%
Public School
%
Private School
%
High College
Attendance (86%+)
%
Lower College
Attendance (up to 64%)
%
Students’ personal, social, and emotional development
93 96 92 94 84 93 93
Students’ academic development 91 92 91 92 93 92 90
Students’ college readiness 86 79 88 85 89 88 87
Students’ career development 85 83 86 87 71 84 90
Helping students navigate the college application and financial aid process
85 69 90 84 90 91 91
Responding to students with disruptive behavior or to students facing an emotional crisis
80 88 78 82 68 80 80
Building a college-going culture 81 72 84 80 87 82 83
Being part of the school’s leadership team 81 83 80 81 82 75 79
Performing administrative or clerical tasks such as test coordinator, hall duty, or lunchroom duty
5 6 5 5 6 4 4
*8–10 ratings on zero-to-10 scale: 10 = should be an extremely important focus of the counselor’s job
24 | Report on Survey Findings
Table 9: Proportion of High School Counselors Who Say That Helping Seniors Transition to College Throughout the Summer After They Graduate Is Important* and That Their School Does This*
“Assisting seniors throughout the summer after they graduate to provide them with resources and support in order to aid their transition to college”
I Believe This Is Important*
%My School Does This*
%Gap
±
High school counselors 54 24 30
Race of counselor
White counselors 49 23 26
African American counselors 82 27 55
Hispanic counselors 66 22 44
Region
Northeast 55 24 31
Midwest 49 20 29
South 51 24 27
West 50 20 30
Type of school
All public 55 23 32
Urban public 61 25 36
Suburban public 47 17 30
Rural public 54 29 25
All private 51 34 17
Percentage of student population that is minority
0 to 24% 47 22 25
25 to 49% 49 22 27
50 to 74% 63 16 47
75% or more 69 28 41
Percentage of student population on free or reduced-price lunch
0 to 24% 38 20 18
25 to 49% 54 19 35
50 to 74% 67 25 42
75% or more 72 31 41
Title I
Schoolwide 67 27 40
Not schoolwide 43 20 23
Number of students in caseload
Fewer than 250 55 29 26
250–349 53 25 28
350–449 55 25 30
450 or more 55 14 41
College attendance rates (high school only)
High college attendance (86% or more) 43 23 20
Lower college attendance (64% and below) 60 22 38
*6–10 ratings on zero-to-10 scale: 10 = completely true statement
The College Board National Survey of School Counselors and Administrators 2012 | 25
Although more than half of high school counselors believe that helping students transition to college during the summer after they graduate is important, fewer than 1 in 4 say that this is something their school actually does. Only 24% of high school counselors say that their school “assists seniors throughout the summer after they graduate to provide them with resources and support to aid their transition to college,” as indicated by a six or higher on a zero-to-10 scale. High school counselors at private schools (34% compared with 23% in public schools) are more likely than most to say that their school helps students who have graduated during the summer.
It also appears that compared with counselors at more advantaged schools, counselors in disadvantaged schools are more likely to help graduating seniors transition to college during the summer after they graduate. While only 20% of counselors at advantaged schools say that this already happens in their schools, 31% of counselors in disadvantaged schools say that it does. Nevertheless, large gaps exist across groups between the proportion who believe assisting graduated students in the summer after they graduate is important and the proportion who report that this is something their school actually does. African American counselors show the largest discrepancy, as 82% believe that helping seniors transition to college the summer after they graduate is important, while only 27% say this happens in their schools (a gap of 55 points.)
26 | Report on Survey Findings
Section 3: Commitment — Counselors’ and Administrators’ Commitment to the Eight ComponentsCounselors’ Commitment to NOSCA’s Eight Components The 2011 national survey of school counselors demonstrated that the eight components developed by NOSCA to ensure that all students graduate from high school ready to succeed in college and career deeply resonate with school counselors’ own practice. Not only do school counselors strongly believe that each of the components is important to a counseling system focused on college and career readiness, but they also are personally committed to each and every one of the eight components. When asked to rate each component on a zero-to-10 scale on which a zero means “not at all committed” and a 10 means “extremely committed,” every component received an eight or higher from a large majority of counselors. At the top (see Table 10) is commitment to “Academic planning for college and career readiness.” Nine in 10 (90%) counselors say that they are very committed (as indexed by an eight or higher) to “advancing students’ planning, preparation, participation, and performance in a rigorous academic program that connects to their college and career aspirations and goals.”
Ensuring that students’ academic pursuits and preparation connect to their future goals emerges again in the second most popular component: “Provide early and ongoing exposure to experiences and information necessary to make informed decisions when selecting a college or career that connects to academic preparation and future aspirations.” Fully 89% of school counselors say that they are very committed to this component. Although “enrichment and extracurricular engagement” are at the bottom of the list, a large majority (77%) of counselors still say that they are very committed to this component, which is described as “ensur[ing] equitable exposure to a wide range of
extracurricular opportunities that build leadership, nurture talents and interests, and increase engagement with school.”
Of interest, “enrichment and extracurricular engagement” is the one component in which middle school counselors demonstrate stronger personal commitment (80%) than do high school counselors (76%). Perhaps because of temporal proximity, middle school counselors may see components related explicitly to the process of college admittance as more the domain of high school counselors. The data certainly support this possibility, as high school counselors evince stronger commitment to seven of the eight components and the most dramatic differences appear on components related to the logistics of getting into college. For example, while 9 in 10 high school counselors (90%) say they are very committed to “ensuring that students and families have an early and ongoing understanding of the college application and admission processes so they can find the postsecondary options that are the best fit with their aspirations and interests,” only 72% of middle school counselors say the same (a difference of 18 points). Even so, middle school counselors remain strongly devoted to setting their students up to succeed in college and career, as 80% say they are very committed to nurturing students’ college aspirations by working to build a college-going culture in their schools.
Administrators’ Support for the Eight ComponentsSchool counselors receive administrators’ support and encouragement to adopt NOSCA’s eight components into their counseling practice. For each of the eight components, at least 7 in 10 school administrators rate themselves as an eight or higher on a zero-to-10 scale regarding the extent to which they support school counselors in their school incorporating each of the eight components into their
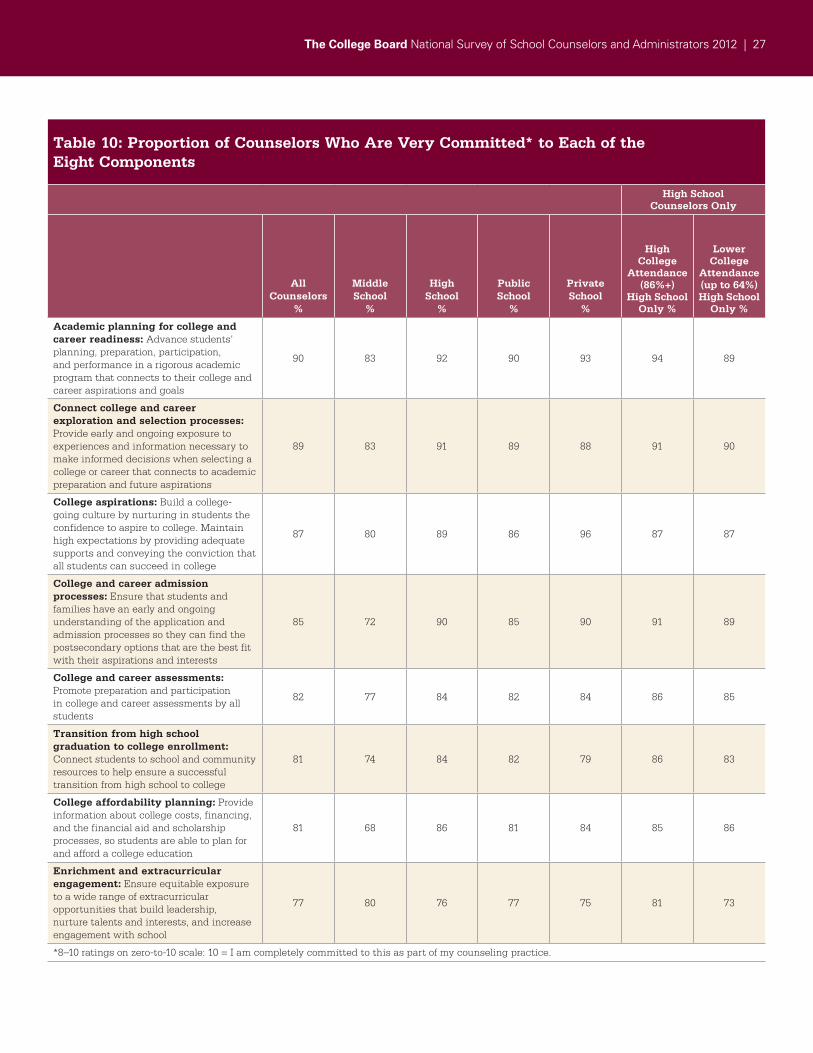
The College Board National Survey of School Counselors and Administrators 2012 | 27
Table 10: Proportion of Counselors Who Are Very Committed* to Each of the Eight Components
High School Counselors Only
AllCounselors
%
MiddleSchool
%
HighSchool
%
Public School
%
Private School
%
High College
Attendance (86%+)
High School Only %
Lower College
Attendance(up to 64%) High School
Only %
Academic planning for college and career readiness: Advance students’ planning, preparation, participation, and performance in a rigorous academic program that connects to their college and career aspirations and goals
90 83 92 90 93 94 89
Connect college and career exploration and selection processes: Provide early and ongoing exposure to experiences and information necessary to make informed decisions when selecting a college or career that connects to academic preparation and future aspirations
89 83 91 89 88 91 90
College aspirations: Build a college-going culture by nurturing in students the confidence to aspire to college. Maintain high expectations by providing adequate supports and conveying the conviction that all students can succeed in college
87 80 89 86 96 87 87
College and career admission processes: Ensure that students and families have an early and ongoing understanding of the application and admission processes so they can find the postsecondary options that are the best fit with their aspirations and interests
85 72 90 85 90 91 89
College and career assessments: Promote preparation and participation in college and career assessments by all students
82 77 84 82 84 86 85
Transition from high school graduation to college enrollment: Connect students to school and community resources to help ensure a successful transition from high school to college
81 74 84 82 79 86 83
College affordability planning: Provide information about college costs, financing, and the financial aid and scholarship processes, so students are able to plan for and afford a college education
81 68 86 81 84 85 86
Enrichment and extracurricular engagement: Ensure equitable exposure to a wide range of extracurricular opportunities that build leadership, nurture talents and interests, and increase engagement with school
77 80 76 77 75 81 73
*8–10 ratings on zero-to-10 scale: 10 = I am completely committed to this as part of my counseling practice.
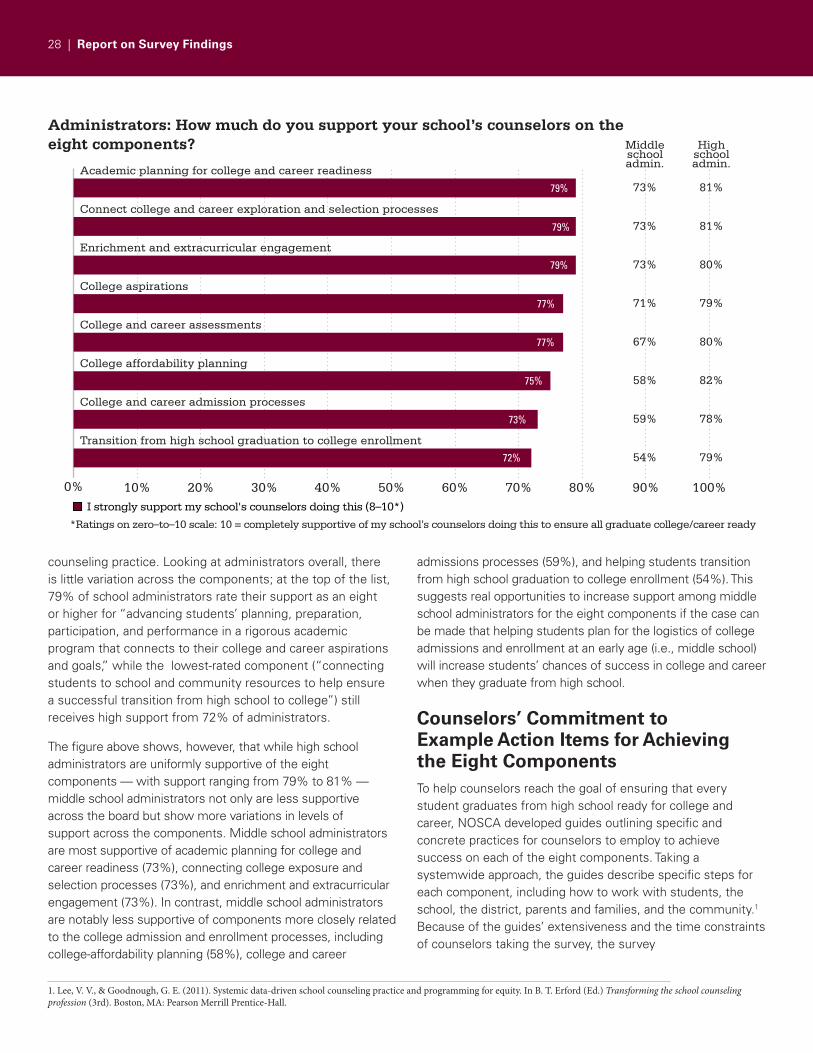
28 | Report on Survey Findings
counseling practice. Looking at administrators overall, there is little variation across the components; at the top of the list, 79% of school administrators rate their support as an eight or higher for “advancing students’ planning, preparation, participation, and performance in a rigorous academic program that connects to their college and career aspirations and goals,” while the lowest-rated component (“connecting students to school and community resources to help ensure a successful transition from high school to college”) still receives high support from 72% of administrators.
The figure above shows, however, that while high school administrators are uniformly supportive of the eight components — with support ranging from 79% to 81% — middle school administrators not only are less supportive across the board but show more variations in levels of support across the components. Middle school administrators are most supportive of academic planning for college and career readiness (73%), connecting college exposure and selection processes (73%), and enrichment and extracurricular engagement (73%). In contrast, middle school administrators are notably less supportive of components more closely related to the college admission and enrollment processes, including college-affordability planning (58%), college and career
admissions processes (59%), and helping students transition from high school graduation to college enrollment (54%). This suggests real opportunities to increase support among middle school administrators for the eight components if the case can be made that helping students plan for the logistics of college admissions and enrollment at an early age (i.e., middle school) will increase students’ chances of success in college and career when they graduate from high school.
Counselors’ Commitment to Example Action Items for Achieving the Eight ComponentsTo help counselors reach the goal of ensuring that every student graduates from high school ready for college and career, NOSCA developed guides outlining specific and concrete practices for counselors to employ to achieve success on each of the eight components. Taking a systemwide approach, the guides describe specific steps for each component, including how to work with students, the school, the district, parents and families, and the community.1 Because of the guides’ extensiveness and the time constraints of counselors taking the survey, the survey
Administrators: How much do you support your school’s counselors on the eight components?
*Ratings on zero–to–10 scale: 10 = completely supportive of my school’s counselors doing this to ensure all graduate college/career ready
Academic planning for college and career readiness
Connect college and career exploration and selection processes
Enrichment and extracurricular engagement
College aspirations
College and career assessments
College affordability planning
College and career admission processes
Transition from high school graduation to college enrollment
I strongly support my school's counselors doing this (8–10*)
Middleschooladmin.
73%
73%
73%
71%
67%
58%
59%
54%
Highschooladmin.
81%
81%
80%
79%
80%
82%
78%
79%
0% 10% 20% 30% 40% 50% 60% 70% 80% 90% 100%
79%
79%
79%
77%
77%
75%
73%
72%
1. Lee, V. V., & Goodnough, G. E. (2011). Systemic data-driven school counseling practice and programming for equity. In B. T. Erford (Ed.) Transforming the school counseling profession (3rd). Boston, MA: Pearson Merrill Prentice-Hall.
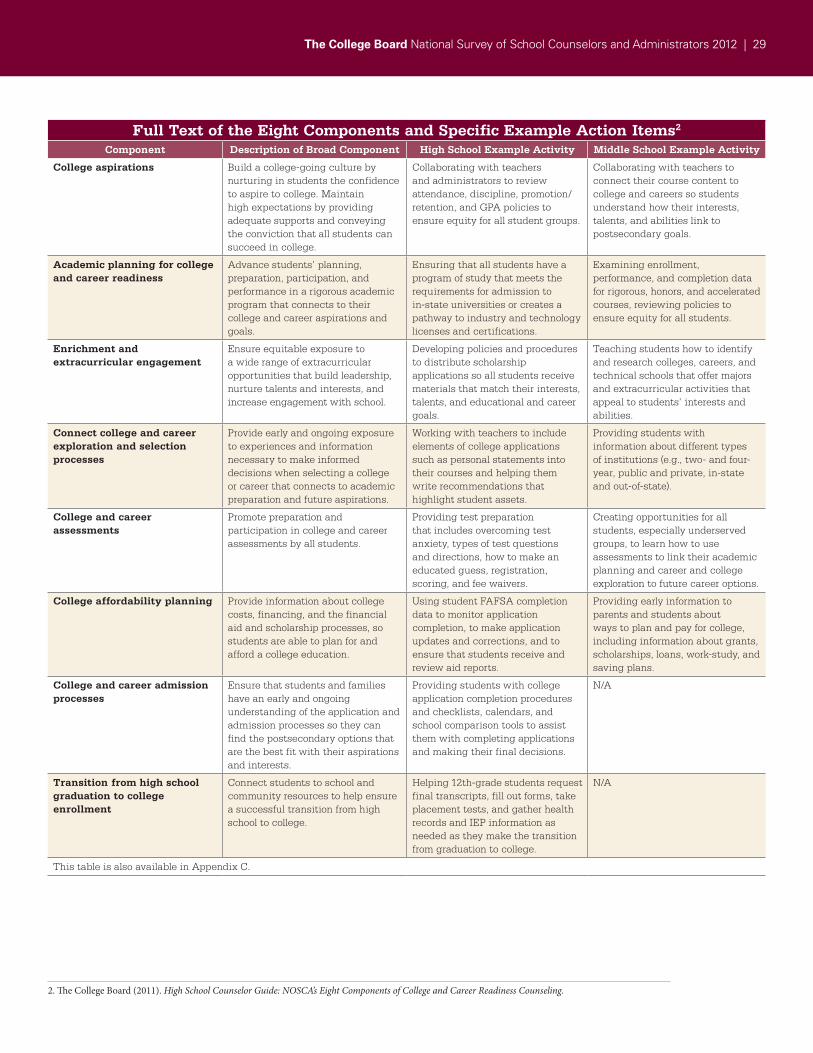
The College Board National Survey of School Counselors and Administrators 2012 | 29
Full Text of the Eight Components and Specific Example Action Items2
Component Description of Broad Component High School Example Activity Middle School Example Activity
College aspirations Build a college-going culture by nurturing in students the confidence to aspire to college. Maintain high expectations by providing adequate supports and conveying the conviction that all students can succeed in college.
Collaborating with teachers and administrators to review attendance, discipline, promotion/retention, and GPA policies to ensure equity for all student groups.
Collaborating with teachers to connect their course content to college and careers so students understand how their interests, talents, and abilities link to postsecondary goals.
Academic planning for college and career readiness
Advance students’ planning, preparation, participation, and performance in a rigorous academic program that connects to their college and career aspirations and goals.
Ensuring that all students have a program of study that meets the requirements for admission to in-state universities or creates a pathway to industry and technology licenses and certifications.
Examining enrollment, performance, and completion data for rigorous, honors, and accelerated courses, reviewing policies to ensure equity for all students.
Enrichment and extracurricular engagement
Ensure equitable exposure to a wide range of extracurricular opportunities that build leadership, nurture talents and interests, and increase engagement with school.
Developing policies and procedures to distribute scholarship applications so all students receive materials that match their interests, talents, and educational and career goals.
Teaching students how to identify and research colleges, careers, and technical schools that offer majors and extracurricular activities that appeal to students’ interests and abilities.
Connect college and career exploration and selection processes
Provide early and ongoing exposure to experiences and information necessary to make informed decisions when selecting a college or career that connects to academic preparation and future aspirations.
Working with teachers to include elements of college applications such as personal statements into their courses and helping them write recommendations that highlight student assets.
Providing students with information about different types of institutions (e.g., two- and four-year, public and private, in-state and out-of-state).
College and career assessments
Promote preparation and participation in college and career assessments by all students.
Providing test preparation that includes overcoming test anxiety, types of test questions and directions, how to make an educated guess, registration, scoring, and fee waivers.
Creating opportunities for all students, especially underserved groups, to learn how to use assessments to link their academic planning and career and college exploration to future career options.
College affordability planning Provide information about college costs, financing, and the financial aid and scholarship processes, so students are able to plan for and afford a college education.
Using student FAFSA completion data to monitor application completion, to make application updates and corrections, and to ensure that students receive and review aid reports.
Providing early information to parents and students about ways to plan and pay for college, including information about grants, scholarships, loans, work-study, and saving plans.
College and career admission processes
Ensure that students and families have an early and ongoing understanding of the application and admission processes so they can find the postsecondary options that are the best fit with their aspirations and interests.
Providing students with college application completion procedures and checklists, calendars, and school comparison tools to assist them with completing applications and making their final decisions.
N/A
Transition from high school graduation to college enrollment
Connect students to school and community resources to help ensure a successful transition from high school to college.
Helping 12th-grade students request final transcripts, fill out forms, take placement tests, and gather health records and IEP information as needed as they make the transition from graduation to college.
N/A
This table is also available in Appendix C.
2. The College Board (2011). High School Counselor Guide: NOSCA’s Eight Components of College and Career Readiness Counseling.
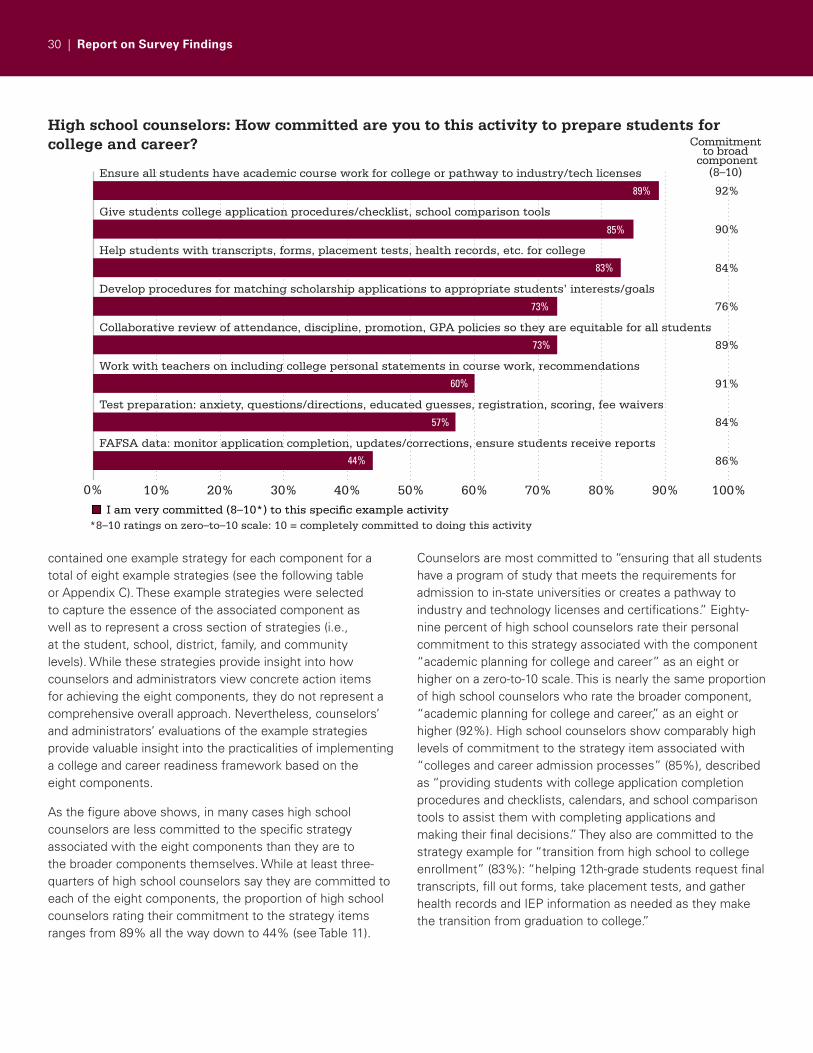
30 | Report on Survey Findings
contained one example strategy for each component for a total of eight example strategies (see the following table or Appendix C). These example strategies were selected to capture the essence of the associated component as well as to represent a cross section of strategies (i.e., at the student, school, district, family, and community levels). While these strategies provide insight into how counselors and administrators view concrete action items for achieving the eight components, they do not represent a comprehensive overall approach. Nevertheless, counselors’ and administrators’ evaluations of the example strategies provide valuable insight into the practicalities of implementing a college and career readiness framework based on the eight components.
As the figure above shows, in many cases high school counselors are less committed to the specific strategy associated with the eight components than they are to the broader components themselves. While at least three-quarters of high school counselors say they are committed to each of the eight components, the proportion of high school counselors rating their commitment to the strategy items ranges from 89% all the way down to 44% (see Table 11).
Counselors are most committed to “ensuring that all students have a program of study that meets the requirements for admission to in-state universities or creates a pathway to industry and technology licenses and certifications.” Eighty-nine percent of high school counselors rate their personal commitment to this strategy associated with the component “academic planning for college and career” as an eight or higher on a zero-to-10 scale. This is nearly the same proportion of high school counselors who rate the broader component, “academic planning for college and career,” as an eight or higher (92%). High school counselors show comparably high levels of commitment to the strategy item associated with “colleges and career admission processes” (85%), described as “providing students with college application completion procedures and checklists, calendars, and school comparison tools to assist them with completing applications and making their final decisions.” They also are committed to the strategy example for “transition from high school to college enrollment” (83%): “helping 12th-grade students request final transcripts, fill out forms, take placement tests, and gather health records and IEP information as needed as they make the transition from graduation to college.”
High school counselors: How committed are you to this activity to prepare students for college and career?
*8–10 ratings on zero–to–10 scale: 10 = completely committed to doing this activity
Ensure all students have academic course work for college or pathway to industry/tech licenses
Give students college application procedures/checklist, school comparison tools
Help students with transcripts, forms, placement tests, health records, etc. for college
Develop procedures for matching scholarship applications to appropriate students’ interests/goals
Collaborative review of attendance, discipline, promotion, GPA policies so they are equitable for all students
Work with teachers on including college personal statements in course work, recommendations
Test preparation: anxiety, questions/directions, educated guesses, registration, scoring, fee waivers
FAFSA data: monitor application completion, updates/corrections, ensure students receive reports
I am very committed (8–10*) to this speci�c example activity
Commitment to broad
component(8–10)
92%
90%
84%
76%
89%
91%
84%
86%
0% 10% 20% 30% 40% 50% 60% 70% 80% 90% 100%
89%
85%
83%
73%
73%
60%
57%
44%
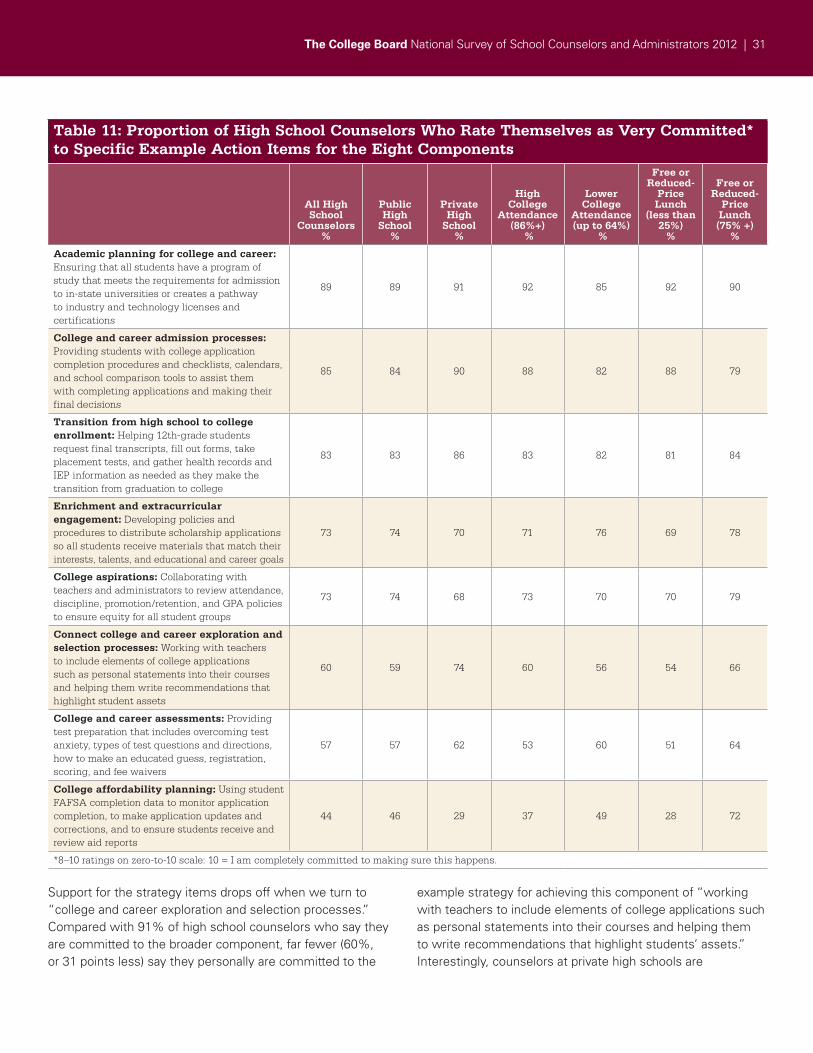
The College Board National Survey of School Counselors and Administrators 2012 | 31
Support for the strategy items drops off when we turn to “college and career exploration and selection processes.” Compared with 91% of high school counselors who say they are committed to the broader component, far fewer (60%, or 31 points less) say they personally are committed to the
example strategy for achieving this component of “working with teachers to include elements of college applications such as personal statements into their courses and helping them to write recommendations that highlight students’ assets.” Interestingly, counselors at private high schools are
Table 11: Proportion of High School Counselors Who Rate Themselves as Very Committed* to Specific Example Action Items for the Eight Components
All HighSchool
Counselors%
Public High
School%
Private High
School%
High College
Attendance (86%+)
%
Lower College
Attendance(up to 64%)
%
Free or Reduced-
Price Lunch
(less than 25%)
%
Free or Reduced-
Price Lunch (75% +)
%
Academic planning for college and career: Ensuring that all students have a program of study that meets the requirements for admission to in-state universities or creates a pathway to industry and technology licenses and certifications
89 89 91 92 85 92 90
College and career admission processes: Providing students with college application completion procedures and checklists, calendars, and school comparison tools to assist them with completing applications and making their final decisions
85 84 90 88 82 88 79
Transition from high school to college enrollment: Helping 12th-grade students request final transcripts, fill out forms, take placement tests, and gather health records and IEP information as needed as they make the transition from graduation to college
83 83 86 83 82 81 84
Enrichment and extracurricular engagement: Developing policies and procedures to distribute scholarship applications so all students receive materials that match their interests, talents, and educational and career goals
73 74 70 71 76 69 78
College aspirations: Collaborating with teachers and administrators to review attendance, discipline, promotion/retention, and GPA policies to ensure equity for all student groups
73 74 68 73 70 70 79
Connect college and career exploration and selection processes: Working with teachers to include elements of college applications such as personal statements into their courses and helping them write recommendations that highlight student assets
60 59 74 60 56 54 66
College and career assessments: Providing test preparation that includes overcoming test anxiety, types of test questions and directions, how to make an educated guess, registration, scoring, and fee waivers
57 57 62 53 60 51 64
College affordability planning: Using student FAFSA completion data to monitor application completion, to make application updates and corrections, and to ensure students receive and review aid reports
44 46 29 37 49 28 72
*8–10 ratings on zero-to-10 scale: 10 = I am completely committed to making sure this happens.
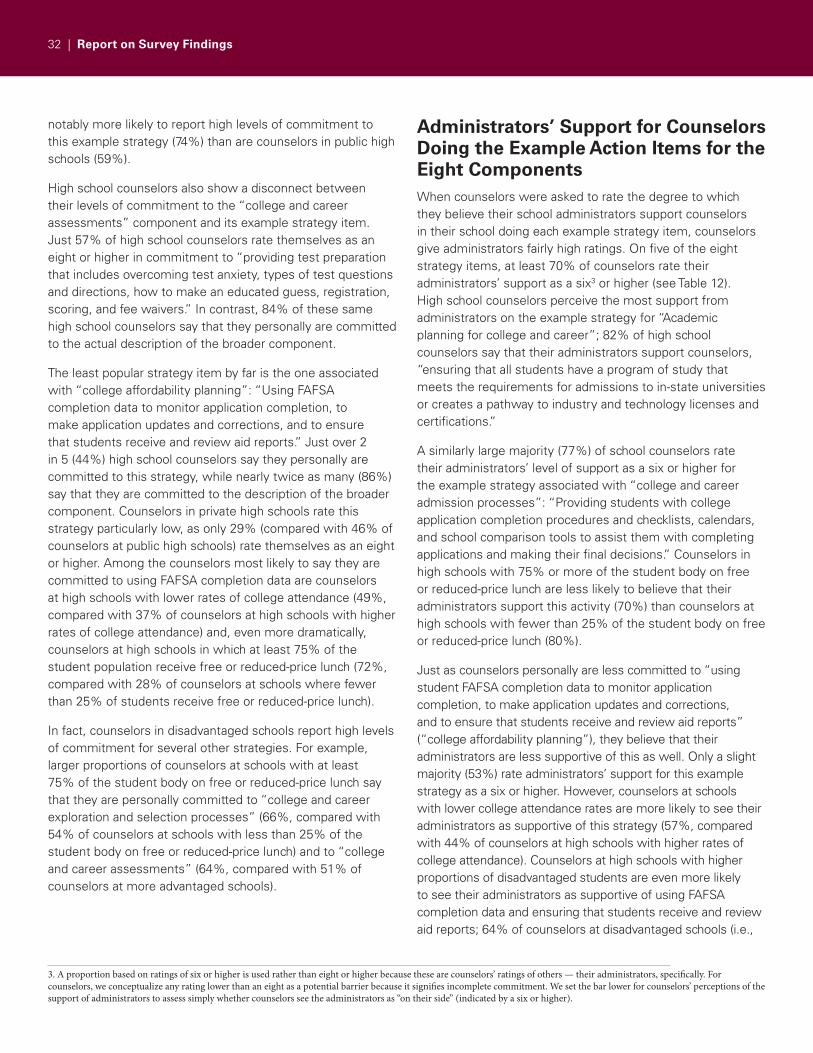
32 | Report on Survey Findings
notably more likely to report high levels of commitment to this example strategy (74%) than are counselors in public high schools (59%).
High school counselors also show a disconnect between their levels of commitment to the “college and career assessments” component and its example strategy item. Just 57% of high school counselors rate themselves as an eight or higher in commitment to “providing test preparation that includes overcoming test anxiety, types of test questions and directions, how to make an educated guess, registration, scoring, and fee waivers.” In contrast, 84% of these same high school counselors say that they personally are committed to the actual description of the broader component.
The least popular strategy item by far is the one associated with “college affordability planning”: “Using FAFSA completion data to monitor application completion, to make application updates and corrections, and to ensure that students receive and review aid reports.” Just over 2 in 5 (44%) high school counselors say they personally are committed to this strategy, while nearly twice as many (86%) say that they are committed to the description of the broader component. Counselors in private high schools rate this strategy particularly low, as only 29% (compared with 46% of counselors at public high schools) rate themselves as an eight or higher. Among the counselors most likely to say they are committed to using FAFSA completion data are counselors at high schools with lower rates of college attendance (49%, compared with 37% of counselors at high schools with higher rates of college attendance) and, even more dramatically, counselors at high schools in which at least 75% of the student population receive free or reduced-price lunch (72%, compared with 28% of counselors at schools where fewer than 25% of students receive free or reduced-price lunch).
In fact, counselors in disadvantaged schools report high levels of commitment for several other strategies. For example, larger proportions of counselors at schools with at least 75% of the student body on free or reduced-price lunch say that they are personally committed to “college and career exploration and selection processes” (66%, compared with 54% of counselors at schools with less than 25% of the student body on free or reduced-price lunch) and to “college and career assessments” (64%, compared with 51% of counselors at more advantaged schools).
Administrators’ Support for Counselors Doing the Example Action Items for the Eight ComponentsWhen counselors were asked to rate the degree to which they believe their school administrators support counselors in their school doing each example strategy item, counselors give administrators fairly high ratings. On five of the eight strategy items, at least 70% of counselors rate their administrators’ support as a six3 or higher (see Table 12). High school counselors perceive the most support from administrators on the example strategy for “Academic planning for college and career”; 82% of high school counselors say that their administrators support counselors, “ensuring that all students have a program of study that meets the requirements for admissions to in-state universities or creates a pathway to industry and technology licenses and certifications.”
A similarly large majority (77%) of school counselors rate their administrators’ level of support as a six or higher for the example strategy associated with “college and career admission processes”: “Providing students with college application completion procedures and checklists, calendars, and school comparison tools to assist them with completing applications and making their final decisions.” Counselors in high schools with 75% or more of the student body on free or reduced-price lunch are less likely to believe that their administrators support this activity (70%) than counselors at high schools with fewer than 25% of the student body on free or reduced-price lunch (80%).
Just as counselors personally are less committed to “using student FAFSA completion data to monitor application completion, to make application updates and corrections, and to ensure that students receive and review aid reports” (“college affordability planning”), they believe that their administrators are less supportive of this as well. Only a slight majority (53%) rate administrators’ support for this example strategy as a six or higher. However, counselors at schools with lower college attendance rates are more likely to see their administrators as supportive of this strategy (57%, compared with 44% of counselors at high schools with higher rates of college attendance). Counselors at high schools with higher proportions of disadvantaged students are even more likely to see their administrators as supportive of using FAFSA completion data and ensuring that students receive and review aid reports; 64% of counselors at disadvantaged schools (i.e.,
3. A proportion based on ratings of six or higher is used rather than eight or higher because these are counselors’ ratings of others — their administrators, specifically. For counselors, we conceptualize any rating lower than an eight as a potential barrier because it signifies incomplete commitment. We set the bar lower for counselors’ perceptions of the support of administrators to assess simply whether counselors see the administrators as “on their side” (indicated by a six or higher).
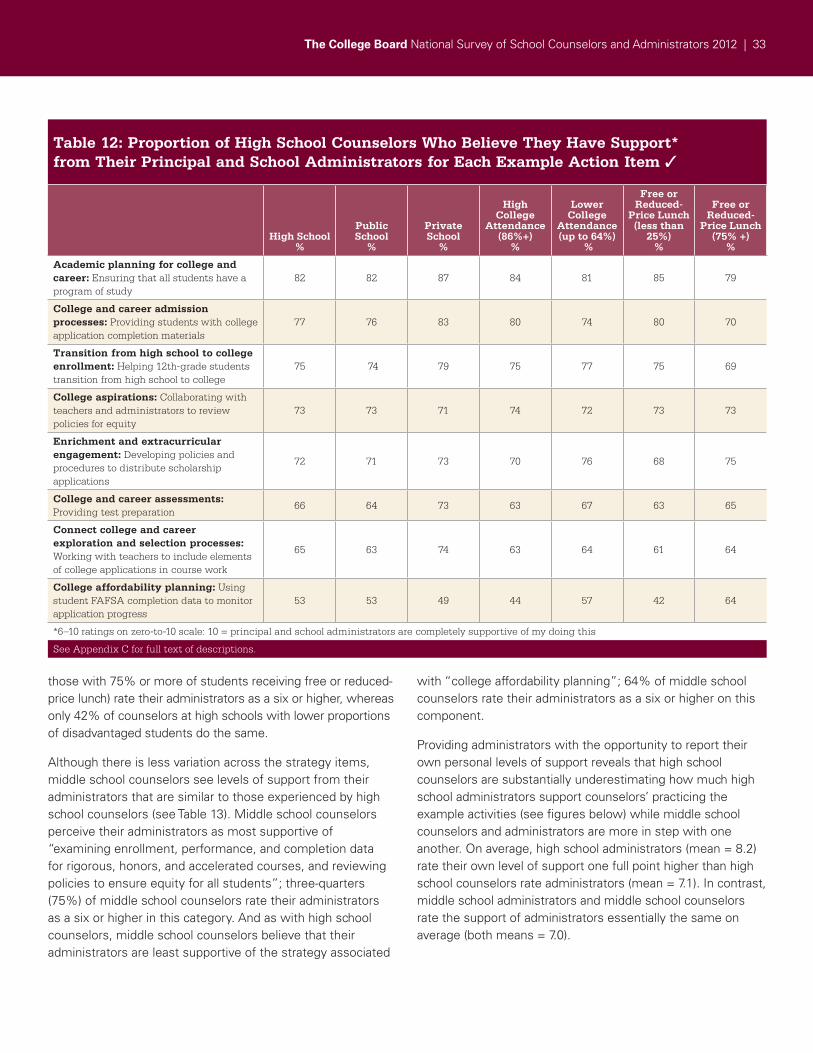
The College Board National Survey of School Counselors and Administrators 2012 | 33
those with 75% or more of students receiving free or reduced-price lunch) rate their administrators as a six or higher, whereas only 42% of counselors at high schools with lower proportions of disadvantaged students do the same.
Although there is less variation across the strategy items, middle school counselors see levels of support from their administrators that are similar to those experienced by high school counselors (see Table 13). Middle school counselors perceive their administrators as most supportive of “examining enrollment, performance, and completion data for rigorous, honors, and accelerated courses, and reviewing policies to ensure equity for all students”; three-quarters (75%) of middle school counselors rate their administrators as a six or higher in this category. And as with high school counselors, middle school counselors believe that their administrators are least supportive of the strategy associated
with “college affordability planning”; 64% of middle school counselors rate their administrators as a six or higher on this component.
Providing administrators with the opportunity to report their own personal levels of support reveals that high school counselors are substantially underestimating how much high school administrators support counselors’ practicing the example activities (see figures below) while middle school counselors and administrators are more in step with one another. On average, high school administrators (mean = 8.2) rate their own level of support one full point higher than high school counselors rate administrators (mean = 7.1). In contrast, middle school administrators and middle school counselors rate the support of administrators essentially the same on average (both means = 7.0).
Table 12: Proportion of High School Counselors Who Believe They Have Support* from Their Principal and School Administrators for Each Example Action Item ✓
High School%
Public School
%
Private School
%
High College
Attendance (86%+)
%
Lower College
Attendance(up to 64%)
%
Free or Reduced-
Price Lunch (less than
25%)%
Free or Reduced-
Price Lunch (75% +)
%
Academic planning for college and career: Ensuring that all students have a program of study
82 82 87 84 81 85 79
College and career admission processes: Providing students with college application completion materials
77 76 83 80 74 80 70
Transition from high school to college enrollment: Helping 12th-grade students transition from high school to college
75 74 79 75 77 75 69
College aspirations: Collaborating with teachers and administrators to review policies for equity
73 73 71 74 72 73 73
Enrichment and extracurricular engagement: Developing policies and procedures to distribute scholarship applications
72 71 73 70 76 68 75
College and career assessments: Providing test preparation
66 64 73 63 67 63 65
Connect college and career exploration and selection processes: Working with teachers to include elements of college applications in course work
65 63 74 63 64 61 64
College affordability planning: Using student FAFSA completion data to monitor application progress
53 53 49 44 57 42 64
*6–10 ratings on zero-to-10 scale: 10 = principal and school administrators are completely supportive of my doing this
See Appendix C for full text of descriptions.
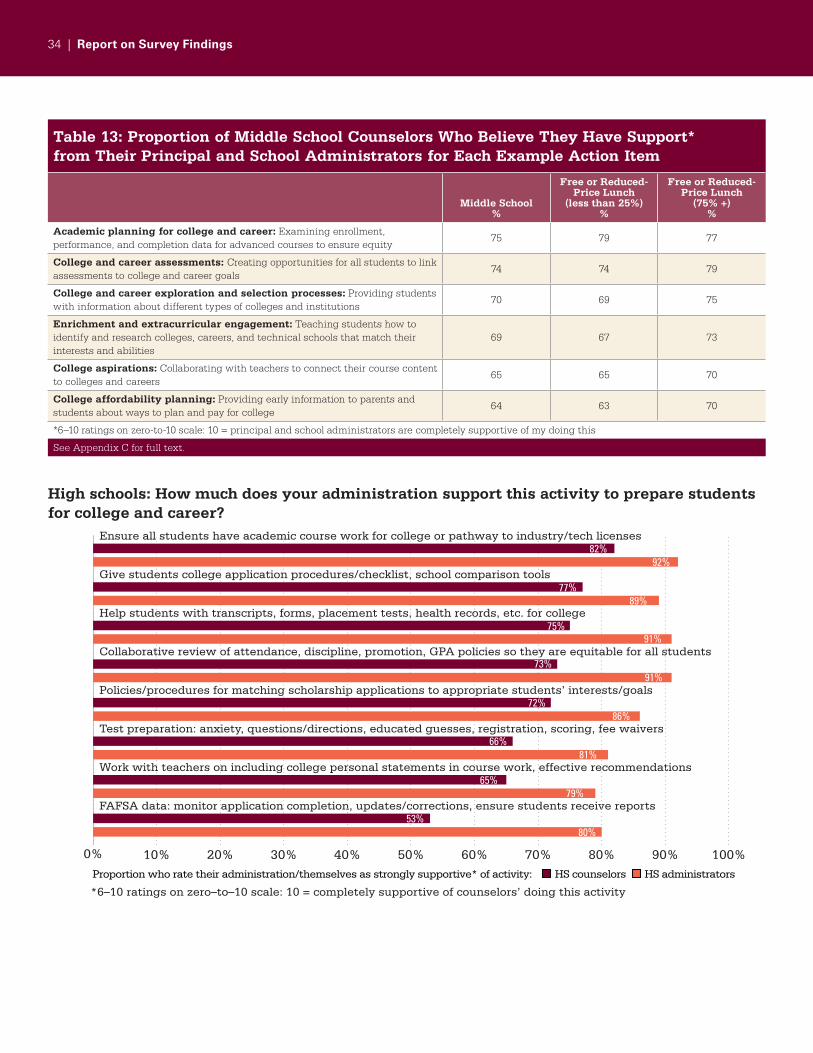
34 | Report on Survey Findings
High schools: How much does your administration support this activity to prepare students for college and career?
*6–10 ratings on zero–to–10 scale: 10 = completely supportive of counselors’ doing this activity
Ensure all students have academic course work for college or pathway to industry/tech licenses
Give students college application procedures/checklist, school comparison tools
Help students with transcripts, forms, placement tests, health records, etc. for college
Collaborative review of attendance, discipline, promotion, GPA policies so they are equitable for all students
Policies/procedures for matching scholarship applications to appropriate students’ interests/goals
Test preparation: anxiety, questions/directions, educated guesses, registration, scoring, fee waivers
Work with teachers on including college personal statements in course work, effective recommendations
FAFSA data: monitor application completion, updates/corrections, ensure students receive reports
Proportion who rate their administration/themselves as strongly supportive* of activity: HS administrators HS counselors
0% 10% 20% 30% 40% 50% 60% 70% 80% 90% 100%
82% 92%
77% 89%
75%
86%72%
91%73%
91%
66% 81%
65% 79%
53% 80%
Table 13: Proportion of Middle School Counselors Who Believe They Have Support* from Their Principal and School Administrators for Each Example Action Item
Middle School%
Free or Reduced-Price Lunch
(less than 25%)%
Free or Reduced-Price Lunch
(75% +)%
Academic planning for college and career: Examining enrollment, performance, and completion data for advanced courses to ensure equity
75 79 77
College and career assessments: Creating opportunities for all students to link assessments to college and career goals
74 74 79
College and career exploration and selection processes: Providing students with information about different types of colleges and institutions
70 69 75
Enrichment and extracurricular engagement: Teaching students how to identify and research colleges, careers, and technical schools that match their interests and abilities
69 67 73
College aspirations: Collaborating with teachers to connect their course content to colleges and careers
65 65 70
College affordability planning: Providing early information to parents and students about ways to plan and pay for college
64 63 70
*6–10 ratings on zero-to-10 scale: 10 = principal and school administrators are completely supportive of my doing this
See Appendix C for full text.
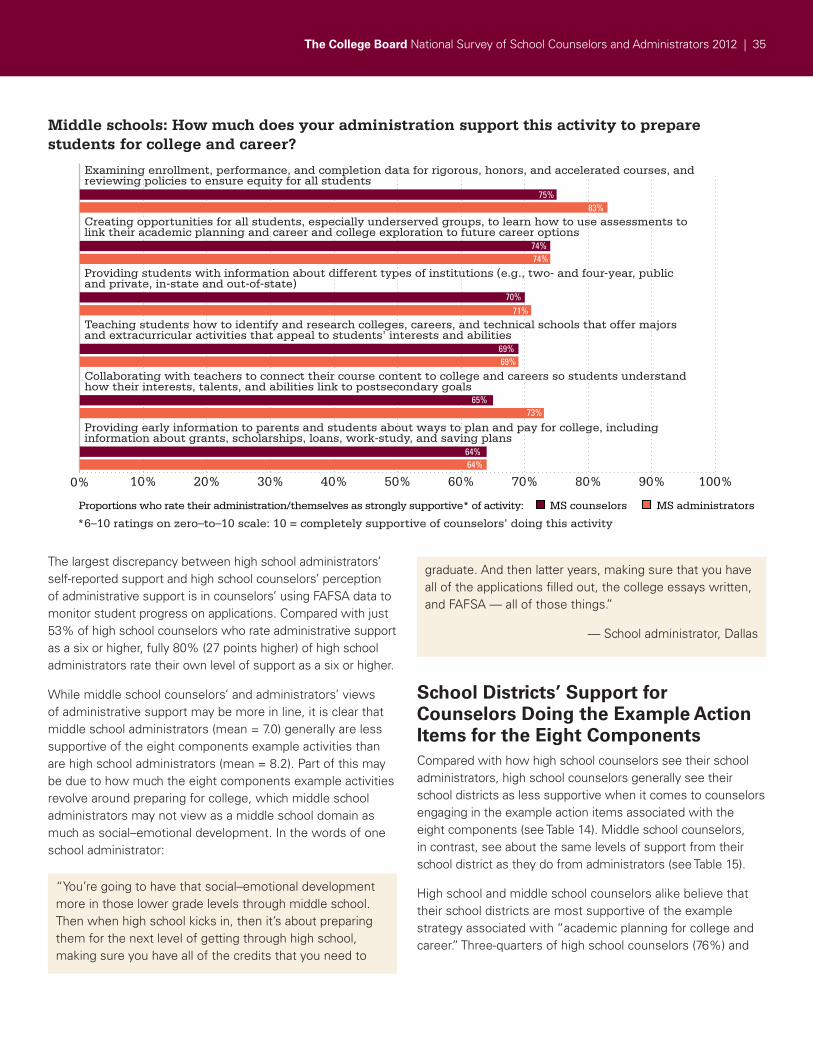
The College Board National Survey of School Counselors and Administrators 2012 | 35
The largest discrepancy between high school administrators’ self-reported support and high school counselors’ perception of administrative support is in counselors’ using FAFSA data to monitor student progress on applications. Compared with just 53% of high school counselors who rate administrative support as a six or higher, fully 80% (27 points higher) of high school administrators rate their own level of support as a six or higher.
While middle school counselors’ and administrators’ views of administrative support may be more in line, it is clear that middle school administrators (mean = 7.0) generally are less supportive of the eight components example activities than are high school administrators (mean = 8.2). Part of this may be due to how much the eight components example activities revolve around preparing for college, which middle school administrators may not view as a middle school domain as much as social–emotional development. In the words of one school administrator:
School Districts’ Support for Counselors Doing the Example Action Items for the Eight ComponentsCompared with how high school counselors see their school administrators, high school counselors generally see their school districts as less supportive when it comes to counselors engaging in the example action items associated with the eight components (see Table 14). Middle school counselors, in contrast, see about the same levels of support from their school district as they do from administrators (see Table 15).
High school and middle school counselors alike believe that their school districts are most supportive of the example strategy associated with “academic planning for college and career.” Three-quarters of high school counselors (76%) and
Middle schools: How much does your administration support this activity to prepare students for college and career?
*6–10 ratings on zero–to–10 scale: 10 = completely supportive of counselors’ doing this activity
Examining enrollment, performance, and completion data for rigorous, honors, and accelerated courses, and reviewing policies to ensure equity for all students
Creating opportunities for all students, especially underserved groups, to learn how to use assessments to link their academic planning and career and college exploration to future career options
Providing students with information about different types of institutions (e.g., two- and four-year, public and private, in-state and out-of-state)
Teaching students how to identify and research colleges, careers, and technical schools that offer majors and extracurricular activities that appeal to students’ interests and abilities
Collaborating with teachers to connect their course content to college and careers so students understand how their interests, talents, and abilities link to postsecondary goals
Providing early information to parents and students about ways to plan and pay for college, including information about grants, scholarships, loans, work-study, and saving plans
Proportions who rate their administration/themselves as strongly supportive* of activity: MS administrators MS counselors
0% 10% 20% 30% 40% 50% 60% 70% 80% 90% 100%
75% 83%
74% 74%
70% 71%
69% 69%
65% 73%
64% 64%
graduate. And then latter years, making sure that you have all of the applications filled out, the college essays written, and FAFSA — all of those things.”
— School administrator, Dallas
“You’re going to have that social–emotional development more in those lower grade levels through middle school. Then when high school kicks in, then it’s about preparing them for the next level of getting through high school, making sure you have all of the credits that you need to
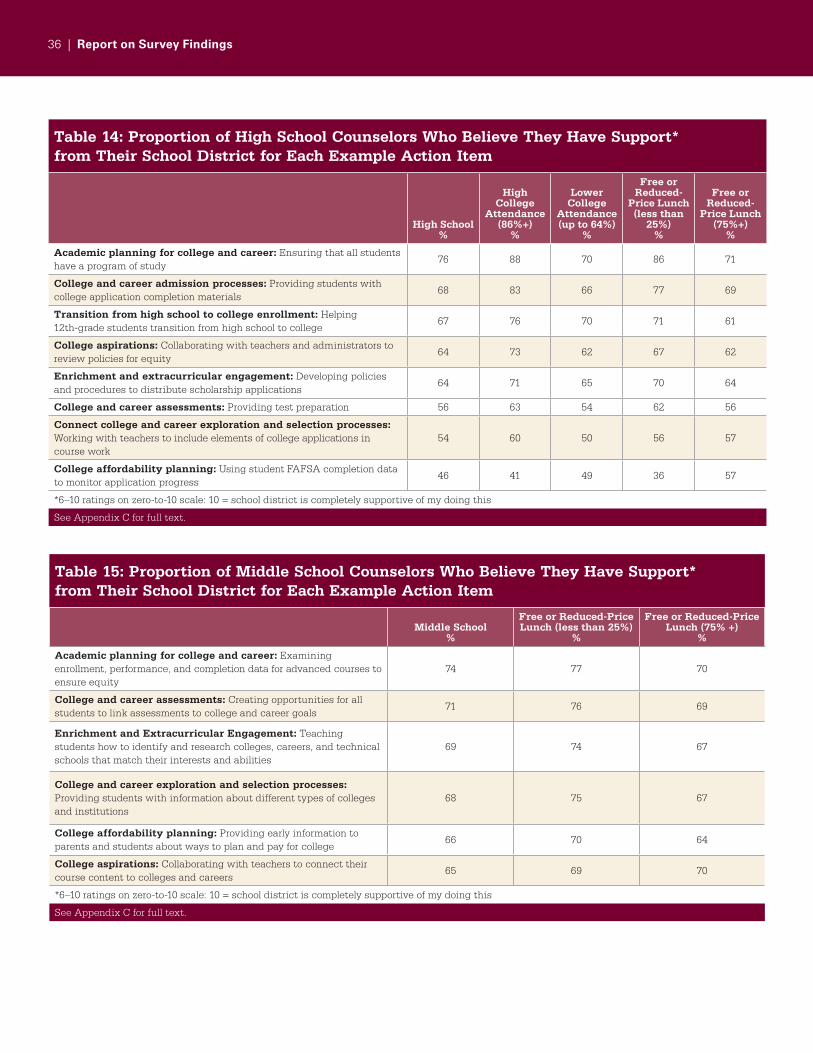
36 | Report on Survey Findings
Table 14: Proportion of High School Counselors Who Believe They Have Support*from Their School District for Each Example Action Item
High School%
High College
Attendance (86%+)
%
Lower College
Attendance (up to 64%)
%
Free or Reduced-
Price Lunch (less than
25%)%
Free or Reduced-
Price Lunch (75%+)
%
Academic planning for college and career: Ensuring that all students have a program of study
76 88 70 86 71
College and career admission processes: Providing students with college application completion materials
68 83 66 77 69
Transition from high school to college enrollment: Helping 12th-grade students transition from high school to college
67 76 70 71 61
College aspirations: Collaborating with teachers and administrators to review policies for equity
64 73 62 67 62
Enrichment and extracurricular engagement: Developing policies and procedures to distribute scholarship applications
64 71 65 70 64
College and career assessments: Providing test preparation 56 63 54 62 56
Connect college and career exploration and selection processes: Working with teachers to include elements of college applications in course work
54 60 50 56 57
College affordability planning: Using student FAFSA completion data to monitor application progress
46 41 49 36 57
*6–10 ratings on zero-to-10 scale: 10 = school district is completely supportive of my doing this
See Appendix C for full text.
Table 15: Proportion of Middle School Counselors Who Believe They Have Support* from Their School District for Each Example Action Item
Middle School%
Free or Reduced-Price Lunch (less than 25%)
%
Free or Reduced-Price Lunch (75% +)
%
Academic planning for college and career: Examining enrollment, performance, and completion data for advanced courses to ensure equity
74 77 70
College and career assessments: Creating opportunities for all students to link assessments to college and career goals
71 76 69
Enrichment and Extracurricular Engagement: Teaching students how to identify and research colleges, careers, and technical schools that match their interests and abilities
69 74 67
College and career exploration and selection processes: Providing students with information about different types of colleges and institutions
68 75 67
College affordability planning: Providing early information to parents and students about ways to plan and pay for college
66 70 64
College aspirations: Collaborating with teachers to connect their course content to colleges and careers
65 69 70
*6–10 ratings on zero-to-10 scale: 10 = school district is completely supportive of my doing this
See Appendix C for full text.
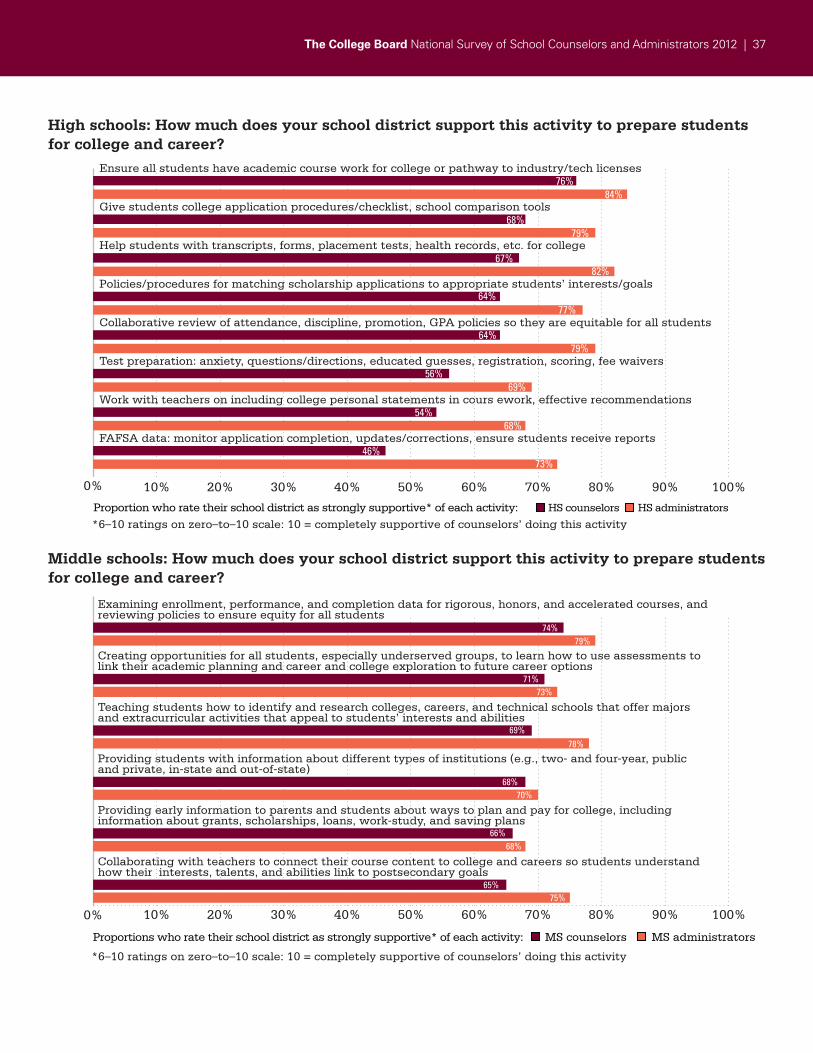
The College Board National Survey of School Counselors and Administrators 2012 | 37
High schools: How much does your school district support this activity to prepare students for college and career?
*6–10 ratings on zero–to–10 scale: 10 = completely supportive of counselors’ doing this activity
Ensure all students have academic course work for college or pathway to industry/tech licenses
Give students college application procedures/checklist, school comparison tools
Help students with transcripts, forms, placement tests, health records, etc. for college
Policies/procedures for matching scholarship applications to appropriate students’ interests/goals
Collaborative review of attendance, discipline, promotion, GPA policies so they are equitable for all students
Test preparation: anxiety, questions/directions, educated guesses, registration, scoring, fee waivers
Work with teachers on including college personal statements in cours ework, effective recommendations
FAFSA data: monitor application completion, updates/corrections, ensure students receive reports
Proportion who rate their school district as strongly supportive* of each activity: HS administrators HS counselors
0% 10% 20% 30% 40% 50% 60% 70% 80% 90% 100%
76% 84%
68% 79%
67%
79%64%
77%64%
82%
56% 69%
54% 68%
46% 73%
Middle schools: How much does your school district support this activity to prepare students for college and career?
*6–10 ratings on zero–to–10 scale: 10 = completely supportive of counselors’ doing this activity
Examining enrollment, performance, and completion data for rigorous, honors, and accelerated courses, and reviewing policies to ensure equity for all students
Creating opportunities for all students, especially underserved groups, to learn how to use assessments to link their academic planning and career and college exploration to future career options
Teaching students how to identify and research colleges, careers, and technical schools that offer majors and extracurricular activities that appeal to students’ interests and abilities
Providing students with information about different types of institutions (e.g., two- and four-year, public and private, in-state and out-of-state)
Providing early information to parents and students about ways to plan and pay for college, including information about grants, scholarships, loans, work-study, and saving plans
Collaborating with teachers to connect their course content to college and careers so students understand how their interests, talents, and abilities link to postsecondary goals
Proportions who rate their school district as strongly supportive* of each activity: MS administrators MS counselors
0% 10% 20% 30% 40% 50% 60% 70% 80% 90% 100%
74% 79%
71% 73%
69% 78%
68% 70%
66% 68%
65% 75%
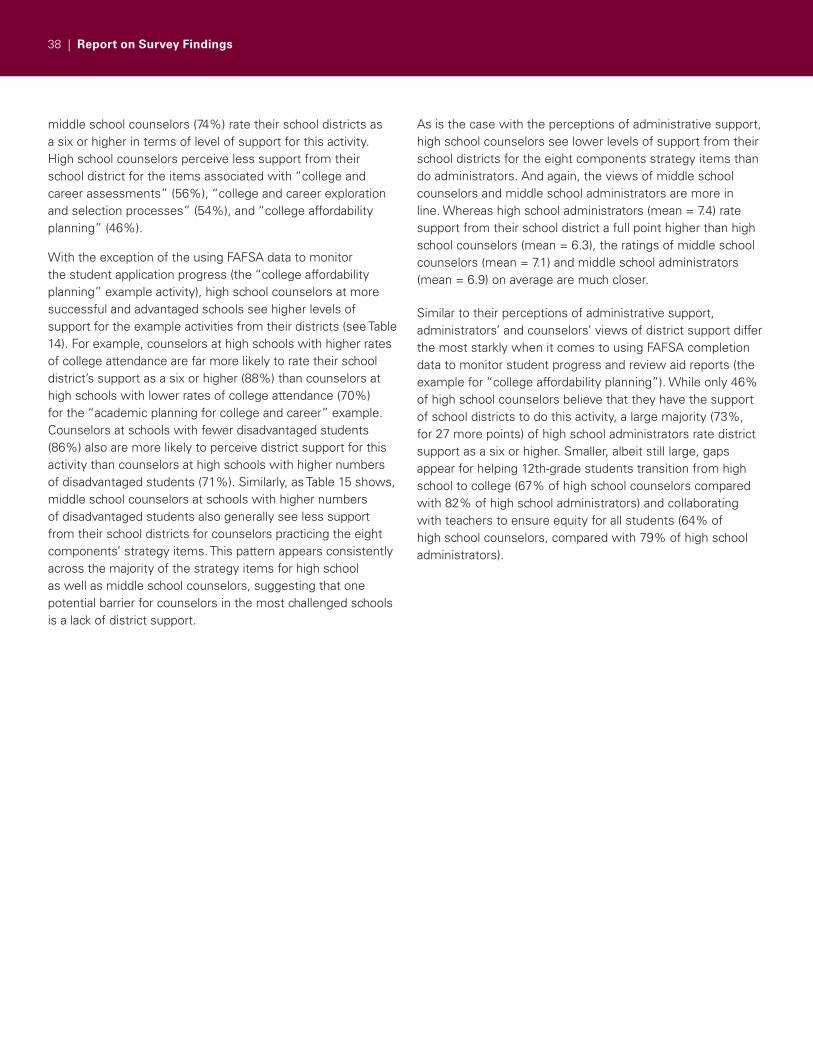
38 | Report on Survey Findings
middle school counselors (74%) rate their school districts as a six or higher in terms of level of support for this activity. High school counselors perceive less support from their school district for the items associated with “college and career assessments” (56%), “college and career exploration and selection processes” (54%), and “college affordability planning” (46%).
With the exception of the using FAFSA data to monitor the student application progress (the “college affordability planning” example activity), high school counselors at more successful and advantaged schools see higher levels of support for the example activities from their districts (see Table 14). For example, counselors at high schools with higher rates of college attendance are far more likely to rate their school district’s support as a six or higher (88%) than counselors at high schools with lower rates of college attendance (70%) for the “academic planning for college and career” example. Counselors at schools with fewer disadvantaged students (86%) also are more likely to perceive district support for this activity than counselors at high schools with higher numbers of disadvantaged students (71%). Similarly, as Table 15 shows, middle school counselors at schools with higher numbers of disadvantaged students also generally see less support from their school districts for counselors practicing the eight components’ strategy items. This pattern appears consistently across the majority of the strategy items for high school as well as middle school counselors, suggesting that one potential barrier for counselors in the most challenged schools is a lack of district support.
As is the case with the perceptions of administrative support, high school counselors see lower levels of support from their school districts for the eight components strategy items than do administrators. And again, the views of middle school counselors and middle school administrators are more in line. Whereas high school administrators (mean = 7.4) rate support from their school district a full point higher than high school counselors (mean = 6.3), the ratings of middle school counselors (mean = 7.1) and middle school administrators (mean = 6.9) on average are much closer.
Similar to their perceptions of administrative support, administrators’ and counselors’ views of district support differ the most starkly when it comes to using FAFSA completion data to monitor student progress and review aid reports (the example for “college affordability planning”). While only 46% of high school counselors believe that they have the support of school districts to do this activity, a large majority (73%, for 27 more points) of high school administrators rate district support as a six or higher. Smaller, albeit still large, gaps appear for helping 12th-grade students transition from high school to college (67% of high school counselors compared with 82% of high school administrators) and collaborating with teachers to ensure equity for all students (64% of high school counselors, compared with 79% of high school administrators).
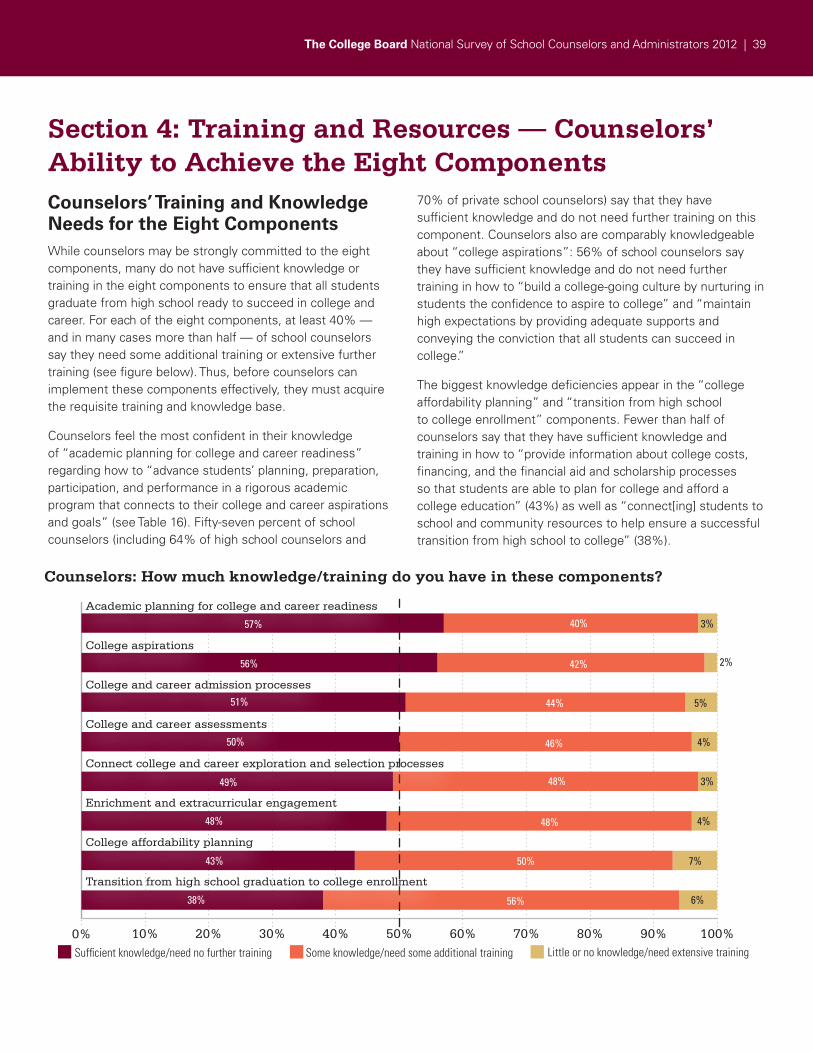
The College Board National Survey of School Counselors and Administrators 2012 | 39
Section 4: Training and Resources — Counselors’ Ability to Achieve the Eight ComponentsCounselors’ Training and Knowledge Needs for the Eight ComponentsWhile counselors may be strongly committed to the eight components, many do not have sufficient knowledge or training in the eight components to ensure that all students graduate from high school ready to succeed in college and career. For each of the eight components, at least 40% — and in many cases more than half — of school counselors say they need some additional training or extensive further training (see figure below). Thus, before counselors can implement these components effectively, they must acquire the requisite training and knowledge base.
Counselors feel the most confident in their knowledge of “academic planning for college and career readiness” regarding how to “advance students’ planning, preparation, participation, and performance in a rigorous academic program that connects to their college and career aspirations and goals” (see Table 16). Fifty-seven percent of school counselors (including 64% of high school counselors and
70% of private school counselors) say that they have sufficient knowledge and do not need further training on this component. Counselors also are comparably knowledgeable about “college aspirations”: 56% of school counselors say they have sufficient knowledge and do not need further training in how to “build a college-going culture by nurturing in students the confidence to aspire to college” and “maintain high expectations by providing adequate supports and conveying the conviction that all students can succeed in college.”
The biggest knowledge deficiencies appear in the “college affordability planning” and “transition from high school to college enrollment” components. Fewer than half of counselors say that they have sufficient knowledge and training in how to “provide information about college costs, financing, and the financial aid and scholarship processes so that students are able to plan for college and afford a college education” (43%) as well as “connect[ing] students to school and community resources to help ensure a successful transition from high school to college” (38%).
0% 10% 20% 30% 40% 50% 60% 70% 80% 90% 100%
57%
56%
51%
50%
49%
48%
43%
3%
2%
5%
4%
3%
40%
42%
44%
46%
48%
48%
50%
4%
7%
38% 56% 6%
Academic planning for college and career readiness
College aspirations
College and career admission processes
College and career assessments
Connect college and career exploration and selection processes
Enrichment and extracurricular engagement
College affordability planning
Transition from high school graduation to college enrollment
Counselors: How much knowledge/training do you have in these components?
Little or no knowledge/need extensive trainingSuf�cient knowledge/need no further training Some knowledge/need some additional training
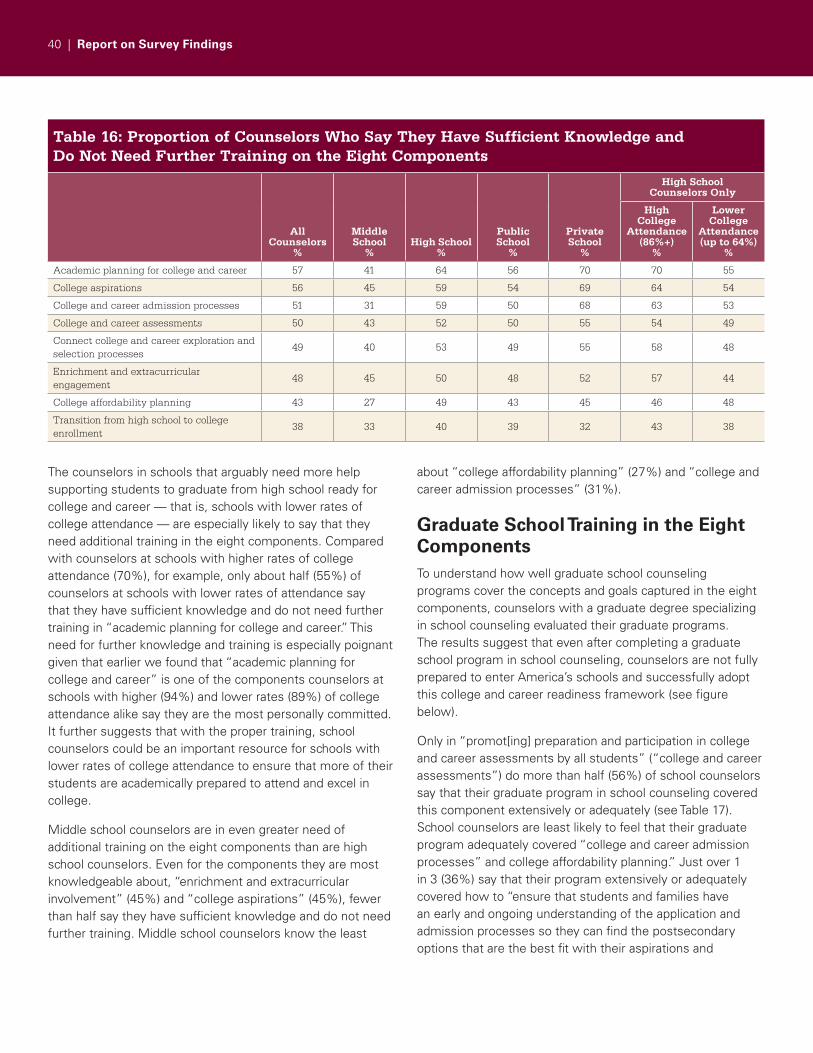
40 | Report on Survey Findings
The counselors in schools that arguably need more help supporting students to graduate from high school ready for college and career — that is, schools with lower rates of college attendance — are especially likely to say that they need additional training in the eight components. Compared with counselors at schools with higher rates of college attendance (70%), for example, only about half (55%) of counselors at schools with lower rates of attendance say that they have sufficient knowledge and do not need further training in “academic planning for college and career.” This need for further knowledge and training is especially poignant given that earlier we found that “academic planning for college and career” is one of the components counselors at schools with higher (94%) and lower rates (89%) of college attendance alike say they are the most personally committed. It further suggests that with the proper training, school counselors could be an important resource for schools with lower rates of college attendance to ensure that more of their students are academically prepared to attend and excel in college.
Middle school counselors are in even greater need of additional training on the eight components than are high school counselors. Even for the components they are most knowledgeable about, “enrichment and extracurricular involvement” (45%) and “college aspirations” (45%), fewer than half say they have sufficient knowledge and do not need further training. Middle school counselors know the least
about “college affordability planning” (27%) and “college and career admission processes” (31%).
Graduate School Training in the Eight ComponentsTo understand how well graduate school counseling programs cover the concepts and goals captured in the eight components, counselors with a graduate degree specializing in school counseling evaluated their graduate programs. The results suggest that even after completing a graduate school program in school counseling, counselors are not fully prepared to enter America’s schools and successfully adopt this college and career readiness framework (see figure below).
Only in “promot[ing] preparation and participation in college and career assessments by all students” (“college and career assessments”) do more than half (56%) of school counselors say that their graduate program in school counseling covered this component extensively or adequately (see Table 17). School counselors are least likely to feel that their graduate program adequately covered “college and career admission processes” and college affordability planning.” Just over 1 in 3 (36%) say that their program extensively or adequately covered how to “ensure that students and families have an early and ongoing understanding of the application and admission processes so they can find the postsecondary options that are the best fit with their aspirations and
Table 16: Proportion of Counselors Who Say They Have Sufficient Knowledge and Do Not Need Further Training on the Eight Components
All Counselors
%
Middle School
%High School
%
Public School
%
Private School
%
High School Counselors Only
High College
Attendance (86%+)
%
Lower College
Attendance(up to 64%)
%
Academic planning for college and career 57 41 64 56 70 70 55
College aspirations 56 45 59 54 69 64 54
College and career admission processes 51 31 59 50 68 63 53
College and career assessments 50 43 52 50 55 54 49
Connect college and career exploration and selection processes
49 40 53 49 55 58 48
Enrichment and extracurricular engagement
48 45 50 48 52 57 44
College affordability planning 43 27 49 43 45 46 48
Transition from high school to college enrollment
38 33 40 39 32 43 38
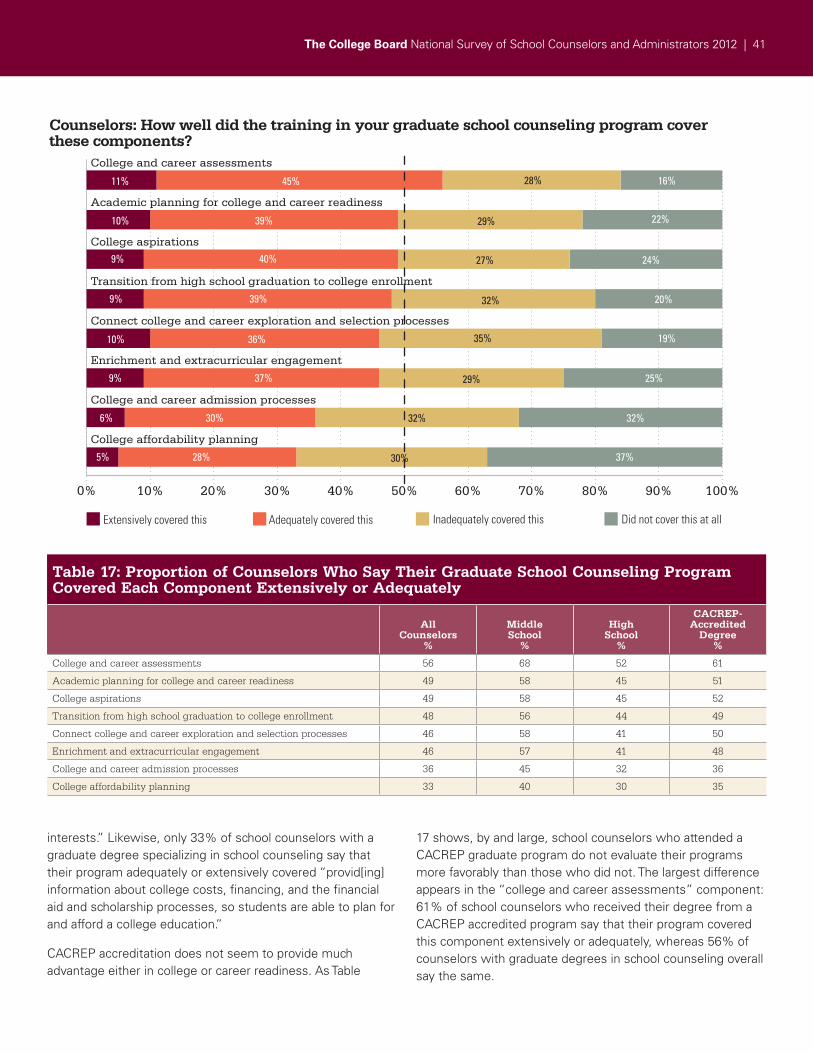
The College Board National Survey of School Counselors and Administrators 2012 | 41
interests.” Likewise, only 33% of school counselors with a graduate degree specializing in school counseling say that their program adequately or extensively covered “provid[ing] information about college costs, financing, and the financial aid and scholarship processes, so students are able to plan for and afford a college education.”
CACREP accreditation does not seem to provide much advantage either in college or career readiness. As Table
17 shows, by and large, school counselors who attended a CACREP graduate program do not evaluate their programs more favorably than those who did not. The largest difference appears in the “college and career assessments” component: 61% of school counselors who received their degree from a CACREP accredited program say that their program covered this component extensively or adequately, whereas 56% of counselors with graduate degrees in school counseling overall say the same.
College and career assessments
Academic planning for college and career readiness
College aspirations
Transition from high school graduation to college enrollment
Connect college and career exploration and selection processes
Enrichment and extracurricular engagement
College and career admission processes
College affordability planning
Counselors: How well did the training in your graduate school counseling program cover these components?
Inadequately covered this Did not cover this at allExtensively covered this Adequately covered this
0% 10% 20% 30% 40% 50% 60% 70% 80% 90% 100%
45%
39%
40%
39%
36%
37%
30%
16%
22%
24%
20%
19%
28%
29%
27%
32%
35%
29%
32%
25%
32%
28%
11%
10%
9%
9%
10%
9%
6%
5% 30% 37%
Table 17: Proportion of Counselors Who Say Their Graduate School Counseling Program Covered Each Component Extensively or Adequately
All Counselors
%
Middle School
%
High School
%
CACREP-Accredited
Degree%
College and career assessments 56 68 52 61
Academic planning for college and career readiness 49 58 45 51
College aspirations 49 58 45 52
Transition from high school graduation to college enrollment 48 56 44 49
Connect college and career exploration and selection processes 46 58 41 50
Enrichment and extracurricular engagement 46 57 41 48
College and career admission processes 36 45 32 36
College affordability planning 33 40 30 35
42 | Report on Survey Findings
Marked differences appear between how middle school counselors and high school counselors evaluate their graduate school training programs in school counseling. Across all components, middle school counselors are more likely to say that their graduate program provided at least adequate coverage. On six of the eight components, more than 50% of middle school counselors say their graduate program provided adequate or extensive coverage. In comparison, graduate programs in school counseling receive only favorable ratings from a majority of high school counselors on one of the eight components (“college and career assessments” (52%).
At first blush, it seems at odds that, compared with high school counselors, middle school counselors overall are more likely to say they want additional training in the eight components, while middle school counselors with graduate degrees specializing in school counseling simultaneously evaluate their graduate training in the eight components more favorably. One potential explanation is that middle school counselors are receiving less in-service training than are high school counselors. In fact, middle school counselors without a graduate degree specializing in school counseling are less likely than their high school counterparts to say that they received training “on the job” (28% compared with 54% of high school counselors) or at workshops and conferences (26% compared with 47% of high school counselors). Furthermore, fewer middle school counselors overall (62%) than high school counselors (79%) say that they have received training in “college and career readiness counseling” since beginning their careers as school counselors.
Counselors’ Training in the Example Action Items for the Eight ComponentsAlthough many counselors want to receive further training in the broader eight components, high school counselors overall fare better when it comes to their training in the example activities. On all but one of the activities, a majority of high school counselors say that they are trained well enough to do the activity effectively, as indicated by a rating of eight or higher on a zero-to-10 scale. The tables below show that although a majority of middle school counselors also rate their training on the example activities specific for middle school as an eight or higher (mean = 7.3), they do so at lower rates than high school counselors (mean = 8.0).
High school counselors feel the most well trained in the example items for “transitioning from high school to college enrollment,” “academic planning for college and career,” and “college and career admission processes,” all of which deal
with providing students with documentation and helpful materials. For “transitioning from high school to college enrollment,” 86% of all high school counselors rate their training as an eight or higher to “help 12th-grade students request final transcripts, fill out forms, take placement tests, and gather health records and IEP information as needed as they make the transition from graduation to college.” Similarly, 85% of all high school counselors say that they are trained sufficiently in “providing students with college application completion procedures and checklists, calendars, and school comparison tools to assist them with completing applications and making their final decisions” (“college and career admission processes”).
High school and middle school counselors alike feel the least trained in “college-affordability planning.” Only 42% of high school counselors say they are trained sufficiently in “using student FAFSA completion data to monitor application completion, making application updates and corrections, and ensuring students receive and review aid reports.” And just half (50%) of middle school counselors rate their training as an eight or higher for “providing early information to parents and students about ways to plan and pay for college, including information about grants, scholarships, loans, work-study, and saving plans.”
However, the following tables show that counselors at schools with at least 75% of the student body on free or reduced-price lunch are far more likely to feel sufficiently trained in enacting the example for “college affordability planning”: 57% of high school counselors at disadvantaged schools (compared with 30% of high school counselors at advantaged schools) say they are effective at using FAFSA data to monitor student progress, and 57% of middle school counselors at disadvantaged schools (compared with 44% of middle school counselors at more advantaged schools) say they are trained sufficiently to provide early information about planning and paying for college. Remember that high school counselors at disadvantaged schools also are more committed to using FAFSA data to monitor student progress and are more likely than their counterparts at more affluent schools to perceive support from their administrators and school districts for this item. These facts suggest that administrators and school districts could potentially both show their support and increase commitment among high school counselors by providing the necessary training to effectively engage in this important intervention for supporting students’ “college affordability planning.”
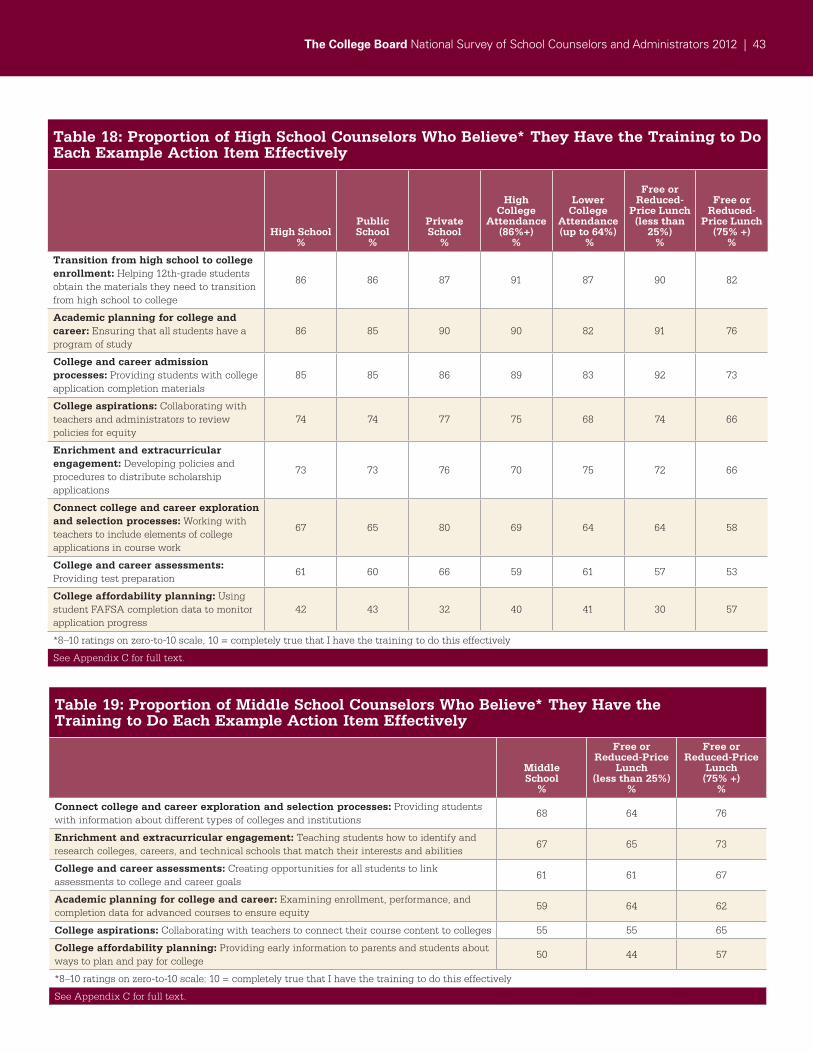
The College Board National Survey of School Counselors and Administrators 2012 | 43
Table 18: Proportion of High School Counselors Who Believe* They Have the Training to Do Each Example Action Item Effectively
High School%
Public School
%
Private School
%
High College
Attendance (86%+)
%
Lower College
Attendance(up to 64%)
%
Free or Reduced-
Price Lunch(less than
25%)%
Free or Reduced-
Price Lunch (75% +)
%
Transition from high school to college enrollment: Helping 12th-grade students obtain the materials they need to transition from high school to college
86 86 87 91 87 90 82
Academic planning for college and career: Ensuring that all students have a program of study
86 85 90 90 82 91 76
College and career admission processes: Providing students with college application completion materials
85 85 86 89 83 92 73
College aspirations: Collaborating with teachers and administrators to review policies for equity
74 74 77 75 68 74 66
Enrichment and extracurricular engagement: Developing policies and procedures to distribute scholarship applications
73 73 76 70 75 72 66
Connect college and career exploration and selection processes: Working with teachers to include elements of college applications in course work
67 65 80 69 64 64 58
College and career assessments: Providing test preparation
61 60 66 59 61 57 53
College affordability planning: Using student FAFSA completion data to monitor application progress
42 43 32 40 41 30 57
*8–10 ratings on zero-to-10 scale, 10 = completely true that I have the training to do this effectively
See Appendix C for full text.
Table 19: Proportion of Middle School Counselors Who Believe* They Have the Training to Do Each Example Action Item Effectively
MiddleSchool
%
Free or Reduced-Price
Lunch (less than 25%)
%
Free or Reduced-Price
Lunch (75% +)
%
Connect college and career exploration and selection processes: Providing students with information about different types of colleges and institutions
68 64 76
Enrichment and extracurricular engagement: Teaching students how to identify and research colleges, careers, and technical schools that match their interests and abilities
67 65 73
College and career assessments: Creating opportunities for all students to link assessments to college and career goals
61 61 67
Academic planning for college and career: Examining enrollment, performance, and completion data for advanced courses to ensure equity
59 64 62
College aspirations: Collaborating with teachers to connect their course content to colleges 55 55 65
College affordability planning: Providing early information to parents and students about ways to plan and pay for college
50 44 57
*8–10 ratings on zero-to-10 scale: 10 = completely true that I have the training to do this effectively
See Appendix C for full text.
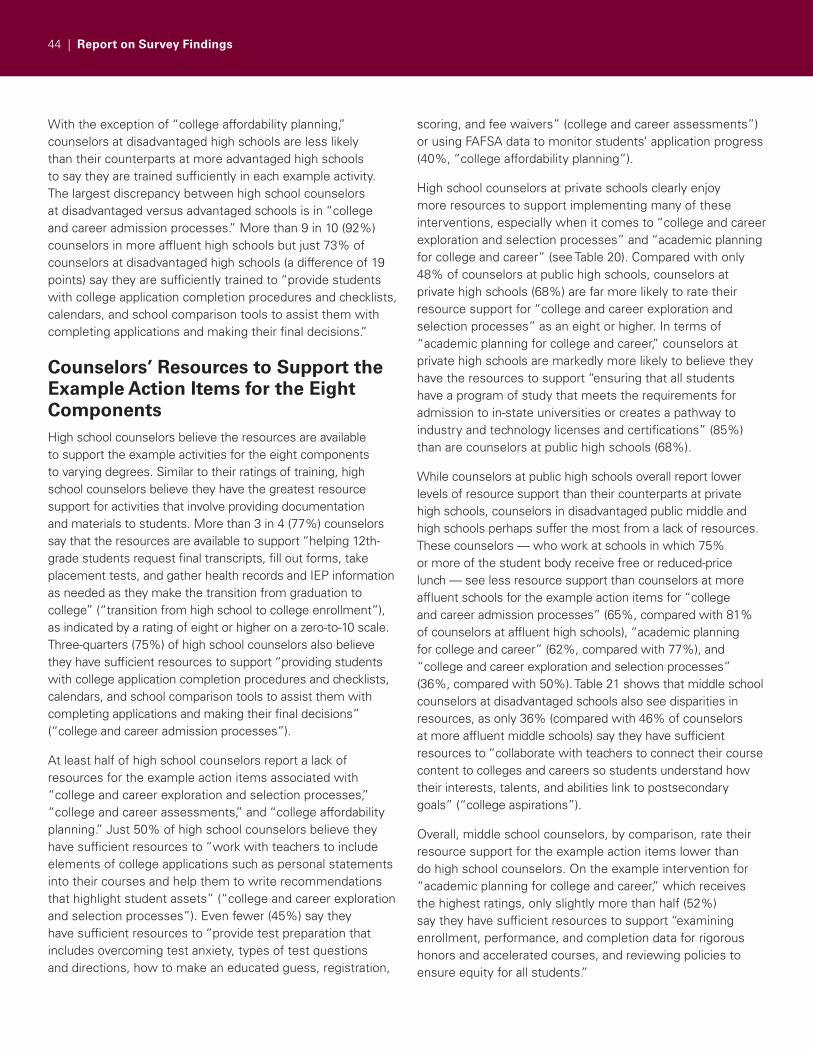
44 | Report on Survey Findings
With the exception of “college affordability planning,” counselors at disadvantaged high schools are less likely than their counterparts at more advantaged high schools to say they are trained sufficiently in each example activity. The largest discrepancy between high school counselors at disadvantaged versus advantaged schools is in “college and career admission processes.” More than 9 in 10 (92%) counselors in more affluent high schools but just 73% of counselors at disadvantaged high schools (a difference of 19 points) say they are sufficiently trained to “provide students with college application completion procedures and checklists, calendars, and school comparison tools to assist them with completing applications and making their final decisions.”
Counselors’ Resources to Support the Example Action Items for the Eight ComponentsHigh school counselors believe the resources are available to support the example activities for the eight components to varying degrees. Similar to their ratings of training, high school counselors believe they have the greatest resource support for activities that involve providing documentation and materials to students. More than 3 in 4 (77%) counselors say that the resources are available to support “helping 12th-grade students request final transcripts, fill out forms, take placement tests, and gather health records and IEP information as needed as they make the transition from graduation to college” (“transition from high school to college enrollment”), as indicated by a rating of eight or higher on a zero-to-10 scale. Three-quarters (75%) of high school counselors also believe they have sufficient resources to support “providing students with college application completion procedures and checklists, calendars, and school comparison tools to assist them with completing applications and making their final decisions” (“college and career admission processes”).
At least half of high school counselors report a lack of resources for the example action items associated with “college and career exploration and selection processes,” “college and career assessments,” and “college affordability planning.” Just 50% of high school counselors believe they have sufficient resources to “work with teachers to include elements of college applications such as personal statements into their courses and help them to write recommendations that highlight student assets” (“college and career exploration and selection processes”). Even fewer (45%) say they have sufficient resources to “provide test preparation that includes overcoming test anxiety, types of test questions and directions, how to make an educated guess, registration,
scoring, and fee waivers” (college and career assessments”) or using FAFSA data to monitor students’ application progress (40%, “college affordability planning”).
High school counselors at private schools clearly enjoy more resources to support implementing many of these interventions, especially when it comes to “college and career exploration and selection processes” and “academic planning for college and career” (see Table 20). Compared with only 48% of counselors at public high schools, counselors at private high schools (68%) are far more likely to rate their resource support for “college and career exploration and selection processes” as an eight or higher. In terms of “academic planning for college and career,” counselors at private high schools are markedly more likely to believe they have the resources to support “ensuring that all students have a program of study that meets the requirements for admission to in-state universities or creates a pathway to industry and technology licenses and certifications” (85%) than are counselors at public high schools (68%).
While counselors at public high schools overall report lower levels of resource support than their counterparts at private high schools, counselors in disadvantaged public middle and high schools perhaps suffer the most from a lack of resources. These counselors — who work at schools in which 75% or more of the student body receive free or reduced-price lunch — see less resource support than counselors at more affluent schools for the example action items for “college and career admission processes” (65%, compared with 81% of counselors at affluent high schools), “academic planning for college and career” (62%, compared with 77%), and “college and career exploration and selection processes” (36%, compared with 50%). Table 21 shows that middle school counselors at disadvantaged schools also see disparities in resources, as only 36% (compared with 46% of counselors at more affluent middle schools) say they have sufficient resources to “collaborate with teachers to connect their course content to colleges and careers so students understand how their interests, talents, and abilities link to postsecondary goals” (“college aspirations”).
Overall, middle school counselors, by comparison, rate their resource support for the example action items lower than do high school counselors. On the example intervention for “academic planning for college and career,” which receives the highest ratings, only slightly more than half (52%) say they have sufficient resources to support “examining enrollment, performance, and completion data for rigorous honors and accelerated courses, and reviewing policies to ensure equity for all students.”
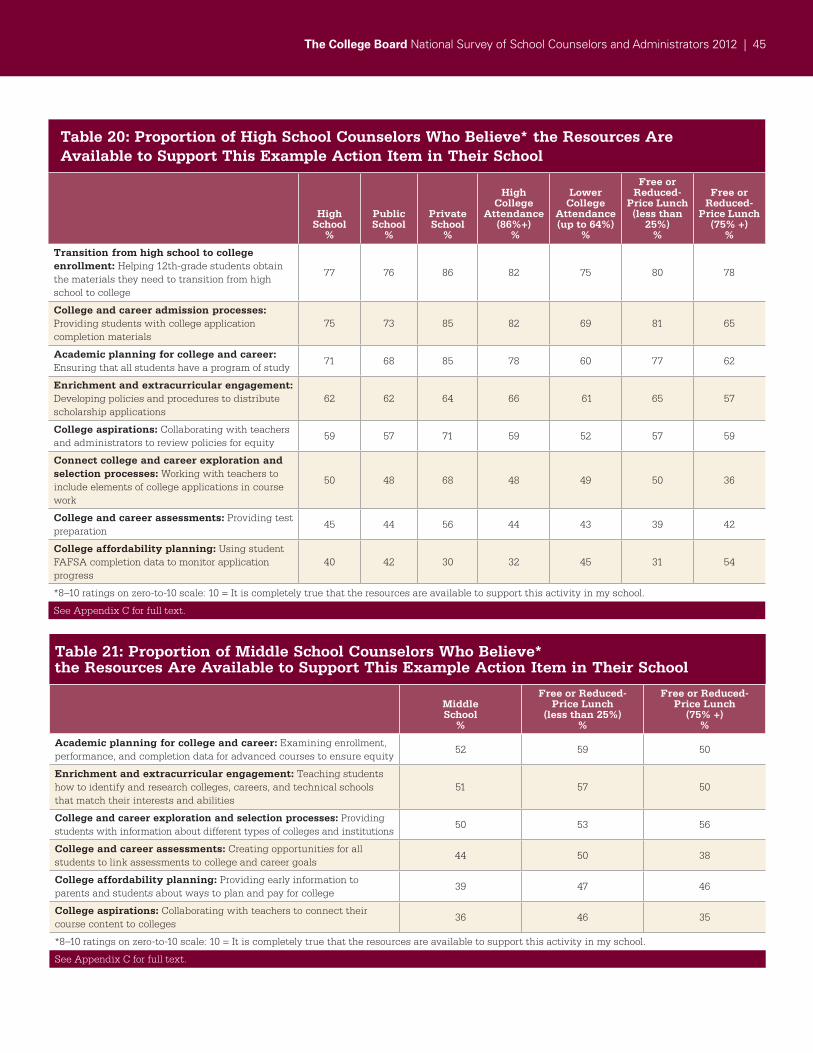
The College Board National Survey of School Counselors and Administrators 2012 | 45
Table 20: Proportion of High School Counselors Who Believe* the Resources Are Available to Support This Example Action Item in Their School
High School
%
Public School
%
Private School
%
High College
Attendance (86%+)
%
Lower College
Attendance(up to 64%)
%
Free or Reduced-
Price Lunch (less than
25%)%
Free or Reduced-
Price Lunch (75% +)
%
Transition from high school to college enrollment: Helping 12th-grade students obtain the materials they need to transition from high school to college
77 76 86 82 75 80 78
College and career admission processes: Providing students with college application completion materials
75 73 85 82 69 81 65
Academic planning for college and career: Ensuring that all students have a program of study
71 68 85 78 60 77 62
Enrichment and extracurricular engagement: Developing policies and procedures to distribute scholarship applications
62 62 64 66 61 65 57
College aspirations: Collaborating with teachers and administrators to review policies for equity
59 57 71 59 52 57 59
Connect college and career exploration and selection processes: Working with teachers to include elements of college applications in course work
50 48 68 48 49 50 36
College and career assessments: Providing test preparation
45 44 56 44 43 39 42
College affordability planning: Using student FAFSA completion data to monitor application progress
40 42 30 32 45 31 54
*8–10 ratings on zero-to-10 scale: 10 = It is completely true that the resources are available to support this activity in my school.
See Appendix C for full text.
Table 21: Proportion of Middle School Counselors Who Believe* the Resources Are Available to Support This Example Action Item in Their School
MiddleSchool
%
Free or Reduced-Price Lunch
(less than 25%)%
Free or Reduced-Price Lunch
(75% +)%
Academic planning for college and career: Examining enrollment, performance, and completion data for advanced courses to ensure equity
52 59 50
Enrichment and extracurricular engagement: Teaching students how to identify and research colleges, careers, and technical schools that match their interests and abilities
51 57 50
College and career exploration and selection processes: Providing students with information about different types of colleges and institutions
50 53 56
College and career assessments: Creating opportunities for all students to link assessments to college and career goals
44 50 38
College affordability planning: Providing early information to parents and students about ways to plan and pay for college
39 47 46
College aspirations: Collaborating with teachers to connect their course content to colleges
36 46 35
*8–10 ratings on zero-to-10 scale: 10 = It is completely true that the resources are available to support this activity in my school.
See Appendix C for full text.
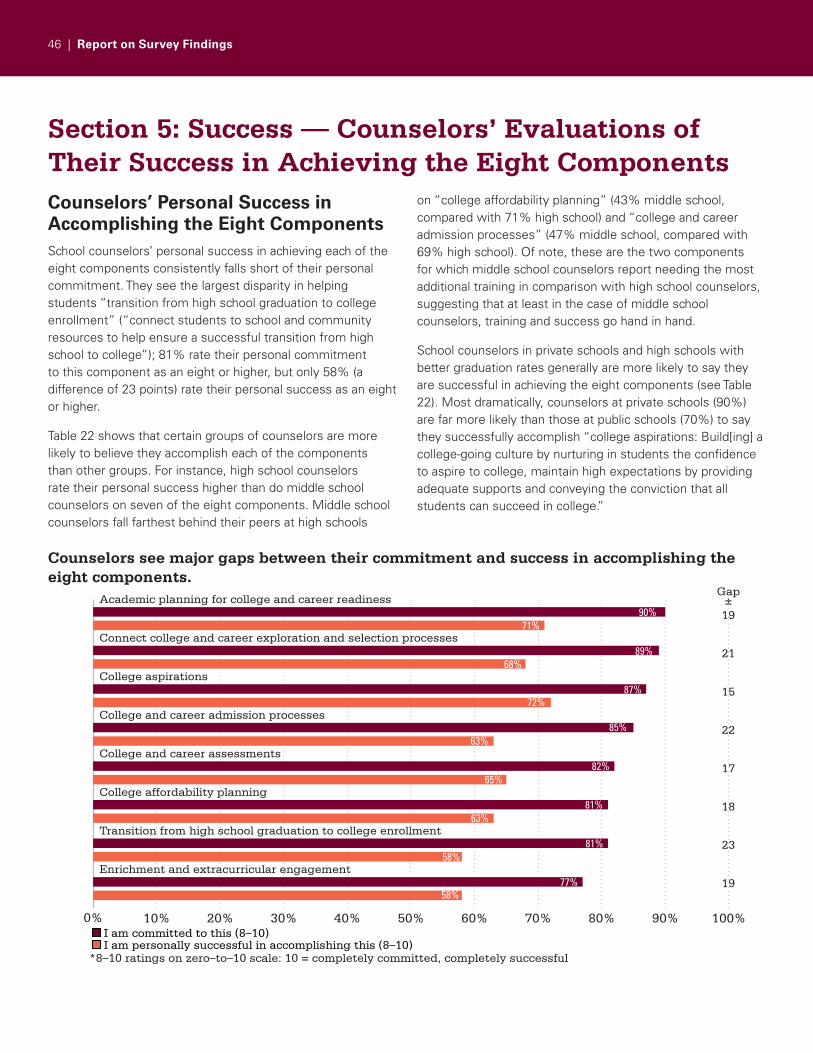
46 | Report on Survey Findings
Section 5: Success — Counselors’ Evaluations of Their Success in Achieving the Eight ComponentsCounselors’ Personal Success in Accomplishing the Eight ComponentsSchool counselors’ personal success in achieving each of the eight components consistently falls short of their personal commitment. They see the largest disparity in helping students “transition from high school graduation to college enrollment” (“connect students to school and community resources to help ensure a successful transition from high school to college”); 81% rate their personal commitment to this component as an eight or higher, but only 58% (a difference of 23 points) rate their personal success as an eight or higher.
Table 22 shows that certain groups of counselors are more likely to believe they accomplish each of the components than other groups. For instance, high school counselors rate their personal success higher than do middle school counselors on seven of the eight components. Middle school counselors fall farthest behind their peers at high schools
on “college affordability planning” (43% middle school, compared with 71% high school) and “college and career admission processes” (47% middle school, compared with 69% high school). Of note, these are the two components for which middle school counselors report needing the most additional training in comparison with high school counselors, suggesting that at least in the case of middle school counselors, training and success go hand in hand.
School counselors in private schools and high schools with better graduation rates generally are more likely to say they are successful in achieving the eight components (see Table 22). Most dramatically, counselors at private schools (90%) are far more likely than those at public schools (70%) to say they successfully accomplish “college aspirations: Build[ing] a college-going culture by nurturing in students the confidence to aspire to college, maintain high expectations by providing adequate supports and conveying the conviction that all students can succeed in college.”
Counselors see major gaps between their commitment and success in accomplishing the eight components.
*8–10 ratings on zero–to–10 scale: 10 = completely committed, completely successful
Academic planning for college and career readiness
Connect college and career exploration and selection processes
College aspirations
College and career admission processes
College and career assessments
College affordability planning
Transition from high school graduation to college enrollment
Enrichment and extracurricular engagement
I am committed to this (8–10)I am personally successful in accomplishing this (8–10)
Gap±19
21
15
22
17
18
23
19
0% 10% 20% 30% 40% 50% 60% 70% 80% 90% 100%
90% 71%
89% 68%
87%
65%82%
63%85%
72%
81% 63%
81% 58%
77% 58%
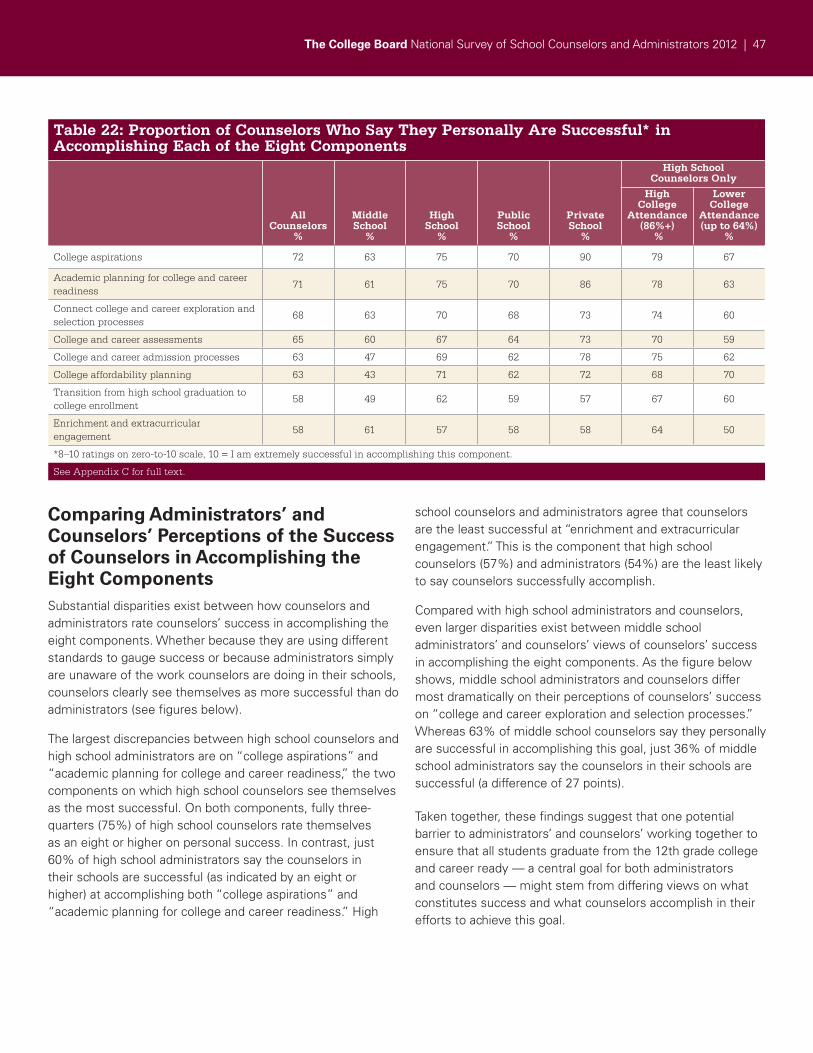
The College Board National Survey of School Counselors and Administrators 2012 | 47
Comparing Administrators’ and Counselors’ Perceptions of the Success of Counselors in Accomplishing the Eight ComponentsSubstantial disparities exist between how counselors and administrators rate counselors’ success in accomplishing the eight components. Whether because they are using different standards to gauge success or because administrators simply are unaware of the work counselors are doing in their schools, counselors clearly see themselves as more successful than do administrators (see figures below).
The largest discrepancies between high school counselors and high school administrators are on “college aspirations” and “academic planning for college and career readiness,” the two components on which high school counselors see themselves as the most successful. On both components, fully three-quarters (75%) of high school counselors rate themselves as an eight or higher on personal success. In contrast, just 60% of high school administrators say the counselors in their schools are successful (as indicated by an eight or higher) at accomplishing both “college aspirations” and “academic planning for college and career readiness.” High
school counselors and administrators agree that counselors are the least successful at “enrichment and extracurricular engagement.” This is the component that high school counselors (57%) and administrators (54%) are the least likely to say counselors successfully accomplish.
Compared with high school administrators and counselors, even larger disparities exist between middle school administrators’ and counselors’ views of counselors’ success in accomplishing the eight components. As the figure below shows, middle school administrators and counselors differ most dramatically on their perceptions of counselors’ success on “college and career exploration and selection processes.” Whereas 63% of middle school counselors say they personally are successful in accomplishing this goal, just 36% of middle school administrators say the counselors in their schools are successful (a difference of 27 points).
Taken together, these findings suggest that one potential barrier to administrators’ and counselors’ working together to ensure that all students graduate from the 12th grade college and career ready — a central goal for both administrators and counselors — might stem from differing views on what constitutes success and what counselors accomplish in their efforts to achieve this goal.
Table 22: Proportion of Counselors Who Say They Personally Are Successful* in Accomplishing Each of the Eight Components
AllCounselors
%
MiddleSchool
%
HighSchool
%
Public School
%
Private School
%
High College
Attendance (86%+)
%
Lower College
Attendance (up to 64%)
%
College aspirations 72 63 75 70 90 79 67
Academic planning for college and career readiness
71 61 75 70 86 78 63
Connect college and career exploration and selection processes
68 63 70 68 73 74 60
College and career assessments 65 60 67 64 73 70 59
College and career admission processes 63 47 69 62 78 75 62
College affordability planning 63 43 71 62 72 68 70
Transition from high school graduation to college enrollment
58 49 62 59 57 67 60
Enrichment and extracurricular engagement
58 61 57 58 58 64 50
*8–10 ratings on zero-to-10 scale, 10 = I am extremely successful in accomplishing this component.
See Appendix C for full text.
High School Counselors Only
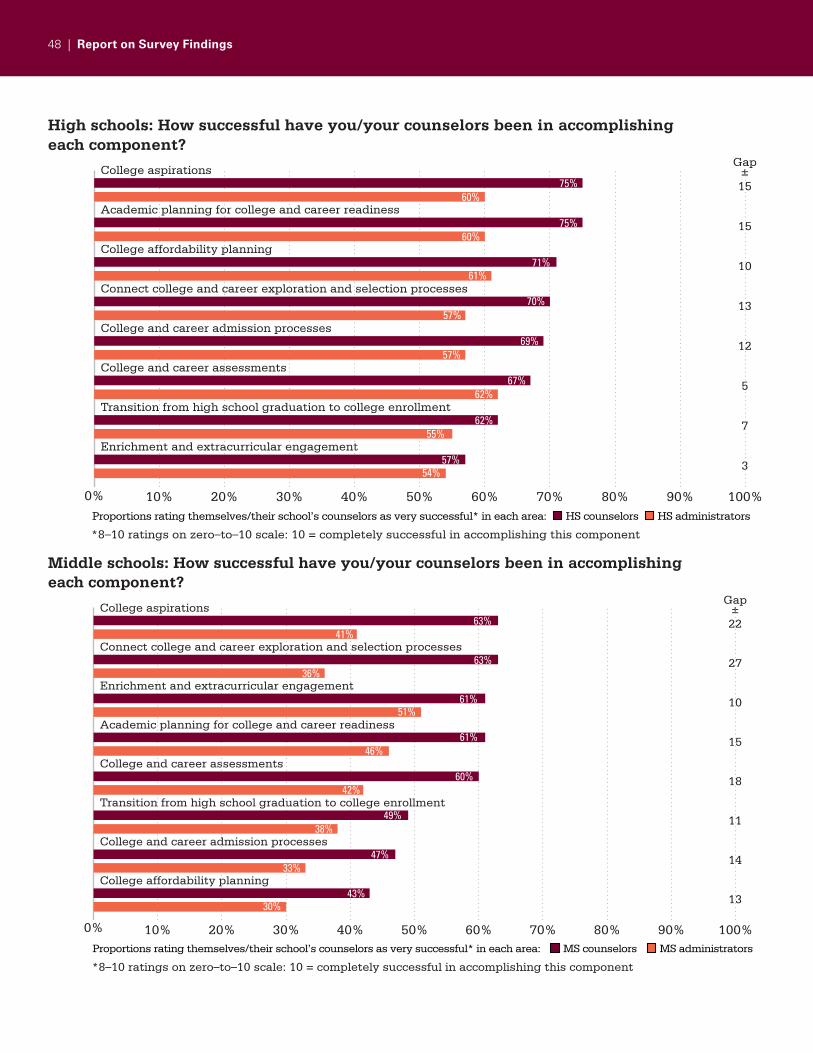
48 | Report on Survey Findings
High schools: How successful have you/your counselors been in accomplishing each component?
*8–10 ratings on zero–to–10 scale: 10 = completely successful in accomplishing this component
College aspirations
Academic planning for college and career readiness
College affordability planning
Connect college and career exploration and selection processes
College and career admission processes
College and career assessments
Transition from high school graduation to college enrollment
Enrichment and extracurricular engagement
Gap±15
15
10
13
12
5
7
3
Proportions rating themselves/their school’s counselors as very successful* in each area: HS administrators HS counselors
0% 10% 20% 30% 40% 50% 60% 70% 80% 90% 100%
75% 60%
75% 60%
71%
57%69%
57%70%
61%
67% 62%
62% 55%
57% 54%
Middle schools: How successful have you/your counselors been in accomplishing each component?
*8–10 ratings on zero–to–10 scale: 10 = completely successful in accomplishing this component
College aspirations
Connect college and career exploration and selection processes
Enrichment and extracurricular engagement
Academic planning for college and career readiness
College and career assessments
Transition from high school graduation to college enrollment
College and career admission processes
College affordability planning
Gap±22
27
10
15
18
11
14
13
Proportions rating themselves/their school’s counselors as very successful* in each area: MS administrators MS counselors
0% 10% 20% 30% 40% 50% 60% 70% 80% 90% 100%
63% 41%
63% 36%
61%
42%60%
46%61%
51%
49% 38%
47% 33%
43% 30%
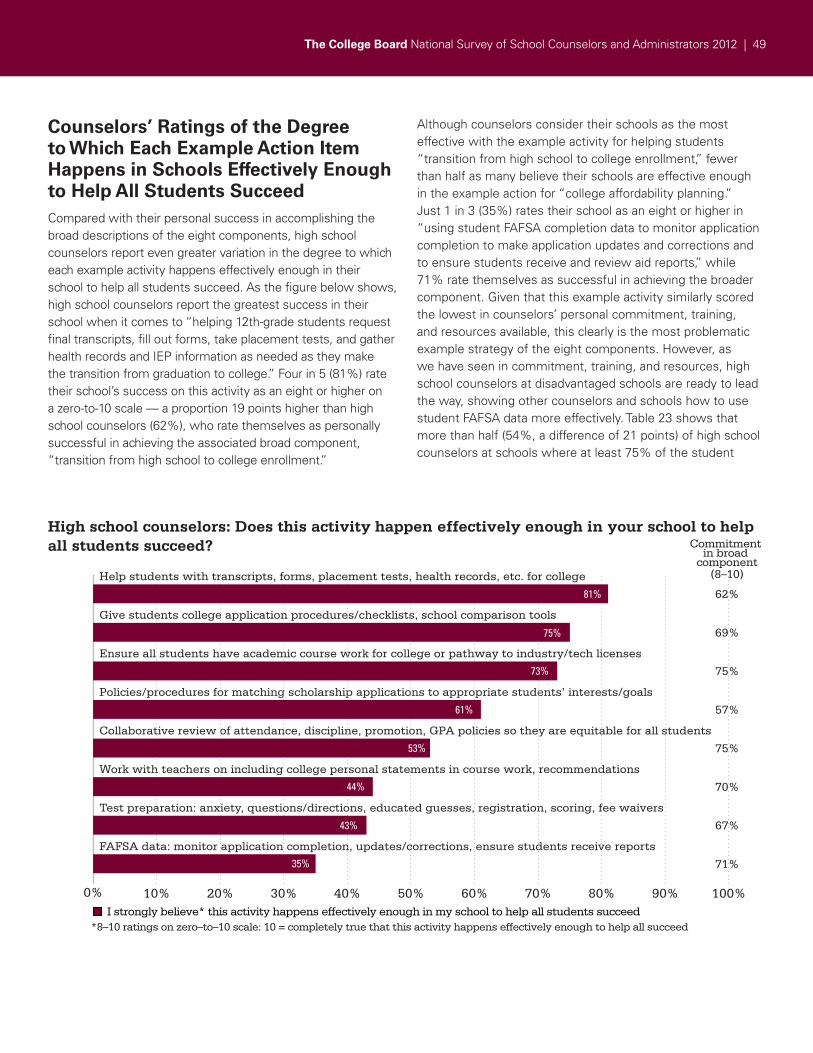
The College Board National Survey of School Counselors and Administrators 2012 | 49
Counselors’ Ratings of the Degree to Which Each Example Action Item Happens in Schools Effectively Enough to Help All Students SucceedCompared with their personal success in accomplishing the broad descriptions of the eight components, high school counselors report even greater variation in the degree to which each example activity happens effectively enough in their school to help all students succeed. As the figure below shows, high school counselors report the greatest success in their school when it comes to “helping 12th-grade students request final transcripts, fill out forms, take placement tests, and gather health records and IEP information as needed as they make the transition from graduation to college.” Four in 5 (81%) rate their school’s success on this activity as an eight or higher on a zero-to-10 scale — a proportion 19 points higher than high school counselors (62%), who rate themselves as personally successful in achieving the associated broad component, “transition from high school to college enrollment.”
Although counselors consider their schools as the most effective with the example activity for helping students “transition from high school to college enrollment,” fewer than half as many believe their schools are effective enough in the example action for “college affordability planning.” Just 1 in 3 (35%) rates their school as an eight or higher in “using student FAFSA completion data to monitor application completion to make application updates and corrections and to ensure students receive and review aid reports,” while 71% rate themselves as successful in achieving the broader component. Given that this example activity similarly scored the lowest in counselors’ personal commitment, training, and resources available, this clearly is the most problematic example strategy of the eight components. However, as we have seen in commitment, training, and resources, high school counselors at disadvantaged schools are ready to lead the way, showing other counselors and schools how to use student FAFSA data more effectively. Table 23 shows that more than half (54%, a difference of 21 points) of high school counselors at schools where at least 75% of the student
High school counselors: Does this activity happen effectively enough in your school to help all students succeed?
*8–10 ratings on zero–to–10 scale: 10 = completely true that this activity happens effectively enough to help all succeed
Help students with transcripts, forms, placement tests, health records, etc. for college
Give students college application procedures/checklists, school comparison tools
Ensure all students have academic course work for college or pathway to industry/tech licenses
Policies/procedures for matching scholarship applications to appropriate students’ interests/goals
Collaborative review of attendance, discipline, promotion, GPA policies so they are equitable for all students
Work with teachers on including college personal statements in course work, recommendations
Test preparation: anxiety, questions/directions, educated guesses, registration, scoring, fee waivers
FAFSA data: monitor application completion, updates/corrections, ensure students receive reports
I strongly believe* this activity happens effectively enough in my school to help all students succeed
Commitment in broad
component(8–10)
62%
69%
75%
57%
75%
70%
67%
71%
0% 10% 20% 30% 40% 50% 60% 70% 80% 90% 100%
81%
75%
73%
53%
61%
44%
43%
35%
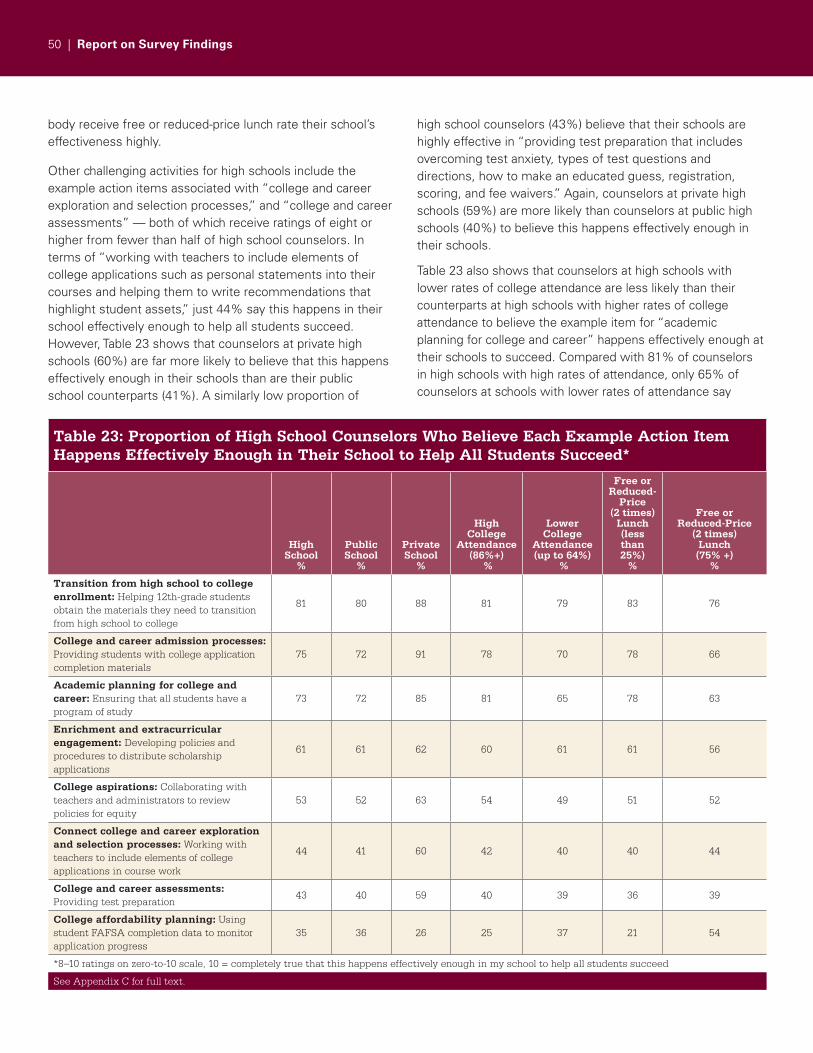
50 | Report on Survey Findings
body receive free or reduced-price lunch rate their school’s effectiveness highly.
Other challenging activities for high schools include the example action items associated with “college and career exploration and selection processes,” and “college and career assessments” — both of which receive ratings of eight or higher from fewer than half of high school counselors. In terms of “working with teachers to include elements of college applications such as personal statements into their courses and helping them to write recommendations that highlight student assets,” just 44% say this happens in their school effectively enough to help all students succeed. However, Table 23 shows that counselors at private high schools (60%) are far more likely to believe that this happens effectively enough in their schools than are their public school counterparts (41%). A similarly low proportion of
high school counselors (43%) believe that their schools are highly effective in “providing test preparation that includes overcoming test anxiety, types of test questions and directions, how to make an educated guess, registration, scoring, and fee waivers.” Again, counselors at private high schools (59%) are more likely than counselors at public high schools (40%) to believe this happens effectively enough in their schools.
Table 23 also shows that counselors at high schools with lower rates of college attendance are less likely than their counterparts at high schools with higher rates of college attendance to believe the example item for “academic planning for college and career” happens effectively enough at their schools to succeed. Compared with 81% of counselors in high schools with high rates of attendance, only 65% of counselors at schools with lower rates of attendance say
Table 23: Proportion of High School Counselors Who Believe Each Example Action Item Happens Effectively Enough in Their School to Help All Students Succeed*
HighSchool
%
Public School
%
Private School
%
High College
Attendance (86%+)
%
Lower College
Attendance(up to 64%)
%
Free or Reduced-
Price (2 times)
Lunch (less than 25%)
%
Free or Reduced-Price
(2 times) Lunch (75% +)
%
Transition from high school to college enrollment: Helping 12th-grade students obtain the materials they need to transition from high school to college
81 80 88 81 79 83 76
College and career admission processes: Providing students with college application completion materials
75 72 91 78 70 78 66
Academic planning for college and career: Ensuring that all students have a program of study
73 72 85 81 65 78 63
Enrichment and extracurricular engagement: Developing policies and procedures to distribute scholarship applications
61 61 62 60 61 61 56
College aspirations: Collaborating with teachers and administrators to review policies for equity
53 52 63 54 49 51 52
Connect college and career exploration and selection processes: Working with teachers to include elements of college applications in course work
44 41 60 42 40 40 44
College and career assessments: Providing test preparation
43 40 59 40 39 36 39
College affordability planning: Using student FAFSA completion data to monitor application progress
35 36 26 25 37 21 54
*8–10 ratings on zero-to-10 scale, 10 = completely true that this happens effectively enough in my school to help all students succeed
See Appendix C for full text.
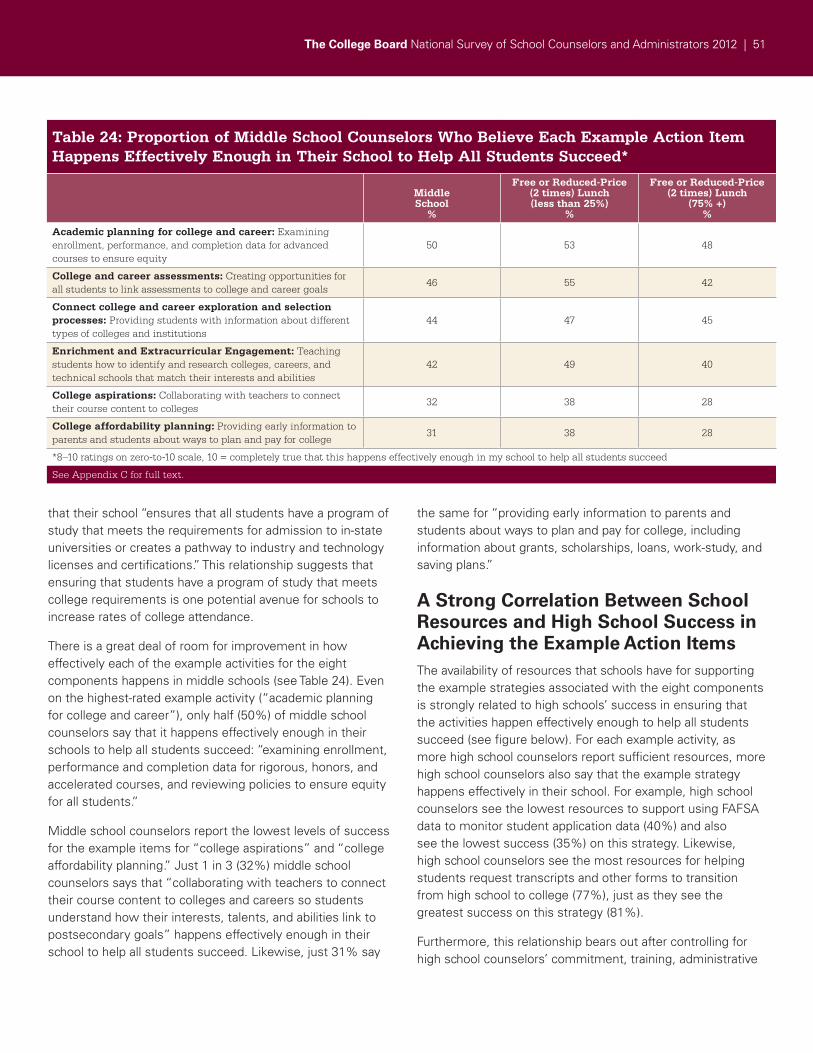
The College Board National Survey of School Counselors and Administrators 2012 | 51
that their school “ensures that all students have a program of study that meets the requirements for admission to in-state universities or creates a pathway to industry and technology licenses and certifications.” This relationship suggests that ensuring that students have a program of study that meets college requirements is one potential avenue for schools to increase rates of college attendance.
There is a great deal of room for improvement in how effectively each of the example activities for the eight components happens in middle schools (see Table 24). Even on the highest-rated example activity (“academic planning for college and career”), only half (50%) of middle school counselors say that it happens effectively enough in their schools to help all students succeed: “examining enrollment, performance and completion data for rigorous, honors, and accelerated courses, and reviewing policies to ensure equity for all students.”
Middle school counselors report the lowest levels of success for the example items for “college aspirations” and “college affordability planning.” Just 1 in 3 (32%) middle school counselors says that “collaborating with teachers to connect their course content to colleges and careers so students understand how their interests, talents, and abilities link to postsecondary goals” happens effectively enough in their school to help all students succeed. Likewise, just 31% say
the same for “providing early information to parents and students about ways to plan and pay for college, including information about grants, scholarships, loans, work-study, and saving plans.”
A Strong Correlation Between School Resources and High School Success in Achieving the Example Action ItemsThe availability of resources that schools have for supporting the example strategies associated with the eight components is strongly related to high schools’ success in ensuring that the activities happen effectively enough to help all students succeed (see figure below). For each example activity, as more high school counselors report sufficient resources, more high school counselors also say that the example strategy happens effectively in their school. For example, high school counselors see the lowest resources to support using FAFSA data to monitor student application data (40%) and also see the lowest success (35%) on this strategy. Likewise, high school counselors see the most resources for helping students request transcripts and other forms to transition from high school to college (77%), just as they see the greatest success on this strategy (81%).
Furthermore, this relationship bears out after controlling for high school counselors’ commitment, training, administrative
Table 24: Proportion of Middle School Counselors Who Believe Each Example Action Item Happens Effectively Enough in Their School to Help All Students Succeed*
Middle School
%
Free or Reduced-Price (2 times) Lunch (less than 25%)
%
Free or Reduced-Price (2 times) Lunch
(75% +) %
Academic planning for college and career: Examining enrollment, performance, and completion data for advanced courses to ensure equity
50 53 48
College and career assessments: Creating opportunities for all students to link assessments to college and career goals
46 55 42
Connect college and career exploration and selection processes: Providing students with information about different types of colleges and institutions
44 47 45
Enrichment and Extracurricular Engagement: Teaching students how to identify and research colleges, careers, and technical schools that match their interests and abilities
42 49 40
College aspirations: Collaborating with teachers to connect their course content to colleges
32 38 28
College affordability planning: Providing early information to parents and students about ways to plan and pay for college
31 38 28
*8–10 ratings on zero-to-10 scale, 10 = completely true that this happens effectively enough in my school to help all students succeed
See Appendix C for full text.
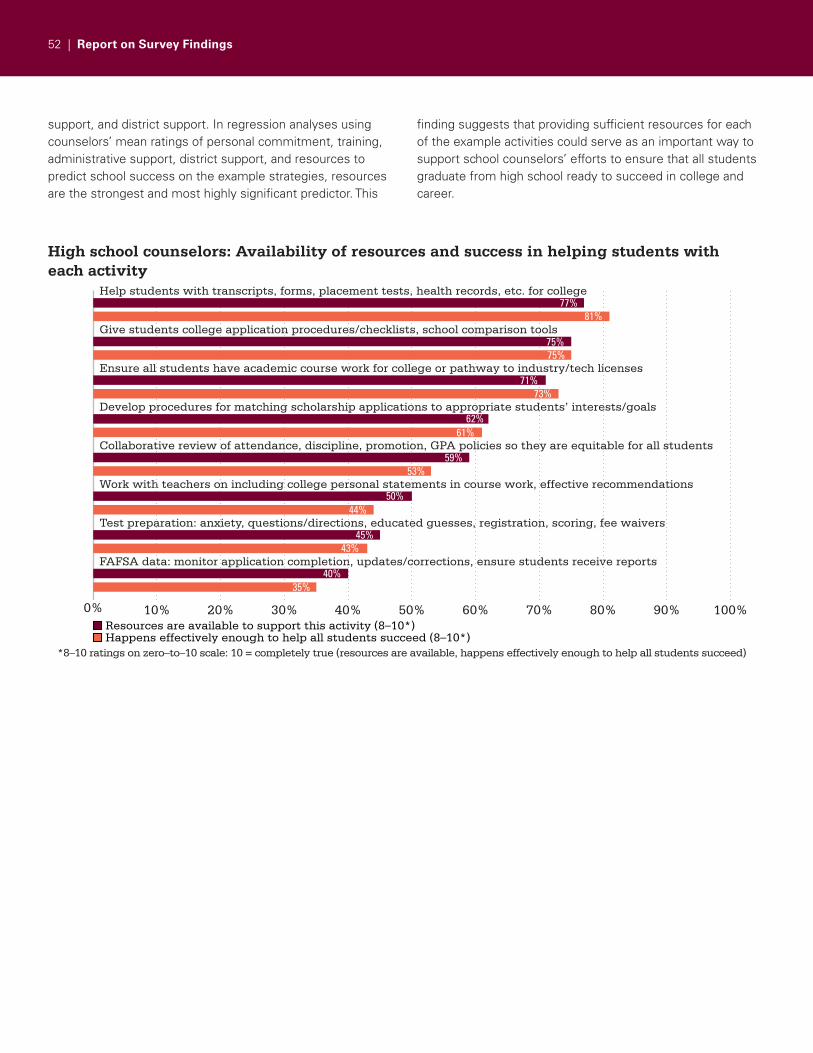
52 | Report on Survey Findings
support, and district support. In regression analyses using counselors’ mean ratings of personal commitment, training, administrative support, district support, and resources to predict school success on the example strategies, resources are the strongest and most highly significant predictor. This
finding suggests that providing sufficient resources for each of the example activities could serve as an important way to support school counselors’ efforts to ensure that all students graduate from high school ready to succeed in college and career.
High school counselors: Availability of resources and success in helping students with each activity
*8–10 ratings on zero–to–10 scale: 10 = completely true (resources are available, happens effectively enough to help all students succeed)
Help students with transcripts, forms, placement tests, health records, etc. for college
Give students college application procedures/checklists, school comparison tools
Ensure all students have academic course work for college or pathway to industry/tech licenses
Develop procedures for matching scholarship applications to appropriate students’ interests/goals
Collaborative review of attendance, discipline, promotion, GPA policies so they are equitable for all students
Work with teachers on including college personal statements in course work, effective recommendations
Test preparation: anxiety, questions/directions, educated guesses, registration, scoring, fee waivers
FAFSA data: monitor application completion, updates/corrections, ensure students receive reports
Resources are available to support this activity (8–10*)Happens effectively enough to help all students succeed (8–10*)
0% 10% 20% 30% 40% 50% 60% 70% 80% 90% 100%
77% 81%
75% 75%
71%
53%59%
61%62%
73%
50% 44%
45% 43%
40% 35%
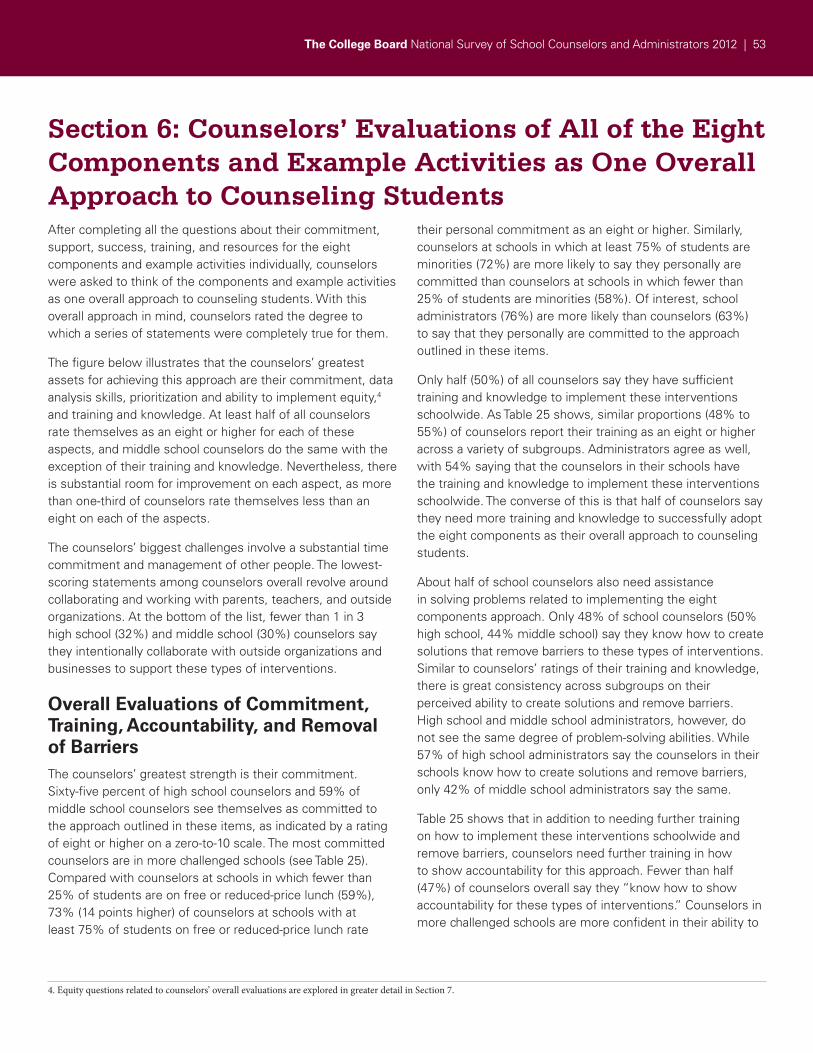
The College Board National Survey of School Counselors and Administrators 2012 | 53
Section 6: Counselors’ Evaluations of All of the Eight Components and Example Activities as One Overall Approach to Counseling StudentsAfter completing all the questions about their commitment, support, success, training, and resources for the eight components and example activities individually, counselors were asked to think of the components and example activities as one overall approach to counseling students. With this overall approach in mind, counselors rated the degree to which a series of statements were completely true for them.
The figure below illustrates that the counselors’ greatest assets for achieving this approach are their commitment, data analysis skills, prioritization and ability to implement equity,4 and training and knowledge. At least half of all counselors rate themselves as an eight or higher for each of these aspects, and middle school counselors do the same with the exception of their training and knowledge. Nevertheless, there is substantial room for improvement on each aspect, as more than one-third of counselors rate themselves less than an eight on each of the aspects.
The counselors’ biggest challenges involve a substantial time commitment and management of other people. The lowest-scoring statements among counselors overall revolve around collaborating and working with parents, teachers, and outside organizations. At the bottom of the list, fewer than 1 in 3 high school (32%) and middle school (30%) counselors say they intentionally collaborate with outside organizations and businesses to support these types of interventions.
Overall Evaluations of Commitment, Training, Accountability, and Removal of BarriersThe counselors’ greatest strength is their commitment. Sixty-five percent of high school counselors and 59% of middle school counselors see themselves as committed to the approach outlined in these items, as indicated by a rating of eight or higher on a zero-to-10 scale. The most committed counselors are in more challenged schools (see Table 25). Compared with counselors at schools in which fewer than 25% of students are on free or reduced-price lunch (59%), 73% (14 points higher) of counselors at schools with at least 75% of students on free or reduced-price lunch rate
their personal commitment as an eight or higher. Similarly, counselors at schools in which at least 75% of students are minorities (72%) are more likely to say they personally are committed than counselors at schools in which fewer than 25% of students are minorities (58%). Of interest, school administrators (76%) are more likely than counselors (63%) to say that they personally are committed to the approach outlined in these items.
Only half (50%) of all counselors say they have sufficient training and knowledge to implement these interventions schoolwide. As Table 25 shows, similar proportions (48% to 55%) of counselors report their training as an eight or higher across a variety of subgroups. Administrators agree as well, with 54% saying that the counselors in their schools have the training and knowledge to implement these interventions schoolwide. The converse of this is that half of counselors say they need more training and knowledge to successfully adopt the eight components as their overall approach to counseling students.
About half of school counselors also need assistance in solving problems related to implementing the eight components approach. Only 48% of school counselors (50% high school, 44% middle school) say they know how to create solutions that remove barriers to these types of interventions. Similar to counselors’ ratings of their training and knowledge, there is great consistency across subgroups on their perceived ability to create solutions and remove barriers. High school and middle school administrators, however, do not see the same degree of problem-solving abilities. While 57% of high school administrators say the counselors in their schools know how to create solutions and remove barriers, only 42% of middle school administrators say the same.
Table 25 shows that in addition to needing further training on how to implement these interventions schoolwide and remove barriers, counselors need further training in how to show accountability for this approach. Fewer than half (47%) of counselors overall say they “know how to show accountability for these types of interventions.” Counselors in more challenged schools are more confident in their ability to
4. Equity questions related to counselors’ overall evaluations are explored in greater detail in Section 7.
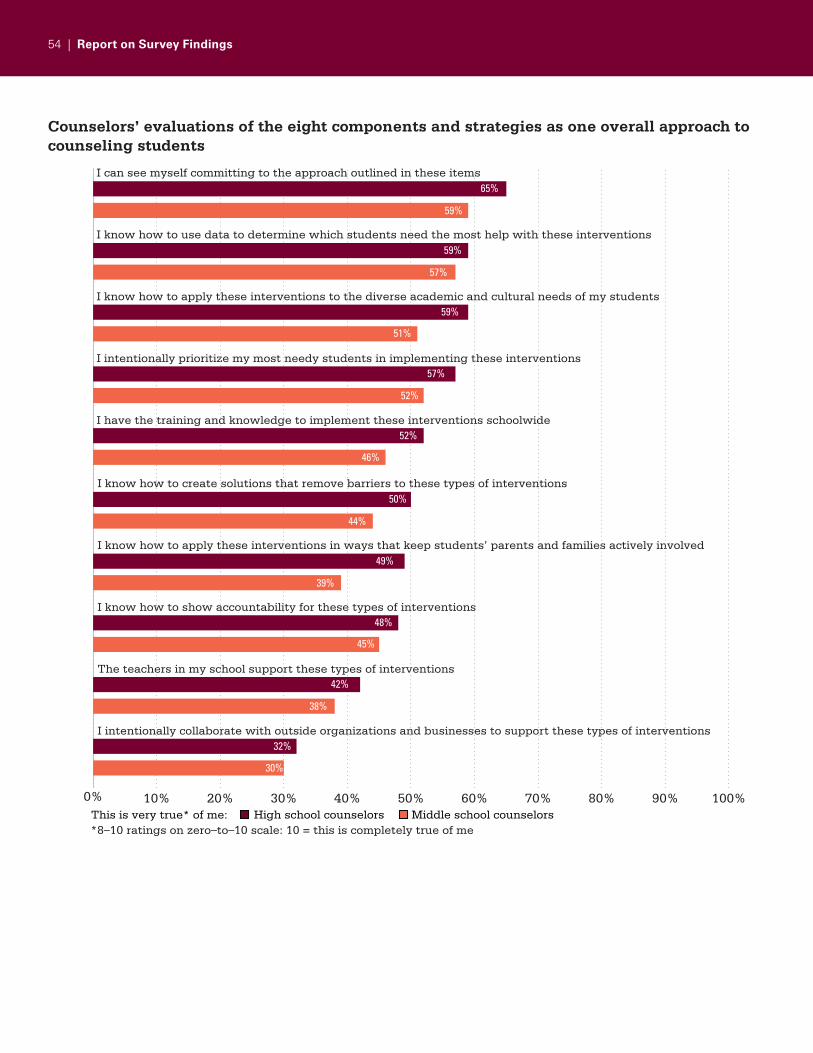
54 | Report on Survey Findings
*8–10 ratings on zero–to–10 scale: 10 = this is completely true of me
I know how to create solutions that remove barriers to these types of interventions
I know how to apply these interventions in ways that keep students’ parents and families actively involved
I know how to show accountability for these types of interventions
The teachers in my school support these types of interventions
I intentionally collaborate with outside organizations and businesses to support these types of interventions
This is very true* of me: Middle school counselorsHigh school counselors
0% 10% 20% 30% 40% 50% 60% 70% 80% 90% 100%
30%
32%
38%
42%
45%
50%
44%
49%
39%
48%
Counselors’ evaluations of the eight components and strategies as one overall approach to counseling students
I can see myself committing to the approach outlined in these items
I know how to use data to determine which students need the most help with these interventions
I know how to apply these interventions to the diverse academic and cultural needs of my students
I intentionally prioritize my most needy students in implementing these interventions
I have the training and knowledge to implement these interventions schoolwide
46%
52%
52%
57%
51%
65%
59%
59%
57%
59%
The College Board National Survey of School Counselors and Administrators 2012 | 55
show accountability, however. Compared with counselors at schools in which fewer than 1 in 4 of the student population is a minority (42%), counselors at schools with at least 75% of students being minorities are more likely to say they know how to show accountability (52%). Counselors at schools with
higher proportions of students on free and reduced-price lunch (54%) also are more likely to know how to show accountability than are their counterparts at schools with fewer than 25% of students on free or reduced-price lunch (44%).
Table 25: Overall Evaluation of Counselors on the Eight Components and Example Action Items as One Overall Approach to Counseling
Committed to This Approach*
%
Have Training and Knowledge to Implement*
%
Know How to Show Accountability for
These Interventions*%
Know How to Create Solutions That
Remove Barriers to These Interventions*
%
All counselors 63 50 47 48
Middle school counselors 59 46 45 44
High school counselors 65 52 48 50
Type of School
All public 63 50 47 48
Urban public 66 51 49 51
Suburban public 60 48 47 47
Rural public 62 52 43 47
All private 60 51 51 49
Percentage of student population that is minority
0 to 24% 58 48 42 45
25 to 49% 62 51 47 47
50 to 74% 65 51 51 52
75% or more 72 52 52 52
Number of students in caseload
Less than 250 65 51 50 50
250–349 62 52 47 47
350–449 63 49 46 47
450 or more 63 49 46 49
Percentage of student population on free or reduced-price lunch
0 to 24% 59 48 44 47
25 to 49% 60 50 45 45
50 to 74% 64 51 47 50
75% or more 73 53 54 53
Title I
Schoolwide 67 51 47 49
Not schoolwide 57 50 45 48
College attendance rates (high school counselors only)
High college attendance (86% or more) 65 55 51 53
Lower college attendance (64% or less) 62 51 43 52
Administrators
All administrators 76 54 NA 53
Middle school administrators 72 50 NA 42
High school administrators 77 55 NA 57
*For each statement, 8–10 ratings on zero-to-10 scale: 10 = This is completely true of me/counselors in my school.
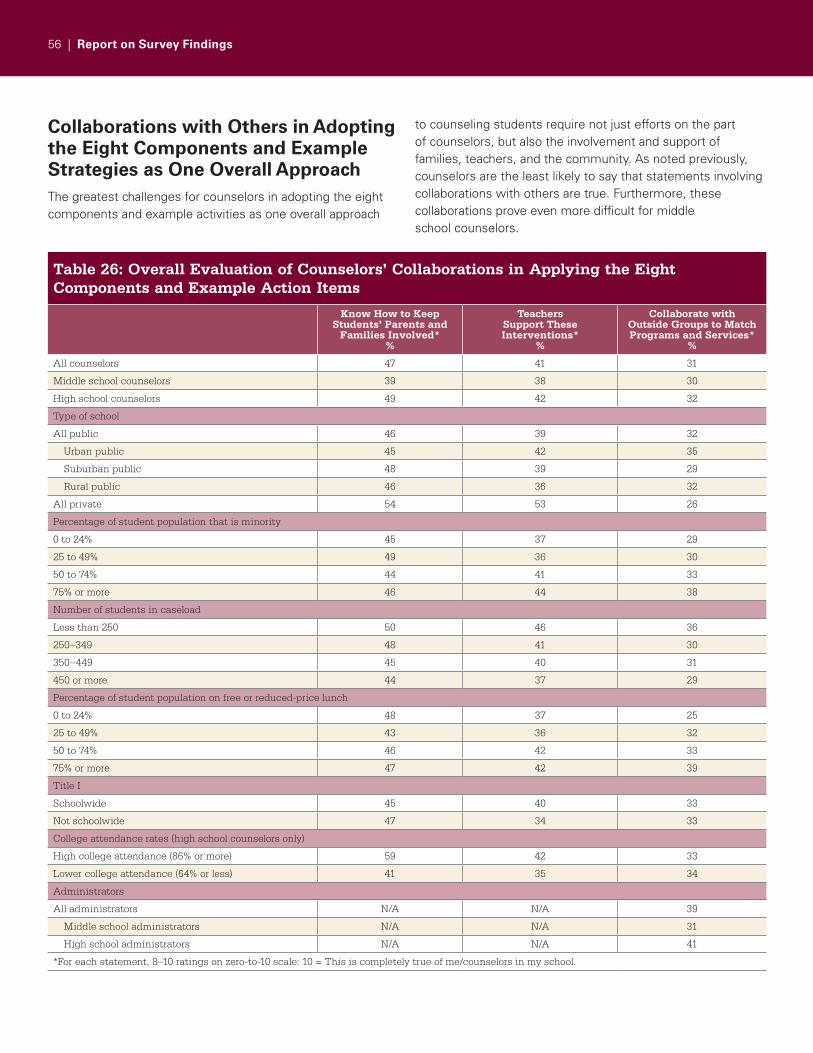
56 | Report on Survey Findings
Collaborations with Others in Adopting the Eight Components and Example Strategies as One Overall ApproachThe greatest challenges for counselors in adopting the eight components and example activities as one overall approach
to counseling students require not just efforts on the part of counselors, but also the involvement and support of families, teachers, and the community. As noted previously, counselors are the least likely to say that statements involving collaborations with others are true. Furthermore, these collaborations prove even more difficult for middle school counselors.
Table 26: Overall Evaluation of Counselors’ Collaborations in Applying the Eight Components and Example Action Items
Know How to Keep Students’ Parents and
Families Involved*%
Teachers Support These Interventions*
%
Collaborate with Outside Groups to Match Programs and Services*
%
All counselors 47 41 31
Middle school counselors 39 38 30
High school counselors 49 42 32
Type of school
All public 46 39 32
Urban public 45 42 35
Suburban public 48 39 29
Rural public 46 36 32
All private 54 53 26
Percentage of student population that is minority
0 to 24% 45 37 29
25 to 49% 49 36 30
50 to 74% 44 41 33
75% or more 46 44 38
Number of students in caseload
Less than 250 50 46 36
250–349 48 41 30
350–449 45 40 31
450 or more 44 37 29
Percentage of student population on free or reduced-price lunch
0 to 24% 48 37 25
25 to 49% 43 36 32
50 to 74% 46 42 33
75% or more 47 42 39
Title I
Schoolwide 45 40 33
Not schoolwide 47 34 33
College attendance rates (high school counselors only)
High college attendance (86% or more) 59 42 33
Lower college attendance (64% or less) 41 35 34
Administrators
All administrators N/A N/A 39
Middle school administrators N/A N/A 31
High school administrators N/A N/A 41
*For each statement, 8–10 ratings on zero-to-10 scale: 10 = This is completely true of me/counselors in my school.
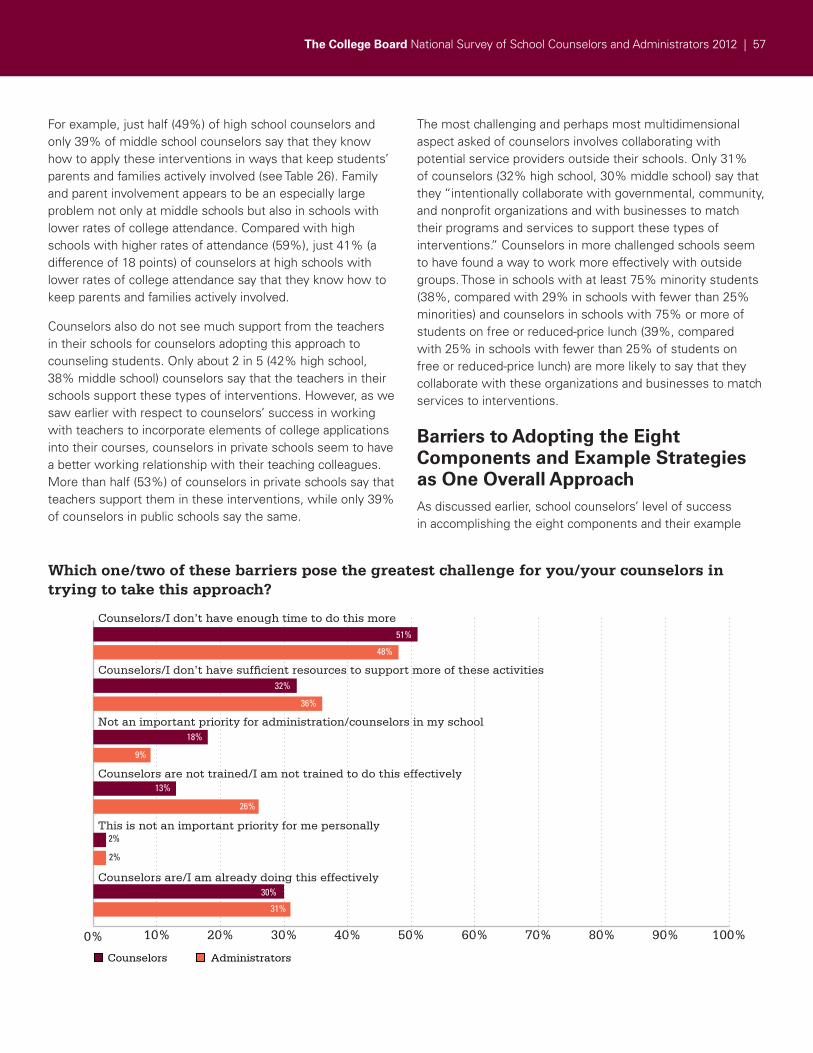
The College Board National Survey of School Counselors and Administrators 2012 | 57
For example, just half (49%) of high school counselors and only 39% of middle school counselors say that they know how to apply these interventions in ways that keep students’ parents and families actively involved (see Table 26). Family and parent involvement appears to be an especially large problem not only at middle schools but also in schools with lower rates of college attendance. Compared with high schools with higher rates of attendance (59%), just 41% (a difference of 18 points) of counselors at high schools with lower rates of college attendance say that they know how to keep parents and families actively involved.
Counselors also do not see much support from the teachers in their schools for counselors adopting this approach to counseling students. Only about 2 in 5 (42% high school, 38% middle school) counselors say that the teachers in their schools support these types of interventions. However, as we saw earlier with respect to counselors’ success in working with teachers to incorporate elements of college applications into their courses, counselors in private schools seem to have a better working relationship with their teaching colleagues. More than half (53%) of counselors in private schools say that teachers support them in these interventions, while only 39% of counselors in public schools say the same.
The most challenging and perhaps most multidimensional aspect asked of counselors involves collaborating with potential service providers outside their schools. Only 31% of counselors (32% high school, 30% middle school) say that they “intentionally collaborate with governmental, community, and nonprofit organizations and with businesses to match their programs and services to support these types of interventions.” Counselors in more challenged schools seem to have found a way to work more effectively with outside groups. Those in schools with at least 75% minority students (38%, compared with 29% in schools with fewer than 25% minorities) and counselors in schools with 75% or more of students on free or reduced-price lunch (39%, compared with 25% in schools with fewer than 25% of students on free or reduced-price lunch) are more likely to say that they collaborate with these organizations and businesses to match services to interventions.
Barriers to Adopting the Eight Components and Example Strategies as One Overall ApproachAs discussed earlier, school counselors’ level of success in accomplishing the eight components and their example
Which one/two of these barriers pose the greatest challenge for you/your counselors in trying to take this approach?
Counselors/I don’t have enough time to do this more
Counselors/I don’t have sufficient resources to support more of these activities
Not an important priority for administration/counselors in my school
Counselors are not trained/I am not trained to do this effectively
This is not an important priority for me personally
Counselors are/I am already doing this effectively
Administrators Counselors
0% 10% 20% 30% 40% 50% 60% 70% 80% 90% 100%
51%
48%
32%
36%
18%
9%
13%
26%
2%
2%
30%
31%
58 | Report on Survey Findings
strategies falls short of their personal commitment. This survey gave school counselors and administrators the opportunity to share their perspectives on the biggest obstacles counselors face in their efforts to adopt the eight components as their overall approach to counseling students. The results reveal that, for the most part, counselors’ and administrators’ views are very much in line. While about 3 in 10 (30%) counselors and administrators (31%) say that their counselors already are doing this effectively, the remaining counselors cite time and resources as their greatest obstacles (see above figure).
Time is the largest barrier to counselors’ using the eight components of a college and career readiness framework successfully and effectively. School counselors say that they simply do not have enough of it. Just about half (51%) of schools counselors say that one of the greatest challenges for them in trying to take this approach to counseling is that they do not have enough time to do it more (see above figure). High school administrators agree, as 53% say that one of the biggest challenges for counselors in their schools is that they do not have enough time (see Table 27). Middle school administrators (32%), in contrast, are markedly less likely to say that time is their counselors’ greatest barrier. Not surprisingly, counselors with larger caseloads are more likely to feel the burden of too little time; 59% of school counselors with at least
450 students say they do not have sufficient time, while just 40% of counselors with fewer than 250 students say the same.
Resources pose the next greatest challenge for counselors, as one-third of counselors (32%) and administrators (36%) say that they do not have sufficient resources to support more of these activities. Counselors in private schools (21%) are less likely than those in public schools (33%) to see a lack of resources as a problem. Of course, it should be noted that counselors in private schools (46%) also are far more likely than counselors in public schools (28%) to say that they already are effective in taking this approach.
School counselors and administrators start to differ, however, when it comes to personalizing the barrier. In short, administrators are more likely to see the barrier as coming from the counselors themselves than are counselors, while counselors are more likely than administrators to fault the administration. By 2 to 1, administrators (26%) are more likely to say that counselors are not trained to take this approach effectively than are counselors themselves (13%). Even more dramatically, while only 2% of school counselors and school administrators alike say that this is not a priority for them personally, fully 18% of school counselors say that it is not a priority for the administration at their schools and 9% of administrators say that it is not a priority for counselors.
While a lack of time (47%) and resources (35%) remain the greatest challenges to counselors in disadvantaged schools, a lack of administrative support also seems to be a barrier. Counselors in schools with at least 75% of the students on free or reduced-price lunch (23%) are more likely to say that this is not a priority for their administrators than counselors in schools with fewer than 25% of students on free or reduced-price lunch (14%).
“I know this is what I want to do, I’m passionate about it, [and] my principal or administrators are committed. But it doesn’t happen in my school. I wish it could, but it’s not happening. The missing ingredients are time and resources.”
— High school conselor, Charlotte
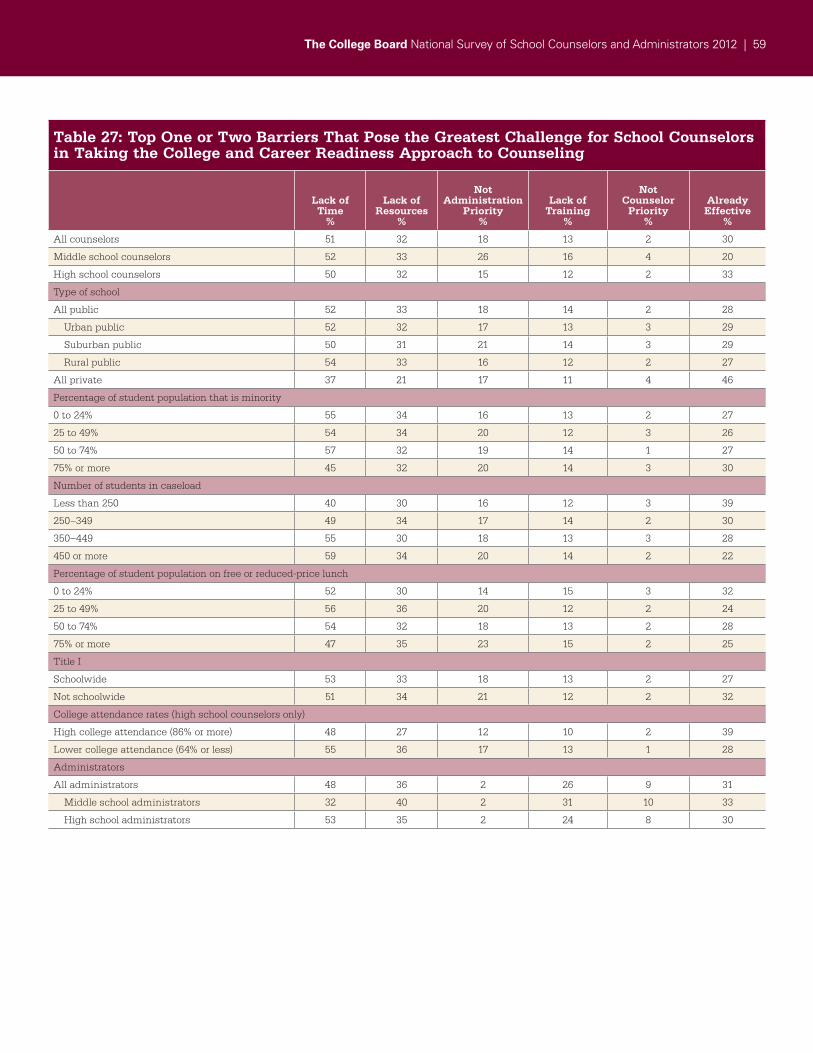
The College Board National Survey of School Counselors and Administrators 2012 | 59
Table 27: Top One or Two Barriers That Pose the Greatest Challenge for School Counselors in Taking the College and Career Readiness Approach to Counseling
Lack ofTime
%
Lack ofResources
%
Not Administration
Priority%
Lack of Training
%
Not Counselor
Priority%
Already Effective
%
All counselors 51 32 18 13 2 30
Middle school counselors 52 33 26 16 4 20
High school counselors 50 32 15 12 2 33
Type of school
All public 52 33 18 14 2 28
Urban public 52 32 17 13 3 29
Suburban public 50 31 21 14 3 29
Rural public 54 33 16 12 2 27
All private 37 21 17 11 4 46
Percentage of student population that is minority
0 to 24% 55 34 16 13 2 27
25 to 49% 54 34 20 12 3 26
50 to 74% 57 32 19 14 1 27
75% or more 45 32 20 14 3 30
Number of students in caseload
Less than 250 40 30 16 12 3 39
250–349 49 34 17 14 2 30
350–449 55 30 18 13 3 28
450 or more 59 34 20 14 2 22
Percentage of student population on free or reduced-price lunch
0 to 24% 52 30 14 15 3 32
25 to 49% 56 36 20 12 2 24
50 to 74% 54 32 18 13 2 28
75% or more 47 35 23 15 2 25
Title I
Schoolwide 53 33 18 13 2 27
Not schoolwide 51 34 21 12 2 32
College attendance rates (high school counselors only)
High college attendance (86% or more) 48 27 12 10 2 39
Lower college attendance (64% or less) 55 36 17 13 1 28
Administrators
All administrators 48 36 2 26 9 31
Middle school administrators 32 40 2 31 10 33
High school administrators 53 35 2 24 8 30
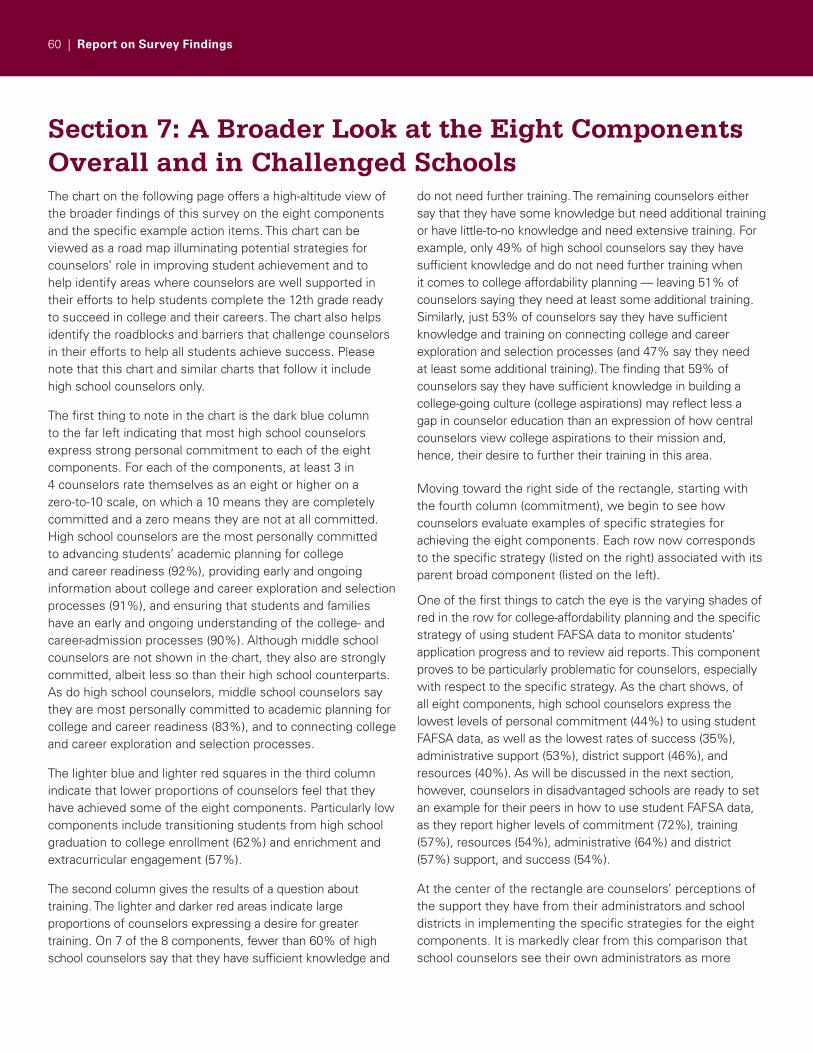
60 | Report on Survey Findings
Section 7: A Broader Look at the Eight Components Overall and in Challenged SchoolsThe chart on the following page offers a high-altitude view of the broader findings of this survey on the eight components and the specific example action items. This chart can be viewed as a road map illuminating potential strategies for counselors’ role in improving student achievement and to help identify areas where counselors are well supported in their efforts to help students complete the 12th grade ready to succeed in college and their careers. The chart also helps identify the roadblocks and barriers that challenge counselors in their efforts to help all students achieve success. Please note that this chart and similar charts that follow it include high school counselors only.
The first thing to note in the chart is the dark blue column to the far left indicating that most high school counselors express strong personal commitment to each of the eight components. For each of the components, at least 3 in 4 counselors rate themselves as an eight or higher on a zero-to-10 scale, on which a 10 means they are completely committed and a zero means they are not at all committed. High school counselors are the most personally committed to advancing students’ academic planning for college and career readiness (92%), providing early and ongoing information about college and career exploration and selection processes (91%), and ensuring that students and families have an early and ongoing understanding of the college- and career-admission processes (90%). Although middle school counselors are not shown in the chart, they also are strongly committed, albeit less so than their high school counterparts. As do high school counselors, middle school counselors say they are most personally committed to academic planning for college and career readiness (83%), and to connecting college and career exploration and selection processes.
The lighter blue and lighter red squares in the third column indicate that lower proportions of counselors feel that they have achieved some of the eight components. Particularly low components include transitioning students from high school graduation to college enrollment (62%) and enrichment and extracurricular engagement (57%).
The second column gives the results of a question about training. The lighter and darker red areas indicate large proportions of counselors expressing a desire for greater training. On 7 of the 8 components, fewer than 60% of high school counselors say that they have sufficient knowledge and
do not need further training. The remaining counselors either say that they have some knowledge but need additional training or have little-to-no knowledge and need extensive training. For example, only 49% of high school counselors say they have sufficient knowledge and do not need further training when it comes to college affordability planning — leaving 51% of counselors saying they need at least some additional training. Similarly, just 53% of counselors say they have sufficient knowledge and training on connecting college and career exploration and selection processes (and 47% say they need at least some additional training). The finding that 59% of counselors say they have sufficient knowledge in building a college-going culture (college aspirations) may reflect less a gap in counselor education than an expression of how central counselors view college aspirations to their mission and, hence, their desire to further their training in this area.
Moving toward the right side of the rectangle, starting with the fourth column (commitment), we begin to see how counselors evaluate examples of specific strategies for achieving the eight components. Each row now corresponds to the specific strategy (listed on the right) associated with its parent broad component (listed on the left).
One of the first things to catch the eye is the varying shades of red in the row for college-affordability planning and the specific strategy of using student FAFSA data to monitor students’ application progress and to review aid reports. This component proves to be particularly problematic for counselors, especially with respect to the specific strategy. As the chart shows, of all eight components, high school counselors express the lowest levels of personal commitment (44%) to using student FAFSA data, as well as the lowest rates of success (35%), administrative support (53%), district support (46%), and resources (40%). As will be discussed in the next section, however, counselors in disadvantaged schools are ready to set an example for their peers in how to use student FAFSA data, as they report higher levels of commitment (72%), training (57%), resources (54%), administrative (64%) and district (57%) support, and success (54%).
At the center of the rectangle are counselors’ perceptions of the support they have from their administrators and school districts in implementing the specific strategies for the eight components. It is markedly clear from this comparison that school counselors see their own administrators as more
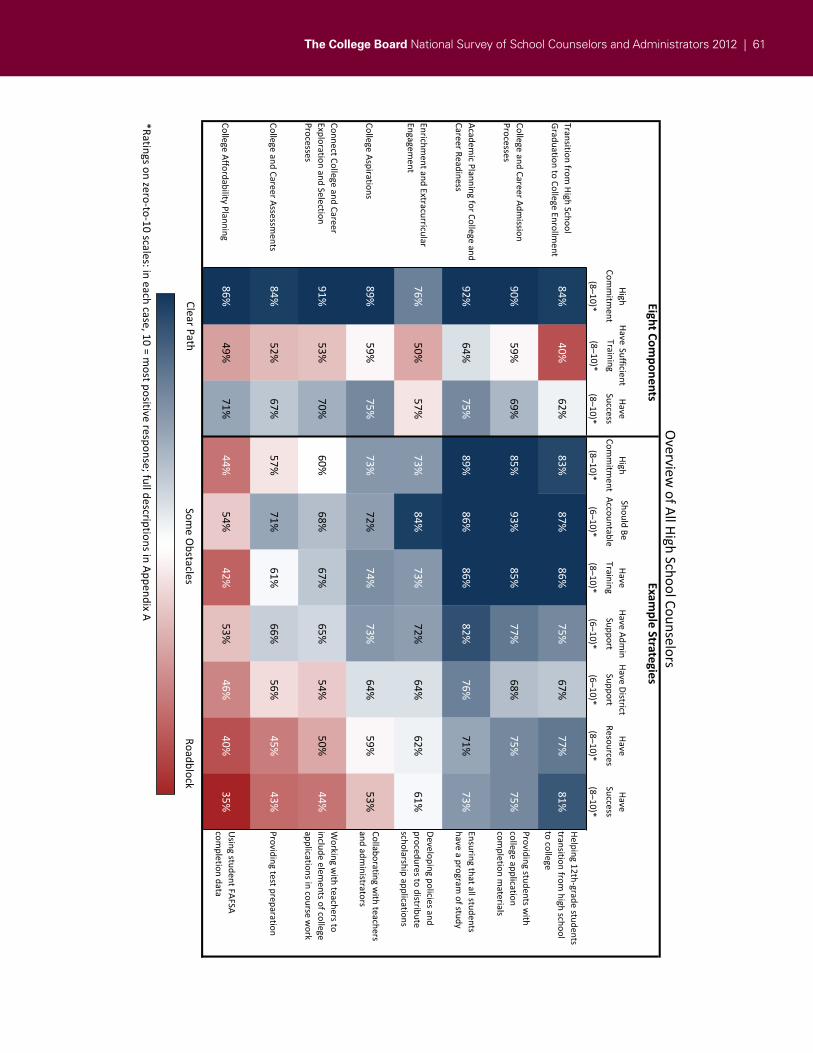
The College Board National Survey of School Counselors and Administrators 2012 | 6160 | Report on Survey Findings
Comm
itment
HaveSuccess
Comm
itment
AccountableTraining
SupportSupport
ResourcesHave
Success
(8–10)*(8–10)*
(8–10)*(6–10)*
(8–10)*(6–10)*
(6–10)*(8–10)*
(8–10)*
84%40%
62%83%
87%86%
75%67%
77%81%
Processes90%
59%69%
85%93%
85%77%
68%75%
75%
Career Readiness92%
64%75%
89%86%
86%82%
76%71%
73%
Engagement
76%50%
57%73%
84%73%
72%64%
62%61%
89%59%
75%73%
72%74%
73%64%
59%53%
Processes91%
53%70%
60%68%
67%65%
54%50%
44%
84%52%
67%57%
71%61%
66%56%
45%43%
86%49%
71%44%
54%42%
53%46%
40%35%
Some
Clear
Be
(8–10)*
Training
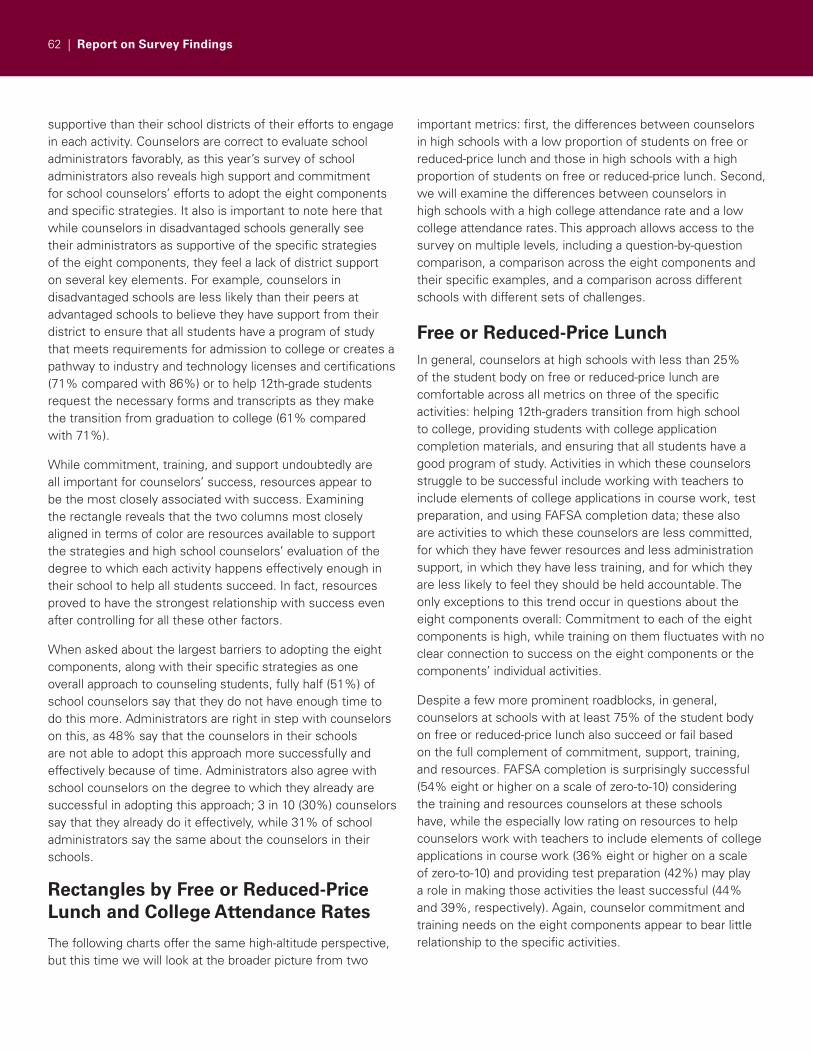
62 | Report on Survey Findings
supportive than their school districts of their efforts to engage in each activity. Counselors are correct to evaluate school administrators favorably, as this year’s survey of school administrators also reveals high support and commitment for school counselors’ efforts to adopt the eight components and specific strategies. It also is important to note here that while counselors in disadvantaged schools generally see their administrators as supportive of the specific strategies of the eight components, they feel a lack of district support on several key elements. For example, counselors in disadvantaged schools are less likely than their peers at advantaged schools to believe they have support from their district to ensure that all students have a program of study that meets requirements for admission to college or creates a pathway to industry and technology licenses and certifications (71% compared with 86%) or to help 12th-grade students request the necessary forms and transcripts as they make the transition from graduation to college (61% compared with 71%).
While commitment, training, and support undoubtedly are all important for counselors’ success, resources appear to be the most closely associated with success. Examining the rectangle reveals that the two columns most closely aligned in terms of color are resources available to support the strategies and high school counselors’ evaluation of the degree to which each activity happens effectively enough in their school to help all students succeed. In fact, resources proved to have the strongest relationship with success even after controlling for all these other factors.
When asked about the largest barriers to adopting the eight components, along with their specific strategies as one overall approach to counseling students, fully half (51%) of school counselors say that they do not have enough time to do this more. Administrators are right in step with counselors on this, as 48% say that the counselors in their schools are not able to adopt this approach more successfully and effectively because of time. Administrators also agree with school counselors on the degree to which they already are successful in adopting this approach; 3 in 10 (30%) counselors say that they already do it effectively, while 31% of school administrators say the same about the counselors in their schools.
Rectangles by Free or Reduced-Price Lunch and College Attendance Rates
The following charts offer the same high-altitude perspective, but this time we will look at the broader picture from two
important metrics: first, the differences between counselors in high schools with a low proportion of students on free or reduced-price lunch and those in high schools with a high proportion of students on free or reduced-price lunch. Second, we will examine the differences between counselors in high schools with a high college attendance rate and a low college attendance rates. This approach allows access to the survey on multiple levels, including a question-by-question comparison, a comparison across the eight components and their specific examples, and a comparison across different schools with different sets of challenges.
Free or Reduced-Price LunchIn general, counselors at high schools with less than 25% of the student body on free or reduced-price lunch are comfortable across all metrics on three of the specific activities: helping 12th-graders transition from high school to college, providing students with college application completion materials, and ensuring that all students have a good program of study. Activities in which these counselors struggle to be successful include working with teachers to include elements of college applications in course work, test preparation, and using FAFSA completion data; these also are activities to which these counselors are less committed, for which they have fewer resources and less administration support, in which they have less training, and for which they are less likely to feel they should be held accountable. The only exceptions to this trend occur in questions about the eight components overall: Commitment to each of the eight components is high, while training on them fluctuates with no clear connection to success on the eight components or the components’ individual activities.
Despite a few more prominent roadblocks, in general, counselors at schools with at least 75% of the student body on free or reduced-price lunch also succeed or fail based on the full complement of commitment, support, training, and resources. FAFSA completion is surprisingly successful (54% eight or higher on a scale of zero-to-10) considering the training and resources counselors at these schools have, while the especially low rating on resources to help counselors work with teachers to include elements of college applications in course work (36% eight or higher on a scale of zero-to-10) and providing test preparation (42%) may play a role in making those activities the least successful (44% and 39%, respectively). Again, counselor commitment and training needs on the eight components appear to bear little relationship to the specific activities.
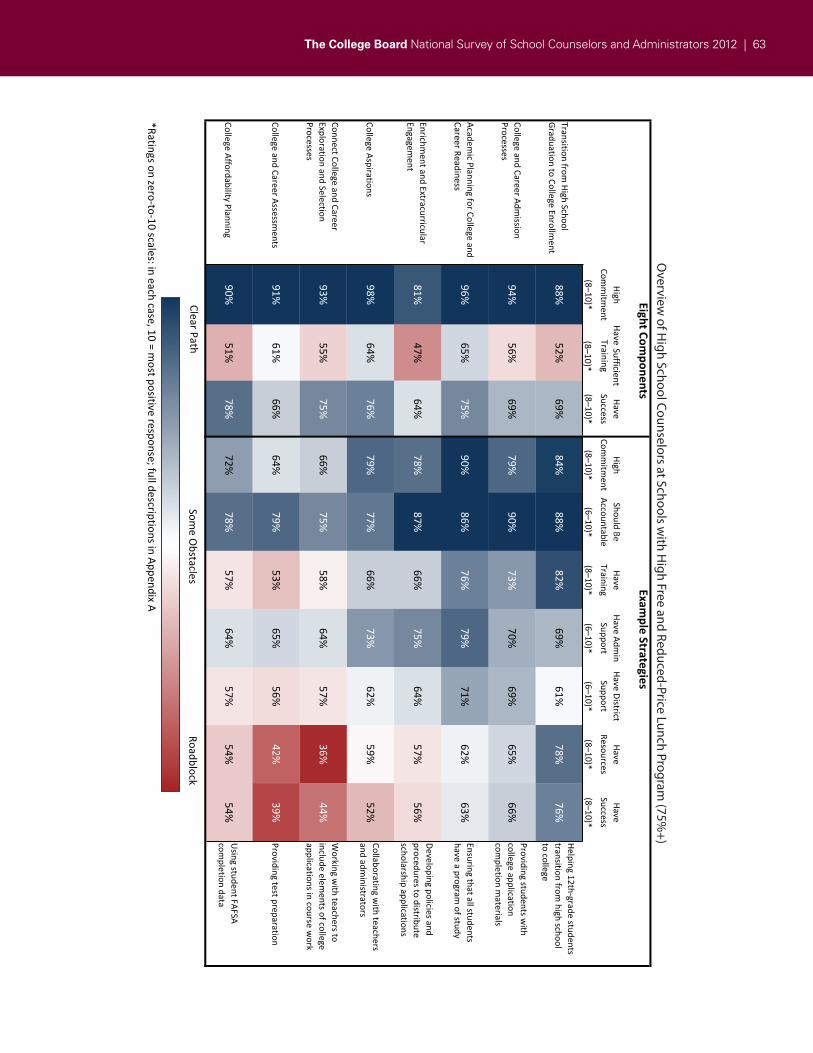
The College Board National Survey of School Counselors and Administrators 2012 | 6362 | Report on Survey Findings
Comm
itment
SuccessCom
mitm
entAccountable
HaveTraining
SupportSupport
ResourcesHave
Success
(8–10)*(8–10)*
(8–10)*(6–10)*
(8–10)*(6–10)*
(6–10)*(8–10)*
(8–10)*
88%52%
69%84%
88%82%
69%61%
78%76%
Processes94%
56%69%
79%90%
73%70%
69%65%
66%
Career Readiness96%
65%75%
90%86%
76%79%
71%62%
63%
Engagement
81%47%
64%78%
87%66%
75%64%
57%56%
98%64%
76%79%
77%66%
73%62%
59%52%
Processes93%
55%75%
66%75%
58%64%
57%36%
44%
91%61%
66%64%
79%53%
65%56%
42%39%
90%51%
78%72%
78%57%
64%57%
54%54%
Some
Clear
Overview
of High School C
ounselors at Schools with H
igh Free and Reduced-Price Lunch Program (75%
+)
(8–10)*
Training
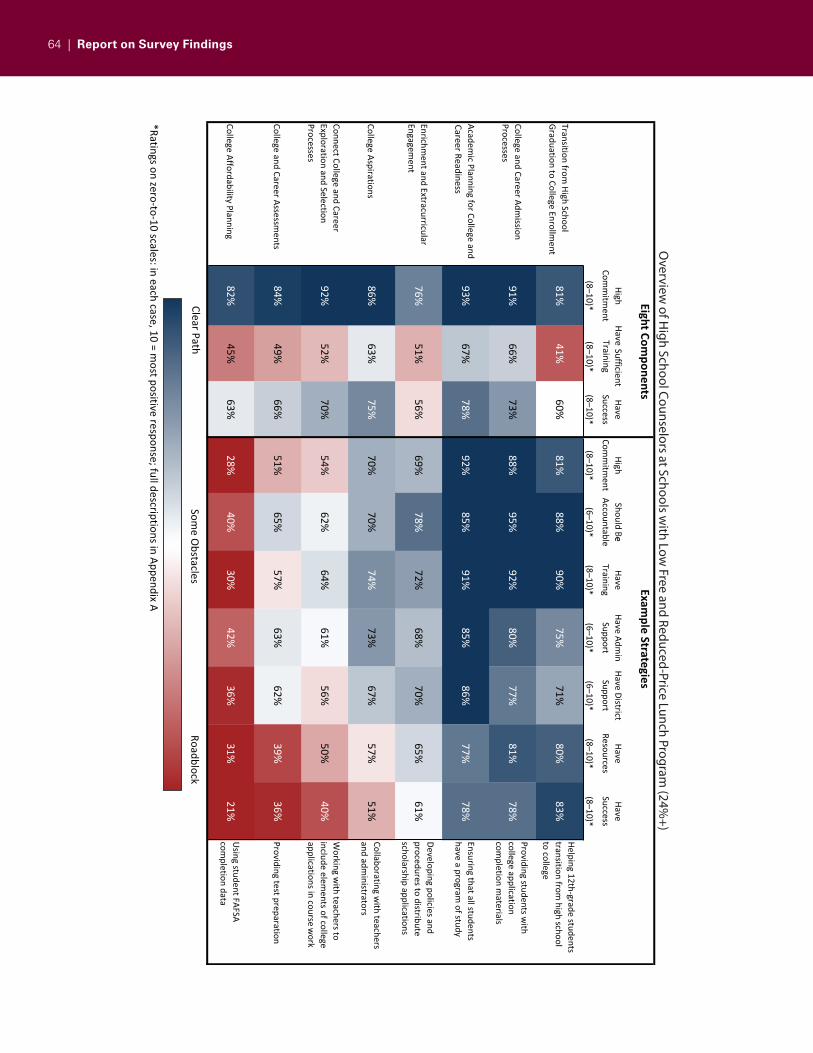
64 | Report on Survey Findings The College Board Barriers and Supports to School Counselor Success 2012 | 63
Comm
itment
SuccessCom
mitm
entAccountable
HaveTraining
SupportSupport
ResourcesHave
Success
(8–10)*(8–10)*
(8–10)*(6–10)*
(8–10)*(6–10)*
(6–10)*(8–10)*
(8–10)*
81%41%
60%81%
88%90%
75%71%
80%83%
Processes91%
66%73%
88%95%
92%80%
77%81%
78%
93%67%
78%92%
85%91%
85%86%
77%78%
Engagement
76%51%
56%69%
78%72%
68%70%
65%61%
86%63%
75%70%
70%74%
73%67%
57%51%
Processes92%
52%70%
54%62%
64%61%
56%50%
40%
84%49%
66%51%
65%57%
63%62%
39%36%
82%45%
63%28%
40%30%
42%36%
31%21%
Some
Clear
Overview
of High School C
ounselors at Schools with Low
Free and Reduced-Price Lunch Program (24%
+)
(8–10)*
Training
Career Readiness
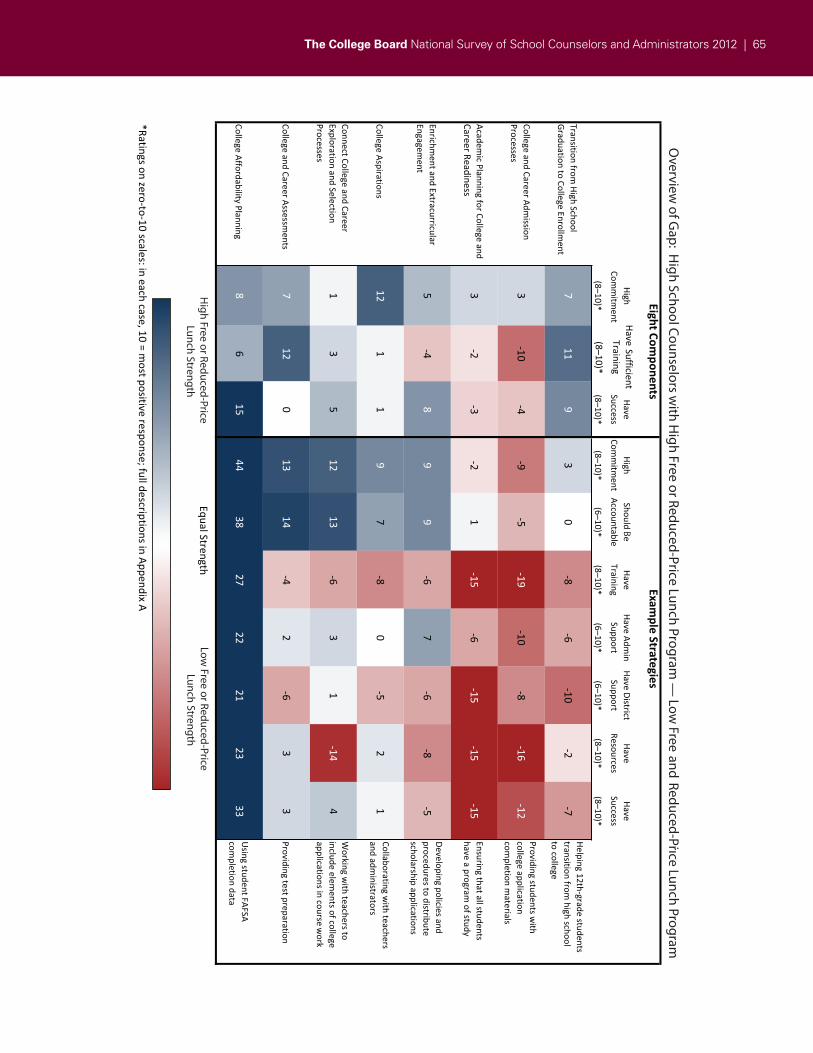
The College Board National Survey of School Counselors and Administrators 2012 | 65
64 | Report on Survey Findings
HighHave
SuccessCom
mitm
entAccountable
HaveTraining
SupportSupport
ResourcesHave
Success
(8–10)*(8–10)*
(8–10)*(6–10)*
(8–10)*(6–10)*
(6–10)*(8–10)*
(8–10)*
711
93
0
Processes3
Career Readiness3
1
Engagement
58
99
7
121
19
70
21
Processes1
35
1213
31
4
712
013
142
33
86
1544
3827
2221
2333
(8–10)*
Training
and
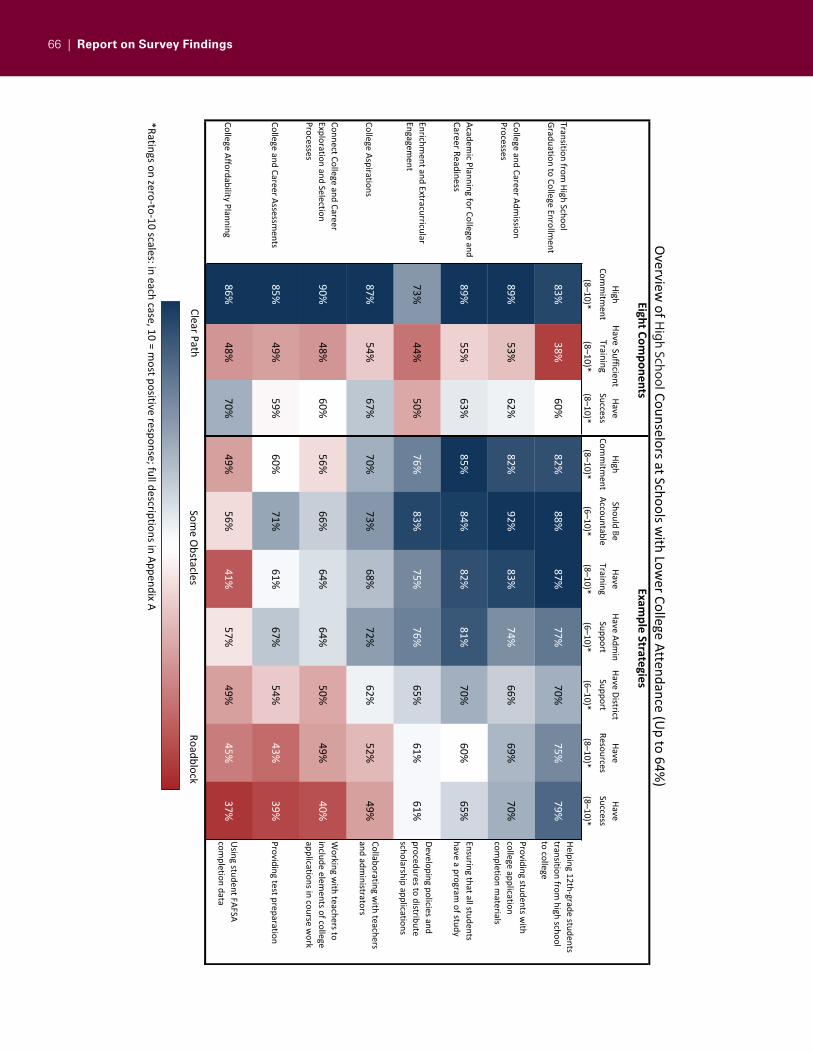
66 | Report on Survey FindingsThe College Board Barriers and Supports to School Counselor Success 2012 | 65
HighCom
mitm
entHave
SuccessCom
mitm
entAccountable
HaveTraining
SupportSupport
ResourcesHave
Success
(8–10)*(8–10)*
(8–10)*(6–10)*
(8–10)*(6–10)*
(6–10)*(8–10)*
(8–10)*
83%38%
60%82%
88%87%
77%70%
75%79%
Processes89%
53%62%
82%92%
83%74%
66%69%
70%
Career Readiness89%
55%63%
85%84%
82%81%
70%60%
65%
Engagement
73%44%
50%76%
83%75%
76%65%
61%61%
87%54%
67%70%
73%68%
72%62%
52%49%
Processes90%
48%60%
56%66%
64%64%
50%49%
40%
85%49%
59%60%
71%61%
67%54%
43%39%
86%48%
70%49%
56%41%
57%49%
45%37%
Some
Clear
(8–10)*
Training
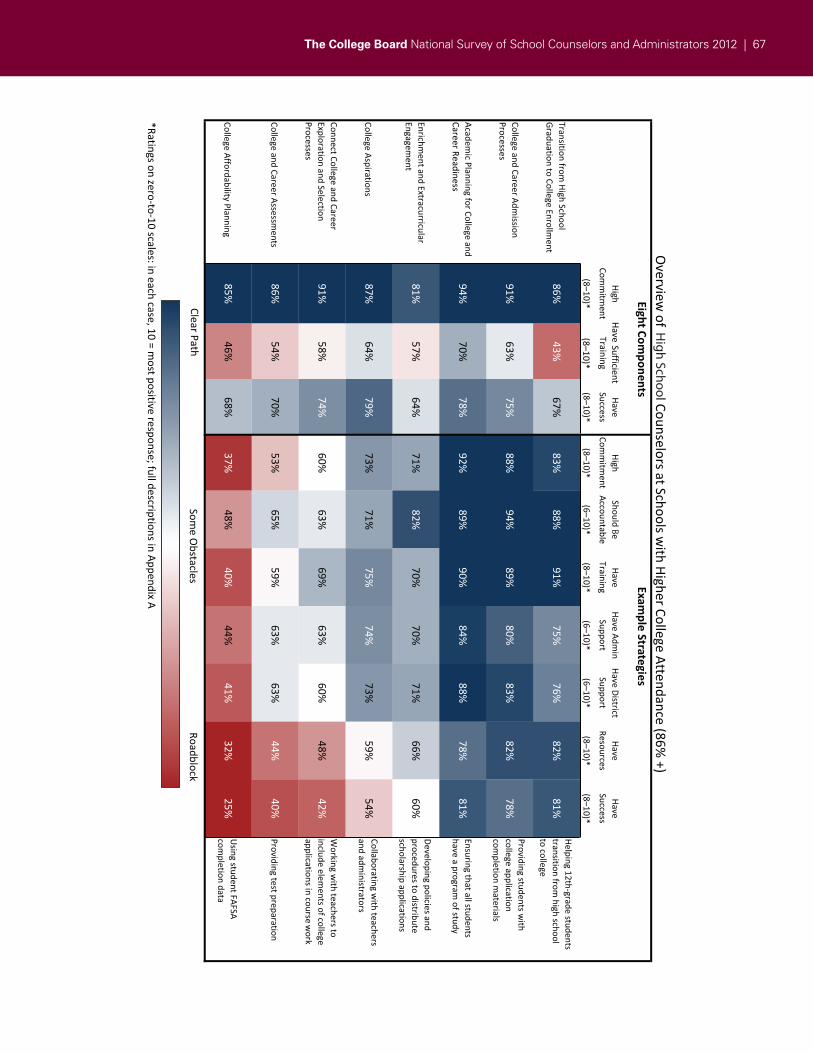
The College Board National Survey of School Counselors and Administrators 2012 | 6766 | Report on Survey Findings
HighCom
mitm
entHave
SuccessHigh
Comm
itment
AccountableHave
TrainingSupport
SupportResources
HaveSuccess
(8–10)*(8–10)*
(8–10)*(6–10)*
(8–10)*(6–10)*
(6–10)*(8–10)*
(8–10)*
86%43%
67%83%
88%91%
75%76%
82%81%
Processes91%
63%75%
88%94%
89%80%
83%82%
78%
Career Readiness94%
70%78%
92%89%
90%84%
88%78%
81%
Engagement
81%57%
64%71%
82%70%
70%71%
66%60%
87%64%
79%73%
71%75%
74%73%
59%54%
Processes91%
58%74%
60%63%
69%63%
60%48%
42%
86%54%
70%53%
65%59%
63%63%
44%40%
85%46%
68%37%
48%40%
44%41%
32%25%
Some
Clear
(8–10)*
Training
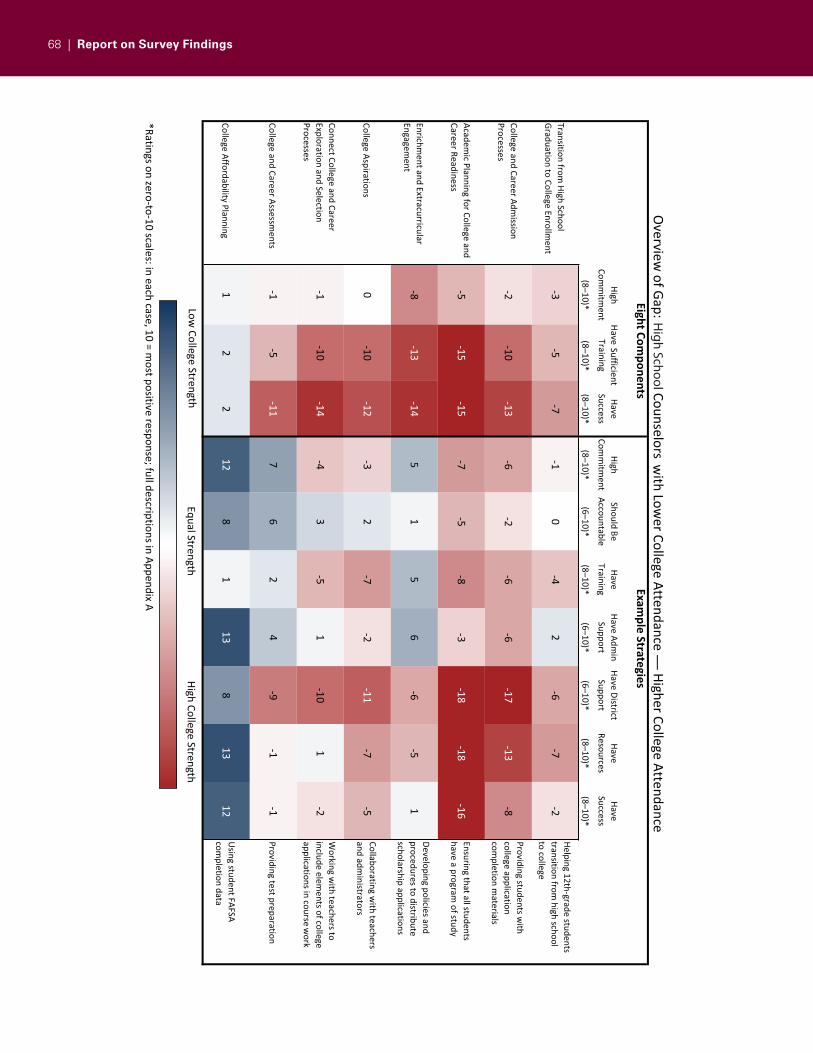
68 | Report on Survey Findings The College Board Barriers and Supports to School Counselor Success 2012 | 67
HighCom
mitm
entHave
SuccessCom
mitm
entAccountable
HaveTraining
SupportSupport
ResourcesHave
Success
(8–10)*(8–10)*
(8–10)*(6–10)*
(8–10)*(6–10)*
(6–10)*(8–10)*
(8–10)*
02
Processes
Career Readiness
Engagement
51
56
1
02
Processes3
11
76
24
12
212
81
138
1312
(8–10)*
Training
The College Board National Survey of School Counselors and Administrators 2012 | 69
Comparing counselors at schools with low levels (less than 25%) of students on free or reduced-price lunch to counselors at schools with high levels (75% or more) reveals a few striking trends (see the third rectangle). The clearest is that counselors at schools with higher proportions of students on free or reduced-price lunch are better trained, have more resources, and have more support, a greater commitment, and greater accountability when it comes to college-affordability planning and using student FAFSA completion data. Counselors at these more challenged schools also are more likely, in general, to be committed and to feel they should be held accountable to the eight components and their specific activities. Counselors at less challenged schools, on the other hand, are more likely to receive training on any specific issue besides FAFSA data use and to receive more district support on specific items.
Looking at the difference between counselors at less challenged schools and those at more challenged schools, a large gap exists on two items: providing students with college application materials and ensuring that all students have a good program of study. Counselors at schools with fewer than 25% of students on free or reduced-price lunch rate themselves higher on nearly every question, especially training and resources. Resources, in particular, track strongly with success, the exception being working with teachers to include elements of college applications. This finding suggests that while a lack of resources poses a challenge to counselors at disadvantaged schools when it comes to implementing most of the interventions, it is not an insurmountable barrier for counselors in these schools when working with teachers.
College AttendanceCounselors at high schools with a high rate of college attendance (at least 86% of students) are successful across all questions on three specific items: helping 12th-graders transition from high school to college, providing students with college application completion materials, and ensuring that all students have a good program of study. Conversely, working with FAFSA completion data is the only activity that receives consistently low ratings from counselors at high-attendance schools. These counselors also struggle to be successful working with teachers to include elements of college applications in course work and to provide test preparation, but their success rate is much lower than their support and training. What is noticeably lower for these two activities is their resource rating (48% eight or higher on a scale of zero-to-10 for working with teachers and 44% for providing test preparation), which is very close to their success rates (42% and 40% eight on a scale of zero-to-10,
respectively). These counselors’ ratings of their commitment and training on more general descriptions of the eight components appear to be disconnected from their success on specific items, with components about which they feel the least trained (43% reporting sufficient training for transitioning students from high school graduation to college enrollment) being the specific example about which they feel they are most successful (81% eight or higher on a scale of zero-to-10 reporting success for helping 12th-grade students transition from high school to college).
Counselors at schools with a low rate of college attendance (at most 64% of students) identify several clear roadblocks in both the eight components and the specific examples. As with counselors at high college-attendance schools, success ratings for counselors at low college-attendance schools appear to have a close relationship with their resource rating on specific example activities. Counselors at low college-attendance schools also have a lower level of district support when compared with training and administrative support, revealing an important deficiency in schools that already send a lower proportion of their students to college. When asked about the eight components, these counselors also report low training and success rates, although a clear connection does not appear between these ratings and ratings on specific examples.
The roadblocks at low college-attendance schools become even more striking when shown in comparison with the ratings given by counselors at high college-attendance schools. Despite a fairly even commitment rating (with a slightly higher rating on most items in favor of high college-attendance schools) on both the eight components and specific example activities, there is a noticeable training gap on the eight components as well as a clear gap in district support of specific activities. The only exception is college affordability planning, with the example of using FAFSA completion data, which counselors at lower college-attendance schools actually rate higher than their counterparts at high-attendance schools. The worst-performing examples are providing students with college application materials and ensuring that all students have a program of study. The 16-point gap in success (81% eight or higher on a scale of zero-to-10 among high attendance compared with 65% among low attendance) for ensuring that all students have a good program of study is the highest difference of the eight examples — well above the differences in success for any of the other items. This specific example appears to be a major stumbling block for high free or reduced-price lunch schools as well as low college-attendance schools, and one of the many roadblocks these charts reveal.
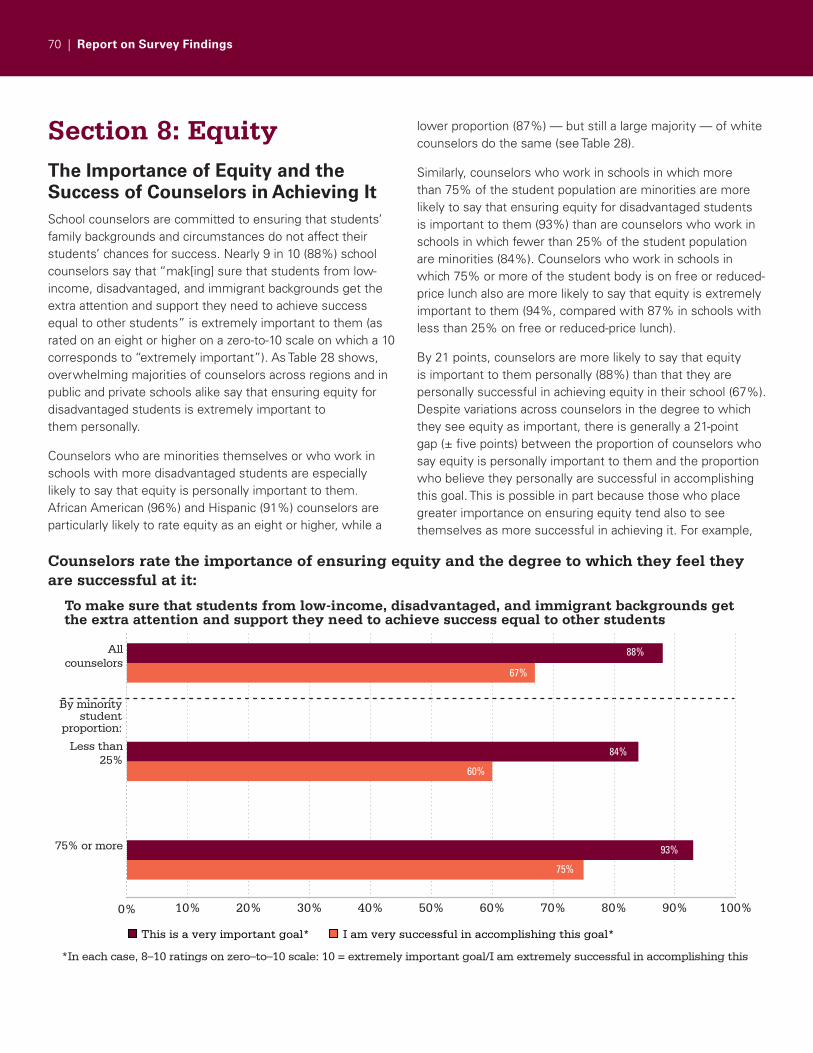
70 | Report on Survey Findings
Section 8: EquityThe Importance of Equity and the Success of Counselors in Achieving ItSchool counselors are committed to ensuring that students’ family backgrounds and circumstances do not affect their students’ chances for success. Nearly 9 in 10 (88%) school counselors say that “mak[ing] sure that students from low-income, disadvantaged, and immigrant backgrounds get the extra attention and support they need to achieve success equal to other students” is extremely important to them (as rated on an eight or higher on a zero-to-10 scale on which a 10 corresponds to “extremely important”). As Table 28 shows, overwhelming majorities of counselors across regions and in public and private schools alike say that ensuring equity for disadvantaged students is extremely important to them personally.
Counselors who are minorities themselves or who work in schools with more disadvantaged students are especially likely to say that equity is personally important to them. African American (96%) and Hispanic (91%) counselors are particularly likely to rate equity as an eight or higher, while a
lower proportion (87%) — but still a large majority — of white counselors do the same (see Table 28).
Similarly, counselors who work in schools in which more than 75% of the student population are minorities are more likely to say that ensuring equity for disadvantaged students is important to them (93%) than are counselors who work in schools in which fewer than 25% of the student population are minorities (84%). Counselors who work in schools in which 75% or more of the student body is on free or reduced-price lunch also are more likely to say that equity is extremely important to them (94%, compared with 87% in schools with less than 25% on free or reduced-price lunch).
By 21 points, counselors are more likely to say that equity is important to them personally (88%) than that they are personally successful in achieving equity in their school (67%). Despite variations across counselors in the degree to which they see equity as important, there is generally a 21-point gap (± five points) between the proportion of counselors who say equity is personally important to them and the proportion who believe they personally are successful in accomplishing this goal. This is possible in part because those who place greater importance on ensuring equity tend also to see themselves as more successful in achieving it. For example,
Counselors rate the importance of ensuring equity and the degree to which they feel they are successful at it:
*In each case, 8–10 ratings on zero–to–10 scale: 10 = extremely important goal/I am extremely successful in accomplishing this
To make sure that students from low-income, disadvantaged, and immigrant backgrounds get the extra attention and support they need to achieve success equal to other students
Allcounselors
Less than25%
By minority student
proportion:
75% or more
I am very successful in accomplishing this goal*This is a very important goal*
0% 10% 20% 30% 40% 50% 60% 70% 80% 90% 100%
75%
88%
67%
84%
60%
93%
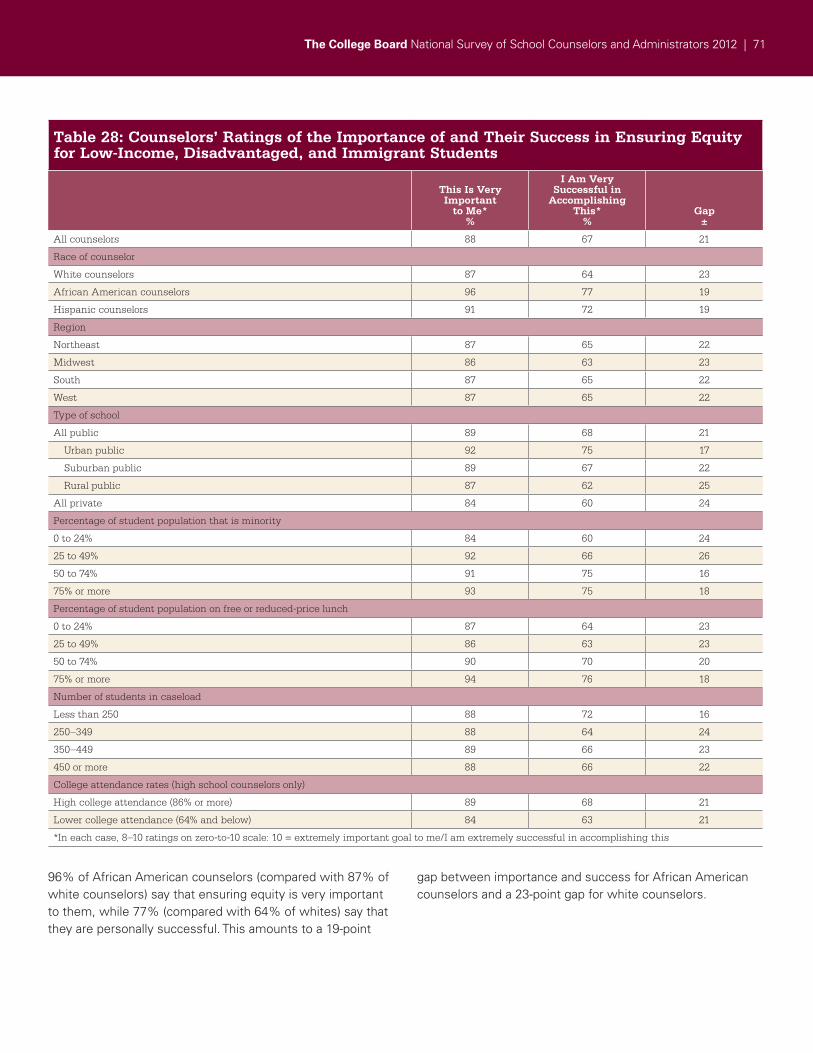
The College Board National Survey of School Counselors and Administrators 2012 | 71
96% of African American counselors (compared with 87% of white counselors) say that ensuring equity is very important to them, while 77% (compared with 64% of whites) say that they are personally successful. This amounts to a 19-point
gap between importance and success for African American counselors and a 23-point gap for white counselors.
Table 28: Counselors’ Ratings of the Importance of and Their Success in Ensuring Equity for Low-Income, Disadvantaged, and Immigrant Students
This Is Very Important
to Me* %
I Am Very Successful in
Accomplishing This*
%Gap
±
All counselors 88 67 21
Race of counselor
White counselors 87 64 23
African American counselors 96 77 19
Hispanic counselors 91 72 19
Region
Northeast 87 65 22
Midwest 86 63 23
South 87 65 22
West 87 65 22
Type of school
All public 89 68 21
Urban public 92 75 17
Suburban public 89 67 22
Rural public 87 62 25
All private 84 60 24
Percentage of student population that is minority
0 to 24% 84 60 24
25 to 49% 92 66 26
50 to 74% 91 75 16
75% or more 93 75 18
Percentage of student population on free or reduced-price lunch
0 to 24% 87 64 23
25 to 49% 86 63 23
50 to 74% 90 70 20
75% or more 94 76 18
Number of students in caseload
Less than 250 88 72 16
250–349 88 64 24
350–449 89 66 23
450 or more 88 66 22
College attendance rates (high school counselors only)
High college attendance (86% or more) 89 68 21
Lower college attendance (64% and below) 84 63 21
*In each case, 8–10 ratings on zero-to-10 scale: 10 = extremely important goal to me/I am extremely successful in accomplishing this
72 | Report on Survey Findings
Ensuring Equity in Adopting the Eight Components and Example Strategies as One Overall Approach to Counseling StudentsAs noted earlier, many counselors feel relatively strong when it comes to implementing the interventions associated with the eight components in a manner that ensures equity to their students. More than half of school counselors say that they prioritize equity, they know how to identify students who need the most help, and they know how to apply these interventions to suit the diverse needs of their students.
School counselors believe that it is important to identify the most at-risk students. Fifty-seven percent of high school counselors and 52% of middle school counselors say they “intentionally prioritize” their most needy students when implementing these interventions, as indicated by a rating of eight or higher on a zero-to-10 scale. This is a fairly consistent priority for counselors across different types of schools (see Table 29), although it is rated higher among counselors at high schools with higher rates of college attendance (64%, compared with 54% of counselors at high schools with lower rates of college attendance) and African American counselors (65%, compared with 54% of white counselors).
Nearly 3 in 5 (59% of high school, 57% of middle school) counselors say that they know how to use data to determine which students need the most help with these interventions. And school administrators expect them to do so: 77% of high school administrators and 72% of middle school administrators say their counselors should do this. Just as we saw with using student FAFSA data to monitor students’
applications, school counselors at disadvantaged schools are more likely to know how to apply data to identify their neediest students. While 57% of counselors at schools with fewer than 25% of students on free or reduced-price lunch rate themselves as an eight or higher, fully 68% of counselors at schools with at least 75% of students on free or reduced-price lunch say the same. This pattern across different questions about data analysis suggests that counselors in the most disadvantaged schools have been uniquely successful in integrating and taking advantage of student data.
Furthermore, many school counselors are aware of how to tailor these interventions to meet their students’ various needs. Three in 5 (59%) high school counselors and 51% of middle school counselors say that they “know how to apply these interventions to the diverse academic and cultural needs” of their students. For the most part, school administrators expect this of their counselors at the same rates: 55% of high school administrators and 45% of middle school administrators say that their counselors should know how to do this. Counselors in more challenged schools, where this skill might be an even greater asset, also feel more knowledgeable. Whereas 53% of school counselors in schools with a minority student population of less than 25% say that they know how to apply these interventions to the diverse academic and cultural needs of their students, 63% (10 points higher) of counselors at schools with a minority population of at least 75% say the same. Likewise, counselors in schools with 75% of students on free or reduced-price lunch (63%) are more likely to know how to apply these interventions to suit their students’ academic and cultural needs than counselors in schools with fewer than 25% of students on free or reduced-price lunch (55%).
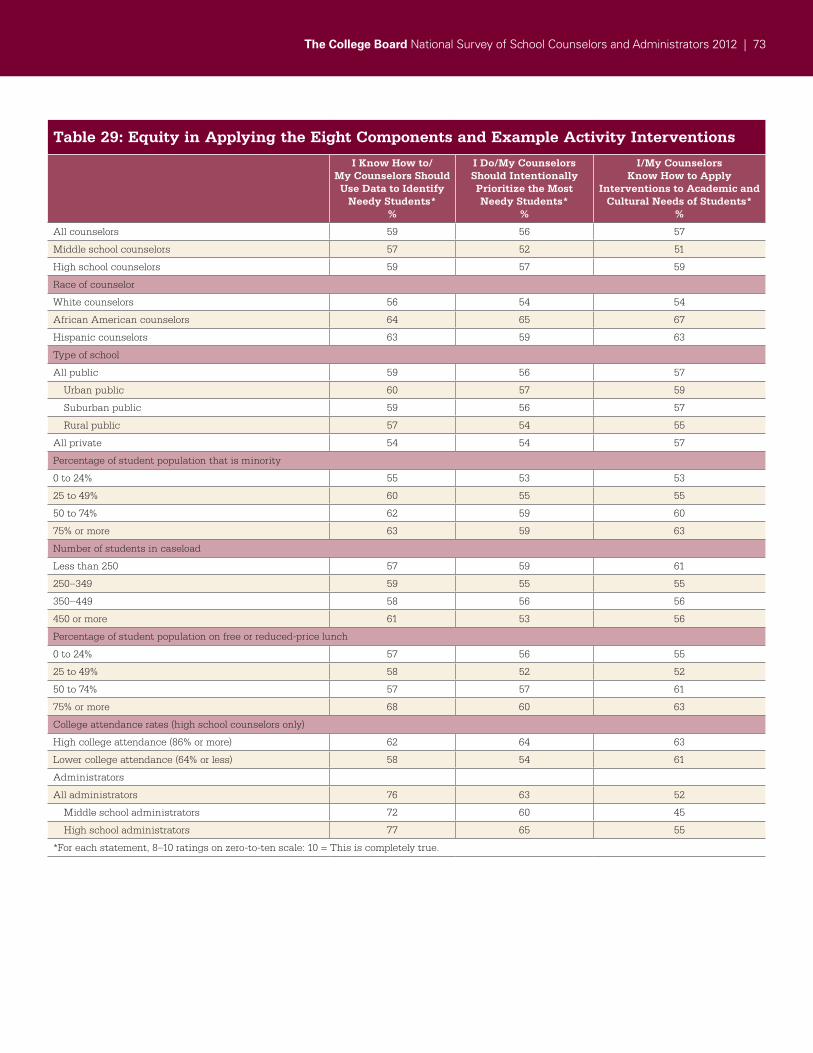
The College Board National Survey of School Counselors and Administrators 2012 | 73
Table 29: Equity in Applying the Eight Components and Example Activity Interventions
I Know How to/My Counselors Should Use Data to Identify
Needy Students*%
I Do/My Counselors Should Intentionally Prioritize the Most Needy Students*
%
I/My Counselors Know How to Apply
Interventions to Academic and Cultural Needs of Students*
%
All counselors 59 56 57
Middle school counselors 57 52 51
High school counselors 59 57 59
Race of counselor
White counselors 56 54 54
African American counselors 64 65 67
Hispanic counselors 63 59 63
Type of school
All public 59 56 57
Urban public 60 57 59
Suburban public 59 56 57
Rural public 57 54 55
All private 54 54 57
Percentage of student population that is minority
0 to 24% 55 53 53
25 to 49% 60 55 55
50 to 74% 62 59 60
75% or more 63 59 63
Number of students in caseload
Less than 250 57 59 61
250–349 59 55 55
350–449 58 56 56
450 or more 61 53 56
Percentage of student population on free or reduced-price lunch
0 to 24% 57 56 55
25 to 49% 58 52 52
50 to 74% 57 57 61
75% or more 68 60 63
College attendance rates (high school counselors only)
High college attendance (86% or more) 62 64 63
Lower college attendance (64% or less) 58 54 61
Administrators
All administrators 76 63 52
Middle school administrators 72 60 45
High school administrators 77 65 55
*For each statement, 8–10 ratings on zero-to-ten scale: 10 = This is completely true.
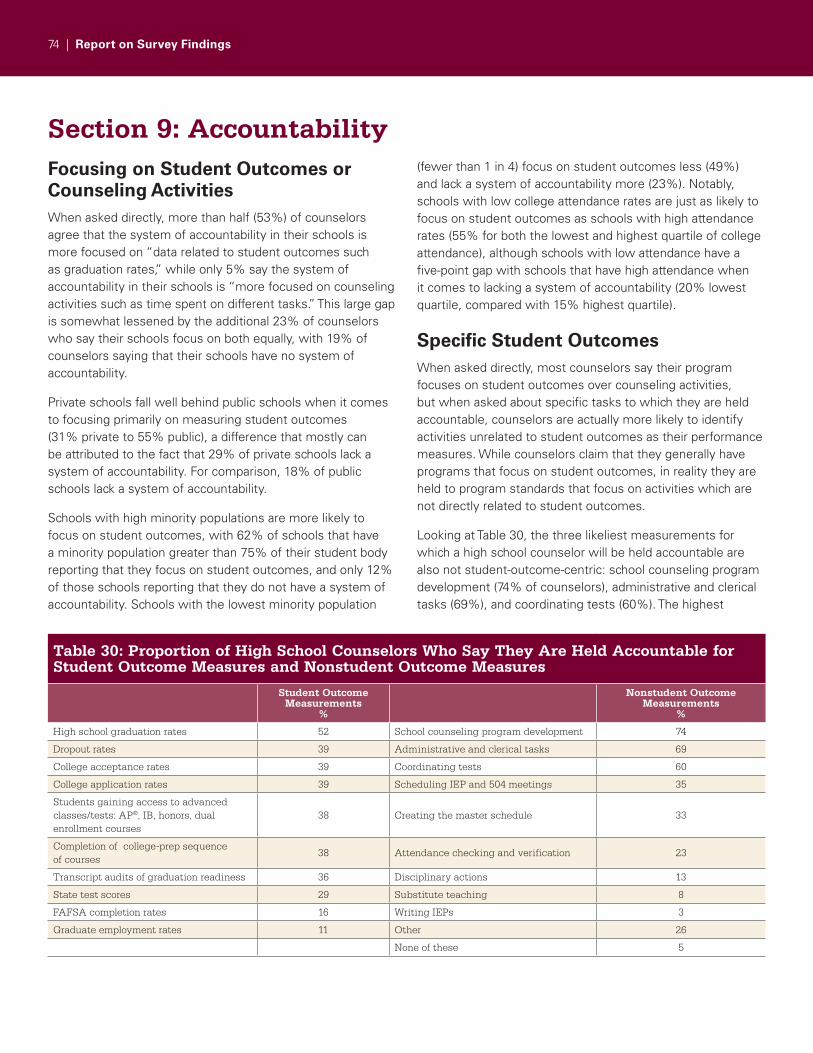
74 | Report on Survey Findings
Section 9: AccountabilityFocusing on Student Outcomes or Counseling ActivitiesWhen asked directly, more than half (53%) of counselors agree that the system of accountability in their schools is more focused on “data related to student outcomes such as graduation rates,” while only 5% say the system of accountability in their schools is “more focused on counseling activities such as time spent on different tasks.” This large gap is somewhat lessened by the additional 23% of counselors who say their schools focus on both equally, with 19% of counselors saying that their schools have no system of accountability.
Private schools fall well behind public schools when it comes to focusing primarily on measuring student outcomes (31% private to 55% public), a difference that mostly can be attributed to the fact that 29% of private schools lack a system of accountability. For comparison, 18% of public schools lack a system of accountability.
Schools with high minority populations are more likely to focus on student outcomes, with 62% of schools that have a minority population greater than 75% of their student body reporting that they focus on student outcomes, and only 12% of those schools reporting that they do not have a system of accountability. Schools with the lowest minority population
(fewer than 1 in 4) focus on student outcomes less (49%) and lack a system of accountability more (23%). Notably, schools with low college attendance rates are just as likely to focus on student outcomes as schools with high attendance rates (55% for both the lowest and highest quartile of college attendance), although schools with low attendance have a five-point gap with schools that have high attendance when it comes to lacking a system of accountability (20% lowest quartile, compared with 15% highest quartile).
Specific Student OutcomesWhen asked directly, most counselors say their program focuses on student outcomes over counseling activities, but when asked about specific tasks to which they are held accountable, counselors are actually more likely to identify activities unrelated to student outcomes as their performance measures. While counselors claim that they generally have programs that focus on student outcomes, in reality they are held to program standards that focus on activities which are not directly related to student outcomes.
Looking at Table 30, the three likeliest measurements for which a high school counselor will be held accountable are also not student-outcome-centric: school counseling program development (74% of counselors), administrative and clerical tasks (69%), and coordinating tests (60%). The highest
Table 30: Proportion of High School Counselors Who Say They Are Held Accountable for Student Outcome Measures and Nonstudent Outcome Measures
Student Outcome Measurements
%
Nonstudent Outcome Measurements
%
High school graduation rates 52 School counseling program development 74
Dropout rates 39 Administrative and clerical tasks 69
College acceptance rates 39 Coordinating tests 60
College application rates 39 Scheduling IEP and 504 meetings 35
Students gaining access to advanced classes/tests: AP®, IB, honors, dual enrollment courses
38 Creating the master schedule 33
Completion of college-prep sequence of courses
38 Attendance checking and verification 23
Transcript audits of graduation readiness 36 Disciplinary actions 13
State test scores 29 Substitute teaching 8
FAFSA completion rates 16 Writing IEPs 3
Graduate employment rates 11 Other 26
None of these 5
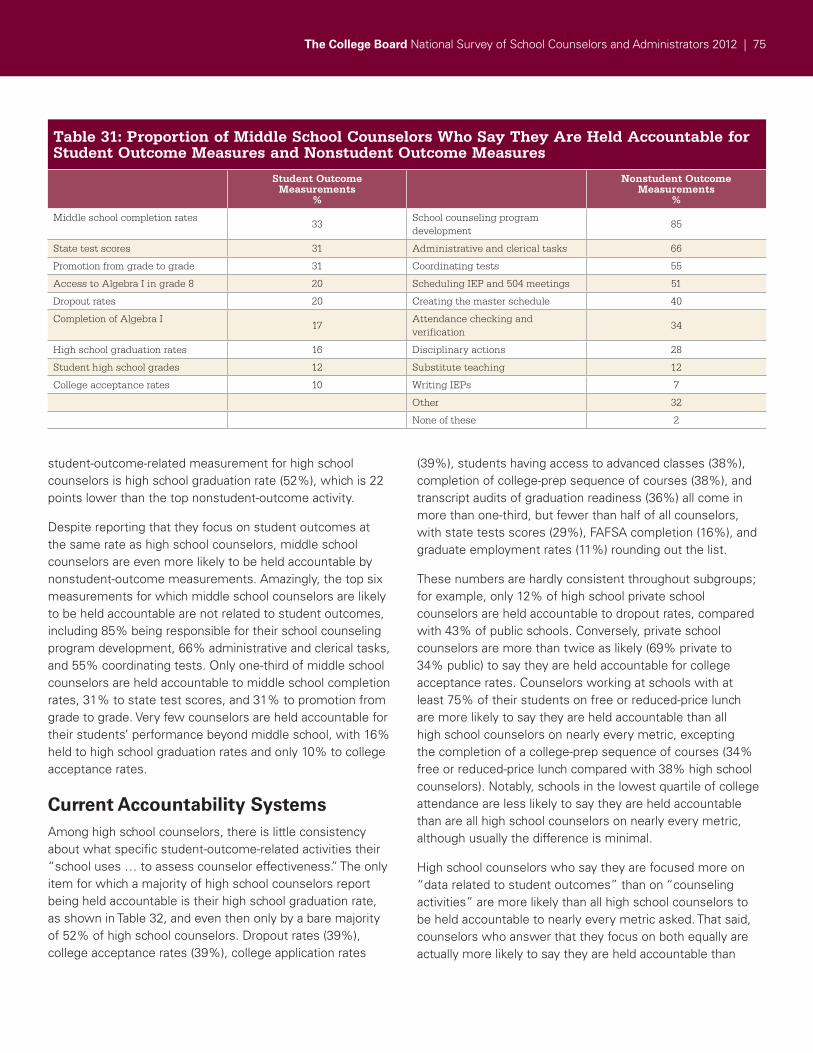
The College Board National Survey of School Counselors and Administrators 2012 | 75
student-outcome-related measurement for high school counselors is high school graduation rate (52%), which is 22 points lower than the top nonstudent-outcome activity.
Despite reporting that they focus on student outcomes at the same rate as high school counselors, middle school counselors are even more likely to be held accountable by nonstudent-outcome measurements. Amazingly, the top six measurements for which middle school counselors are likely to be held accountable are not related to student outcomes, including 85% being responsible for their school counseling program development, 66% administrative and clerical tasks, and 55% coordinating tests. Only one-third of middle school counselors are held accountable to middle school completion rates, 31% to state test scores, and 31% to promotion from grade to grade. Very few counselors are held accountable for their students’ performance beyond middle school, with 16% held to high school graduation rates and only 10% to college acceptance rates.
Current Accountability Systems Among high school counselors, there is little consistency about what specific student-outcome-related activities their “school uses … to assess counselor effectiveness.” The only item for which a majority of high school counselors report being held accountable is their high school graduation rate, as shown in Table 32, and even then only by a bare majority of 52% of high school counselors. Dropout rates (39%), college acceptance rates (39%), college application rates
(39%), students having access to advanced classes (38%), completion of college-prep sequence of courses (38%), and transcript audits of graduation readiness (36%) all come in more than one-third, but fewer than half of all counselors, with state tests scores (29%), FAFSA completion (16%), and graduate employment rates (11%) rounding out the list.
These numbers are hardly consistent throughout subgroups; for example, only 12% of high school private school counselors are held accountable to dropout rates, compared with 43% of public schools. Conversely, private school counselors are more than twice as likely (69% private to 34% public) to say they are held accountable for college acceptance rates. Counselors working at schools with at least 75% of their students on free or reduced-price lunch are more likely to say they are held accountable than all high school counselors on nearly every metric, excepting the completion of a college-prep sequence of courses (34% free or reduced-price lunch compared with 38% high school counselors). Notably, schools in the lowest quartile of college attendance are less likely to say they are held accountable than are all high school counselors on nearly every metric, although usually the difference is minimal.
High school counselors who say they are focused more on “data related to student outcomes” than on “counseling activities” are more likely than all high school counselors to be held accountable to nearly every metric asked. That said, counselors who answer that they focus on both equally are actually more likely to say they are held accountable than
Table 31: Proportion of Middle School Counselors Who Say They Are Held Accountable for Student Outcome Measures and Nonstudent Outcome Measures
Student Outcome Measurements
%
Nonstudent Outcome Measurements
%
Middle school completion rates33
School counseling program development
85
State test scores 31 Administrative and clerical tasks 66
Promotion from grade to grade 31 Coordinating tests 55
Access to Algebra I in grade 8 20 Scheduling IEP and 504 meetings 51
Dropout rates 20 Creating the master schedule 40
Completion of Algebra I17
Attendance checking and verification
34
High school graduation rates 16 Disciplinary actions 28
Student high school grades 12 Substitute teaching 12
College acceptance rates 10 Writing IEPs 7
Other 32
None of these 2
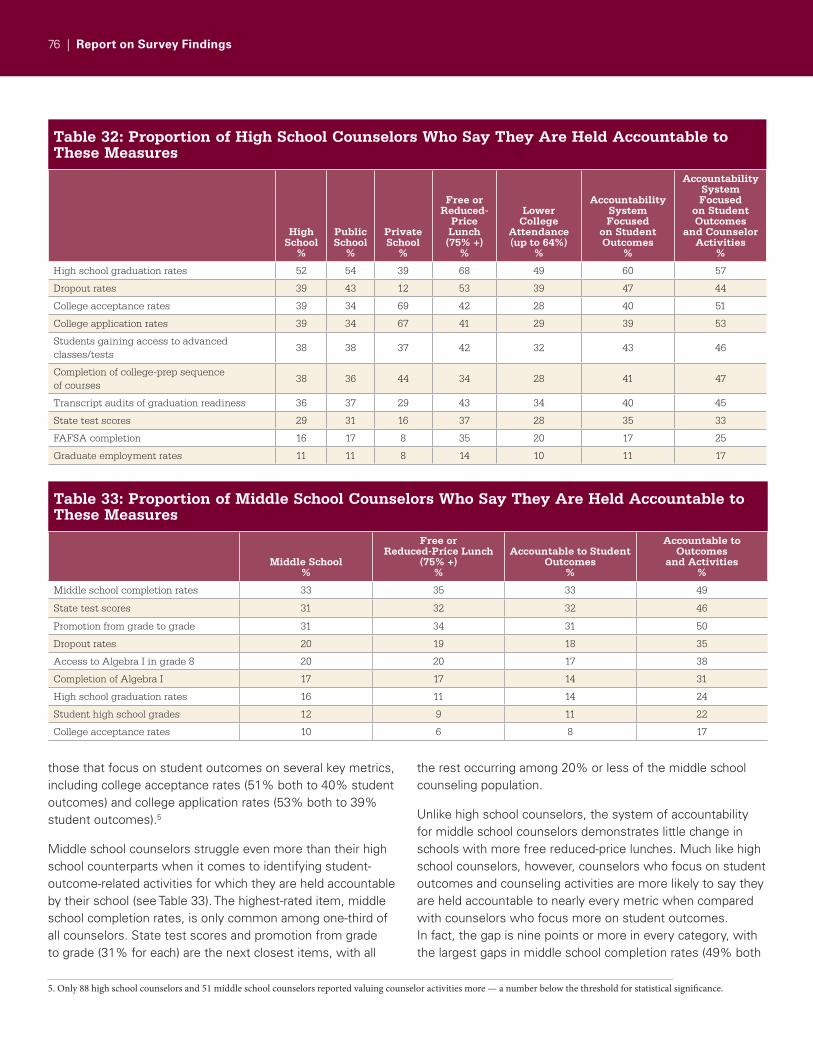
76 | Report on Survey Findings
those that focus on student outcomes on several key metrics, including college acceptance rates (51% both to 40% student outcomes) and college application rates (53% both to 39% student outcomes).5
Middle school counselors struggle even more than their high school counterparts when it comes to identifying student-outcome-related activities for which they are held accountable by their school (see Table 33). The highest-rated item, middle school completion rates, is only common among one-third of all counselors. State test scores and promotion from grade to grade (31% for each) are the next closest items, with all
the rest occurring among 20% or less of the middle school counseling population.
Unlike high school counselors, the system of accountability for middle school counselors demonstrates little change in schools with more free reduced-price lunches. Much like high school counselors, however, counselors who focus on student outcomes and counseling activities are more likely to say they are held accountable to nearly every metric when compared with counselors who focus more on student outcomes. In fact, the gap is nine points or more in every category, with the largest gaps in middle school completion rates (49% both
Table 32: Proportion of High School Counselors Who Say They Are Held Accountable to These Measures
HighSchool
%
Public School
%
Private School
%
Free or Reduced-
Price Lunch (75% +)
%
Lower College
Attendance(up to 64%)
%
Accountability System Focused
on Student Outcomes
%
Accountability System Focused
on Student Outcomes
and Counselor Activities
%
High school graduation rates 52 54 39 68 49 60 57
Dropout rates 39 43 12 53 39 47 44
College acceptance rates 39 34 69 42 28 40 51
College application rates 39 34 67 41 29 39 53
Students gaining access to advancedclasses/tests
38 38 37 42 32 43 46
Completion of college-prep sequence of courses
38 36 44 34 28 41 47
Transcript audits of graduation readiness 36 37 29 43 34 40 45
State test scores 29 31 16 37 28 35 33
FAFSA completion 16 17 8 35 20 17 25
Graduate employment rates 11 11 8 14 10 11 17
Table 33: Proportion of Middle School Counselors Who Say They Are Held Accountable to These Measures
Middle School%
Free or Reduced-Price Lunch
(75% +)%
Accountable to Student Outcomes
%
Accountable to Outcomes
and Activities%
Middle school completion rates 33 35 33 49
State test scores 31 32 32 46
Promotion from grade to grade 31 34 31 50
Dropout rates 20 19 18 35
Access to Algebra I in grade 8 20 20 17 38
Completion of Algebra I 17 17 14 31
High school graduation rates 16 11 14 24
Student high school grades 12 9 11 22
College acceptance rates 10 6 8 17
5. Only 88 high school counselors and 51 middle school counselors reported valuing counselor activities more — a number below the threshold for statistical significance.
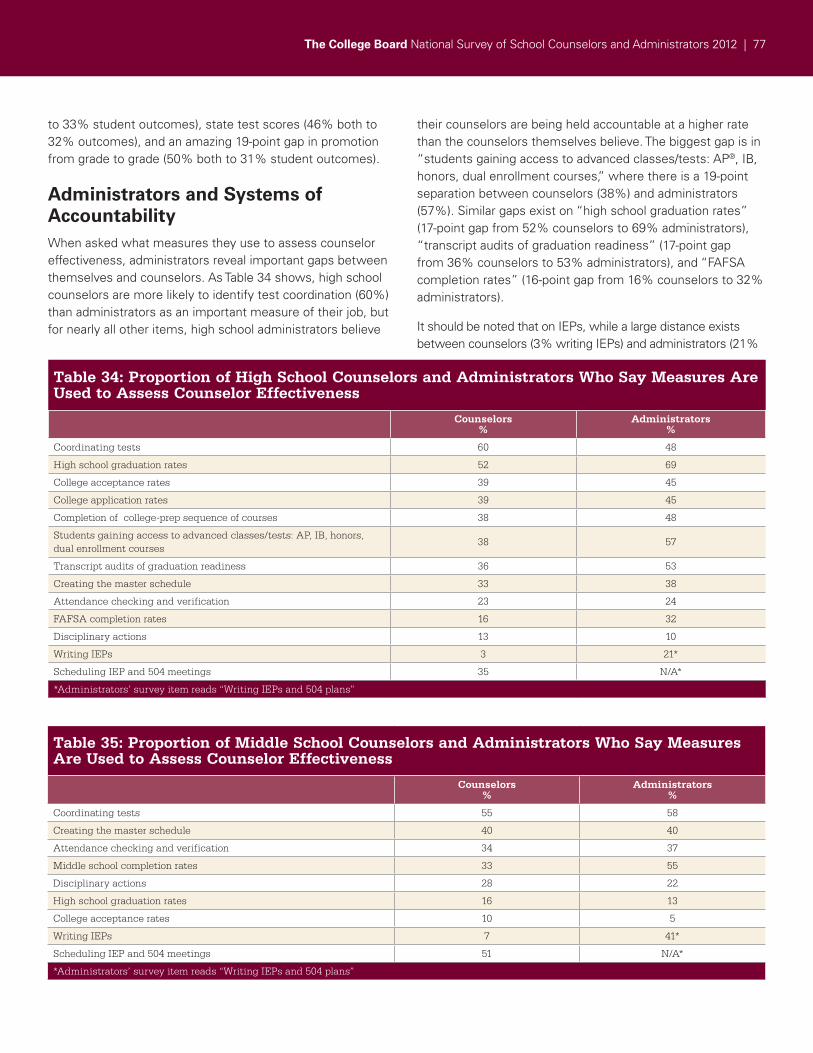
The College Board National Survey of School Counselors and Administrators 2012 | 77
to 33% student outcomes), state test scores (46% both to 32% outcomes), and an amazing 19-point gap in promotion from grade to grade (50% both to 31% student outcomes).
Administrators and Systems of AccountabilityWhen asked what measures they use to assess counselor effectiveness, administrators reveal important gaps between themselves and counselors. As Table 34 shows, high school counselors are more likely to identify test coordination (60%) than administrators as an important measure of their job, but for nearly all other items, high school administrators believe
their counselors are being held accountable at a higher rate than the counselors themselves believe. The biggest gap is in “students gaining access to advanced classes/tests: AP®, IB, honors, dual enrollment courses,” where there is a 19-point separation between counselors (38%) and administrators (57%). Similar gaps exist on “high school graduation rates” (17-point gap from 52% counselors to 69% administrators), “transcript audits of graduation readiness” (17-point gap from 36% counselors to 53% administrators), and “FAFSA completion rates” (16-point gap from 16% counselors to 32% administrators).
It should be noted that on IEPs, while a large distance exists between counselors (3% writing IEPs) and administrators (21%
Table 34: Proportion of High School Counselors and Administrators Who Say Measures Are Used to Assess Counselor Effectiveness
Counselors%
Administrators%
Coordinating tests 60 48
High school graduation rates 52 69
College acceptance rates 39 45
College application rates 39 45
Completion of college-prep sequence of courses 38 48
Students gaining access to advanced classes/tests: AP, IB, honors, dual enrollment courses
38 57
Transcript audits of graduation readiness 36 53
Creating the master schedule 33 38
Attendance checking and verification 23 24
FAFSA completion rates 16 32
Disciplinary actions 13 10
Writing IEPs 3 21*
Scheduling IEP and 504 meetings 35 N/A*
*Administrators’ survey item reads “Writing IEPs and 504 plans”
Table 35: Proportion of Middle School Counselors and Administrators Who Say Measures Are Used to Assess Counselor Effectiveness
Counselors%
Administrators%
Coordinating tests 55 58
Creating the master schedule 40 40
Attendance checking and verification 34 37
Middle school completion rates 33 55
Disciplinary actions 28 22
High school graduation rates 16 13
College acceptance rates 10 5
Writing IEPs 7 41*
Scheduling IEP and 504 meetings 51 N/A*
*Administrators’ survey item reads “Writing IEPs and 504 plans”
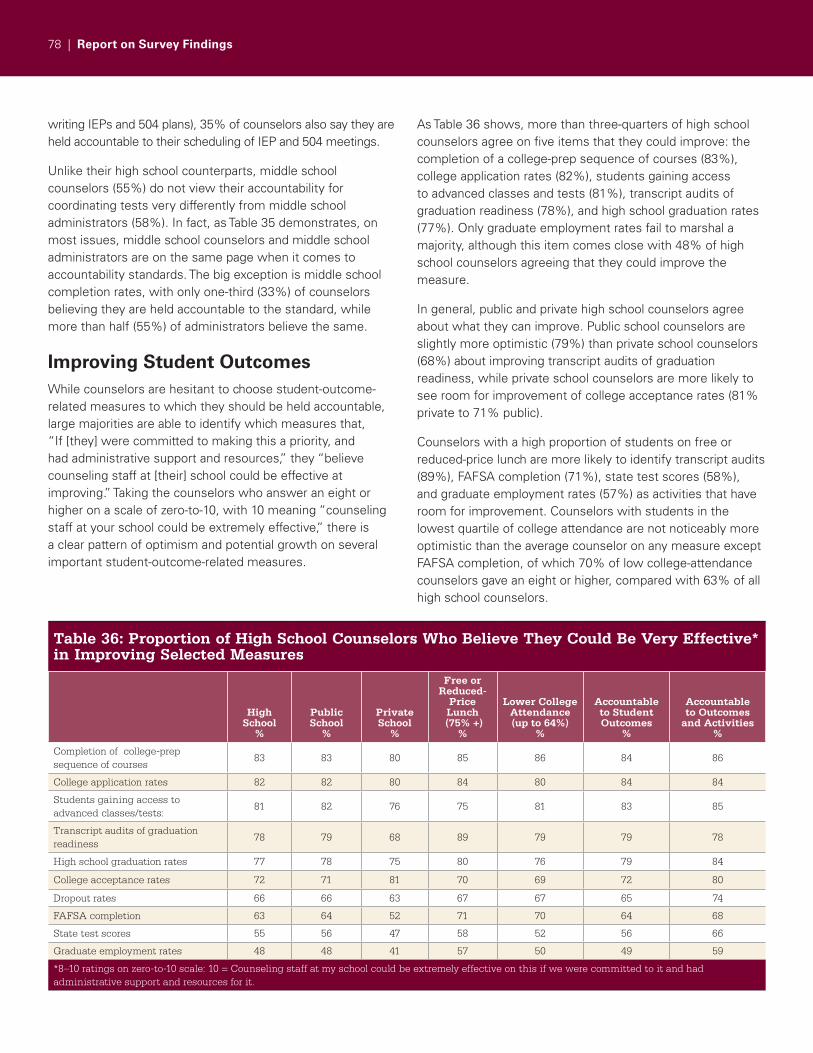
78 | Report on Survey Findings
writing IEPs and 504 plans), 35% of counselors also say they are held accountable to their scheduling of IEP and 504 meetings.
Unlike their high school counterparts, middle school counselors (55%) do not view their accountability for coordinating tests very differently from middle school administrators (58%). In fact, as Table 35 demonstrates, on most issues, middle school counselors and middle school administrators are on the same page when it comes to accountability standards. The big exception is middle school completion rates, with only one-third (33%) of counselors believing they are held accountable to the standard, while more than half (55%) of administrators believe the same.
Improving Student OutcomesWhile counselors are hesitant to choose student-outcome-related measures to which they should be held accountable, large majorities are able to identify which measures that, “If [they] were committed to making this a priority, and had administrative support and resources,” they “believe counseling staff at [their] school could be effective at improving.” Taking the counselors who answer an eight or higher on a scale of zero-to-10, with 10 meaning “counseling staff at your school could be extremely effective,” there is a clear pattern of optimism and potential growth on several important student-outcome-related measures.
As Table 36 shows, more than three-quarters of high school counselors agree on five items that they could improve: the completion of a college-prep sequence of courses (83%), college application rates (82%), students gaining access to advanced classes and tests (81%), transcript audits of graduation readiness (78%), and high school graduation rates (77%). Only graduate employment rates fail to marshal a majority, although this item comes close with 48% of high school counselors agreeing that they could improve the measure.
In general, public and private high school counselors agree about what they can improve. Public school counselors are slightly more optimistic (79%) than private school counselors (68%) about improving transcript audits of graduation readiness, while private school counselors are more likely to see room for improvement of college acceptance rates (81% private to 71% public).
Counselors with a high proportion of students on free or reduced-price lunch are more likely to identify transcript audits (89%), FAFSA completion (71%), state test scores (58%), and graduate employment rates (57%) as activities that have room for improvement. Counselors with students in the lowest quartile of college attendance are not noticeably more optimistic than the average counselor on any measure except FAFSA completion, of which 70% of low college-attendance counselors gave an eight or higher, compared with 63% of all high school counselors.
Table 36: Proportion of High School Counselors Who Believe They Could Be Very Effective* in Improving Selected Measures
HighSchool
%
Public School
%
Private School
%
Free or Reduced-
Price Lunch
(75% +)%
Lower College Attendance(up to 64%)
%
Accountable to Student Outcomes
%
Accountableto Outcomes
and Activities%
Completion of college-prep sequence of courses
83 83 80 85 86 84 86
College application rates 82 82 80 84 80 84 84
Students gaining access to advanced classes/tests:
81 82 76 75 81 83 85
Transcript audits of graduation readiness
78 79 68 89 79 79 78
High school graduation rates 77 78 75 80 76 79 84
College acceptance rates 72 71 81 70 69 72 80
Dropout rates 66 66 63 67 67 65 74
FAFSA completion 63 64 52 71 70 64 68
State test scores 55 56 47 58 52 56 66
Graduate employment rates 48 48 41 57 50 49 59
*8–10 ratings on zero-to-10 scale: 10 = Counseling staff at my school could be extremely effective on this if we were committed to it and had administrative support and resources for it.
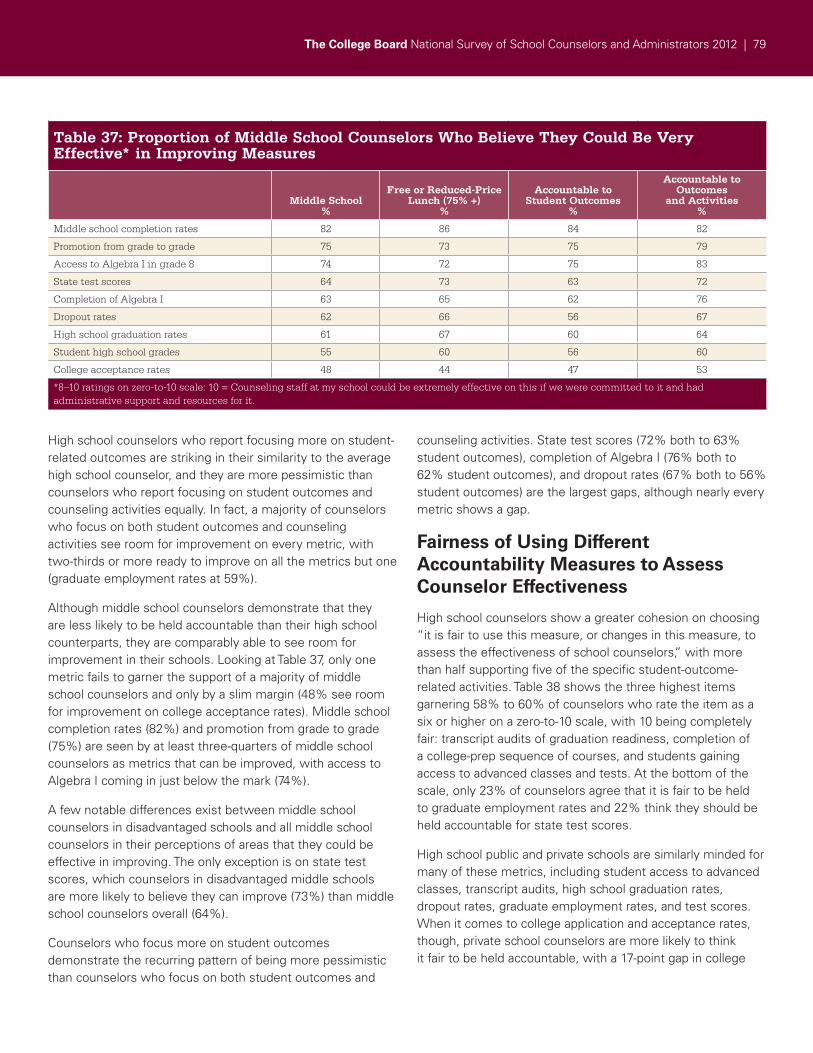
The College Board National Survey of School Counselors and Administrators 2012 | 79
High school counselors who report focusing more on student-related outcomes are striking in their similarity to the average high school counselor, and they are more pessimistic than counselors who report focusing on student outcomes and counseling activities equally. In fact, a majority of counselors who focus on both student outcomes and counseling activities see room for improvement on every metric, with two-thirds or more ready to improve on all the metrics but one (graduate employment rates at 59%).
Although middle school counselors demonstrate that they are less likely to be held accountable than their high school counterparts, they are comparably able to see room for improvement in their schools. Looking at Table 37, only one metric fails to garner the support of a majority of middle school counselors and only by a slim margin (48% see room for improvement on college acceptance rates). Middle school completion rates (82%) and promotion from grade to grade (75%) are seen by at least three-quarters of middle school counselors as metrics that can be improved, with access to Algebra I coming in just below the mark (74%).
A few notable differences exist between middle school counselors in disadvantaged schools and all middle school counselors in their perceptions of areas that they could be effective in improving. The only exception is on state test scores, which counselors in disadvantaged middle schools are more likely to believe they can improve (73%) than middle school counselors overall (64%).
Counselors who focus more on student outcomes demonstrate the recurring pattern of being more pessimistic than counselors who focus on both student outcomes and
counseling activities. State test scores (72% both to 63% student outcomes), completion of Algebra I (76% both to 62% student outcomes), and dropout rates (67% both to 56% student outcomes) are the largest gaps, although nearly every metric shows a gap.
Fairness of Using Different Accountability Measures to Assess Counselor Effectiveness
High school counselors show a greater cohesion on choosing “it is fair to use this measure, or changes in this measure, to assess the effectiveness of school counselors,” with more than half supporting five of the specific student-outcome-related activities. Table 38 shows the three highest items garnering 58% to 60% of counselors who rate the item as a six or higher on a zero-to-10 scale, with 10 being completely fair: transcript audits of graduation readiness, completion of a college-prep sequence of courses, and students gaining access to advanced classes and tests. At the bottom of the scale, only 23% of counselors agree that it is fair to be held to graduate employment rates and 22% think they should be held accountable for state test scores.
High school public and private schools are similarly minded for many of these metrics, including student access to advanced classes, transcript audits, high school graduation rates, dropout rates, graduate employment rates, and test scores. When it comes to college application and acceptance rates, though, private school counselors are more likely to think it fair to be held accountable, with a 17-point gap in college
Table 37: Proportion of Middle School Counselors Who Believe They Could Be Very Effective* in Improving Measures
Middle School%
Free or Reduced-Price Lunch (75% +)
%
Accountable to Student Outcomes
%
Accountable to Outcomes
and Activities%
Middle school completion rates 82 86 84 82
Promotion from grade to grade 75 73 75 79
Access to Algebra I in grade 8 74 72 75 83
State test scores 64 73 63 72
Completion of Algebra I 63 65 62 76
Dropout rates 62 66 56 67
High school graduation rates 61 67 60 64
Student high school grades 55 60 56 60
College acceptance rates 48 44 47 53
*8–10 ratings on zero-to-10 scale: 10 = Counseling staff at my school could be extremely effective on this if we were committed to it and had administrative support and resources for it.
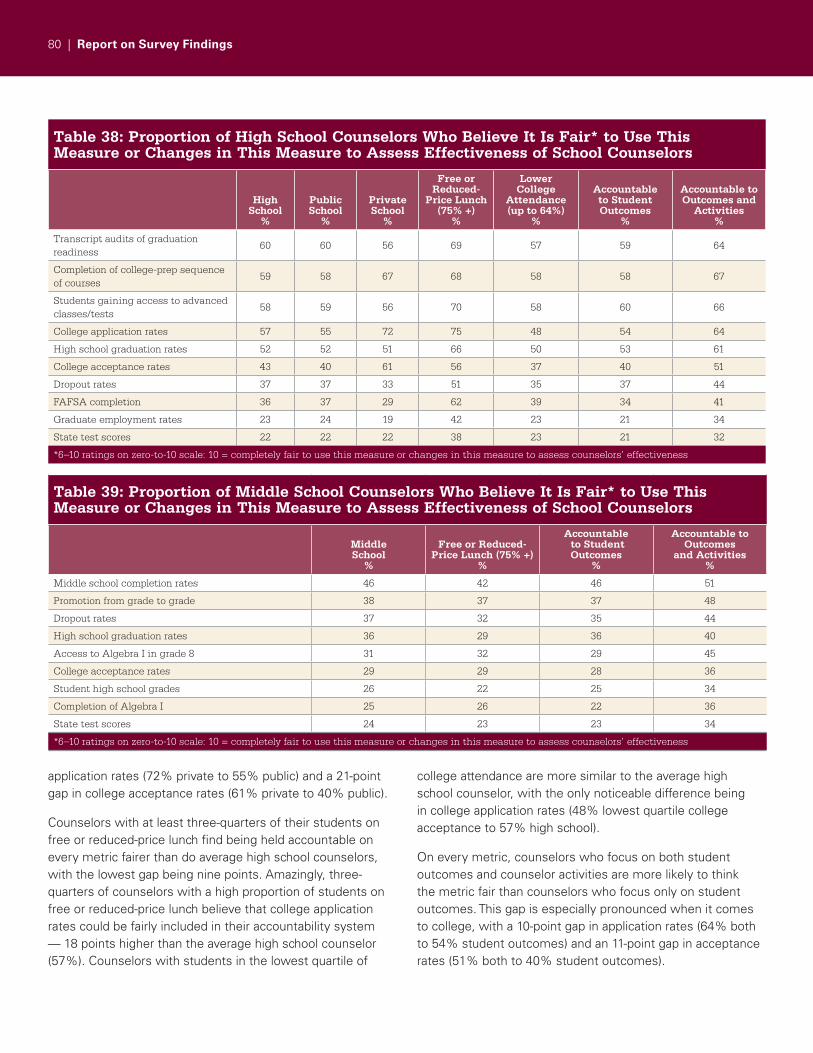
80 | Report on Survey Findings
application rates (72% private to 55% public) and a 21-point gap in college acceptance rates (61% private to 40% public).
Counselors with at least three-quarters of their students on free or reduced-price lunch find being held accountable on every metric fairer than do average high school counselors, with the lowest gap being nine points. Amazingly, three-quarters of counselors with a high proportion of students on free or reduced-price lunch believe that college application rates could be fairly included in their accountability system — 18 points higher than the average high school counselor (57%). Counselors with students in the lowest quartile of
college attendance are more similar to the average high school counselor, with the only noticeable difference being in college application rates (48% lowest quartile college acceptance to 57% high school).
On every metric, counselors who focus on both student outcomes and counselor activities are more likely to think the metric fair than counselors who focus only on student outcomes. This gap is especially pronounced when it comes to college, with a 10-point gap in application rates (64% both to 54% student outcomes) and an 11-point gap in acceptance rates (51% both to 40% student outcomes).
Table 38: Proportion of High School Counselors Who Believe It Is Fair* to Use This Measure or Changes in This Measure to Assess Effectiveness of School Counselors
HighSchool
%
Public School
%
Private School
%
Free or Reduced-
Price Lunch (75% +)
%
Lower College
Attendance(up to 64%)
%
Accountable to Student Outcomes
%
Accountable to Outcomes and
Activities%
Transcript audits of graduation readiness
60 60 56 69 57 59 64
Completion of college-prep sequence of courses
59 58 67 68 58 58 67
Students gaining access to advanced classes/tests
58 59 56 70 58 60 66
College application rates 57 55 72 75 48 54 64
High school graduation rates 52 52 51 66 50 53 61
College acceptance rates 43 40 61 56 37 40 51
Dropout rates 37 37 33 51 35 37 44
FAFSA completion 36 37 29 62 39 34 41
Graduate employment rates 23 24 19 42 23 21 34
State test scores 22 22 22 38 23 21 32
*6–10 ratings on zero-to-10 scale: 10 = completely fair to use this measure or changes in this measure to assess counselors’ effectiveness
Table 39: Proportion of Middle School Counselors Who Believe It Is Fair* to Use This Measure or Changes in This Measure to Assess Effectiveness of School Counselors
Middle School
%
Free or Reduced-Price Lunch (75% +)
%
Accountable to Student Outcomes
%
Accountable to Outcomes
and Activities%
Middle school completion rates 46 42 46 51
Promotion from grade to grade 38 37 37 48
Dropout rates 37 32 35 44
High school graduation rates 36 29 36 40
Access to Algebra I in grade 8 31 32 29 45
College acceptance rates 29 29 28 36
Student high school grades 26 22 25 34
Completion of Algebra I 25 26 22 36
State test scores 24 23 23 34
*6–10 ratings on zero-to-10 scale: 10 = completely fair to use this measure or changes in this measure to assess counselors’ effectiveness
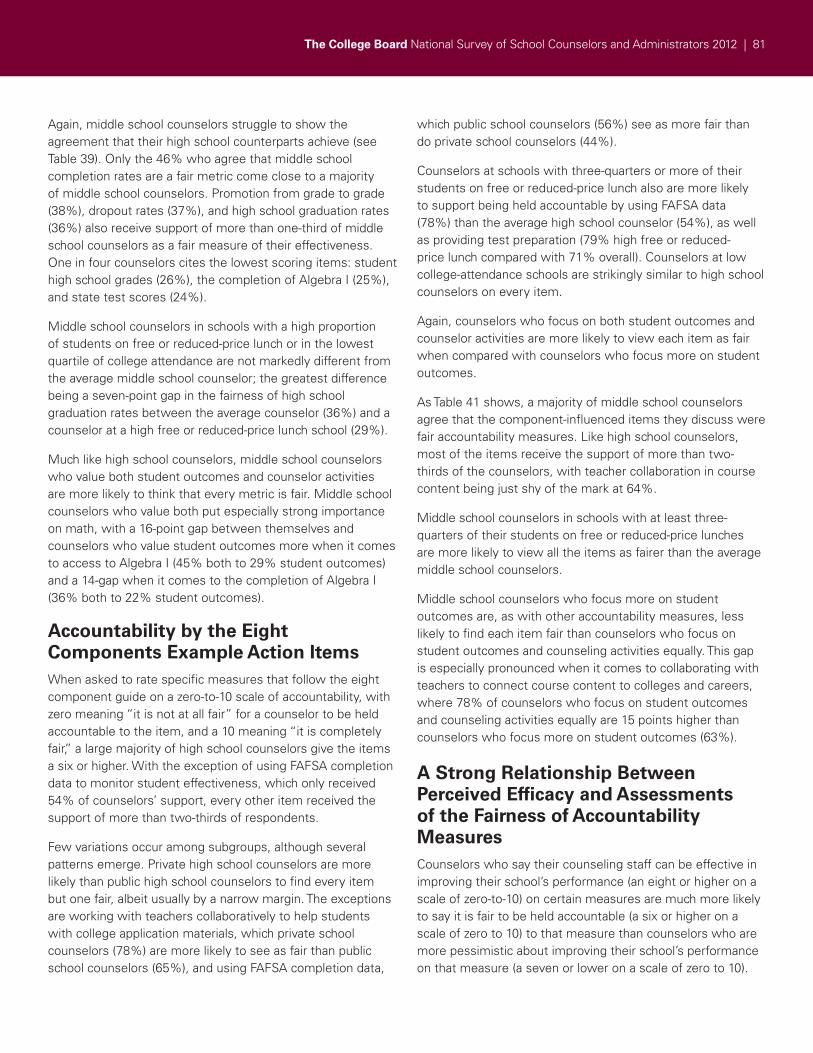
The College Board National Survey of School Counselors and Administrators 2012 | 81
Again, middle school counselors struggle to show the agreement that their high school counterparts achieve (see Table 39). Only the 46% who agree that middle school completion rates are a fair metric come close to a majority of middle school counselors. Promotion from grade to grade (38%), dropout rates (37%), and high school graduation rates (36%) also receive support of more than one-third of middle school counselors as a fair measure of their effectiveness. One in four counselors cites the lowest scoring items: student high school grades (26%), the completion of Algebra I (25%), and state test scores (24%).
Middle school counselors in schools with a high proportion of students on free or reduced-price lunch or in the lowest quartile of college attendance are not markedly different from the average middle school counselor; the greatest difference being a seven-point gap in the fairness of high school graduation rates between the average counselor (36%) and a counselor at a high free or reduced-price lunch school (29%).
Much like high school counselors, middle school counselors who value both student outcomes and counselor activities are more likely to think that every metric is fair. Middle school counselors who value both put especially strong importance on math, with a 16-point gap between themselves and counselors who value student outcomes more when it comes to access to Algebra I (45% both to 29% student outcomes) and a 14-gap when it comes to the completion of Algebra I (36% both to 22% student outcomes).
Accountability by the Eight Components Example Action ItemsWhen asked to rate specific measures that follow the eight component guide on a zero-to-10 scale of accountability, with zero meaning “it is not at all fair” for a counselor to be held accountable to the item, and a 10 meaning “it is completely fair,” a large majority of high school counselors give the items a six or higher. With the exception of using FAFSA completion data to monitor student effectiveness, which only received 54% of counselors’ support, every other item received the support of more than two-thirds of respondents.
Few variations occur among subgroups, although several patterns emerge. Private high school counselors are more likely than public high school counselors to find every item but one fair, albeit usually by a narrow margin. The exceptions are working with teachers collaboratively to help students with college application materials, which private school counselors (78%) are more likely to see as fair than public school counselors (65%), and using FAFSA completion data,
which public school counselors (56%) see as more fair than do private school counselors (44%).
Counselors at schools with three-quarters or more of their students on free or reduced-price lunch also are more likely to support being held accountable by using FAFSA data (78%) than the average high school counselor (54%), as well as providing test preparation (79% high free or reduced-price lunch compared with 71% overall). Counselors at low college-attendance schools are strikingly similar to high school counselors on every item.
Again, counselors who focus on both student outcomes and counselor activities are more likely to view each item as fair when compared with counselors who focus more on student outcomes.
As Table 41 shows, a majority of middle school counselors agree that the component-influenced items they discuss were fair accountability measures. Like high school counselors, most of the items receive the support of more than two-thirds of the counselors, with teacher collaboration in course content being just shy of the mark at 64%.
Middle school counselors in schools with at least three-quarters of their students on free or reduced-price lunches are more likely to view all the items as fairer than the average middle school counselors.
Middle school counselors who focus more on student outcomes are, as with other accountability measures, less likely to find each item fair than counselors who focus on student outcomes and counseling activities equally. This gap is especially pronounced when it comes to collaborating with teachers to connect course content to colleges and careers, where 78% of counselors who focus on student outcomes and counseling activities equally are 15 points higher than counselors who focus more on student outcomes (63%).
A Strong Relationship Between Perceived Efficacy and Assessments of the Fairness of Accountability MeasuresCounselors who say their counseling staff can be effective in improving their school’s performance (an eight or higher on a scale of zero-to-10) on certain measures are much more likely to say it is fair to be held accountable (a six or higher on a scale of zero to 10) to that measure than counselors who are more pessimistic about improving their school’s performance on that measure (a seven or lower on a scale of zero to 10).
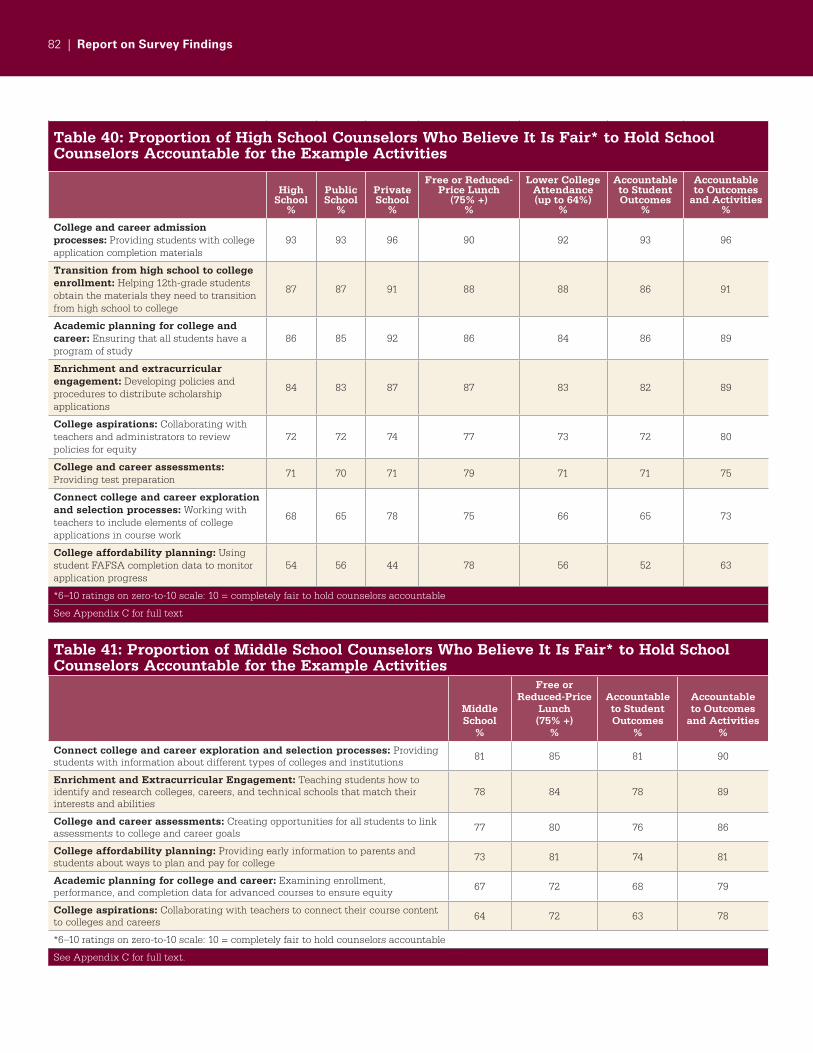
82 | Report on Survey Findings
Table 41: Proportion of Middle School Counselors Who Believe It Is Fair* to Hold School Counselors Accountable for the Example Activities
Middle School
%
Free or Reduced-Price
Lunch (75% +)
%
Accountable to Student Outcomes
%
Accountable to Outcomes
and Activities%
Connect college and career exploration and selection processes: Providing students with information about different types of colleges and institutions 81 85 81 90
Enrichment and Extracurricular Engagement: Teaching students how to identify and research colleges, careers, and technical schools that match their interests and abilities
78 84 78 89
College and career assessments: Creating opportunities for all students to link assessments to college and career goals 77 80 76 86
College affordability planning: Providing early information to parents and students about ways to plan and pay for college 73 81 74 81
Academic planning for college and career: Examining enrollment, performance, and completion data for advanced courses to ensure equity 67 72 68 79
College aspirations: Collaborating with teachers to connect their course content to colleges and careers 64 72 63 78
*6–10 ratings on zero-to-10 scale: 10 = completely fair to hold counselors accountable
See Appendix C for full text.
Table 40: Proportion of High School Counselors Who Believe It Is Fair* to Hold School Counselors Accountable for the Example Activities
HighSchool
%
Public School
%
Private School
%
Free or Reduced- Price Lunch
(75% +)%
Lower College Attendance(up to 64%)
%
Accountable to Student Outcomes
%
Accountable to Outcomes
and Activities%
College and career admission processes: Providing students with college application completion materials
93 93 96 90 92 93 96
Transition from high school to college enrollment: Helping 12th-grade students obtain the materials they need to transition from high school to college
87 87 91 88 88 86 91
Academic planning for college and career: Ensuring that all students have a program of study
86 85 92 86 84 86 89
Enrichment and extracurricular engagement: Developing policies and procedures to distribute scholarship applications
84 83 87 87 83 82 89
College aspirations: Collaborating with teachers and administrators to review policies for equity
72 72 74 77 73 72 80
College and career assessments: Providing test preparation
71 70 71 79 71 71 75
Connect college and career exploration and selection processes: Working with teachers to include elements of college applications in course work
68 65 78 75 66 65 73
College affordability planning: Using student FAFSA completion data to monitor application progress
54 56 44 78 56 52 63
*6–10 ratings on zero-to-10 scale: 10 = completely fair to hold counselors accountable
See Appendix C for full text.
The College Board National Survey of School Counselors and Administrators 2012 | 83
These results are shown in the figure below, where the gap between those who see little room for improvement and those who see a great amount of space for improvement is, at its lowest, 24 points (dropout rates and state test scores).
Among counselors who see little or a moderate amount of room for improvement, there is a striking lack of agreement about which measures fairly could be included as a measurement of their effectiveness. The most popular item, transcript audits of graduation readiness, only gains the support of 38% of low- to moderate-improvement counselors. In comparison, only the item, state tests scores, is rated lower by counselors (35%) at schools where there is a lot of room for improvement. Clearly, counselors who see room for improvement are more prepared to be held accountable than
are those who hesitate to identify measures on which they could be more effective.
Administrators’ Views of the Fairness of Different Accountability MeasuresAlthough middle school and high school administrators have a noticeably different opinion from counselors about what is a fair measure of counselor effectiveness, the differences are not pronounced or dramatic. Among those who rate a measure a six or higher on a scale of zero-to-10, with 10 meaning it is completely fair to use the measure to assess counselor effectiveness, the most surprising difference may be between high school and middle school administrators.
High school counselors who say it is fair to be held accountable (6–10*) by whether they think they can be effective on each measure
*Ratings on zero–to–10 scales: 10 = I can be extremely effective/it is completely fair.
Counselors who think they can be very effective on this measure (8–10*)Counselors who do not think they can be effective on this measure (0–7*)
Transcript audits of graduation readiness
Students gaining access to advanced classes/tests
Completion of college-prep sequence of courses
College application rates
High school graduation rates
College acceptance rates
FAFSA completion
Dropout rates
Graduate employment rates
State test scores
Gap±
36
34
31
28
30
27
32
24
28
24
0% 10% 20% 30% 40% 50% 60% 70% 80% 90% 100%
74% 38%
69% 35%
68%
30%60%
37%65%
37%
53% 26%
51% 19%
48% 24%
40% 12%
35% 11%
Middle school administrators are less willing than high school administrators to describe most of the measures as fair. The only measures that a majority of administrators rate as a six or higher are middle school completion rates (62%) and promotion from grade to grade (59%). Middle school completion rates (46%) and promotion from grade to grade (38%) also are the same measures that middle school counselors rate the highest, although neither measure receives a rating of six or higher from a majority. Middle
school counselors and administrators are less likely to say that counselors should be held accountable for students’ progress after they leave middle school. For example, only 29% of middle school counselors and 42% of middle school administrators say it is fair to hold middle school counselors accountable for college acceptance rates or high school grades (26% counselors, 35% administrators).
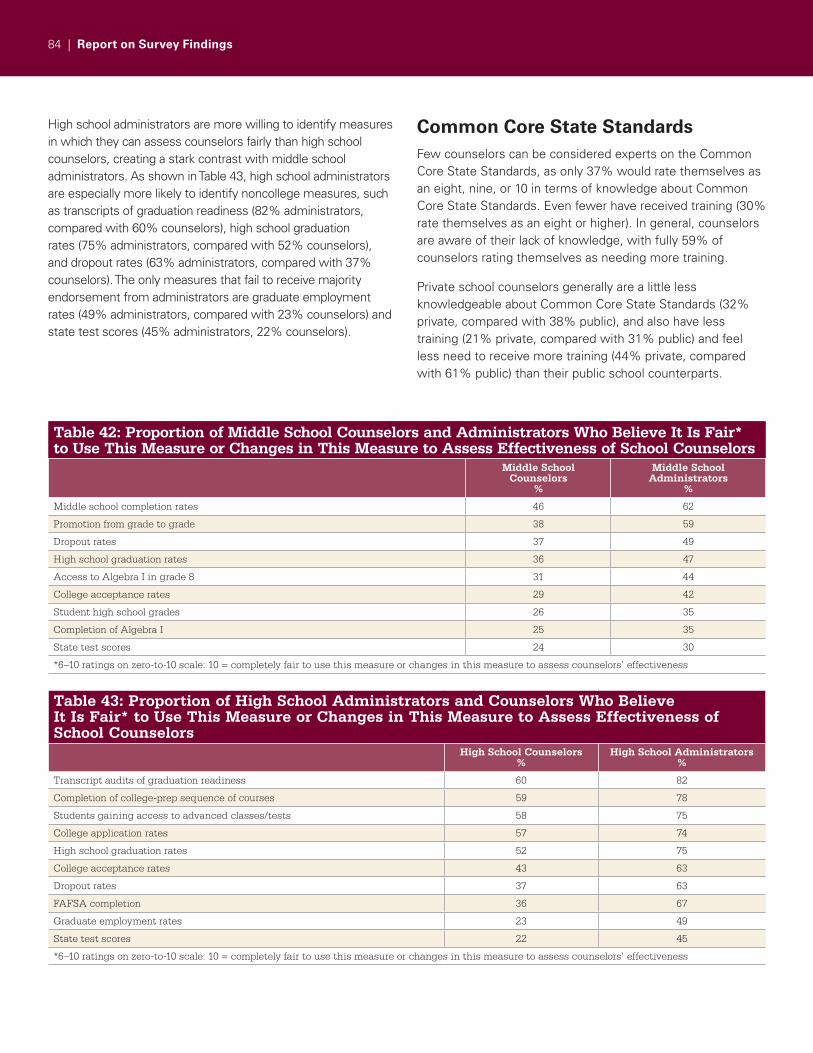
84 | Report on Survey Findings
High school administrators are more willing to identify measures in which they can assess counselors fairly than high school counselors, creating a stark contrast with middle school administrators. As shown in Table 43, high school administrators are especially more likely to identify noncollege measures, such as transcripts of graduation readiness (82% administrators, compared with 60% counselors), high school graduation rates (75% administrators, compared with 52% counselors), and dropout rates (63% administrators, compared with 37% counselors). The only measures that fail to receive majority endorsement from administrators are graduate employment rates (49% administrators, compared with 23% counselors) and state test scores (45% administrators, 22% counselors).
Common Core State StandardsFew counselors can be considered experts on the Common Core State Standards, as only 37% would rate themselves as an eight, nine, or 10 in terms of knowledge about Common Core State Standards. Even fewer have received training (30% rate themselves as an eight or higher). In general, counselors are aware of their lack of knowledge, with fully 59% of counselors rating themselves as needing more training.
Private school counselors generally are a little less knowledgeable about Common Core State Standards (32% private, compared with 38% public), and also have less training (21% private, compared with 31% public) and feel less need to receive more training (44% private, compared with 61% public) than their public school counterparts.
Table 42: Proportion of Middle School Counselors and Administrators Who Believe It Is Fair* to Use This Measure or Changes in This Measure to Assess Effectiveness of School Counselors
Middle School Counselors
%
Middle School Administrators
%
Middle school completion rates 46 62
Promotion from grade to grade 38 59
Dropout rates 37 49
High school graduation rates 36 47
Access to Algebra I in grade 8 31 44
College acceptance rates 29 42
Student high school grades 26 35
Completion of Algebra I 25 35
State test scores 24 30
*6–10 ratings on zero-to-10 scale: 10 = completely fair to use this measure or changes in this measure to assess counselors’ effectiveness
Table 43: Proportion of High School Administrators and Counselors Who Believe It Is Fair* to Use This Measure or Changes in This Measure to Assess Effectiveness of School Counselors
High School Counselors%
High School Administrators%
Transcript audits of graduation readiness 60 82
Completion of college-prep sequence of courses 59 78
Students gaining access to advanced classes/tests 58 75
College application rates 57 74
High school graduation rates 52 75
College acceptance rates 43 63
Dropout rates 37 63
FAFSA completion 36 67
Graduate employment rates 23 49
State test scores 22 45
*6–10 ratings on zero-to-10 scale: 10 = completely fair to use this measure or changes in this measure to assess counselors’ effectiveness
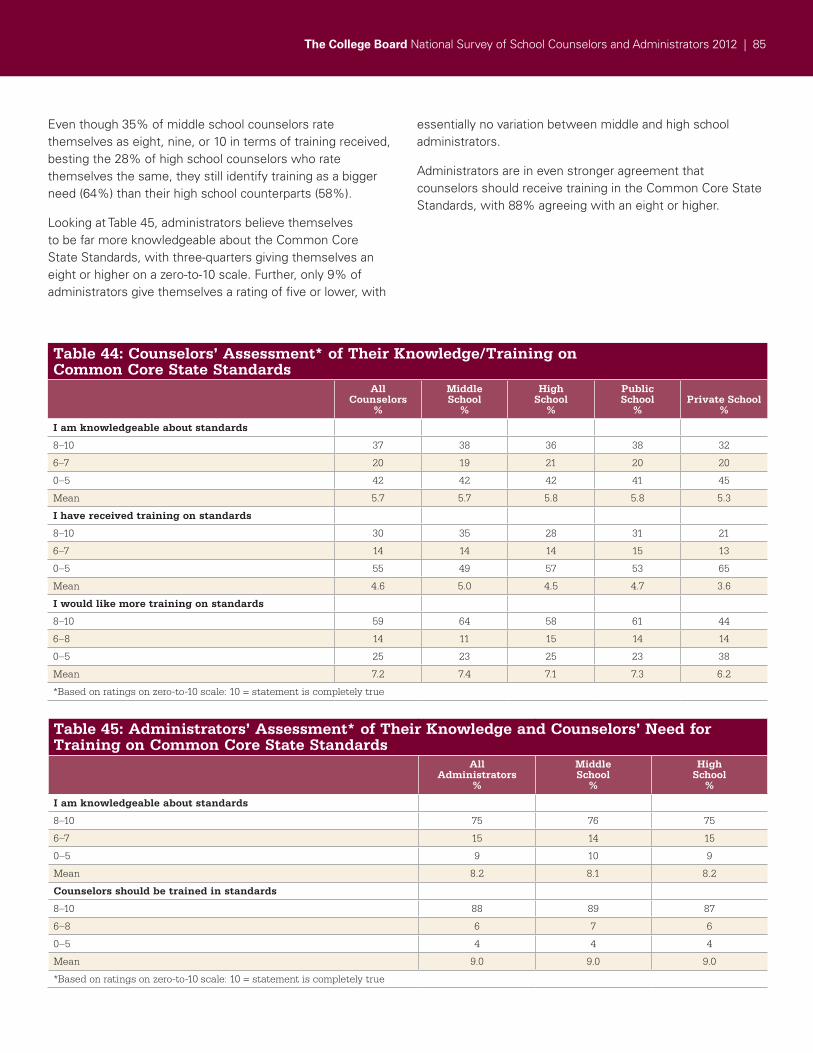
The College Board National Survey of School Counselors and Administrators 2012 | 85
Even though 35% of middle school counselors rate themselves as eight, nine, or 10 in terms of training received, besting the 28% of high school counselors who rate themselves the same, they still identify training as a bigger need (64%) than their high school counterparts (58%).
Looking at Table 45, administrators believe themselves to be far more knowledgeable about the Common Core State Standards, with three-quarters giving themselves an eight or higher on a zero-to-10 scale. Further, only 9% of administrators give themselves a rating of five or lower, with
essentially no variation between middle and high school administrators.
Administrators are in even stronger agreement that counselors should receive training in the Common Core State Standards, with 88% agreeing with an eight or higher.
Table 45: Administrators’ Assessment* of Their Knowledge and Counselors’ Need for Training on Common Core State Standards
AllAdministrators
%
MiddleSchool
%
HighSchool
%
I am knowledgeable about standards
8–10 75 76 75
6–7 15 14 15
0–5 9 10 9
Mean 8.2 8.1 8.2
Counselors should be trained in standards
8–10 88 89 87
6–8 6 7 6
0–5 4 4 4
Mean 9.0 9.0 9.0
*Based on ratings on zero-to-10 scale: 10 = statement is completely true
Table 44: Counselors’ Assessment* of Their Knowledge/Training on Common Core State Standards
AllCounselors
%
MiddleSchool
%
HighSchool
%
PublicSchool
%Private School
%
I am knowledgeable about standards
8–10 37 38 36 38 32
6–7 20 19 21 20 20
0–5 42 42 42 41 45
Mean 5.7 5.7 5.8 5.8 5.3
I have received training on standards
8–10 30 35 28 31 21
6–7 14 14 14 15 13
0–5 55 49 57 53 65
Mean 4.6 5.0 4.5 4.7 3.6
I would like more training on standards
8–10 59 64 58 61 44
6–8 14 11 15 14 14
0–5 25 23 25 23 38
Mean 7.2 7.4 7.1 7.3 6.2
*Based on ratings on zero-to-10 scale: 10 = statement is completely true
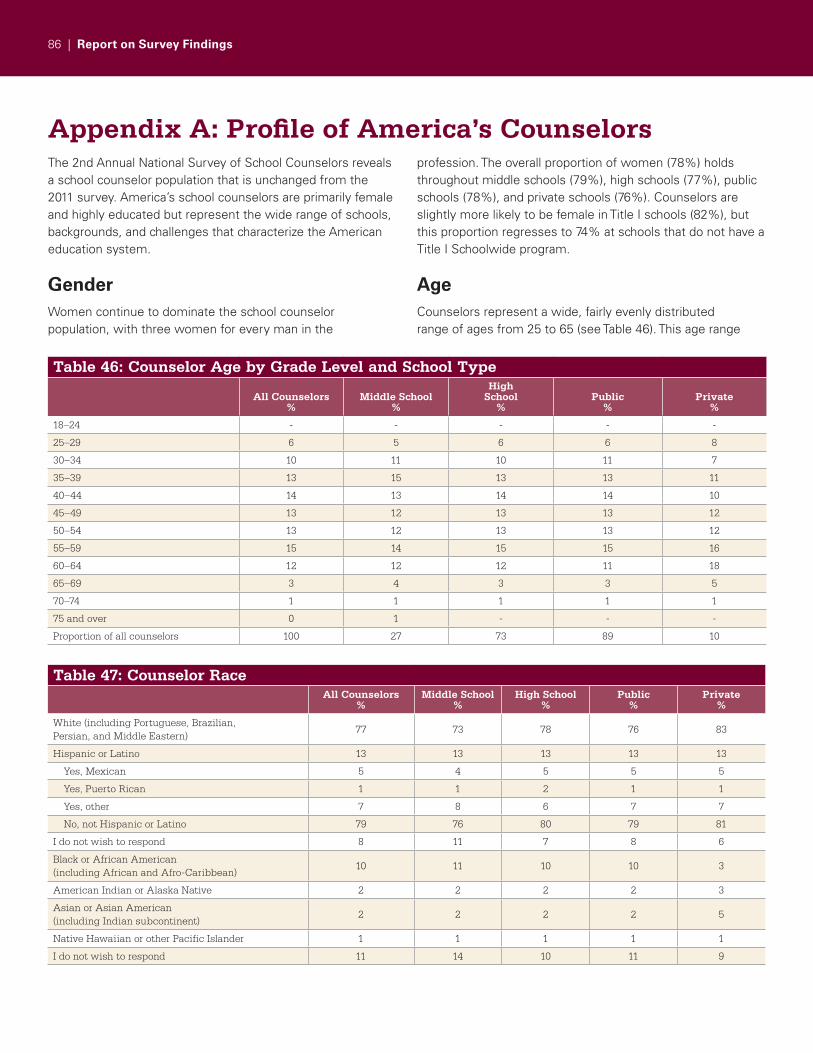
86 | Report on Survey Findings
Appendix A: Profile of America’s CounselorsThe 2nd Annual National Survey of School Counselors reveals a school counselor population that is unchanged from the 2011 survey. America’s school counselors are primarily female and highly educated but represent the wide range of schools, backgrounds, and challenges that characterize the American education system.
GenderWomen continue to dominate the school counselor population, with three women for every man in the
profession. The overall proportion of women (78%) holds throughout middle schools (79%), high schools (77%), public schools (78%), and private schools (76%). Counselors are slightly more likely to be female in Title I schools (82%), but this proportion regresses to 74% at schools that do not have a Title I Schoolwide program.
AgeCounselors represent a wide, fairly evenly distributed range of ages from 25 to 65 (see Table 46). This age range
Table 47: Counselor RaceAll Counselors
%Middle School
%High School
%Public
%Private
%
White (including Portuguese, Brazilian, Persian, and Middle Eastern)
77 73 78 76 83
Hispanic or Latino 13 13 13 13 13
Yes, Mexican 5 4 5 5 5
Yes, Puerto Rican 1 1 2 1 1
Yes, other 7 8 6 7 7
No, not Hispanic or Latino 79 76 80 79 81
I do not wish to respond 8 11 7 8 6
Black or African American(including African and Afro-Caribbean)
10 11 10 10 3
American Indian or Alaska Native 2 2 2 2 3
Asian or Asian American(including Indian subcontinent)
2 2 2 2 5
Native Hawaiian or other Pacific Islander 1 1 1 1 1
I do not wish to respond 11 14 10 11 9
Table 46: Counselor Age by Grade Level and School Type
All Counselors%
Middle School%
HighSchool
%Public
%Private
%
18–24 - - - - -
25–29 6 5 6 6 8
30–34 10 11 10 11 7
35–39 13 15 13 13 11
40–44 14 13 14 14 10
45–49 13 12 13 13 12
50–54 13 12 13 13 12
55–59 15 14 15 15 16
60–64 12 12 12 11 18
65–69 3 4 3 3 5
70–74 1 1 1 1 1
75 and over 0 1 - - -
Proportion of all counselors 100 27 73 89 10
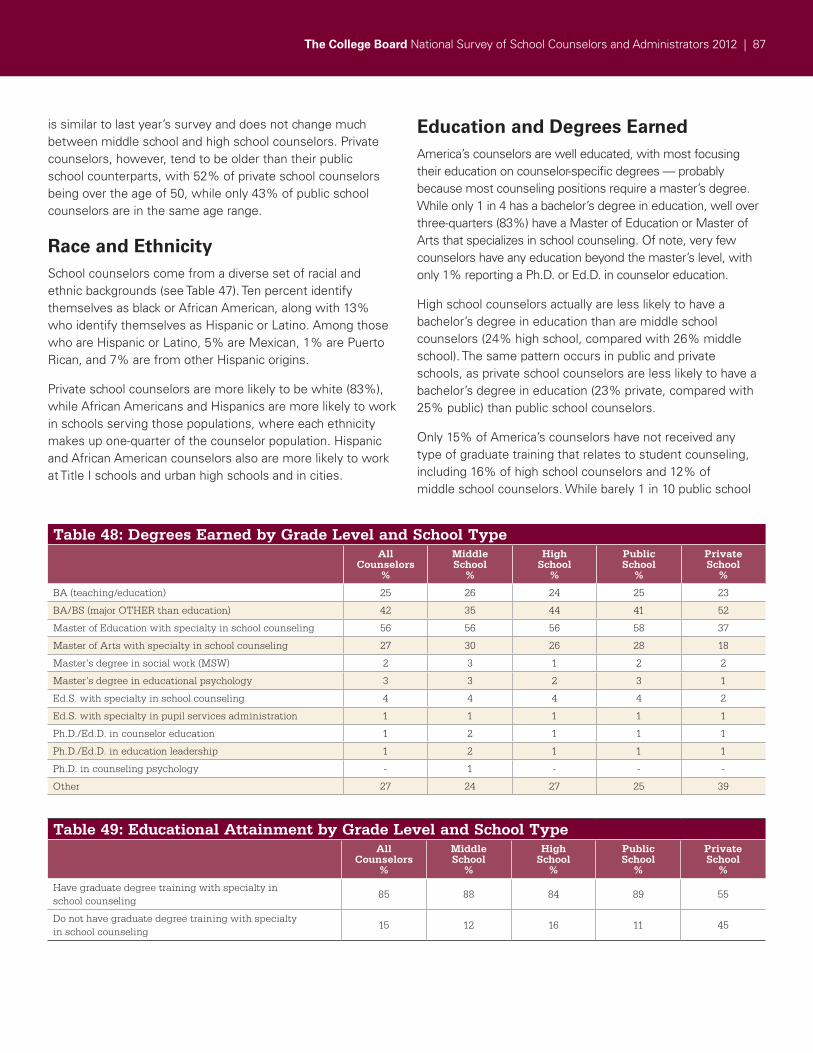
The College Board National Survey of School Counselors and Administrators 2012 | 87
is similar to last year’s survey and does not change much between middle school and high school counselors. Private counselors, however, tend to be older than their public school counterparts, with 52% of private school counselors being over the age of 50, while only 43% of public school counselors are in the same age range.
Race and EthnicitySchool counselors come from a diverse set of racial and ethnic backgrounds (see Table 47). Ten percent identify themselves as black or African American, along with 13% who identify themselves as Hispanic or Latino. Among those who are Hispanic or Latino, 5% are Mexican, 1% are Puerto Rican, and 7% are from other Hispanic origins.
Private school counselors are more likely to be white (83%), while African Americans and Hispanics are more likely to work in schools serving those populations, where each ethnicity makes up one-quarter of the counselor population. Hispanic and African American counselors also are more likely to work at Title I schools and urban high schools and in cities.
Education and Degrees EarnedAmerica’s counselors are well educated, with most focusing their education on counselor-specific degrees — probably because most counseling positions require a master’s degree. While only 1 in 4 has a bachelor’s degree in education, well over three-quarters (83%) have a Master of Education or Master of Arts that specializes in school counseling. Of note, very few counselors have any education beyond the master’s level, with only 1% reporting a Ph.D. or Ed.D. in counselor education.
High school counselors actually are less likely to have a bachelor’s degree in education than are middle school counselors (24% high school, compared with 26% middle school). The same pattern occurs in public and private schools, as private school counselors are less likely to have a bachelor’s degree in education (23% private, compared with 25% public) than public school counselors.
Only 15% of America’s counselors have not received any type of graduate training that relates to student counseling, including 16% of high school counselors and 12% of middle school counselors. While barely 1 in 10 public school
Table 48: Degrees Earned by Grade Level and School TypeAll
Counselors%
Middle School
%
High School
%
Public School
%
Private School
%
BA (teaching/education) 25 26 24 25 23
BA/BS (major OTHER than education) 42 35 44 41 52
Master of Education with specialty in school counseling 56 56 56 58 37
Master of Arts with specialty in school counseling 27 30 26 28 18
Master’s degree in social work (MSW) 2 3 1 2 2
Master’s degree in educational psychology 3 3 2 3 1
Ed.S. with specialty in school counseling 4 4 4 4 2
Ed.S. with specialty in pupil services administration 1 1 1 1 1
Ph.D./Ed.D. in counselor education 1 2 1 1 1
Ph.D./Ed.D. in education leadership 1 2 1 1 1
Ph.D. in counseling psychology - 1 - - -
Other 27 24 27 25 39
Table 49: Educational Attainment by Grade Level and School TypeAll
Counselors%
MiddleSchool
%
HighSchool
%
Public School
%
PrivateSchool
%
Have graduate degree training with specialty in school counseling
85 88 84 89 55
Do not have graduate degree training with specialty in school counseling
15 12 16 11 45
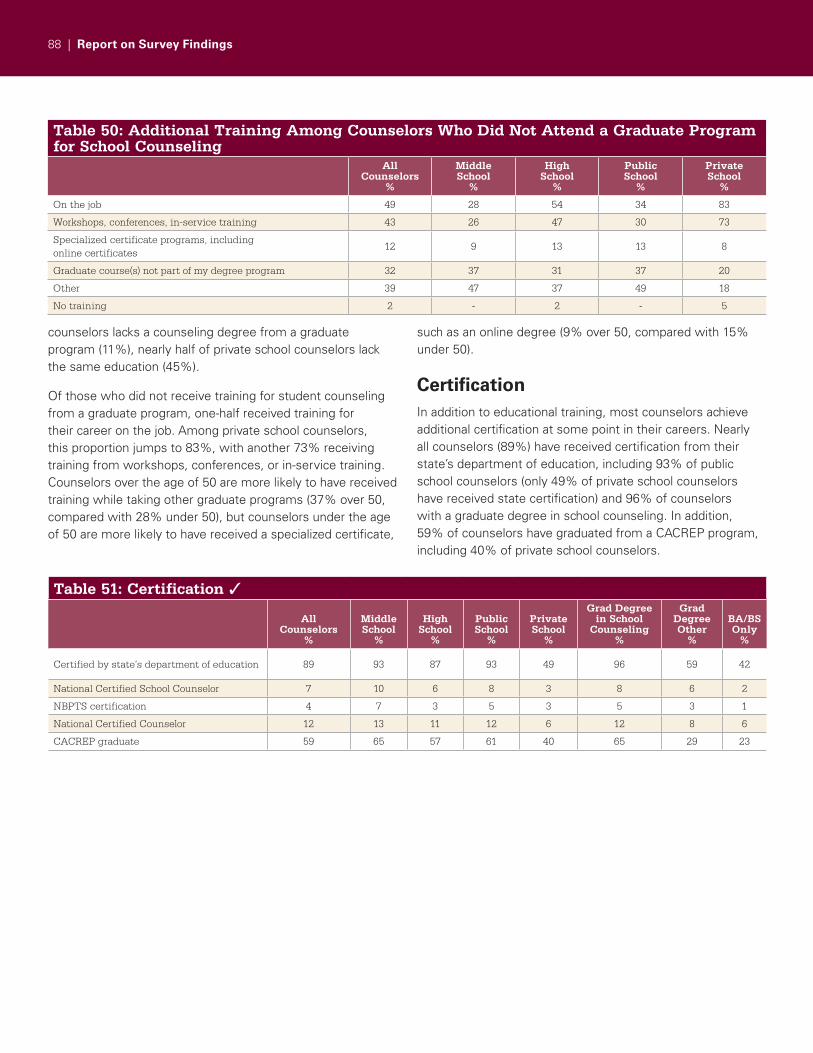
88 | Report on Survey Findings
counselors lacks a counseling degree from a graduate program (11%), nearly half of private school counselors lack the same education (45%).
Of those who did not receive training for student counseling from a graduate program, one-half received training for their career on the job. Among private school counselors, this proportion jumps to 83%, with another 73% receiving training from workshops, conferences, or in-service training. Counselors over the age of 50 are more likely to have received training while taking other graduate programs (37% over 50, compared with 28% under 50), but counselors under the age of 50 are more likely to have received a specialized certificate,
such as an online degree (9% over 50, compared with 15% under 50).
CertificationIn addition to educational training, most counselors achieve additional certification at some point in their careers. Nearly all counselors (89%) have received certification from their state’s department of education, including 93% of public school counselors (only 49% of private school counselors have received state certification) and 96% of counselors with a graduate degree in school counseling. In addition, 59% of counselors have graduated from a CACREP program, including 40% of private school counselors.
Table 50: Additional Training Among Counselors Who Did Not Attend a Graduate Program for School Counseling
AllCounselors
%
MiddleSchool
%
HighSchool
%
Public School
%
Private School
%
On the job 49 28 54 34 83
Workshops, conferences, in-service training 43 26 47 30 73
Specialized certificate programs, including online certificates
12 9 13 13 8
Graduate course(s) not part of my degree program 32 37 31 37 20
Other 39 47 37 49 18
No training 2 - 2 - 5
Table 51: Certification ✓
All Counselors
%
Middle School
%
High School
%
Public School
%
Private School
%
Grad Degree in School
Counseling%
Grad Degree Other
%
BA/BS Only
%
Certified by state’s department of education 89 93 87 93 49 96 59 42
National Certified School Counselor 7 10 6 8 3 8 6 2
NBPTS certification 4 7 3 5 3 5 3 1
National Certified Counselor 12 13 11 12 6 12 8 6
CACREP graduate 59 65 57 61 40 65 29 23
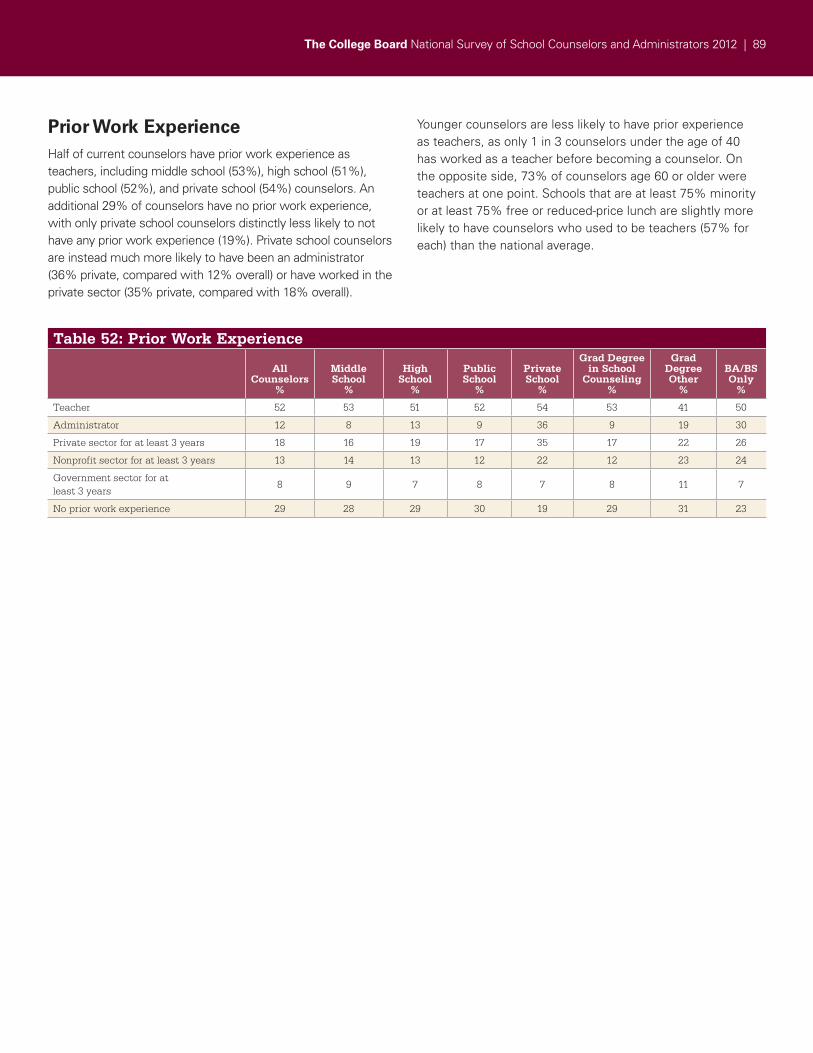
The College Board National Survey of School Counselors and Administrators 2012 | 89
Table 52: Prior Work Experience
AllCounselors
%
MiddleSchool
%
HighSchool
%
PublicSchool
%
Private School
%
Grad Degree in School
Counseling%
Grad Degree Other
%
BA/BS Only
%
Teacher 52 53 51 52 54 53 41 50
Administrator 12 8 13 9 36 9 19 30
Private sector for at least 3 years 18 16 19 17 35 17 22 26
Nonprofit sector for at least 3 years 13 14 13 12 22 12 23 24
Government sector for at least 3 years
8 9 7 8 7 8 11 7
No prior work experience 29 28 29 30 19 29 31 23
Prior Work ExperienceHalf of current counselors have prior work experience as teachers, including middle school (53%), high school (51%), public school (52%), and private school (54%) counselors. An additional 29% of counselors have no prior work experience, with only private school counselors distinctly less likely to not have any prior work experience (19%). Private school counselors are instead much more likely to have been an administrator (36% private, compared with 12% overall) or have worked in the private sector (35% private, compared with 18% overall).
Younger counselors are less likely to have prior experience as teachers, as only 1 in 3 counselors under the age of 40 has worked as a teacher before becoming a counselor. On the opposite side, 73% of counselors age 60 or older were teachers at one point. Schools that are at least 75% minority or at least 75% free or reduced-price lunch are slightly more likely to have counselors who used to be teachers (57% for each) than the national average.
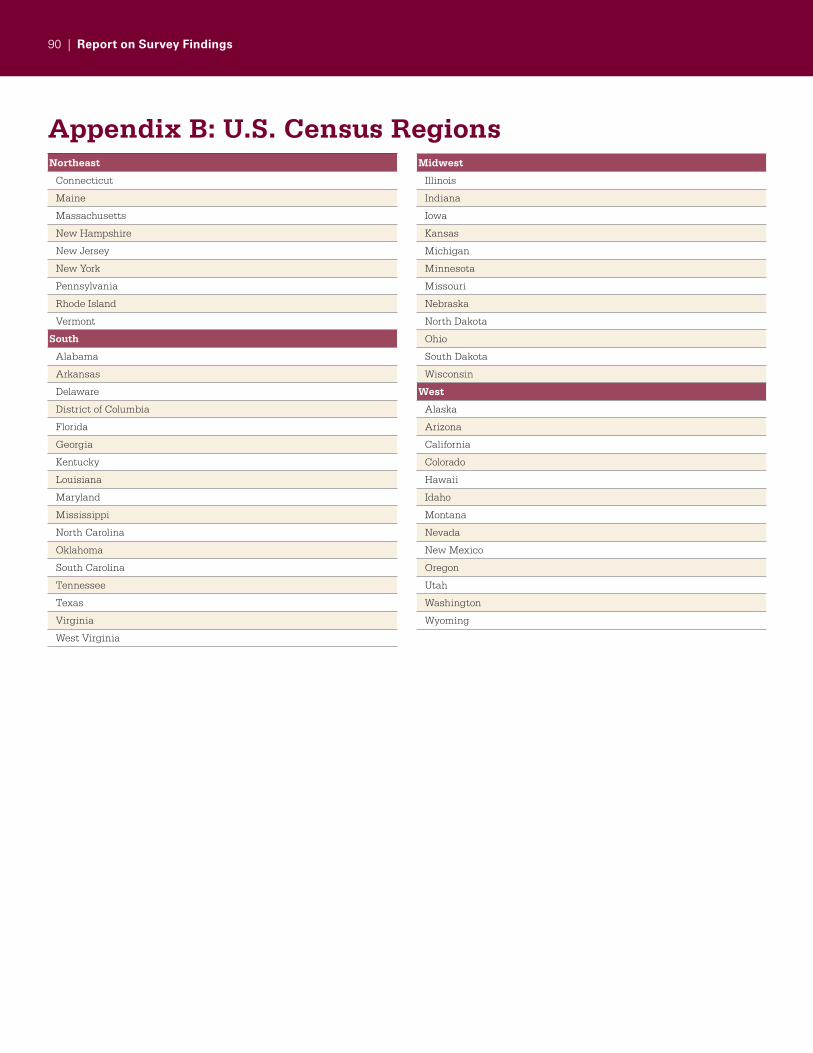
90 | Report on Survey Findings
Appendix B: U.S. Census RegionsNortheast
Connecticut
Maine
Massachusetts
New Hampshire
New Jersey
New York
Pennsylvania
Rhode Island
Vermont
South
Alabama
Arkansas
Delaware
District of Columbia
Florida
Georgia
Kentucky
Louisiana
Maryland
Mississippi
North Carolina
Oklahoma
South Carolina
Tennessee
Texas
Virginia
West Virginia
Midwest
Illinois
Indiana
Iowa
Kansas
Michigan
Minnesota
Missouri
Nebraska
North Dakota
Ohio
South Dakota
Wisconsin
West
Alaska
Arizona
California
Colorado
Hawaii
Idaho
Montana
Nevada
New Mexico
Oregon
Utah
Washington
Wyoming
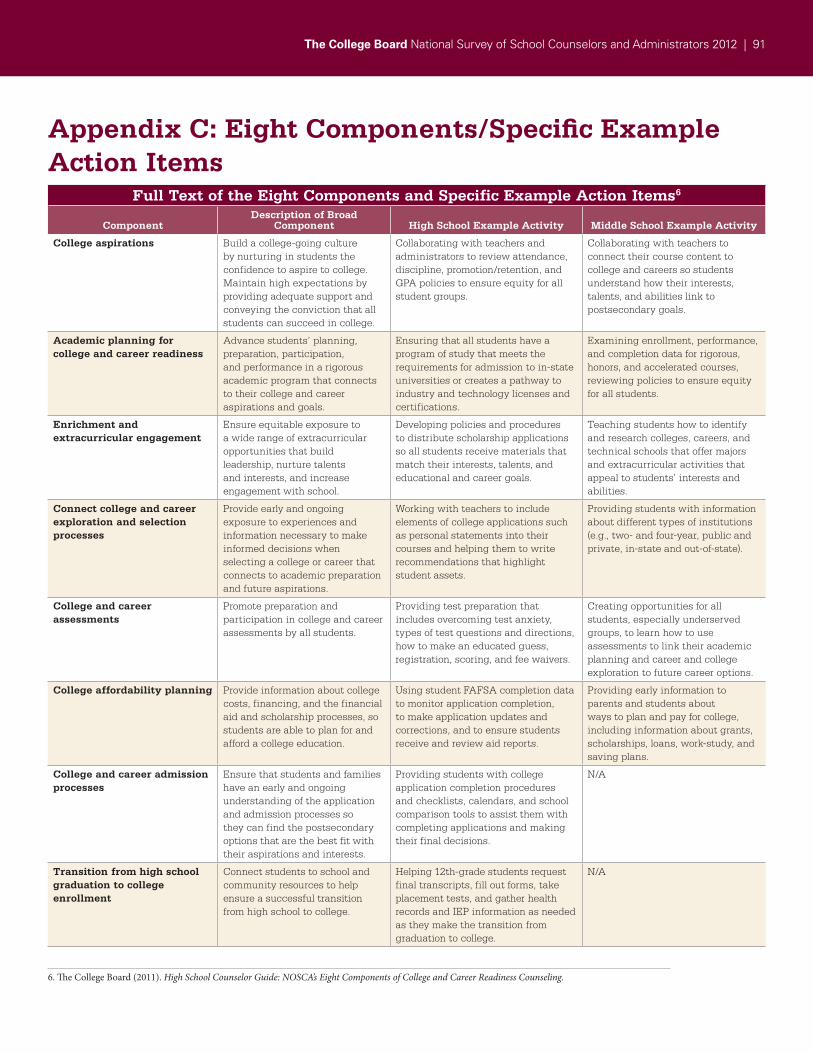
The College Board National Survey of School Counselors and Administrators 2012 | 91
Appendix C: Eight Components/Specific Example Action Items
Full Text of the Eight Components and Specific Example Action Items6
Component Description of Broad
Component High School Example Activity Middle School Example Activity
College aspirations Build a college-going culture by nurturing in students the confidence to aspire to college. Maintain high expectations by providing adequate support and conveying the conviction that all students can succeed in college.
Collaborating with teachers and administrators to review attendance, discipline, promotion/retention, and GPA policies to ensure equity for all student groups.
Collaborating with teachers to connect their course content to college and careers so students understand how their interests, talents, and abilities link to postsecondary goals.
Academic planning for college and career readiness
Advance students’ planning, preparation, participation, and performance in a rigorous academic program that connects to their college and career aspirations and goals.
Ensuring that all students have a program of study that meets the requirements for admission to in-state universities or creates a pathway to industry and technology licenses and certifications.
Examining enrollment, performance, and completion data for rigorous, honors, and accelerated courses, reviewing policies to ensure equity for all students.
Enrichment and extracurricular engagement
Ensure equitable exposure to a wide range of extracurricular opportunities that build leadership, nurture talents and interests, and increase engagement with school.
Developing policies and procedures to distribute scholarship applications so all students receive materials that match their interests, talents, and educational and career goals.
Teaching students how to identify and research colleges, careers, and technical schools that offer majors and extracurricular activities that appeal to students’ interests and abilities.
Connect college and career exploration and selection processes
Provide early and ongoing exposure to experiences and information necessary to make informed decisions when selecting a college or career that connects to academic preparation and future aspirations.
Working with teachers to include elements of college applications such as personal statements into their courses and helping them to write recommendations that highlight student assets.
Providing students with information about different types of institutions (e.g., two- and four-year, public and private, in-state and out-of-state).
College and career assessments
Promote preparation and participation in college and career assessments by all students.
Providing test preparation that includes overcoming test anxiety, types of test questions and directions, how to make an educated guess, registration, scoring, and fee waivers.
Creating opportunities for all students, especially underserved groups, to learn how to use assessments to link their academic planning and career and college exploration to future career options.
College affordability planning Provide information about college costs, financing, and the financial aid and scholarship processes, so students are able to plan for and afford a college education.
Using student FAFSA completion data to monitor application completion, to make application updates and corrections, and to ensure students receive and review aid reports.
Providing early information to parents and students about ways to plan and pay for college, including information about grants, scholarships, loans, work-study, and saving plans.
College and career admission processes
Ensure that students and families have an early and ongoing understanding of the application and admission processes so they can find the postsecondary options that are the best fit with their aspirations and interests.
Providing students with college application completion procedures and checklists, calendars, and school comparison tools to assist them with completing applications and making their final decisions.
N/A
Transition from high school graduation to college enrollment
Connect students to school and community resources to help ensure a successful transition from high school to college.
Helping 12th-grade students request final transcripts, fill out forms, take placement tests, and gather health records and IEP information as needed as they make the transition from graduation to college.
N/A
6. The College Board (2011). High School Counselor Guide: NOSCA’s Eight Components of College and Career Readiness Counseling.

92 | Report on Survey Findings

12b-6371120505155
About the College BoardThe College Board is a mission-driven, not-for-profit organization that connects students to college success and opportunity. Founded in 1900, the College Board was created to expand access to higher education. Today, the membership association is made up of over 6,000 of the world’s leading educational institutions and is dedicated to promoting excellence and equity in education. Each year, the College Board helps more than seven million students prepare for a successful transition to college through programs and services in college readiness and college success — including the SAT® and the Advanced Placement Program®. The organization also serves the education community through research and advocacy on behalf of students, educators and schools.For further information, visit www.collegeboard.org.
The College Board Advocacy & Policy CenterThe College Board Advocacy & Policy Center was established to help transform education in America. Guided by the College Board’s principles of excellence and equity in education, we work to ensure that students from all backgrounds have the opportunity to succeed in college and beyond. We make critical connections between policy, research and real-world practice to develop innovative solutions to the most pressing challenges in education today.For further information, visit advocacy.collegeboard.org.
For further information on the National Office for School Counselor Advocacy (NOSCA), visit nosca.collegeboard.org.
Civic EnterprisesCivic Enterprises is a public policy firm that helps corporations, nonprofits, foundations, universities and governments develop and spearhead innovative public policies to strengthen our communities and country. Created to enlist the private, public and nonprofit sectors to help address our Nation’s toughest problems, Civic Enterprises fashions new initiatives and strategies that achieve measurable results in the fields of education, civic engagement, health, and many more. For information about Civic Enterprises, please visit their website at www.civicenterprises.net.
Hart ResearchHart Research has been one of America’s leading public opinion and strategic research firms for four decades. Throughout that time, Hart has been at the forefront of identifying and understanding Americans’ changing expectations, attitudes, and behaviors, and views on public policy. Hart Research’s clients come from virtually every sector of society, including politics, labor unions, media, non-profit organizations, and for-profit organizations including many Fortune 500 corporations. For more information about Hart Research, please visit their website www.hartresearch.com.
© 2012 The College Board. College Board, Advanced Placement Program, AP, SAT and the acorn logo are registered trademarks of the College Board. All other products and services may be trademarks of their respective owners. Visit the College Board on the Web: www.collegeboard.org.