National Park Service - morageology
58
National Park Service U.S. Department of the Interior Mount Rainier National Park Rivers Gone Wild: Extreme landscape response to climate-induced flooding and debris flows, and implications to long-term management at Mount Rainier National Park Field Trip Guide #410, 2017 Geological Society of America Annual Meeting, Seattle, WA
Transcript of National Park Service - morageology

National Park Service U.S. Department of the Interior
Mount Rainier National Park
Rivers Gone Wild: Extreme landscape response to climate-induced flooding and debris flows, and implications to long-term management at Mount Rainier National Park Field Trip Guide #410, 2017 Geological Society of America Annual Meeting, Seattle, WA

ON THIS PAGE Debris flow deposit left in the Tahoma Creek Picnic Area (then a campground and now abandoned) on the evening of August 31, 1967 following the genesis of modern debris flow activity in the Tahoma Creek reach. The un-vegetated part of the Tahoma Creek active channel is faintly visible in the background. (Photo modified from Richardson, 1968) ON THE COVER Bank protection installed during the summer of 2016 along the West Side Road and Tahoma Creek, on the southwest side of Mount Rainier National Park, to protect the road from flooding and debris flows. (Scott Beason/NPS Photo)

Rivers Gone Wild: Extreme landscape response to climate-induced flooding and debris flows, and implications to long-term management at Mount Rainier National Park Field Trip Guide #410, 2017 Geological Society of America Annual Meeting, Seattle, WA
Scott R. Beason1, Paul M. Kennard1, Christopher S. Magirl2, Joseph L. George1, Robert P. Jost1, and Taylor R. Kenyon1 1National Park Service Mount Rainier National Park 55210 238th Ave E Ashford, WA 98304 2United States Geological Survey Arizona Water Science Center 520 North Park Avenue Tucson, AZ 85719
October 21, 2017 U.S. Department of the Interior National Park Service Mount Rainier National Park Ashford, Washington

ii
Photo 1: Mount Rainier and Nisqually River as seen at Longmire (Scott Beason/NPS Photo).
Please cite this publication as:
Beason, S.R., P.M. Kennard, C.S. Magirl, J.L. George, R.P. Jost, and T.R. Kenyon. 2017. Rivers Gone Wild: Extreme landscape response to climate-induced flooding and debris flows, and implications to long-term management at Mount Rainier National Park: Field Trip Guide #410 – 2017 Geological Society of America Annual Meeting, Seattle, WA. National Park Service, Mount Rainier National Park, Ashford, Washington. 49 p.

iii
Contents Page
Figures................................................................................................................................................... iv
Tables .................................................................................................................................................... vi
Introduction and Trip Description.......................................................................................................... 1
Geologic Hazards of Mount Rainier ...................................................................................................... 1
Eruptive Volcanism ........................................................................................................................ 1
Lahars ............................................................................................................................................. 2
Glacial Outburst Floods (Jökulhlaups) ........................................................................................... 2
Debris Flows ................................................................................................................................... 2
Field Trip Itinerary ................................................................................................................................. 3
Geologic Setting of Mount Rainier ........................................................................................................ 5
Ancestral Mount Rainier ................................................................................................................ 5
Modern Mount Rainier and the Holocene ...................................................................................... 6
Mount Rainier Today ..................................................................................................................... 7
Sediment Transport at Mount Rainier (“Goats to Geoducks”) .............................................................. 8
Imminent Threats Program .................................................................................................................. 14
Pilot Program – The West Side Road ........................................................................................... 14
Stop 1 – West Side Road and Tahoma Creek ...................................................................................... 17
Stop 2 – Kautz Creek Picnic Area ....................................................................................................... 25
Stop 3 – Longmire Community Building ............................................................................................ 30
Stop 4 – Lower Van Trump Hairpin .................................................................................................... 35
Stop 5 – Paradise .................................................................................................................................. 40
Literature Cited .................................................................................................................................... 47

iv
Figures Page
Figure 1: Field trip overview map. ....................................................................................................... 3
Figure 2: Conceptual model of processes affecting sediment delivery from Mount Rainier, Washington .............................................................................................................................. 9
Figure 3: Images of the headwaters of the White River at the terminus of the Emmons Glacier, Mount Rainier, Washington ................................................................................................... 10
Figure 4: Graph showing stage for median flow and daily discharge as measured at the U.S. Geological Survey streamflow-gaging station Nisqually River near National (12082500) ........................................................................................................................................... 11
Figure 5: Map of Mount Rainier, Washington, showing where potential sediment-management actions would be most effective based on geomorphic conditions that suggest sediment accumulates naturally, including both long- and mid-term transient-storage reaches. .................................................................................................................................... 12
Figure 6: Map showing change in average elevation at about 100 cross section between 1984 and 2009 in the Puyallup, White, and Carbon Rivers, western Washington .............................. 13
Figure 7: A conceptual model proposed by Lane (1955) and Rosgen (1996) that describes four factors that influence sediment transport in fluvial systems ........................................ 14
Figure 8: The three ring hazard model utilized by the imminent threats program at Mount Rainier .................................................................................................................................................. 14
Figure 9: Products from a geomorphic assessment along Tahoma Creek completed in 2014...................................................................................................................................................... 15
Figure 10: The path of Tahoma Creek active channel after the stream bed was rearranged by a series of debris flows and subsequent high water events during the winter of 2015/2016 ............................................................................................................................................ 15
Figure 11: Cross section view of the flood protection constructed along a portion of the Westside Road in 2016 ........................................................................................................................ 16
Figure 12: Location map for stop 1 along the West Side Road. ......................................................... 17
Figure 13: Aerial images from 1960, 2006 and 2015 showing loss of riparian habitat by incursion of Tahoma Creek during successive debris flows from 1967-2015. .................................... 18
Figure 14: View facing south of the West Side Road parking area following 2014 Mount Wow rockfall, including damage to the roadway, an NPS gate and a visitor vehicle ......................... 21
Figure 15: Debris flow levee on the Tahoma Creek Trail as result of the August 13, 2015 South Tahoma Glacier outburst flood and debris flow ........................................................................ 22
Figure 16: Dry Creek debris flow deposit as viewed on October 10, 2015. ....................................... 23
Figure 17: Conceptual model for storage and release of water as outburst floods by stagnant ice during glacial thinning/retreat and evolution of the South Tahoma Glacier .................... 24

v
Figure 18: Location map for Stop 2 at Kautz Creek Picnic Area ....................................................... 25
Figure 19: Oblique aerial photo of the 1947 Kautz Creek mudflow .................................................. 26
Figure 20: Floodwaters overtopping the Kautz Creek culverts .......................................................... 27
Figure 21: Looking upstream at the twin culverts located 0.2 miles east of the Kautz Creek bridge. ........................................................................................................................................ 28
Figure 22: Lahar exposure near Kautz Creek viewpoint .................................................................... 29
Figure 23: Location map for Stop 3 at Longmire ............................................................................... 30
Figure 24: Longmire Maintenance Area during November 1959 flood ............................................. 31
Figure 25: Damage to the park infrastructure near the recently-constructed Emergency Operations Center at Longmire during the November 2006 flood ...................................................... 32
Figure 26: Construction of a flood wall in 2007 to help protect the Longmire administrative area from floods on the Nisqually River ...................................................................... 33
Figure 27: River stage, temperature and precipitation during the October 27, 2012 Nisqually Glacier outburst flood, as recorded on stream gaging equipment at Longmire. ................. 34
Figure 28: Location map for Stop 4 at Lower Van Trump Hairpin .................................................... 35
Figure 29: Van Trump Creek flooding into the Nisqually during the September 29, 2005 debris flow ........................................................................................................................................... 36
Figure 30: LiDAR hillshade comparison between 2008 and 2012 at Lower Van Trump Hairpin, clearly showing the 2008 landslide scar and deposit. ............................................................ 37
Figure 31: LiDAR difference map (2012 surface minus 2008 surface) showing distinct zones of aggradation and incision. ....................................................................................................... 38
Figure 32: Boulder levees (left) and battered tree trunks (right) are evidence of the 2005 Van Trump debris flow. ....................................................................................................................... 39
Figure 33: Location map for Stop 5 at Paradise. ................................................................................ 40
Figure 34: View of the Nisqually Glacier terminus from the Nisqually Vista trail in 1974 (top) and 2004 (bottom). ...................................................................................................................... 41
Figure 35: Terminus position of the Nisqually Glacier, 1840-2015. The current mapped glacier terminus is as of 2015 .............................................................................................................. 42
Figure 36: Velocity of individual features (top) and extrapolated velocity fields (bottom) on the lower Nisqually Glacier during the 2011 and 2012 field seasons ............................................. 44
Figure 37: Overall mass balance on the Nisqually and Emmons Glacier, 2003-2013. ...................... 45
Figure 38: Change in surface area of all glaciers at Mount Rainier from 1896 to 2015 ..................... 45
Figure 39: Change in volume of glaciers at Mount Rainier from 1896-2015..................................... 46
vi
Tables Page
Table 1: Field trip itinerary ................................................................................................................... 4
Table 2: Dates of known debris flows on Tahoma Creek from various sources. ..........................19-20
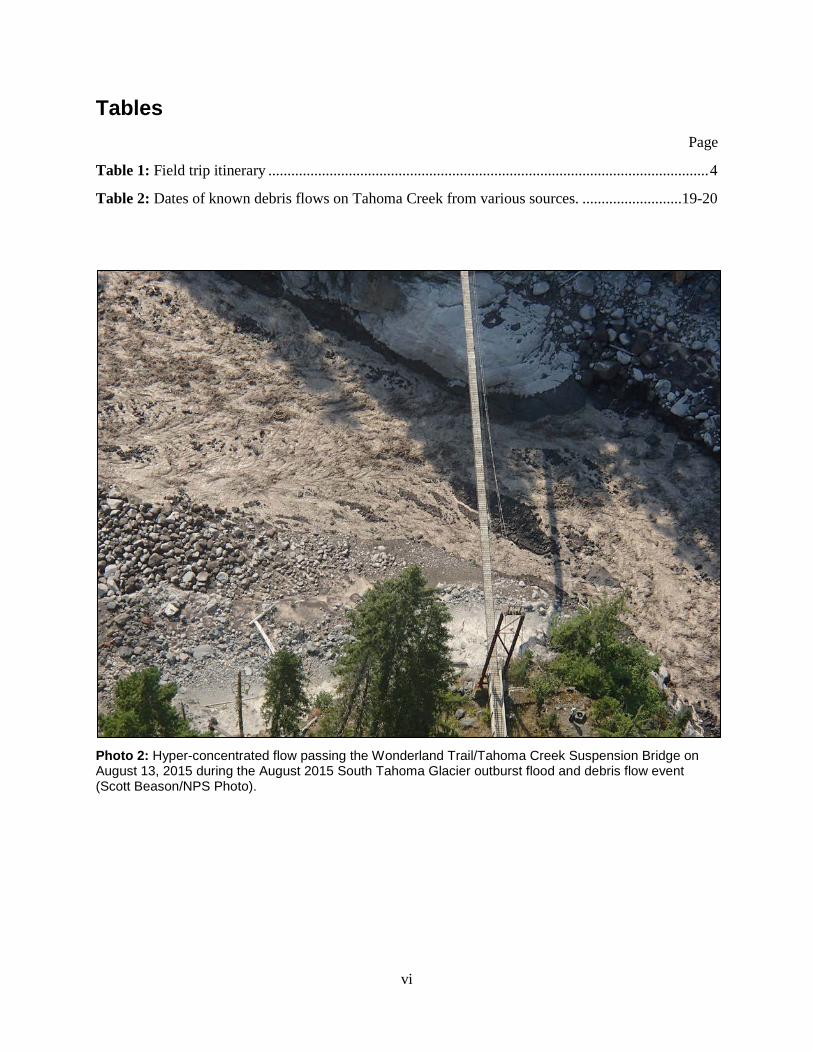
Photo 2: Hyper-concentrated flow passing the Wonderland Trail/Tahoma Creek Suspension Bridge on August 13, 2015 during the August 2015 South Tahoma Glacier outburst flood and debris flow event (Scott Beason/NPS Photo).

1
Introduction and Trip Description This field trip will explore recent landscape response and changing management of park resources at Mount Rainier National Park due to flooding, debris flows, and other geomorphic forces that the park has experienced in the last decade. We will visit areas that have been greatly affected by geologic forces and show how Mount Rainier’s park leaders have decided to manage these resources while attempting to minimize loss of recreational access and opportunities to visitors at Mount Rainier. The park has recently implemented an “imminent threats” program that uses adaptive management to address scientific-based multi-phased approaches for assessing, prioritizing, and mitigating flood hazards to park infrastructure. This field trip will visit locations within the park where this program has been successfully implemented. This single-day trip will depart Seattle and have stops on the West Side Road, Kautz Creek, Longmire and Paradise areas of the park. On the return leg, the participants will travel through the east side of the park and witness the changing look of Mount Rainier and its resources. This trip will highlight some of the work completed by NPS Geoscientists-in-Parks (GIP) Interns and present real solutions that have been implemented to address complicated issues of changing landscapes at Mount Rainier.
Geologic Hazards of Mount Rainier The following list is intended to be a brief introduction to the geologic hazards present at Mount Rainier National Park and is given to acquaint the reader with the most common geologic threats facing Park infrastructure and visitors. Significant portions of this section were summarized from Patrick T. Pringle’s Roadside Geology of Mount Rainier National Park and Vicinity (2008), with permission.
Eruptive Volcanism Given that Mount Rainier is an active volcano (albeit dormant since approximately 1,100 yr B.P.), the most sensational threat to Park visitors & infrastructure is the potential for eruptive volcanic products, especially lava flows and pyroclastic materials. Based on the andesite and low-silica dacite lava flows that dominate Mount Rainier’s eruptive history, a modern eruption of Mount Rainier would likely produce fairly viscous lava flows that have the potential to travel long distances downslope. These viscous lava flows would likely consume anything in their paths, while also burning adjacent forests and melting snow and ice. Also preserved in Mount Rainier’s geologic record are signs of pyroclastic flows, masses of hot gases and rock fragments that flow quickly at ground level downslope from an eruption. A modern eruption of Mount Rainier would likely produce pyroclastic flows like those observed during the 1980 eruption of Mount St. Helens. Given that pyroclastic flows travel at hundreds of yards (meters) per second and range in temperature from 500 to 1500 degrees Fahrenheit (300 to over 800 degrees Celsius), they have a particularly deadly direct human impact. Pyroclastic flows also have the potential to quickly melt snow and ice, which has serious implications for Park infrastructure and visitors because of the likelihood that this will incite lahars and/or glacial outburst floods (jökulhlaups).

2
Lahars Another major geologic hazard associated with volcanoes like Mount Rainier is the threat of lahars, fast-moving mixtures of mud, rock, and volcanic debris that are mobilized from the slopes of a volcano by water. This material can travel for tens of miles downslope from its source, preferentially flowing through river valleys. The area included in and surrounding Mount Rainier National Park is underlain with extensive lahar deposits, the most recent of which occurred approximately 300 years ago. As mentioned above, lahars can be generated by the rapid melting of snow and glacial ice associated with volcanic processes. However, lahars are not always directly linked with volcanism. Lahars may also be caused by excessive rainfall on steep, unstable slopes and by the collapse of weakened rock that has been hydrothermally altered by past volcanism. This collapse of altered rock, specifically the summit edifice of Mount Rainier, was responsible for the largest lahar in Mount Rainier’s history (the Osceola Mudflow), in which approx. 1 mi3 (4 km3) of material was transported through the drainages of the White River and South Prairie Creek around 5,600 cal yr B.P. Given the voluminous potential of lahars and the rapid speed at which this material is transported, lahars are posed to be the most devastating threat to Park infrastructure and visitors.
Glacial Outburst Floods (Jökulhlaups) Glacial outburst floods, or jökulhlaups, are dramatic floods caused by the failure of glacial ice following extended periods of unusually hot weather or increased rainfall. These extreme weather conditions cause water to pool up beneath a glacier, either through rainfall runoff or from excessive glacial melt. Eventually, enough water will pool up to cause the glacier to become buoyant, leading to a catastrophic release of the impounded water. While the resulting flood from this release of water has the potential to directly impact Park infrastructure and visitors, the primary threat from these floods is their ability to mobilize material from steeply sloping valley walls, inciting debris flows.
Debris Flows Among the most common geologic hazards present in Mount Rainier National Park are debris flows, accumulations of rock and hillslope debris mobilized by water. As noted above, debris flows are most commonly triggered by glacial outburst floods. Even though these floods may only generate a minor increase in stream stage, they are capable of mobilizing enormous quantities of material from the steep slopes adjacent to the river channels through which they travel. Hillslope material may also be mobilized into debris flows by heavy precipitation during fall storms. Because the material transported in debris flows can be significantly larger than the normal carrying capacity of the streams through which they move, this material is capable of damming up streams once the flood discharge transitions back into normal flow. Even after the stream breaks through this sediment dam, this wave of debris flow material has long-lasting implications for the behavior of the affected stream as it is slowly transported downstream. While the long-term fluvial sediment transport-related effects of debris flow material may take decades to recognize, the short-term effects of debris flows can be devastating to Park infrastructure and visitors. The large rock and debris associated with debris flows can batter old growth forests and Park roads, can bury campgrounds, and can fill river channels, putting bridges and other Park infrastructure at risk. Debris flows can also be deadly to Park visitors, as they move quickly and can descend upon victims with little notice.

3
Field Trip Itinerary
Figure 1: Field trip overview map.

4
Table 1: Field trip itinerary
Stop # Start Time End Time Brief Description of Event or Stop
07:00 AM 09:15 AM Depart Washington State Convention Center in Seattle and drive ~90 miles (via either I-5 or SR167) to the Nisqually Entrance at Mount Rainier National Park (estimated 2 hours). Then drive 4 miles from the park entrance to the West Side Road Parking Area. Bathroom stops can be made in Elbe or Ashford on the way. There are no bathrooms at the West Side Road area.
1 09:15 AM 10:45 AM Spend 1.5 hrs exploring the West Side Road and Tahoma Creek area. This includes approximately 1-2 miles of hiking on a dirt/gravel/sandy surface to visit an area the park that has seen numerous debris flows and flooding events over the last 50 years (including two separate sequences in 2015), which has led to changes in management of the area. We will also explore how the park's new "imminent threats" program is responding to geohazardous areas like these.
10:45 AM 11:00 AM Drive 6 miles from West Side Road to Kautz Creek Picnic Area.
2 11:00 AM 11:45 AM Stop at Kautz Creek Picnic Area and spend 45 minutes discussing the 1947 mudflow, debris flows and changes to the area between 2006 and present. We will also discuss adaptive park management in this area, especially in relation to the management of the park's helicopter base and impacts of floods on park operations.
11:45 AM 12:00 PM Drive 4 miles from Kautz Creek to the Longmire Community Building
3 12:00 PM 1:00 PM Spend approximately 1 hour at the Longmire Community Building. We will have a working lunch at the Community Building where we will show a presentation about everyday geologic hazards (flooding, debris flows, etc) and how the park is managed with respect to changing global and regional climates. A box or sack lunch will be provided to all participants and is included in the cost of the trip. Please let trip leaders know about dietary restrictions at least 1 week prior to the start of the field trip.
1:00 PM 1:15 PM Drive 4 miles from the Longmire Community Building to the "Lower Van Trump" Hairpin on the Nisqually-Paradise Road
4 1:15 PM 2:00 PM Spend approximately 45 minutes exploring the Lower Van Trump Hairpin area. This location has been heavily influenced by debris flows, landslides, and flooding. We will hike approximately 1 mile roundtrip on a former debris flow deposit. This hike will be on loose silt, sand, gravels and boulders.
2:00 PM 2:20 PM Drive 8 miles from Lower Van Trump Hairpin to the Paradise Lower Parking Lot
5 2:20 PM 4:20 PM Spend approximately 2 hours at the Paradise area (5,400'). We will hike approximately 2 miles on the Nisqually Vista trail and have views of the peak, the Nisqually Glacier, and the upper Nisqually River. At the viewpoints, we will discuss how changing regional climate is affecting park glaciers and, in turn, affecting proglacial areas and glacial rivers downstream of those glaciers.
4:20 PM 7:00 PM Depart the Paradise Area and Return to the Washington State Convention Center, arriving around 7 PM. There are 2 alternative routes that can be taken: 1) Return the same direction (103 miles); or 2) Drive around the East Side the park (115 miles). Both take about the same amount of time - 2:10-2:30. Depending on the group's feelings, we will decide which direction to return on the day of the trip.

5
Geologic Setting of Mount Rainier Significant portions of this section were summarized from Patrick T. Pringle’s Roadside Geology of Mount Rainier National Park and Vicinity (2008), with permission.
Ancestral Mount Rainier Mount Rainier National Park was established by an act of Congress on March 2, 1899. Mount Rainier National Park (from here on referred to as MORA) is a 369.35 mi2 (956.6 km2) National Park in southwestern Washington encompassing the active volcano Mount Rainier and the area surrounding it. For the purposes of this field trip, the geologic history of MORA begins with the formation of the Cascade volcanic arc after the subduction of the Juan de Fuca Plate beneath the North American Plate. The earliest volcanoes in the Cascade Range likely began forming in the late Eocene Epoch (43-37 Ma) of the Tertiary Period (65.5-1.8 Ma) in what was then a coastal plain environment. Cascade volcanism increased from the late Eocene to late Oligocene Epochs (37-27 Ma), during which time extensive basaltic andesite lava flows formed the Ohanapecosh Formation found in MORA. Late Eocene to early Oligocene volcanic centers known to be present at or near Mount Wow and Cowlitz Chimneys (the latter in MORA) may have been the source for the lava that formed the Ohanapecosh Formation.
The next period of volcanism in the vicinity of MORA occurred in the late Oligocene to early Miocene Epochs (27-22 Ma), leaving behind two major deposits in the Park. The older of these is the Stevens Ridge Formation, a deposit of welded tuffs derived from rhyodacitic ash flows. This Formation is named after Stevens Ridge, a prominent feature in Stevens Canyon on the south side of MORA. The second of these late Oligocene to early Miocene deposits is the Fifes Peak Formation, the remnant of multiple, extensive basalt, basaltic andesite, and andesite lava flows. This Formation is visible throughout the western part of MORA, including such prominent features as Florence Peak and Ipsut Pass. Concurrent with the deposition of the Stevens Ridge and Fifes Peak Formations, rocks now exposed as the Tatoosh Range on the southern border of MORA began to form as the Tatoosh pluton. Using radiometric dating techniques, Mattinson (1977) found the granodiorite and quartz monzonite of the Tatoosh pluton to have ages between 25.8 and 14.1 Ma.
The Miocene (23 to 5 Ma) was a relatively quiet Epoch for volcanism in the vicinity of MORA. However, it was during this time (17.5 to 6 Ma) that flood basalts erupted from eastern Washington, eastern Oregon, and Idaho to form the Columbia River Basalt Group. Near the end of the Pliocene (5 to 1.8 Ma), volcanism in MORA began to pick up again. It was during this Epoch that the formation of an ancestral Mount Rainier began (approx. 2 Ma). This ancestral Mount Rainier was very similar to its modern counterpart, being a large volcano with ridges and canyons that radiated from its summit. The eruptive style of the ancestral Mount Rainier was also very similar to that of the modern Mount Rainier, with andesite and dacite lava flows, lahars, and pumiceous lahars being the dominant eruptive products.
Remnants of the ancestral Mount Rainier’s volcanic activity are preserved at Panhandle Gap on the eastern slope of the modern Mount Rainier, as an extensive accumulation of volcanic debris on the northwest slope preserved as the Lily Creek, Puyallup and Alderton Formations, and in small

6
exposures in the headwaters of the Carbon and Cowlitz Rivers. A decrease in volcanic output from this ancestral Mount Rainier began around 1 Ma and was followed by a period of regional glaciation in the early to middle Pleistocene (1.8-0.13 Ma).
Pleistocene (1.8 Ma to 12 ka) glaciation of the MORA area was part of a larger glacial event that affected the Pacific Northwest, as well as significant portions of North America. During this time, continental ice sheets associated with the larger Cordilleran ice sheet frequently moved into the Puget Lowland region between the Olympic Mountains and the Cascade Range. Alpine glaciers were also widespread among the crest of the Cascade Range during the Pleistocene, forming in the highlands around the current locations of Mount Rainier, Adams and St. Helens. In the MORA area, alpine glaciers developed in the Tatoosh Range, the Carbon River area, and on the ancestral Mount Rainier itself. The successive movements of these alpine glaciers were responsible for removing nearly all signs of the ancestral Mount Rainier from the landscape.
Modern Mount Rainier and the Holocene Formation of the modern Mount Rainier began approximately 500 ka, an event marked by the beginning of an almost continuous period of volcanism unlike the sporadic volcanic events that preceded it. Some remnants of the earliest eruptions of the modern Mount Rainier include pyroclastic flows preserved as breccias in Glacier Basin, large andesite flows preserved in Burroughs Mountain, and other lava flows that form Grand Park and nearby ridges. Many of the ridge-forming lava flows in MORA exhibit ice-contact features (i.e. columnar jointing, perched deposits, and isolated ridges), caused by lava coming into contact with the many ice-filled valleys radiating from the summit of Mount Rainier during this time.
More ice-contact features are found in the lava flows forming the Mowich Face and Liberty Cap features of the northwest region of MORA. Ice contact features present in these high-elevation deposits, ranging in age from 280 to 190 ka, indicate the extent of valley glaciation at Mount Rainier during this time. Lava flows from the modern Mount Rainier continued intermittently from 190 ka to about 40 ka, forming features such as Echo and Observation Rocks, Point Success, and much or all of the Willis Wall. Little is known about the volcanic behavior of Mount Rainier as the Pleistocene Epoch transitioned into the Holocene Epoch (40 ka to ~12 ka) due to the difficult nature of dating the rocks that form the highest ridges of Mount Rainier’s summit. However, deposits of Holocene rocks provide a much better record of Mount Rainier’s volcanic activity during the last 12,000 years.
The Holocene (12 ka to present) volcanic record of Mount Rainier is dominated by deposits of tephra, lahar, and glacial origin. Nearly 0.5 km3 of tephra (a general term for rocks and lava ejected into the air during an eruption) was released during explosive eruptions in the Holocene, 30-40% of which was erupted between 7,500 and 6,800 cal yr B.P. These Holocene-age tephra-producing eruptions are also responsible for a number of lahars that originated in MORA and flowed into the surrounding area. The first of these lahars occurred between 7,500 and 6,900 cal yr B.P. when a sandy mass flowed down the ancient course of the White River (now South Prairie Creek), nearly reaching the Puget Sound.

7
The same eruptive episode also produced a clay-rich lahar originating on the south flank of Mount Rainier that flowed along the Paradise and Nisqually River valleys. Around 5,600 cal yr B.P., the largest recorded lahar in MORA, the Osceola Mudflow, occurred when the northeast side of Mount Rainier collapsed in a debris avalanche that quickly turned into a lahar and filled the White River valley with approximately 2.5 km3 of material. Through erosion of the impacted areas downstream, the Osceola Mudflow grew to approximately 4 km3 as it flowed north and west into the Puget Sound. This rapid process of erosion and sediment production had a lasting effect on the White River valley and areas downstream by removing vegetation, shortening the channel of the White River, and depositing large volumes of sediment into the Puget Sound via the Puyallup delta.
The next major eruptive period occurred between ~2,700 to 2,200 cal yr B.P. and was responsible for producing the most voluminous tephra of the Holocene. An eruption around 2,600 cal yr B.P. was responsible for a collapse of hydrothermally altered rock in the west flank of Mount Rainier that produced a clay-rich lahar (Round Pass mudflow) that moved through the upper Puyallup River valley and also through Tacoma Creek into the Nisqually River as far as Ashford. The summit cone of Mount Rainier, Columbia Crest, was likely formed during a tephra-producing eruption sometime after 2,200 cal yr B.P., based on age analyses of tephra deposits throughout MORA.
While lava flows from Mount Rainier ceased around 2,000 cal yr B.P., explosive tephra-producing eruptions continued until about 1,100 cal yr B.P. Even though tephra-producing eruptions at Mount Rainier had ended, the upper west flank failure around A.D. 1502 to 1503 that produced the Electron Mudflow may have been caused by a small eruption or a tectonic earthquake. The Electron Mudflow is the last of the major lahars in Mount Rainier’s history, caused by the failure of hydrothermally altered, clay-rich rocks near Sunset Amphitheater that flowed into the Puyallup River valley as far downstream as Sumner and Puyallup, WA. Lahars continued to originate from Mount Rainier until approximately 300 years ago. Lahar deposits of this age can be found along the current courses of both the White and Nisqually Rivers, including the deposit that underlies the Longmire complex in the southwest part of MORA.
Mount Rainier Today Since its formation, the eruptive behavior of the modern Mount Rainier has been dominated by andesite and low-silica dacite lava flows, with some pyroclastic flows. In its 500 k.y. lifetime, an estimated 140 m3 of magma has been erupted from Mount Rainier. The erosion of much of this material by numerous alpine glaciers and meltwater streams is responsible for the current landscape of this 14,410 ft (4395 m) –tall stratovolcano. Much of the initial glacial erosion of the modern Mount Rainier occurred between 170 and 130 ka during an event called the Hayden Creek glaciation. During the Hayden Creek glaciation, ice caps covered most high-elevation areas in MORA. These ice caps fed valley glaciers that extended as far as 30 miles down the Nisqually River valley from Mount Rainier to Alder Lake outside of Elbe, WA (Crandell and Miller, 1974).
Another period of extensive glaciation at Mount Rainier occurred between 22 and 15 cal yr B.P. The Evans Creek glaciation, as it is known, was responsible for forming numerous cirques around Mount Rainier, many of which are now occupied by Mowich, Crescent, Hidden, Shriner Deadwood, and Blue Lakes. Several periods of minor glacial advances followed the Evans Creek glaciation, the most

8
recent of which was the “Little Ice Age” that lasted from A.D. 1250 to approximately A.D. 1850. During this period, the glaciers of Mount Rainier extended an average of approximately 1 mile farther down valley than they do today, as indicated by moraines deposited during this time. Mount Rainier’s glaciers began to recede in the mid-1800s and, aside from a minor advance during the 1970s and 80s, have been receding ever since. Between 1896 and 2015, glaciers in MORA have receded at a rate of 0.33% per year, for a total area loss of 39.1% (Beason, 2017).
As glaciers in MORA continue to retreat, they pose a threat to Park visitors and infrastructure. The increased instability of retreating glaciers, combined with warming temperatures and increased rainfall, can lead to glacial outburst floods (jökulhlaups) that have the potential to dislodge unstable sediment that has accumulated on the steep slopes of glacier margins, creating debris flows. Numerous glacial outburst flood-induced debris flows have occurred in the drainages of Kautz, Tahoma, Winthrop, and Van Trump Creeks and the Nisqually River since the late 1940s and continue to occur in many watersheds in MORA to this day (Copeland, 2009).
The influx of sediment associated with these debris flows elicits dramatic responses from the river systems into which they flow, including channel aggradation and incision, channel switching and abandonment, and flooding. The focus of this field trip will be the causes of these relatively short-lived geohazard events that occur in MORA and their lasting effects on the Park’s river systems & infrastructure.
Sediment Transport at Mount Rainier (“Goats to Geoducks”) Conceptually, sediment is transported from Mount Rainier to the Puget Lowland through a sequence of glacial and fluvial processes (Czuba et al., 2012b; Figure 2). High on the mountain, glaciers entrain sediment through bedrock erosion and carry colluvium deposited by rockfalls. Englacial sediment is transported by glaciers to lower elevations and deposited in moraines. Debris flows mobilize sediment from moraines as well as from superglacial deposits transporting sediment downstream into the river network. Finally, floods work to transport coarse-grained and fine-grained sediment down main-stem rivers to the Puget Lowland and Puget Sound.

9
Figure 2: Conceptual model of processes affecting sediment delivery from Mount Rainier, Washington (from Czuba et al., 2012b).
On Mount Rainier, large rockfalls and debris avalanches are a dominant source of sediment that ultimately ends up in rivers of the Puget Lowland (Czuba et al., 2012b). The largest rockfall/debris avalanche in the Mount Rainier historical record occurred in December 1963, when 11 million m3 fell during at least seven separate avalanches that traveled a distance of more than 6 km down Emmons Glacier and left a sizeable deposit on the valley floor in front of the glacier terminus (Figure 3). A photograph of the region downslope of the Emmons Glacier terminus taken in the summer following the debris avalanche shows the extent of the debris coverage (Figure 3 (B)), and a photograph taken from a similar vantage point five years later shows the progression of the rockfall-sourced sediment down the White River (Figure 3 (C)). By the summer of 2011, vegetation had grown on much of the 1963 debris-avalanche surface, and fluvial processes appeared to have significantly reworked the deposit and transported a portion downstream (Figure 3 (D)).

10
Figure 3: Images of the headwaters of the White River at the terminus of the Emmons Glacier, Mount Rainier, Washington: (A) July 18, 1959 (published by Sigafoos and Hendricks, 1961; numbered points indicate botanical study locations), (B) 1964 (photo by D.R. Crandell), (C) August 29, 1969 (published by Sigafoos and Hendricks, 1972), and (D) August 14, 2011 (photo by C.S. Magirl). Figure from Czuba et al. (2012b).
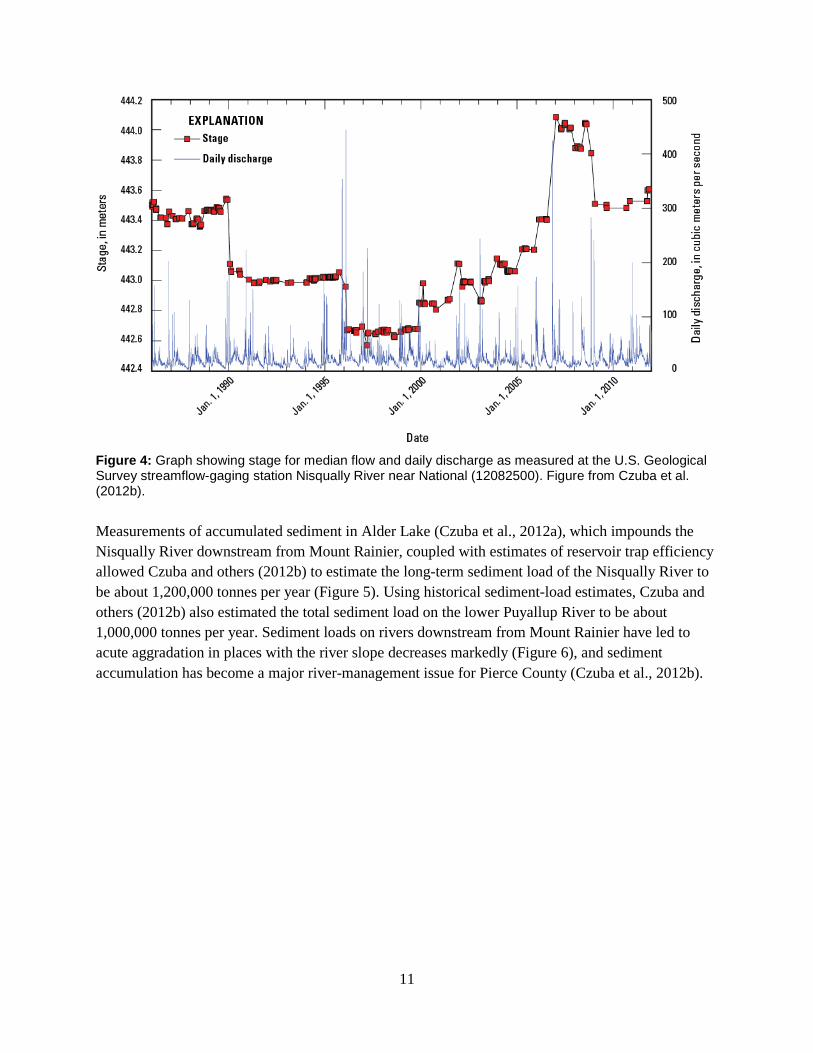
Flood-induced incision or aggradation of a particular river reach is governed by the mass balance of sediment entering and exiting the reach and the resulting storage of bed material. Using gage analysis, Czuba and others (2010) found the Nisqually River near National had experienced significant changes in the stage-discharge relation since 1942. Plotting stage for the median flow for the Nisqually River along with the daily discharge from 1986 to 2011 showed an apparent relation between stage changes recorded at the gage and during peak flow events (Figure 4). During some large peak-flow events (notably, the February 1996 storm), the median-flow stage at the gaging station decreased significantly. In contrast, other peak-flow events (for example, during the November 2006 storm) were associated with a net increase in median-flow stage at the gage. Still other peak-flow events were associated with little or no change in median-flow stage.
11
Figure 4: Graph showing stage for median flow and daily discharge as measured at the U.S. Geological Survey streamflow-gaging station Nisqually River near National (12082500). Figure from Czuba et al. (2012b).
Measurements of accumulated sediment in Alder Lake (Czuba et al., 2012a), which impounds the Nisqually River downstream from Mount Rainier, coupled with estimates of reservoir trap efficiency allowed Czuba and others (2012b) to estimate the long-term sediment load of the Nisqually River to be about 1,200,000 tonnes per year (Figure 5). Using historical sediment-load estimates, Czuba and others (2012b) also estimated the total sediment load on the lower Puyallup River to be about 1,000,000 tonnes per year. Sediment loads on rivers downstream from Mount Rainier have led to acute aggradation in places with the river slope decreases markedly (Figure 6), and sediment accumulation has become a major river-management issue for Pierce County (Czuba et al., 2012b).

12
Figure 5: Map of Mount Rainier, Washington, showing where potential sediment-management actions would be most effective based on geomorphic conditions that suggest sediment accumulates naturally, including both long- and mid-term transient-storage reaches. Also shown are best estimates for long-term sediment-load values for rivers in the study (from Czuba et al., 2012b).

13
Figure 6: Map showing change in average elevation at about 100 cross section between 1984 and 2009 in the Puyallup, White, and Carbon Rivers, western Washington. Aggradation is most pronounced in the White and Puyallup Rivers. Figure modified from Czuba et al. (2012a).

14
Imminent Threats Program The Imminent Threats Program has evolved out of the need for park administrators to adequately protect the infrastructure of Mount Rainier National Park despite limited funding and in the face of predictions that call for an increase in the frequency and magnitude of destructive geologic events due to climate change. The mission of the imminent threats program is to gain a detailed understanding of the braided river systems that flow off the slopes of Mount Rainier. The complex interactions between water, sediment, and gravity are conceptually summarized by Lanes Balance (Figure 7). A hazard assessment by the Imminent Threats program (Figure 8) is completed in three iterative stages; a geomorphic assessment to understand the processes influencing geologic hazards, creating a suite of engineered solutions designed to mitigate or reduce the given hazard, and presenting the solutions to park administrators and overseeing the construction of the chosen protection measures.
Pilot Program – The West Side Road The first site to undergo a full evaluation following the three ring model was along a 700 foot section of the Westside Road. The first phase began in 2014 and involved a comprehensive literature review of prior geomorphic research completed in the Tahoma Creek watershed and field investigations to assess the current conditions at the proposed construction site (Figure 9). The following summer another team of geologists continued to monitor the site and began developing a suite of engineered solutions to mitigate the damage caused by numerous flooding and debris flow events.
Another round of geomorphic assessment was completed after a series of debris flows and high water events rerouted the main flow of Tahoma Creek 500 feet (~154 m) to the west of the historic channel (Figure 10).
Figure 7: A conceptual model proposed by Lane (1955) and Rosgen (1996) that describes four factors that influence sediment transport in fluvial systems. The principle factors that may tip the scales right or left are: stream slope, discharge, sediment size, and sediment load. A fifth factor particularly relevant in the Pacific Northwest region is the effects of large woody debris.
Figure 8: The three ring hazard model utilized by the imminent threats program at Mount Rainier

15
Figure 9: Products from a geomorphic assessment along Tahoma Creek completed in 2014. (Left) Delineates the east-west cross valley gradient along the bottom of Tahoma Creek. (Right) Denotes the height of the valley bottom relative to the Westside Road. These figures indicate that the lower portions of the Westside Road are highly susceptible to flooding given the valley geometry of Tahoma creek in conjunction with the destruction of old growth forest in the active floodplain.
Finally during the summer of 2016, construction was completed on a flood protection design that utilized wood and rock (Figure 11). The Large Woody Structure (LWS) is designed to mimic naturally formed log jams and was designed based on standard engineering principles. After the installation of the LWS was completed, a second phase of construction took place using phyto-engineering concepts and the planting of pioneer species such as the Sitka Willow in order to revive the riparian gallery forest along Tahoma Creek's edge. To date, this project is unique in Mount Rainier as it is the first to combine rock, wood, and live plants in an effort to create low-cost, effective solutions to reduce the damages that result from geologic events.
Figure 10: The path of Tahoma Creek active channel after the stream bed was rearranged by a series of debris flows and subsequent high water events during the winter of 2015/2016

16
Figure 11: Cross section view of the flood protection constructed along a portion of the Westside Road in 2016. Discrete bundles comprised of 4-5 logs with attached root wads were dug into the streambed margins and covered with ~20 of rock ballast. This coupling of woody debris and rock is designed to increase roughness along the toe of the road thereby dissipating the erosive power of a high water event. Reducing the velocity of streamflow along the banks should facilitate deposition of sediment and accumulate additional pieces of large woody debris, making the structure more stable over time.

17
Stop 1 – West Side Road and Tahoma Creek
Figure 12: Location map for stop 1 along the West Side Road.

18
The West Side Road is located on the southwest corner of MORA. The road travels three miles from the junction of the Nisqually-Paradise Road to the parking area at Dry Creek. From there, the abandoned road bed turns into a visitor-accessible trail that travels six miles to Round Pass. A trail continues north from Round Pass to the North Puyallup River.
Early park plans envisioned a road that would traverse around the Mount Rainier volcano within the national park. The West Side Road was initially one of these legs that were imaged to connect the Nisqually-Paradise Road on the south to the Mowich Road on the northwest side of the park. As such, the West Side Road’s construction began in 1926 (Rybolt, 2013). By 1928, almost nine miles was completed to Round Pass, and this section of roadway was opened in 1930 to visitor access. Construction reached Klapatche Point near Mile Post 13 by the end of summer in 1931. The park’s plan was to build the road from the North Puyallup River to Mowich Lake, but work never resumed on this section after 1935. The road remained open to the North Puyallup River until the early 1970s at which time the last three miles were closed and converted to a trail beyond Klapatche Point (Rybolt, 2013).
Figure 13: Aerial images from 1960, 2006 and 2015 showing loss of riparian habitat by incursion of Tahoma Creek during successive debris flows from 1967-2015.
Starting in the late 1960s, a series of destructive debris flows from the South Tahoma Glacier surged down Tahoma Creek, which destroyed a campground/picnic area, a popular trailhead, and damaged a significant section of the West Side Road. Debris flow and flood events have continued to impact the lower reaches of the Westside Road prompting the Park Service to close the road indefinitely to vehicular traffic beginning in 1993. While the road is remains open to pedestrian and bicycle traffic

19
the limited access along the Westside Road precludes many visitors from reaching nearly one-quarter of the park, including six major trailheads, fourteen hiking destinations, and a memorial honoring US Marines.
The impact of 30 debris flows (Table 2) and flood events in the Tahoma Creek watershed have been two-fold; Large swaths of old growth forest along the valley bottom have been destroyed (Figure 13) leaving “ghost forests” of dead standing trees. The huge influx of sediment deposited in the lower reaches of Tahoma Creek has aggraded the river bed by several meters. The removal of confining vegetation and the raising of the river channel above the surrounding floodplain has destabilized the active stream channel which is currently free to flow along the path of least resistance. In the absence of confining vegetation along the banks, the path of the active channel in the lower reaches of Tahoma Creek is governed by a cross-valley gradient that runs east to west.
Table 2: Dates of known debris flows on Tahoma Creek from various sources. “Dry” and “Wet” refer to debris flows that generated during dry weather or during rain storms.
Number Year Date Day of Year Dry Wet Weather/Observation Notes Source 1 1967 1967-08-29 241 Warm and Dry, 13:00-13:30, emerged from
an icefall at 7,500 ft on South Tahoma Glacier. Washed away a footbridge on Tahoma Creek 1.2 mi DS of glacier
A B F
2 1967 1967-08-31 243 Warm and Dry, 20:40-21:30. Impacted then-closed Tahoma Creek campground
A B G
3 1967 1967-09-15 258 Warm and Dry, unknown time B 4 1968 1968-06-29 181 Possibly other flows as well, not recorded
well B
? 1968 ? ? ? A number of flows were described by Crandell (1971) occurring “from time to time” in 1968. Unknown exact count.
B
5 1970 1970-08-21 233 Warm and Dry, unknown time B G 6 1971 1971-08-10 222 Zero rain in month previous to flood,
damaged trees C
7 1979 1979-08-01 ~213 Date estimated, stated July-August 1979. Dry weather with brief periods of light rain.
C
8 1980 1980-09-21 265 ? From report: “A minor glacial outburst flood swept down Tahoma Creek…putting some mud up into a picnic area along the West Side Road and causing a large gravel accumulation behind the Tahoma Creek road bridge.”
D
9 1981 1981-08-15 ~227 Date estimated. <250 mm rain for month, 2-3 m wall of water seen by park personnel
C
10a 1986 1986-10-26 299 Cool & Rainy, recorded at 13:54-14:12 on Longmire seismograph
C E F D I
11b 1987 1987-06-29 180 Warm & Dry, recorded at 14:08-14:30 on Longmire seismograph
C E F D
12b 1987 1987-08-28 240 Warm & Dry, recorded at 17:04-17:13 on Longmire seismograph
C E F D
13b 1987 1987-08-31 243 Warm & Dry, recorded at 20:21-20:37 on Longmire seismograph
C E F D

20
Table 2 (continued): Dates of known debris flows on Tahoma Creek from various sources. “Dry” and “Wet” refer to debris flows that generated during dry weather or during rain storms.
Number Year Date Day of Year Dry Wet Weather/Observation Notes Source 14b 1987 1987-09-23 266 Warm & Dry, 1 recorded at 8:30-19:00 on
Longmire seismograph. C E F
D 15 1988 1988-07-14 196 Cool & Dizzily, recorded at 13:46-14:00 on
Longmire seismograph E I
16 1988 1988-07-26 208 Warm & Dry, recorded at 15:48-16:01 on Longmire seismograph
E
17 1988 1988-10-16 290 Cool & Very Rainy, recorded at 05:30-06:02 on Longmire seismograph
E F I
18 1988 1988-10-22 296 ? From report: “10/22/88 debris flow on Tahoma Creek left one million dollars’ worth of damage to the Tahoma Creek Bridge, Sunshine Point Campground dike, West Side Road … and Tahoma Creek Trail.” Not noted in other references. May be 10-16 event?
D
19 1989 1989-09-23 266 Hot & Dry E 20 1989 1989-11-09 313 Cool & Very Rainy, recorded at 05:00-
06:02 on Longmire seismograph E I
21 1990 1990-08-04 216 Hot & Dry E 22 1990 1990-10-03 276 Cool & Heavy Rain, 10 debris flow pulses
with 10-32 min duration over 8.5 hours E I
23 1991 1991-11-05 308 Cool & Very Rainy, ~1 hour flow. E I 24c 1992 1992-09-08 252 Cool & Rainy E I 25c 1992 1992-09-20 264 Cool & Rainy E I 26 2003 2003-09-12 255 ? Possibly between 02:40-03:40 UTC from
RER Sesimic. Warm Weather? H
27 2005 2005-09-29 272 15.3 cm of rain fall in 48 hours. H I 28 2006 2006-11-06 310 45.7 cm of rain in 36 hours, produced
multiple debris flows park-wide (See Copeland (2010) for list).
H
29 2015 2015-08-13 225 4 separate sequences: 09:49-10:01, 10:16-11:02, 11:21-11:43 (largest) and 12:26-12:43 PDT on RER seismic
J
30 2015 2015-09-12 255 1 sequence: 17:28-17:42 PDT on RER J
Sources: (A) Richardson (1968); (B) Crandell (1971); (C) Driedger and Fountain (1989); (D) Samora (1991); (E) Walder and Driedger (1994); (F) Scott et al. (1995); (G) Molenaar (2005); (H) Copeland (2009); (I) Legg (2014); (J) Beason (In Prep). a Copeland mentions two debris flows in 1986, but Walder and Driedger (1994) only mention one. b Samora (1991) reports that “five debris flows” occurred on Tahoma Creek, but all other references only mention four. c Copeland mentions three debris flows in 1992, but Walder and Driedger (1994) only mention two
On Thursday, May 15, 2014 at about 10:30 AM, approximately 8,500 cubic feet of Oligocene-age (~30 ma) Ohanapecosh Formation andesite slid off the east face of Mount Wow at about the 4,000-foot level. The rock fall traveled approximately one-quarter-mile down a steep talus and scree slope, and deposited large boulders on the West Side Road parking area at the 2,800-foot level. An NPS volunteer further up the West Side Road heard the rock fall, allowing the timing of the event to be determined. A visitor’s vehicle was totaled by a large rock and the parking area sustained impact crater damage from the boulders (Figure 14). No eyewitnesses directly observed the event itself and there were no injuries sustained. The largest of the craters in the road/parking area was

21
approximately 8 feet wide by 3 feet deep. Numerous boulders were deposited on the scree field between the source and deposition areas, including a boulder that is roughly 30 feet wide by 20 feet long by 5 feet high. About 45 boulders with a diameter greater than 1 foot reached the parking area, with an estimated combined volume of 4,345 cubic feet. It is estimated that at least this much additional material stopped short of the parking area and is deposited on the scree field above the road. Therefore, we estimate the size of the rock fall to be approximately 8,500 cubic feet (315 cubic yards; or 31.5 dump trucks worth of material).
Figure 14: View facing south of the West Side Road parking area following 2014 Mount Wow rockfall, including damage to the roadway, an NPS gate and a visitor vehicle (Photo: NPS/Scott Beason)
On August 13, 2015, during a warm, dry day, four separate debris flow sequences were identified via the Emerald Ridge seismic station. These debris flows began as outburst floods from the South Tahoma Glacier, and quickly “bulked up” in pro-glacial sediment downslope of the glacier terminus. The event was extremely well documented by seismic and acoustic monitors, park staff and visitors, satellite stereo-pair imagery, and by stream gages outside of the park. An acoustic soundscape monitor placed near the Tahoma Creek Trailhead on the West Side Road accurately recorded river noise during the event, including the passage of each debris flow surge. A park visitor also videoed the passage of the third debris flow with his cellphone, literally meters from his feet.
A geomorphic investigation of the area via helicopter on August 13 showed the source of the event at the 2,070 m (6,800 ft) terminus of the South Tahoma Glacier. The outlet stream from the glacier

22
shifted approximately 150 m (500 ft) to the South, incising into pro-glacial sediment. Peak flow velocities were recorded by measuring super-elevation of debris on intact trees in the lower reaches of the debris flow deposits and indicated flows of between 4-6 m/s (14-20 ft/s) (Figure 15). Throughout the remainder of August 13 and for the next few days, stream flows remained high on Tahoma Creek.
Figure 15: Debris flow levee on the Tahoma Creek Trail as result of the August 13, 2015 South Tahoma Glacier outburst flood and debris flow (NPS/Mitch Haynes photo).
After approximately 1 month of relatively normal stream conditions, during a warm and dry September 12, another debris flow occurred from the South Tahoma Glacier. This debris flow was well documented on the Emerald Ridge seismograph, but very few, if any, park staff and visitors documented the event. Stream flows were noted as running high and sediment-rich at the Nisqually-Paradise Road Bridge over Tahoma Creek for approximately 2 days following the event. Field investigations over the next few weeks indicated that this debris flow was much larger than all of the debris flows that occurred on August 13.
Fortunately, no injuries were reported to park staff or visitors during the events, and only minor damage occurred to park infrastructure. Other debris flows have occurred sporadically throughout the West Side Road area, especially in Dry Creek, a small tributary of Tahoma Creek (Figure 16).

23
Geomorphic evidence indicates that a large field of debris-covered stagnant ice exists downslope of the current terminus of South Tahoma Glacier. The zone is physically cut off from the upper ice by a bedrock ledge outcropping. This debris-rich stagnant ice can store up water and release the water catastrophically, though, the exact mechanisms through which this occurs are not well known (Figure 17). As the glacier continues to retreat, it is likely that further bedrock ledges may be exposed and cutoff lower parts of the glacier. This would lead to periods of increased hydrologic events from the glacier until the area stabilizes.
Figure 16: Dry Creek debris flow deposit as viewed on October 10, 2015. Photo taken facing south, toward public road closure (Scott Beason/NPS photo).
It is likely that the park is now entering a period of increased sediment production from outburst floods and debris flows from the South Tahoma Glacier. This behavior could be potentially seen in other small glaciers on Mount Rainier. Climate forcing may be an influence in these events and predicted climate change in the region will likely enhance the outburst flood and debris-flow forming morphology of the basin.

24
Figure 17: Conceptual model for storage and release of water as outburst floods by stagnant ice during glacial thinning/retreat and evolution of the South Tahoma Glacier. Timestamp 2b represents the approximate current configuration of the South Tahoma Glacier. (Modified from Beason, in prep)

25
Stop 2 – Kautz Creek Picnic Area
Figure 18: Location map for Stop 2 at Kautz Creek Picnic Area

26
Figure 19: Oblique aerial photo of the 1947 Kautz Creek mudflow (Modified from Burtchard et al., 2008).

27
The Kautz Creek Picnic area is a day-use parking lot and trailhead at approximately milepost 3.5 on the Nisqually-Paradise Road. The area is named for Kautz Creek, with originates from the Kautz Glacier, and named for August Kautz, who is sometimes credited for the first ascent of Mount Rainier. Like the Nisqually and Tahoma Glaciers, the Kautz Glacier originates at the summit of Mount Rainier and flows down to the terminus at approximately 6,800 feet (2,070 meters). The Kautz Glacier gets contributions from the Success Glacier, a small cirque glacier.
Looking downstream from the Kautz creek bridge there are several dead standing trees. These trees were killed in October of 1947 when a debris flow was initiated by intense rainfall covering the Nisqually road with 20 feet (6 m) of debris and damning the entire Nisqually River (Figure 19). Although debris flows trigged by heavy rainfall are common within the park the 1947 event was exceptionally large. During a reconnaissance to the terminus of the Kautz glacier after the storm, Crandell (1971) noted that many large blocks of ice had been calved off the terminus over the course of the storm and suggested that an additional input of water had been released from the glacier terminus and could account the for size of the 1947 debris flow. These sudden outbursts of glacial melt (jökullhlaup) have been ascribed to the retreat of alpine glaciers since the end of the ‘Little Ice Age’ maximum. The mechanics and timing of jökullhlaups are an ongoing area of research in Mount Rainier.
Figure 20: Floodwaters overtopping the Kautz Creek culverts (NPS Photo).

28
During the historic flood event of 2006 Kautz Creek abandoned the historic channel and began carving a new course along the eastern margin of the 1947 debris fan; the ‘new’ Kautz creek crosses the Nisqually road 0.2 miles (0.3 km) east of the Kautz Bridge. Twin culverts were installed to accommodate the new channel but the efficacy of these culverts is questionable as subsequent high water events have overtopped the Nisqually Road when the culverts became clogged with sediment and large woody debris (Figure 20; Figure 21).
Figure 21: Looking upstream at the twin culverts located 0.2 miles east of the Kautz Creek bridge.
North of the old Kautz Creek channel bridge about 100 m along the west bank of the former Kautz Creek (46.73747, -121.85666), deposits of the 1947 debris flow and of previous lahars are exposed (Figure 22) (J. Vallance, personal communication). The neutral gray deposit at the top of the section is the 1947 debris flow. Beneath it are two Mount St. Helens pumice falls, Wn (A.D. 1479) and Yn (3,700 cal ybp). The lower part of the sequence includes the Reflection Lakes lahar, Mazama ash, Van Trump lahar (10,050 cal ybp), and another lahar. The Van Trump lahar was emplaced during the Sunrise eruptive period and is the oldest of three avalanche-induced lahars found on the south flank of Mount Rainier.

29
Figure 22: Lahar exposure near Kautz Creek viewpoint (Photo courtesy of Jim Vallance, USGS/CVO).

30
Stop 3 – Longmire Community Building
Figure 23: Location map for Stop 3 at Longmire

31
Longmire is the name of one of the two primary year-round visitor use and administrative areas on the southwest side of MORA. This area was formerly the park’s main administration area until the development of the Tahoma Woods administration area, west of Ashford. The Longmire area has been used as a developed visitor destination since the late 1800s. The presence of springs with temperatures up to 80°F in the Longmire Meadow (within the “Trail of Shadows,” Figure 23) lead to the establishment of visitor facilities once the road to the park was established (Pringle, 2008).
Construction on the Longmire road was started by James Longmire beginning in 1883, and a rough road was completed in 1885 (Burtchard et al., 2008). Final road construction was completed in 1907. This combined with passenger rail service to Ashford in early 1900s helped bring people into the park and Longmire springs development. This area was established as a historic district in 1991 and later named as a contributing element to the park’s National Historic Landmark District in 1997.
The Longmire area (including the Longmire Meadow) as we see it today is built upon an abandoned river channel and lahar floodplain that was formed in approximately 1686 (Pringle, 2008). Smaller debris flows are present from the 1860s on the Longmire Meadow. Large river boulders and clasts either exposed at the surface or just below the surface throughout the Longmire area attest to the debris flow and lahar activity that has occurred here.
The Longmire area has had a long history of damage to infrastructure due to flooding and outburst floods from the Nisqually Glacier. Damage to the Longmire Campground and roads in the Longmire area, including a 150-foot washout 0.25 miles below Longmire, occurred during a storm on October 25, 1955 when 4 inches (96 mm) of rain fell in a 32-hour period (Samora, 1991).
Figure 24: Longmire Maintenance Area during November 1959 flood (Modified from Burtchard et al., 2008)

32
Four years later, a storm on November 21-22, 1959 caused extensive damage to roads, trails and bridges throughout the park. The Nisqually River overflowed its banks at Longmire and water ran through the utility area and down the main entrance road leading to the then park headquarters (Samora, 1991; Figure 24). Extensive damage was done to the roads above and below Longmire as well. Flooding in 2003 also caused some damage to the roads and infrastructure in this area.
The most recent and most extensive damage occurred as part of an atmospheric river flood event that occurred between November 5-7, 2006. Nearly 18 inches of rain fell in 36 hours during the storm. Additionally, a high freezing level and low antecedent snow pack lead to debris flow generation and flooding in all areas of the park. High winds also damaged exposed infrastructure, like fire lookouts. The Nisqually River responded to these hydrologic inputs and caused extensive damage to park infrastructure in the Longmire Area. The recently-constructed emergency operations center nearly was lost when a river berm and parking area were eroded by the Nisqually River (Figure 25). All told, an estimated $36 million in damage was incurred to the park during this storm. This damage, as well as other major damage to park roads and infrastructure, lead to the longest single closure in the park’s history (November 7, 2006 to April 27, 2007).
Figure 25: Damage to the park infrastructure near the recently-constructed Emergency Operations Center at Longmire during the November 2006 flood (National Park Service Photo).

33
One of the more unusual features of Longmire is that most of the facilities in the Longmire area are below the elevation of the river (one has to walk uphill to get to the river). In some places, like the National Park Inn, this difference is over 40 feet (12 meters). This floodplain disequilibrium is result of the 1686 channel abandonment (in the area of the Longmire Meadow) and restablishment in the current river channel. To help alleviate worries about future flooding and to prevent situations like those that occurred in the 1950s, the park constructed a buried concrete and large rock clast flood wall in 2007 in the footprint of the levee that separate the Nisqually River channel from the Longmire campground (Figure 26). This flood wall is built below the elevation of the river or tied into bedrock where exposed.
Figure 26: Construction of a flood wall in 2007 to help protect the Longmire administrative area from floods on the Nisqually River (Scott Beason/NPS Photo).
The Nisqually River flows through a relatively confined stretch upstream of Longmire with Tertiary-age intrusive bedrock exposures on both the right and left bank (Pringle, 2008). After flowing under the Longmire suspension bridge, the river loses its bedrock confinement and widens out. Channel widths here vary from 40 meters in the upstream zone to around 100 meters at the downstream end.
Ten river cross sections are routinely measured at Longmire in order to see trends in bed topography. Upstream sediment delivery and sediment routing through the Longmire reach cause large variations in the sediment-to-discharge balance of the Nisqually River at this location (Beason et al., 2015). Aggradation and incision rates here are much more variable year-to-year compared to other locations
34
in the park. Aggradation was observed in 2005-2006, 2009-2010, and 2011-2012 ranging from 0.05 to 0.14 m yr-1 (0.16 - 0.46 ft yr-1). Incision occurred in the reach between 1997-2005, 2006-2008, and 2010-2011 ranging between 0.00 to -0.04 m yr-1 (0 - 0.13 ft yr-1). Overall, the Longmire reach has accumulated 2,185 m3 (77,170 ft3) of sediment from 1997 to 2012. However, most areas in the Longmire reach have incised since 2006, with the notable exception of Longmire cross section 7, which has showed a rather large increase in sediment - likely relicts from dredging efforts upstream of the line. Longmire is located downstream of areas that have seen large increases in sediment delivery and as this sediment sluices downstream, it is likely that the aggradation rate here will increase in the coming years to decades, depending on timing and magnitude of large floods that move the sediment downstream.
Longmire is one of two locations in the park that currently have a real-time stream gage (Real-time data can be viewed at: http://waterdata.morageology.com/station.php?g=4B300A32 ). This gage records stage height, rainfall, stream turbidity, air and water temperatures, electrical conductivity, and other variables. Another stream gage operates on the White River at the junction of the White River Campground Road and Sunrise Road and records similar parameters (Real-time data can be viewed at: http://waterdata.morageology.com/station.php?g=4B3004E0 ).
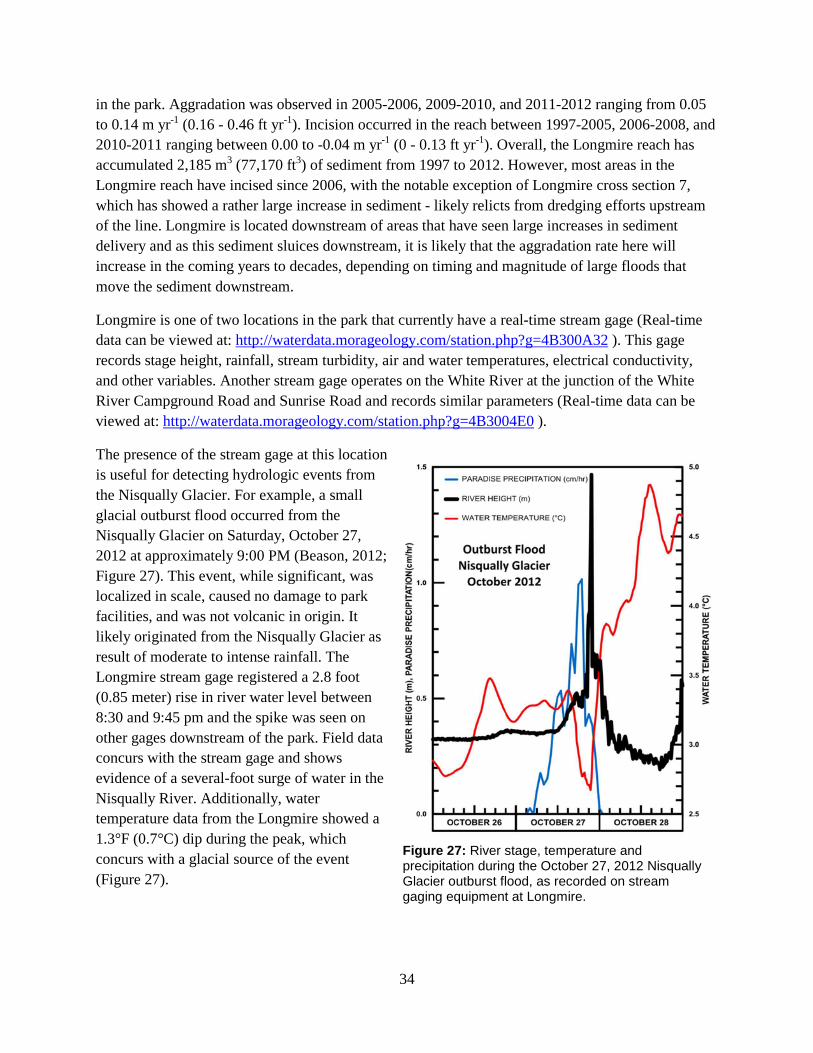
The presence of the stream gage at this location is useful for detecting hydrologic events from the Nisqually Glacier. For example, a small glacial outburst flood occurred from the Nisqually Glacier on Saturday, October 27, 2012 at approximately 9:00 PM (Beason, 2012; Figure 27). This event, while significant, was localized in scale, caused no damage to park facilities, and was not volcanic in origin. It likely originated from the Nisqually Glacier as result of moderate to intense rainfall. The Longmire stream gage registered a 2.8 foot (0.85 meter) rise in river water level between 8:30 and 9:45 pm and the spike was seen on other gages downstream of the park. Field data concurs with the stream gage and shows evidence of a several-foot surge of water in the Nisqually River. Additionally, water temperature data from the Longmire showed a 1.3°F (0.7°C) dip during the peak, which concurs with a glacial source of the event (Figure 27).
Figure 27: River stage, temperature and precipitation during the October 27, 2012 Nisqually Glacier outburst flood, as recorded on stream gaging equipment at Longmire.

35
Stop 4 – Lower Van Trump Hairpin
Figure 28: Location map for Stop 4 at Lower Van Trump Hairpin

36
Lower Van Trump Hairpin is the moniker given to a curve located at mile 9.3 (kilometer 15.1) along Paradise Road, the main road through MORA. This curve is located at the confluence of Van Trump Creek and the Nisqually River, just upstream from Cougar Rock Campground and Picnic Area.
The area of interest at Lower Van Trump Hairpin is composed of fluvial sediment overlain by recent debris flow and landside deposits. The combined Nisqually River/Van Trump Creek drainage basins have an area of 9.9 mi2 (25.7 km2). The drainage basins include the Nisqually, Wilson, and Van Trump Glaciers, as well as the Muir Snowfield.
Due to its location along Paradise Road in MORA, Lower Van Trump Hairpin is a major transportation junction that sees an extraordinary amount of traffic annually. Lower Van Trump Hairpin is also adjacent to Cougar Rock campground, one of the most popular campgrounds in MORA, and a number of nearby hiking trails.
The Lower Van Trump Hairpin area has been subject to numerous debris flows. Between 2001 and 2006, four separate debris flows have deposited ~375,000 m3 of material in the active channel of the Nisqually River (Beason et al., 2014; Figure 29). An influx of sediment from a 2005 debris flow caused widespread aggradation in the active channel of the Nisqually River. This debris flow deposit pinned the Nisqually River into a narrow channel against its left bank, adjacent to a cliff base. In 2008, a storm with an approximately 14-year recurrence interval increased flows in the Nisqually River and initiated a landslide across the channel from the aforementioned debris flow deposit (Figure 30). The resulting ~20,000 m3 of sediment deposited into the Nisqually blocked the active channel and was capable of damming the river for a short time (Figure 31). The Nisqually River soon breached this dam, flowing in a narrow channel before successively widening as stream velocities and shear stresses increased.
Figure 29: Van Trump Creek flooding into the Nisqually during the September 29, 2005 debris flow. Photo taken during the waning stages of the debris flow.

37
Figure 30: LiDAR hillshade comparison between 2008 and 2012 at Lower Van Trump Hairpin, clearly showing the 2008 landslide scar and deposit.

38
Figure 31: LiDAR difference map (2012 surface minus 2008 surface) showing distinct zones of aggradation and incision. Zone (A) is the 2001-2006 debris flow fan; (B) 2008 landslide scar; (C) 2008 landslide deposit; (D) Aggradation upstream of landslide deposit due to blockage of channel and pooling of sediment-laden water; (E) Incision and headcutting through and downstream of constriction provided by landslide deposit; and (F) Deposition downstream of headcut likely caused by eddying of water.
The 2005 debris flow had the unexpected benefit of moving the river away from Paradise Road, decreasing the short-term risk of the road flooding. However, incision into the debris flow deposit will increase hazards to the road as sediment is mobilized downstream and the river migrates back toward the road. As this wave of sediment works its way downstream, it also poses a danger to Park infrastructure along lower reaches of the Nisqually (Longmire, Nisqually Entrance, etc.).

39
Because of the large sediment delivery in this location, channel equilibrium is unlikely to be exhibited here for decades. Reach-weighted aggradation was strongly observed here in 2005-2006 as result of a 2005 debris flow that deposited an impressive 15,500 m3 (547,500 ft3) of material, an aggradation rate corresponding to 1.55 m (5.09 ft) in a one year period. Some incision has occurred in this area, namely in the intervals 2006-2008 and 2010-2011, and ranging between -0.03 to -0.18 m yr-1 (-0.10 to -0.59 ft yr-1). However, the periods 2008-2009, 2009-2010, and 2011-2012 have seen aggradation ranging from 0.01 to 0.12 m yr-1 (0.03 - 0.39 ft yr-1). Overall, 13,130 m3 (463,700 ft3) of sediment have accumulated in this area since 2005. It is anticipated that, without further sediment inputs, the Nisqually River will continually erode away at these deposits, mobilizing them downstream. However, future debris flow deposition here is very likely, so this area is not expected to return to equilibrium in the near future.
Figure 32: Boulder levees (left) and battered tree trunks (right) are evidence of the 2005 Van Trump debris flow. Photo taken facing downstream.
While it may seem like building a road in this location was an unwise decision, one must condsider the conditions in which the road was built. This section of roadway was plotted and laid out in the early 1900s by Eugene Ricksecker (Catton, 1996). Beason (2007) found that the riverbed adjacent to the Lower Van Trump hairpin had aggraded 12 meters (39 feet) as result of river aggradation and debris flow fan deposition between 1910-2006, most of which has occurred in the last few decades. It is likely that the look of this area has changed remarkably in the last 100 years and that the road would not be constructed in its current layout if the early park planners were working with this current geomorphic configuration.
40
Stop 5 – Paradise
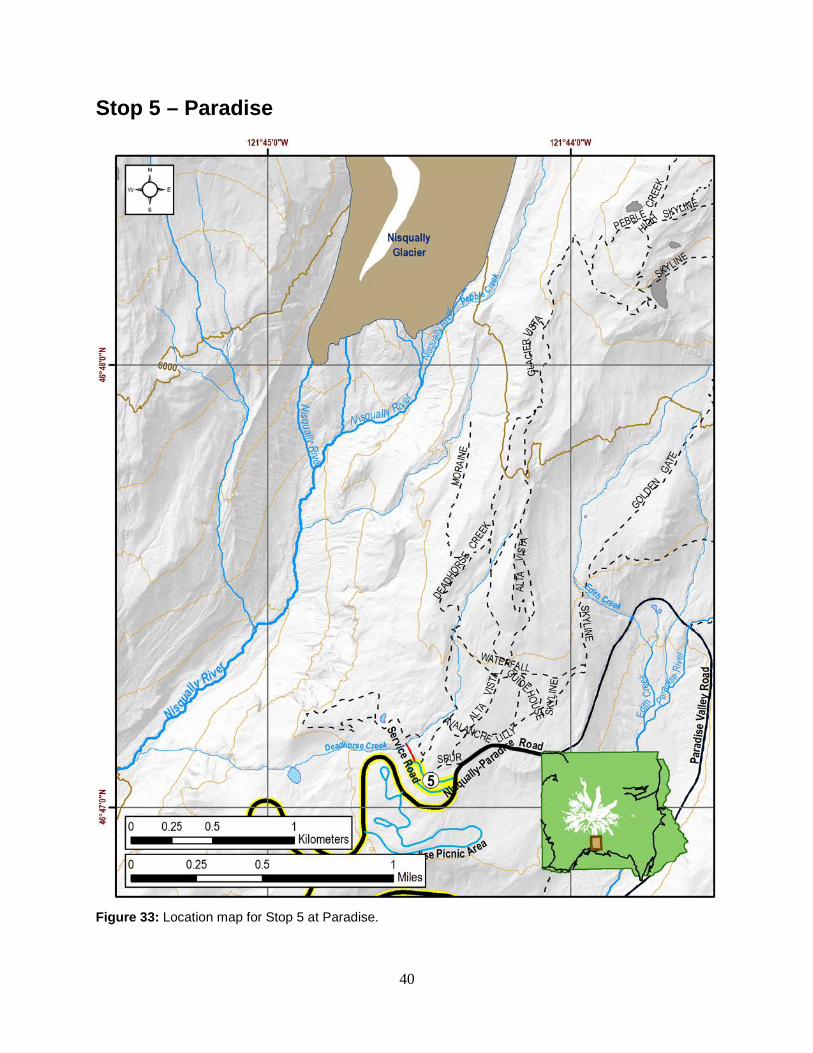
Figure 33: Location map for Stop 5 at Paradise.

41
Paradise is the name of a year-round visitor destination located at the 5,400 foot (1,645 meter) elevation level on the south side of Mount Rainier. This area is home to the Henry M. Jackson Visitor Center and Paradise Inn, a hotel that operates during the busy summer months. Paradise is one of the most popular destinations in the park – in 2000, over 62% of the 1.3 million visitors to the park went to Paradise. It is also home to one of the more spectacular subalpine wildflower meadows in the park. The name “Paradise” was established by Virinda Longmire in the summer of 1885, when she viewed the subalpine wildflowers and stated “Oh, what a paradise!”
The use of the Paradise area has changed greatly in the last century. In 1931, a golf course was built in the Paradise Valley and a ski rope tow was installed in 1936. These were soon abandoned, but the effects to the subalpine environment are still viewable today. The Mission 66 Henry M. Jackson Visitor Center (constructed in 1966) was replaced in 2008 with the current Jackson Visitor Center (the old visitor center was demolished in 2009).
Paradise is one of the snowiest places on Earth where snowfall is measured regularly. 1,122 inches (93.5 feet; 28.5 meters) of snow fell during the winter of 1971-1972, setting a world record that was later eclipsed by snowfall at Mount Baker.
From the Paradise area, on a clear day, one can see the Mount Rainier volcano, the Tatoosh Range to the south, the Nisqually River to the southeast, and the neighboring Cascade volcanoes, including Mount Adams (40 mi [64 km] away), Mount St. Helens (46 mi [74 km] away), and Mount Hood in Oregon (95 mi [152 km] away). The Tatoosh are an east-to-west range of 24 prominent named peaks south of Paradise on the southern side of MORA. These peaks are made up of granodiorite of the Tatoosh Pluton, with radiometric ages that range from 26 to 14 million years, suggesting that it is predominantly of Miocene age (Pringle, 2008).
Our trip visits the 2.2 mi (3.5 km) Nisqually Vista Loop, accessed from the Lower Parking Lot at Paradise. Other hikes lead from the Paradise area, including the 3.7 mile (6 km) round trip hike to Glacier Vista, which is a spectacular way to see the Nisqually and Wilson Glaciers, neoglacial moraines, lava flows, and block-and-ash deposits. From the viewpoints at the end of the Nisqually Vista trail, the terminus of the Nisqually Glacier is approximately 1.6 miles away (as the bird flies; 2.5 km) and the summit of Mount Rainier is 6.7 miles (10.7 km) to the north.
Figure 34: View of the Nisqually Glacier terminus from the Nisqually Vista trail in 1974 (top) and 2004 (bottom). The glacier retreated about 1000 ft (300 m) during this timeframe.

42
Figure 35: Terminus position of the Nisqually Glacier, 1840-2015. The current mapped glacier terminus is as of 2015 (Beason, 2017).
The Nisqually Glacier is arguably one of the most studied glaciers in the world, with a history of exploration since the early 1900s. Many of the historic study efforts continue to this day. At present,

43
glacial monitoring at MORA (including the Nisqually Glacier) encompasses the following study efforts: (1) Mass balance; (2) Surface elevations; (3) Volume; (4) Surface area extents; (5) Velocity studies; and (6) Repeat photography. Mass balance studies have been conducted on the Nisqually and Emmons Glaciers at MORA since 2003 as part of the North Coast and Cascades Network Inventory and Monitoring Network (NCCN I&M) as one of a dozen major vital signs for region parks. Surface elevation studies have been conducted almost yearly along three transects since the 1930s. These surveys occur in the fall each year prior to snow falling; the 2017 survey was completed on October 5, 2017. Volume estimation has been completed by a variety of authors and is a subject of a poster that is to be presented at the Geological Society of America Annual Meeting in Seattle (George and Beason, 2017). Surface area extents are relatively straightforward and east to obtain for a large area based on aerial imagery; the latest park-wide survey was conducted in 2015 (Beason, 2017). Velocity studies have been completed by surveying individual rocks on the glacier over weeks to months to establish vectors showing glacial movement. Repeat photography from known points shows dramatic changes to the glacial extents in a visual manner.
With the exception between 1961 and 1986, the Nisqually Glacier has been in a continual retreat (Figure 34; Figure 35). Between 1840 and 2015, the Nisqually has retreated approximately 2.5 miles (4 km) to its current position. During this time, the elevation of the terminus has increased from approximately 3,800 feet (1,160 meters) to 5,500 feet (1,680 meters). Between June, 2006 and May, 2014, the Nisqually Glacier retreated 970 feet (296 meters), an average recession of 124 ft × yr-1 (38 m × yr-1). Stated another way, during this time period, the Nisqually Glacier was retreating about 3.3 feet (1 meter) every 10 days.
During the summer/fall of 2011 and 2012, numerous rocks on the Nisqually Glacier were surveyed weekly to calculate a surficial velocity field of the lower 1 km2 (0.4 mi2) of the glacier (Walkup et al., 2013; Figure 36). Between 2011 and 2012, observed velocities in the upper portions of the study area accelerated while the lower portions of the glacier slowed or remained the same. Shortly after the on-glacier study concluded, a small glacial outburst flood was released from the glacier during a minor rain event (this event was mentioned previously in the Longmire section of the field trip manual).
Empiric evidence suggests that glacial outburst floods or jökulhlaups at Mount Rainier tend to occur when large amounts of stagnant ice are present in their lower reaches. Additionally, Hodge (1974) found that the summer ice velocity of the Nisqually glacier increased measurably in the vicinity of the equilibrium line (ELA), while slowing occurred toward the terminus (relative to the previous summer) just prior to the 1970 glacier outburst flood. He suggested that observed variations in ice velocity were correlated with the amount of liquid water temporarily stored within the glacier. This indicates that the presence of more englacial water leads to faster ice velocities and a higher potential for outburst floods, while the absence of large quantities of englacial water is associated with slower glacial flow and fewer outburst floods. If this is consistently the case, long-term annual glacial velocity measurement could be a powerful tool in the prediction of potentially devastating glacial outburst floods.

44
Figure 36: Velocity of individual features (top) and extrapolated velocity fields (bottom) on the lower Nisqually Glacier during the 2011 and 2012 field seasons (Modified from Walkup et al., 2013).

45
At least four major, damaging glacial outburst floods have been released from the Nisqually Glacier since the 1920’s, along with many smaller outburst events. The floods of 1926 and 1934 damaged the bridge below the glacial terminus, and the floods in 1932 and 1955 destroyed it (Hodge, 1972). In Mount Rainier National Park, downstream tourist areas like Longmire are susceptible to flooding associated with glacial outburst floods, as evidenced in the 1955 event when the community was inundated with flood water (Figure 24). In addition, much of the main access road into the park parallels the Nisqually River, putting park access and anyone on the road at risk in the event of a major glacial outburst flood from the Nisqually Glacier.
Historic accounts of glacial outburst floods include observations that the outburst can occur above the terminus of the glacier (Richardson, 1968), possibly originating from the interface between active and stagnant ice, and have been known to sweep the glacial ice clean of debris.
The overall mass balance on the two monitored glaciers in the park (the Nisqually and Emmons) show a situation where ice loss over time is greater than snow and ice accumulation (Figure 37). Despite some positive mass balance years in 2010 and 2011, both the Nisqually and Emmons have lost 11.7 and 13.2 meters water equivalent (m w.e.), respectively (Riedel and Larrabee, 2017). This is a major loss of water across the glacier is equivalent to 78 and 148.8 million cubic meters of water equivalent volume loss for the Nisqually and Emmons.
In 2015, Mount Rainier National Park contained a total of 29 named glaciers which covered a total of 78.76 ± 1.11 km2 (30.41 ± 0.43 mi2) (Beason, 2017; Figure 38). Adding perennial snowfields, the total snow and glacier cover within the park as of 2015 to 80.82 ± 1.11 km2 (31.21 ± 0.43 mi2). The total area of debris cover on glaciers at Mount Rainier is 20.01 ± 0.42 km2 (7.73 ± 0.16 mi2), or approximately 25.4% of mapped glaciers. The largest glacier at Mount Rainier was the Emmons Glacier, which encompasses 11.03 ± 0.58 km2 (4.26 ± 0.22 mi2). The
Figure 37: Overall mass balance on the Nisqually and Emmons Glacier, 2003-2013 (Riedel and Larrabee, 2017).
Figure 38: Change in surface area of all glaciers at Mount Rainier from 1896 to 2015 (Beason, 2007).

46
Carbon Glacier, the third largest glacier in the park at 7.26 ± 0.39 km2 (2.80 ± 0.15 mi2), had the largest area of debris cover at 4.84 ± 0.27 km2 (1.87 ±0.11 mi2), covering 66.7% of its area. The Nisqually Glacier is ranked as the 6th largest glacier in the park, with a surface area of 4.19 ± 0.23 km2 (1.62 ± 0.09 mi2), and has 1.64 ± 0.01 km2 (0.63 ± 0.04 mi2) of debris cover (39% of its area). See Beason (2017) for more information about this and other glaciers in the park.
The change in glacial and perennial ice surface area from 1896 to 2015 was -52.08 km2 (-20.11 mi2), a total reduction of 39.1% (Figure 38). This corresponds to an average rate of -0.44 km2 per year (-0.17 mi2 × yr-1) during the 119 year period. Recent changes (between the 6-year period of 2009 to 2015) showed a reduction of -1.46 km2 (-0.56 mi2) of glacial surface area, or a 1.8% reduction in glacial area and a rate that corresponded to -0.24 km2 per year (-0.09 mi2 × yr-1).
Figure 39: Change in volume of glaciers at Mount Rainier from 1896-2015 (George and Beason, 2017)
Like surface area, glacier extent park-wide has also decreased, from 5.9 ± 1.11 km3 (1.41 ± 0.26 mi3) in 1896 to 3.22 ± 0.31 km3 (0.77 ± 0.07 mi3) in 2015 (George and Beason, 2017; Figure 39). This is a loss of 2.68 km3 (0.64 mi3), or a reduction of 45% in glacial volume in 119 years. The average rate of volume loss is -0.02 km3× yr-1 (-0.004 mi3 × yr-1) over this period. Between 2009 and 2015 (6 years), the volume loss is 0.13 km3 (-0.03 mi3), or a reduction of 3.8%, with a corresponding average rate of -0.021 km3× yr-1 (-0.005 mi3× yr-1).

47
Literature Cited Beason, S.R. 2017. Change in glacial extent at Mount Rainier National Park from 1896 to 2015. Natural Resource
Report NPS/MORA/NRR—2017/1472, National Park Service, Fort Collins, Colorado, 98 p.
Beason, S.R. 2014. Mount Wow rock fall, preliminary findings: Unpublished Document, Mount Rainier National Park, 7 p.
Beason, S.R. 2012. Small glacial outburst flood occurs on Mount Rainier - October 27, 2012: Unpublished Science Brief, National Park Service, 3 p.
Beason, S.R. 2007. The environmental implications of aggradation in major braided rivers at Mount Rainier National Park, Washington: M.S. Thesis, University of Northern Iowa, 165 p.
Beason, S.R., L.C. Walkup, and P.M. Kennard. 2015. Aggradation of glacially-sourced braided rivers at Mount Rainier National Park, Washington: Summary report for 1997-2012: Natural Resource Technical Report NPS/MORA/NRTR—2014/910, National Park Service, 166 p.
Beason, S.R., L.C. Walkup, and P.M. Kennard. 2014. Fluvial landscape response to aggradation, debris flows, and landslides: An example from the Nisqually River and Van Trump Creek, Mount Rainier, Washington, USA: Paper No. 124-11, Geological Society of America Abstracts with Programs, Vol. 46, No. 6, p. 314.
Burtchard, G.C., J.Y. Cheung, and E.B. Gleason. 2008. Archaeology and history in the Nisqually Corridor, Sunshine Point, Kautz, and Longmire Historic District: Results of the 2006-2007 flood damage survey: Mount Rainier National Park, 93 p.
Catton, T. 1996. Wonderland: An administrative history of Mount Rainier National Park. National Park Service Cultural Resources Program, Seattle, WA, 723 p.
Copeland, E.A. 2009. Recent periglacial debris flows from Mount Rainier, Washington: M.S. Thesis. Oregon State University, 139 p.
Crandell, D.R. 1971. Postglacial lahars from Mount Rainier volcano, Washington: United States Geological Survey Professional Paper 677, 75 p.
Crandell, D.R. and R.D. Miller. 1974. Quaternary stratigraphy and extent of glaciation in the Mount Rainier region, Washington: U.S. Geological Survey Professional Paper 847, 58 p.
Czuba, J.A., C.R. Czuba, C.S. Magirl, and F.D. Voss. 2010. Channel-conveyance capacity, channel change, and sediment transport in the lower Puyallup, White, and Carbon Rivers, western Washington: U.S. Geological Survey Scientific Investigations Report 2010–5240, 104 p. https://pubs.usgs.gov/sir/2010/5240/
Czuba, J.A., T.D. Olsen, C.R. Czuba, C.S. Magirl, and C.C. Gish. 2012a. Changes in sediment volume in Alder Lake, Nisqually River Basin, Washington, 1945–2011: U.S. Geological Survey Open-File Report 2012–1068, 30 p. https://pubs.usgs.gov/of/2012/1068/
Czuba, J.A., C.S. Magirl, C.R. Czuba, C.A. Curran, K.H. Johnson, T.D. Olsen, H.K. Kimball, and C.C. Gish. 2012b. Geomorphic analysis of the river response to sedimentation downstream of Mount Rainier, Washington: U.S. Geological Survey Open-File Report 2012-1242, 134 p. https://pubs.usgs.gov/of/2012/1242/
Driedger, C.L. and A.G. Fountain. 1989. Glacier outburst floods at Mount Rainier, Washington state, U.S.A.: Annals of Glaciology, Vol. 13, pp. 51-55.

48
Driedger, C.L. and P.M. Kennard. 1986. Ice volumes on Cascade Volcanoes: Mount Rainier, Mount Hood, Three Sisters, and Mount Shasta: United States Geological Survey Professional Paper 1365, 38 p.
George, J.L. and S.R. Beason. 2017. Dramatic changes to glacial volume and extent since the late 19th century at Mount Rainier National Park, Washington, USA: Poster #158-6, Geological Society of America Abstracts with Programs, Vol. 49, No. 6, doi: 10.1130/abs/2017AM-299694.
Hodge, S.M. 1974. Variations in the sliding of a temperate glacier: Journal of Glaciology, Vol. 13, No. 69, 21 p.
Hodge, S.M. 1972. The movement and basal sliding of the Nisqually Glacier, Mount Rainier: Ph.D Thesis, University of Washington, 433 p.
Lane, E.W. 1955. The importance of fluvial morphology in hydraulic engineering. Proceedings of the American Society of Civil Engineers, Vol. 81, No. 745, p. 745-761.
Legg, N.T., A.J. Meigs, G.E. Grant, and P.M. Kennard. 2014. Debris flow initiation in proglacial gullies on Mount Rainier, Washington: Geomorphology, Vol. 226, p. 249-260.
Mattinson, J.M. 1977. Emplacement history of the Tatoosh volcanic-plutonic complex, Washington: Ages of zircons: Geological Society of America Bulletin, Vol. 88, No. 10, p. 1509-1514.
Molenaar, D., 2005, The Challenge of Rainier: A record of the explorations and ascents, triumphs and tragedies, on the Northwest’s greatest mountain: The Mountaineers, Seattle, WA, 364 p.
Nylen, T.H. 2004. Spatial and temporal variations of glaciers (1913-1994) on Mt. Rainier and the relation with climate: M.S. Thesis, Portland State University, 128 p.
Pringle, P.T. 2008. Roadside geology of Mount Rainier National Park and vicinity: Washington Division of Geology and Earth Resources Information Circular 107, 190 p.
Richardson, D. 1968. Glacier outburst floods in the Pacific Northwest: United States Geological Survey Professional Paper 600-D, p. 79-86.
Riedel, J.L and M. Larrabee. 2017. Drifts, debris and danger: Glacial mass balance of Nisqually and Emmons Glaciers: Presentation at Mount Rainier Glacier Researchers Summit, Pacific Lutheran University, March 3, 2017.
Rosgen, D. 1996. Applied fluvial geomorphology: Wildland Hydrology Books, Pagosa Springs, CO.
Rybolt, B.R. 2013. Roads less traveled: Access, automobiles, and recreation in Mount Rainier National Park’s wilderness areas: M.A. Thesis, University of Washington, 195 p.
Samora, B.A. 1991. Chronology of flood events as noted in the superintendent's annual reports 1940-1991: Unpublished Internal Document, National Park Service/Mount Rainier National Park, 13 p.
Scott, K.M. and J.W. Vallance. 1995. Sedimentology, behavior, and hazards of debris flows at Mount Rainier, Washington: United States Geological Survey Professional Paper 1547, 56 p.
Sisson, T.W., J.E. Robinson, and D.D. Swinney. 2011. Whole-edifice ice volume change A.D. 1970 to 2007/2008 at Mount Rainier, Washington, based on LiDAR surveying: Geology, Vol. 39, p. 639-642, doi: 10.1130/G31902.1.

49
Walder, J.S. and C.L. Driedger. 1994. Geomorphic change caused by outburst floods and debris flows at Mount Rainier, Washington, which emphasis on Tahoma Creek Valley: United States Geological Survey Water-Resources Investigations Report 93-4093, 100 p.
Walkup, L.C., S.R. Beason, P.M. Kennard, J.G. Ohlschlager, and A.C. Stifter. 2013. Surficial ice velocities of the lower Nisqually Glacier and their relationship to outburst flood hazards at Mount Rainier National Park, Washington, United States: Geological Society of America Abstracts with Programs, Vol. 45, No. 7, p. 565.
Photo 3: Damage to the West Side Road during the September 29, 2005 flood at Mount Rainier (NPS Photo).

National Park Service U.S. Department of the Interior
Mount Rainier National Park