
National Library of Australia Cataloguing-in-Publication Entry · 2015-09-16 · National Library...
80
Transcript of National Library of Australia Cataloguing-in-Publication Entry · 2015-09-16 · National Library...


National Library of Australia Cataloguing-in-Publication Entry
Lyle, J. M.
Tasmanian scalefish fishery assessment - 2000.
Bibliography.
Includes index.
ISBN 0 7246 8009 8.
1. Fishery management - Tasmania. 2. Fisheries - Catcheffort - Tasmania. 3. Fisheries - Tasmania - Fishingeffort. 4. Fishery resources - Tasmania - Measurement.I. Hodgson, K. (Kate), 1972- . II. TasmanianAquaculture and
Fisheries Institute. III. Title. (Series : Technical reportseries (Tasmanian Aquaculture and Fisheries Institute) ;no. 19).
333.95609946
Published by the Marine Research Laboratories - Tasmanian Aquacultureand Fisheries Institute, University of Tasmania 2000
Series Editor - Dr Caleb Gardner
The opinions expressed in this report are those of the author/s and are notnecessarily those of the Marine Research Laboratories or the TasmanianAquaculture and Fisheries Institute.

TASMANIAN SCALEFISH FISHERY ASSESSMENT - 2000
Compiled by J.M. Lyle and K. Hodgson
May 2000
Tasmanian Aquaculture and Fisheries InstituteMarine Research Laboratories

This assessment of the scalefish resource is produced by the Tasmanian Aquaculture andFisheries Institute (TAFI) and uses input from the Scalefish Fishery Assessment WorkingGroup (SFAWG).
The SFAWG met on 14 December, 2000 to consider background documents and provideinput into the assessments. The Working Group participants were:
Assoc. Prof. Malcolm Haddon ChairDr Jeremy Lyle Senior Research Scientist (TAFI)Ms Kate Hodgson Research Assistant (TAFI)Mr Dennis Witt Manager, Wild Fisheries (DPIWE)Mr Sean Riley Manager, Finfish (DPIWE)Mr John Smith Manager, Recreational Fisheries
(DPIWE)Mr Shane Bevis IndustryMr Brian Hughes Industry
This report was compiled by J. M. Lyle and K. Hodgson
TAFI Marine Research Laboratories, PO Box 252-49, Hobart, TAS 7001, Australia.Email: [email protected];Ph: (03) 6227 7277, Fax: (03) 6227 8035
This series provides general fishery assessment reports by the Tasmanian Aquaculture andFisheries Institute. The documents are not intended as definitive statements but rather asprogress reports on the current status of ongoing assessments derived from research andmonitoring programs.

Scalefish Fishery Assessment: 2000
TAFI Technical Report No. 19 Page i
Scalefish Fishery Assessment 2000SummaryThe Tasmanian scalefish fishery is a multi-species commercial fishery involving a wide variety offishing methods. In addition, many scalefish species are important to the State’s recreational fishery.
An important element of the Scalefish Management Plan, introduced in 1998, is the explicitidentification of performance indicators. These indicators have two primary functions;
• to monitor performance of the management plan in relation to effort and catch levels, and• to provide reference points against which the status of fish stocks can be assessed.
Fishery AssessmentIn this assessment the scalefish fishery is described in terms of catch composition, catch and effort.Catch history for the period 1990/91 – 1999/2000 is presented, with more detailed analyses of catchand effort by method for the period 1995/96 – 1999/2000. An important improvement in the analysisof catch and effort information has been the inclusion of Commonwealth logbook data for dualendorsed operators fishing in Tasmanian waters. These data were not available in the previousassessments.
Effort and catch rate (catch per unit effort - CPUE) information are presently only available for a fiveyear period, the first three years being used as the reference period to define the trigger points. In thisregard there are only two years of data available to assess fishery performance.
The most important developments in the fishery since 1997/98 have been the significant increases indropline, spear, dip net and squid jig effort. For all but squid jig, 1999/2000 effort levels werebetween 10-40% higher than during the reference period (Table 1). Squid jig effort had increasedaround one hundred-fold over the reference period, reflecting increases in effort targeted at southerncalamary and especially automatic jig effort targeted at arrow squid. It is noteworthy that thesemethods are available to all holders of scalefish licences. In terms of days fished, however, onlydropline and jig effort exceeded reference levels, suggesting that for the other methods that exceededthe effort triggers, more gear or time per day was spent fishing.
By contrast, effort levels declined for methods regulated through limited entry (eg. purse seine, beachseine). Graball net effort also declined markedly, presumably reflecting the impact of newmanagement arrangements that prescribe and limit the amount of gear that can be used by eachscalefish licence category.
Table 1 Effort trigger point assessment by major fishing methodsY triggered , N not triggered, , * 10-40% increase, ** > 40% increase
Effort >10% peak 1995-97 levelsMethod Gear units Days fishedBeach seine N NPurse seine N NGraball net N NSmall mesh N NDropline (<200m) Y* Y*Handline N NTroll N NFish trap N NSpear Y* NDip net Y* NSquid jig Y** Y**

Scalefish Fishery Assessment: 2000
TAFI Technical Report No. 19 Page ii
Species assessmentsDetailed assessments are provided for striped trumpeter, banded morwong, sea garfish, wrasse,southern calamary and arrow squid. In each case, the assessment involved an examination of catch,effort and CPUE data. Descriptions of these fisheries, including fishing methods, seasonality andspatial distribution of catches were provided in previous assessment reports and have been updatedhere.
Striped trumpeterThe 1999/2000 catch of striped trumpeter, while slightly lower than in 1998/99, was higher thancatches taken during the reference period. Handline catches have continued to increase since 1995/96while dropline and graball net catches fell slightly by comparison with 1998/99. Catch rates fordropline fishing rose whereas graball catch rates fell in the current year. By comparison, CPUE forhandline fishing has remained relatively stable over recent years. Particularly strong recruitment of1993 and 1994 cohorts appears to have contributed to the recent catch and catch rates for handline anddropline methods. The resource status is unknown, but indicators based on catch and effort are likelyto be strongly influenced by recruitment variability.
The triggers for total catch and handline effort in striped trumpeter were exceeded in 1999/2000.
Banded morwong
The fishery for banded morwong expanded in the early 1990’s with the development of live fishmarkets for the species. However, the annual catch has declined steadily since 1994/95, falling furtherin 1999/2000 to 29 tonnes due primarily to a large decrease in effort and declines in CPUE. Declinesin catch and effort were evident in most east coast fishing blocks.
Banded morwong are long-lived (up to 80 years) and productivity appears to be very low. In addition,the species demonstrate strong site attachment, suggesting that it will be susceptible to localised over-fishing. Research and commercial catch sampling has indicated that there is size structuring within thepopulation at small spatial scales (to the level of a particular reef), which suggests that assessment atblock and regional levels may be insensitive more localised changes in abundance.
The 1999/2000 catch was lower than the minimum reference level (1994/95 to 1997/98) and haddeclined by greater than 30% compared to 1998/99. As a consequence both catch triggers wereexceeded. Furthermore, despite a decline in fishing effort, state-wide and regional (St Helens,Schouten and Maria) catch rates had declined to below 80% of the lowest reference level and thereforethe catch rate trigger was also exceeded.
Catch and catch rate indicators demonstrate the impact of the fishery on the banded morwongpopulation and suggest that the sustainability of the fishery, even at current levels of exploitation, isuncertain.
Sea garfish
Sea garfish catches declined slightly compared to 1998/99, due mainly to a fall in the dip net catch, butwere within the reference catch range. Effort and catch rates in the dip net sector fell considerably butthe fall in catch rates did not exceed the trigger level. Beach seine catch and effort has been relativelystable of the past three years while catch rates have increased in the past two years. Sea garfish are aschooling species and catch rates are not considered to be reliable nor sensitive parameters forindicating trends in abundance. Resource status is unknown.
No triggers were reached for sea garfish.

Scalefish Fishery Assessment: 2000
TAFI Technical Report No. 19 Page iii
Wrasse
The development of live fish markets for wrasse has resulted in increased catches since the early1990’s. Two main species are involved, purple wrasse and blue-throat wrasse, though it is notpossible to distinguish catches of either species from commercial catch returns. Overall catch declinedfrom 89 tonnes in 1998/99 to 85 tonnes in 1999/2000, reflecting decreases in trap and handline catchand effort. CPUE decreased for all methods in 1999/2000.
Although wrasse are comparatively short-lived, attaining maturity well before they are recruited to thefishery, they demonstrate strong site attachment and therefore, assessment even at the smallestreporting scale (block level) may mask more localised changes in abundance. Resource status isunknown.
No triggers were exceeded for wrasse in 1999/2000.
Southern calamary
The total annual catch of southern calamary again exceeded the maximum obtained over the 1990-1997 period, although catch was slightly less compared to 1998/99. Jig effort continued to escalate,up by 25% from 1998/99 levels, following a six-fold increase in the previous year. Evidence suggeststhat the short-term closures of Great Oyster Bay in late 1999 were successful in providing some degreeof protection to spawning squid. The closures may also have been partly responsible for the distinctshift in the dynamics of the fishery, with Mercury Passage contributing catch and effort comparable tothat seen in Great Oyster Bay for the first time.
The resource status is unknown and the sustainability of current catch levels is uncertain. The fact thatcalamary have a life span of generally less than one year, with no accumulation of recruitment across anumber of years, suggests considerable potential for inter-annual variability in abundance coupledwith vulnerability to over-fishing.
Catch and effort (jig) triggers were exceeded for the second year.
Arrow squid
The 1999/2000 catch of over 430 tonnes of arrow squid is the highest reported catch of the speciesfrom Tasmanian waters and represented a five-fold increase in catch over the previous year. Increasedsquid jig effort, primarily by automated jig vessels accounted for the majority of increased catch. Thecatch was concentrated off south-eastern Tasmania and in particular in Storm Bay. Catch samplingrevealed that the bulk of the catch was comprised of juvenile squid, much of which was utilised for thebait market.
The resource status of arrow squid is unknown and the sustainability of current catch levels isuncertain. The relationships between arrow squid populations from south-eastern Tasmania and thoseexploited in the Commonwealth fishery in Bass Strait is not known.
Catch and effort triggers were exceeded for the second year.
Other key species
Catch, effort and CPUE were also examined for blue warehou, Australian salmon, bastard trumpeter,flounder and jackass morwong. These parameters were within the reference criteria for Australiansalmon and bastard trumpeter. The 1999/2000 catch of blue warehou, although within the referencerange, fell by over 30% compared with the previous year, indicating that the catch trigger was reached.Flounder and jackass morwong catches were also lower than during the reference period, with a fall ofover 30% in the catch of jackass morwong compared with 1998/99, indicating that catch triggers werereached for both species. Effort and CPUE triggers for blue warehou, flounder and jackass morwongwere not exceeded.

Scalefish Fishery Assessment: 2000
TAFI Technical Report No. 19 Page iv
Trigger point summary
Catch, effort and CPUE trigger point analysis for key species are summarised in Table 2. Details ofeffort triggers by methods for key species are detailed in Chapters 3-9.
Table 2 Summary trigger point assessment for key species –1999/2000.Y triggered; N not triggered; arrows indicate direction of change; * catch history period for comparison is
1994/95 to 1997/98; ** catch history period for comparison is 1995/96 to 1997/98; # applies only to particularmethods.
Catch Effort CPUE
SpeciesOutside 90-97
rangeDecline/ increase
by >30%
Increase by >10%from highest 95-97
level< 80% min. 95-97
rangeStriped trumpeter Y ↑ N Y# NBanded morwong* Y ↓ Y ↓ N YSea garfish N N N NWrasse** N N N NSouthern calamary Y ↑ N Y NAustralian salmon N N N NBastard trumpeter N N N NBlue warehou N Y ↓ N NFlounder Y ↓ N N NJackass morwong Y ↓ Y ↓ N NArrow squid Y ↑ Y ↑ Y N

Scalefish Fishery Assessment: 2000
TAFI Technical Report No. 19 Page i
Table of Contents
SUMMARY.............................................................................................................................................................I
1 MANAGEMENT OBJECTIVES AND STRATEGIES ........................................................................... 1
1.1 MAJOR OBJECTIVES .................................................................................................................................. 11.2 PRIMARY STRATEGIES.............................................................................................................................. 11.3 PERFORMANCE INDICATORS..................................................................................................................... 11.4 TRIGGER POINTS ...................................................................................................................................... 2
2 FISHERY ASSESSMENT .......................................................................................................................... 3
2.1 THE FISHERY............................................................................................................................................ 32.2 DATA SOURCES ........................................................................................................................................ 4
2.2.1 General Fishing Returns ................................................................................................................. 42.2.2 Commonwealth returns.................................................................................................................... 42.2.3 Data analysis ................................................................................................................................... 52.2.4 Recreational fishery......................................................................................................................... 5
2.3 RECENT CATCH TRENDS ........................................................................................................................... 52.4 EFFORT................................................................................................................................................... 10
2.4.1 Method based effort ....................................................................................................................... 102.4.2 Species based effort ....................................................................................................................... 13
2.5 CATCH RATES......................................................................................................................................... 142.6 RECREATIONAL FISHERY ........................................................................................................................ 14
2.6.1 Gillnet fishery ................................................................................................................................ 142.6.2 Other methods ............................................................................................................................... 15
2.7 UNCERTAINTIES ..................................................................................................................................... 152.8 IMPLICATIONS FOR MANAGEMENT......................................................................................................... 16
3 STRIPED TRUMPETER (LATRIS LINEATA) ...................................................................................... 17
3.1 MANAGEMENT BACKGROUND................................................................................................................ 173.2 STOCK STRUCTURE AND LIFE-HISTORY.................................................................................................. 173.3 PREVIOUS ASSESSMENTS........................................................................................................................ 183.4 CURRENT ASSESSMENT.......................................................................................................................... 18
3.4.1 The Fishery.................................................................................................................................... 183.4.2 Recent developments...................................................................................................................... 193.4.3 2000 Assessment ............................................................................................................................ 19
3.5 EVALUATION OF TRIGGER POINTS.......................................................................................................... 223.6 IMPLICATIONS FOR MANAGEMENT......................................................................................................... 233.7 RESEARCH NEEDS .................................................................................................................................. 23
4 BANDED MORWONG (CHEILODACTYLUS SPECTABILIS) ........................................................... 25
4.1 MANAGEMENT BACKGROUND................................................................................................................ 254.2 STOCK STRUCTURE AND LIFE-HISTORY.................................................................................................. 254.3 PREVIOUS ASSESSMENTS........................................................................................................................ 264.4 CURRENT ASSESSMENT.......................................................................................................................... 26
4.4.1 The Fishery.................................................................................................................................... 264.4.2 Recent Developments..................................................................................................................... 274.4.3 2000 Assessment ............................................................................................................................ 27
4.5 EVALUATION OF TRIGGER POINTS.......................................................................................................... 294.6 IMPLICATIONS FOR MANAGEMENT......................................................................................................... 314.7 RESEARCH NEEDS .................................................................................................................................. 31
5 SEA GARFISH (HYPORHAMPHUS MELANOCHIR).......................................................................... 32
5.1 MANAGEMENT BACKGROUND................................................................................................................ 325.2 STOCK STRUCTURE AND LIFE-HISTORY.................................................................................................. 325.3 PREVIOUS ASSESSMENTS........................................................................................................................ 335.4 CURRENT ASSESSMENT.......................................................................................................................... 33
5.4.1 The Fishery.................................................................................................................................... 33

Scalefish Fishery Assessment: 2000
TAFI Technical Report No. 19 Page ii
5.4.2 Recent Developments ..................................................................................................................... 345.4.3 2000 Assessment ............................................................................................................................ 34
5.5 EVALUATION OF TRIGGER POINTS.......................................................................................................... 365.6 IMPLICATIONS FOR MANAGEMENT ......................................................................................................... 375.7 RESEARCH NEEDS .................................................................................................................................. 37
6 WRASSE (FAMILY: LABRIDAE).......................................................................................................... 38
6.1 MANAGEMENT BACKGROUND................................................................................................................ 386.2 STOCK STRUCTURE AND LIFE-HISTORY.................................................................................................. 386.3 PREVIOUS ASSESSMENTS........................................................................................................................ 396.4 CURRENT ASSESSMENT .......................................................................................................................... 39
6.4.1 The Fishery .................................................................................................................................... 396.4.2 Recent Developments ..................................................................................................................... 406.4.3 2000 Assessment ............................................................................................................................ 41
6.5 EVALUATION OF TRIGGER POINTS.......................................................................................................... 426.6 IMPLICATIONS FOR MANAGEMENT ......................................................................................................... 436.7 RESEARCH NEEDS .................................................................................................................................. 44
7 SOUTHERN CALAMARY (SEPIOTEUTHIS AUSTRALIS) ............................................................... 45
7.1 MANAGEMENT BACKGROUND................................................................................................................ 457.2 STOCK STRUCTURE AND LIFE-HISTORY.................................................................................................. 457.3 PREVIOUS ASSESSMENTS........................................................................................................................ 467.4 CURRENT ASSESSMENT .......................................................................................................................... 46
7.4.1 The Fishery .................................................................................................................................... 467.4.2 Recent Developments ..................................................................................................................... 477.4.3 2000 Assessment ............................................................................................................................ 48
7.5 EVALUATION OF TRIGGER POINTS.......................................................................................................... 497.6 IMPLICATIONS FOR MANAGEMENT ......................................................................................................... 507.7 RESEARCH NEEDS .................................................................................................................................. 51
8 ARROW SQUID (NOTOTODARUS GOULDI)....................................................................................... 52
8.1 MANAGEMENT BACKGROUND................................................................................................................ 528.2 STOCK STRUCTURE AND LIFE-HISTORY.................................................................................................. 528.3 PREVIOUS ASSESSMENTS ........................................................................................................................ 538.4 CURRENT ASSESSMENT .......................................................................................................................... 53
8.4.1 The Fishery .................................................................................................................................... 538.4.2 Recent developments...................................................................................................................... 548.4.3 2000 Assessment ............................................................................................................................ 54
8.5 EVALUATION OF TRIGGER POINTS.......................................................................................................... 558.6 IMPLICATIONS FOR MANAGEMENT ......................................................................................................... 568.7 RESEARCH NEEDS .................................................................................................................................. 57
9 OTHER KEY SCALEFISH SPECIES..................................................................................................... 58
REFERENCES .................................................................................................................................................... 60

Scalefish Fishery Assessment: 2000
TAFI Technical Report No. 19 Page 1
1 Management Objectives and Strategies
The Scalefish Management Plan was introduced in 1998 (DPIF 1998) and contains thefollowing objectives, strategies and performance indicators.
1.1 Major objectives
• To maintain fish stocks at sustainable levels by restricting the level of fishing effortdirected at scalefish, including the amount and types of gear that can be used;
• To optimise yield and/or value per recruit;• To mitigate any adverse interactions that result from competition between different
fishing methods or sectors for access to shared fish stocks and/or fishing grounds;• To maintain or provide reasonable access to fish stocks for recreational fishers;• To minimise the environmental impact of scalefish fishing methods generally, and
particularly in areas of special ecological significance;• To reduce by-catch of juveniles and non-target species, and• To implement effective and efficient management.
1.2 Primary Strategies
• Limit total fishing capacity by restricting the number of licences available to operate inthe fishery;
• Define allowable fishing methods and amounts of gear that can be used in the scalefishfishery;
• Monitor the performance of the fishery over time, including identification and use ofbiological reference points (or limits) for key scalefish species;
• Protect fish nursery areas in recognised inshore and estuarine habitats by prohibiting orrestricting fishing in these areas;
• Employ measures to reduce the catch and mortality of non-target or undersized fish, and• Manage some developing fisheries under permit conditions.
1.3 Performance Indicators
The performance of the Scalefish Fishery Management Plan in meeting the objectives ofmaintaining biomass and recruitment, will be measured through a combination ofperformance indicators relating to the sustainability of the key target species, and thefisheries dependent on these species.
Performance indicators (or trigger points) will be assessed relative to the years 1990 to 1997,and/or the first two years of the management plan where such time series data do not exist.Analysis of fishery performance under this (initial) strategy will be examined and measuredvariously by the use of:• trends in effort in the fishery;• variations in the total catch of a species from year to year, or between seasons, regions
and sectors;• trends in catch per unit effort (CPUE) for a species;

Scalefish Fishery Assessment: 2000
TAFI Technical Report No. 19 Page 2
• significant changes in biological characteristics of a fish species or population, such asa change in size or age structure; and
• other indicators of fish stock stress - e.g. disease or pollution effects.It is recognised, however, that not all performance indicators are suitable for all species orfishing methods.
1.4 Trigger Points
Trigger points are levels of, or rates of change in, the 'performance' of the scalefish fisherythat are considered to be outside the normal variation of the stock(s) and the fishery. Thetrigger points provide a framework against which the performance of the fishery can beassessed, and (if necessary) flag the need for management action.
A trigger point will be reached when one or more of the following criteria are met:• total catch of a key target species is outside of the 1990 to 1997 range; or when, total
catch of a key target species declines or increases in one year more than 30% from theprevious year;
• fishing effort for any gear type, or effort targeted towards a species or species group,increases by 10% from the highest of the 1995 to 1997 levels;
• CPUE of a key target species is less than 80% of the lowest annual value for the period1995 to 1997;
• a significant change in the size composition of commercial catches for key targetspecies; or when monitoring of the size/age structure of a species indicates a significantchange in the abundance of a year class (or year classes), with particular importance onpre-recruit year classes;
• a change in the catch of ‘trash’ or non-commercial fish relative to 1990 to 1997 records;or when incidental mortality of non-commercial species or undersized commercial fish isunacceptably high;
• significant numbers of fish are landed in a diseased or clearly unhealthy condition; orwhen a pollution event occurs that may produce risks to fish stocks, the health of fishhabitats or to human health; or when,
• any other indication of fish stock stress is observed.

Scalefish Fishery Assessment: 2000
TAFI Technical Report No. 19 Page 3
2 Fishery Assessment
2.1 The Fishery
The scalefish fishery is a multi-method and multi-species fishery, the management of whichis complicated by jurisdictional issues, with several key species harvested across a numberof jurisdictions (Lyle and Jordan 1999).
A wide range of fishing gears, the most important being gillnet, hooks and seine nets, areused to harvest a diverse range of scalefish, shark and cephalopod species. Other fishinggear in use include traps, Danish seine, otter trawl, dip nets, spears, etc. A listing ofcommon and scientific names of species reported in catches is presented in Appendix 1.
In many respects the fishery is dynamic, with fishers readily adapting and changing theiroperations in response to changes in fish availability and in response to marketrequirements. As a consequence, only a small proportion of the fleet has specialised in asingle activity or to targeting a primary species. For many operators, finfish represent anadjunct to other activities, for instance rock lobster fishing.
Historically, Australian salmon and barracouta dominated the Tasmanian scalefish catch,with a wide variety of other species also taken but in smaller quantities. With changingmarket preferences and availability, landings of barracouta declined during mid-1970’s andcurrently only small quantities are marketed for human consumption. Australian salmoncontinue to be an important commercial and recreational species in Tasmania, the bulk ofthe commercial catch being used as rock lobster bait (Lyle and Jordan 1999).
During the late 1980’s a fishery for blue warehou developed off southern Australia. At thetime gillnetters and trawlers operating in Commonwealth waters accounted for the bulk ofthe catch, the inshore Tasmanian catch represented only a minor component of the fishery.Blue warehou have continued to be an important inshore commercial and recreational targetspecies in Tasmania and, with falling catches from the Commonwealth sector, Tasmaniancatches currently represent a significant portion of the total fishery production. Althoughnow managed as a quota species in the South East Fishery (SEF), State catches of bluewarehou are subject to a memorandum of understanding with the Commonwealth and aremanaged under status quo arrangements, that is catches are to remain within historic levels.Formal assessments of blue warehou, incorporating data from the Tasmanian fishery, areundertaken as part of the South East Fishery Assessment Group (SEFAG) process.
Blue eye trevalla have traditionally been an important offshore species to Tasmania. In1997, an Offshore Constitutional Settlement (OCS) agreement gave the Commonwealthmanagement responsibility for the species, along with blue grenadier, gemfish, hapuka andothers. Assessment of these and a number of other demersal trawl species, includingflathead, jackass morwong and ocean perch, are undertaken by SEFAG.
The development of markets for live fish in the early 1990’s saw a rapid expansion ofbanded morwong and wrasse landings, species that previously had little commercial value.More recently, catches of southern calamary and arrow squid have also risen sharply due toincreased market opportunities and/or availability.

Scalefish Fishery Assessment: 2000
TAFI Technical Report No. 19 Page 4
Shark, particularly school shark and gummy shark, have also been an important componentof Tasmanian fishery in terms of both volume and value. In December 2000, OCSarrangements between Tasmania and the Commonwealth saw management responsibility forshark passed over to the Commonwealth. In January 2001 individual transferable quotaswere introduced for these species. The Southern Shark Fishery Assessment Group (SSFAG)is responsible for school and gummy shark stock assessment.
Scalefish also represent the mainstay of the recreational fishery, with many of the samespecies targeted by both recreational and commercial fishers. Line fishing is the primaryfishing method employed by recreational fishers but the recreational use of gillnets andbeach seines is also permitted. Flathead, Australian salmon and barracouta are the main linecaught species, with blue warehou, bastard trumpeter, flounder and mullet comprising thebulk of the gillnet catch (Lyle 2000).
2.2 Data sourcesCommercial catch and effort data are based on Tasmanian General Fishing Returns andCommonwealth non-trawl (GN01 and GN01A) and Southern Squid Jig Fishery (SSFJ)logbook returns.
2.2.1 General Fishing Returns
General Fishing Returns prior to 1995 provided monthly summaries of catches (landings)but were often incomplete in terms of providing any effort and fishing method information.Limitations of the old catch returns have been discussed in some detail by Lennon (1998)and, in summary, they provide basic information about production levels but are of littlevalue in providing a meaningful basis for effort and catch rate analysis.
In early 1995, a new General Fishing Return was introduced, replacing the monthly return,with catch and effort information reported on a daily basis for each fishing method used.The revised returns provide greater detail about fishing operations, including more explicitspecification of the fishing method, greater spatial resolution (½ degree rather 1 degreeblocks), details about effort and depths fished and form of the harvested product.
In the analysis of General Fishing Returns some data manipulation has been undertaken,details of which are provided in Appendix 2.
2.2.2 Commonwealth returns
Following the introduction of the Commonwealth non-trawl logbook (GN01) in late 1997,dual endorsed Tasmanian and Commonwealth (South East Non-Trawl and Southern Shark)operators generally commenced recording all of their catch and effort data, including fishingin State waters, in the Commonwealth logbook. These data were not available for the 1998and 1999 assessments but are incorporated in the present update.
In addition, several dual endorsed squid vessels reported some or all of their state watersfishing activity in the Southern Squid Jig Fishery (SSJF) logbook and these data have alsobeen incorporated in the analyses.
As most operators do not explicitly indicate whether fishing occurred in State orCommonwealth waters it has been necessary to incorporate all activity reported in coastal

Scalefish Fishery Assessment: 2000
TAFI Technical Report No. 19 Page 5
fishing blocks. For details of data restrictions and manipulations involving Commonwealthdata refer to Appendix 2.
Since Tasmania has assumed management responsibility for striped trumpeter, all catch andeffort data for this species have been incorporated in the analyses, including fishing inCommonwealth waters.
2.2.3 Data analysis
For the purposes of this assessment, effort and catch rate analyses are restricted to dataprovided for the period July 1995 to June 2000. All catch returns available as at September2000 have been incorporated in the analyses.
Catch returns for which effort was unrealistically high or low (either due to data entry erroror misinterpretation of information requirements by fishers) have been excluded whencalculating effort and catch rates but the catches have been included in catch reporting.Effort information for approximately 0.5% of all fishing operations (daily catch records)were considered unreliable.
When reporting annual data, a fishing year from July to June has been adopted. The primaryjustification being that this period better reflects the seasonality in the fisheries for mostspecies, with catches (and effort) tending to be concentrated between late spring and earlyautumn.
In generating catch rate statistics the geometric mean of all valid individual records has beencalculated. The geometric mean approach is recommended because catch rates tend to belog-normally distributed.
2.2.4 Recreational fishery
A national survey of recreational fishing is in progress and will provide catch and effortinformation for the recreational sector in 2000/01 at national, state and regional levels.Survey results were unavailable at the time of writing but will be incorporated in futureassessments.
A previous state-wide survey of fishing activity by licensed recreational fishers, conductedbetween December 1996 - April 1998, represents the only available information aboutrecreational effort and catches in Tasmania (Lyle, 2000).
2.3 Recent catch trendsAnnual commercial catches by species since 1990/91 are presented in Table 2.1. Overall,scalefish catches have declined from over 2,000 tonnes in the early 1990s to between 1,100– 1,500 tonnes in recent years. The 1999/2000 catch of 1145 tonnes represented a decline ofjust over 15% when compared with the previous year. Falls in blue warehou, Australiansalmon and jack mackerel catches contributed significantly to the overall drop in scalefishproduction.
The decline in the reported catch of ‘Commonwealth’ species (as defined in Table 2.1) since1997, principally blue eye trevalla, is a consequence of the introduction of theCommonwealth non-trawl logbook and the fact that fishing occurs in offshoreCommonwealth waters. Tuna catches have also been reported in Commonwealth logbooks

Scalefish Fishery Assessment: 2000
TAFI Technical Report No. 19 Page 6
since the early 1990’s and, as a consequence, actual catches in recent years are under-represented in the data. Catches of sharks (mainly school and gummy shark) have fluctuatedbetween 1000 and1600 tonnes p.a. since 1990/91 but represent only the Tasmaniancomponent of the Southern Shark Fishery and need to be considered in the context of thewider shark fishery. These data are incorporated as part of the shark stock assessmentsundertaken by SSFAG and are not considered further here.
The sharp rise in the cephalopod catch in 1999/2000, to almost 600 tonnes, was the result ofincreased arrow squid catches combined with relatively high catches of calamary andoctopus.
Catch trends for the major species are summarised in Fig. 2.1. Australian salmon haveconsistently dominated the scalefish catch, with catches in excess of 650 tonnes p.a. prior to1995/96. More recent landings have remained lower, fluctuating between about 300 - 475tonnes. The 1999/2000 catch of 345 tonnes represented a decline of 10% compared with1998/99 but was within the catch range for the reference years 1990/91 – 1997/98. Thegenerally lower landings in recent years were due largely to a decline in the beach seinecatch, itself a response to reduced bait-market demand.
Barracouta catches declined sharply from around 350 tonnes in the early 1990s to around 60tonnes by 1993/94. Since then landings have remained at low levels, reflecting, in part atleast, low market demand. For the past two years catches were maintained at around 25tonnes p.a.
Catches of flounder have tended to range between 30 – 40 tonnes, the most recent dataindicating a lower catch of around 20 tonnes, slightly below the minimum reported duringthe reference period.
The catch history for bastard trumpeter has been characterised by relatively minorfluctuations between years, with catches in the range of 35 – 65 tonnes p.a. The 1999/2000catch of 35 tonnes represented a 25% reduction compared with the previous year. Incontrast, striped trumpeter production levels have generally increased since the early 1990’s,with annual catches for the past two years exceeding 100 tonnes.
Flathead, jackass morwong and whiting catches all declined between the early 1990’s and1995/96. Subsequent catches have remained relatively stable at levels of below 50 tonnesp.a. A reduction in inshore trawl (otter trawl and Danish seine) activity has largelycontributed to these declines (Lyle and Jordan 1999).
Apart from the mid-1990’s, sea garfish production has remained relatively stable at between80 – 100 tonnes p.a. over the past decade.
The development of live fish markets for banded morwong and wrasse during the early1990’s resulted in marked increases in the catch of both species. Subsequent to 1995/96,wrasse catches stabilised at around 85 - 100 tonnes p.a. whereas banded morwong catcheshave declined steadily, from almost 90 tonnes in 1995/96 to just 30 tonnes in 1999/2000.
Since the early 1990’s, blue warehou catches have fluctuated widely, between around 100 –300 tonnes, with the most recent catch of around 180 tonnes representing a decline of about34% on the previous year. This species is also harvested in the Commonwealth managedSouth East Fishery (SEF) by both trawl and gillnet methods.
Scalefish Fishery Assessment: 2000
TAFI Technical Report No. 19 Page 7
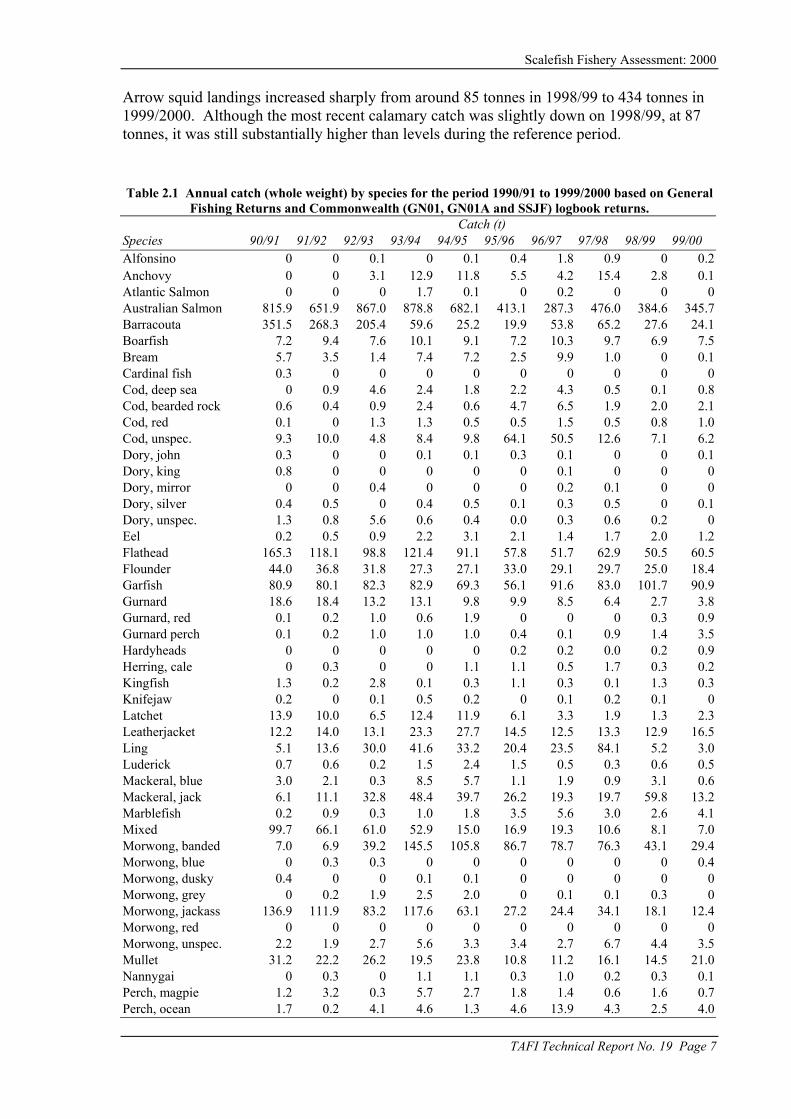
Arrow squid landings increased sharply from around 85 tonnes in 1998/99 to 434 tonnes in1999/2000. Although the most recent calamary catch was slightly down on 1998/99, at 87tonnes, it was still substantially higher than levels during the reference period.
Table 2.1 Annual catch (whole weight) by species for the period 1990/91 to 1999/2000 based on GeneralFishing Returns and Commonwealth (GN01, GN01A and SSJF) logbook returns.
Catch (t)Species 90/91 91/92 92/93 93/94 94/95 95/96 96/97 97/98 98/99 99/00Alfonsino 0 0 0.1 0 0.1 0.4 1.8 0.9 0 0.2Anchovy 0 0 3.1 12.9 11.8 5.5 4.2 15.4 2.8 0.1Atlantic Salmon 0 0 0 1.7 0.1 0 0.2 0 0 0Australian Salmon 815.9 651.9 867.0 878.8 682.1 413.1 287.3 476.0 384.6 345.7Barracouta 351.5 268.3 205.4 59.6 25.2 19.9 53.8 65.2 27.6 24.1Boarfish 7.2 9.4 7.6 10.1 9.1 7.2 10.3 9.7 6.9 7.5Bream 5.7 3.5 1.4 7.4 7.2 2.5 9.9 1.0 0 0.1Cardinal fish 0.3 0 0 0 0 0 0 0 0 0Cod, deep sea 0 0.9 4.6 2.4 1.8 2.2 4.3 0.5 0.1 0.8Cod, bearded rock 0.6 0.4 0.9 2.4 0.6 4.7 6.5 1.9 2.0 2.1Cod, red 0.1 0 1.3 1.3 0.5 0.5 1.5 0.5 0.8 1.0Cod, unspec. 9.3 10.0 4.8 8.4 9.8 64.1 50.5 12.6 7.1 6.2Dory, john 0.3 0 0 0.1 0.1 0.3 0.1 0 0 0.1Dory, king 0.8 0 0 0 0 0 0.1 0 0 0Dory, mirror 0 0 0.4 0 0 0 0.2 0.1 0 0Dory, silver 0.4 0.5 0 0.4 0.5 0.1 0.3 0.5 0 0.1Dory, unspec. 1.3 0.8 5.6 0.6 0.4 0.0 0.3 0.6 0.2 0Eel 0.2 0.5 0.9 2.2 3.1 2.1 1.4 1.7 2.0 1.2Flathead 165.3 118.1 98.8 121.4 91.1 57.8 51.7 62.9 50.5 60.5Flounder 44.0 36.8 31.8 27.3 27.1 33.0 29.1 29.7 25.0 18.4Garfish 80.9 80.1 82.3 82.9 69.3 56.1 91.6 83.0 101.7 90.9Gurnard 18.6 18.4 13.2 13.1 9.8 9.9 8.5 6.4 2.7 3.8Gurnard, red 0.1 0.2 1.0 0.6 1.9 0 0 0 0.3 0.9Gurnard perch 0.1 0.2 1.0 1.0 1.0 0.4 0.1 0.9 1.4 3.5Hardyheads 0 0 0 0 0 0.2 0.2 0.0 0.2 0.9Herring, cale 0 0.3 0 0 1.1 1.1 0.5 1.7 0.3 0.2Kingfish 1.3 0.2 2.8 0.1 0.3 1.1 0.3 0.1 1.3 0.3Knifejaw 0.2 0 0.1 0.5 0.2 0 0.1 0.2 0.1 0Latchet 13.9 10.0 6.5 12.4 11.9 6.1 3.3 1.9 1.3 2.3Leatherjacket 12.2 14.0 13.1 23.3 27.7 14.5 12.5 13.3 12.9 16.5Ling 5.1 13.6 30.0 41.6 33.2 20.4 23.5 84.1 5.2 3.0Luderick 0.7 0.6 0.2 1.5 2.4 1.5 0.5 0.3 0.6 0.5Mackeral, blue 3.0 2.1 0.3 8.5 5.7 1.1 1.9 0.9 3.1 0.6Mackeral, jack 6.1 11.1 32.8 48.4 39.7 26.2 19.3 19.7 59.8 13.2Marblefish 0.2 0.9 0.3 1.0 1.8 3.5 5.6 3.0 2.6 4.1Mixed 99.7 66.1 61.0 52.9 15.0 16.9 19.3 10.6 8.1 7.0Morwong, banded 7.0 6.9 39.2 145.5 105.8 86.7 78.7 76.3 43.1 29.4Morwong, blue 0 0.3 0.3 0 0 0 0 0 0 0.4Morwong, dusky 0.4 0 0 0.1 0.1 0 0 0 0 0Morwong, grey 0 0.2 1.9 2.5 2.0 0 0.1 0.1 0.3 0Morwong, jackass 136.9 111.9 83.2 117.6 63.1 27.2 24.4 34.1 18.1 12.4Morwong, red 0 0 0 0 0 0 0 0 0 0Morwong, unspec. 2.2 1.9 2.7 5.6 3.3 3.4 2.7 6.7 4.4 3.5Mullet 31.2 22.2 26.2 19.5 23.8 10.8 11.2 16.1 14.5 21.0Nannygai 0 0.3 0 1.1 1.1 0.3 1.0 0.2 0.3 0.1Perch, magpie 1.2 3.2 0.3 5.7 2.7 1.8 1.4 0.6 1.6 0.7Perch, ocean 1.7 0.2 4.1 4.6 1.3 4.6 13.9 4.3 2.5 4.0

Scalefish Fishery Assessment: 2000
TAFI Technical Report No. 19 Page 8
Table 2.1 ContinuedCatch (t)
Species 90/91 91/92 92/93 93/94 94/95 95/96 96/97 97/98 98/99 99/00Pike, long-finned 0.1 0 0.1 0.3 0.2 0.3 3.1 3.9 9.4 16.1Pike, short-finned 10.4 9.5 11.0 12.4 18.6 13.7 15.2 17.7 3.2 4.0Pilchard 0.1 0 0.7 1.7 0.3 1.1 0 0 0 0Rays bream 0 1.2 0.6 0.2 0.5 2.0 2.0 0.2 0 0Redbait 0 0.7 0.8 0 0 0.1 0 0 4.0 0Red mullet 0.4 0 0.2 0.3 0.1 0.2 0.1 0 0 0Silverfish 0.4 0 0.2 0 0.3 0.0 0.4 0.1 0 0.1Snapper 0 0 0 0 0.2 0.2 0.2 0.9 1.5 0.6Stargazer 10.7 3.0 1.2 4.3 1.5 0.2 0 0.3 0.1 0.2Sweep 1.5 1.4 0.8 0.8 2.0 1.1 0.5 0.6 0.4 0.3Tailor 0 0 0 0 0 0 0.7 0 0 0.1Trevalla, unspec. 1.1 20.9 10.0 0.8 1.4 0 0 3.5 0 1.8Trevalla, white 0.6 0 0.1 0 0.2 0 0.1 0 0.9 0Trevally, silver 15.0 12.2 2.5 5.9 15.5 5.9 4.5 7.8 8.0 3.7Trevally, unspec. 5.6 1.4 9.5 2.4 6.1 0 0 0 0 0Trout 0 0 0.5 0 0 0.4 0.8 3.6 1.1 0.1Trumpeter, bastard 63.3 37.2 34.0 54.8 50.8 59.7 51.5 40.6 47.2 35.1Trumpeter, striped 74.5 58.2 52.7 56.5 72.4 60.2 82.3 81.1 107.5 100.9Trumpeter, unspec. 0.7 0 0 0.4 0.1 0.2 0.1 0.6 3.4 0.1Warehou, blue 257.6 317.6 187.7 250.1 205.4 82.1 128.9 190.8 274.1 180.1Warehou, spotted 0.7 0.4 4.2 8.8 3.4 14.6 15.6 4.8 0 0Whiptail 0 0 0 0 0 0 0 0 0.1 0Whiting 124.2 152.3 84.3 97.9 81.4 25.4 39.3 48.1 30.4 24.6Whiting, King George 0.1 0.4 0.1 0.1 0.2 0.1 0.3 0.2 0.2 7.1Wrasse 57.2 71.7 97.3 142.4 178 83.3 110.1 100.3 90.7 84.8Other (unspec.) 0 0 0 0 0 0.8 0.5 2.6 0.5 0.3Total scalefish 2449.9 2154.1 2134.7 2367.1 1933.5 1258.9 1290.0 1551.8 1379.0 1147.5
CephalopodsCalamary 8.2 7.5 5.8 9.7 12.6 33.0 19.0 26.6 94.4 87.0Cuttlefish 0.5 0.7 0 1.1 0.8 0.2 0.3 0.2 0 0Octopus 32.2 35.2 47.4 58.2 55.3 76.8 40.8 43.4 85.4 65.3Squid, arrow 35.1 7.2 7 7.7 8.6 5.7 7.9 12.9 85.6 434.1Total cephalopod 75.9 50.6 60.2 76.7 77.3 115.7 67.9 83.0 265.4 586.4
‘Commonwealth’ sp.Blue grenadier 3.6 0.1 3.2 5.2 4.2 8.9 12.3 1.7 0 0.1Gemfish 3.4 1.7 1 0.4 0.9 5.0 6.1 2.9 0.1 0Hapuka 7.2 4.9 19.1 21.4 16.0 2.7 1.7 4.7 0.1 0.1Oreo 0.5 0 0.1 0 0 0.1 0 0 0 0Trevalla, blue eye 206.6 296.5 261.2 288.7 347.7 436.4 575.8 138.5 14.0 2.9Total ‘Comm.’ Sp. 221.3 303.2 284.6 315.7 368.8 453.1 595.9 147.8 14.2 3.1TunaTuna, albacore 36.7 72.9 43.4 26.9 3.4 1.4 4.7 5.5 2.5 0.7Tuna, skipjack 13.8 14.1 8.2 0.6 0.7 0.3 0.4 0.3 6.8 0.5Tuna, southern bluefin 46.7 24.1 10.8 2.3 1.8 0.6 0.9 0 0 0.2Tuna, unspec. 11.3 10.2 8.9 4.9 1.1 0.2 0.5 0.4 0.9 0.5Total tuna 108.4 121.3 71.3 34.7 7.0 2.4 6.5 6.3 10.2 1.9Sharks & RaysShark 1472.7 1114.2 1671.3 1483.8 1427.4 1248.5 1026.5 1128.3 1094.1 1365.6Skates & Rays 2.6 7.4 5.1 6.3 5.9 6.4 2.1 4.7 7.8 5.5Total shark & ray 1475.5 1121.6 1676.4 1490.1 1433.3 1254.9 1028.6 1133.0 1101.9 1371.1

Scalefish Fishery Assessment: 2000
TAFI Technical Report No. 19 Page 9
Fig. 2.1 Annual catches for key scalefish species 1990/91 to 1999/2000. Dotted lines indicate upper and lowercatch levels for the catch reference period (1990/91-97/98 for all species except banded morwong [1994/95-97/98] and wrasse [1995/96-97/98]).
Australian salmon
0
200
400
600
800
1000
90/91
91/92
92/93
93/94
94/95
95/96
96/97
97/98
98/99
99/00
Catch (tonn
Barracouta
0
100
200
300
400
90/91
91/92
92/93
93/94
94/95
95/96
96/97
97/98
98/99
99/00
Catch (tonn
Flathead
0
50
100
150
200
90/91
91/92
92/93
93/94
94/95
95/96
96/97
97/98
98/99
99/00
Cat
ch (t
onne
s)
Flounder
0
10
20
30
40
50
90/91
91/92
92/93
93/94
94/95
95/96
96/97
97/98
98/99
99/00
Catch (tonn
Garfish
0
20
40
60
80
100
120
90/91
91/92
92/93
93/94
94/95
95/96
96/97
97/98
98/99
99/00
Cat
ch (t
onne
s)
Banded morwong
0
40
80
120
160
90/91
91/92
92/93
93/94
94/95
95/96
96/97
97/98
98/99
99/00
Cat
ch (t
onne
s)
Jackass morwong
0
40
80
120
160
90/91
91/92
92/93
93/94
94/95
95/96
96/97
97/98
98/99
99/00
Cat
ch (t
onne
s)
Bastard trumpeter
0
20
40
60
80
90/91
91/92
92/93
93/94
94/95
95/96
96/97
97/98
98/99
99/00
Cat
ch (t
onne
s)
Striped trumpeter
0
20
40
60
80
100
120
90/91
91/92
92/93
93/94
94/95
95/96
96/97
97/98
98/99
99/00
Cat
ch (t
onne
s)
Blue warehou
0
100
200
300
400
90/91
91/92
92/93
93/94
94/95
95/96
96/97
97/98
98/99
99/00
Cat
ch (t
onne
s)

Scalefish Fishery Assessment: 2000
TAFI Technical Report No. 19 Page 10
Fig. 2.1 Continued.
2.4 EffortThe Scalefish Management Plan contains two trigger points that pertain to fishing effort, onebased on effort relating to a particular gear type and the other based on effort targetedtowards a species or species group. A trigger point is reached when effort exceeds the peaklevel for the period 1995-1997 by at least 10%.
2.4.1 Method based effort
Method based effort triggers are intended more as indicators of fishery performance than asmeaningful biological reference points. Specifically, the Scalefish Management Plan wasdeveloped to limit the potential for expansion of fishing effort by defining and limitingaccess in terms of gear allocation. The impact or performance of these managementarrangements may, therefore, be assessed in terms of trends in fishing effort for the mainfishing methods.
Catch and effort by the major fishing methods are presented in Table 2.2. Since a range offishing methods are represented it has been necessary to express effort in units appropriateto the specific fishing method (Table 2.3). However, because it has become apparent thatsome operators have misinterpreted reporting requirements for effort, effort has also beenexpressed in terms of days fished.
Reporting of dropline catch and effort has been restricted to depths of less than 200 m toexclude fishing for blue eye trevalla (now managed by the Commonwealth). Since less than1% of the striped trumpeter catch is reported from depths greater than 200 m, this restrictioneffectively encompasses the target dropline fishery for striped trumpeter. While catch andeffort for shark net and bottom longline methods have been included in this analysis, thesemethods relate specifically to the shark fishery (with shark accounting for over 90% of thecatch taken by each method), which is now managed by the Commonwealth.
Calamary
0
20
40
60
80
100
90/9
1
91/9
2
92/9
3
93/9
4
94/9
5
95/9
6
96/9
7
97/9
8
98/9
9
99/0
0
Cat
ch (t
onne
s)
Arrow squid
0
100
200
300
400
500
90/9
1
91/9
2
92/9
3
93/9
4
94/9
5
95/9
6
96/9
7
97/9
8
98/9
9
99/0
0
Cat
ch (t
onne
s)
W rasse
0
50
100
150
200
90/91
91/92
92/93
93/94
94/95
95/96
96/97
97/98
98/99
99/00
Cat
ch (t
onne
s)
Whiting
0
40
80
120
16090
/91
91/9
2
92/9
3
93/9
4
94/9
5
95/9
6
96/9
7
97/9
8
98/9
9
99/0
0
Cat
ch (t
onne
s)

Scalefish Fishery Assessment: 2000
TAFI Technical Report No. 19 Page 11
Inferences about the status of the fishery and the impacts of recent management changes arelimited due to the short time series of available data. In fact, since the new licensingarrangements only took effect part way through the 1998/99 fishing year (November 1998),less than two years of data under the new arrangements are available for this assessment.
Effort levels in 1999/2000 were higher than during the reference period for dropline, dip net,squid jig and spear methods whereas fish trap effort was within the reference range (Table2.2)1. For the remaining key fishing methods, including graball and handline, current effortlevels were lower than prior to the introduction of the management plan.
By comparison with 1998/99, current squid jig and spear effort (based on gear units) wereonly; effort for all other methods had in fact declined. A similar pattern was evident fordays fished in all but beach seine, dropline and handline methods. For this group, more dayswere fished using these methods in 1999/2000 although overall less gear was used.
Despite this variability in effort, current catches for the key methods were within previouslevels for all but dropline and squid jig methods. In both of these instances, catchesexceeded reported levels since 1995/96.
In terms of the effort based criterion, 1999/2000 effort levels for dropline, dip net, squid jigand spear methods were at least 10% higher than the peak for the reference period (see Table2.2). The effort increases were moderate (14-23%) for dropline, dip net and spear methodsbut were substantial (over a hundred-fold increase) for squid jigs, due largely to the activityof automatic jig vessels targeting arrow squid. Effort triggers were not exceeded for theremaining methods. In fact, beach seine, purse seine, graball, small mesh net and handlineeffort levels were substantially lower than for preceding four years. Most of these methodshave been constrained in terms of access, through limited entry (beach seine, purse seine,small mesh net), or through gear restrictions (graball), under the scalefish management plan.By contrast, all operators are permitted to us handlines, however, one of the primaryhandline species, (live) wrasse, is itself subject to a limited entry fishery and handline efforttargeted at wrasse has declined markedly in recent years.
Notwithstanding the above, there are concerns, especially from industry, regarding the levelof latent effort from licence-holders who are currently either not active in the fishery orparticipating at low levels but with access to gear such as gillnets, hooks, dip nets and jigs(available to all scalefish licence-holders).
1 Shark net and longline methods have not been included in this comparison.

Scalefish Fishery Assessment: 2000
TAFI Technical Report No. 19 Page 12
Table 2.2 Total annual catch and effort by major fishing methods for the period 1995/96-1999/2000.# Gear units of effort are defined in Table 2.3. * Five or fewer vessels involved, data not shown.
Fishing Catch EffortMethod year (kg) Gear units# Days fished
Seine Beach seine 1995/96 469129 1086 5671996/97 364252 1358 6971997/98 520894 1206 5851998/99 448087 903 4081999/2000 403968 873 435
Purse seine 1995/96 35182 417 1871996/97 30419 336 1541997/98 41786 319 1571998/99 77056 242 1621999/2000 31942 229 119
Gillnet Graball 1995/96 346697 223284 55251996/97 377218 235176 52661997/98 455607 234863 53421998/99 494684 166615 48241999/2000 354460 154289 4234
Small mesh net 1995/96 38575 11039 2911996/97 26847 8000 2661997/98 21770 7992 2491998/99 31144 7863 2881999/2000 22136 6014 206
Shark net 1995/96 1073892 663541 27981996/97 932328 817457 31911997/98 1051181 1137866 46041998/99 1025029 1207666 49201999/2000 1246811 1278318 5228
Hook Dropline (<200m) 1995/96 19866 433 1591996/97 30092 436 2071997/98 22676 480 2071998/99 29448 610 2661999/2000 31746 591 286
Handline 1995/96 75956 17153 16591996/97 94318 21538 19061997/98 98927 21065 17311998/99 92207 17536 13401999/2000 98217 16605 1454
Bottom longline 1995/96 204083 4648 5771996/97 121941 3918 4821997/98 96584 3452 4861998/99 102933 2314 5721999/2000 141415 4133 689

Scalefish Fishery Assessment: 2000
TAFI Technical Report No. 19 Page 13
Table 2.2 ContinuedFishing Catch Effort
Method year (kg) Gear units* Days fishedTrolling 1995/96 19563 3497 358
1996/97 62039 9755 6001997/98 76189 13520 6921998/99 46211 9500 484
1999/2000 39933 6096 420Trap Fish trap 1995/96 41764 9829 1454
1996/97 57144 10710 17991997/98 49898 9873 18771998/99 53571 10698 1583
1999/2000 55855 10476 1628Other Squid jig 1995/96 8710 5006 97
1996/97 5791 554 751997/98 17489 7172 1951998/99 145098 171339 663
1999/2000 488409 906491 1255Spear 1995/96 13991 1391 371
1996/97 19236 1845 4671997/98 16806 1981 4871998/99 19307 1830 450
1999/2000 19009 2257 486Dip net 1995/96 * * *
1996/97 24151 1517 3641997/98 33271 1707 4151998/99 42641 2679 556
1999/2000 24872 1973 427
Table 2.3 Table of effort gear units by fishing method
Method(s) Effort gear unitsBeach seine/purse seine No. of shotsGraball/shark net/small meshnet
100 m net hours
Dropline/bottom longline 100 hook liftsHandline/trolling Line hoursFish trap No. trap or pot liftsSquid jig Jig hoursSpear Fisher hoursDip net Dip net hours
2.4.2 Species based effort
Individual species may be taken by a variety of methods, either as a target or non-targetedcatch. Targeting is an important and relevant issue when considering effort; a fact that ishighlighted in the species based performance indicators outlined in the ScalefishManagement Plan. Although targeting has not been recorded in the General FishingReturns, inferences can be made by considering the relative importance of a species in the
Scalefish Fishery Assessment: 2000
TAFI Technical Report No. 19 Page 14
catch2. Based on experience in other fisheries and field observations in this fishery, when aspecies is targeted it will, generally, account for a significant proportion of the catch. Therewill, however, be times when target species are either not caught or only represent a minorcomponent of the catch. In such instances, the correct classification of fishing operationswill be difficult and targeting may be incorrectly classified. Unless otherwise specified, theissue targeting has not been addressed in this report.
For the purposes of analysis, effort has only been assigned to a species when that specieswas reported in the catch (whether taken as a targeted species or as incidental catch). Effortfor the key species or species groups by fishing method are presented in Chapters 3-9.
2.5 Catch ratesCatch rates of catch per unit effort (CPUE) is often used in fisheries assessment as an indexof resource abundance. In the context of the scalefish management plan, a catch rate triggeris exceeded when the catch rate falls below 80% of the lowest catch rate for the referenceperiod, 1995/96 to 1997/98. CPUE values by method for key species are discussed inChapters 3-9.
2.6 Recreational fishery
2.6.1 Gillnet fishery
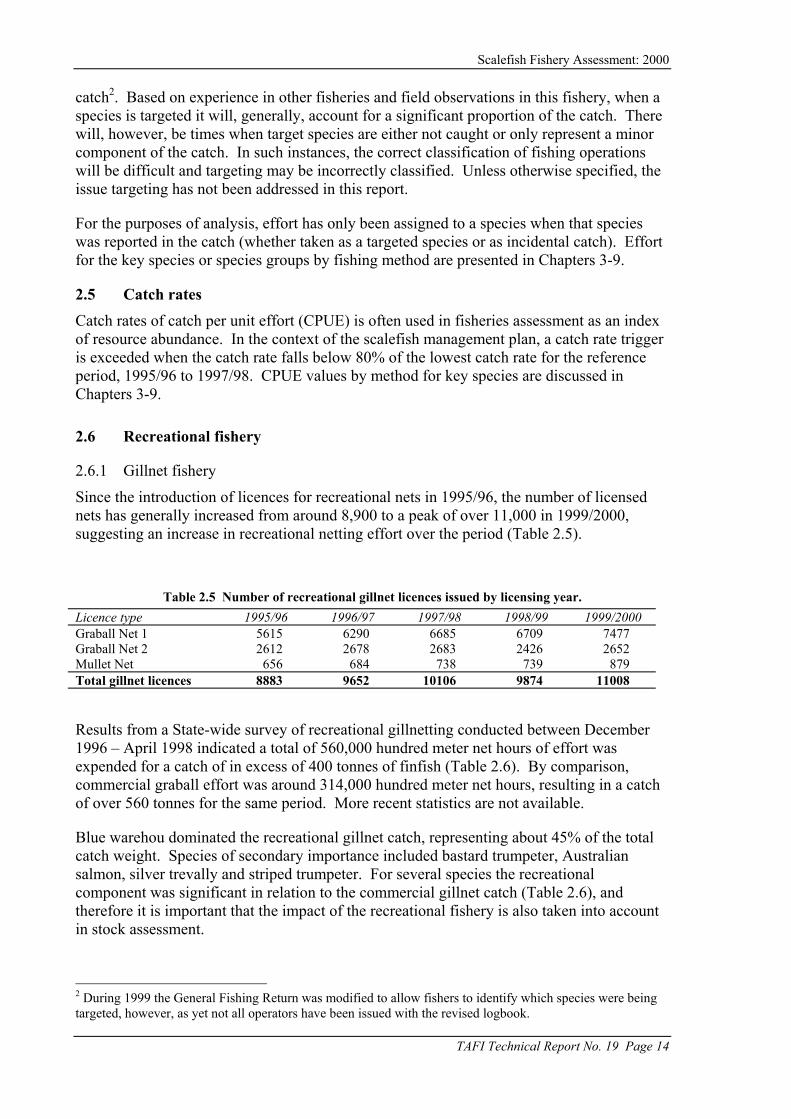
Since the introduction of licences for recreational nets in 1995/96, the number of licensednets has generally increased from around 8,900 to a peak of over 11,000 in 1999/2000,suggesting an increase in recreational netting effort over the period (Table 2.5).
Table 2.5 Number of recreational gillnet licences issued by licensing year.Licence type 1995/96 1996/97 1997/98 1998/99 1999/2000Graball Net 1 5615 6290 6685 6709 7477Graball Net 2 2612 2678 2683 2426 2652Mullet Net 656 684 738 739 879Total gillnet licences 8883 9652 10106 9874 11008
Results from a State-wide survey of recreational gillnetting conducted between December1996 – April 1998 indicated a total of 560,000 hundred meter net hours of effort wasexpended for a catch of in excess of 400 tonnes of finfish (Table 2.6). By comparison,commercial graball effort was around 314,000 hundred meter net hours, resulting in a catchof over 560 tonnes for the same period. More recent statistics are not available.
Blue warehou dominated the recreational gillnet catch, representing about 45% of the totalcatch weight. Species of secondary importance included bastard trumpeter, Australiansalmon, silver trevally and striped trumpeter. For several species the recreationalcomponent was significant in relation to the commercial gillnet catch (Table 2.6), andtherefore it is important that the impact of the recreational fishery is also taken into accountin stock assessment.
2 During 1999 the General Fishing Return was modified to allow fishers to identify which species were beingtargeted, however, as yet not all operators have been issued with the revised logbook.

Scalefish Fishery Assessment: 2000
TAFI Technical Report No. 19 Page 15
Table 2.6 Comparison of catch and effort for recreational and commercial gillnet fisheries for keyspecies. Based on the period Dec 1996 – April 1998.
Gillnet catch (tonnes)Species Recreational CommercialBlue warehou 191.6 230.9Bastard trumpeter 42.0 73.3Australian salmon 28.3 27.5Silver trevally 30.3 3.6Striped trumpeter 22.4 28.6Cod 14.7 7.9Leatherjacket 12.4 4.7Mullet 10.1 6.3Wrasse 10.0 28.0Jackass morwong 9.5 20.1Flounder 8.5 18.7Jack mackerel 7.1 5.4Flathead 6.5 4.5Banded morwong 1.8 105.8Effort (100 m net hours) 560160 314170
2.6.2 Other methods
Apart from gillnetting, there has been no comprehensive assessment of the recreationalscalefish fishery to date. However, information about the fishing activity of recreationallicence holders has been collected. Although data do not include the activity of non-licensedrecreational fishers, it was evident that species such as flathead, Australian salmon,barracouta and striped trumpeter are important to the line fishery while flounder arecommonly targeted using spears (Lyle 2000). Based on incomplete fishery coverage (i.e.licensed fishers only), the estimated flathead and barracouta catches both exceeded 100tonnes for the period December 1996 – April 1998, while catches of 10-30 tonnes wereestimated for Australian salmon, cod, striped trumpeter and jackass morwong during thesame period. These findings indicate that recreational catches of several key species aresignificant, probably exceed the commercial catch.
The 2000/01 national recreational fishing survey will provide for a more comprehensiveassessment of recreational catch and effort.
2.7 Uncertainties
While considerable attention has been given to ensure comparability of commercial catchand effort data over time (refer Appendix 2), it is acknowledged that some recentadministrative changes in the reporting of catches may have, nonetheless, exerted aninfluence on observed catch and effort trends.
Other uncertainties in this assessment relate to limitations in catch and effort data, both interms of the short time series available and the level of detail collected from the commercialfishery. Within the context of the time series, five years is barely sufficient to infermeaningful trends in the status of either the fishery or fish stocks. In addition, since theGeneral Fishing Return was designed to encompass a diverse range of fishing activities,compromises have been necessary, with data collection on a daily rather than operational(set or shot) basis. The lack of information about targeting also complicates interpretation ofCPUE.

Scalefish Fishery Assessment: 2000
TAFI Technical Report No. 19 Page 16
It has also become apparent that some fishers have experienced problems in correctlyinterpreting or complying with reporting requirements, especially in terms of effortinformation, and there is an urgent need to educate fishers in this area. Further, the lack ofvalidation of the Tasmanian logbook data remains an issue in relation to data quality.
Catch and effort (at the fishing method and species levels) are influenced by a combinationof factors which include fishers matching their fishing operations against changing marketrequirements and/or resource availability, as well as responses to changing managementarrangements. The latter add further uncertainty regarding the underlying causes of anyobserved trends in catch and effort. There is, therefore, a clear need to factor in thedynamics of the fishery, including impacts of management change when assessing thefishery as a whole.
The lack of comprehensive information about the recreational fishery is a major uncertaintyalthough the current national survey will provide an important snapshot of this fishery.There is, however, an urgent need to consider on-going monitoring of the recreationalfishery, without which attempts to assess the status of species with significant recreationalcatches, will be either biased or incorrect.
2.8 Implications for ManagementIn many respects the commercial fishery is still in a state of flux, not only in response tochanging marketing requirements and/or resource availability but also to managementchanges. The introduction of the Scalefish Management Plan defined access and gearentitlements but recent changes in other fisheries, such as the Tasmanian rock lobster fishery(move to a ITQ management system) and Commonwealth fisheries including shark, are alsolikely to have an impact on fisher’s behaviour. For example, there is already evidence ofeffort shift into the less regulated activities, for instance in the increased use of squid jigsand dip nets.
As an indicator of fishery and resource status, a considerable time series of catch and effortdata is required. In the short to medium term, uncertainty will be associated with thisfishery in regards to the implications of trends in catch and effort.

Scalefish Fishery Assessment: 2000
TAFI Technical Report No. 19 Page 17
3 Striped Trumpeter (Latris lineata)
3.1 Management BackgroundStriped trumpeter has had a long history of exploitation in Tasmania, being highly esteemedfor it’s eating qualities. The species are taken by a variety of fishing methods includinghooks and gillnets but are also taken in small quantities as a bycatch to demersal trawling onthe shelf. Juvenile striped trumpeter are taken predominantly by graball net in inshore waters(within 3 nautical miles) and usually in depths <20 m whereas adult fish are taken in deeperoffshore waters by hook methods (dropline, handline, longline) and by large mesh gillnets(shark nets).
Responsibility for management of striped trumpeter in both inshore and offshore (from 3 –200 nautical miles) waters was passed to the Tasmania in 1996 through an OCS arrangementwith the Commonwealth. A Memorandum of Understanding accompanied the OCS,specifying trip limits for Commonwealth only fishers of 100 kg for South East Non-Trawl(SENT) permit holders and 20 kg for all other permit holders.
When the Tasmanian scalefish fishery management plan was implemented in 1998, gearrestrictions were introduced for all commercial scalefish fishers operating in State waters.However, after the introduction of the management plan those fishers who held both aTasmanian scalefish licence and a Commonwealth permit to fish in the southern shark orSENT fisheries were effectively allowed to target unrestricted quantities of striped trumpeterin offshore waters using their Commonwealth gear allocations. In addition, Tasmanian rocklobster fishers were also allowed to target unrestricted quantities of striped trumpeter inoffshore waters using their State scalefish gear allocations.
In August 2000, the State Government introduced a combined trip limit of 250 kg of stripedtrumpeter, yellowtail kingfish and red snapper for all fishers (Commonwealth and State), inall inshore and offshore waters relevant to Tasmania. This measure was introduced becauseit was recognised that the striped trumpeter fishery was not a year round fishery able tosustain continuous targeting, but had developed a niche as part of a diversified fishery, andrequired some protection against over-fishing. Further, introduction of quotas for key SENTspecies and for rock lobster, plus impending output control management of the southernshark fishery, meant that striped trumpeter may be vulnerable to additional targeting byoperators participating in these fisheries. A bag and possession limit of five stripedtrumpeter has also been introduced for recreational fishers.
A legal minimum size limit of 35 cm total length (TL) applies for striped trumpeter(increased from 33 cm with the introduction of the scalefish management plan).
3.2 Stock Structure and Life-historyStriped trumpeter are distributed throughout southern Australia, from Sydney around toKangaroo Island in South Australia, including Tasmania. The species is also found in NewZealand. They are reported to grow to 1.2 m in length and 25 kg in weight (Gomon et al.1994). They occur mainly on the continental shelf over rocky bottom to depths of about 300m, although juveniles are known to occur on shallow reefs throughout Tasmania. Asnothing is known of the stock structure of striped trumpeter in Australian waters a commonstock throughout its range is assumed for management purposes. A recent report of a striped
Scalefish Fishery Assessment: 2000
TAFI Technical Report No. 19 Page 18
trumpeter tagged off eastern Tasmania and recaptured off southern NSW provides somesupport for a common Australian stock.
Little is known of the life history of striped trumpeter. Spawning occurs from July to earlyOctober, depending on geographical location (Ruwald et al. 1991), with spawningcommencing and finishing earlier at lower latitudes. Females reach maturity at a smallersize and age (44 cm and 5 years) than males (53 cm and 8 years) (Hutchinson 1994).Striped trumpeter are multiple spawners, highly fecund (100 000 to 400 000 eggs forfemales weighing 3.2 and 5.2 kg, respectively) and produce small pelagic eggs (1.3 mmdiameter) with a single oil droplet (Ruwald et al. 1991, Ruwald 1992, Hutchinson 1994).Larval rearing trials indicate a complex and extended larval phase, with metamorphosis fromthe post-larval ‘paperfish’ stage probably occurring up to nine months after hatching. Thedistribution of larvae and recruitment processes are unknown.
While no information is available on the size and timing of settlement, small juveniles ataround 18 cm fork length (FL) have been caught on shallow reefs throughout south-easternTasmania in January (Murphy and Lyle 1999). Tagging studies suggest that juveniles tendto remain in around shallow reefs for several years, with only limited movement. There arealso indications of movement of larger juveniles into deeper offshore reefs which issupported by data from the commercial fishery which shows fish around 45 cm recruiting tothe offshore hook fishery.
Growth in juveniles is rapid, reaching a mean length of around 28 cm after two years and 42cm after four years, with most growth occurring during summer and autumn (Murphy andLyle 1999). Older fish grow significantly more slowly, with a large range in size-at-age infish over approximately 50 cm. Maximum age is currently estimated to be 31 years and,while this has yet to be validated, the incremental structure in sectioned otoliths is clear andunambiguous. Age composition, mortality rates and productivity have not been estimated.
There is some evidence for marked recruitment variability in striped trumpeter, with a verystrong cohort spawned in 1993 (Murphy and Lyle 1998). The 1994 cohort also appeared tobe relatively strong, through its size relative to the 1993 cohort is unknown.
Few biological parameters have been defined for striped trumpeter (see Appendix 3). Thegrowth parameters defined are represented by few fish larger than 70 cm and are derivedfrom unvalidated age estimates for fish over 5 years old.
3.3 Previous AssessmentsPrevious assessments have been restricted to analysis of catch, effort and catch rate data andreporting on performance indicators (trigger points).
The 1998/99 catch was the highest on record, being particularly influenced by higherdropline, handline and graball catches, and therefore exceeded the catch trigger. The efforttrigger for handline fishing was also exceeded but CPUE remained within previous levels.
3.4 Current Assessment
3.4.1 The Fishery
Striped trumpeter are taken by a range of fishing methods, but predominately hook andgillnet methods (Fig. 3.1). Handline and dropline fishing accounted for around 55% of the

Scalefish Fishery Assessment: 2000
TAFI Technical Report No. 19 Page 19
total 1999/2000 catch of 100 tonnes. Fishing operations are conducted over hard bottom,with droplines generally fished in depths of 60-140 m and handlines between 40-80 m and120-160 m.
Reflecting their more inshore distribution, juvenile striped trumpeter are generally taken ingraball nets from inshore reef areas in depths of less than 20 m, often in association with anumber of other reef fish species. In 1999/2000, about 18% of the catch was taken bygraball net.
Striped trumpeter are also caught on longlines and in shark nets as a by-product of fishingfor school and gummy shark. In 1999/2000 these methods accounted 21% of the reportedcatch.
Striped trumpeter are taken commercially around the entire Tasmanian coastline, with thegreatest portion of the catch being taken from shelf grounds along the length of the east andsouth-east coasts and off Flinders Island. Relatively small catches are taken from the north-west, west and south-west coasts. There are few indications of shifts in the distribution ofcatches, although there was evidence of increased west coast catches in 1998/99.
������������������������
������������������������������������
������������������������������������
������������������������������������������������
������������������������������������������������
������������������������
������������������������
������������������������
������������������������
������������������������
������������
������������ ������������
������������ ������������������������
0
20
40
60
80
100
120
95/96 96/97 97/98 98/99 99/00
Cat
ch (t
onne
s)
Other�������� BL
SL����
SNGN����
���� HLDL
Figure 3.1. Annual catch of striped trumpeter by method. DL is dropline; HL is handline; GN is graball; SN isshark mesh net; SL is shark longline; BL is bottom longline.
3.4.2 Recent developments
Some limited monitoring of the offshore hook fishery for striped trumpeter in the south eastwas conducted in 1999/2000. The strong 1993 and to a lesser extent 1994 year-classes wereapparent in the catches which has implications for the interpretation of trends in catch andCPUE in the fishery. While there are limited data to assess the relative strength of thesubsequent year-classes, the movement of these two year-classes into the offshore hookfishery is likely to influence catches in this sector. Initially, small changes in CPUE (basedon weight) can be expected, although increased numbers of fish will be landed. As thesefish increase in size, CPUE should gradually rise assuming these cohorts continue todominate catches.
The inclusion of Commonwealth catch data in this assessment represents an importantdevelopment, providing a more comprehensive description of the fishery.
3.4.3 2000 Assessment
The 1999/2000 commercial catch of 100 tonnes was slightly down on the previous year butwas still higher than annual Tasmanian catches during the reference years 1990/01 –1997/98. However, if catches reported in Victorian logbooks, but taken in waters south of

Scalefish Fishery Assessment: 2000
TAFI Technical Report No. 19 Page 20
latitude 39° 12’S, are included (i.e. waters incorporated in the OCS agreement for stripedtrumpeter), then recent catches are of similar order to that reported in 1990/91 (Table 3.1).
The current assessment has been restricted to an examination of catch and effort trends forthe primary fishing methods for striped trumpeter, namely dropline, handline and graballnet. In an attempt to distinguish targeted fishing for striped trumpeter the followingassumptions have been made. Fishing on a given day, using these methods, has beenassigned as targeted if:
• the catch of striped trumpeter was greater than 10 kg and accounted for at least half ofthe total weight of all species retained; or
• the catch of striped trumpeter was greater than or equal to 50 kg.
Annual catch, effort and CPUE by method are summarised in Table 3.2 and are representedgraphically in Figs 3.1-3.3. Annual handline catches have increased steadily since 1995/96from around 13 to over 30 tonnes in 1999/2000. This increase has been largely due to risingeffort, with both targeted and total CPUE remaining relatively stable over the period.Dropline catches increased initially from around 15 tonnes and have been maintained ataround 25 tonnes p.a. since 1996/97. Up until 1998/99, dropline effort had tended toincrease each year while CPUE remained relatively stable, apart from a peak in targetedCPUE in 1996/97. In the most recent year, however, dropline effort fell by over 40%compared to that in 1998/99, but as this was offset by a sharp increase in CPUE, catcheswere maintained at similar levels. The presence of strong 1993 and 1994 year classes mayhave influenced the recent increase in CPUE. Limited catch sampling supports thisobservation.
Graball catches of striped trumpeter rose from 1995/96 to a peak in 1998/99, falling slightlyin 1999/2000. Striped trumpeter are not usually targeted using gillnets but generally occuras a by-product of targeting other scalefish species. This clearly evident in thecomparatively low levels of effort (and consequently the proportion of the catch) that metthe targeting criteria (Fig 3.3). Although the most recent targeted and to a lesser extent totalgraball CPUE values were down on 1998/99, they were comparable with previous years.
In the 1999 assessment it was noted that size composition data for graball catches suggestedthat 1998/99 CPUE peak was influenced by the presence of relatively large numbers of 3year-old fish (representing the 1996 year-class) (Jordan and Lyle 2000). As these fish growthey are expected to move into deeper water and thus become less vulnerable to graball nets.The decline in catch and CPUE in the most recent data is possibly indicative of thistransition.
The striped trumpeter resource status is uncertain; recruitment variability is likely to be amajor factor influencing abundance in the short to medium-term.
.
Table 3.1 Annual catches of striped trumpeter (tonnes) south of latitude 39° 12’S based on Tasmanian,Victorian and Commonwealth logbook returns.

Scalefish Fishery Assessment: 2000
TAFI Technical Report No. 19 Page 21
Catch (tonnes)Year Tasmania Victoria Commonwealth Combined
1990/91 74.5 37.1 111.61991/92 58.2 36.8 95.01992/93 52.7 19.8 72.51993/94 56.5 16.0 72.51994/95 72.4 14.6 87.01995/96 60.2 60.21996/97 80.3 2.0 82.31997/98 75.3 5.8 81.11998/99 98.6 8.9 107.5
1999/2000 86.2 14.7 100.9
Table 3.2 Catch, effort and CPUE by method for striped trumpeter based on General Fish Returns.For units of effort and CPUE refer to Table 2.3.
Method Year Catch (tonnes) Effort CPUEHandline 1995/96 13.0 3487 2.86
1996/97 15.1 3823 2.831997/98 24.8 4180 3.931998/99 29.3 5167 4.34
1999/2000 30.5 5083 4.19Dropline 1995/96 16.5 541 28.96
1996/97 27.7 736 36.631997/98 20.8 635 33.841998/99 26.7 845 31.28
1999/2000 24.8 469 45.84Graball 1995/96 10.2 17113 0.74
1996/97 16.4 23430 1.241997/98 17.7 14892 1.391998/99 21.1 15081 1.64
1999/2000 17.8 20292 1.10
0
5
10
15
20
25
30
35
95/96 96/97 97/98 98/99 99/00
Cat
ch (t
onne
s)
0
1000
2000
3000
4000
5000
6000
95/96 96/97 97/98 98/99 99/00
Effo
rt (l
ine
hour
s)
0
2
4
6
8
10
95/96 96/97 97/98 98/99 99/00
CPU
E (k
g/lin
e ho
ur)
Figure 3.1 Annual handline catch, effort and catch per unit effort (CPUE) for striped trumpeter based on total(solid circle) and targeted (open circle) effort.

Scalefish Fishery Assessment: 2000
TAFI Technical Report No. 19 Page 22
0
5
10
15
20
25
30
95/96 96/97 97/98 98/99 99/00
Cat
ch (t
onne
s)
0
200
400
600
800
1000
95/96 96/97 97/98 98/99 99/00
Effo
rt (1
00 h
ooks
)
0
20
40
60
80
95/96 96/97 97/98 98/99 99/00
CPU
E (k
g/10
0 ho
oks)
Figure 3.2. Annual dropline catch, effort and catch per unit effort (CPUE) for striped trumpeter based on total(solid circle) and targeted (open circle) effort.
0
5000
10000
15000
20000
25000
95/96 96/97 97/98 98/99 99/00
Effo
rt (1
00m
net
hou
rs)
0
2
4
6
8
10
12
95/96 96/97 97/98 98/99 99/00C
PUE
(kg/
100m
net
hr)
0
5
10
15
20
25
95/96 96/97 97/98 98/99 99/00
Cat
ch (t
onne
s)
Fig. 3. Annual graball net catch, effort and catch per unit effort (CPUE) for striped trumpeter based on total(solid circle) and targeted (open circle) effort.
3.5 Evaluation of Trigger Points
Total catch
i. Total catch of a key target species is outside of the 1990/91 to 1997/98 range; or when,ii. total catch of a key target species declines or increases in one year more than 30%from the previous year.
The 1999/2000 striped trumpeter catch of 100 tonnes was higher than Tasmanian catchestaken during the reference period and, while lower than 1998/99, the decline was only small(<10%). On this basis the catch trigger (i) was exceeded. However, if the combined catchfrom waters over which Tasmania now has jurisdiction for striped trumpeter is considered,then the catch trigger was not reached (refer Table 3.1).
Fishing effort
Fishing effort for any gear type, or effort targeted towards a species or species group,increases by 10% from the highest of the 1995-97 levels.
Although slightly lower than 1998/99 handline effort once again exceeded the effort trigger.By contrast, the marked decline in dropline effort in 1999/2000 meant that this trigger wasnot exceeded. Increased graball effort in the most recent year did not exceed the previous(1996/97) peak level.

Scalefish Fishery Assessment: 2000
TAFI Technical Report No. 19 Page 23
Catch rates (CPUE)
In a given year, the CPUE of a key target species is less than 80% of the lowest value forthe 1995-97 period.
CPUE (total and targeted) values for each of the key methods were either higher or withinhistoric ranges and therefore did not exceed this trigger.
Change in size composition
i. A significant change in the size composition of commercial catches for key species; orwhen,
ii. monitoring of the size/age structure of a species indicates a significant change in theabundance of a year class (or year classes), with particular importance on pre-recruityear classes.
Commercial and research catch sampling over several years indicates marked recruitmentvariability. The full significance of this phenomenon has yet to be fully evaluated.
3.6 Implications for ManagementTrends in catch and CPUE in the fishery are likely to be influenced for some years by thestrong 1993 and 1994 year-classes. There are also some indications of good recruitment forthe 1996 year-class.
Superficially, stability in catches over the past decade could suggest that current catch levelsare sustainable, however, there is evidence of strong recruitment variability which couldproduce marked variations in population size, especially if there is a prolonged period ofpoor recruitment. The lack of knowledge about the recruitment processes and the impacts ofthe recreational fishery represent major uncertainties. Clearly a more rigorous assessmentthan is possible through examination of commercial catch and effort data is required toassess the sustainability of the fishery.
The suitability of the legal minimum size limit of 35 cm in terms of yield-per-recruit isunknown, however, as this size limit is well below the size at maturity it is a risk pronestrategy in terms of egg-per-recruit.
There are likely to be impacts on the fishery from the recently introduced 250 kg trip limit.It is unclear how future catch and effort will be affected but this limit may confound theinterpretation of catch rate trends, especially if operators achieve the limit and cease fishing.
3.7 Research NeedsThe Scalefish Fishery Research Advisory Group has identified the need for research intostock assessment, recruitment variability and gear interactions as areas of high researchpriority for striped trumpeter.
There is a need to define life history and population parameters for striped trumpeter(including growth and mortality, reproductive biology, movements, etc) and to conduct yieldper recruit analysis to determine the appropriate legal minimum size. Given the paucity ofinformation regarding the offshore fishery for striped trumpeter, basic size and age

Scalefish Fishery Assessment: 2000
TAFI Technical Report No. 19 Page 24
composition data are required for this component of the fishery to develop optimal harveststrategies.
Given evidence of considerable recruitment variability, there is also a need to conductsampling of inshore reefs to assess relative abundance of pre-recruits. Such informationwould be valuable interpreting and even predicting both catch and catch rate trends for thevarious sectors of the industry.

Scalefish Fishery Assessment: 2000
TAFI Technical Report No. 19 Page 25
4 Banded Morwong (Cheilodactylus spectabilis)
4.1 Management Background
The ‘live fish’ fishery for banded morwong began in early 1990’s. All holders of a fishinglicence (vessel) were able to take this species and, as a result, there was a dramatic increasein fishing effort directed at the species. Reported landings increased from 7 tonnes in1991/92 to 39 tonnes in 1992/93 and to over 145 tonnes in 1993/94.
On 31 May 1994, a Ministerial warning was issued explaining that any catches of bandedmorwong (and wrasse) taken after that date would not be used toward catch history, shouldprevious catches be used to determine future access to the live fishery. In the same year,minimum and maximum size limits (33 and 43 cm fork length) were introduced for bandedmorwong to (i) maintain adequate egg production by protecting large adults and (ii) reflectmarket requirements by restricting the size range to that of highest value. Subsequentresearch indicated that these size limits offered minimal protection to mature females; fewactually exceeded the upper size limit and the lower size limit was set close to the size at50% maturity (Murphy and Lyle 1999). For these reasons the size limits were revised in1998 and minimum and maximum sizes were increased by 3 cm.
During 1995 a closed season (March and April inclusive) was introduced to coincide withthe species peak spawning period, in an attempt to minimise wastage of fish at a time whenthey are most vulnerable to mortality in captivity. Spawning closures have beenimplemented each year since that time.
In addition to the closed season, management measures for 1996 included the introductionof an interim live fish endorsement on the fishing licence (personal) to take bandedmorwong and wrasse. Eligibility for an endorsement was based on a demonstrated historyof taking one or both of these species, and the total number of endorsements issued wasaround 90. These arrangements continued until the scalefish fishery management plan wasimplemented in late 1998.
Under the plan, a specific licence was introduced for the taking of banded morwong in Statewaters. The amount of gear able to be used to target this species was also restricted. Toqualify for a fishing licence (banded morwong), applicants had to prove that they had caughtat least two tonnes of banded morwong during the period 1 January 1993 to 31 May 1994.There are currently 29 fishing licences (banded morwong).
4.2 Stock Structure and Life-history
Banded morwong are a rocky reef species distributed from about Sydney (New SouthWales) south to eastern Victoria and around Tasmania (Gomon et al. 1994). They alsooccur in New Zealand waters. While they are found down to about 50 m, in New Zealandfemales and juveniles inhabit the shallow sections of the reef with males tending todominate deeper reef regions (McCormick 1989a). On many southern Tasmanian reefslarge changes in depth occur over short distances, suggesting depth stratification of thepopulation may be less pronounced than that described from New Zealand. There is noinformation on the stock structure of banded morwong in Tasmania. The relationships ofpopulations throughout the range are unknown.

Scalefish Fishery Assessment: 2000
TAFI Technical Report No. 19 Page 26
In Tasmanian waters, banded morwong are caught in a spawning condition between mid tolate February and May, with the distribution of oocytes indicating they are serial spawners.Sexual maturity in females begins at between 30 and 32 cm FL, equivalent to 4 to 5 years ofage (Murphy and Lyle 1999). Length at 50% maturity is 32 cm. Individuals have beenfound to be highly territorial, spawning on the same reef over several years (McCormick1989b). The eggs and larvae are concentrated on the surface. Considerable numbers ofCheilodactylus sp. larvae have been caught some distance off the shelf break of easternTasmania suggesting that banded morwong have a pelagic stage that is distributed inoffshore waters (B. Bruce pers. comm). Juveniles appear in shallow water on rocky reefsand tide-pools between September and December after a pelagic phase of around 4-6 months(Wolf 1998).
Tagging studies have indicated that movement of juvenile and adult banded morwong islimited, generally to within 5 km of the site of release (Murphy and Lyle 1999).
In Tasmania, growth in female banded morwong is relatively rapid for the first 5-6 years,until about 35 cm, and then slows dramatically (Murphy and Lyle 1999). In contrast, malesgrow relatively rapidly for the first 10-12 years, until about 45 cm, before slowing.Maximum recorded ages for female and male banded morwong are 86 and 81 years,respectively (Murphy and Lyle 1999). The age structure of banded morwong populationsfrom some east coast sites exhibit strong year classes, providing evidence for variation inrecruitment strength (Murphy and Lyle 1999).
The range of biological parameters that have been defined for banded morwong in Tasmaniaare presented in Appendix 4.
4.3 Previous AssessmentsPrevious assessments have been limited to examination of trends in graball catch, effort andcatch rates. Given evidence of population structuring at a small spatial scale, analyses havebeen conducted at regional as well as state-wide levels. Overall, catch and effort hasdeclined steadily since 1995/96 with only a slight fall in CPUE. However, when regionalcatch rates were examined for only those fishers with a minimum of three years catchhistory over the period 1995/96 to 1998/99, the decline in CPUE was more pronounced inall areas apart from the Bruny region.
The 1998/99 catch of banded morwong was lower than previous catches during thereference period (1994/95 – 1997/98 in this case) and had declined by greater than 30%compared with 1997/98. Both catch triggers were, therefore, exceeded. State-wide, thecatch rate trigger was not reached, however, at the regional level, CPUE triggers wereexceeded in the Schouten and Maria Island regions.
While there were uncertainties in the interpretation of catch and catch rate trends, given thelife history characteristics of the species, concern was expressed in relation to the impactthat the fishery had had on the populations.
4.4 Current Assessment
4.4.1 The Fishery
Banded morwong are targeted almost exclusively with large mesh gillnets (primarily 130-140 mm stretched mesh) for the live fish market. In addition to targeted fishing, both

Scalefish Fishery Assessment: 2000
TAFI Technical Report No. 19 Page 27
banded morwong are taken as a by-product in gillnets set on inshore rocky reefs andtargeting trumpeters and blue warehou. Fishing operations are conducted over hard bottom,with nets fished primarily in the 10-20 m depth range.
The fishery is centred mainly along the east coast of Tasmania, between St Helens in thenorth and the Tasman Peninsula in the south, with the largest catches coming from aroundBicheno. Smaller catches are made along the south coast and around Flinders Island. Apartfrom a general increase in fishing activity around St Helens up to 1997/98, there has beenlittle evidence of any substantial shifts in the distribution of catches at the fishing block levelover the past five years (refer Figs 4.2- 4.3).
4.4.2 Recent Developments
There has been no recent research or monitoring of the banded morwong fishery. However,a meeting of researchers, managers and industry was convened in December 2000 to discussresource and management issues relevant to the banded morwong fishery. Industryconfirmed that recent declines in catches were not market driven but rather were the result ofreductions in actual fishing effort. Several key operators had either left the fishery orsignificantly reduced their level of activity by either targeting other species, and thus takingbanded morwong largely as a by-product, or by reducing the number of sets conducted eachday. Many operators reported that increased interactions with seals had caused them toeither curtail fishing on a given day or reduce the amount of net that was set. A generalobservation supported by operators with several years of involvement in the fishery was thatboth the frequency of seal interactions and the quantities of fish lost to seals had increasedover the history of the fishery. Amongst the industry members, seal interactions wereconsidered to be a more significant factor influencing the downturn in catch and effort thanvariation in catch rates.
4.4.3 2000 Assessment
Since 1994/953 banded morwong catches have declined from over 100 tonnes falling to just29 tonnes in 1999/2000 (Table 2.1, Fig. 2.1). In fact, the most recent year’s catchrepresented a fall of about 32% compared with 1998/99.
This assessment has been restricted to examination of catch and effort trends for the graballnets, the method accounting for around 99% of the total catch of banded morwong. In anattempt to distinguish targeted fishing for banded morwong the following assumptions havebeen made. Fishing on a given day was assigned as targeted at banded morwong if:
• the catch of banded morwong was greater than 10 kg and accounted for at least half ofthe total weight of all species retained; or
• the catch of banded morwong was greater than or equal to 50 kg.
State-wide, the graball catch has declined each year since 1995/96, with a sharp falls in since1997/98 (Table 4.1, Fig. 4.1). Banded morwong are primarily taken in operations targeted atthe species, the levels of ‘non-targeted’ effort being comparatively low. Over the past twoyears there has been a marked drop in both total and targeted effort accompanied with fallsin CPUE. Since 1995/96, CPUE has fallen by over 40% based on total fishing effort and byjust under 10% based on targeted effort. These observations tend to support industrycomments in that there is currently less effort targeted at the species and that targeted catchrates have declined only slightly. 3 Note: the reported catch for 1993/94 is considered to be inaccurate due to over-reporting.

Scalefish Fishery Assessment: 2000
TAFI Technical Report No. 19 Page 28
Since banded morwong appear to be site attached to individual reefs, analysis of data at thesmallest spatial scale provides a more realistic indication of trends in the fishery. Catch,effort and CPUE for the major fishing regions are presented in Figs 4.2 and 4.3. Theregions, based on fishing blocks, have been defined as St Helens (5H1), Bicheno (5H3),Schouten (6H1), Maria (6H3, 6G4) and Tasman Peninsula (7G2, 7H1). Between 1995/96and 1997/98 the sharp fall in catches from the Bicheno region was to some extent offset byrising catches from around St Helens. Since then, however, catches in all regions havetended to decline, with the 1999/2000 catch for St Helens almost half that for the previousyear. Effort levels in 1999/2000 were higher in the more southerly regions (Maria andTasman Peninsula), lower for St Helens and generally stable for Bicheno and Schoutenregions.
Regionally, catch rates have been highly variable both within and between years but therehas been a general decline in CPUE for all regions since 1995/96, such that the most recentyear’s values were lower than for the reference period (1995/96 - 1997/98). CPUE data alsoindicate a general trend of increasing catch rates moving south to north along the east coast.This could imply that the more northern reefs support greater densities of banded morwongbut it may also be influenced by the fact that the fishery developed initially in the south-eastand this area has had a longer history of exploitation.
Catch and catch rate indicators suggest that the fishery has impacted on banded morwongpopulations and that the sustainability of the fishery, even at current levels of exploitation, isuncertain. These fishery dependent indicators may, however, be influenced by factors otherthan just fish abundance, for instance there have been recent management changes (licensingand size limits) and there are suggestions of shifts in the dynamics of the fishery which arenot necessarily linked to fish availability. As a consequence, there is uncertaintysurrounding the resource status. There is an urgent need to investigate possible biologicalindicators of stock condition; for example population age structure.
Table 4.1 Catch, effort and CPUE by method for banded morwong based on General Fish Returns.For units of effort and CPUE refer to Table 2.3.
Method Year Catch (tonnes) Effort CPUEGraball 1995/96 86.2 69019 1.16
1996/97 78.5 64524 1.091997/98 75.8 78821 0.981998/99 43.1 43993 0.95
1999/2000 29.0 46237 0.66

Scalefish Fishery Assessment: 2000
TAFI Technical Report No. 19 Page 29
0
20
40
60
80
100
95/96 96/97 97/98 98/99 99/00
Cat
ch (t
onne
s)
0
20000
40000
60000
80000
100000
95/96 96/97 97/98 98/99 99/00
Effo
rt (1
00m
net
hrs
)
0.0
0.5
1.0
1.5
2.0
95/96 96/97 97/98 98/99 99/00
CPU
E (k
g/10
0m n
et h
rs)
Fig. 4.1 Annual graball net catch, effort and catch per unit effort (CPUE) for banded morwong based on total(solid circle) and targeted (open circle) effort.
0
5
10
15
20
25
30
35
95/96 96/97 97/98 98/99 99/00
Cat
ch (t
onne
s)
St HelensBichenoSchouten
0
4000
8000
12000
16000
20000
95/96 96/97 97/98 98/99 99/00
Effo
rt (1
00m
net
hrs
)
0.0
0.5
1.0
1.5
2.0
2.5
3.0
95/96 96/97 97/98 98/99 99/00
CPU
E (k
g/10
0m n
et h
rs)
Fig. 4.2 Annual graball net catch, effort and CPUE for banded morwong by fishing regions - St Helens,Bicheno and Schouten.
0
5
10
15
20
95/96 96/97 97/98 98/99 99/00
Cat
ch (t
onne
s)
Tasman
Maria
0
5000
10000
15000
20000
25000
95/96 96/97 97/98 98/99 99/00
Effo
rt (1
00m
net
hrs
)
0.0
0.5
1.0
1.5
2.0
95/96 96/97 97/98 98/99 99/00
CPU
E (k
g/10
0m n
et h
rs)
Fig. 4.3 Annual graball net catch, effort and CPUE for banded morwong by fishing regions - Maria andTasman Peninsula.
4.5 Evaluation of Trigger Points
Total catch
i. Total catch of a key target species is outside of the 1990/91 to 1997/98 range; or when,
ii. total catch of a key target species declines or increases in one year more than 30%from the previous year.
Total catch of banded morwong for the period 1990/91 to 1997/98 ranged from 6.9 to 145.5tonnes (Table 2.1). However, given the rapid increase in landings of banded morwong over

Scalefish Fishery Assessment: 2000
TAFI Technical Report No. 19 Page 30
this period there is little value in the use of this full range in assessing catch trends. This isparticularly the case for data prior to the development of the fishery (pre 1993/94), and forthe 1993/94 reported catch, which is believed to have been significantly overstated.Therefore, for the purpose of trigger point assessment, catches for the period 1994/95 to1997/98 have been adopted as the reference period.
The 1999/2000 catch of just 29 tonnes was outside of this range and was over 30% lowerthan in 1998/99, indicating that both catch triggers were exceeded. Significantly, catchtriggers were also exceeded in 1998/99.
Fishing effort
Fishing effort for any gear type, or effort targeted towards a species or species group,increases by 10% from the highest of the 1995-97 levels.
As fishing effort had decreased and in the key fishing regions in 1999/2000 and state-wide,the effort trigger was not reached.
Catch rates (CPUE)
In a given year, the CPUE of a key target species is less than 80% of the lowest value forthe 1995-97 period.
Based on targeted CPUE, the value for 1999/2000 was within the reference range.However, if total (combined targeted and non-targeted) CPUE is considered, then in themost recent year CPUE was just 67% of the lowest value for the reference period. At aregional level, total CPUE values for the St Helens, Schouten and Maria regions were below80% of the lowest value for the reference period and therefore triggers had been reached ineach of these regions.
Interpretation of the significance catch rates for banded morwong is complicated by the factthat the species can be targeted or taken as a by-product of fishing for other species, withtargeted and total catch rates indicating different levels of change. However, it is significantthat catch rates have declined despite substantial reductions in effort.
Change in size composition
i. A significant change in the size composition of commercial catches for key species; orwhen,
ii. monitoring of the size/age structure of a species indicates a significant change in theabundance of a year class (or year classes), with particular importance on pre-recruityear classes.
No monitoring of the size or age structure of banded morwong populations has beenconducted since 1997. There is considerable variability in the size composition of the catchbetween regions and seasons, which will strongly influence the spatial and temporal patternof future commercial monitoring. The impact of changes in size limits will need to be takeninto account in any future analysis.

Scalefish Fishery Assessment: 2000
TAFI Technical Report No. 19 Page 31
4.6 Implications for Management
While catch rates have declined only slightly in the main fishing areas over the past fiveyears, it is likely that they have been maintained to some extent through the fish down ofaccumulated (up to 50 or more year classes) rather than replacement biomass. Based on lifehistory, in particular the longevity of the species, productivity is expected to be low.Therefore, if over-fishing occurs stock recovery will be slow even if the fishing effort issignificantly reduced. Further, being a sedentary species the potential for localised depletionis high. A more rigorous assessment than is possible through examination of catch rate datais required to determine resource status and sustainability of the current fishing levels.
Little is known about the dynamics of the fishery, specifically whether catch rates areeffectively being maintained through the exploitation of ‘new’ reef areas. Any such serialdepletion of individual reefs would be masked in the catch and effort data provided byfishers because of the relatively large spatial scale that operations are reported in catchreturns.
Over the past five years there has been a trend towards increased mesh size (largely inresponse to size limit increases) that will have implications for the interpretation of catchand CPUE data from the commercial fleet. That is, catch rates will reflect changes in meshsize and size regulations in addition to abundance. For instance, modelling undertaken atthe time of the new size limits were proposed suggested that there would be a slight declinein catch rates, assuming that there were no changes in mesh size or the size structure of thecatch (Murphy and Lyle 1998). There is no empirical information to test the above.
The age structure of the banded morwong population indicates variations in the strength ofrecruitment, which will have implications for the size composition and catch rates in thefishery.
4.7 Research NeedsThe Scalefish Fishery Research Advisory Group has accorded stock assessment of bandedmorwong high priority. An integral component of the stock assessment is the establishmentand monitoring of suitable biological trigger points for this fishery. As commercialmonitoring of the banded morwong fishery concluded in mid-1997, on-board commercialcatch sampling of the fishery is a high priority because of inferences that can be made aboutthe effects that fishing is having on the size and sex structure of the population. However,given the considerable variability in the size composition of the catch between regions,future monitoring needs to be focussed regionally, even at the scale of discrete reef areas.This degree of sampling intensity may be difficult to achieve and justify in a fishery of thissize.
Changes to the minimum and maximum size limits for banded morwong were alsointroduced in the Scalefish Management Plan in late 1998. There is a need to assess theeffect these changes have had on catch rates in order to interpret the trends. In 2001,population age structure at key sites will be investigated for comparison with informationfrom the mid-1990’s. It is hoped that these comparisons may prove informative inindicating changes that have occurred as a consequence of fishing. It is ultimately intendedto develop a model for the banded morwong fishery, which will enable a more robust stackassessment based on depletion estimators.

Scalefish Fishery Assessment: 2000
TAFI Technical Report No. 19 Page 32
5 Sea Garfish (Hyporhamphus melanochir)
5.1 Management Background
Traditionally a winter beach seine fishery, catches were initially centred off the north-eastcoast, including Flinders Island. More recently the fishery has extended to the east andsouth-east coasts and, with the introduction of dip nets, catches have increasingly beingtaken over the summer months.
Under the scalefish management plan all scalefish and rock lobster licence holders areentitled to use dip nets. The use of beach seine and purse seine nets, however, is restrictedto those fishers who hold a fishing licence (beach seine A or B or purse seine licences).
A legal minimum size limit of 25 cm TL applies for sea garfish.
5.2 Stock Structure and Life-history
The sea garfish is endemic to Australian waters and is distributed from Eden in NSW toKalbarri in Western Australia, including Bass Strait and Tasmanian waters (Gomon et al.1994). They are found in sheltered bays, clear coastal waters and estuaries to depths ofabout 20 m. Fish school near the surface at night, and close to the bottom, often overseagrass beds during the day. They are predominantly herbivores with around 75% of theirdiet being comprised of seagrass and algal filaments (Klumpp and Nichols 1983). Otherdiet items include diatoms, insect larvae, worms and small crustaceans, particularlyamphipods (St Hill 1996).
Morphometric studies suggest sea garfish may form two populations in Australia, i.e. aneastern stock around NSW, Victoria and Tasmania and a western stock around SouthAustralia and Western Australia.
Sea garfish in eastern Tasmania spawn over an extended period of at least five months, fromOctober to February (Jordan et al. 1998). However, the bulk of spawning occurs betweenOctober and December, with a lower level of spawning activity in the latter half of thespawning period. Sea garfish are serial spawners, with asynchronous oocyte developmentoccurring simultaneously in reproductively active ovaries (St Hill 1996).
Sea garfish eggs are about 2.9 mm in diameter and negatively buoyant, sinking immediatelyto the bottom after fertilisation and become attached to filamentous drift algae (Jordan et al.1998). There is no evidence in eastern Tasmania that eggs attach in clusters on seagrassblades as has been suggested in the literature. In this region, spawning occurs in shallowareas (<5 m deep) over beds of drift algae. However, seagrass beds may be of greatersignificance around areas such as Flinders Island where the majority of shallow waterhabitat consists of seagrass beds (principally Posidonia australis and Amphibolisantarctica). Sea garfish have a long egg duration of around 28-30 days and are unusual inthat they hatch out as large (7.8-8.5 mm) post-flexion larvae. There is little informationavailable on early life history and recruitment of sea garfish. Small juveniles (0+ cohort)have been caught in shallow sheltered waters of eastern Tasmania (Jordan et al. 1998). Insouth-western Australia, sea garfish may spend the first year of life in estuarine areas andthe first 2 years in inshore waters (Lenanton 1982).

Scalefish Fishery Assessment: 2000
TAFI Technical Report No. 19 Page 33
Growth of male and female sea garfish in eastern Tasmania is relatively rapid for the first 3years, achieving a length of around 20 cm FL by 2 years of age and 25 to 30 cm by 3 years(Jordan et al. 1998). Growth then slows appreciably, reaching a maximum age of around 9years when fish may be 40 cm long and weigh around 0.35 kg. After 3-4 years there isincreasing variation in size-at-age, with fish at a length of 30 cm ranging from 3 to 8 yearsold. Insufficient data are available to determine whether males and females grow at thesame rate.
The range of biological parameters that have been defined for sea garfish in Tasmania arepresented in Appendix 5.
5.3 Previous Assessments
Previous assessments have been restricted to examination of trends in catch and catch ratesfor beach seine and dip net methods. Analysis was based on calendar rather than fishingyear (July to June) since, historically at least, the major fishery for garfish occurred duringthe winter months4.
With the exception of 1995, annual garfish catches have fluctuated between around 70-100tonnes, without any consistent pattern or trend between years. Since 1995 beach seinecatches generally increased but CPUE remained stable. It was noted, however, that stabilityin beach seine CPUE may not be a good indicator of stock abundance, since garfish aretargeted in schools and thus catch rates are expected to remain relatively insensitive tochanging population abundance (unless there are actual declines in school size). Thegrowing importance of dip nets as a method for taking garfish was evident in previousassessments, with a sharp increase in dip net effort since 1995. Although dip net catch andCPUE for 1998 was within the reference range, the increase in effort exceeded the efforttrigger. Since all holders of scalefish licences have access to dip nets and garfish cancommand premium prices there was concern about the potential for further expansion in thissector.
5.4 Current Assessment
5.4.1 The Fishery
Sea garfish are taken by a variety of fishing methods, with beach seining and dip netsaccounting for 80-90% of the annual catch in recent years (Fig 5.1). Other methods includepurse seine and spears, with purse seine catches tending to rise slightly over the past twoyears. Both beach seine and dip net fishing are conducted close to shore and almostexclusively in depths of <10 m. Dip nets are used during the night over shallow areas ofsand, seagrass and reef to target surface fish that are attracted to lights.
Sea garfish are taken commercially around the entire Tasmanian coastline (apart from thewest coast), with the greatest portion of the catch being taken off the north-east coast,including Flinders Island, and off the east and south-east coasts. Since 1996/97, annualcatches from the north-east (blocks 3G4, 4G2, 4G4, 4H1, 4H3) have declined slightly fromaround 50 tonnes in 1996/97 to 42 tonnes in 1999/2000 (Fig. 5.2). Over the same period,east coast (blocks 6G4, 6H1, ES13, ES14, ES15, ES16) catches have fluctuated between 14and 25 tonnes, without an obvious trend. By contrast, catches of garfish from the south-east,
4 For the purposes of the current assessment, analysis has been undertaken on a fishing year basis.

Scalefish Fishery Assessment: 2000
TAFI Technical Report No. 19 Page 34
including Norfolk and Frederick Henry Bays (blocks 7G1, 7G2, ES17, ES18, ES19), haveincreased steadily, from just 3 tonnes in 1995/96 to about 25 tonnes in 1999/2000. Themajority of the catch from the north-east is taken by beach seine whereas dip nets, and to alesser extent beach seines, represent the dominant methods used off the east coast. Dip netsand more recently purse seine account for the bulk of the south-east coast catch.
0
20
40
60
80
100
120
95/96 96/97 97/98 98/99 99/00
Cat
ch (t
onne
s) OtherPSDNBS
Fig. 5.1. Annual catch of sea garfish by method. BS is beach seine; DN is dip net; PS is purse seine.
0
10
20
30
40
50
60
95/96 96/97 97/98 98/99 99/00
Cat
ch (t
onne
s)
NE E SE
Fig. 5.2. Annual catch of sea garfish by major fishing regions. NE includes Flinders Island and the northeastcoast of Tasmania, E is east coast including Great Oyster Bay and SE is southeast coast including the TasmanPeninsular, Norfolk and Frederick Henry Bays and Bruny Island.
5.4.2 Recent Developments
A recent study of the fishery and biology of sea garfish examined aspects of reproductivebiology, early-life-history, size composition and age and growth in Tasmanian waters(Jordan et al. 1998). A study of garfish stock structure, age and growth and reproductivebiology off southern Australia (incorporating Tasmania) is being finalised.
5.4.3 2000 Assessment
The 1999/2000 catch of 91 tonnes was slightly down on the previous year but was within thecatch range for the reference period 1990/91 to 1997/98 (Table 2.1).
This assessment has been restricted to the examination of trends in catch, effort and CPUEfor beach seine and dip nets, being the primary fishing methods for sea garfish.
Beach seine catch and effort peaked in 1996/97 and since then catches have remainedrelatively stable (Table 5.1, Fig. 5.3). Relatively high beach seine CPUE for the past two

Scalefish Fishery Assessment: 2000
TAFI Technical Report No. 19 Page 35
years contributed to the maintenance of catch levels despite slight drops in effort. The trendfor increased dip net catch and effort between 1995/96 and 1998/99 was reversed in1999/2000, with the catch and effort falling by 49 and 29%, respectively (Table 5.1, Fig.5.3). Dip net CPUE also declined by about 35%, to its lowest level on record.
The lack of consistency in catch rate trends for the two methods suggests a number ofcomplicating factors in the interpretation of stock status. As a schooling species, CPUE forgarfish is expected to be relatively insensitive to declines in abundance, perhaps more so formethods such as beach seining which target schools of fish. On the other hand, severalindustry members have expressed concerns about the effects of dip netting on the schoolingbehaviour of garfish. Specifically it has been suggested that intensive dip netting activitytends to cause schools to break up, which could have the effect of lowering CPUE (andopportunities to use beach seines to target the species).
Based on the available analysis, the stock status for sea garfish is uncertain.
Table 5.1 Total catch, effort and CPUE by the main garfish fishing methods.* 5 or fewer vessels involved, data can not be shown.
Method Year Catch (tonnes) Effort CPUEBeach seine 1995/96 43.8 731 36.2
1996/97 60.1 1044 36.91997/98 46.2 752 37.01998/99 56.3 683 52.2
1999/2000 53.0 657 52.4Dip net 1995/96 * * 8.9
1996/97 21.4 1492 12.11997/98 27.6 1650 13.01998/99 33.8 2522 10.7
1999/2000 17.2 1811 7.0
0
20
40
60
80
95/96 96/97 97/98 98/99 99/00
Cat
ch (t
onne
s)
0
200
400
600
800
1000
1200
95/96 96/97 97/98 98/99 99/00
Effo
rt (N
o. o
f sho
ts)
0
10
20
30
40
50
60
95/96 96/97 97/98 98/99 99/00
CPU
E (k
g/sh
ot)
Fig. 5.3 Annual beach seine catch, effort and catch per unit effort (CPUE) of sea garfish.

Scalefish Fishery Assessment: 2000
TAFI Technical Report No. 19 Page 36
0
10
20
30
40
95/96 96/97 97/98 98/99 99/00
Cat
ch (t
onne
s)
0
500
1000
1500
2000
2500
3000
95/96 96/97 97/98 98/99 99/00
Effo
rt (F
ishe
r hrs
)
0
2
4
6
8
10
12
14
95/96 96/97 97/98 98/99 99/00
CPU
E (k
g/fis
her h
r)
Fig. 5.4 Annual dip net catch, effort and catch per unit effort (CPUE) of sea garfish. Catch and effort is notshown where 5 or fewer vessels are involved.
5.5 Evaluation of Trigger Points
Total catch
i. Total catch of a key target species is outside of the 1990 to 1997 range; or when,
ii. total catch of a key target species declines or increases in one year more than 30%from the previous year.
The total catch of sea garfish in 1999/2000 was within the reference range and being about10% lower than for the previous year neither of the catch triggers were reached.
Fishing effort
Fishing effort for any gear type, or effort targeted towards a species or species group,increases by 10% from the highest of the 1995-97 levels.
Beach seine fishing effort was at its lowest level in 1999/2000 while dip net effort had fallenfrom a peak in 1998/99 to a level roughly equivalent to 10% greater than the peak during thereference period. On this basis, effort triggers were not exceeded for the primary garfishfishing methods.
Catch rates (CPUE)
In a given year, the CPUE of a key target species is less than 80% of the lowest value forthe 1995-97 period.
Although the most recent dip net CPUE was lower than reported for the reference period, itwas equivalent to about 80% of the lowest previous value (1995/96) and therefore the CPUEtrigger was not exceeded. As noted above, however, CPUE may not be a suitable indicatorof stock abundance for garfish.

Scalefish Fishery Assessment: 2000
TAFI Technical Report No. 19 Page 37
Change in size composition
i. A significant change in the size composition of commercial catches for key species; orwhen,
ii. monitoring of the size/age structure of a species indicates a significant change in theabundance of a year class (or year classes), with particular importance on pre-recruityear classes.
There are considerable differences in the size, and possibly age structure, of sea garfish inthe commercial fishery between south-east and north-east regions. The significance ofthese differences have yet to be assessed. Size/age compositions have not been followedthrough time and no pre-recruit surveys have been conducted.
5.6 Implications for ManagementAlthough current catch levels in the Tasmanian garfish fishery have fluctuated over recentyears, interest in garfish is high and it is possible that effort may increase over a relativelyshort period, particularly in the dip net sector since it is a method available to all scalefishlicence-holders. Such increases may result in over-exploitation. Very limited information isavailable on the stock structure of sea garfish and thus it is not possible to evaluate whethersome form of regional management would be appropriate.
There is concern amongst some industry members regarding the effects of dip net fishing onthe schooling behaviour of garfish, including possible impacts on spawning success. Thereis no objective information available to test these concerns.
Seagrass is important to the life history of sea garfish and therefore the distribution andhealth of seagrass beds is an important issue for the garfish stock. Recent reports of largereductions in the size of seagrass beds around Tasmania are of concern.
5.7 Research NeedsStock assessment, critical habitat requirements, impact of management arrangements andgear interactions on sea garfish have been accorded high research priority by the ScalefishFishery Research Advisory Group.
Information indicating the level of fishing pressure that can be sustained on sea garfish isrequired. This could probably be best achieved by sampling from the commercial fisheryand estimating key population parameters for modelling in yield per recruit analysis.Integral to this is the need to analyse otoliths for age, validate annuli, construct age lengthkeys and estimate mortality parameters for sea garfish.
The significance of seagrass habitats for spawning and feeding of sea garfish will requirefurther sampling in areas along the north coast and Flinders Island. Information on the stockstructure of sea garfish is required.

Scalefish Fishery Assessment: 2000
TAFI Technical Report No. 19 Page 38
6 Wrasse (Family: Labridae)
6.1 Management Background
Historically wrasse have had limited commercial value, being used primarily as rock lobsterbait. A ‘live fish’ fishery for wrasse developed the early 1990’s and anyone holding afishing licence (vessel) was able to take this species. As a result, there was a dramaticincrease in fishing effort directed at the species. Reported landings from State watersincreased from around 70 tonnes in 1991/92 to 100 tonnes in 1992/93 and almost 180 tonnesin 1994/95.
On 31 May 1994, a Ministerial warning was issued explaining that any catches taken afterthat date would not be used toward catch history, should previous catches be used todetermine access in the future. In the same year, minimum and maximum size limits (28and 43 cm TL) were introduced for wrasse; primarily to match market requirements (byrestricting the size range to that of the highest value) and to allow fish to breed several timesprior to attaining the minimum size limit.
In 1996 an interim live fish endorsement on the fishing licence (personal) was issued to takebanded morwong and wrasse. Eligibility for an endorsement was based on a demonstratedhistory of taking these species, and the total number of endorsements issued was around 90.These arrangements continued until the scalefish fishery management plan was implementedin late 1998.
Under the management plan, a specific licence was introduced for the marketing of livewrasse in State waters. To qualify for a fishing licence (wrasse), applicants had to provethat they had caught at least one tonne of wrasse during the period 1 January 1993 to 31May 1994. There are currently 58 fishing licences (wrasse). Only wrasse licence-holdersare permitted to sell live wrasse and only wrasse and rock lobster licence-holders arepermitted to have in their possession more than 30 kg total weight of wrasse.
6.2 Stock Structure and Life-history
Eight species of wrasse occur in Tasmanian waters with purple wrasse (Pseudolabrusfucicola) and blue-throat wrasse (P. tetricus) the two main commercial species. Bothspecies are distributed in south-east Australia (Tasmania, Victoria, New South Wales andSouth Australia) with purple wrasse also occurring in New Zealand. The other six wrassespecies have overlapping ranges with some encompassing southern Western Australia andNew Zealand. Purple wrasse are found in very shallow water down to depths of 25 m whileblue-throat wrasse generally occur in deeper water down to 50 m. The stock structure ofwrasse in Australian waters has not been examined.
The sex of purple wrasse appears to be genetically based and is set before sexual maturity isreached (Barrett 1995). In contrast, a small proportion of blue-throat wrasse between 27 and32 cm change from female to male, accompanied by a colour change. Sex reversal appearsto be determined by a combination of factors, including social structure and size or age ofindividuals (Barrett 1995). Functional males with female colour morphology have beenfound. Length at first maturity of females for both species is about 15 cm, whichcorresponds to an age of around 2 to 3 years. This small size at maturity means fish mayspawn for at least 4 to 5 years before reaching the lower size limit of 28 cm. Spawning in

Scalefish Fishery Assessment: 2000
TAFI Technical Report No. 19 Page 39
Tasmania occurs throughout their range between August and January (Barrett 1995). Thereare no estimates of fecundity.
Wrasse eggs and larvae are believed to be pelagic and larvae recruit to rocky reefs atapproximately 1.5 to 2.0 cm in length. Growth in juveniles is rapid, reaching a mean lengthof around 12-15 cm after two years and 20 cm after four years, with growth considerablyslower in older fish (Barrett 1995). The maximum age for purple and blue-throat wrasse isabout 17 and 10 years, respectively (Barrett 1995). Age composition, mortality rates andproductivity have not been estimated.
While male blue-throat wrasse are territorial, females are home ranging and sedentary oninshore rocky reefs, showing strong site attachment (Barrett 1995).
Few biological parameters have been defined for blue-throat and purple wrasse (seeAppendix 6). The growth parameters defined are represented by few fish over 30 cm andare based on unvalidated age estimates.
6.3 Previous Assessments
Previous assessments have been restricted to analyses of trends in trap and handline catch,effort and catch rates since 1995/96. During this period there have been only minor changesin the annual catch of wrasse combined across all fishing gears, with catches rangingbetween 83 and 110 tonnes between 1995/96 and 1998/99.
Trap catch and effort peaked in 1996/97 and CPUE in 1998/99. Variability in catchesbetween years were more in response to changes in effort rather than catch rates over thisperiod. Similarly, the handline component of the fishery showed a peak in catch and effortin 1996/97, with CPUE peaking in 1998/99.
6.4 Current Assessment
6.4.1 The Fishery
Operators targeting the live fish market primarily take wrasse with fish traps and handlines.In 1999/2000, trap and handline fishing accounted for around 50% and 30% of the catch,respectively (Fig 6.1). Graball catches tend to of secondary importance, since few fishcaught by this method are suitable for sale on the live fish market. Incidental catches arealso regularly taken in rock lobster pots and a by variety of other methods.
Based on the reported form of the catches, the annual live wrasse catch has ranged between55.2 tonnes (1999/2000) and 82.4 tonnes (1996/97) for the five years since 1995/96(averaging 68% of the total catch weight in each year). Reported usage of wrasse as bait hasranged between 9.4 tonnes (1999/2000) and 12.8 tonnes (1995/96) over the same period(averaging 12% of the annual catch). It is probable that both ‘live fish’ and bait usage areunderestimated since almost 20% of the catch in each year was reported as ‘whole fish’,some of which may be marketed live or used as bait. Further, it is uncertain as to howcomprehensively the use of wrasse for bait is reported, especially amongst rock lobsterfishers.
Wrasse are targeted over shallow reefs close to shore, with the majority of trap caught fishtaken in depths of less than 10 m, while a higher proportion of the handline catch is taken indepths of 10-20 m.

Scalefish Fishery Assessment: 2000
TAFI Technical Report No. 19 Page 40
0
20
40
60
80
100
120
95/96 96/97 97/98 98/99 99/00
Cat
ch (t
onne
s)
Other
GN
HL
FP
Fig. 6.1 Annual catch of wrasse by method. FP is fish trap; HL is handline; GN is graball net.
Wrasse are taken commercially around the entire Tasmanian coastline, with the greatestportion of the catch taken from the east coast (blocks 5H1, 5H3, 6G4, 6H1, 6H3, ES13,ES14, ES15, ES16) and south-east coast (blocks 7F3, 7F4, 7G1, 7G2, 7G3, 7H1) (Fig 6.2).Moderate catches have also been taken from the north-east (including around FlindersIsland) (blocks 3F1, 3F2, 3G1, 3G2, 3G3, 3G4, 3H3, 4G2, 4G4, 4H1, 4H3). Relativelysmall catches are taken from the north-west coast (blocks 4D2, 4D4, 4E1, 4E2, 4E3, 4E4,5D2). There is evidence that there has been a shift in the spatial distribution of catches since1996/97, with east coast catches generally increasing, while south-east and north-east coastcatches have declined. In 1999/2000 there was a sharp increase in east coast and a markeddecline in the north-east coast production.
0
10
20
30
40
50
95/96 96/97 97/98 98/99 99/00
Cat
ch (t
onne
s)
ENENWSE
Fig 6.2 Annual catch or wrasse by fishing regions - E is east coast, NE is north east coast, including FlindersIsland , NW is north west coast and SE is south-east coast (refer text).
6.4.2 Recent Developments
A project presently underway is examining aspects of age and growth of purple wrasse onthe south and east coasts of Tasmania. Multiple mark recapture and selectivity experimentsare being undertaken at sites on the east coast to provide an assessment of possible methodsfor estimating population abundance and size/age structure in these species. Analysis ofdata from this research is, however, incomplete and not available for this report.
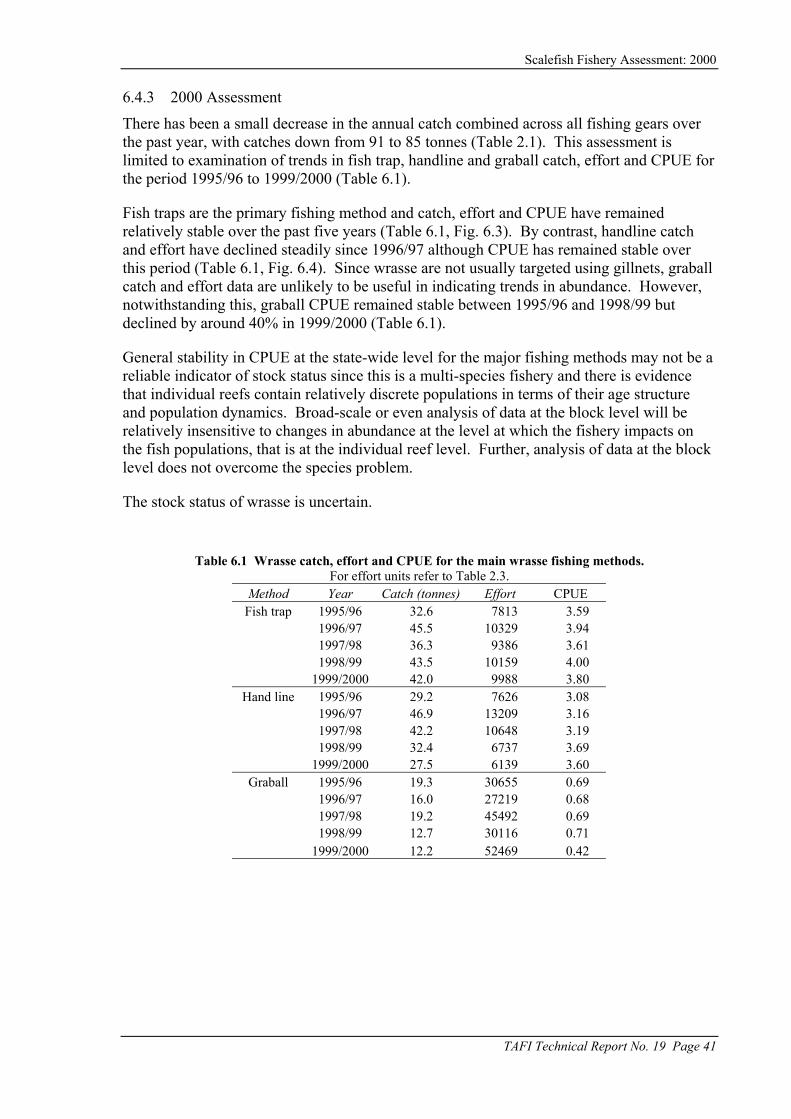
Scalefish Fishery Assessment: 2000
TAFI Technical Report No. 19 Page 41
6.4.3 2000 Assessment
There has been a small decrease in the annual catch combined across all fishing gears overthe past year, with catches down from 91 to 85 tonnes (Table 2.1). This assessment islimited to examination of trends in fish trap, handline and graball catch, effort and CPUE forthe period 1995/96 to 1999/2000 (Table 6.1).
Fish traps are the primary fishing method and catch, effort and CPUE have remainedrelatively stable over the past five years (Table 6.1, Fig. 6.3). By contrast, handline catchand effort have declined steadily since 1996/97 although CPUE has remained stable overthis period (Table 6.1, Fig. 6.4). Since wrasse are not usually targeted using gillnets, graballcatch and effort data are unlikely to be useful in indicating trends in abundance. However,notwithstanding this, graball CPUE remained stable between 1995/96 and 1998/99 butdeclined by around 40% in 1999/2000 (Table 6.1).
General stability in CPUE at the state-wide level for the major fishing methods may not be areliable indicator of stock status since this is a multi-species fishery and there is evidencethat individual reefs contain relatively discrete populations in terms of their age structureand population dynamics. Broad-scale or even analysis of data at the block level will berelatively insensitive to changes in abundance at the level at which the fishery impacts onthe fish populations, that is at the individual reef level. Further, analysis of data at the blocklevel does not overcome the species problem.
The stock status of wrasse is uncertain.
Table 6.1 Wrasse catch, effort and CPUE for the main wrasse fishing methods.For effort units refer to Table 2.3.
Method Year Catch (tonnes) Effort CPUEFish trap 1995/96 32.6 7813 3.59
1996/97 45.5 10329 3.941997/98 36.3 9386 3.611998/99 43.5 10159 4.00
1999/2000 42.0 9988 3.80Hand line 1995/96 29.2 7626 3.08
1996/97 46.9 13209 3.161997/98 42.2 10648 3.191998/99 32.4 6737 3.69
1999/2000 27.5 6139 3.60Graball 1995/96 19.3 30655 0.69
1996/97 16.0 27219 0.681997/98 19.2 45492 0.691998/99 12.7 30116 0.71
1999/2000 12.2 52469 0.42

Scalefish Fishery Assessment: 2000
TAFI Technical Report No. 19 Page 42
0
10
20
30
40
50
95/96 96/97 97/98 98/99 99/00
Cat
ch (t
onne
s)
0
2000
4000
6000
8000
10000
12000
95/96 96/97 97/98 98/99 99/00
Effo
rt (N
o. o
f tra
p lif
ts)
1
2
3
4
5
95/96 96/97 97/98 98/99 99/00
CPU
E (k
g/tr
ap li
fts)
Fig. 6.3 Annual fish trap catch, effort and catch per unit effort (CPUE) of wrasse in Tasmania.
0
10
20
30
40
50
95/96 96/97 97/98 98/99 99/00
Cat
ch (t
onne
s)
0
3000
6000
9000
12000
15000
95/96 96/97 97/98 98/99 99/00
Effo
rt (L
ine
hrs)
0
1
2
3
4
95/96 96/97 97/98 98/99 99/00C
PUE
(kg/
line
hrs)
Fig. 6.4 Annual handline catch, effort and catch per unit effort (CPUE) of wrasse in Tasmania.
6.5 Evaluation of Trigger Points
Total catch
i. Total catch of a key target species is outside of the 1990/91 to 1997/98 range; or when,
ii. total catch of a key target species declines or increases in one year more than 30%from the previous year.
Total catch of wrasse for the period 1990/91 to 1997/98 ranged from 57 to 178 tonnes(Table 2.1). However, given the rapid increase in wrasse landings between 1990/91 and1992/93 as the live fishery developed there is little value in using the full range to establish ameaningful catch history against which future catch levels can be compared. A furtherconsideration is the suggestion that 1993/94 and 1994/95 catches were significantlyoverstated in the light of expectations that the fishery was about to become limited entry,with access based on catch history. Therefore, for the purpose of trigger point assessment,catches for the period 1995/96 to 1997/98 have been adopted as the reference period.
As the 1999/2000 catch was within the reference range and varied less than 30% from the1998/99 level (refer Table 2.1), no catch triggers were exceeded for wrasse.

Scalefish Fishery Assessment: 2000
TAFI Technical Report No. 19 Page 43
Fishing effort
Fishing effort for any gear type, or effort targeted towards a species or species group,increases by 10% from the highest of the 1995-97 levels.
Fishing effort peaked in both the handline and trap fisheries in 1996/97 indicating that efforttriggers were not reached for either method based on 1999/2000 data (Table 6.1). Althoughin 1999/2000 graball effort exceeded the previous peak (1997/98) by about 15%, this doesnot necessary indicate an increase in gillnet effort targeted at wrasse, an observationsupported by consistency in catch levels over the past two years.
Catch rates (CPUE)
In a given year, the CPUE of a key target species is less than 80% of the lowest value forthe 1995-97 period.
Minimum CPUE levels occurred in the trap and handline components of the fishery in1995/96 (Table 6.1). As the most recent annual CPUE values for fish trap and handlinemethods were within or higher than the reference range, this trigger was not reached. Thesharp fall in graball CPUE is not considered a reliable indicator since the species occurlargely as an incidental catch using this method.
Although no CPUE triggers were reached for the trap and handline gears, these observationsshould be treated with some caution since the analysis is based on the entire State and not atspatial scales appropriate to the life history of the species.
Change in size composition
i. A significant change in the size composition of commercial catches for key species; orwhen,
ii. monitoring of the size/age structure of a species indicates a significant change in theabundance of a year class (or year classes), with particular importance on pre-recruityear classes.
During 1998, limited commercial monitoring of the trap fishery found fish within the legalsize range made up about 48% of the catch. There is likely to be considerable variability inthe size composition of the catch between regions and species, reflecting possible small-scale differences in growth and/or recruitment. Examination of such aspects is the subject tocurrent research projects.
6.6 Implications for Management
While input controls (limited entry) have capped participation in the live wrasse fishery, it isunknown whether current harvest levels are sustainable. Under present arrangements, thereis potential for localised depletions, especially if effort becomes concentrated in particularregions. There is, for example, already evidence for a concentrating of effort and catch offthe east coast, especially blocks 6G4, 6H1 and 6H3.
Wrasse are currently managed and reported in catch returns as a species group, rather than atthe individual species level. This clearly has implications for stock assessment, producinguncertainty in the interpretation of fishery indicators.

Scalefish Fishery Assessment: 2000
TAFI Technical Report No. 19 Page 44
There is a need to assess the levels of usage of wrasse as rock lobster bait and specifically toensure that such usage is reported in the catch returns. As all holders of rock lobsterlicences have unrestricted access to wrasse for bait there is potential for this sector, alongwith the live fish fishers, to impact significantly on stocks.
6.7 Research NeedsThe Scalefish Fishery Research Advisory Group has accorded stock assessment, impact ofmanagement arrangements and impacts of different fishing gear on wrasse populations ashigh research priorities.
Research into the recruitment rates of juveniles to reefs, total biomass estimates and thesustainability of current fishing levels need to be undertaken. There is also a need to definepopulation parameters for purple and blue-throat wrasse (including growth and mortality)and to conduct yield per recruit analysis to determine the appropriate legal minimum andmaximum size limits.
Commercial monitoring of the wrasse fishery is required because of inferences that can bemade about changes in species, size and sex structure of populations, parameters that arelikely to provide more suitable biological reference points for this fishery. Alternatively,commercial fishers could be encouraged to provide information on the species breakdownand greater spatial resolution in relation to their catches.

Scalefish Fishery Assessment: 2000
TAFI Technical Report No. 19 Page 45
7 Southern calamary (Sepioteuthis australis)
7.1 Management Background
Annual catches of southern calamary rose dramatically in 1998/99 from historic levels ofgenerally below 20 tonnes to almost 100 tonnes, prompting the warning by the Minister forPrimary Industries, Water and Environment during August 1999. The Minister announcedthat management arrangements for southern calamary were under review and restrictions oncatch, effort and numbers of operators accessing the resource may be introduced in thefuture. In addition, temporary short-term closures of Great Oyster Bay were implementedduring October and December 1999 to protect egg production. Similar closures were alsoimplemented in 2000.
Growing markets for the species coupled with increasing use of squid jigs, a methodavailable to all holders of scalefish and rock lobster licences, to target the species havecontributed to the recent expansion of the fishery.
7.2 Stock Structure and Life-history
Southern calamary are a shallow water species endemic to southern Australian and northernNew Zealand waters. It is one of the most common cephalopods in the coastal waters ofsouthern Australia and is an important component of the coastal ecosystem as a primaryconsumer of crustaceans and fishes, and as a significant food source for numerous marineanimals.
The species is short-lived, probably living for less than one year (Pecl 2000) althoughgrowth is extremely variable. Maximum recorded ages of female and male southerncalamary are 263 and 275 days respectively, with males appearing to live slightly longer onaverage than females. Males attain a greater size at age than females. The maximumrecorded size of females and males are 2 kg and 398 mm and 3.6 kg and 538 mm dorsalmantle length (ML), respectively. The rate of growth is rapid, at 7-8% body weight per day(BW day –1) in individuals less than 100 days old, decreasing to 4-5% BW day –1 in squidolder than 200 days. At 200 days of age individual males may vary in size by as much as1.5 kg and females by as much as 0.9 kg. Some of this variability in growth may beexplained by temperature or food availability at hatching, with those individuals hatched inwarmer seasons growing faster (Pecl 2000).
On the east coast of Tasmania, males account for around 60% of the commercial catch. Insummer and winter, the majority of males taken by the fishery are mature, with immaturemales very rarely caught. Over 90% of females caught in summer are mature, whereas inwinter over 50% are either immature or in developing stages of maturity. Minimumrecorded age and size at maturity for females is 117 days, 0.12 kg and 147 mm ML.However, immature females as old as 196 days and up 0.62 kg and 237 mm ML have beenrecorded. Males are mature as young as 92 days and as small as 0.06 kg and 104 mm ML.
Although spring/summer appears to be a major spawning period in Tasmania there isevidence that spawning occurs all year round (Moltschaniwskyj unpublished data). Themajority of summer caught squid are hatched in winter and vice versa. Southern calamaryare multiple spawners although the duration of individual maturity and the frequency ofbatch deposition are unknown. In summer, females appear to lay larger batches of eggs thando winter spawners (Pecl 2001). Several females deposit eggs together in collective egg

Scalefish Fishery Assessment: 2000
TAFI Technical Report No. 19 Page 46
masses, attaching the finger like capsules to the substrate by small stalks. Eggs appear to bemost commonly attached to Amphibolis seagrass although they are also found attached tomacro-algae. Individual egg capsules contain 4-7 eggs, with 50 to several hundred eggstrands joined together to form larger egg mops. Development takes between 4-8 weeks,depending on water temperature (Steer unpublished data.).
Newly hatched calamary are 2.4-7 mm ML and immediately swim to the surface followinghatching. Hatchlings remain over the spawning grounds for 20-30 days. The location ofindividuals between about 20-80 days of age is unknown, however at 80-150 days juvenilesare found in deep water adjacent to the spawning grounds. Individuals become available tothe fishery at approximately 90-120 days of age. A pilot tagging study suggests that once onthe spawning grounds individuals are site-specific (Jackson and Pecl unpublished data).Movement prior to arrival on the spawning grounds is unknown.
The range of biological parameters that have been defined for southern calamary inTasmania are presented in Appendix 7.
7.3 Previous Assessments
The 1999 assessment was restricted to an analysis of trends in catch, effort and catch ratesfor squid jig and purse seine methods. There was a large increase in the total catch ofsouthern calamary in 1998/99, due almost exclusively to increased squid jig effort, whichresulted in both catch and effort triggers being exceeded for this species. Catches fromGreat Oyster Bay, Mercury Passage and Tasman Peninsula regions combined contributedaround 80% of the total and consequently trends in catch, effort and CPUE were alsoanalysed at the regional level. Jig effort was found to have increased markedly in 1998/99,largely due to targeted fishing over seagrass beds in the eastern Great Oyster Bay andMercury Passage regions, with the effort trigger greatly exceeded for this gear type.
7.4 Current Assessment
7.4.1 The Fishery
Southern calamary are taken by a variety of methods including purse seine, beach seine,squid jig, spear and dip net, with squid jigs and purse seine the primary methods, accountingfor around 73% of the catch in 1999/2000(Fig.7.1). Both purse seine and jig fishing areconducted close to shore, almost exclusively in depths of <10 m. Jigs are used during theday over shallow areas of seagrass and macro-algae to target fish concentrated on thesebeds. Southern calamary are taken commercially along the north and east coasts ofTasmania and off Flinders Island, with the greatest portion of the catch taken in the MercuryPassage and Great Oyster Bay regions.

Scalefish Fishery Assessment: 2000
TAFI Technical Report No. 19 Page 47
�������������������������
������������������������
������������������������ ������������
������������
������������ ������������
������������������������
������������
������������ ������������
0
20
40
60
80
100
95/96 96/97 97/98 98/99 99/00C
atch
(ton
nes)
�������� Other
HL����
GNBS����
���� DNSPPSSJ
Figure 7.1. Annual catch of southern calamary by method. SJ is squid jig; PS is purse seine; SP is spear; DN isdip net; BS is beach seine; GN is graball net; HL is handline.
7.4.2 Recent Developments
A recent study of the fishery and biology of southern calamary examined aspects ofreproductive biology, early life history, size composition and age and growth in GreatOyster Bay (Pecl 2001). In October 1999, an follow-up study was initiated to furtherexamine these population parameters, with research sampling conducted on a more intensivetemporal basis. The size composition and sex ratio of the commercial catch from both jigand purse seine gears are being monitored on a monthly basis to determine biological andpopulation characteristics as a function of season, region and fishing method. This researchhas shown that while overall the size composition of the commercial catch is comparable tothat obtained during 1995/96 and 1996/97, the biological characteristics are extremelyvariable both between and within regions.
A temporary closure to protect spawning squid in Great Oyster Bay was implemented over 2two-week periods in late October to early December of 1999, with 2 weeks of commercialaccess allowed in between the closures. During the first of the two closures, densities ofeggs on the seagrass increased six-fold suggesting that the either the closure providedprotection to the spawning aggregations or promoted an increase in spawning activities(Moltschaniwskyj et al. 2001). An increase in egg densities did not occur over themonitored sites during the second closure, however, the reproductive condition of thefemales had declined by this time. A similar system of closures in Great Oyster Bay wasimplemented between October and December 2000, with egg densities again monitoredduring open and closed periods. Results of this research have yet to be fully synthesised.
Although Great Oyster Bay continued to be an important focus for fishing activity, evidencefrom regional effort data suggested that the closures have encouraged fishers to target areasoutside of this region (Moltschaniwskyj et al. 2001).
Recent research has also examined levels of mortality occurring within the egg mops laid inGreat Oyster Bay. This has shown that mortality of individual eggs can be significant,sometimes as high as 20%, and is also highly variable temporally. Work is currentlyprogressing to establish relationships between egg mortality rates and environmentalparameters such as temperature.

Scalefish Fishery Assessment: 2000
TAFI Technical Report No. 19 Page 48
7.4.3 2000 Assessment
There has been a considerable change in the annual catch of southern calamary combinedacross all fishing gears over the past five years, ranging from 19 tonnes in 1996/97 to 87tonnes in 1999/2000, with a peak of 94 tonnes in 1998/99 (Table 2.1). The higher catches of1998/99 and 1999/2000 have been almost exclusively due to increased squid jig effort(Table 7.1).
This assessment is restricted to an examination of trends in catch, effort and catch rates since1995/96 and as squid jig and purse seine are the primary fishing methods, analysis has beenrestricted to these methods. It should be noted, however, that as five or fewer vessels wereinvolved in the use of purse seines between 1996/97 and 1998/99, catch and effort data havenot been reported.
State-wide, jig effort increased again in 1999/2000, up by 18% from the 1998/99 peak.There was, however, a 30% decrease in CPUE compared to 1998/99 that resulted in a 10%fall in the jig catch (Table 7.1). Purse seine CPUE, which had remained relatively stableover the previous four-year period, declined by almost 40% in 1999/2000.
Trends in catch, effort and CPUE have been examined in more detail for the three keyfishing regions, namely Great Oyster Bay (blocks 6H1, ES13 and ES14), Mercury Passage(6H3, 6G4 and ES16) and Tasman Peninsula (7G2). Collectively these regions accountedfor 82% of both the overall squid jig catch and effort in 1999/2000. Whereas in previousyears catch and effort was concentrated in Great Oyster Bay, in 1999/2000 catch and effortlevels were generally similar for Great Oyster Bay and Mercury Passage (Fig.7.2). Thisgeneral shift in the fishery reflected a combination of reduced activity in Great Oyster Bayand increased fishing in the Mercury Passage. This shift was probably at least partly aresponse to the short-term fishing closures imposed during 1999 in Great Oyster Bay.Although CPUE in each of the three regions declined in 1999/2000, levels were comparableor slightly higher that those for the period 1995/96 to 1997/98.
Interestingly, in 1999/2000 around 3.4 tonnes of calamary was coded as handline catch,representing a ten-fold increase when compared to the previous three years. As the majorityof this was probably taken using jigs this effectively would represent a further increase toboth catch and effort for this gear type.
The resource status of southern calamary is unknown and the sustainability of current catchlevels is uncertain. The fact that calamary have a life span of generally less than one year,with no accumulation of recruitment across a number of years, suggests considerablepotential for inter-annual variability in abundance coupled with vulnerability to recruitmentover-fishing, especially since the species can be targeted whilst aggregating to spawn.

Scalefish Fishery Assessment: 2000
TAFI Technical Report No. 19 Page 49
Table 7.1 Catch, effort and CPUE by key fishing methods for southern calamary.For units of effort and CPUE refer to Table 2.3. * 5 or fewer vessels involved, data can not be shown.
Method Year Catch (tonnes) Effort CPUESquid jig 1995/96 5.1 360 10.0
1996/97 0.3 127 2.61997/98 5.3 1407 5.01998/99 63.0 6592 8.9
1999/2000 56.7 7799 6.2Purse seine 1995/96 21.0 322 31.1
1996/97 * * 28.61997/98 * * 29.81998/99 * * 31.6
1999/2000 6.8 199 20.0
0
1000
2000
3000
4000
95/96 96/97 97/98 98/99 99/00
Effo
rt (J
ig h
rs)
0
15
30
45
60
95/96 96/97 97/98 98/99 99/00
Cat
ch (t
onne
s)
GOBMercury PassageTasman
0
2
4
6
8
10
12
14
95/96 96/97 97/98 98/99 99/00C
PUE
(kg/
Jig
hr)
Fig. 7.2 Annual squid jig catch, effort and catch per unit effort (CPUE) of southern calamary in Tasmania.
7.5 Evaluation of Trigger Points
Total catch
i. Total catch of a key target species is outside of the 1990 to 1997 range; or when,
ii. total catch of a key target species declines or increases in one year more than 30%from the previous year.
The 1999/2000 catch of southern calamary was clearly in excess of catches for the period1990/91 to 1997/98, indicating that the catch trigger was exceeded for the second yearrunning. However, although the current catch was lower than in 1998/99, the decline ofabout 8% did not exceed the second catch trigger.
Fishing effort
Fishing effort for any gear type, or effort targeted towards a species or species group,increases by 10% from the highest of the 1995-97 levels.
Purse seine fishing effort has remained relatively stable over the past four years indicatingthis effort trigger has not been reached. By contrast, jig effort increased again in 1999/2000by at least 18%, and possibly up to 25% if effort reported as ‘handline’ is combined with the

Scalefish Fishery Assessment: 2000
TAFI Technical Report No. 19 Page 50
jig effort. Current jig effort is substantially higher than the reference period and thereforethe effort trigger has been exceeded for the second year.
Catch rates (CPUE)
In a given year, the CPUE of a key target species is less than 80% of the lowest value forthe 1995-97 period.
Although 1999/2000 jig CPUE was within the reference period range, it was about 30%lower than for the previous year, with declines occurring in each of the major fishingregions. Purse seine catch rates also declined by about 40%, to a level equivalent to 70% ofthe lowest value from the 1995-97 period. As such this trigger point has been exceeded forpurse seine. However, it is unclear how the recent changes to the licensing arrangements forpurse seines (i.e. limited entry) have impacted on the use of this method to target calamary.
Southern calamary are a schooling species that aggregates to spawn, at which time they canbe effectively targeted using jigs or purse seines. As a consequence, catch rates can beexpected to remain relatively stable even with decreasing stock abundance. Therefore,declines in CPUE need to examined carefully. The influence on catch rates of the seasonalclosure of Great Oyster Bay is uncertain, however the fact that declines were alsoexperienced in all other areas is of concern and warrants closer scrutiny.
Change in size composition
i. significant change in the size composition of commercial catches for key species;or when,
ii. monitoring of the size/age structure of a species indicates a significant change inthe abundance of a year class (or year classes), with particular importance on pre-recruit year classes.
Commercial and research sampling indicates a considerable range of sizes, and possibly agestructure of southern calamary in the commercial fishery. The significance of observeddifferences between sites and years have yet to be evaluated.
7.6 Implications for Management
All holders of scalefish fishing licences are entitled to use squid jigs and, therefore, givengrowing interest in this species, there is potential for further expansion in effort. There islittle information available on the stock structure of southern calamary, which is requiredbefore the appropriate size of spatial management regions can be developed.
As a consequence of the short life span (less than one year), annual recruitment to thepopulation is essential since there is no accumulation of recruitment across a number ofyears to stabilise the population against recruitment fluctuations. The growth andreproductive characteristics of ‘micro-cohorts’ differ substantially, depending upon thetiming of hatching and subsequent environmental conditions. Environmental factors maytherefore be as important as fishing mortality in driving the population dynamics anddetermining spatial patterns of abundance.
The 1999 closures were implemented as an emergency measure when little information wasavailable on the temporal and spatial predictability of spawning activities. Although it was

Scalefish Fishery Assessment: 2000
TAFI Technical Report No. 19 Page 51
evident that the 1999 closures were successful in providing some protection to spawninganimals, current research may allow the timing of future closures to be made on a biologicalbasis that offers maximum protection to spawning aggregations.
Seagrass is important to the life history of southern calamary and therefore the distributionand health of seagrass beds is an important issue for the species. Recent reports of largereductions in the size of seagrass beds around Tasmania are of concern.
7.7 Research Needs
The Scalefish Fishery Research Advisory Group has recognised stock assessment,evaluation of critical habitat requirements, impact of management arrangements and gearinteractions on calamary populations as high priority research areas.
Information on the stock structure and level of fishing pressure that can be sustained onsouthern calamary is required. Integral to this is the need to analyse statoliths for age inorder to determine spawning times and growth rates of seasonal cohorts. Our understandingof the variability and plasticity in the life cycle, and the subsequent application of populationmodelling techniques, would benefit from more detailed research into determining linksbetween environmental factors and growth, reproductive and survival characteristics. Giventhe vulnerability to recruitment failure, the impact of fishing activities on the spawningbehaviour of the aggregations needs to be addressed. The relationship between reproductiveoutput and age and size of females, in terms of batch size and frequency of batch deposition,needs to be quantified. The significance of seagrass and macro-algal habitats for spawningand feeding of southern calamary will require further sampling in areas along the east coast.

Scalefish Fishery Assessment: 2000
TAFI Technical Report No. 19 Page 52
8 Arrow squid (Nototodarus gouldi)
8.1 Management BackgroundArrow squid were first targeted in Tasmania in the early 1970’s by fishers operating in theDerwent estuary. At this time, around 30 fishers landed over 150 tonnes over a two-monthperiod. However, prior to this unusual occurrence, the only catches of arrow squid weretaken as a by-catch to otter trawling, Danish seining and trolling.
In the late 1970’s to early 1980’s, Japanese, Korean and Taiwanese fishing interests targetedthe arrow squid fishery in waters off South Australia, Victoria and Tasmania using vesselsgeared up with automatic squid jigging machines and fish attraction lamps.
A domestic arrow squid fishery developed in the late 1980’s in Commonwealth waters usingautomatic squid jigging gear developed by the Japanese. This fishery has expanded toinclude around 40 active participants in the Southern Squid Jig Fishery. These fisherspredominantly target arrow squid in western Bass Strait, where catches steadily increased toaround 2,000 tonnes in 1997 and then declined to around 400 tonnes in 1998.
The South East Fishery and Great Australian Bight Trawl Fisheries also take arrow squid asa by-catch of trawling in Commonwealth waters. Annual catches have remained relativelyconsistent around 400 - 600 tonnes since 1986.
Under the scalefish management plan all scalefish and rock lobster licence-holders areentitled to use an unrestricted number of squid jigs. Until recently, the Tasmanian arrowsquid fishery was based around diversified fishers periodically targeting arrow squid usingsquid jigs by hand or semi-automatic fishing devices. The fishery expanded rapidly betweenNovember 1999 and February 2000 where approximately 400 tonnes of arrow squid weretaken in State waters (mainly Storm Bay) by vessels using automatic squid jigging gear.Most of these vessels also participate in the Southern Squid Jig Fishery.
In April 2000, the Tasmanian Minister for Primary Industries, Water and Environmentissued a press statement warning fishers against investing in automatic squid jigging gearand fish attraction lamps. The Minister also made fishers aware that managementarrangements for this fishing sector would be reviewed, and that catches taken after the pressrelease date might not be taken into account in any determination of future access to theresource. In November 2000, the Minister advised that State waters would be closedtemporarily (between December 2000 and February 2001) to large-scale automatic jigoperators, unless otherwise authorised by permit. About 15 arrow squid permits wereissued. Long-term management of the arrow squid fishery will be considered in the reviewof the scalefish management plan, scheduled to take effect in late 2001.
8.2 Stock Structure and Life-historyArrow squid are found throughout the shelf waters of southern Australia, from Geraldton inWestern Australia to latitude 27°S in southern Queensland and including Bass Strait andTasmania. They are also common in New Zealand waters where they support a majorfishery along with the related species, N. sloanii. Arrow squid are an oceanic squid but arecommonly found schooling in shallow coastal and estuarine waters at certain times of theyear (Winstanley et al. 1983). Stock structure within Australian waters is not known at

Scalefish Fishery Assessment: 2000
TAFI Technical Report No. 19 Page 53
present and it is unclear whether the Australian and New Zealand populations are a singlegenetic stock.
Arrow squid aggregate near the sea bed during the day and disperse through the watercolumn at night to feed (Winstanley et al. 1983, O’Sullivan and Cullen 1983). Their dietconsists mainly of planktonic crustaceans, fish and other squids (O’Sullivan 1980). Themain predators of arrow squid are seals, dolphins, tuna and benthic and bathypelagic fishesincluding school shark (Coleman and Hobday 1982).
As a general group, squid are fast growing, short-lived animals. Arrow squid are thought tolive for up to 12 months. Females grow larger than males and reach 1.4 kg and 370 mmML, males reach 1.0 kg and 330 mm (Harrison 1980).
Based on length frequency information, early research on arrow squid in Tasmaniasuggested that there were at least three separate broods or cohorts a year. These weretermed the winter, spring and summer broods (Harrison 1980). More recent work based onageing using statoliths has revealed that growth rates are highly variable in response toecological parameters, such as temperature and productivity, and that length is not a reliableindicator of age.
Males store sperm in spermatophoric packages that are transferred to the female using asingle modified arm called a hectocotylis. Females are mated before they mature and storethe sperm packets in buccal pouches around the mouth. Eggs are fertilised as they emergefrom the ovary and are transferred to a gelatinous mucous ball produced by the female(Harrison 1980). It is not known whether the egg mass is free floating or attached to thesubstrate. Naturally spawned egg masses for arrow squid have not been identified andstudied. Based on studies of other oceanic species, it is thought that fertilised eggs developand hatch in 1 to 2 months, depending on water temperature.
8.3 Previous assessmentsThere have been no previous assessments of arrow squid apart from reporting of catchlevels.
8.4 Current Assessment
8.4.1 The Fishery
The Tasmanian arrow squid fishery targets schools forming around the coast from Octoberthrough to March. The fishery saw a dramatic expansion of effort in the jig sector in1998/99 and again in 1999/2000, with annual catches increasing from less than about 10tonnes during the 1990’s to 86 tonnes in 1998/99 and 430 tonnes in 1999/2000 (Table 2.1).
The majority (about 80%) of the 1998/99 and 1999/2000 catches were taken betweenDecember and January and predominately from Storm Bay. Overall, 90% of the 1999/2000catch was taken from Storm Bay (blocks 7G1, 7G2, 7G3). Smaller quantities were takenfrom Bass Strait, east of the Tamar River, and off the east coast, mainly south of theFreycinet Peninsula. Industry reports suggest that catch and effort in the Bass Strait regionwas unusually low in 1999/2000 because of the presence of large quantities of barracoutawhich caused excessive damage and losses to fishing gear.

Scalefish Fishery Assessment: 2000
TAFI Technical Report No. 19 Page 54
The Tasmanian fleet consists of a small number of the large commercial automated jigvessels (with four to eight jig machines), most of which also participate in theCommonwealth squid fishery, and a large number of smaller diversified operators. Some ofthese diversified operators have recently invested in a small number of automated jigmachines (one or two) and lights. Others have constructed semi-automated systems whilst,at the most basic level, hand operated lines with one or more jigs attached are used. Smalleroperators tend to have success fishing during the day in shallow water while automatic jigboats fishing at night have the highest catches in waters ranging from 20 to 100 m.
Logistically, the fleet is limited in its area of operation since the catch is either stored on iceor in brine and spoils quickly. It is necessary therefore to fish in close proximity to theprocessing and storage facilities. Partly for this reason, catches in the past two seasons havebeen concentrated in Storm Bay and to a lesser extent off the east and north coasts ofTasmania.
8.4.2 Recent developments
Limited catch sampling was undertaken during the 1999/2000 season as part of researchbeing undertaken by the University of Tasmania’s Institute of Antarctic and Southern OceanStudies (IASOS) (B McGrath and G Jackson) and as part of an Australian Maritime Collegeproject (R Mitchell).
The size composition of samples of arrow squid showed a trend of growth over the1999/2000 season. The average size increased from 223 mm ML in December 1999 to 299mm in February 2000. Sex and maturity information indicated that virtually all of thefemales and over 75% of males caught were immature in December and January. Fifty fivepercent of females and 11% of males caught in February were mature. The sex ratio wasroughly 50:50 in December but by January and February females dominated the catches (70- 100%).
These data indicate that the majority of arrow squid caught at the height of the season(December and January) were small and had not reached maturity. Industry reports suggestthat a large proportion of the Tasmanian catch was not of size suitable for processing intosquid tubes for human consumption but was processed for (longline) bait.
8.4.3 2000 Assessment
There has been a dramatic expansion in the arrow squid fishery over the past two years, withcatches reaching about 430 tonnes in 1999/2000 (Table 2.1). The higher catches have beenalmost exclusively due to increases in squid jig effort compared to earlier years and, inparticular, due to the operation of automatic squid vessels5 (Fig. 8.1). In 1999/2000, theautomated jig sector, some 11 vessels, alone accounted for 86% of the total catch.
Given the recent expansion of the fishery, examination of catch, effort and CPUE trends willnot be meaningful. It would appear that arrow squid occur seasonally in coastal waters and,based on the 1999/2000 season, are largely represented by juveniles. The impact of takinglarge quantities of juvenile squid out of the population on subsequent spawning success isunknown. There are, however, indications that not only is the availability of arrow squid 5 Automated jig systems have been defined as operations using more than 100 jigs (mostly >200 jigs), whereasjig operations refer to operators using hand operated or semi-automated systems involving less than 100 jigs(mostly < 60 jigs).

Scalefish Fishery Assessment: 2000
TAFI Technical Report No. 19 Page 55
highly variable between years but the size (and maturity) of squid varies between and withinseasons. The effects of taking large quantities of squid over a short period of time and froma very limited area (Storm Bay) on the squid population and more broadly on the generalecosystem is not known.
The resource status of arrow squid is unknown and the sustainability of current catch levelsis uncertain. The fact that arrow squid probably have a life span of generally less than oneyear, with no accumulation of recruitment across a number of years, suggests considerablepotential for inter-annual variability in abundance coupled with vulnerability to recruitmentover-fishing. The relationships between arrow squid populations from south-easternTasmania and those exploited in the Commonwealth fishery in Bass Strait is not known.
Table 8.1 Catch, effort and CPUE by key fishing methods for arrow squid.For units of effort and CPUE refer to Table 2.3. * 5 or fewer vessels involved, data can not be shown.
Method Year Catch (tonnes) Effort CPUESquid jig 1995/96 3.5 4563 0.23
1996/97 5.4 405 2.101997/98 12.0 6484 2.711998/99 25.7 3822 4.96
1999/2000 57.0 21537 3.05Auto jig 1998/99 * * 0.15
1999/2000 373.0 875191 0.27
0
100
200
300
400
500
95/96 96/97 97/98 98/99 99/00
Cat
ch (t
onne
s)
OtherSJAJ
Fig. 8.1. Annual catch of arrow squid by method. SJ is squid jig; AJ is automated jig system.
8.5 Evaluation of Trigger Points
Total catch
i. total catch of a key target species is outside of the 1990 to 1997 range; or when,
ii. total catch of a key target species declines or increases in one year more than 30%from the previous year.
The 1999/2000 catch of 430 tonnes was the highest on record for Tasmania, representing afive-fold increase over the 1998/99 catch. Both catch triggers were, therefore, exceeded.

Scalefish Fishery Assessment: 2000
TAFI Technical Report No. 19 Page 56
Fishing effort
Fishing effort for any gear type, or effort targeted towards a species or species group,increases by 10% from the highest of the 1995-97 levels.
Jig effort increased again dramatically in 1999/2000, exceeding effort trigger level for thesecond year in a row.
Catch rates (CPUE)
In a given year, the CPUE of a key target species is less than 80% of the lowest value forthe 1995-97 period.
Jig CPUE is unlikely to be a very reliable indicator of abundance since arrow squid are aschooling species and are generally attracted through the use of lights to the fishing vessel.Notwithstanding this, jig CPUE was within the reference range of values while theautomated jig CPUE was almost twice that for 1998/99. On this basis, the catch rate triggerwas not reached.
Change in size composition
i. a significant change in the size composition of commercial catches for keyspecies; or when,
ii. monitoring of the size/age structure of a species indicates a significant change inthe abundance of a year class (or year classes), with particular importance on pre-recruit year classes.
Catch sampling for 1999/2000 season indicated that the bulk of the catch was comprised ofsmall and immature individuals. The impact of taking large quantities of juvenile squid onthe population is not known.
8.6 Implications for Management
The sporadic nature of the arrow squid fishery in south-east Australia has been due in part,to economic viability, as dictated by world supply and demand for squid, and to fluctuationsin the size of the stock available to the jig fishery. Some variation in effort may also be dueto fluctuations in the performance of other south-east Australian fisheries which has theeffect of forcing fishers to look to alternative species such as squid. Very little is knownabout the population dynamics of arrow squid in Australian waters at this stage.
A number of characteristics particular to squid populations make management of suchfisheries particularly difficult. The short life span means that essentially a new populationhas to be managed each year. Also, the extreme plasticity of growth in squid means that themore traditional use of length frequency relationships in management and assessmenttechniques are not valid. Ageing of individuals is a much more powerful tool fordetermining population dynamics.
A significant body of latent effort in the Tasmanian arrow squid fishery exists in the form ofCommonwealth automated jig boats that are increasingly looking to maximise the length oftheir fishing season. Arrow squid become available to the jig fishery in Tasmania as early asNovember as opposed to February in Bass Strait. By fishing in Tasmanian waters,
Scalefish Fishery Assessment: 2000
TAFI Technical Report No. 19 Page 57
Commonwealth operators can increase the length of the season by up to 4 months. There isan urgent need to address the issue of access by large-scale operators to the fishery. Thiswas undertaken as an interim measure for the 2000/01 season but should be resolved withinthe context of the scalefish management plan review in 2001.
8.7 Research NeedsThe need for research into arrow squid, in particular in relation to monitoring size/agestructure and reproductive condition as a means of supporting management, was identifiedas a high research priority by the Scalefish Fishery Research Advisory Group. Very little isknown about the ecology and population dynamics of arrow squid populations aroundTasmania. Various studies have been conducted since the early 1970’s and data obtainedfrom these studies have shown a high degree of variability in the distribution and abundanceof the species between years. Recent ageing work on squids has revealed that the moretraditional use of length frequency analysis may not be an appropriate way to model thepopulations.
Research into the life history and stock structure of arrow squid off southern Australia isbeing undertaken by IASOS. A post-graduate study within TAFI to examine the dynamicsof arrow squid in Tasmanian waters has also been proposed.

Scalefish Fishery Assessment: 2000
TAFI Technical Report No. 19 Page 58
9 Other key scalefish species
Catch, effort and CPUE for the main fishing methods for Australian salmon, bastardtrumpeter, blue warehou, flounder and jackass morwong are presented in Table 9.1.Reference should also be made to Table 2.1 and Fig. 2.1 for recent catch history trends.
The beach seine catch of Australian salmon has declined steadily since 1997/98, reflecting ageneral decrease in effort (Table 9.1). While there was no consistent trend in CPUE, beachseines are generally used to target schooling fish and therefore catch rates are unlikely to bea reliable indicator of stock abundance. The graball catch increased slightly in 1999/2000,due largely to an increase in graball effort. No catch, effort or CPUE triggers were exceededfor Australian salmon.
The 1999/2000 graball catch of bastard trumpeter declined by about 27% compared with theprevious year, despite a 14% increase in effort (Table 9.1). Although the most recent CPUEvalue was the lowest since 1995/96, it was still within 80% of the previous lowest level(1997/98) and therefore did not exceed the trigger. Bastard trumpeter, like the relatedstriped trumpeter, are known to exhibit strong recruitment variability which may result inshort-term variability in catch rates. The development of pre-recruit indices of abundance(in conjunction with striped trumpeter) may represent a feasible means of explaining (andeven predicting) some of the variability in availability and thus catch rates.
The most recent graball catch for blue warehou catch fell by over 30% when compared tothe previous year, to a level equivalent to that for 1997/98 (Table 9.1). In doing so the catchtrigger relating to rate of change in annual catches was exceeded. There was a slight declinein effort and CPUE in 1999/2000 but neither effort nor CPUE triggers were reached. Bluewarehou occur seasonally in Tasmanian inshore waters, this area representing the southernmost extent of the species distribution. In addition, the availability of blue warehou ininshore waters appears to be influenced by prevailing oceanographic conditions. Combined,these factors result in marked inter-annual variability in catches as demonstrated in Table2.1. However, availability will also be influenced by overall stock size, this species beingthe subject of a larger trawl and gillnet fishery in Commonwealth waters.
The graball catch of flounder fell by over 50% in 1999/2000, due largely to a drop in effortof similar magnitude (Table 9.1). CPUE has, however, increased steadily since 1995/96.The spear catch was very similar to 1998/99 and although spear CPUE was at the lowestlevel for the five year period, the CPUE trigger was not reached. As the combined catch (allmethods) of flounder was lower than the reference period the catch trigger has beenactivated (refer Table 2.1).
Both catch triggers were exceeded for jackass morwong, with 1999/2000 catches the lowestsince 1990/91, representing a decline of greater than 30% over the previous year’s catch(refer Table 2.1). Jackass morwong are taken by a variety of methods, the most significantbeing graball nets. It is apparent from Table 9.1 that the sharp decline in graball catch wasdue to a marked fall in effort, CPUE being slightly higher in 1999/2000 compared to1998/99. Effort and CPUE triggers were not, therefore, reached. As for blue warehou, thespecies is taken by trawl in Commonwealth waters, where catches are significantly greaterthan those taken from State waters.

Scalefish Fishery Assessment: 2000
TAFI Technical Report No. 19 Page 59
Table 9.1 Catch, effort and CPUE by method for key species for the period 1995/96 to 1999/2000.For units of effort and CPUE refer to Table 2.3.
Species Method Year Catch (tonnes) Effort CPUEAustralian Salmon Beach seine 1995/96 387.7 221 211.97
1996/97 253.8 238 119.171997/98 437.6 359 184.011998/99 352.0 150 244.39
1999/2000 309.6 143 145.37Graball 1995/96 12.9 11245 0.90
1996/97 14.1 10983 1.371997/98 16.3 8137 1.941998/99 11.0 7169 1.70
1999/2000 13.5 9957 1.15Bastard trumpeter Graball 1995/96 59.1 76964 0.86
1996/97 50.0 80315 0.731997/98 39.5 58352 0.681998/99 45.9 61018 0.75
1999/2000 33.5 69718 0.63Blue warehou Graball 1995/96 50.5 42047 0.76
1996/97 111.6 86524 1.041997/98 177.5 118622 1.361998/99 257.5 97122 2.03
1999/2000 170.7 93295 1.65Flounder Graball 1995/96 18.6 71138 0.23
1996/97 11.8 47577 0.241997/98 13.8 34872 0.311998/99 12.1 24833 0.34
1999/2000 5.7 13926 0.37Spear 1995/96 8.7 1204 6.15
1996/97 15.2 1696 7.311997/98 13.3 1864 5.871998/99 10.7 1547 5.54
1999/2000 11.0 1771 5.27Jackass Morwong Graball 1995/96 17.5 13474 1.29
1996/97 11.4 11758 1.371997/98 14.6 23994 0.771998/99 10.8 10632 1.01
1999/2000 6.9 6026 1.12

Scalefish Fishery Assessment: 2000
TAFI Technical Report No. 19 Page 60
References
Barrett, N. (1995). Aspects of the biology and ecology of six temperate reef fishes (Families: Labridae andMonacanthidae). PhD Thesis, University of Tasmania, 199 p.
Coleman, N. and Hobday, D. (1982). Squid not vital in the diet of commercially important fish from SEAustralia. Aust Fish. 41(11): 6-8.
DPIF (1998). Scalefish fishery: Policy Document. Department of Primary Industry and Fisheries.
Gomon, M. F., Glover, J. C. M. and Kuiter, R. H. (1994). The fishes of Australia’s south coast. State Print,Adelaide.
Harrison, A.J. (1980). Preliminary assessment of a squid fishery off Tasmania. In: Squid outlook, Tasmania,1980, Tas. Fish. Devel. Auth. H. E. Rogers (Ed), pp. 9-28.
Hutchinson, W. (1993). The reproductive biology and induced spawning of striped trumpeter, Latris lineata.M.Sc. thesis., University of Tasmania.
Klumpp, D. W. and Nichols, P. D. (1983). Nutrition of the southern sea garfish (Hyporhamphus melanochir):gut passage rate and daily consumption of two food types and assimilation of seagrass components.Marine Ecology Progress Series 12: 207-216.
Jordan, A. R., Mills, D. and Ewing, G. and Lyle, J. M. (1998). Assessment of inshore habitats aroundTasmania for life-history stages of commercial finfish species. Final report to FRDC (94/037), 176 p.
Jordan, A.R. AND Lyle, J.M (2000). Tasmanian scalefish fishery assessment – 1999. TAFI FisheryAssessment Report, 51p.
Lenanton, R. C. J. (1982). Alternative non-estuarine nursery habitats for some commercial and recreationallyimportant fish species of south-western Australia. Australian Journal of Marine and FreshwaterResearch 33: 881-900.
Lennon, S. M. (1998). General fishing returns and Tasmanian scalefish fishery catch data for the period 1990-96. Stock Assessment Background Report 98/01.
Lyle, J.M. (2000). Assessment of the licensed recreational fishery of Tasmania (Phase 2). Final Report toFRDC (96/161), 102p.
Lyle, J.M. and Jordan, A.R. (1999). Tasmanian scalefish fishery assessment – 1998. TAFI Fishery AssessmentReport, 88p.
McCormick, M. I. (1989a). Spatio-temporal patterns in the abundance and population structure of a largetemperate reef fish. Marine Ecology Progress Series 53: 215-25.
McCormick, M. I. (1989b). Reproductive ecology of the temperate reef fish Cheilodactylus spectabilis(Pisces: Cheilodactylidae). Marine Ecology Progress Series 55: 113-120.
Motlschaniwskyj N.A., Pecl G.T. and Lyle. J. (2001)., An assessment of the use of short-term closures toprotect spawning southern calamary aggregations from fishing pressure in Tasmania. Bulletin of MarineScience. in press.
Murphy, R. and Lyle, J. M. (1999). Impact of gillnet fishing on inshore temperate reef fishes, with particularreference to banded morwong. Final report to FRDC (95/145), 135p.
O’Sullivan, D. (1980). Biology of Gould’s squid in Bass Strait studied. Aust. Fish. 39(12): 10-17.

Scalefish Fishery Assessment: 2000
TAFI Technical Report No. 19 Page 61
O’Sullivan, D. and Cullen, S. M. (1983). Food of the squid Nototodarus gouldi in Bass Strait. Aust. J. Mar.Freshw. Res. 34: 261-285.
Pecl, GT (2000). Comparative life-history of tropical and temperate Sepioteuthis squids in Australian waters.PhD thesis, James Cook University, 174p.
Pecl, GT (2001). Flexible reproductive strategies in tropical and temperate Sepioteuthis squids. MarineBiology 138: 93-101.
Ruwald, F. P. (1992). Larval feeding trials with striped trumpeter, Latris lineata. In Larval biology.Australian Society for Fish Biology Workshop, Hobart, 20 August 1991. Ed by Hancock, D.A. Bureauof Rural Resources Proceedings No. 15, AGPS, Canberra.
Ruwald, F. P., Searle, L. D. and Oates, L. A. (1991). A preliminary investigation into the spawning and larvalrearing of striped trumpeter, Latris lineata. Department of Primary Industry, Sea Fisheries DivisionTechnical Report 44.
Trianifillos, L. (1998). Southern Calamary. South Australia Fisheries Assessment series No 98/08 SARDIAquatic Sciences, Adelaide
Winstanley, R.H., Potter, M.A., and Caton, A.E. (1983). Australian cephalapod resources. In: Proceedings ofthe workshop on the biology and resource potential of cephalopods, Melbourne, Australia, 9-13 March1981. Memoirs of the National Museum of Victoria 44: 243-253.
Wolf, B. (1998). Update on juvenile banded morwong in Tasmania. Fishing Today 11(4): 30.

Scalefish Fishery Assessment: 2000
TAFI Technical Report No. 19 Page 62
Appendix 1. Common and scientific names for species reported in catch returns.Common name Scientific name Common name Scientific nameAlfonsino Beryx spp. Pilchard Fam. ClupeidaeAnchovy Fam. Engraulidae Rays bream Fam.BramidaeAtlantic salmon Salmo salar Red bait Emmelichthys nitidusAustralian salmon Arripis spp. Red fish Fam. BerycidaeBarracouta Thyrsites atun Red mullet Upeneichthys sp.Boarfish Fam. Pentacerotidae Silverfish Fam. AtherinidaeBream Acanthopagrus butcheri Snapper Pagrus auratusButterfish Spp unknown Stargazer Fam. UranoscopidaeCardinal fish Fam Apogonidae Sweep Scorpis sppCod deep sea Mora moro Tailor Pomatomus saltatorCod, bearded rock Pseudophycis barbata Thetis fish Neosebastes thetidisCod, red Pseudophycis bachus Trevalla, white Seriolella caeruleaCod, unspec. Fam. Moridae Trevally, silver Pseudocaranx dentaxDory, john Zeus faber Trout, rainbow Oncorhynchus mykissDory, king Cyttus traversi Trumpeter, bastard Latridopsis forsteriDory, mirror Zenopsis nebulosus Trumpeter, striped Latris lineataDory, silver Cyttus australis Trumpeter, unspec. Fam. LatridaeDory, unspec. Fam. Zeidae Warehou, blue Seriolella bramaEel Conger sp. Warehou, spotted Seriolella punctataFlathead Fam Plactycephalidae. Whiptail Fam. MacrouridaeFlounder Fam. Pleuronectidae Whiting Fam. SillaginidaeGarfish Hyporhamphus melanochir Whiting, King George Sillaginoides punctataGurnard Fam. Triglidae & Fam.
ScorpaenidaeWrasse Pseudolabris spp.
Gurnard perch Neosebastes scorpaenoides ‘Commonwealth’ sppGurnard, red Chelidonichthys kumu Blue grenadier Macruronus noveazelandiaeHardyheads Fam. Atherinidae Gemfish Rexea solandriHerring cale Odax cyanomelas Hapuka Polyprion oxygeneiosKingfish, yellowtail Seriola lalandi Oreo Fam. OreosomatidaeKnifejaw Oplegnathus woodwardi Trevalla, blue eye Hyperoglyphe antarticaLatchet Pterygotrigla polyommata TunasLeatherjacket Fam. Monocanthidae Albacore Thunnus alalungaLing Genypterus spp. Skipjack Katsuwonus pelamisLuderick Girella tricuspidata Southern bluefin Thunnus maccoyiiMackerel, blue Scomber australasicus Tuna, unspec. Fam. ScombridaeMackerel, jack Trachurus declivis SharksMarblefish Aplodactylus arctidens Shark, angel Squatina australisMorwong, banded Cheliodactylus spectabilis Shark, blue whaler Prionace glaucaMorwong, blue Nemadactylus valenciennesi Shark, bronze whaler Carcharhinus brachyurusMorwong, dusky Fam. Cheilodactylidae Shark, elephant Callorhynchus miliiMorwong, grey Nemadactylus douglasii Shark, gummy Mustelus antarcticusMorwong, jackass Nemadactylus macropterus Shark, saw Pristophorus spp.Morwong, red Fam. Cheilodactylidae Shark, school Galeorhinus galeusMorwong, unspec. Fam. Cheilodactylidae Shark, seven-gilled Notorynchus cepedianusMullet Mugilidae Shark, spurdog Fam. SqualidaeNannygai Centroberyx affinis CephalopodPerch, magpie Cheilodactylus nigripes Calamary Sepioteuthis autralisPerch, ocean Helicolenus spp Cuttlefish Sepis spp.Pike, long-finned Dinolestes lewini Octopus Octopus spp.Pike, short-finned Sphyraena novaehollandiae Squid, arrow Nototodarus gouldi

Scalefish Fishery Assessment: 2000
TAFI Technical Report No. 19 Page 63
Appendix 2. Data restrictions and adjustments
There have been a number of administrative changes that have affected the collection ofcatch and effort data from the fishery. The following restrictions and adjustments have beenapplied when analysing the data as an attempt to ensure comparability between years,especially when examining trends over time.
Tasmanian logbook data
i) Correction of old logbook landed catch weights
Prior to 1995, catch returns were reported as monthly summaries of landings. With theintroduction of a revised logbook in 1995, catch and effort was recorded on a daily basis foreach method used. As catch data reported in the old general fishing return represent landedcatch it has been assumed to represent processed weights. For example, where a fish isgilled and gutted, the reported landed weight will be the gilled and gutted and not wholeweight. By contrast, in the revised logbook all catches are reported in terms of weight andproduct form (whole, gilled and gutted, trunk, fillet, bait or live), such that if a catch of aspecies is reported as gilled and gutted then the equivalent whole weight can be estimated byapplying a standard conversion factor6.
Without correcting for product form, old logbook and revised logbook catch weights are notstrictly compatible. In an attempt to correct for this and provide a ‘best estimate’, acorrection factor was calculated using catch data from the revised logbook and applied tocatches reported in the old logbook. A species based ratio of the sum of estimated wholeweights (adjusted for product form) to the sum of reported catch weights was used as thecorrection factor (Lennon 1998).
ii) Area restriction
Unless otherwise stated, only catch and effort data reported in fishing blocks adjacent toland have been used in the analyses:
3C2, 3D1, 3F1, 3F2, 3G1, 3G2, 3C4, 3D3, 3F4, 3G3, 3G4, 3H3, 3H4, 4C2, 4D1, 4D2, 4E1,4G2, 4H1, 4H2, 4D4, 4E3, 4E4, 4F4, 4G3, 4G4, 4H3, 4H4, 5D2, 5E2, 5F1, 5F2, 5H1, 5D4,5E3, 5H3, 6E1, 6H1, 6E3, 6G4, 6H3, 7E1, 7E2, 7G1, 7G2, 7H1, 7E4, 7F3, 7F4, 7G3.
In addition, catches from estuary blocks have been included (refer Fig A1).
iii) Duplicate records
Duplicate records (fisher, date and gear) were detected in the database. Where the recordsappeared to be exact duplicates, one was deleted. Where they appeared to be separaterecords, the catch was added together to form a single record but the effort was not doubled.The exception to this approach related to shark net and shark longline methods since fisherswere required to report such activity on a shot by shot rather than daily basis.
iv) Effort Problems 6 Conversion factors to whole weights are 1.00 for whole, live or bait; 2.50 for fillet; 1.50 for trunk; and 1.18for gilled and gutted.

Scalefish Fishery Assessment: 2000
TAFI Technical Report No. 19 Page 64
Records where effort (based on gear units, refer to Table 2.3) was zero or null, or appearedto be recorded incorrectly (that is implausible), were flagged. The catch was included incatch summaries, however the effort was not included in effort summaries, nor was therecord used in calculating CPUE.
v) Vessel restrictions
In all analyses of catch and effort, catches from six vessels (four Victorian based and twoTasmanian based) have been excluded. These vessels were known to have fishedconsistently in Commonwealth waters and their catches of species such as blue warehou andling tended to significantly distort catch trends. In fact, all four Victorian vessels and one ofthe Tasmanian vessels ceased reporting on the General Fishing Returns in 1994. With theintroduction of the South East Fishery Non-Trawl logbook (GN01) in 1997, the remainingTasmanian vessel ceased reporting fishing activity in the Tasmanian logbook.
TASMANIA
3C1
3H43H3
3H23H1
3G4
3G2
3G3
3G1
3F4
3F2
3F3
3F1
3D43D3
3D23D1
4C1
3C4
3C2
3C3
4H4
4H2
4H3
4H1
4G4
4G2
4G3
4G1
4F4
4F2
4F3
4F1
4E4
4E2
4E3
4E1
4D4
4D2
4D3
4D1
4C4
4C2
4C3
5H3 5H4
5H25H1
5D4
5D2
5D3
6D1
6G4 6H46H3
6H26H16E1
6E36D46D3
6D2
7E2
7H47H3
7H27H1
7G4
7G27G1
7G37F47F37E47E3
7E1
5D1
5E3
5F15E2 5F2
Fig. A1 Block numbers for fishing blocks used in calculation of catch figures.
Commonwealth logbook data:
Commonwealth logbook data from Australian Fisheries Management Authority wasincluded in this year’s analyses so that the report now reflects all catches from Tasmanianwaters.
i) Area restrictions
Commonwealth logbook records were only included if the catch was taken in fishing blocksadjacent to Tasmania (as above) and the maximum depth of the fishing operation was lessthan 200 m. This condition was applied to all records except where striped trumpeter wascaught. All records that included catches of this species were included for analysis.ii) Duplicate records

Scalefish Fishery Assessment: 2000
TAFI Technical Report No. 19 Page 65
A number of records in Commonwealth logbooks had matching records (fisher, date,gear type) in the Tasmanian logbook database. Such records were examined individuallyand decisions made as to whether it was more appropriate to keep the Tasmanian record, theCommonwealth record or both. In most situations the Tasmanian logbook entry was keptand the Commonwealth record excluded. The only exceptions were where there was extrainformation in the Commonwealth record, e.g. catch of a Commonwealth species that wasnot recorded in the Tasmanian logbook.

Appendix 3. Biological parameters for striped trumpeter in Tasmania.
Growth Longevity Mortality Reproduction RecruitmentInshore Fishery
Length-Weight
Linf K t0 Amax Z M Age Size Age Size a b AuthorFemales 72.9 0.89 -1.258 - - 0.034 2.77 unpubl.Males 72.9 0.89 -1.258 - - 0.034 2.77Females 5 43.8 Hutchinson
(1993)Males 8 53.4Females 5 Murphy and
Lyle (inprep)
Males

Appendix 4. Biological parameters for banded morwong in Tasmania
Growth Longevity Mortality Reproduction50% mature
Recruitment Length-Weight
Linf K t0 Amax Z M Age Size Age Size a b AuthorFemales 43.2 0.098 -11.3 77 0.02-0.04 0.059 4-5 32.4 0.0318 2.91 Murphy &
Lyle (1999)Males 51.2 0.161 -2.7 65 0.06-0.07 0.071 0.0309 2.91Females -nonspawning
0.0371 2.847
Females -spawning
0.0329 2.902
Males 0.0301 2.912Females -Bicheno
43.2 0.113 -10.0
FemalesTasman
43.1 0.082 -13.7
Males -Bicheno
50.9 0.178 -2.5 0.0318 2.901
Males -Tasman
51.6 0.149 -2.8 0.0309 2.901

Appendix 5. Biological parameters for sea garfish in TasmaniaGrowth Longevity Mortality Reproduction
50% matureRecruitment Length-Weight
Linf K t0 Amax Z M Age Size Age Size a b AuthorFemales 34.3 0.54 0.23 2 ~25 cm Jordan et al.
(1998)
Males 2 ~25 cm
Females 37.3 0.62 2 3.08 3.85 St Hill(1996)
Males 36.4 0.59 3 3.05 3.45
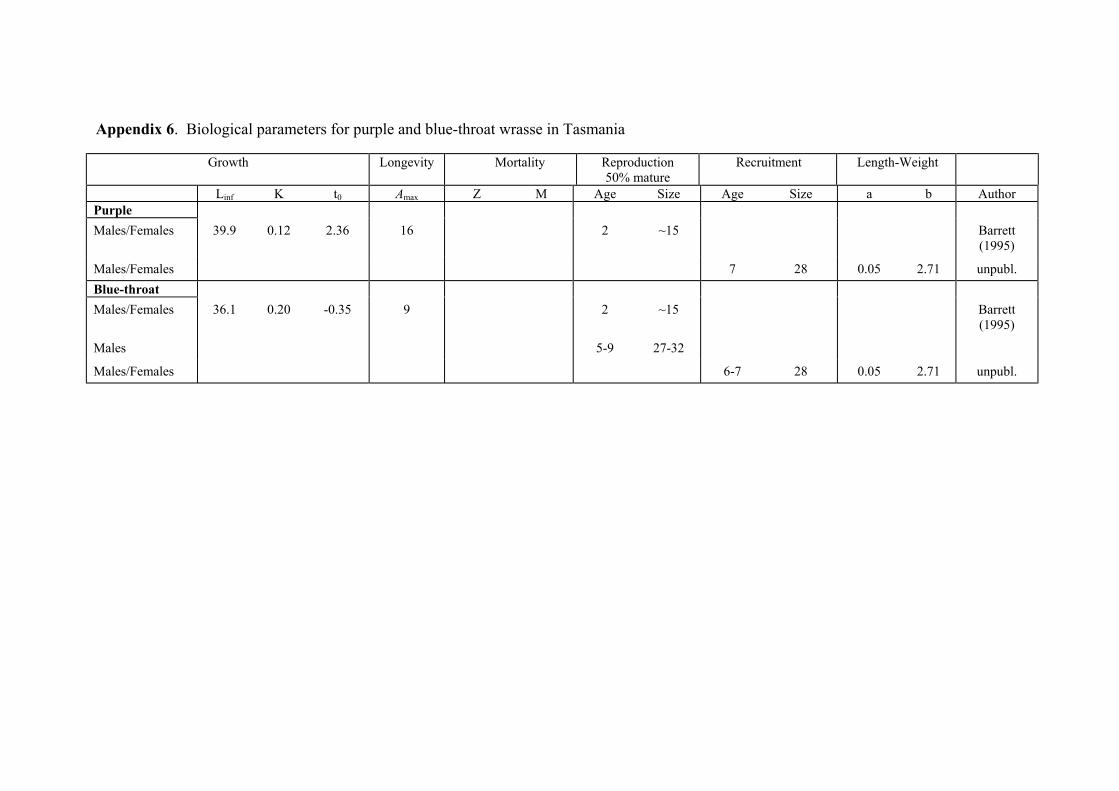
Appendix 6. Biological parameters for purple and blue-throat wrasse in Tasmania
Growth Longevity Mortality Reproduction50% mature
Recruitment Length-Weight
Linf K t0 Amax Z M Age Size Age Size a b AuthorPurpleMales/Females 39.9 0.12 2.36 16 2 ~15 Barrett
(1995)
Males/Females 7 28 0.05 2.71 unpubl.Blue-throatMales/Females 36.1 0.20 -0.35 9 2 ~15 Barrett
(1995)
Males 5-9 27-32
Males/Females 6-7 28 0.05 2.71 unpubl.

Appendix 7. Biological parameters for southern calamary in Tasmania
Growth Longevity Reproduction(minimum age & size)
Recruitment Length-Weight
MaximumLength(ML)
MaximumWeight
(g)
% BWday-1
MaximumAge
(days)
Age(days)
Length Weight Age Length Weight a b Author
Females 398 2008 263 117 147 120 0.00042 2.56 Pecl(2000)
Males 530 36004-8%
275 92 114 6390-120days
100-110mm
60-120g0.00049 2.50 Pecl
(2000)
ML: Dorsal mantle length in mm, %BW day-1: increase in percentage body weight per day.