
National Income Distributions and International Trade Flows
37
National Income Distributions and International Trade Flows # Maurice Kugler and Josef Zweimueller * January 2005 Abstract In this paper we model the pattern of international trade, and technological innovation and imitation between industrialized and developing regions, when preferences are nonhomothetic. By and large, models of the dynamics of North-South trade impose the assumption of unit income elasticity for all consumption goods. We relax this assumption and incorporate the insight from Engel’s Law: The budget share allocated to necessities falls with income. Since the composition of individual consumption depends on income, aggregate demand for newly invented goods depends not only on the distribution of income across countries but also within countries. To account for the impact of income distribution, we introduce preferences where consumers rank indivisible goods according to a hierarchy of both needs and desires. In the model we assume that the distribution of wealth is unequal in the less developed country and even in the industrialized country. We show that the composition of the aggregate consumption basket in the integrated economy depends on both inter- and intra-national inequality. Hence, we identify a demand channel through which inequality affects the international trade pattern. Empirical evidence from a panel of bilateral trade data among 57 countries, for which adequate income distribution measures exist, and spanning three decades supports the conjecture that high inequality in a trading partner yields less bilateral trade flows through lower imports, after controlling for both observed and unobserved heterogeneity. Keywords: Nonhomothetic preferences; inequality; aggregate import demand; pattern of international trade. JEL Codes: F12, F15, O11, O31 # We are indebted to Pranab Bardhan, Francois Bourguignon, Antonio Ciccone, Brad DeLong, In Ho Lee, Kiminori Matsuyama, Barry McCormick, Paul Romer, Pablo Spiller, Akos Valentinyi, Juuso Valimaki and Fabrizio Zilibotti. We would also like to thank, subject to the standard proviso, seminar participants at the Econometric Society Meetings in Santiago de Chile, London School of Economics, University of Nottingham and University of Southampton for valuable comments. Data were gracefully made available by Shang-Jin Wei on bilateral trade, and by Klaus Deininger and Lyn Squire on inequality. * University of Southampton and University of Zurich. Corresponding address: [email protected] .
Transcript of National Income Distributions and International Trade Flows

National Income Distributions and International Trade Flows####
Maurice Kugler and Josef Zweimueller*
January 2005
Abstract In this paper we model the pattern of international trade, and technological innovation and imitation between industrialized and developing regions, when preferences are nonhomothetic. By and large, models of the dynamics of North-South trade impose the assumption of unit income elasticity for all consumption goods. We relax this assumption and incorporate the insight from Engel’s Law: The budget share allocated to necessities falls with income. Since the composition of individual consumption depends on income, aggregate demand for newly invented goods depends not only on the distribution of income across countries but also within countries. To account for the impact of income distribution, we introduce preferences where consumers rank indivisible goods according to a hierarchy of both needs and desires. In the model we assume that the distribution of wealth is unequal in the less developed country and even in the industrialized country. We show that the composition of the aggregate consumption basket in the integrated economy depends on both inter- and intra-national inequality. Hence, we identify a demand channel through which inequality affects the international trade pattern. Empirical evidence from a panel of bilateral trade data among 57 countries, for which adequate income distribution measures exist, and spanning three decades supports the conjecture that high inequality in a trading partner yields less bilateral trade flows through lower imports, after controlling for both observed and unobserved heterogeneity.
Keywords: Nonhomothetic preferences; inequality; aggregate import demand; pattern of international trade. JEL Codes: F12, F15, O11, O31
# We are indebted to Pranab Bardhan, Francois Bourguignon, Antonio Ciccone, Brad DeLong, In Ho Lee, Kiminori Matsuyama, Barry McCormick, Paul Romer, Pablo Spiller, Akos Valentinyi, Juuso Valimaki and Fabrizio Zilibotti. We would also like to thank, subject to the standard proviso, seminar participants at the Econometric Society Meetings in Santiago de Chile, London School of Economics, University of Nottingham and University of Southampton for valuable comments. Data were gracefully made available by Shang-Jin Wei on bilateral trade, and by Klaus Deininger and Lyn Squire on inequality. * University of Southampton and University of Zurich. Corresponding address: [email protected] .

2
1 Introduction
The dynamics of innovation and imitation between industrialized and less developed regions
have been investigated in various contexts. The life-cycle structure of the location choice for
production of newly invented goods over time, where relatively early manufacturing takes
place in industrialized countries and gradually shifts to less developed countries explored by
Vernon (1966), has been formalized in models exploring technology diffusion to emerging
economies (See e.g. Grossman and Helpman, 1991). By and large, when it is not supposed
that there is a representative consumer, the assumption of unit income elasticity is imposed
for all consumption goods. Thus, any impact of income distribution on the level and
composition of aggregate demand is ruled out.
In this paper, the model incorporates the fact that income elasticity with respect to newly
invented goods is larger than the income elasticity with respect to older ones. The
assumption is that more recently introduced goods yield less utility because they satisfy less
urgent requirements, or desires rather than needs. Then wealth distribution determines
aggregate demand. This follows from the insight of Engel’s Law: The budget share allocated
to necessities decreases with income. As observed by Linder (1961), once the difference in
expenditure decisions between rich and poor consumers is acknowledged, the trade pattern
between industrialized and less developed regions is determined not only by differentials in
technology, factor endowment and income but also by income distribution within each
region. To account for the impact of income distribution, we introduce nonhomothetic
preferences in an innovation-imitation model of an integrated world economy.
The specification of preferences used is that introduced Murphy, Shleifer and Vishny (1989),
and by Zweimueller (1998) in a dynamic setting, where consumers rank goods according to a
hierarchy of needs and desires. The configuration of demand for newer goods across
households depends on the range of affordable consumption. Aggregate demand for
different types of goods is determined by the income distribution within and across regions.
The equilibrium pattern of trade is given not only by technology primitives, factor
endowments and relative per capita incomes, that is inter-regional income distributions, as in

3
standard trade theory but also by intra-regional income distributions as pointed out by
Linder.
In the model, we assume that the distribution of wealth is unequal in the poor region and
even in the prosperous region. This assumption is consistent with the stylized evidence on
distribution and development. Hence, our distinction is meant to capture broad modern
regional dichotomies of the global North-South or the European East-West type. In
particular, we explore the effect of changes in the distribution of wealth within the poor
region on the pattern of trade of the integrated economy. The inclusion of nonhomothetic
preferences in the model brings about a demand channel through which income distribution,
not only between countries but also within trading partners, affects international trade flows.
The configuration of global exports will be determined by regional demands for different
types of goods.
The effect of wealth distribution in the less developed on trade is ambiguous. On the one
hand, since only the rich in the less developed region can afford imported luxurious goods,
progressive wealth redistribution leads to a contraction of trade, other things equal. This
would occur because the redistribution of wealth is associated with an attendant fall in
demand for relatively new goods. On the other hand, if the poor are made wealthier, their
range of consumption increases. Then, the varieties of goods produced in the less developed
country, and therefore exports, grow. This would occur because the redistribution of wealth
is associated with an attendant rise in demand for more recently imitated domestic goods.
The paper is structured as follows. Section 2 reviews the related literature. Section 3 sets up
the primitives of the model: endowments, preferences and technology. Section 4 derives the
strategic linkages between innovators and imitators under free entry. Section 5 characterizes
the steady-state equilibrium of the integrated economy, with particular emphasis on the
pattern of trade and income distribution. Section 6 presents the results from the econometric
analysis of panel data on bilateral trade flows among 57 countries over three decades on the
impact of inequality on imports and total trade. Finally, Section 7 concludes.

4
2 Related Literature Although the impact of international inequality has featured in both the modeling and
empirical studies of trade under nonhomothetic preferences, the impact of intra-national
inequality has been largely neglected. The present paper aims to bridge this gap in both the
theory and empirics of international trade. In this section, we review the existing theoretical
and empirical research about the impact of inequality on international trade when the
composition of household consumption depends on income, and aggregate consumption for
each good on income distibution.
2.1 Theory
In his now classic treatise, Linder (1961) points out that the dependence of the composition
of a household’s consumption basket on its income means that aggregate demand for
different types of goods is determined by income distribution. In fact, while with homothetic
preferences demand for any good only depends on aggregate income, with nonhomothetic
preferences the attendant demand for new goods is higher when there are more well off
households. Therefore, with fixed costs of innovation, countries with a higher concentration
of wealthy households manufacture varieties of the most recent vintages. Some of these
varieties are exported from industrialized to less developed countries if enough consumers
find them affordable. In particular, bilateral trade will be determined not only by the
differences in technology and endowments, as well as the similarity in aggregate incomes, but
also by both inter- and intra-national inequality.
International differences in per capita income are the focus of trade models by Markusen
(1986) and Ramezzana (2000). The former combines monopolistic competition and factor
endowment differentials with nonhomothetic preferences. Capital is abundant in the
industrialized country and goods with high income elasticity are capital intensive. The latter
model also combines monopolistic competition with nonhomothetic preferences but
introduces transportation costs. Hence, in both models, trade is mostly among countries
with higher per capita income. The volume of trade falls with international inequality.

5
The literature on economic development emphasizes the importance of demand expansion
for the adoption of increasing returns technologies that are not viable in small markets. For
example, Rosenstein-Rodan (1943) highlights the key role of productive agriculture in
generating demand for manufactures and spurring industrialization. But, as Baldwin (1956)
points out, the aggregate demand for manufactures may not manifest itself if the wealth
generated in agriculture is extremely concentrated. Therofore, intra-national inequality can
affect industrial structure.
The idea that the emergence of a middle class is needed, as the source of purchasing power
for manufactures, is modeled by Murphy, Shleifer and Vishny (1989). Given that agricultural
expansion enlarges the middle class, progressive redistribution unambiguously stimulates
industrialization through the expansion of demand that makes it possible for manufacturers
of new varieties to cover fixed costs. A role for exports of primary goods is allowed akin to
that of agriculture, as generators of the resources that spur industrialization. Luxury imports
are considered as detrimental for domestic manufacturing and a negative byproduct of
inequality.
By contrast, in the model of the present paper, imports by the rich households in the less
developed country are the counterpart of exports to the industrialized country. Without
“luxury” imports by the rich, the less developed country manufacturers suffer a drop in their
demand because exports cease. Furthermore, international trade facilitates adoption of
advanced technologies by manufacturers in the less developed country.
In a related model, Matsuyama (1999) considers a Ricardian model of trade in which the less
developed country specializes in goods with low income elasticity, and the industrialized
country has comparative advantage in goods with high income elasticity. As above,
consumption is discrete for each good and satiation is reached after the first unit. Utility rises
with the diversity of the consumption bundle rather than with the intensity of consumption
of each good. While preferences are nonhomothetic, there is perfect competition. Hence,
income distribution has impact on industrial structure only through its effect on trade,
without any pecuniary externalities of demand to allow for start-up cost coverage.

6
Redistribution from rich to poor consumers in the less developed country reduces exports
and imports if the ensuing rise in the terms of trade due to the shift in demand is bounded.
Given that early goods provide more utility and that only the first unit of consumption of
each good provides utility, the more rich consumers there are the higher the aggregate
demand newer goods. In the model of this paper, like in the model of Murphy, Shleifer and
Vishny, redistribution of wealth from the rich to the poor can stimulate demand for
domestic manufactures and increase the range of exportable goods in the less developed
country. But also, as in Matsuyama’s model progressive redistribution reduces import
demand from the less developed country, and therefore total trade flows. Hence, the impact
of inequality and redistribution on international trade is ambiguous in the model of this
paper.
2.2 Empirics
With regard to the link between the diversity of the consumption bundle and income,
Jackson (1984) finds evidence of a positive correlation among household income and variety
of goods in its consumption basket. Hunter and Markusen (1988) explore the link between
national per capita income and the composition of demand. The estimation of a linear
expenditure system for thirty four countries and eleven commodity groups yields a rejection
of the null hypothesis of homothetic preferences at significance levels of 1%.
Also, Francois and Kaplan (1996) find that the composition of imports depends on intra-
national inequality. Countries with more unequal distributions tend to import more
consumer manufactures. However, they do not explore the effect of intra-national on either
the level of imports or the pattern of bilateral trade. In the present paper, the importance of
the Gini coefficient in explaining both bilateral imports and total trade flows is explored
empirically. Even after controlling for observed and unobserved heterogeneity of both
trading partners, as well as geographic location variables, the lagged Gini coefficient is
negatively correlated with bilateral imports and the share of total bilateral exports over the
total bilateral product.

7
Deardorff (1998) points that if preferences are nonhomothetic and goods with high income
elasticity are capital intensive, as in Markusen (1986), the gravity model of bilateral can
account for the direction of bilateral flows, as long as the relative per capita income is added
as an explanatory variable. But, the prediction that capital abundant countries trade mainly
with each other, while capital scarce countries do the same, is not borne out. For example,
Frankel, Stein and Wei (1996) find that high-income countries trade disproportionately with
all countries, not just other high-income countries. The relevance of intra-national inequality
is neglected in estimations of the gravity equation. In the present paper, regressions of the
bilateral trade pattern include national inequality.
3 The Building Blocks
In this section the building blocks of the model are laid out. First, the preference structure is
specified following Murphy, Shleifer and Vishny (1989) and Zweimueller (1998). We build in
Engel's Law. Second, the endowment structure is characterized. Next, the necessary first-
order conditions implied by household optimization are used to write the individual and
aggregate consumption functions. Finally, the innovation, imitation and manufacturing
technologies are characterized.
3.1 Preferences
The economy is made up of two countries, A and B, populated by LA and LB inhabitants
respectively. Country A is relatively more prosperous and industrialized than country B.
Preferences are defined over consumption goods. It is assumed that all consumers,
independently of their income and their nationality, have the same preferences. Lifetime
utility of a household of type h in country i is given by,
( )∫∞
−=0
)( dtetCuU tih
ih
δ ,

8
which is the discounted flow of instantaneous utility from consumption of each infinitely-
lived household.
There is a continuum of goods indexed by +ℜ∈j . A hierarchy of necessity and desirability
ranks these goods according to their priority. For all goods, we assume that there is
indivisibility in consumption and that utility is derived only from the first unit consumed, at
each point in time. Households consume conveniences only after basic needs are met.
Goods satisfying necessities are indexed in the unit interval, )1,0[∈j , and yield one unit of
utility for the first unit consumed. All other goods 1≥j provide amenities for the first unit
consumed, at each moment +ℜ∈t , worth j1
units of utility.
If prices are not decreasing in j , then each household will consume goods according to the
priority specified by the hierarchy. Given equal prices, as j increases each unit of utility from
consumption becomes more costly. Hence, no good 1≥j will ever be demanded by a
household until all goods indexed below j have been consumed. Although the decisión-making
criterion has a lexicographic structure, the consumption function is continuous and otherwise well-
behaved by construction. Note that there exists a continuum of goods and that the index of last good
consumed is pari passu a measure of consumption because only one unit of each good is consumed.
Indeed, instantaneous utility is given by,
( ) )(ln111)()(
1
tCdjj
tCu ih
tC
j
ih
ih
+=+= ∫=
,
where )(tC ih is the highest index of all goods consumed at time +ℜ∈t .
3.2 Endowments
Each household in country A has identical financial asset holdings VA. In country B, there
are two types of households, rich and poor. The proportion of poor households is β . Per

9
capita wealth from financial assets is VB. Each poor household owns wealth
)()( tVtV BBP α= .
Now,
)()1()()( tVtVtV BR
BP
B ββ −+= ,
and therefore, the financial holdings of each rich household are given by,
)(1
1)( tVtV BBR β
βα−
−= .
The law of motion of the state variable for each type of household is,
∫−+=)(
0
),()()()(tC
iih
ih
ih
djtjptWtrVtVD
where r is the world interest rate and wages are determined nationally.1 The prices depend
only on the location where the goods are manufactured. Goods manufactured in country A
are set as numeraire. Goods manufactured in Country B are cheaper and priced at 1<p .
The more recent the invention a good the higher its index +ℜ∈j . The goods manufactured
in country A are those which since their introduction have not been imitated in country B.
We assume that )(tN goods have been introduced at time +ℜ∈t and )(tM imitated. Then
the law of motion of wealth becomes,
−−++<−+
=otherwisetCtMptWtrV
tMtwhenCtpCtWtrVtV i
hii
h
ih
ih
iihi
h ),()()1()()()()(),()()(
)(D .
1 Labor supply is inelastic.

10
We will focus in the case in which (i) households in the relatively prosperous country A
purchase all invented varieties, (ii) the rich but not the poor in the less developed country B
can afford imported “luxury” goods, and (iii) the poor can afford more than the basic
subsistence goods but not all domestically manufactured goods. Hence, we have,
1)()()()( >>>>= BP
BR
A CtMtCtCtN
Since utility is logarithmic, it turns out that the asset distribution is stationary under the
present specification of preferences. In particular, the ratio of savings to the value of asset
holdings is independent of the level of wealth. The share of wealth of each group is fixed.
3.3 Intertemporal Optimization
Consumer demand for each household type depends on the range of affordable goods. In
particular, solving the intertemporal optimization problem of each consumer yields the
following consumption functions,
NMpVWC AAA =−++= )1(δ (1),
for country A households,
MMpVWC BBBR >−+
−−+= )1(
11
ββαδ (2),
for rich households in country B, and
Mp
VWCBB
BP <+= δα (3),
for poor households.2
2 We are concentrating in the steady state without growth, whih implies that 0/ =−= δrccD .

11
4 Innovation and Imitation
To complete the specification of the primitives of the model, we provide the elements that
determine the cost structure of manufacturing in each region. First, in the rich economy,
there is a sunk cost stemming from the resource requirement for innovative design. The
marginal cost of producing each unit gives the mark-up equation. Second, in the developing
economy, there is a fixed cost associated with reverse engineering. Limit pricing together
with the variable cost define the mark-up relationship for imitated products. These technical
parameters together with the aggregate demand functions determine the free-entry
equilibrium conditions in each region.
4.1 R&D Primitives
Each firm in country A has exclusive use of a blueprint. Perfect intellectual property
protection prevails in country A. But, entrepreneurs in country B can reverse engineer a
design without compensating the creator. The deployment cost of R&D ventures
is )(tF units of labor. Once a design is made, the firm can manufacture each unit using
)(tA units of labor and acquire a monopoly position for the corresponding good. We assume
symmetry in the technology across goods.
There is an upper bound on the price to be charged by each incumbent firm. We normalize
this limit price to unity. The limit on the price is due to potential production by a
competitive fringe. Once invented any good can be produced using a “backyard” technology
that has requires )(/1 tW A units of labor to produce each unit of output under constant
returns, where )(/1)( tWtA A> . Hence, the incumbents’ price determines the reservation
wage.
In particular, since we have normalized the price of country A manufactures to unity, the
marginal revenue product of labor using the “backyard” technology is )(tW A . If an
incumbent monopolist tried to bid the wage below that level, the competitive fringe could

12
enter without incurring sunk costs and offer slightly higher wages to attract all the required
workers to serve the whole market. No incumbent will ever pay a wage lower than the
reservation level )(tW A . With a wage rate )(tW A and a price of unity, the profit flow per
unit of output sold is )()(1 tWtA AA −=π .
The following assumptions summarize the evolution of technical opportunities:
)(/)(),(/)( tNatAtNftF == and )()( tNwtW AA = .
We assume that productivity growth in the relatively prosperous country is driven by
innovations. We adopt the simplest way to capture this idea by assuming that the stock of
knowledge in the economy can be proxied by the measure of previous innovations )(tN
and the labor input requirement of R&D is inversely related to this measure. Moreover, we
assume productivity in final output production, by both incumbents and the competitive
fringe, also increases with )(tN , which is an index of past manufacturing as well.
Hence, efficiency in R&D and production, both manufacturing and backyard, rise pari passu
with the number of goods introduced. Innovators, entrepreneurs and workers build upon
experience of previous successes. The assumption about the impact of new ideas, or designs,
on future innovators follows Romer (1990). Learning leading to higher productivity ceases if
innovation stops, as in Young (1993). While the wage rate grows with the measure of
previous innovations, the profit flow per unit sold remains constant over time as,
AAA awtWtA −=−= 1)()(1π .
4.2 Emulation Primitives
Firms in the less developed country B do not have access to the innovation technology. To
become manufacturers they emulate producers from the innovating country A. Imitation
requires set-up costs of )(tG units of labor. After a good has been imitated in country B,

13
imitators can produce at constant marginal cost )()( tWtB B , where )(tB is the labor input
necessary to produce one unit of output using the imitation technology and )(tW B is the
wage rate in country B. We will discuss later on the endogenous determination of )(tW B .
Technological change for imitation activities evolves analogously to that in innovating
activities. In particular, we assume that,
)(/)( tMgtG = and )(/)( tMbtB = .
This characterization of the progress of emulation technologies states that efficiency is
determined by the history of imitating activities )(tM . Productivity in the blueprint imitation
and adaptation process increases as a result of learning from reverse-engineering experience.
Successful design copying not only adds to the productivity of further imitation but also
leads to more efficient production due to the associated increase in manufacturing
experience.
In order to be competitive in the world market, country B producers have to underbid
country A firms. The lowest price at which country A firms are willing to sell is their
marginal cost Aaw . If a country B firm charges a slightly lower price, it can take over the
whole world market and drive the country A competitors out of the market. However, the
country B firms will only be able to do so if their marginal cost is below that of country A
producers. Or equivalently, we assume BA bwaw > , where )(/)( tMtWw BB = denotes the
country B wage rate normalized by the measure of previously imitated goods.3 We obtain the
mark-up for imitating producers by invoking limit pricing. In order to capture the market the
imitator has to underbid the price of the current producer. The limit price (i.e., the price
which drives the country A firm out of the market) is slightly below the marginal cost of the
country A firm and the profits per unit sold are thus,
BABAB bwawtWtBtWtA −=−= )()()()(π .
3 We will concentrate in equilibria in which the wages grow at the same rate as the other variables.

14
4.3 Innovation The free entry condition in country A is given by,
τβπτπ ττ deLLdeLtWtF trBAT
T
AtrAT
t
AA )()( ))1(()()(2
1
1−−−− −++= ∫∫ ,
where 1T is the time at which rich consumers from country B can afford the good
introduced at time t and 2T is the time at which that good is imitated an all rents start
accruing to the imitator.
In general, if all variables grow at a common rate γ , we have that,
)()( )( 1 tNetC tTBR =−γ and )()( )( 2 tNetM tT =−γ ,
so that,
)()(ln1
1 tCtNtT B
R
−+= γ and )()(ln1
2 tMtNtT −+= γ .
If we concentrate in the steady state in which no growth occurs, we have that δ
π AAA Lfw = .
4.4 Imitation
The free entry condition in country B is given by,
τπτβπ ττ deLLdeLLtWtG trBA
T
BtrBAT
t
BB )()( )())1(()()(3
3−−
∞−− ++−+= ∫∫ ,

15
where 3T is the time at which poor consumers from country B can afford the good imitated
at time t .
In general, if all variables grow at a common rate γ , we have that )()( )( 3 tMetC tTBP =−γ and
)()(ln1
3 tCtMtT B
P
−+= γ . In particular, if we concentrate in the steady state in which no growth
occurs, we have that δ
βπ ))1(( BABB LLgw −+= .
Proposition 1 The equilibrium wage in country B falls as the fraction of poor
households in country B rises, and as the discount rate gets higher. Also, the wage increases
as efficiency, in both imitation and manufacturing, increases in country B, as the cost of
manufacturing in country A rises, and as the world population expands.
Proof: Using the mark-up expression, we find the wage in country B as,
))1((
))1((BA
BAAB
LLbGLLaww
βδβ
−++−+= (4),
and the stated results follow directly. ❑
The wage that satisfies the free-entry condition in country B essentially rises with the
profitability of imitation. In particular, the higher the fraction of poor households, the
smaller the market for high-income elasticity imitated manufactures. The ensuing fall in the
wage causes a further contraction in the market size because the income of all country B
household decreases, and so does the range of affordable manufactures. Hence, a low
industrialization trap of the type highlighted by Murphy, Shleifer and Vishny (1989) can
arise. In the present set up, this causes a fall in exportable varieties because of limited supply
of manufactures by country B and also limited demand for newly innovated goods.
Therefore, higher inequality stemming from a higher fraction of poor households can have a

16
contractionary effect on world trade through the wage effect outlined. Both countries lose
out because more expensive manufacturing of relatively old goods takes place in country A,
thereby reducing the availability of resources for innovation.
5 The Integrated Economy
In order to characterize the steady state we have to describe the implications of our
assumptions on preferences and technology for innovation, imitation, and trade. We
assumed that only in country A there is access to the innovation technology. The innovation
equilibrium is one where the present discounted value of future profits accruing from an
innovation is equal to the fixed cost of discovery. Firms in the country B do not have access
to the innovation technology, but there are no barriers to entry in imitation activities. The
imitation equilibrium characterization is analogous to the free-entry condition for country A
innovators.
The values of innovation and imitation success in steady-state equilibrium were derived
under the following conditions. Consumers choose optimally the size and the composition
of their consumption basket. The savings are invested in assets until there are no unexploited
profit opportunities left, in the sense that neither further incentives to innovate nor to
imitate with higher intensity exist. Finally, labor markets have to clear and the current
account has to balance. In the steady state without growth, current account balance entails
trade balance.
5.1 Resource Balance Constraints
We find the labor market equilibrium in both countries. Since labor is the only factor of
production, this is enough to characterize worldwide resource balance. In equilibrium, the
manufacturing sector pays reservation wages so that labor is demanded for innovation,
imitation and production.
17
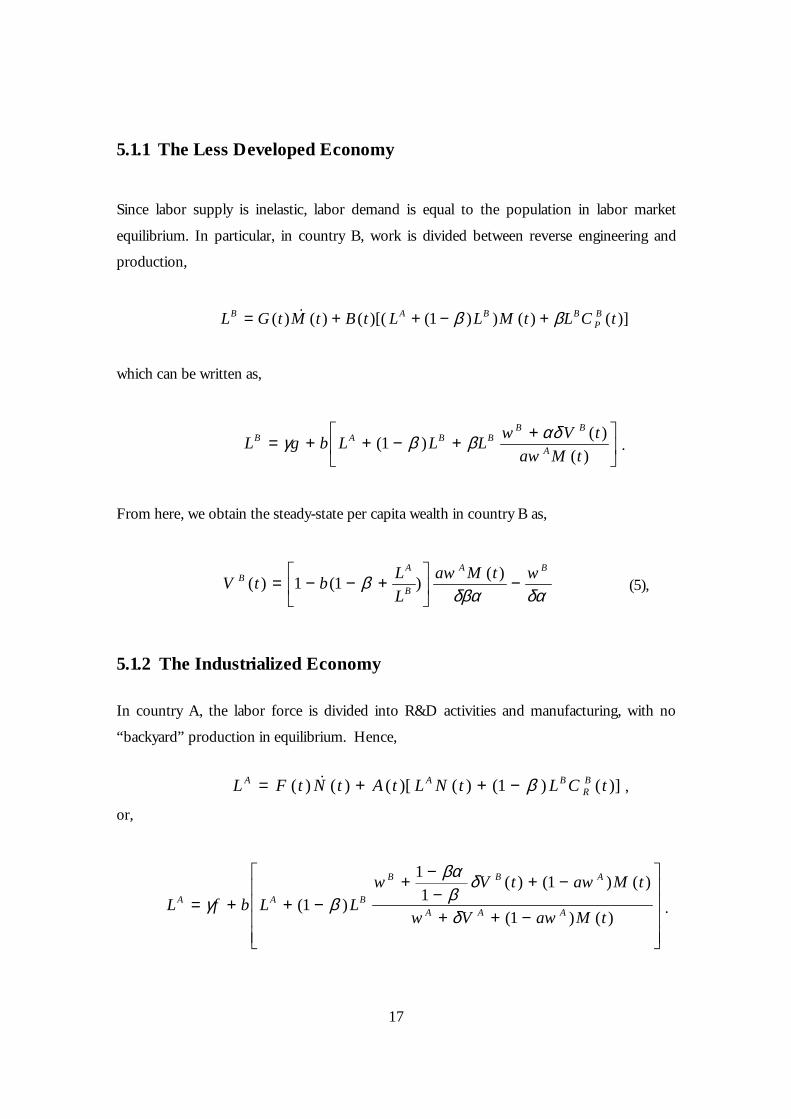
5.1.1 The Less Developed Economy Since labor supply is inelastic, labor demand is equal to the population in labor market
equilibrium. In particular, in country B, work is divided between reverse engineering and
production,
)]()())1()[(()()( tCLtMLLtBtMtGL BP
BBAB ββ +−++= D
which can be written as,
++−++=)(
)()1(tMaw
tVwLLLbgL A
BBBBAB αδββγ .
From here, we obtain the steady-state per capita wealth in country B as,
δαδβα
βBA
B
AB wtMaw
LLbtV −
+−−= )()1(1)( (5),
5.1.2 The Industrialized Economy
In country A, the labor force is divided into R&D activities and manufacturing, with no
“backyard” production in equilibrium. Hence,
)]()1()()[()()( tCLtNLtAtNtFL BR
BAA β−++= � ,
or,
−++
−+−
−+−++=
)()1(
)()1()(1
1
)1(tMawVw
tMawtVwLLbfL AAA
ABB
BAA
δ
δβ
βα
βγ .

18
Proposition 2 The equilibrium per capita wealth in country A rises with the
efficiency of manufacturing in country B and with the range of goods produced in country
B. Furthermore, for a given degree of imitation, a higher fraction of poor households in
country B lowers wealth in country A because the size of the market for innovations is
smaller.
Proof: From (5), we obtain the steady-state per capita wealth in country A as,
[ ] B
AABA
LtMawbLLbtV
δβαβ )())1(1()( −−−= (6),
and the stated results follow. ❑
A drop in imitation, as for example discussed in connection to Proposition 1 when the
proportion of poor households rises, affects country A household adversely because their
consumption bundles become more expensive. This in turn means that less resources are
available for innovation. Somewhat paradoxically, imitation spurs innovation.
5.2 Current Account Balance
As mentioned at the beginning of this section, we will concentrate in the case in which
income differences between countries are relatively large, so that the poor in the less
developed country cannot afford any imported varieties. )(tM goods are produced in
country B and all these goods are exported as all households in country A can afford them.
The price of these goods is Aaw . So the value of total country A imports (in terms of the
numeraire goods produced in country A) is therefore given by AA LtMaw )( The demand for
exports is given by the number, and wealth, of rich consumers in the country B country.
Only this group is assumed to be able to afford imported luxury goods. The level of
consumption of this group is )(tC BR so the value of exports country B is BB
R LtC )1)(( β− . In

19
the steady state, the current account balance can therefore be written as,
−+
−−+−= )()1()(
11)1()( tMawtVw
LawLtM ABBAA
B
δβ
βαβ ,
where the expression in brackets is the optimal consumption of the rich in country B
derived in (2).
Proposition 3 The integrated economy will have an equilibrium with international
trade if the mark-up of manufactures from country A is sufficiently small and the population
of country B relative to that of country A is sufficiently large. Moreover, the degree of
manufacturing and exports in country B rises with the wage.
Proof: Now, if we plug in the equilibrium wage and per capita assets in country B obtained
in equations (4) and (5) from the free-entry and resource balance conditions, we obtain the
range of goods produced in country B as,
BwtMξ+Γ
Γ=)( (7),
where,
[ ] ))1(())1(1(1 bbLLbbaw B
AAA −+−−−+++−= βαµβαβξ ,
where Aµ is the price mark-up of goods manufactured in country A, that is the marginal
cost over the price, and )1( αβ −=Γ is the Gini coefficient derived from the wealth
distribution in country B.4 If the conditions stated in the Proposition are satisfied, then the
last expression is positive and so is the range of goods produced in country B.
❑
4 See Appendix 8.1.

20
Imposing an upper bound on the mark-up of country A amounts to limiting the magnitude
of the price of imitated manufactures. This makes them affordable to more consumers,
thereby expanding market size for imitators, as does a large population in country B. A large
population in country B relative to country A also ensures that there will be some demand
for imports from country B, even if the fraction of poor households is large, while
households from the industrialized country always consume all goods produced in the less
developed country.
The positive feedback between wage rises and manufacturing expansion in the less
developed country illustrates the role of nonhomothetic preferences in bringing about a
demand channel whereby income distribution determines industrial activity and the pattern
of trade. If less inequality induces more production in the less developed country, the
industrialized country benefits also because, as explained above, imitation stimulates
innovation. Yet, inequality may stimulate growth as imitation follows innovation, and in
particular, rises in “luxury’ imports.
5.3 The Pattern of International Trade
In the steady state, this economic system is characterized by the household optimization
rules, by the industrial organization among innovators and imitators in equilibrium, by
resource balance, and by the balance of trade described in the last section.
Now, we analyze the determinants of international trade. Total trade flows will be derived in
terms of the primitives of the model. In particular, we want to explore the impact of the
distribution of wealth in country B. Define total trade flows as total exports,
AAAB LtMawXXtT )()( =+≡ + BBR LtC )1)(( β− .

21
Proposition 4 Total trade flows in the integrated economy do not change
monotonically with variations in the wealth distribution parameters. While inequality
contracts the export supply of the less developed country, it also expands its import demand.
The net effect is ambiguous.
Proof: If we plug in the equilibrium wage and per capita assets in country B obtained in
equations (4) and (5) from the free-entry and resource balance conditions together with the
range of production in country B derived from current account balance in the integrated
economy, we obtain the steady-state total trade flow as,
−
+ΓΨΓ=Γ−Ψ= BBBB LwLwtMtT
ξ)()( ,
where,
BAAAA LbawawLbaw ))]1)(1(()1)(1([))1(( βαββαββαβαβα −−−+−−+−−=Ψ ,
where the expression for total trade clearly does not vary unambiguously with changes in the
distribution parameters.
❑
The effect of inequality emphasized in the first three propositions points to a contraction in
trade due to less imitation, and indirectly less resources for innovation. Proposition 4
introduces a direct effect of inequality in expanding the market for innovators through
higher imports from the less developed country. In equilibrium, higher imports from the less
developed country entail higher exports to the industrialized country. Hence, in the dynamic
model of international trade, nonhomothetic preferences induce two offsetting effects from
intra-national inequality. In order to learn more about the impact of inequality on
international trade, we turn next to analyze the empirical evidence. Once the importance of
national inequality for bilateral international trade in the sample is ascertained, the net effect
of the Gini coefficient of trading partners is estimated in an augmented gravity equation.

22
6 Evidence on Inequality and Bilateral Trade
In this section, the gravity equation approach is used to analyze the impact of national inequality on
international trade flows. First, bilateral import demand and export supply functions are fitted
controlling for
7 Conclusions
Although the ambiguity in the results so far is relatively unsatisfactory, it does prove the relevance of
incorporating nonhomotheticity in preferences in the dynamic analysis of global trade. As observed
by Linder (1961) in his classic study, once the difference in expenditure decisions between rich and
poor consumers is acknowledged, we conclude that the trade pattern between industrialized and
developing regions is determined not only by factor endowment and cross-regional income
differentials, as in the Hecksher-Olin-Samuelson and intra-industry trade models, but also by the
income distribution within each region. The incorporation of Engel's Law into the preference
structure has dramatic implications regarding the importance of income distribution within regions
over both the technology diffusion and trade patterns. This feature introduces an aggregate demand
channel which raises the possibility of multiple steady states as well as different converging paths
even under \QTR{it}{common initial conditions}. As discussed in Section 4, stability of the
integrated economy generically implies the existence of multiple equilibria. The latter tend to be
Pareto rankable. Equilibria exhibiting high growth in the developing region also display high wages.
In spite of the higher production costs entailed by high wages, higher growth is sustainable in view of
the demand expansion associated with higher income as well as the ensuing rise in labor supply. The
prosperous region should also benefit in view of a higher volume of trade which translates into
higher growth.
As pointed out in Section 3, by construction, the model implies balance of the capital account in
equilibrium because there is international equalization in rates of return. However, there are
incentives for technology transfer, which we rule out by assumption. In order to explore
technological diffusion to emerging economies, we characterize the life-cycle structure of the
locational choice over time for the production of sophisticated newly invented goods. In the present
state of the model, we simply inherit the information exchange structure from dynamic North-South

23
trade models where reverse engineering is the only channel of technological diffusion. In future
versions, we shall allow for other mechanisms whereby technical knowledge flows across boundaries.
This will enrich our study of the evolution of the trade pattern over time, in the presence of
nonhomothetic preferences.
We could treat the stock of technical knowledge as an endowment subject to some type of factor
price equalization. When considering technology adoption across boundaries, we must model two
types of costs that limit the technological implementation possibilities by late adopters. First, we need
to incorporate the resource cost entailed by the required absorptive capacity build-up. Second, we
should build-in strategic costs due to intellectual property right protection and nondisclosure clauses
that innovators use to limit diffusion and enhance trade secrecy. Hence, whether we model foreign
direct investment (FDI) or trade in intermediate goods as the conduits of knowledge, the deployment
cost provides a bound on the adoption rate. The conclusions reached should be sensitive to what we
assume with regard to each form of information flow. For example, Romer(1994) assumes that
intermediates are essential to implement new production methods. Hence, trade barriers to exchange
new inputs hamper growth. Feenstra(1996), who considers the impact of trade on growth when
knowledge flows are localized, arrives to the same conclusion. However, regarding the impact of
FDI, because he assumes that the only benefit to the domestic economy is the generation of low-
wage jobs, he concludes that the net effect is domestic industry displacement in the short-run and
Dutch disease in the long-run. In contrast, Romer(1993) concludes that FDI is probably the most
efficient channel through which less developed countries can bring new technologies and enjoy from
their propagation over time due to their nonexcludable nature. Enriching the specification of the
technological propagation process will undoubtedly lead to more interesting results, as the
considerations to follow suggest.
A technology gap may also persist due to trade secrecy incentives. Beyond the real fixed costs
associated with technology transplants, there exists a strategic cost to producers in the industrialized
country to the extent that technical knowledge is not fully excludable. Although the benefit of using
it in various set-ups stems from the fact that it is nonrival, those possessing technological
information will try to erect barriers to its dissemination even if they are only partially successful. The
balance of these two effects can be analyzed by studying the impact of intellectual property right
(IPR) protection and corporate organization. For instance, Helpman(1993) studies the impact of IPR
enforcement in a trade model with innovation-imitation dynamics. To the extent that imitation
intensity falls, the monopoly power associated with innovation increases and growth falls. But,
Lai(1996) has shown that if FDI is the channel of production transfer the conclusions are exactly

24
reversed. The competitive or predatory impact of imitation on innovation thus depends on the
characteristic of the propagation process associated with different conduits of technical knowledge
flows.
The main analytical result obtained by introducing a demand channel through which income
distribution can affect industrial evolution in a dynamic trade model is the multiplicity of equilibria,
even under common initial conditions. This is not just a possible outcome but a highly likely one.
Indeed, almost surely multiple equilibria and converging paths obtain because the condition required
for the existence of a stable equilibrium is that the rate of time preference be sufficiently high while
uniqueness requires a rate of impatience below a very small threshold. This by itself demonstrates the
importance of nonhomothetic preferences. These multiple equilibria, arising under\QTR{it}{\
common initial conditions}, are generically Pareto rankable due to the correlation of a high wage
with high growth in the developing region and the expanded trade volume for the integrated
economy. This suggests a very strong possibility for welfare enhancing policy coordination among
the regions which is not present in previous models assuming preference homotheticity. Cooperative
arrangements could play a catalytic role not necessarily addressed to overhauling measures meant to
change initial conditions but rather targeted to jump starting up the movement toward a better
equilibrium.
We are in the process of finding more positive results on the relevance of the \QTR{it}{intra}-
regional income distribution, through the impact of Engel's Law on demand, in the determination of
the dynamic pattern of international trade. To do so, we are calibrating the model and applying
numerical methods to simulate realistic scenarios and comparative steady state exercises.

25
7 References
Deardorff (1998)
Francois, J. and S. Kaplan (1996), “Aggregate demand shifts, income distribution, and the Linder
Hypothesis,” Review of Economics and Statistics.
Grossman, G. and E. Helpman. (1991), Innovation and growth in the global economy, Cambridge, Mass: MIT
Press.
Linder, S. (1961), An essay on trade and transformation, Uppsala: Almqvist and Wiksells.
Markusen, J. (1986), ''Explaining the Volumen of Trade: An Ecclectic Approach,'' American Economic
Review, 76(4): 1002-11.
Matsuyama, K. (1999), “A Ricardian Model with a Continuum of Goods under Nonhomothetic
Preferences: Demand Complementarities, Income Distribution and North-South Trade,” Math Center
Discussion Paper No. 1241, Northwestern University, Evanston, IL.
Murphy R., A. Shleifer and R. Vishny (1989), “Income Distribution, Market Size and Industrialization,”
Quarterly Journal of Economics.
Ramezzana, P. (2000), “Per Capita Income, Demand for Variety, and International Trade: Linder
Reconsidered,” Discussion Paper, London School of Economics.
Romer, P. (1994), “New goods, old theory and the welfare costs of trade restrictions,” Journal of
Development Economics.
Romer, P. (1990), “Endogenous Technological Change,” Journal of Political Economy.
Vernon, R. (1966), “International investment and international trade in the product cycle,” Quarterly
Journal of Economics.
Young, A. (1993), “Invention and bounded learning by doing,” Journal of Political Economy.
Zweimueller, J. (1998), “Schumpeterian Entrepreneurs Meet Engel's Law: The Impact of Inequality on

26
Innovation-Driven Growth,” CEPR, Working Paper No. 1880, London, UK.
8.1 The Estimation
Imports and Inequality
-8.00
-5.00
-2.00
1.00
4.00
7.00
10.00
0.20 0.30 0.40 0.50 0.60 0.70
GINI i
Mij

27
Total Bilateral Exports and Trading Partner Inequality
-16.00
-13.00
-10.00
-7.00
-4.00
-1.00
0.20 0.30 0.40 0.50 0.60 0.70
gini1
ln([X
ij+Xj
i]/[Y
i+Yj
])
Total Bilateral Exports and Trading Partner Inequality
-16.00
-13.00
-10.00
-7.00
-4.00
-1.00
0.20 0.30 0.40 0.50 0.60 0.70
gini1
ln([X
ij+Xj
i]/[Y
i+Yj
])
Data description

28
Fixed-effects (within) regression Number of obs = 7148Group variable (i) : i Number of groups = 58
R-sq: within = 0.6995 Obs per group: min = 19between = 0.2384 avg = 123.2overall = 0.5647 max = 177
F(13,7077) = 1267.23corr(u_i, Xb) = 0.0352 Prob > F = 0.0000
------------------------------------------------------------------------------lnbilimp | Coef. Std. Err. t P>|t| [95% Conf. Interval]---------+--------------------------------------------------------------------logdist | -.6942325 .0286229 -24.254 0.000 -.7503419 -.6381231
d2ap | 1.671377 .0953699 17.525 0.000 1.484423 1.85833d1ap | .4667906 .0500521 9.326 0.000 .3686735 .5649078hsa1 | .4347359 .1753933 2.479 0.013 .0909127 .7785592wh2 | 1.198301 .0988047 12.128 0.000 1.004615 1.391988
adjacent | .497194 .0963623 5.160 0.000 .3082951 .6860929linguist | .5315383 .0496536 10.705 0.000 .4342024 .6288741loggini1 | -.6540001 .20824 -3.141 0.002 -1.062213 -.2457874loggini2 | .0352501 .0849377 0.415 0.678 -.1312532 .2017534loggnp2 | .869763 .0133058 65.367 0.000 .8436796 .8958464logpcg1 | .2041027 .0272805 7.482 0.000 .1506247 .2575807logpcg2 | .3445702 .0168075 20.501 0.000 .3116224 .3775179
_cons | -5.17441 .374427 -13.820 0.000 -5.908398 -4.440421------------------------------------------------------------------------------sigma_u | 1.3742681sigma_e | 1.3317613
rho | .51570432 (fraction of variance due to u_i)------------------------------------------------------------------------------F test that all u_i=0: F(57,7077) = 88.07 Prob > F = 0.0000

29
Random-effects GLS regression Number of obs = 7148Group variable (i) : i Number of groups = 58
R-sq: within = 0.6993 Obs per group: min = 19between = 0.3058 avg = 123.2overall = 0.5816 max = 177
Random effects u_i ~ Gaussian Wald chi2(13) = 16311.33corr(u_i, X) = 0 (assumed) Prob > chi2 = 0.0000
------------------------------------------------------------------------------lnbilimp | Coef. Std. Err. z P>|z| [95% Conf. Interval]---------+--------------------------------------------------------------------logdist | -.7088604 .0286457 -24.746 0.000 -.765005 -.6527159
d2ap | 1.661595 .0957685 17.350 0.000 1.473892 1.849297d1ap | .4817824 .0500387 9.628 0.000 .3837083 .5798566hsa1 | .4303998 .1763467 2.441 0.015 .0847665 .7760331wh2 | 1.174346 .0990967 11.851 0.000 .9801205 1.368572
adjacent | .4897403 .0969302 5.053 0.000 .2997607 .6797199linguist | .5200788 .049873 10.428 0.000 .4223296 .6178281loggini1 | -.8988843 .1946852 -4.617 0.000 -1.28046 -.5173084loggini2 | .0358301 .0853804 0.420 0.675 -.1315124 .2031726loggnp2 | .8630616 .0133598 64.601 0.000 .8368768 .8892463logpcg1 | .2493413 .0263411 9.466 0.000 .1977138 .3009689logpcg2 | .3398445 .0168989 20.110 0.000 .3067232 .3729658
_cons | -5.833791 .3831467 -15.226 0.000 -6.584744 -5.082837---------+--------------------------------------------------------------------sigma_u | .81288434sigma_e | 1.3317613
rho | .27143827 (fraction of variance due to u_i)------------------------------------------------------------------------------

30
Hausman specification test
---- Coefficients ----| Fixed Random
lnbilimp | Effects Effects Difference---------+-----------------------------------------logdist | -.6942325 -.7088604 .0146279
d2ap | 1.671377 1.661595 .0097823d1ap | .4667906 .4817824 -.0149918hsa1 | .4347359 .4303998 .0043361wh2 | 1.198301 1.174346 .0239549
adjacent | .497194 .4897403 .0074537linguist | .5315383 .5200788 .0114594loggini1 | -.6540001 -.8988843 .2448843loggini2 | .0352501 .0358301 -.00058loggnp2 | .869763 .8630616 .0067015logpcg1 | .2041027 .2493413 -.0452386logpcg2 | .3445702 .3398445 .0047256
dilngini | .1178264 .1205486 -.0027222
Test: Ho: difference in coefficients not systematic
chi2( 13) = (b-B)'[S^(-1)](b-B), S = (S_fe - S_re)= 49.16
Prob>chi2 = 0.0000

31
Fixed-effects (within) regression Number of obs = 7148Group variable (i) : i Number of groups = 58
R-sq: within = 0.6895 Obs per group: min = 27between = 0.3319 avg = 123.2overall = 0.5523 max = 175
F(12,7078) = 1310.08corr(u_i, Xb) = 0.0566 Prob > F = 0.0000
------------------------------------------------------------------------------lnbilexp | Coef. Std. Err. t P>|t| [95% Conf. Interval]---------+--------------------------------------------------------------------logdist | -.8937787 .0250568 -35.670 0.000 -.9428976 -.8446597
d2ap | 1.191062 .0927713 12.839 0.000 1.009203 1.372922d1ap | .3326972 .0481058 6.916 0.000 .2383954 .4269989hsa1 | .3689404 .1723801 2.140 0.032 .0310239 .7068569wh2 | .8333391 .0957815 8.700 0.000 .6455787 1.0211
linguist | .5699293 .0482527 11.811 0.000 .4753397 .664519loggini1 | .1069954 .2026886 0.528 0.598 -.2903349 .5043258loggini2 | -.4870956 .0867225 -5.617 0.000 -.6570976 -.3170935logpcg1 | .4194079 .0263698 15.905 0.000 .3677153 .4711006logpcg2 | .1464208 .0171792 8.523 0.000 .1127444 .1800972loggnp2 | .8264954 .0127864 64.639 0.000 .8014303 .8515605
_cons | -2.703383 .3461923 -7.809 0.000 -3.382023 -2.024742------------------------------------------------------------------------------sigma_u | 1.4745177sigma_e | 1.2985806
rho | .5631899 (fraction of variance due to u_i)------------------------------------------------------------------------------F test that all u_i=0: F(57,7078) = 109.09 Prob > F = 0.0000

32
Random-effects GLS regression Number of obs = 7148Group variable (i) : i Number of groups = 58
R-sq: within = 0.6895 Obs per group: min = 27between = 0.3592 avg = 123.2overall = 0.5606 max = 175
Random effects u_i ~ Gaussian Wald chi2(12) = 15684.36corr(u_i, X) = 0 (assumed) Prob > chi2 = 0.0000
------------------------------------------------------------------------------lnbilexp | Coef. Std. Err. z P>|z| [95% Conf. Interval]---------+--------------------------------------------------------------------logdist | -.8987311 .0250477 -35.881 0.000 -.9478237 -.8496386
d2ap | 1.194352 .0928956 12.857 0.000 1.01228 1.376425d1ap | .3447884 .0480637 7.174 0.000 .2505852 .4389916hsa1 | .3684504 .172698 2.133 0.033 .0299686 .7069322wh2 | .828063 .0958331 8.641 0.000 .6402336 1.015892
linguist | .564131 .0483255 11.674 0.000 .4694146 .6588473loggini1 | -.0127696 .1954166 -0.065 0.948 -.3957791 .3702399loggini2 | -.4923866 .0868892 -5.667 0.000 -.6626863 -.322087logpcg1 | .4445518 .0258861 17.173 0.000 .3938161 .4952876logpcg2 | .14367 .0172118 8.347 0.000 .1099355 .1774045loggnp2 | .8228904 .0128045 64.266 0.000 .7977941 .8479867
_cons | -3.254213 .3720404 -8.747 0.000 -3.983399 -2.525028---------+--------------------------------------------------------------------sigma_u | 1.1324436sigma_e | 1.2985806
rho | .43197738 (fraction of variance due to u_i)------------------------------------------------------------------------------

33
Hausman specification test
---- Coefficients ----| Fixed Random
lnbilexp | Effects Effects Difference---------+-----------------------------------------logdist | -.8937787 -.8987311 .0049525
d2ap | 1.191062 1.194352 -.0032902d1ap | .3326972 .3447884 -.0120913hsa1 | .3689404 .3684504 .00049wh2 | .8333391 .828063 .0052761
linguist | .5699293 .564131 .0057984loggini1 | .1069954 -.0127696 .1197651loggini2 | -.4870956 -.4923866 .0052911logpcg1 | .4194079 .4445518 -.0251439logpcg2 | .1464208 .14367 .0027508loggnp2 | .8264954 .8228904 .003605
djlngin2 | .2001331 .2008989 -.0007658
Test: Ho: difference in coefficients not systematic
chi2( 12) = (b-B)'[S^(-1)](b-B), S = (S_fe - S_re)= 45.24
Prob>chi2 = 0.0000

34
Fixed-effects (within) regression Number of obs = 3369Group variable (i) : i Number of groups = 57
R-sq: within = 0.7857 Obs per group: min = 2between = 0.4983 avg = 59.1overall = 0.7410 max = 170
F(16,3296) = 755.10corr(u_i, Xb) = 0.0905 Prob > F = 0.0000
------------------------------------------------------------------------------lnplutra | Coef. Std. Err. t P>|t| [95% Conf. Interval]---------+--------------------------------------------------------------------logdist | -.7072502 .0280994 -25.170 0.000 -.7623442 -.6521563
d2ap | 1.600493 .0847851 18.877 0.000 1.434257 1.76673d2na | -.6646207 .2683821 -2.476 0.013 -1.190833 -.1384082d1ap | .5198653 .0456675 11.384 0.000 .4303258 .6094048wh2 | .7921349 .0970731 8.160 0.000 .6018052 .9824646
adjacent | .5441098 .0923489 5.892 0.000 .3630428 .7251768linguist | .6452698 .0472909 13.645 0.000 .5525472 .7379924loggini1 | .3103716 .2712568 1.144 0.253 -.2214773 .8422204loggini2 | .4646067 .0959799 4.841 0.000 .2764204 .652793lnpcgin1 | -.6455658 .2152589 -2.999 0.003 -1.06762 -.2235111lnpcgin2 | .2310558 .0186839 12.367 0.000 .1944226 .267689loggnp1 | .9055891 .1981664 4.570 0.000 .5170476 1.294131loggnp2 | .7074166 .0163083 43.378 0.000 .6754412 .7393919
mijlngin | -.7407607 .1017938 -7.277 0.000 -.9403462 -.5411752mijlngnp | .0682432 .0177396 3.847 0.000 .0334615 .1030249mijlpgin | -.0234487 .0197333 -1.188 0.235 -.0621394 .015242
_cons | -4.605697 .588925 -7.821 0.000 -5.760393 -3.451001------------------------------------------------------------------------------sigma_u | 1.2774522sigma_e | .8610448
rho | .68760642 (fraction of variance due to u_i)------------------------------------------------------------------------------F test that all u_i=0: F(56,3296) = 27.58 Prob > F = 0.0000

35
Fixed-effects (within) regression Number of obs = 3369Group variable (i) : i Number of groups = 57
R-sq: within = 0.7855 Obs per group: min = 2between = 0.5844 avg = 59.1overall = 0.7570 max = 170
F(14,3298) = 862.59corr(u_i, Xb) = 0.2197 Prob > F = 0.0000
------------------------------------------------------------------------------lnplutra | Coef. Std. Err. t P>|t| [95% Conf. Interval]---------+--------------------------------------------------------------------logdist | -.707228 .0280839 -25.183 0.000 -.7622917 -.6521642
d2ap | 1.598169 .0847779 18.851 0.000 1.431947 1.764392d2na | -.6591565 .2683555 -2.456 0.014 -1.185317 -.1329962d1ap | .5176556 .0456519 11.339 0.000 .4281467 .6071645wh2 | .7883687 .0970467 8.124 0.000 .598091 .9786465
adjacent | .5385997 .0922749 5.837 0.000 .3576779 .7195215linguist | .6456025 .0472951 13.651 0.000 .5528717 .7383332loggini2 | .4510161 .0956261 4.716 0.000 .2635236 .6385086lnpcgin1 | -.4866535 .1525158 -3.191 0.001 -.7856887 -.1876184lnpcgin2 | .2176713 .0145479 14.962 0.000 .1891474 .2461952loggnp1 | .7538761 .1376926 5.475 0.000 .4839046 1.023848loggnp2 | .712691 .0157041 45.382 0.000 .6819002 .7434819
sijlngin | -.7112763 .1001815 -7.100 0.000 -.9077005 -.5148521sijlngnp | .0576587 .0148508 3.883 0.000 .0285411 .0867763
_cons | -4.373803 .5511488 -7.936 0.000 -5.454431 -3.293175------------------------------------------------------------------------------sigma_u | 1.1767234sigma_e | .86113954
rho | .65123338 (fraction of variance due to u_i)------------------------------------------------------------------------------F test that all u_i=0: F(56,3298) = 28.43 Prob > F = 0.0000

36
Fixed-effects (within) regression Number of obs = 3369Group variable (i) : j Number of groups = 57
R-sq: within = 0.7914 Obs per group: min = 4between = 0.5067 avg = 59.1overall = 0.6440 max = 143
F(16,3296) = 781.49corr(u_i, Xb) = -0.1368 Prob > F = 0.0000
------------------------------------------------------------------------------lnplutra | Coef. Std. Err. t P>|t| [95% Conf. Interval]---------+--------------------------------------------------------------------logdist | -.9410296 .0302071 -31.153 0.000 -1.000256 -.8818031
d2ap | 1.081797 .0999408 10.824 0.000 .8858452 1.27775dja | -.3784135 .173929 -2.176 0.030 -.7194333 -.0373937
d1ap | .408205 .0565621 7.217 0.000 .2973045 .5191055hsa1 | .4332478 .16986 2.551 0.011 .100206 .7662897wh2 | .4205478 .0968738 4.341 0.000 .2306089 .6104867
adjacent | .2766568 .0967818 2.859 0.004 .0868983 .4664153linguist | .5493785 .0492445 11.156 0.000 .4528256 .6459313lnpcgin1 | -.1747095 .1090828 -1.602 0.109 -.3885864 .0391673lnpcgin2 | .5688443 .1329551 4.278 0.000 .3081614 .8295273loggnp1 | .8639809 .0151578 56.999 0.000 .8342613 .8937005loggnp2 | -.1892749 .1135799 -1.666 0.096 -.4119692 .0334194logpcg1 | .2922337 .1014263 2.881 0.004 .0933688 .4910985
sijlngin | -.7435173 .106744 -6.965 0.000 -.9528085 -.534226sijlngnp | .075959 .0188669 4.026 0.000 .0389669 .1129511sijlpgin | -.078793 .020327 -3.876 0.000 -.1186479 -.0389382
_cons | -1.183643 .4988506 -2.373 0.018 -2.161731 -.2055545------------------------------------------------------------------------------sigma_u | 1.2975573sigma_e | .89689505
rho | .67668962 (fraction of variance due to u_i)------------------------------------------------------------------------------F test that all u_i=0: F(56,3296) = 21.33 Prob > F = 0.0000

37
Fixed-effects (within) regression Number of obs = 3369Group variable (i) : ij Number of groups = 1377
R-sq: within = 0.8281 Obs per group: min = 1between = 0.3827 avg = 2.4overall = 0.4569 max = 4
F(9,1983) = 1061.59corr(u_i, Xb) = -0.3748 Prob > F = 0.0000
------------------------------------------------------------------------------lnplutra | Coef. Std. Err. t P>|t| [95% Conf. Interval]---------+--------------------------------------------------------------------loggnp1 | 1.550995 .1618791 9.581 0.000 1.233525 1.868466loggnp2 | .8644355 .1321203 6.543 0.000 .6053263 1.123545
loggini1 | 1.088552 .1960572 5.552 0.000 .7040519 1.473051loggini2 | .5682854 .1923803 2.954 0.003 .1909967 .9455742lnpcgin1 | -1.099925 .1570185 -7.005 0.000 -1.407864 -.7919865lnpcgin2 | -.2076647 .1269664 -1.636 0.102 -.4566662 .0413368sijlngin | -.4161245 .0960629 -4.332 0.000 -.6045192 -.2277298sijlngnp | .0806086 .0175021 4.606 0.000 .0462842 .114933sijlnpcg | -.0737776 .0181961 -4.055 0.000 -.1094631 -.0380922
_cons | -11.79181 .3789443 -31.118 0.000 -12.53499 -11.04864------------------------------------------------------------------------------sigma_u | 1.9947776sigma_e | .50965323
rho | .93872292 (fraction of variance due to u_i)------------------------------------------------------------------------------F test that all u_i=0: F(1376,1983) = 15.51 Prob > F = 0.0000


