NATIONAL HURRICANE RESEARCH · PDF fileNo. U. Instrumentation of National Hurricane Research...
20
NATIONAL HURRICANE RESEARCH PROJECT K REPORT NO. 55 Vertical Wind Profiles in Hurricanes
Transcript of NATIONAL HURRICANE RESEARCH · PDF fileNo. U. Instrumentation of National Hurricane Research...

NATIONAL HURRICANE RESEARCH PROJECT
K
REPORT NO. 55
Vertical Wind Profiles in Hurricanes
U. S. DEPARTMENT OF COMMERCELuther H. Hodges, Secretary
WEATHER BUREAUF. W. Reichelderfer, Chief
NATIONAL HURRICANE RESEARCH PROJECT
REPORT NO. 55
Vertical Wind Profiles in Hurricanes
by
H. F. Hawkins
National Hurricane Research Project, Miami, Fla.
Washington, D. C.June 1962

NATIONAL HURRICANE RESEARCH PROJECT REPORTS
Reports by Weather Bureau units, contractors, and cooperators working on the hurricane problem are preprinted inSJ! ^V° IS^If *TJiatC distribution °f tte information among the workers and other £J£Z&uM?s Asthis United reproduction and distribution in this form do not constitute formal scientific publication, reference to apaper in the series should identify it as a preprinted report. ^^cawoo, rererence xo aNo. 1. Objectives and basic design of the NHRP. March 1956.No. 2. Numerical weather prediction of hurricane motion. July 1956.
Supplement: Error analysis of prognostic 5O0-mb. maps made for numerical weather prediction of hurricanemotion. March 1957.
No. 3. Rainfall associated with hurricanes. July 1956.No. U. Some problems involved in the study of storm surges. December 1956.No. 5. Survey of meteorological factors pertinent to reduction of loss of life and property in hurricane situations.
March 1957.No. 6. A mean atmosphere for the West Indies area. May 1957.No. 7. An index of tide gages and tide gage records for the Atlantic and Gulf coasts of the United States. May 1957.No. B. Part I. Hurricanes and the sea surface temperature field. Part II. The exchange of energy between the sea
and the atmosphere in relation to hurricane behavior. June 1957.No. 9. Seasonal variations in the frequency of North Atlantic tropical cyclones related to the general circulation.
July 1957.
No. 10. Estimating central pressure of tropical cyclones from aircraft data. August 1957.No. U. Instrumentation of National Hurricane Research Project aircraft. August 1957.No. 12. Studies of hurricane spiral bands as observed on radar. September 1957.No. 13. Mean soundings for the hurricane eye. September 1957.No. 1U. On the maximum intensity of hurricanes. December 1957.No. 15. The three-dimensional wind structure around a tropical cyclone. January 1958.No. 16. Modification of hurricanes through cloud seeding. May I958.No. 17. Analysis of tropical storm Frieda 1957. A preliminary report. June I958.No. 18. The use of mean layer winds as a hurricane steering mechanism. June 1958.No. 19. Further examination of the balance of angular momentum in the mature hurricane. July 1958.No. 20. On the energetics of the mature hurricane and other rotating wind systems. July I958.No. 21. Formation of tropical storms related to anomalies of the long-period mean circulation. September 1958.No. .22. On production of kinetic energy from condensation heating. October 1958.No. 23. Hurricane Audrey storm tide. October I958.No. 2k. Details of circulation in the high energy core of hurricane Carrie. November 1958.No. 25. Distribution of surface friction in hurricanes. November 1958.No. 26. A note on the origin of hurricane radar spiral bands and the echoes which form them. February 1959.No. 27. Proceedings of the Board of Review and Conference on Research Progress. March 1959.No. 28. A model hurricane plan for a coastal community. March 1959.No. 29. Exchange of heat, moisture, and momentum between hurricane "in (1958) and its environment. April 1959.No. 30. Mean soundings for the Gulf or Mexico area. April I959.No. 31. On the dynamics and energy transformations in steady-state hurricanes. August 1959.No. 32. An interim hurricane storm surge forecasting guide. August 1959-No. 33. Meteorological considerations pertinent to standard project hurricane, Atlantic and Gulf coasts of the United
States. November 1959.No. 3U. Filling and intensity changes in hurricanes over land. November 1959.No. 35. Wind and pressure fields In the stratosphere over the West Indies region in August 1958. December 1959.No. 36. Climate-logical aspects of Intensity of typhoons. February i960.No. 37. Unrest in the upper stratosphere over the Caribbean Sea during January i960. April i960.No. 38. On quantitative precipitation forecasting. August i960.No. 39. Surface winds near the center of hurricanes (and other cyclones). September i960.No. kO. On initiation of tropical depressions and convection in a conditionally unstable atmosphere. October i960.No. Ul. On the heat balance of the troposphere and water body of the Caribbean Sea. December i960.No. I»2. Climatology of 2U-hour North Atlantic tropical cyclone movements. January 1961.No. 1»3. Prediction of movements and surface pressures of typhoon centers in the Far East by statistical methods. May 1961.No. kk.t Marked changes in the characteristics of the eye of intense typhoons between the deepening and filling states.
May 1961.No. 1*5. -The occurrence of anomalous winds andtheir significance. June I961.No. U6. Some aspects of hurricane Daisy, 1958. July 1961.No. U7. Concerning the mechanics and thermodynamics of the inflow layer'of the mature hurricane. September 1961.No. 1»8. On the structure of hurricane Daisy (1958). October 1961.No. U9. Some properties of hurricane wind fields as deduced from trajectories. November I96I.No. 50. Proceedings of the Second Technical Conference on Hurricanes, June 27-30, I96I, Miami Beach, Fla. March 1962.No. 51- Concerning the general vertically averaged hydrodynamic equations with respect to basic storm equations.
April I962.
No. 52. Inventory, use,and availability of NHRP meteorological data gathered by aircraft. April 1962.No. 53. On the momentum and energy balance of hurricane Helene (1958). April 1962.No. 5U. On the balance of forces and radial accelerations in hurricanes. June 1962.
CONTENTS
Page
1. INTRODUCTION '1
2. DATA 2*
Nature and characteristics of the wind data 2
Vertical data coverage 6
Data coverage relative to classes of hurricane .".... 7
5. PROCEDURE AND RESULTS 7
Comparison with hurricanes of greater intensity .... 15
REFEBENCES l6

VERTICAL WIND PROFILES IN HURRICANES
Harry F. Hawkins, Jr.National Hurricane Research Project, Miami, Fla.
1. INTRODUCTION
Investigation of the vertical wind structure in hurricanes serves thedual purpose of practical necessity and research. From the practical viewpoint, it is essential that the forecaster be supplied with fairly accurateinformation as to the intensity and areal extent of damaging winds at lowlevels (preferably the ground level). Lack of such information must leadeither to inadequate hurricane warnings or to overwarning - either of whichis unsatisfactory to the public. It is, in a way, a meteorological irony ofour time, that the advent of radio and marine broadcasts has so affectedshipping procedures that very few ships are now caught in these storms andonlyrarely is there available any reliable estimate of strong surface windsfrom these sources. Before the initiation of aircraft reconnaissance, thismeant that the forecaster had, on many occasions, to judge and estimate thestorm by peripheral data alone. Only when and if the storm made a landfall,was an adequate description of the surface wind field apt to become available.
During most of the period of aircraft reconnaissance (and to some extenteven today), flights were carried out at low altitudes - often below cloud •base, except where this was unfeasible. In such operations wind speeds couldbe estimated with considerable accuracy through continuous observations ofthe state of the sea. Tables and photographs relating characteristic stateswith wind speed were prepared. Navigational checks and drift readings wereused to supplement these estimates. As the demand for more continuous andfarther ranging reconnaissance increased, recourse was had to larger andfaster planes. Experience indicated that these should be employed at higherlevels,for safety reasons 5>000 to 10,000ft.;and to meet meteorological requirements 18,000 to 20,000 ft. In the high-energy core of the hurricane,clouds and rain obscure the sea almost all of the time from these heights.In addition, when viewed from 10,000 ft. or higher, the sea is seen in different perspective so that the brief available glimpses are difficult to evaluate. However, at flight level the winds may be known with from fair to highorder accuracy depending on navigational aids utilized and the availabilityof automatic navigation equipment. The problem is then reduced to making reliable estimates of the sea level wind speeds from the known speeds at flightlevels.
The theoretical uses to which knowledge about the vertical wind structure in hurricanes can be put are many and varied. At one time the recognition of the hurricane as a warm core phenomenon led to a belief that thestorm disappeared quite rapidly with height. Calculations by Haurwitz [1]indicated clearly that hurricanes of significant intensity maintained theiridentity through most if not all of the troposphere. Given adequate data onthe thermal structure, one can calculate the pressure or contour field at anylevel if the fied is defined at one level. However, the relation of thewinds to contour gradients and the vertical variations in this relationship,
the asymmetry in the wind field and its vertical variation, implications of

vertical motions as deduced from the vertical wind structure; all of these and
more, make determination of the vertical wind structure academically valuable.It is not believed, however, that the vertical shears established and treatedin this paper are adequate for the computation of lateral and vertical fric-.tional stresses.
The present paper consolidates and extends the original work reported onby the author at the Joint AGU-MS Meetings held in Washington, D. C. in May1958. It is anticipated that the main practical purpose served by this reportwill be in the estimation of low-level winds over the ocean when flight level
winds are available - in moderate, mature hurricanes.
2. DATA
At present the only reliable means by which the vertical wind relationship can be established is through utilization of the unique NHRP collectionof data. These data have been gathered by aircraft (usually three) makingmulti-level traverses through the core of the hurricane along preselectedflight tracks. In addition, the flights are planned to achieve approximatesimultaneity so that radial profiles are nearly synoptic in time. Since notall flights were planned with these particular criteria in mind, only a limited amount of the NHRP data are suitable for these particular purposes.
Figure 1 is illustrative of the spatial and time separation which wasconsidered acceptable. Data were gathered at three levels: 6,^00, 15,600,and >5,000 ft. pressure altitude.* Adjacent radial passes did not lie directly one above the other but it can be readily seen that the spatial separationswere not great. The two TB-50's at the lower levels cruised at approximatelythe same power settings but at different speeds because of the difference inaltitude. At the upper level, the B-kJ (jet) traveled much faster. Thismeans that, of necessity, the time separation of data gathered at the different levels varied throughout the data collection period. If the storm is ina reasonably steady-state condition , objections to the time difference maybe minimized. However, due to the convective and violent nature of the hurricane, one must treat such assumptions with extreme caution and accept the datawith reservations.
Nature and characteristics of the wind data.
Having satisfied reasonable requirements as to space and time differencesacceptable in the data to be utilized, it was proper to examine the nature orcharacteristics of these data. The wind observations were produced aboard theaircraft by a small computer linked to the APN/82 Doppler Navigation System.The following statements may be offered concerning the winds thus obtained[2,3]. "".
1. Wind observations were available as often as one every 2 seconds.
2. The Doppler antenna balanced return echoes to a null reading by rotation. This continuous hunting introduced small very-short-term fluctuations
^Pressure altitude is referred to the U.S.Standard Atmosphere throughout thispaper unless otherwise noted.

COMPOSITED FLIGHT TRACKS
CLEO AUG. 18, 1958
1947
AIRCRAFT B-50 (FLIGHT-A) 6400FTAIRCRAFT B-50 (FLIGHT-B) I5.600FTAIRCRAFT B-47 (FLIGHT -C) 35.000FT
ALL TIMES G.C.T
Figure 1. - Space and time separation in the reconnaissance of hurricane Cleo,Wind speed profiles were prepared from each flight level for all of theradial passes. With rare exceptions they were treated as synoptic intime and vert-ical in space.

in the wind speeds. Such small-scale oscillations in the range of 2 to 10seconds could not be considered real.
3. The Doppler systems used on the NHRP research planes were especiallydesigned for fast response. Bench tests indicated the maximum response to achange in wind direction was 2.6° per second and this rate of slewing was attained in k seconds. For changes in wind speed, a maximum response of 6.6 kt.per second was reached in 3 seconds. While horizontal wind shear and curvaturein the free air are by no means negligible, the B-50's flying at 220 kt. travel only 750 ft. in 2 seconds. It is maintained that the aircraft wind dataare at least as accurate (after post flight calibration) as rawinsonde windsand that spot values represent a3-5 second average; i.e. about a l/k to 1/2mile average wind. Examination of hurricane eye penetrations where strongshears are common - from the ring of maximum wind to the much calmer eye -reveals that only very rarely have slew rates (for speed) approached themaximum.
k. When used over open water, Doppler systems suffer a well recognizeddeficiency, i.e. they measure only relative to the surface beneath, which ispresumed to be stationary. Thus, the winds computed by the APN/«2 are inerror by an amount equal to the net water transport which characterizes aconsiderable area beneath the plane. The correction, if known, could be madeby adding a vector (equal to the net transport) to the computed winds. Innear simultaneous flights over the same or adjacent ocean areas this effectshould be approximately the same for all three planes (at three different altitudes). The total error introduced should be similar to that made by decreasing the wind speed at each level by a relatively small (compared to hurricanewinds) amount.
With the wind speeds recorded once every 2 seconds, detailed features inthe profiles were readily available. Figure 2 shows the 2-second observationsfrom the inner eye-wall of hurricane Carrie (solid line). Small-scale fluctuations of 2-3 kt. over intervals of 2 to about 6 seconds were quite common.The dashed line in figure 2 indicates the profile obtained using only everyfifth observation, i.e. one observation every.10 seconds (about 2/3 n.mi.;.
' The salient features are still well represented but relatively minor oscilla-*' tions are still common. These "meso-scale" features may, of course, have beenquite real on occasion but if comparison was to be made with winds observed 5miles away, one-half hour later, and 10,000 feet higher, it was clear thatfeatures of this scale had to be eliminated. Smoothing was begun by usingrunning averages of the 10-second observations over 5 n.mi. (measured radially).
An example of the result of such processing is shown in figure 3- Dotsshow 5-mi. averages of wind speed gathered in a pass at 14,000 ft. (pressurealtitude) in Carrie (September 15, 1957) at 21^0 GMT. Crosses show the sameparameter in apass made in the same left front quadrant about 2 hours later.The solid curve was considered tdbe a representative mean profile for thisperiod. That the double peak of speed was a reasonably steady synoptic feature was testified to by similar characteristic shape of the profiles at19,000 and at 1,500 feet (except the latter penetration was limited to thoseareas where winds were 65 kt. or less).

02
0(1
91
9:4
5)
40
60
20
(19
21
:45
)6
02
0
TIM
EIN
SE
CO
ND
S
60
20
(19
23
:45
)6
02
0(1
92
5=
45
)
Figure
2.-Variations
inwind
speedbasedon
observations
takenat
2-
andlO-second
intervals.
Note
small-scale
fluctuations
inwind
speed
inobservations
takenevery2
seconds
(solid
line)andresi
dual
oscillations
when10-secondinterval
(dashedline)
only
was
retained.
\ji

70
60
50
~ 40o
UJ0.
30
20
X)
X /
XX X£*xV\x
23502 xx« xxxxxxxxx xxxr xx
X XK[XXXXX
X/ < \x X
Y/ • • vxx
•
•
•
• •
•• ••••
21402
••
•••
•
•••••
•
•
«... ":
\V x)
)
X
X
X XXXXX
' :w x
XI*
•
•
•xxxxx •
• •
• ••• '• '
x|I5SEF
CAF
T. 1957
RIE
14,0'DO FT.
• ••
•••
xj LEFT FRONT QUAD RANT
xj*xj
!1J *X
-
X' •
X / • 1•
X J
1 !
i
!
: I
.
10 20 30 40 50 60 70 80 90 100
RADIAL DISTANCE FROM CENTER OF EYE .(N.MI.)
Figure 3. - An extreme example of subjective profile smoothing (solid curve).Ordinarily successive passes from the same quadrant did not produce profiles as dissimilar as those shown.
Vertical data coverage.
Examination of the data available in the vertical showed that coveragefrom 5,000 to 35,000 ft. was relatively good. Also some data were availabledown to 1,500 ft. All sets of low-level data were carefully evaluated even ifonly portions of profiles were available. The main objective here was toestablish as firmly as possible the shears from 1,500 ft. to 5,000 and 10,000ft. It is believed that this relationship was reasonably well determinedwithin tlje limitations of the data which include the necessary smoothing andsteady state assumption. No data from heights less than 1,500 ft. wereemployed in this study.
Thus, in essence, the shears treated were between the smoothedwind fields at the various levels. The winds have been deliberatelysmoothedto retain only "synoptic scale" wind variations. It was reasonedthat the 1,500-ft. winds so smoothed may well be equivalent to 5-min.average winds observed at sea level. The prevailing level of speed at

1,500 ft. should certainly be greater than that observed at sea level when considered over a comparable radial distance and the actual shear in this area isa matter of great importance. However, available data were not suitable forthe solution of this problem. Nevertheless, it seems reasonable to hypothesize that the winds generally obtained at 1,500 ft. are carried down to theearth in gusts due to the turbulence which characterizes the eye-wall and thespiral bands.
Upper-level wind reports were available from 35,000 ft. pressure.altitude,i.e. about 2^0 mb. Consideration of these data for hurricanes Carrie and Cleoclearly demonstrated that at this level much of the closed cyclonic circulation of the storm had disappeared. Therefore, no meaningful relation to thetotal observed wind was possible. Consequently, only the tangential componentof the wind was considered in the data obtained at elevations above 30,000 ft.
Data coverage relative to classes of hurricanes.
It has long been recognized that hurricanes vary greatly one from another.The intensities as measured by maximum wind speed and central pressure cover awide range from the minimum 6k kt. and about 995 mb. to 150 to 200 kt. and perhaps 890 mb. The vertical extent of the storm is"a function of the minimumpressure and the temperature distribution. Observations now available indicatethat the deeper more intense storms maintain an inner core of strong cycloniccirculation up beyond 250 mb. Consequently, meaningful average wind shearsmust ideally be defined for various categories of hurricanes.
In examining currently available data it was clear that the most adequatecoverage was provided for a so-called average hurricane. Thus, the bulk ofthe data treated in this report were gathered in Cleo, August 18, 1958, and inCarrie, September 15 and 17, 1957, with some data from Betsy, August lk, 1956.On these occasions the conditions of nearly identical radial passes and approximate simultaneity were reasonably satisfied. Portions of passes from otherstorms have been incorporated where the pertinent conditions were satisfied.Since the data were gathered at a rapid rate, each pass at a given level contains hundreds of observations. Thus, in a sense, the quantity of data available was quite large but limited principally to two hurricanes (Cleo and Carrie)which were of approximately the same strength (970 and 975 mb. ). Moreover,these storms were both mature hurricanes at relatively high latitudes (near 30°)and were near or in the recurvature stage. This uniformity of the sample washelpful in that the storms were quite comparable but at the same time limitsthe range over which results may be applicable.
3. PR0CEDUEE AND RESULTS
One of the incidental difficulties inherent in the comparison of hurricanes is their variation in size. The ring of maximum winds may vary anywherefrom about 15 to 50n.mi. or more in diameter. Consequently, comparison of profiles on a true scale of radial distance is impossible, i.e. the shear insidethe eye of one storm cannot be compared with the shear in the turbulent updraftsin the wall cloud of another. To eliminate this difficulty, comparisons areusually standardized and radial distance is normalized in terms of the radius
of maximum winds (R ) . While comparisons are thus rendered more facile there

1.5
1.75
2.0R
m2.
252.
52.
753.
0Rm
3.25
RAD
IAL
DIS
TANC
E(W
HERE
RmIS
THE
RAD
IUS
OFM
AXIM
UMW
IND
S)
Figure
k.-Smoothedwindspeedprofilesfromfour
levels
inthe
left
front
quadrant
ofCarrie;
tangential
componentonlyhasbeenretainedat35,000
ft.
CO

seems implicit in this device an assumption that the scale of all processesin a hurricane varies with eye diameter. Undoubtedly some of the phenomena dovary in this manner but it is extremely doubtful that the horizontal scale ofsay, the convective activity, varies directly with the eye diameter. Thisbeing so, one must accept with reservation any relations tentatively put forward at more remote distances from the eye wall. The most meaningful shearsmay eventually be expressed in terms of eye-wall and spiral bands and relativeorientation to such well-defined physical features. Figure k shows thesmoothed wind profiles from the left-front quadrant of hurricane Carrie (1957)and illustrates the form of the data used to derive the vertical shears.
The winds, previously defined, were plotted at their proper altitude atthe correct multiples of the radius of maximum winds. The winds were then expressed in the form of the percentage reduction in wind speed per thousandfeet from one elevation to the next higher where data were available. Thevariation of reduction with elevation and. radial distance was analyzed. ,Sinceall of the data were from moderately intense, closed vortices, with solid wallclouds, no stratification by quadrant or open vs. closed sector was attempted.By adjustment, interpolation, and cross checking an average relationship wasobtained. Since the major use of the nomogram (fig. 5) may be to estimatelow-level from flight-level winds, the reciprocal relationship has been retained for presentation here. The percentages were not all expressed in termsof the maximum wind itself since the profiles were by no means identical evenwhen expressed in terms of normalized radial distance.
Figure '5 shows the mean relationship for mature hurricanes of averagedepth. It may be noted that speeds in the wall cloud (l.O Rm) weaken verylittle up to about 25,000 ft. However, above this height they fall off rapidlyand at 35,000 ft. are only about 1/3 of their low-level maximum. The maximumwinds at upper levels (around 35,000 ft.) are displaced outward (at least interms of percentage of surface wind) and the total shear is at a minimum atabout twice the radius of maximum wind. Wind preservation with height is wellmarked below 20,000 ft. and out at least to 2.5 Rm-
The effective relation depicted in figure 5 was originally establishedwith the Carrie and assorted supplementary data. Cleo (1958) afforded an opportunity to corroborate and modify the findings. The general agreement wasexcellent and lent strength to the hypothesis that the relationship was astable one. The original diagram was modified slightly to include all of theCleo data.
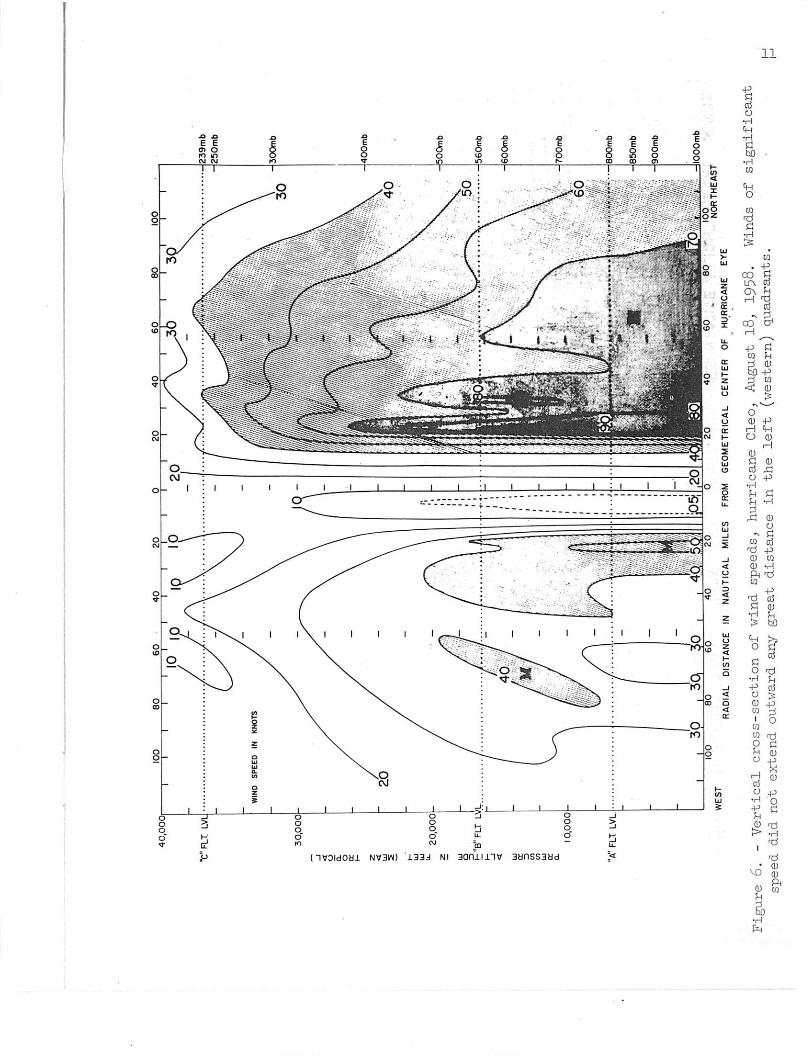
An illustration of what the "Schematic" relationship implies in a specific example is shown in figure 6, the complete vertical cross-section for hurricane Cleo (1958) [k]. Checks against the nomogram reveal that in almost allregions one can estimate the 1,500 ft. winds within about 10 percent from anygiven flight level below 25,000 ft.
Probably the poorest defined area in the existing data (for mature averagehurricanes) is to be found in the region from 2^,000 ft. to 33,000 ft. wherefew flights have been conducted because of operating limitations of the aircraft employed. For the average mature hurricane this layer is one of considerable interest because most of the shear lies within its confines. Further,in this class of hurricanes the vortex circulation at 35,000 ft. is too weak

RADIAL
DISTANCE
FROM
EVE
CENTER
(WHERE
RmIS
RADIUS
OFMAXIMUM
WINDS)
Figure
5.-Nomogram
showing
(for
mature
hurricane
ofaverage
depth)
thepercentage
bywhichanyrepresen
tative
flight-levelwind
shouldbe
increasedto
estimatelow-levelwinds.
H O
40
,00
0
"C'F
LT
LV
L
30
,00
0-
20
,00
0-
•"B
"FL
TL
VL
I0,0
00
-
"A"
FL
TL
VL
WE
ST
8060
4020
020
4060
^80
RA
DIA
LD
IST
AN
CE
INN
AU
TIC
AL
MIL
ES
FR
OM
GE
OM
ET
RIC
AL
CE
NT
ER
OF
HU
RR
ICA
NE
EY
E
-lO
OO
mb
10
0N
OR
TH
EA
ST
Figure
6.-Vertical
cross-section
ofwind
speeds,
hurricane
Cleo,
August
18,
1958.
Winds
ofsignificant
speeddid
notextend
outwardany
great
distance
inthe
left
(western)
quadrants.

12
and variable to be utilized effectively as an index of lower-level circulation. It is possible, given more relevant data, that a useful relationshipcould be developed between the ring of maximum winds at 35,000 ft. and thatat 1,500 ft. but in the outer areas of the weak upper-level vortex the circulation is apt to be dominated by the synoptic-scale pattern.
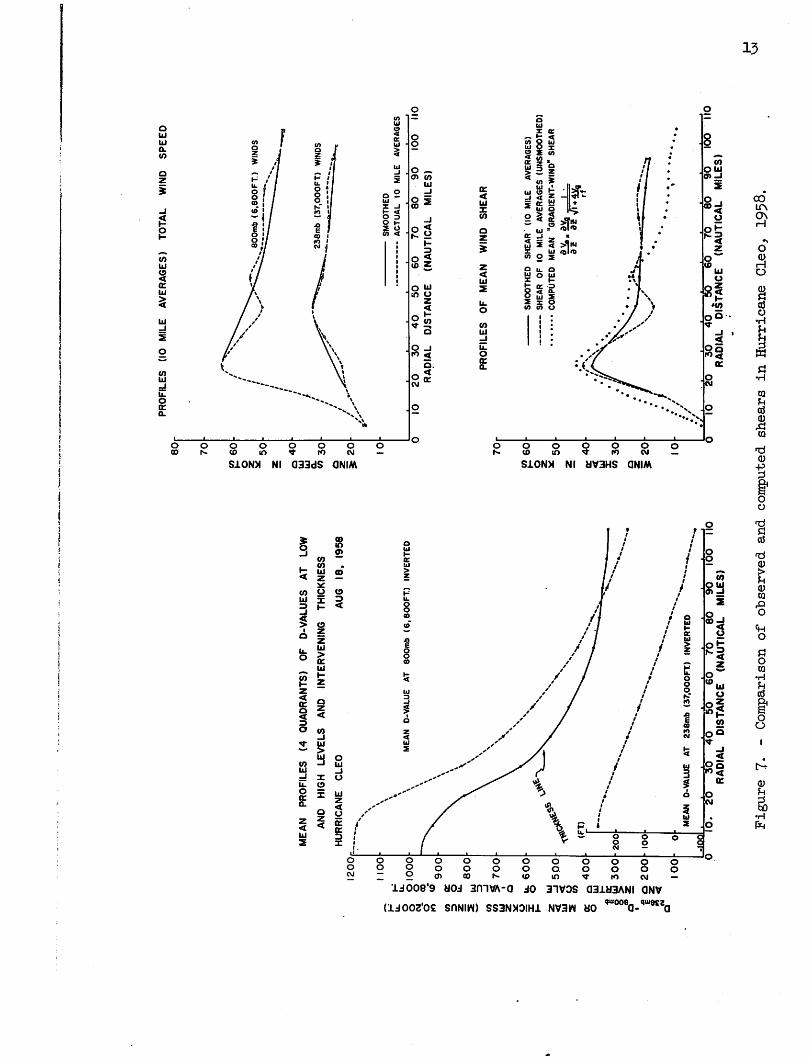
As a consistency check using the best data-set available, the observations gathered in Cleo were subjected to the following test of the shears observed. Figure 7 shows the essence of this work. On the left are the meanD-value (radio altitude minus pressure altitude) profiles from Cleo for thelowest (800 mb.) and highest levels(238 mb. ) for which data were available[k]. The profiles have been averaged for all quadrants and inverted (byusing the negative of the actual values) for easy comparison with the thickness between these levels (heavy solid line). On the upper right are theaverage profiles (all quadrants) of the total winds from the same two levels.Solid lines show the smoothed wind at each level and the difference or shearis presented as the solid curve in the lower right graph, i.e., the observedsmoothed shear using 10 n. mi. averages. The unsmoothed shear is retained asa dashed line. Using the thickness gradient developed on the left, the "gradient wind shear" was computed from the following considerations:
Let v = the tangential component of the gradient wind
v = geostrophic wind
f = Coriolis parameter
r = radius of curvature taken to be the radial distance
•r- = height gradient (on a constant pressure surface) pressure.
v2Then, ~ +fv0 =g^ =fv and v =| ^5. After differentiation ^-2 =
dv 1 d vQ dv^-& — where -^— is the "shear" in the gradient wind and ^-^
is the "shear in the geostrophic wind. "* The geostrophic shear was calculatedfrom computations of the geostrophic winds at the two levels and v for the
glayer was assumed to be the average of the upper and lower geostrophic winds.
*Implicit in the use of this equation are the assumptions that the motion ishorizontal, non-accelerating, and non-viscous. It provides at best a standard of comparison rather than a rigorous test. However, the equation may bemore general than appears at first glance since the variation of v with
gheight may be quite similar to the variation of total wind with height andover much of the range of z the variation in trajectory curvature with heightmay be negligible.
12
00
I1
00
OIO
OO
o 00
to9
00
(E O
80
0
%7
00
•
o
60
0
50
0
40
0
2j30
0
Q2
00
z <
10
0
ME
AN
PR
OF
ILE
S(4
QU
AD
RA
NT
S)O
FD
-VA
LU
ES
AT
LO
W
AN
DH
IGH
LE
VE
LS
AN
DIN
TE
RV
EN
ING
TH
ICK
NE
SS
HU
RR
ICA
NE
CL
EO
AU
G1
8,
19
58
20
0
10
0 0
dflD
j
ME
AN
D-V
AL
UE
AT
80
0m
b(6
.80
0F
T)
INV
ER
TE
D
ME
AN
D-V
AL
UE
AT
23
8m
b(3
7.0
00
FT
)IN
VE
RT
ED
010
.20
3(5
40
5060
7080
9010
0M
OR
AD
IAL
DIS
TA
NC
E(N
AU
TIC
AL
MIL
ES
)
80
70
«26
0O z *
50
z o4
0U
JId
Ol
w3
0
o z £2
0
10
70
-
{26
0-
O z *5
0z a
40
< v»3
0
a z j2
0
10
PR
OF
ILE
S(1
0M
ILE
AV
ER
AG
ES
)T
OT
AL
WIN
DS
PE
EO
10
10
80
0m
b(6
,80
0F
T.)
WIN
OS
23
8m
b(3
7.0
00
FT
)W
IND
S
SM
OO
TH
ED
AC
TU
AL
10
MIL
EA
VE
RA
GE
S
20
30
40
50
60
70
80
90
RA
DIA
LD
JST
AN
CE
(NA
UT
ICA
LM
ILE
S)
PR
OF
ILE
SO
FM
EA
NW
IND
SH
EA
R
10
01
10
SM
OO
TH
ED
SH
EA
R(1
0M
ILE
AV
ER
AG
ES
)
SH
EA
RO
F1
0M
ILE
AV
ER
AG
ES
(UN
SM
OO
TH
ED
)
CO
MPU
TE
DM
EA
N"G
RA
DIE
NT
-WIN
D"
SHE
AR
3H32
Vl+
gV^
"35
30
40
50
60
70
80
90
100
110
RA
DIA
LD
IST
AN
CE
(NA
UT
ICA
LM
ILE
S)
Figure
7«-ComparisonofobservedandcomputedshearsinHurricane
Cleo,
1958.
«
Ik
It may be noted that the computed "gradient wind shear" agrees quiteclosely with the observed shear at least out to 60 n.mi. (about 3 R ). Be-
yond this point the computed shears were less than those observed while at
smaller radii the calculated shears were somewhat greater than observed. Itmay be worthy of note that at radii less than 60 n.mi., where the observedshears were less than the calculated, there is a suggestion of upward transport of the lower-level, high-speed winds, and possibly a slight imbalancealoft with winds somewhat stronger than gradient.
Checks and comparisons with other research of a similar vein may be ofinterest but are of limited value because of inherent differences in data and
approach. With data fairly well removed from the wall cloud and a necessarily cruder compositing technique, Miller [5] has extended the earlier work ofE. Jordan [6] and Hughes [7]. This consisted of hurricane rawins compositedby 2°-squares about the axis of storm motion. At distance of 85 n.mi.(assumed to be about 3.5 x the average R ) and 190 n.mi. (where comparison
was made with maximum distance treated in this paper, 5 R ) the 15,000-ft. and
37,000-ft. wind reductions agreed within 10 percent. At 26,000 ft. the Miller-Jordan-Hughes data indicated a somewhat greater reduction than shown here.Hence, although the data are not strictly comparable, the results are notgrossly dissimilar. Jordan and Fortner [8] have presented data using sealevel winds made from visual estimates of the state of the sea. They havesubstantiated the generally unsatisfactory nature of these data and wouldseem to be in general agreement with the small shears (in the region of thewall-cloud) demonstrated here.
One may also compare the maximum lower-level wind determined from thenomogram with those computed from formulae of the type given by the WeatherBureau Hydrometeorological Section [9] for maximum cyclostrophic winds. Thelatter expression was chosen for comparison since it presumably representsaccording to Fletcher [10], "... an average value along a line ..." and isnot the peak gust to be observed at sea level which may be "... about halfagain as strong ...". This expression is of the form v = K J^ - p ,
where v is the maximum cyclostrophic wind speed and p and p.. are the pres-. cm n 0
sures*at the storm's outer edge and at the storm center, respectively. Myers[11] showed further that for observed maximum wind speeds in two hurricanes,this coefficient takes on a considerable range of values (7 to Ik, where windspeed is in knots and pressure in millibars) depending upon the height of theanemometer and the time interval over which the wind is averaged. The com
parison, for the three hurricane days of this study where computations werepossible, showed that values of K computed from the pressure profiles and
maximum low-level winds estimated from observations between 10,000 and 20,000ft. are within the range of values that Myers [11] had found near the surface.
It should be re-emphasized that the flight winds (for mature hurricanesof average depth) have here been related essentially to 1,500-ft. winds whichare probably near the level of maximum wind speed, and that they have alsobeen subjected to radial smoothing. With these considerations in mind one
might hazard an estimate that over the ocean, speeds for the fastest mile atship anemometer level (extreme speed by Weather Bureau definition), may exceed

10
15
15 20 25 30 35 40 45 50 55 60 65 70 75 80 85 90 95 100
10 15 20 25 30 35 40 45 50 55 60 65 70 75 80 85 90 95 (00
RADIAL DISTANCE (NAUTICAL MILES)
Figure 8. - Wind profiles, right front quadrant of hurricane Daisy (centralpressure 9^8 mb. ) Aug. 27, 1958. An example of the preservation of windspeed with height in the wall of an intense hurricane.
the values derived through this flight-wind technique by something like 30 percent. It is recommended that any such approximations be confined to the areaof the wall-cloud.
Comparison with hurricanes of greater intensity.
Although insufficient data are at hand to derive a similar nomogram (fig.5) for intense storms, it may be of value to include a set of profiles for atleast one intense hurricane. Figure 8 shows profiles from 13,000, 20,500,and 35,000 ft. pressure altitude from hurricane Daisy, August 27, 1958. Daisywas a small (R = 9 n.mi. ) fairly deep (9^8 mb. ) hurricane. It will be noted
that maximum winds of about 115 kt. were observed at 13,000 ft. At 35,000 ft.these had diminished only to 70 kt.. This is a much smaller reduction than thetwo-thirds decrease which might be anticipated in an average mature hurricane.It is also a graphic example of the preservation of wind with height in thewall-cloud. The speeds decreased only 15 kt. in the layer from 13,000 ft. to20,500 ft.
Jordan, Hurt, and Lowery [12] demonstrated by RHI photographs that thewall cloud of Daisy on August 27 extended well above the 50,000-ft. level.

16
When evidence of such strong vertical development is available, it is unreasonable to expect that strong shears persist within the turbulent portion ofthe wall-cloud.
It is evident that (even if hurricanes can be treated in the average, asattempted in this paper) further categories of hurricanes (by strength, atleast) must be studied as data become available before comprehensive treatmentcan be attained.
REFERENCES
1. B. Haurwitz, "The Height of Tropical Cyclones and of the 'Eye' of theStorm," Monthly Weather Review, vol. 63, No. 2, Feb. 1935, pp.45-49.
2. H. Hawkins, F. Christensen, S. Pearce, and Staff, NHRP, "Inventory, Useand Availability of NHRP Meteorological Data Gathered by Aircraft, " NHRPReport No. 52, 1962.
3. D. Hilleary and F. Christensen, "Instrumentation of the National HurricaneResearch Project Aircraft," National Hurricane Research Project ReportNo.11, August 1957, 71 pp.
4. N. LaSeur, H. Hawkins and Staff, NHRP, "A Study of Hurricane Cleo, 1958,"(forthcoming report, NHRP).
5. B. Miller, "The Three-Dimensional Wind Structure Around a Tropical Cyclone J'National Hurricane Research Project Report No. 15, Jan. 1958, kl pp.
6. E. Jordan, "An Observational Study of the Upper Wind-Circulation AroundTropical Storms," Journal of Meteorology, vol. 9, No. 5, Oct. 1952, pp.31*0-3^6.
7. L. Hughes, "On the Low-Level Wind Structure of Tropical Storms," Journalof Meteorology, vol. 9, No. 6, Dec. 1952, pp. 422-428.
8. C. L. Jordan and L. E. Fortner, Jr., "Estimation of Surface Wind Speeds inTropical Cyclones, " Bulletin of the American Meteorological Society, vol.4l, No. 1, Jan. i960, pp. 9-13.
9. .V. A. Myers, "Characteristics of United States Hurricanes Pertinent to•Levee Design for Lake Okeechobee, Florida," Hydrometeorological ReportNO. 32, U. S. Weather Bureau and U. S. Army, Corps of Engineers, March1954, 106 pp.
10. R. Fletcher, "Computation of Maximum Surface Winds in Hurricanes,"Bulletin of the American Meteorological Society, vol. 36, No. 6, June1955, PP. 247-250.
11. V. Myers, "Maximum Hurricane Winds," Correspondence, Bulletin of theAmerican Meteorological Society,vol. 38, No. k, Apr. 1957, pp. 227-228.
12. C. L. Jordan, D. A. Hurt, and C. A. Lowrey, "On the Structure 'of HurricaneDaisy on 27 August 1958," Journal of Meteorology, vol. 17, No. 3, June i960,PP. 337-348.