National Grid 2021-2023 Energy Efficiency Plan DRAFT
80
The Narragansett Electric Company d/b/a National Grid National Grid 2021-2023 Energy Efficiency Plan DRAFT June 11, 2020 RIPUC Docket No. XXXX Submitted to: Rhode Island Public Utilities Commission Submitted by:
Transcript of National Grid 2021-2023 Energy Efficiency Plan DRAFT
The Narragansett Electric Company
d/b/a National Grid
National Grid 2021-2023
Energy Efficiency Plan
DRAFT
June 11, 2020
RIPUC Docket No. XXXX
Submitted to:
Rhode Island Public Utilities Commission
Submitted by:
Contents 1 Pre-Filed Testimony .............................................................................................................................. 1
2 Executive Summary ............................................................................................................................... 2
3 Introduction .......................................................................................................................................... 5
3.1 Three-Year Plan Development and Stakeholder Process ............................................................. 6
3.2 Purpose and Benefits of Energy Efficiency ................................................................................... 7
3.2.1 Benefits Expected to Accrue from Three-Year Plan .............................................................. 8
3.3 Purpose of the Three-Year Plan .................................................................................................. 11
3.4 Least-Cost Procurement Law and Standards .............................................................................. 12
3.4.1 Prudency ............................................................................................................................. 13
3.4.2 Reliability ............................................................................................................................. 13
3.4.3 Environmentally Responsible .............................................................................................. 13
3.4.4 Cost Effective ...................................................................................................................... 14
3.4.5 Cost of Supply ..................................................................................................................... 14
4 Priorities .............................................................................................................................................. 14
4.1 Strategic Overview of Programs and Priorities ........................................................................... 14
4.2 Commercial & Industrial Programs ............................................................................................. 17
4.2.1 Deepen Customer Relationships and Increase Participation Across All Customers ........... 18
4.2.2 Drive Comprehensive Measure Adoption with Tailored Program Enhancements ............. 22
4.2.3 Drive Comprehensive Measure Adoption with Technology-Based Opportunities ............. 24
4.2.4 Expand Active Demand Response ....................................................................................... 25
4.2.5 Explore Cutting-Edge Technologies .................................................................................... 26
4.3 Residential & Income Eligible Services Programs ....................................................................... 27
4.3.1 Deepen Customer Relationships and Increase Participation Across All Customers ........... 28
4.3.2 Drive Comprehensive Measure Adoption Through Tailored Program Enhancements ...... 30
4.3.3 Drive Comprehensive Measure Adoption with Technology-Based Opportunities ............. 32
4.3.4 Expand Active Demand Response ....................................................................................... 32
4.4 Cross-Cutting Programs .............................................................................................................. 33
4.5 Multi-Year Strategies .................................................................................................................. 35
5 Savings Goals and Potential ................................................................................................................ 36
5.1 EERMC Three-Year Savings Targets ............................................................................................ 36

5.1.1 How the Potential Study informed Goals ........................................................................... 37
5.1.2 Quantitative Savings Goals ................................................................................................. 38
5.1.3 Annual Plans ........................................................................................................................ 41
6 Funding Plan ........................................................................................................................................ 42
7 Cost Effectiveness ............................................................................................................................... 43
7.1 RI Test .......................................................................................................................................... 43
7.2 Comparison of TRC Test to RI Test .............................................................................................. 44
7.3 Cost of Supply ............................................................................................................................. 45
7.4 Environmentally Responsible ...................................................................................................... 48
7.4.1 Greenhouse Gas Reduction Values ..................................................................................... 48
8 Rate and Bill Impacts ........................................................................................................................... 48
9 Pilots, Demonstrations, and Assessments .......................................................................................... 49
9.1 Process to Identify and Develop Potential New Measures, Approaches, and Solutions ............ 49
9.2 Regional Collaboration to Assess Potential New Measures, Approaches, and Solutions .......... 51
9.3 Ongoing Pilots, Demonstrations, Assessments ........................................................................... 52
9.4 Anticipated Areas of Exploration for Future Pilots, Demonstrations, Assessments ................... 52
9.4.1 Residential, Multifamily, and Income Eligible Areas of Exploration ................................... 52
9.4.2 Commercial & Industrial Areas of Exploration .................................................................... 53
10 Evaluation Measurement and Verification ..................................................................................... 53
10.1 EM&V Process and Outlook for the Next Three Years ................................................................ 53
10.2 EM&V Studies Influencing Savings and Programs in the Three-Year Plan ................................. 53
11 Performance Incentive Plan ............................................................................................................ 57
11.1 Proposed Performance Incentive ............................................................................................... 57
11.2 Stakeholder Engagement ............................................................................................................ 57
12 Coordination with Other Energy Policies, Programs, and Dockets ................................................. 57
12.1 Heating Sector Transformation ................................................................................................... 57
12.2 Heat Pump and Delivered Fuel Policy and Objectives ................................................................ 58
12.2.1 Heat Pump Implementation, and Education ...................................................................... 58
12.2.2 Delivered Fuels .................................................................................................................... 58
12.3 Power Sector Transformation ..................................................................................................... 58
12.3.1 Advanced Metering Functionality and Grid Modernization ............................................... 59
12.4 Rate Cases ................................................................................................................................... 59
12.5 System Reliability Procurement and Infrastructure, Safety and Reliability ................................ 60
12.6 Integration with Renewables ...................................................................................................... 60
12.7 Codes and Standards Program and Accounting for New Codes and Standards ......................... 60
13 Timeline ........................................................................................................................................... 61
13.1 Annual Plan Development Schedule ........................................................................................... 61
13.2 Triennial and Annual Plan Development Process ....................................................................... 61
14 Conclusion and Requested Rulings ................................................................................................. 63
Attachments ................................................................................................................................................ 64
Attachment 1. Energy Efficiency Funding Plans...................................................................................... 64
Attachment 2. Program Level Benefit Cost Summary ............................................................................ 67
Attachment 3. Definitions ....................................................................................................................... 73

1
1 Pre-Filed Testimony The Company will pre-file testimony with the final Three-Year Plan that addresses the cost-effectiveness
of the Plan, prudency, reliability, environmental responsibility, and the cost of additional supply
compared to the cost of the Plan. Pre-filed testimony will also specify the energy efficiency and
conservation procurement items of which the Company seeks PUC approval. Pre-Filed Testimony will be
part of the final version of the Thee-Year Plan, not included in this draft.
2
2 Executive Summary In accordance with R.I. Gen. Laws § 39-1-27.7(c)(4) and the Least Cost Procurement Standards (LCP
Standards or Standards) set by the Rhode Island Public Utilities Commission (Commission or PUC), The
Narragansett Electric Company d/b/a National Grid (National Grid or the Company) submits this Draft
2021-2023 Three-Year Energy Efficiency and Conservation Procurement Plan (Draft Three-Year Plan or
Draft Plan). The Draft Three-Year Plan establishes an overarching strategy for the next three years that
will enable the Company to successfully meet the goal of Least Cost Procurement (LCP) which is to meet
the state’s electrical and natural gas energy needs in a manner that is cost effective, reliable, prudent,
and environmentally responsible.
This Draft Three-Year Plan is delivered in the context of rapidly changing energy and economic
landscapes, change that is being exacerbated by the ongoing global pandemic. For Rhode Island to
remain a national leader in energy efficiency, and the benefits that that brings to Rhode Island residents,
National Grid must innovate by creating new models that balance the goal of increasing the breadth and
depth of the portfolio’s reach with the need to maintain a commitment to reasonable and prudent rates
for residential and business consumers, many of whom are facing unprecedented economic challenges
as a result of the COVID-19 pandemic. Because the low-cost savings that lighting programs have
historically provided will no longer be a significant driver of savings or cornerstone of the portfolio, the
Company must now go deeper and broader to secure the next unit of efficiency. This means
encouraging continuous, multi-year engagement that increases opportunities for comprehensive savings
through installation of multiple efficiency measures, including new and cutting-edge technologies. Over
the next three years, National Grid will identify, test, and begin to scale new ways of achieving energy
savings. Newer technologies and integrated systems come with significant product, design, and training
costs, even as the lower incremental savings constrain incentive budgets. While the cost to achieve
savings will therefore increase, the Company will continue to deliver cost effective programs that remain
less expensive than supply. The effects of the COVID-19 pandemic will likely also compound the pressure
on program delivery costs. The Company is committed, both in its immediate response and in its multi-
year planning, to supporting and growing an energy efficiency workforce while adapting to the impacts
and continuing uncertainties that delivery partners, workforce, and customers are experiencing.
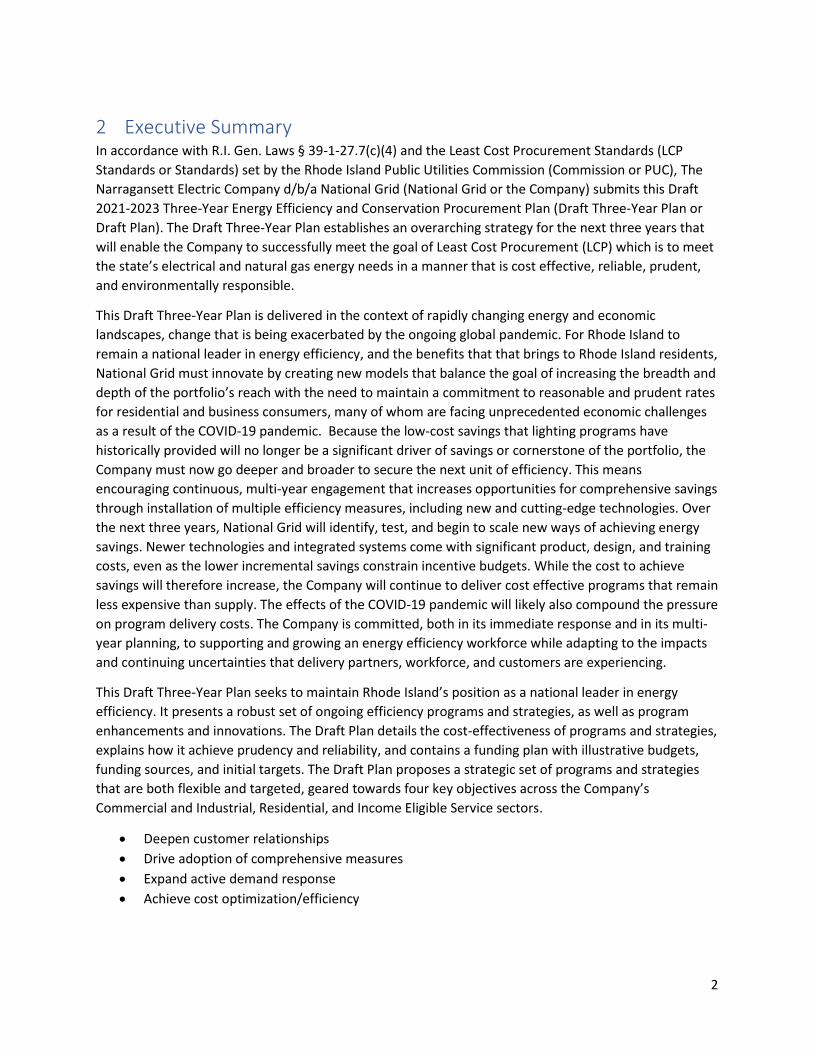
This Draft Three-Year Plan seeks to maintain Rhode Island’s position as a national leader in energy
efficiency. It presents a robust set of ongoing efficiency programs and strategies, as well as program
enhancements and innovations. The Draft Plan details the cost-effectiveness of programs and strategies,
explains how it achieve prudency and reliability, and contains a funding plan with illustrative budgets,
funding sources, and initial targets. The Draft Plan proposes a strategic set of programs and strategies
that are both flexible and targeted, geared towards four key objectives across the Company’s
Commercial and Industrial, Residential, and Income Eligible Service sectors.
• Deepen customer relationships
• Drive adoption of comprehensive measures
• Expand active demand response
• Achieve cost optimization/efficiency

3
Earlier this year, the Rhode Island Energy Efficiency & Resource Management Council (EERMC or
Council) presented Proposed Energy Savings Targets (Targets) to PUC. The PUC approved the EERMC’s
Targets for 2021-2023, except for the proposed delivered fuels targets. The approved Targets represent
maximum program achievable potential as outlined in the 2020 Rhode Island Energy Efficiency Market
Potential Study (Market Potential Study), which represents the most detailed assessment of the energy
efficiency potential in the state in approximately ten years. The Draft Plan takes into consideration
these Targets.1 In addition, this Draft Three-Year Plan was developed with the Technical Working Group
(TWG), a collection of entities that have historically joined the Company in settlements for the
Company’s Annual Plans. The Company engages the TWG throughout the planning process to leverage
their expertise and seek their feedback. In early 2020, TWG members were asked to identify their
priorities for the Three-Year Plan, and the Company has incorporated their priorities into many
components of this draft. TWG members also previewed and provided input on key themes and major
changes in a Plan Outline Memorandum circulated in April 2020, before this Draft Three-Year Plan was
developed. TWG members are listed in Section 3.1. The Company looks forward to continued
engagement as the Draft Plan is reviewed and further refined with input from stakeholders and
anticipates submission of a final Three-Year Plan to the PUC for approval with the support of
stakeholders in September.
The Company will use the final Three-Year Plan as a roadmap for development of the more detailed
Energy Efficiency Program Plans for 2021, 2022, and 2023 (Annual Plans). The level of detail across this
Draft Plan varies, as some elements are more conceptual in nature at this juncture. Full detail will be
provided in subsequent Annual Plans.
The illustrative savings goal in the Draft Three-Year Plan will result in significant benefits to electric and
gas customers, the Rhode Island economy, and the environment. The Draft Three-Year Plan will create
cumulative annual savings of 419,418 MWh (electric) and 1,319,240 MMBtu (natural gas) and lifetime
savings of 15,122,722 MWh (electric) and 15,122,722 MMBtu (natural gas). Achieving these targets will
generate benefits of more than $2.21 billion over the life of the measures, with $1.74 billion in benefits
coming from electric efficiency and $0.47 billion in benefits from natural gas efficiency. This will deliver
tremendous value for residential, commercial, industrial, and income eligible energy customers.
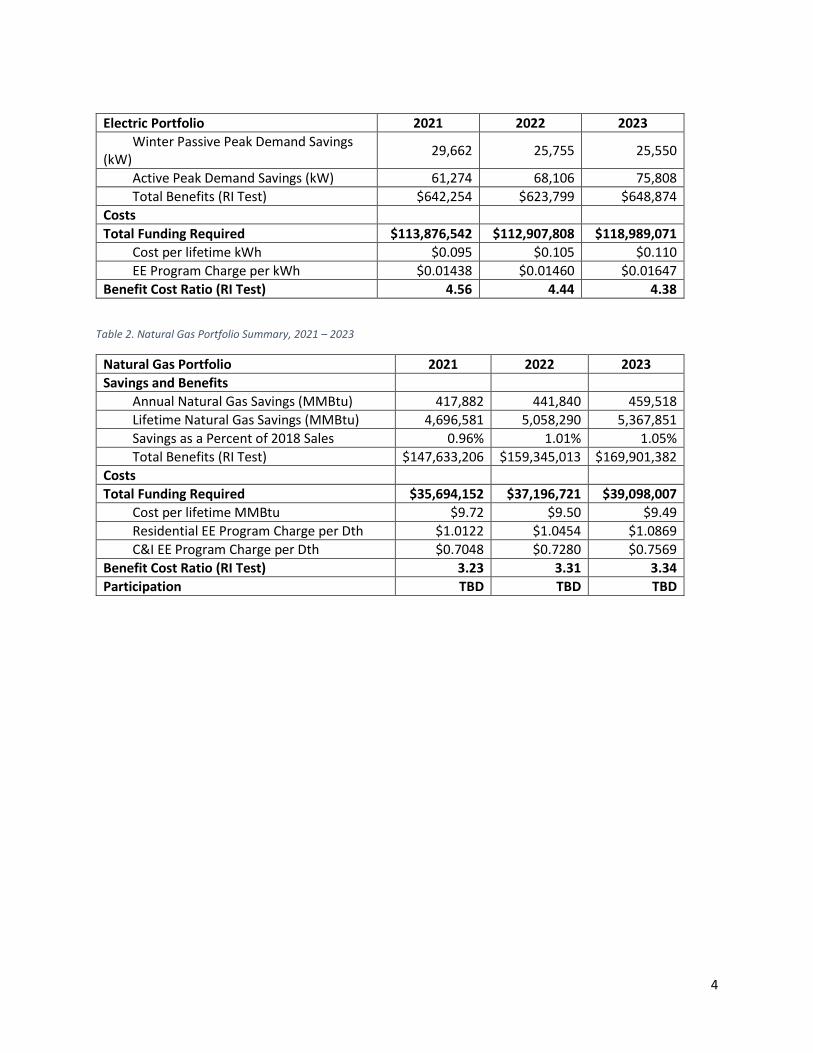
The following tables summarize illustrative benefits, and costs proposed in this Draft Three-Year Plan.
Table 1. Electric Portfolio Summary, 2021 – 2023
Electric Portfolio 2021 2022 2023
Savings and Benefits
Annual Electric Savings (MWh) 153,917 133,337 132,164
Lifetime Electric Savings (MWh) 1,486,653 1,336,726 1,343,448
Savings as a Percent of Sales 2.10% 1.82% 1.80%
Summer Passive Peak Demand Savings (kW)
25,070 22,298 21,908
1 The PUC acknowledged these Targets represent high goal posts for what is potentially achievable with efficiency programs, not accounting for other constraints, and that the Targets did not account for prudency and reliability, which are requirements the Company must demonstrate in its plans.
4
Electric Portfolio 2021 2022 2023
Winter Passive Peak Demand Savings (kW)
29,662 25,755 25,550
Active Peak Demand Savings (kW) 61,274 68,106 75,808
Total Benefits (RI Test) $642,254 $623,799 $648,874
Costs
Total Funding Required $113,876,542 $112,907,808 $118,989,071
Cost per lifetime kWh $0.095 $0.105 $0.110
EE Program Charge per kWh $0.01438 $0.01460 $0.01647
Benefit Cost Ratio (RI Test) 4.56 4.44 4.38
Table 2. Natural Gas Portfolio Summary, 2021 – 2023
Natural Gas Portfolio 2021 2022 2023
Savings and Benefits
Annual Natural Gas Savings (MMBtu) 417,882 441,840 459,518
Lifetime Natural Gas Savings (MMBtu) 4,696,581 5,058,290 5,367,851
Savings as a Percent of 2018 Sales 0.96% 1.01% 1.05%
Total Benefits (RI Test) $147,633,206 $159,345,013 $169,901,382
Costs
Total Funding Required $35,694,152 $37,196,721 $39,098,007
Cost per lifetime MMBtu $9.72 $9.50 $9.49
Residential EE Program Charge per Dth $1.0122 $1.0454 $1.0869
C&I EE Program Charge per Dth $0.7048 $0.7280 $0.7569
Benefit Cost Ratio (RI Test) 3.23 3.31 3.34
Participation TBD TBD TBD

5
3 Introduction The Draft 2021-2023 Three-Year Energy Efficiency and Conservation Procurement Plan (Draft Three-Year
Plan or Draft Plan) is the fifth triennial plan submitted by The Narragansett Electric Company d/b/a
National Grid (National Grid or the Company). In Docket 5023 the Rhode Island Public Utilities
Commission (Commission or PUC) approved the Rhode Island Energy Efficiency & Resource
Management Council’s (EERMC or Council) Proposed Energy Efficiency Savings Targets (Targets) for
2021-2023, with the exception of the proposed delivered fuels targets.2 These Targets reflect the most
ambitious three-year performance targets of the options explored by the EERMC and PUC and will
inform the Company’s programs, strategies, and associated budgets through 2023.
The Company’s goals in 2021, 2022, and 2023 are lower than the Commission approved Targets in
Docket 5023 due to the application of additional analysis of constraints in the available energy efficiency
marketplace that were not applied by the EERMC in defining their Targets. The Company will review
available technologies, programs, evaluation results and strategies with the EERMC and Technical
Working Group in subsequent Annual Plans in order to achieve our commitment to delivering cost-
effective energy savings that are potentially achievable through Least-Cost Procurement as set forth in
statute.3 The Draft Three-Year Plan is consistent with the revised Least-Cost Procurement Standards as
approved in Docket 4684.4
Table 3. 2021-2023 Docket 5023 Electric Energy Targets and Three-Year Plan Proposed Electric Energy Goals5
Ref Electric Energy 2021 2022 2023
a Docket 5023 Electric Energy Targets (Lifetime MWh) 1,949,782 2,037,314 2,059,265
b Docket 5023 Electric Energy CHP Targets (Lifetime MWh)6
723,337 723,337 723,337
c Docket 5023 Electric Energy Total (Lifetime MWh) (a + b)
2,673,119 2,760,651 2,782,602
d 3YP Electric Energy Goal (Lifetime MWh) 1,377,193 1,227,266 1,233,988
e 3YP CHP Energy Goal (Lifetime MWh) 109,460 109,460 109,460
f 3YP Electric Goals Total (Lifetime MWh) 1,486,653 1,336,726 1,343,448
g Difference (f – c) -1,186,466 -1,423,925 -1,439,154
h Docket 5023 Electric Energy Targets (Annual MWh) 182,299 187,378 171,353
i Docket 5023 Electric Energy CHP Targets (Annual MWh) 45,209 45,209 45,209
j Docket 5023 Electric Energy Total (Annual MWh) (h + i) 227,508 232,587 216,562
2 RI PUC Docket 5023. Targets approved at an Open Meeting on May 8, 2020. http://www.ripuc.ri.gov/eventsactions/docket/5023page.html 3 R.I. Gen. Laws §39-1-27.7 4 At the time of this draft plan, the PUC has not finalized revisions to the LCP Standards in Docket 5015. 5 The RI PUC approved Targets in lifetime savings units. The equivalent annual savings units from the Market Potential Study “Max Scenario” that is the source of the Targets are shown for comparability with prior Plans that used annual units. 6 The approved targets also included 11.1 MW of annual peak demand reduction from CHP for each year of 2021 - 2023. Not shown in this table.

6
Ref Electric Energy 2021 2022 2023
k 3YP Electric Energy Goal (Annual MWh) 148,444 127,864 126,691
l 3YP CHP Energy Goal (Annual MWh) 5,473 5,473 5,473
m 3YP Electric Goals Total (Annual MWh) (k + l) 153,917 133,337 132,164
n Difference (m – j) -73,591 -99,250 -84,398
Table 4. 2021-2023 Docket 5023 Natural Energy Targets and Three-Year Plan Proposed Natural Gas Energy Goals7
Ref Natural Gas Energy 2021 2022 2023
a Docket 5023 Natural Gas Targets (Lifetime MMBtu) 9,598,108 9,948,779 9,958,127
b 3YP Natural Gas Goals (Lifetime MMBtu) 4,696,581 5,058,290 5,367,851
c Difference (b – a) -4,901,527 -4,890,489 -4,590,276
d Docket 5023 Natural Gas Targets (Annual MMBtu) 749,344 770,569 787,805
e 3YP Natural Gas Goals (Annual MMBtu) 417,882 441,840 459,518
f Difference (e – d) -331,462 -328,729 -328,287
Table 5. 2021-2023 Docket 5023 Peak Demand Reduction Targets and Three-Year Plan Proposed Peak Demand Reduction Goals
Ref Electric Peak Demand 2021 2022 2023
a Docket 5023 Energy Efficiency Passive Peak Demand Reduction Target (Annual MW)
30.8 33.2 33.5
b Docket 5023 CHP Peak Demand Reduction Target (Annual MW) 11.1 11.1 11.1
c Docket 5023 Total Energy Efficiency Passive Peak and CHP Demand Reduction Target (Annual MW) (a +b)
41.9 44.3 44.6
d 3YP Energy Efficiency Passive Peak Demand Reduction Goal (Annual MW) 24.4 21.7 21.3
e 3YP CHP Passive Peak Demand Reduction Goal Total (Annual MW) 0.6 0.6 0.6
f 3YP Energy Efficiency Passive Peak Demand Reduction Goal Total (Annual MW) (d + e)
25.1 22.3 21.9
g Difference (f – c) -16.8 -22.0 -22.7
h Docket 5023 Active Demand Response Peak Demand Reduction (Annual MW) 33.9 52.7 74.5
I 3YP Active Peak Demand Reduction Goal (Annual MW) 61.3 68.1 75.8
j Difference (i – h) 27.4 15.4 1.3
3.1 Three-Year Plan Development and Stakeholder Process National Grid is required to procure energy efficiency in Rhode Island. The Comprehensive Energy
Conservation, Efficiency and Affordability Act of 2006 established a statutory basis for Least-Cost
Procurement, which sets standards and guidelines for Three-Year and Annual Energy Efficiency and
Conservation Procurement Plans. Since 2009, the savings resulting from the Company’s plans have
established Rhode Island as a national leader, coming in third in the latest American Council for an
Energy-Efficient Economy (ACEEE) state ranking of energy efficiency.
7 The RI PUC approved Targets in lifetime savings units. The equivalent annual savings units from the Market Potential Study “Max Scenario” that is the source of the Targets are shown for comparability with prior Plans that used annual units.
7
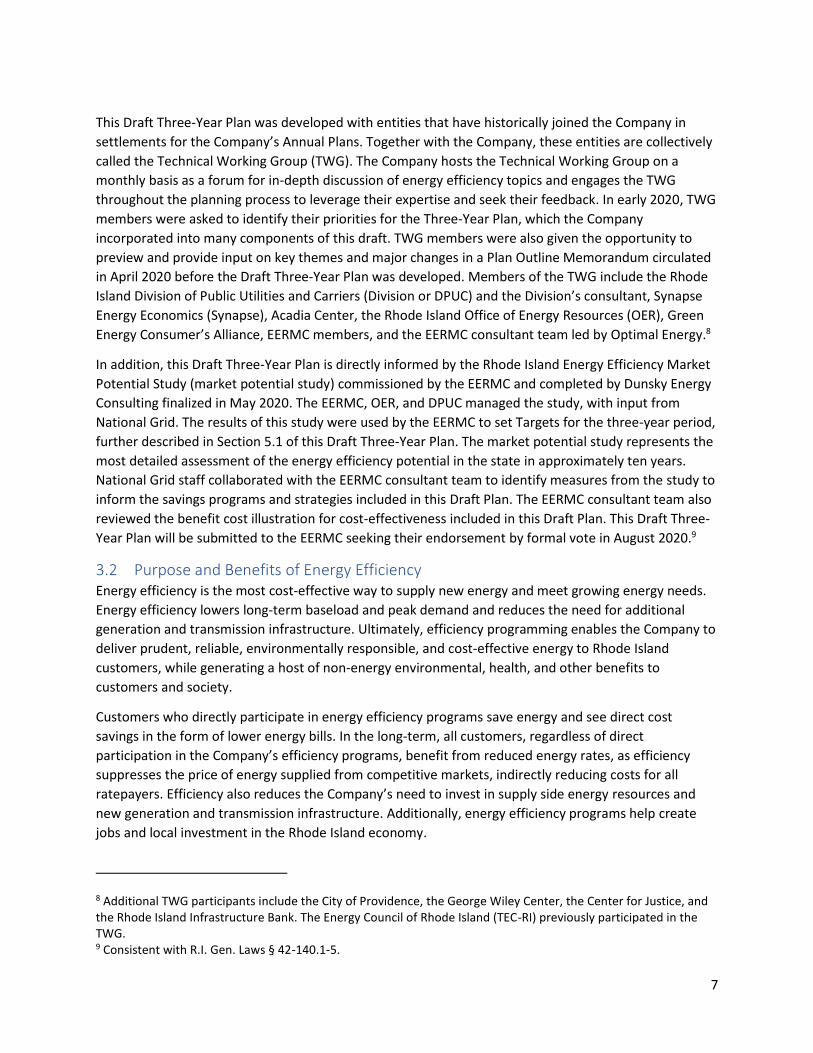
This Draft Three-Year Plan was developed with entities that have historically joined the Company in
settlements for the Company’s Annual Plans. Together with the Company, these entities are collectively
called the Technical Working Group (TWG). The Company hosts the Technical Working Group on a
monthly basis as a forum for in-depth discussion of energy efficiency topics and engages the TWG
throughout the planning process to leverage their expertise and seek their feedback. In early 2020, TWG
members were asked to identify their priorities for the Three-Year Plan, which the Company
incorporated into many components of this draft. TWG members were also given the opportunity to
preview and provide input on key themes and major changes in a Plan Outline Memorandum circulated
in April 2020 before the Draft Three-Year Plan was developed. Members of the TWG include the Rhode
Island Division of Public Utilities and Carriers (Division or DPUC) and the Division’s consultant, Synapse
Energy Economics (Synapse), Acadia Center, the Rhode Island Office of Energy Resources (OER), Green
Energy Consumer’s Alliance, EERMC members, and the EERMC consultant team led by Optimal Energy.8
In addition, this Draft Three-Year Plan is directly informed by the Rhode Island Energy Efficiency Market
Potential Study (market potential study) commissioned by the EERMC and completed by Dunsky Energy
Consulting finalized in May 2020. The EERMC, OER, and DPUC managed the study, with input from
National Grid. The results of this study were used by the EERMC to set Targets for the three-year period,
further described in Section 5.1 of this Draft Three-Year Plan. The market potential study represents the
most detailed assessment of the energy efficiency potential in the state in approximately ten years.
National Grid staff collaborated with the EERMC consultant team to identify measures from the study to
inform the savings programs and strategies included in this Draft Plan. The EERMC consultant team also
reviewed the benefit cost illustration for cost-effectiveness included in this Draft Plan. This Draft Three-
Year Plan will be submitted to the EERMC seeking their endorsement by formal vote in August 2020.9
3.2 Purpose and Benefits of Energy Efficiency Energy efficiency is the most cost-effective way to supply new energy and meet growing energy needs.
Energy efficiency lowers long-term baseload and peak demand and reduces the need for additional
generation and transmission infrastructure. Ultimately, efficiency programming enables the Company to
deliver prudent, reliable, environmentally responsible, and cost-effective energy to Rhode Island
customers, while generating a host of non-energy environmental, health, and other benefits to
customers and society.
Customers who directly participate in energy efficiency programs save energy and see direct cost
savings in the form of lower energy bills. In the long-term, all customers, regardless of direct
participation in the Company’s efficiency programs, benefit from reduced energy rates, as efficiency
suppresses the price of energy supplied from competitive markets, indirectly reducing costs for all
ratepayers. Efficiency also reduces the Company’s need to invest in supply side energy resources and
new generation and transmission infrastructure. Additionally, energy efficiency programs help create
jobs and local investment in the Rhode Island economy.
8 Additional TWG participants include the City of Providence, the George Wiley Center, the Center for Justice, and the Rhode Island Infrastructure Bank. The Energy Council of Rhode Island (TEC-RI) previously participated in the TWG. 9 Consistent with R.I. Gen. Laws § 42-140.1-5.

8
Energy efficiency also generates a number of positive non-energy impacts, including environmental and
health benefits, for both participants and society. Environmental benefits include greenhouse gas
reductions from avoided carbon dioxide emissions and improved air quality from reduced nitrogen oxide
(NOX), found in smog and other dangerous particulates. Customers participating in energy efficiency
programs gain increased comfort and health from warmer, drier, and property ventilated homes and
businesses, lowering the risk of mold growth and illness, as well as improved property values compared
to standard homes or businesses.
3.2.1 Benefits Expected to Accrue from Three-Year Plan The illustrative savings targets in this Draft Three-Year Plan will result in significant benefits to electric
and gas customers, the Rhode Island economy, and the environment. The Draft Three-Year Plan will
create cumulative annual savings of 419,418 MWh and 1,319,240 MMBtu and lifetime savings of
4,166,827 MWh and 15,122,722 MMBtu. Achieving these targets will generate benefits of more than
$2.21 billion over the life of the measures (with $1.74 billion in benefits coming from electric efficiency
and $ 0.476 billion in benefits from natural gas efficiency), delivering tremendous value for residential,
commercial, industrial, and income eligible energy customers. Figure 1 shows the net benefits of energy
efficiency program years since 2009, with projected net benefits from this Three-Year Plan.

9
Figure 1. Net Benefits of Energy Efficiency Plans10
As detailed in Table 6 and Table 7, from 2009 to 2019, the Company served 5,163,499 electric program
participants,11 resulting in cumulative annual electric savings of 1,871,538 MWh and cumulative lifetime
savings of 19,207,318 MWh at an average cost of $0.038 per lifetime kWh saved. The Company also
served 969,609 gas participants,12 resulting in cumulative annual natural gas savings of 3,659,731
MMBtu, and cumulative lifetime savings of 45,156,570 MMBtu at an average cost of $4.10 per lifetime
MMBtu.
10 Net benefits calculated as total benefits – program implementation expenses. 11 Electric participation is aggregate and includes repeat participation by individual customers. Annual Reports include a participation analysis that details unique cumulative participation since 2012. 12 Gas participation is aggregate and includes repeat participation by individual customers. Annual Reports include a participation analysis that details unique cumulative participation since 2012.
$-
$100
$200
$300
$400
$500
$600
$700
Ne
t B
en
efi
ts (
$ m
illio
n)
Gas
Electric

10
Table 6. Summary of 2009-2019 Electric Energy Efficiency Plans
Year Annual MWh
Savings
Lifetime MWh Savings
Total Benefits ($000)
Total Spending*
($000)
TRC BC Ratio**
RI Test BC Ratio
(1)
EE Program Charge/kWh
$ per lifetime kwh***
Participants
2009 81,543 899,331 $123,045 $29,536 3.02 $0.0032 $0.027 106,525
2010 81,275 929,242 $128,864 $29,712 3.73 $0.0032 $0.027 153,611
2011 96,009 1,076,778 $151,542 $39,308 3.35 $0.00526 $0.031 254,747
2012 119,666 1,288,325 $140,104 $50,719 2.24 $0.00589 $0.036 201,351
2013 159,035 1,612,371 $192,418 $72,875 2.24 $0.00862 $0.039 470,245
2014 268,468 3,278,088 $314,673 $80,321 2.69 $0.00911 $0.041 551,882
2015 222,822 2,287,785 $312,000 $82,897 2.38 $0.00942 $0.036 622,822
2016 214,329 2,034,220 $234,234 $74,274 2.16 $0.01077 $0.034 758,284
2017 232,023 2,327,916 $249,986 $90,012 1.91 $0.01124 $0.039 687,141
2018 206,209 1,848,845 $369,835 $88,123 2.99 $0.00972 $0.048 688,471
2019 190,159 1,624,417 $489,299 $104,620 3.43 $0.01121 $0.064 668,420
*Total Spending includes implementation, evaluation, commitments, EERMC, and OER. Does not include customer contribution or shareholder incentive. **TRC Benefit/Cost Ratio = Benefits/(Implementation Expenses + Customer Contribution + Evaluation Cost + Shareholder Incentives). ***Implementation costs/Lifetime savings **** December 2011 PUC voted to increase gas EE Program charge to $0.411/Dth. (1) RI Test Benefit/Cost Ratio = (Energy + Capacity + Resource Benefits + Economic Benefits + Carbon Benefits + NOx Benefits) / (Program Implementation + Customer Contribution + Shareholder Incentive) (2) B/C Ratio changed from TRC to RI Test from 2018 onwards
Table 7. Summary of 2009-2019 Natural Gas Energy Efficiency Plans
Year Annual MMBtu Savings
Lifetime MMBtu Savings
Total Benefits ($000)
Total Spending* ($000)
TRC BC Ratio**
RI Test BC Ratio (1)
EE Program Charge/Dth $ per lifetime MMBtu***
Participants
2009 195,200 2,553,828 $26,071 $6,552 2.83 $0.150 $2.44 8,339
2010 140,097 2,155,112 $26,309 $5,496 2.31 $0.150 $2.33 5,670
2011 119,613 1,623,922 $18,196 $4,868 2.21 $0.150 ****$0.411 $2.73 3,080
2012 229,811 3,300,583 $36,237 $13,310 1.68 $0.384 $3.72 11,681
2013 311,585 4,377,672 $44,747 $19,501 1.78 $0.414 $4.21 135,646
2014 409,029 5,958,381 $50,417 $20,034 2.41 $0.600 (Resi) $0.492 (C&I) $3.84 143,655
2015 419,778 5,249,170 $54,762 $20,129 2.60 $0.781 (Resi) $0.637 (C&I) $3.47 146,098
2016 417,820 5,282,221 $51,103 $23,135 1.93 $0.748 (Resi) $0.487 (C&I) $4.78 150,160
2017 468,211 4,615,034 $70,972 $27,513 1.86 $0.888 (Resi) $0.726 (C&I) $5.96 112,202
2018 497,119 5,513,499 $113,117 $27,231 3.11 $0.869 (Resi) $0.671 (C&I) $4.94 101,423
2019 451,466 4,527,147 $115,736 $30,142 2.66 $0.715 (Resi) $0.420 (C&I) $6.66 151,655
*Total Spending includes implementation, evaluation, commitments, EERMC, and OER. Does not include customer contribution or shareholder incentive. **TRC Benefit/Cost Ratio = Benefits/(Implementation Expenses + Customer Contribution + Evaluation Cost + Shareholder Incentives). ***Implementation costs/Lifetime savings **** December 2011 PUC voted to increase gas EE Program charge to $0.411/Dth. (1) RI Test Benefit/Cost Ratio = (Energy + Capacity + Resource Benefits + Economic Benefits + Carbon Benefits + NOx Benefits) / (Program Implementation + Customer Contribution + Shareholder Incentive) (2) B/C Ratio changed from TRC to RI Test from 2018 onwards

11
The energy efficiency strategies described in this Draft Three-Year Plan will also contribute to Rhode
Island’s greenhouse gas reduction goals. The energy savings resulting from this Draft Plan will avoid
2,943,099 million tons of carbon dioxide over the lifetime of the installed efficiency measures.13
Additionally, this Draft Three-Year Plan will provide additional significant economic benefits.
Investments made in energy efficiency under the Draft Three-Year Plan are expected to generate
approximately $980.8 million to Rhode Island’s.14
In sum, the benefits of the Company’s implemented energy efficiency programming far outweigh the
costs, providing significant cost-savings to Rhode Island electric and natural gas customers. In 2020, the
Company’s savings trajectory has been impacted by the COVID-19 pandemic, which has touched all
segments of the economy and necessitated a pause in some energy efficiency program implementation.
Achievement of planned 2020 savings is likely to be negatively impacted by this significant and
unanticipated situation.15 In spite of such obstacles, the Company appreciates the opportunity to
continue working with the PUC, the TWG, and the EERMC to deliver nation-leading cost-effective energy
savings over the next three years and meet growing customer demand for energy efficiency programs
and services.
3.3 Purpose of the Three-Year Plan The Draft Three-Year Plan establishes the Company’s overarching strategy for “meeting electrical and
natural gas energy needs in a manner that is optimally cost-effective, reliable, prudent and
environmentally responsible,” in compliance with statutory and regulatory requirements. National Grid
as a Rhode Island distribution utility is required to procure energy efficiency by the Comprehensive
Energy Conservation, Efficiency and Affordability Act of 2006. The Least-Cost Procurement Standards,
revised triennially, provide guidelines for the Three-Year Energy Efficiency and Conservation
Procurement Plan.16
This Draft Three-Year Plan details a robust set of ongoing efficiency programs and strategies, as well as
aggressive program enhancements and innovations that will continue to deliver energy savings and
other benefits for Rhode Island energy consumers. The strategies outlined in this document are
designed to ensure Rhode Island maintains its leadership position among the top three states for energy
efficiency nationally, while balancing a commitment to reasonable and prudent rates for residential and
business consumers. As such, the Draft Three-Year Plan also describes the cost-effectiveness of
programs and strategies, describes how the Draft Plan achieves prudency and reliability, contains a
funding plan with illustrative budgets, funding sources and initial targets, and proposes a performance
incentive mechanism.
13 This includes the net impact of EE measures on carbon emissions. The marginal carbon emission rates are from “Avoided Energy Supply Components in New England: 2018 Report” Appendix K. pages 368-370. https://www.synapse-energy.com/sites/default/files/AESC-2018-17-080-Oct-ReRelease.pdf 14 Macroeconomic multipliers for the economic growth and job creation benefits of investing in cost-effective energy efficiency are derived from the “Review of RI Test and Proposed Methodology” prepared for National Grid by the Brattle Group on January 31, 2019 15 https://www.cdc.gov/coronavirus/2019-ncov/index.html 16 At the time of this draft, a revised set of LCP Standards is not finalized by the PUC in Docket 5015
12
While many of the programs and strategies contained in this Draft Three-Year Plan have a history of
market traction and delivered savings, this Draft Plan is distinct from the 2018-2020 Three-Year Plan in a
few key ways. While the loss of substantial annual savings from the saturation of the lighting market
began during the prior Three-Year Plan, this is even more so the case now, requiring the Company to
seek new opportunities to drive deeper savings. Consequently, this Draft Three-Year Plan has an intense
focus on building upon existing customer relationships to encourage comprehensive measures that
accrue greater savings over their lifetime. Additionally, cost control and efficiency is a key emphasis, as
these replacement measures will not deliver savings at costs comparable to lighting, while the Company
must continue to deliver energy efficiency to ratepayers at a reasonable cost.
The Draft Three-Year Plan also provides the Company with a roadmap for development of the more
detailed Energy Efficiency Program Plans for 2021, 2022, and 2023 (Annual Plans).17 Since Three-Year
Plans are illustrative and provisional, variances between Annual Plans and Three-Year Plans due to
changes in factors such as, but not limited to, legislative changes, sales forecasts, funding sources,
avoided costs, and evaluation results are expected. The Company will provide explanations for any
variances in its Annual Plan filings.
3.4 Least-Cost Procurement Law and Standards The Comprehensive Energy Conservation, Efficiency and Affordability Act of 2006 (Act) provides the
statutory basis for Least-Cost Procurement of energy efficiency and conservation resources and system
reliability in Rhode Island. Energy efficiency procurement includes “energy efficiency and energy
conservation measures that are prudent and reliable and when such measures are lower cost than
acquisition of additional supply, including supply for periods of high demand.”18 System reliability
procurement includes, but is not limited to, renewable energy resources, distributed generation,
targeted energy efficiency, direct load control, and demand response. These are the two main areas that
National Grid is authorized to work on under the Act. The Act requires the Company submit plans for
energy efficiency and conservation and system reliability procurement to the PUC on a triennial basis.19
Such plans must include “measurable goals and target percentages for each energy resource, pursuant
to standards established by the Commission, including efficiency, distributed generation, demand
response, combined heat and power, and renewables.”20
17 The Company will file the 2021 Annual Plan and 2021 SRP Report with the PUC by November 1, 2020. The Company will file the 2022 and 2023 Annual Plans and SRP Reports with the PUC by October 15, 2018 and October 15, 2019, respectively. 18 R.I. Gen. Laws § 39-1-27.7. 19 R.I. Gen. Laws § 39-1-27.7. 20 R.I. Gen. Laws § 39-1-27.7.

13
Figure 2. Relationship Between the Statutory Basis for Least-Cost Procurement Standards and the Company’s Procurement Plans
3.4.1 Prudency The Draft Three-Year Plan is based on assessments of achievable potential, with the savings contained in
the Draft Plan within the bounds of what is achievable. The Draft Three-Year Plan balances the
immediate costs and rate impacts of achieving near-term savings with goals that will provide savings and
benefits that will play out over the duration of the lives of the measures.
3.4.2 Reliability The programs developed under this Draft Three-Year Plan will continue to offer best-in-class strategies
and savings to customers, while introducing new implementation approaches and expanding the
Company’s existing programs to serve more customers. Existing programs that have significant
experience and traction in the market will be extended.
3.4.3 Environmentally Responsible The energy efficiency strategies described in the Draft Three-Year Plan will contribute to Rhode Island’s
greenhouse gas reduction goals, further detailed in Section 7.4.1. The electric and natural gas savings
Comprehensive Energy Conservation, Efficiency and Affordability Act of 2006 (RI Legislature)- Established statutory basis for Least-Cost Procurement in Rhode Island.
Least-Cost Procurement Standards (RI Public Utilities Commission) - Set standards and guidelines for Energy Efficiency and Conservation and System Reliability Procurement Plans.
- Approve three-year energy efficiency savings targets for each energy resource.
- Reviewed and amended triennially.
Three-Year & Annual Energy Efficiency and Conservation Procurement Plans (National Grid)- Describe the Company's three-year strategy and annual progress toward meeting energy savings targets in a manner that is prudent, reliable, environmentally responsible, cost-effective, and less than the cost of supply.
Three-Year System Reliability Procurement Plans (National Grid)- Describe planning principles and areas of focus for system reliability procurement for the three years of implementation. (Filed Separately)

14
resulting from this Draft Three-Year Plan will avoid 2.9 million tons of carbon dioxide over the lifetime of
the installed efficiency measures.21
3.4.4 Cost Effective The Company has determined the proposed investments in this Draft Three-Year Plan to be cost
effective using the RI Test, described in further detail in Section 7.1. In addition to cost-effectiveness per
the RI Test as required by the Standards, we also present and compare the results of the TRC test in
Section 7.2 to enable comparison with past plans.
3.4.5 Cost of Supply In accordance with the Standards, the Company assessed the cost of energy supply and the cost of
energy efficiency using all applicable costs enumerated in the Rhode Island Benefit Cost Framework
(Framework) approved by the PUC in Docket 4600-A and the RI Test as detailed in Attachment 4 of the
2020 Annual Plan. See Section 7.3 for additional detail on the calculation of the cost of supply and cost
of energy efficiency calculation.
4 Priorities
4.1 Strategic Overview of Programs and Priorities
The Draft 2021-2023 Three-Year Plan sets an ambitious agenda to continue to drive energy saving
benefits for Rhode Island commercial and residential consumers, while proposing new approaches to
meet the challenges of the rapidly changing energy landscape. The intentional transformation of the
lighting market with light-emitting diode (“LED”) technology is a signature achievement of the design
and implementation of prior Three-Year and Annual Plans. LED lighting moved quickly from an emerging
technology to rapid scale up, as the Company recognized this valuable opportunity for customers and
pushed for rapid adoption through multiple channels across the portfolio. The Company’s efficiency
programs drove this market transformation, . While some savings from high efficiency lighting are
expected through 2021, the Company anticipates a saturated market by 2022, at which point lighting
will no longer be a significant driver of savings or cornerstone of programs.
The low-cost electric energy savings opportunity presented by lighting is irreplaceable with other
measures in the portfolio. The Company’s focus has, by necessity, shifted to programs with leaner
savings and greater barriers, as well as customers who have been less inclined to pursue energy
efficiency to date. The cost to achieve savings will increase as subsequent offerings require much more
intense promotion, customer education, support, and higher incentives, amidst longer development
cycles. Newer technologies and integrated systems come with significant product, design, and training
costs, even as the lower incremental savings constrain incentive budgets. The Company must go deeper
and broader to secure the next unit of efficiency. This Draft Three-Year Plan reflects National Grid’s
planned efforts to identify, test, and begin to scale new ways of achieving the efficiency savings to make
up for savings growth lighting programs have delivered in recent years, while remaining cognizant of the
21 This includes the net impact of EE measures on carbon emissions. The marginal carbon emission rates are from “Avoided Energy Supply Components in New England: 2018 Report” Appendix K. pages 368-370. https://www.synapse-energy.com/sites/default/files/AESC-2018-17-080-Oct-ReRelease.pdf

15
heightened costs of such measures and the need to maintain reasonable rates for ratepayers. The
Company is committed to a comprehensive, multi-pronged portfolio that encourages continuous
engagement and continues to deliver great customer and community benefits while minimizing impact
on the customer surcharge.
In order for Rhode Island to remain a nationwide energy efficiency leader, National Grid must innovate
and create new models that increase the breadth and depth of the portfolio’s reach. This means
encouraging continuous, multi-year engagement that in turn increases opportunities for comprehensive
savings through installation of multiple efficiency measures, including new and cutting-edge
technologies. To meet this challenge, National Grid proposes a strategic set of programs and strategies
that are both flexible and targeted, grouped by key themes across the Company’s Commercial and
Industrial, Residential, and Income Eligible Service sectors. This Draft-Three Year Plan is designed with
the first year including intensive planning and testing of program refinements and innovations.
This starts with deepening customer relationships by optimizing existing tools and processes to improve
residential customer targeting and marketing, exploring new energy management frameworks for
commercial and industrial customers, and enhanced incentives designs for all customers that invest in
deeper savings over a specific timeframe. In parallel, the Company will undertake tailored program
enhancements and technology-based opportunities that drive adoption of comprehensive measures.
This includes tailoring programs to push into new commercial and residential markets such as
telecommunications, and the subsegment of multifamily condominiums. A new zero-energy ready tier
for new construction will be incorporated and offered across all customer segments. Comprehensive
technology-based measures emphasized over the next three-years include commercial Heating,
Ventilation, and Air Conditioning (HVAC) systems with controls, lighting controls, and storage, while Air
Source Heat Pumps will be emphasized for all customers, in support of the state’s Heating Sector
Transformation initiative.
National Grid will also deploy multiple forward-looking strategies and innovations that pivot the
portfolio to ensure continued robust savings and benefits for customers. The innovations in this Draft
Three-Year Plan include substantial expansion of the Community-based initiative into a full Community
Solutions initiative and a forward looking Codes and Standards effort, both of which cut across the
portfolio and seek to fundamentally broaden program partners and approaches to reach the next level
of clean energy transformation. The Draft Three-Year Plan continues to expand active demand response
efforts that will have an impact on summer peak demand and winter reliability, while supporting Rhode
Island’s greenhouse gas reduction goals. Active demand response offerings are included for all
customers. The Company will also explore cutting-edge technologies, such as fuel cells and geothermal
heating systems, with an aim to integrate them into the portfolio in a staged approach that supports
bringing these technologies to scale. The Company will continue to assess financing programs and seek
alternative funding to support program development and customer adoption to minimize impact on
customer surcharge.
This Draft Three-Year Plan is delivered in the context of the COVID-19 pandemic and its devastating
effects. The Company is mindful in both its immediate efforts and its multi-year planning and to ensure
efforts support and grow an energy efficiency workforce while adapting to the impacts and continuing
uncertainties delivery partners, workforce and customers continue to experience.

16
Navigating the transition to a greatly changed energy efficiency landscape will not happen quickly or
easily but will require intensive trial and error and leaps of innovation, followed by retrenchment and
refinement. The Company anticipates the first year of this Draft Three-Year Plan to be a year of
intensive planning and testing with a process of continuous enhancements to pull deeper savings from
existing programs. Together these efforts will allow the Company to continuously improve the customer
experience and create even greater value for customers in securing long-term savings.
Table 8 and Table 9 provide a listing of the many program enhancements and innovations the Company
will pursue over the next three years, which are further described in Section 4.2 Commercial & Industrial
Programs and Section 4.3 Residential & Income Eligible Services Programs.
Table 8. Commercial and Industrial Programs Summary
Deepen Customer Relationships and Increase Participation Across All Customers
• New Energy Management Frameworks for Large and Medium Commercial and Industrial
Customers
• Enhanced Incentives for Bundling of Measures
• Explore Enhanced Finance Offers for Commercial and Industrial Customers
Drive Comprehensive Measure Adoption with Tailored Program Enhancements
• New Telecommunication, Commercial Real Estate, and Nursing Home Initiatives
• New Program Enhancements for Small Business Customers
• Expand Community Partnerships to Bring in New Customers
• New Construction Zero Energy Ready Tier
Drive Comprehensive Measure Adoption with Technology-Based Opportunities
• HVAC and Controls
• Lighting Controls
• Air Source Heat Pumps and VRF Systems
Expand Active Demand Response
• Grow the Existing Active Demand Response Program
• Explore Adding Electric Vehicles to the Active Demand Response Portfolio
Explore Cutting-Edge Technologies
• Fuel Cells
• Geothermal Systems
Table 9. Residential and Income Eligible Services Programs Summary
Deepen Customer Relationships and Increase Participation Across All Customers
• Enhanced Incentives for Increased Savings
• Customer Management Systems
• Equity
• Explore Finance Offers for Residential Customers
Drive Comprehensive Measure Adoption Through Tailored Program Enhancements
• EnergyWise
• Multifamily
17
• Income Eligible Services (IES) Single Family
• New Construction Zero Energy Ready Tier
Drive Comprehensive Measure Adoption with Technology-Based Opportunities
• Air Source Heat Pumps
Expand Active Demand Response
• Connected Solutions
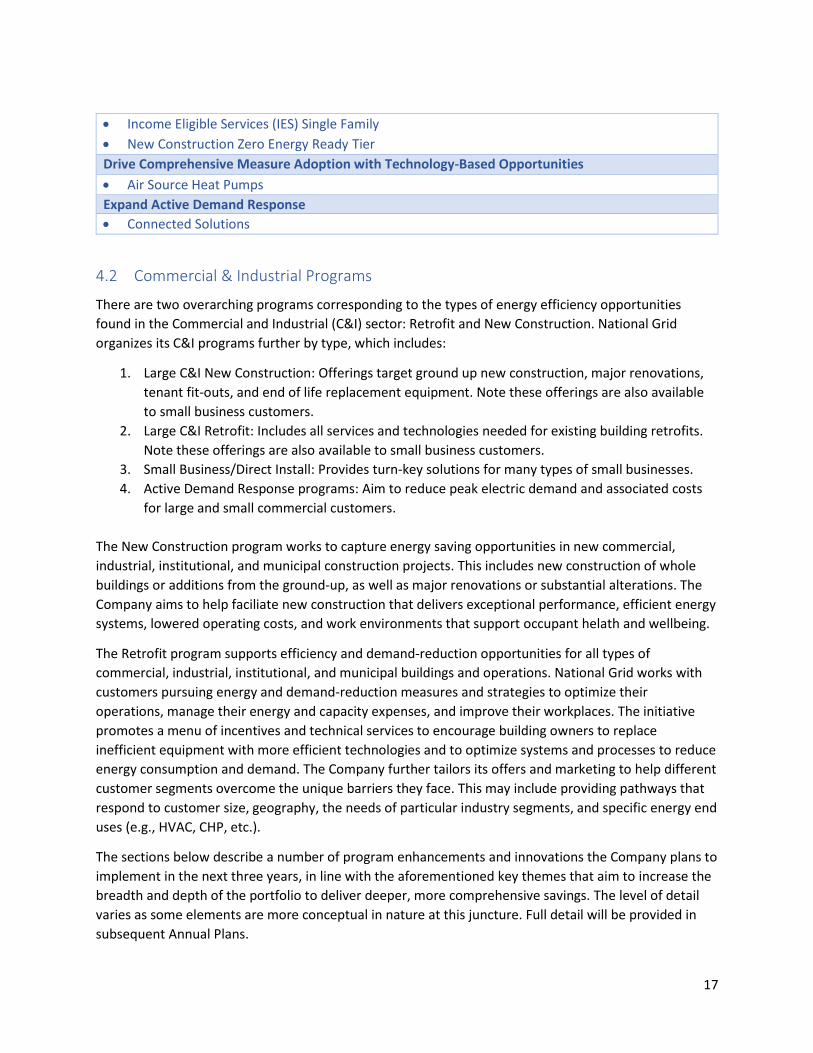
4.2 Commercial & Industrial Programs
There are two overarching programs corresponding to the types of energy efficiency opportunities
found in the Commercial and Industrial (C&I) sector: Retrofit and New Construction. National Grid
organizes its C&I programs further by type, which includes:
1. Large C&I New Construction: Offerings target ground up new construction, major renovations,
tenant fit-outs, and end of life replacement equipment. Note these offerings are also available
to small business customers.
2. Large C&I Retrofit: Includes all services and technologies needed for existing building retrofits.
Note these offerings are also available to small business customers.
3. Small Business/Direct Install: Provides turn-key solutions for many types of small businesses.
4. Active Demand Response programs: Aim to reduce peak electric demand and associated costs
for large and small commercial customers.
The New Construction program works to capture energy saving opportunities in new commercial,
industrial, institutional, and municipal construction projects. This includes new construction of whole
buildings or additions from the ground-up, as well as major renovations or substantial alterations. The
Company aims to help faciliate new construction that delivers exceptional performance, efficient energy
systems, lowered operating costs, and work environments that support occupant helath and wellbeing.
The Retrofit program supports efficiency and demand-reduction opportunities for all types of
commercial, industrial, institutional, and municipal buildings and operations. National Grid works with
customers pursuing energy and demand-reduction measures and strategies to optimize their
operations, manage their energy and capacity expenses, and improve their workplaces. The initiative
promotes a menu of incentives and technical services to encourage building owners to replace
inefficient equipment with more efficient technologies and to optimize systems and processes to reduce
energy consumption and demand. The Company further tailors its offers and marketing to help different
customer segments overcome the unique barriers they face. This may include providing pathways that
respond to customer size, geography, the needs of particular industry segments, and specific energy end
uses (e.g., HVAC, CHP, etc.).
The sections below describe a number of program enhancements and innovations the Company plans to
implement in the next three years, in line with the aforementioned key themes that aim to increase the
breadth and depth of the portfolio to deliver deeper, more comprehensive savings. The level of detail
varies as some elements are more conceptual in nature at this juncture. Full detail will be provided in
subsequent Annual Plans.

18
4.2.1 Deepen Customer Relationships and Increase Participation Across All Customers
The Strategic Energy Management Program (SEMP) offers a successful process for continuous customer
engagement that delivers increasing depth and comprehensiveness of energy savings over multiple
years. SEMP participants are the Company’s largest customers, including large manufacturers, university
campuses, and large health care systems. The SEMP partnership allows the customer to share their long-
term goals and vision, which the Company uses to provide tailored support to help identify energy
opportunities and approaches that align with the customers’ needs. The Customer and the Company
then mutually commit to a formal memorandum of understanding outlining the financial incentives tied
directly to the savings the customer commits over the next three or four years. The SEMP represents an
ideal model in which customers are well educated and actively engaged in building and implementing
multiyear plans, in partnership with the Company, that deliver highly cost-effective energy savings. The
challenge is that this model only applies to a small number of very large customers with large savings
potential and the scale to support human and financial resource commitments over a longer-term
planning and investment cycle.
As the Company moves into the next three years, it is essential to find ways to achieve more continuous,
long-term customer engagements that can deliver deep, cost-effective savings with the next tier of large
and medium commercial customer, for whom the SEMP program is not a fit. The C&I team aims to
enhance existing program delivery models and experiment with new ways to increase participant
engagement. National Grid proposes taking actions to create a culture of continuous energy efficiency
improvement with this next tier of customers with high potential savings, by addressing the specific
barriers and systematically working to develop comprehensive efficiency packages and delivery that are
easily accepted and adopted.
New Energy Management Frameworks for Large and Medium Commercial and Industrial Customers
Distinct from SEMP in that its focus is large and medium (rather than very large) customers, energy
management frameworks provide the customer with a structured approach to instituting successful
energy efficiency strategies. The Strategic Energy Management (SEM) demonstration, started as a
demonstration in 2019 as a first attempt to engage in a SEMP-like continuous engagement with the next
tier of customers. The SEM pilot will be completed in 2021. To avoid confusion with the SEMP program,
the Company now refers to the SEM pilot as the Continuous Energy Improvement (CEI) model. The CEI
model gathered medium-sized customers together in cohorts and provided a facilitated forum and
support that allowed customers to share best practices and be introduced to higher value efficiency
opportunities. The CEI model theoretically offered a more efficient delivery of the support provided
under SEMP, while still moving the customer to build multi-year efficiency plans that supported
continuous and deeper measures. Unlike the SEMP initiative where customers make firm commitments
to achieve savings, the CEI model only requires customer meetings, and early results do not show
customers engaging in sustained continuous efficiency savings activity. Consequently, the costs of the
facilitated support are high relative to the savings secured. The evidence to date, halfway through the
program, makes this an area in which the Company will need to examine if the investment matches the
potential and to aggressively explore other framework models that can move large and medium
customers closer to the multi-year comprehensive savings model achieved through SEMP.

19
The Company will remain attuned to lessons learned from the CEI model as the demonstration
concludes, while also learning from Rhode Island’s commercial customer base and vendors and
designing enhancements based on their needs. A primary focus is to examine the best practices of
customers that have successfully engaged in a continuous path of increasing energy efficiency. Looking
closely at Rhode Island customers who have successfully engaged more consistently in energy efficiency
is one of the best sources of program enhancement information, as their contexts and circumstances
will most closely reflect other Rhode Island businesses the Company seeks to target. These experiences
also reflect engagements where the current vendor community succeeded and are therefore most likely
to identify sales and delivery adjustment opportunities that can be more easily and systematically
adopted by existing energy efficiency vendors available to serve this market. While the National Grid
team will also look at programming in other states and draw on customer engagement strategies from
other industries, focusing on the specific context of the Rhode Island business community offers the
Company the opportunity to maximize the speed of translation from design to incorporation into
delivery. It also maximizes the opportunity to innovate and grow the local workforce and businesses.
The goal is to identify model energy efficiency plans that offer two- to five-year efficiency pathways that
allow customers to understand their opportunities and align those with incentive structures and support
to incorporate longer term commitments to efficiency in their operations. To be successful, models must
align with customers’ business objectives and financial abilities without requiring substantial customer
time commitment to planning.
In National Grid’s current delivery model, vendors identify comprehensive opportunities and present
these to customers. However, there are often barriers to a customer adopting the full suite of
opportunities. While at times it can be a cost issue, it is often a more complex set of barriers and
disincentives that prevent the customer from adopting comprehensive measures. These include
customer inability to manage multiple or complex projects or the concern that larger projects require
longer disruption to operations. Often larger, more complex projects require more attention that is
simply not available from businesses managers, for whom energy efficiency is not a core responsibility.
Commercial customers have frameworks for normal business operations and energy efficiency tends to
be outside these standardized operations frameworks. Even when a customer has a successful
engagement with a vendor, i.e. offered a suite of opportunities with payback and agrees to implement,
there is no automatic loop to bring the customer the next opportunity. It is highly inefficient, for both
the business and the vendor, to return to assess opportunities each year. By analyzing the success
factors from comprehensive multiyear customer engagements, National Grid hopes to identify best
practices and translate those into tailored frameworks that can integrate into existing business
operations. The Company anticipates frameworks will help vendors work with customers to review
consumption data and create simplified multiyear energy action plans with annual energy reduction
targets. The energy management frameworks will be tailored to each business segment. The objective
is both to increase participant engagement and to create a series of next best actions for energy
efficiency improvements.
This program enhancement will require some adjustments to the current sales process and information
capture. It also requires development of tools that allow the vendor to seamlessly provide the customer
with a suite of near term and future opportunities and a simplified multiyear implementation plan that
20
ensures a multiyear relationship. For example, as part of the initial energy audit, the vendor could
catalog all major equipment, including the nameplate information, installed date, run hours,
load/consumption data, and operation and maintenance reports if possible. Creating this shared data
catalogue will allow the Company to provide customers increased insights to optimize energy using
equipment, including modifications and replacement timing. The Company will look to establish a
database that catalogues specific attributes associated with major equipment, including energy
consumption, years in use, lifecycle, and annual maintenance hours. This catalogue will be used to tailor
energy efficiency offerings, create energy action plans, and to better integrate energy efficiency
measures as a solution to customer pain points.
The National Grid sales representative or vendor can use the equipment catalog to establish a multiyear
(two- to five-year) energy efficiency action plan (EEAP) that takes into consideration equipment nearing
its end of life, operation and maintenance expenses, and operational pain points. In creating the EEAP,
the sales representative/vendor can establish site energy reduction targets as a percentage of total site
consumption. In conjunction with this effort, the sales representative/vendor will present the energy
management frameworks in a simple template tailored to the customer’s industry, business segment, or
energy profile (if an industry or business segment is not available). By taking the lessons learned from
prior engagements and creating these frameworks that reflect an understanding of and are easily
incorporated into the businesses’ standard operations, it can allow energy efficiency action to become a
continuous rather than one time part of customers’ business operations.
The initial target for this enhancement will be customers with significant electric and gas loads with little
to no energy efficiency program engagement within the past five years. Prioritizing customers by energy
efficiency potential will help the total cost efficiency. This is important because the program will be
expensive, with considerable investment in developing frameworks and relationships, identifying savings
opportunities, and partnering with the customer to move to action. To successfully secure these new
savings opportunities, the program will need to invest in completing the data review and research to
highlight and build reproduceable simplified templates for action, work with vendors to ensure the audit
process captures new data that allows for longer term plan development, and ensure there is a data
storage system that allows the program and sales teams to anticipate and reach out to customers as
next actions become available based on the longer term framework or plan.
Enhanced Incentives for Bundling of Measures
The energy management framework approach targets the tier just below the Company’s very large
customers. For customers who are not candidates for the framework approach, the Company will
explore providing enhanced incentives to those that commit to implementing comprehensive energy
efficiency measures within a specified timeframe. The objective is to balance longer-term and shorter-
term energy savings, and to accelerate customer investments in energy efficiency. Providing enhanced
incentives to customers that commit to implementing comprehensive energy efficiency measures within
a specified timeframe can accelerate adoption of energy efficiency by reducing the financial barrier
associated with deeper investments and supporting customers in shifting to a multi-year energy
efficiency strategy to realize enhanced incentives. Only comprehensive measures will be bundled. In
terms of what combination of measures the Company considers comprehensive, this would include, for
example, the combination of a new lighting system and a more efficient domestic hot water system. In

21
contrast, the combination of a new lighting system and vending misers would not be considered
comprehensive.
The Company will explore two sets of comprehensive bundle types and identify which offers the best
opportunity to engage customers in deeper, more comprehensive measure adoption. The first approach
to bundling is at the system level, e.g. HVAC units with variable frequency drives (VFDs), lighting with
controls, fryers with hood vents. The theory is that the customer is already interested in an upgrade to a
specific system and may be convinced, with enhanced incentives, to install additional, similar measures
(i.e. bundle) to achieve greater efficiency within that energy system. The second approach is to bundle
items that pair well together for specific businesses because of the businesses’ energy profile and likely
energy savings opportunities. For example, lighting and VFDs are frequently early high priority
opportunities for many businesses.
The Company will look at historical data on measure implementation, with attention to specific systems
measures. The Company will also research how specific customer segments advance through energy
efficiency to identify those struggling to advance comprehensively. This data and research review will be
paired with an investigation of measures identified in the potential study with significant remaining
achievable potential and further filtering for measures with synergistic effects when bundled. Certain
system bundles are likely to be incorporated in earlier Annual plans, with several identified in Section
4.2.3 likely to be targets for an enhanced incentive model deployment in first years of the Draft Three-
Year Plan. As the teams dig more deeply into historic trends and test the extent to which enhanced
incentives can drive adoption of more comprehensive action, the Company will expand the enhanced
incentive offers available.
Explore Enhanced Finance Offers for Commercial and Industrial Customers
The Company will identify any gaps in the large selection of financing products currently offered to C&I
customers, and opportunities to enhance finance offers, while also educating customers on the value
and appropriate timing of current and future finance tools. The Company wants to ensure that the
barriers to investing in energy efficiency are as low as possible. As National Grid asks customers to
engage more continuously and in more comprehensive projects, as described above, there will be higher
costs. The Company’s primary tools to alleviate cost barriers for customers are incentives and financing.
The Company is committed to balancing these against each other to ensure an optimal amount of
savings for the right cost.
Part of the review and refinement to finance offers will be to ensure that the finance products meet the
needs of Rhode Island customers. There has been an explosion of new energy efficiency finance models
over the past decade. Some are niche products that may not be taken up by Rhode Island customers.
Ultimately the greater the complexity of finance offers, the higher the administrative costs to the
Company of time expended developing and deploying finance products that serve very few or no
customers, and the greater potential for customer and vendor confusion. This distracts from National
Grid’s ability to focus on optimizing and making more accessible the existing mix of finance and
incentive packages that the Company knows can move customers with significant savings opportunities
to action.
22
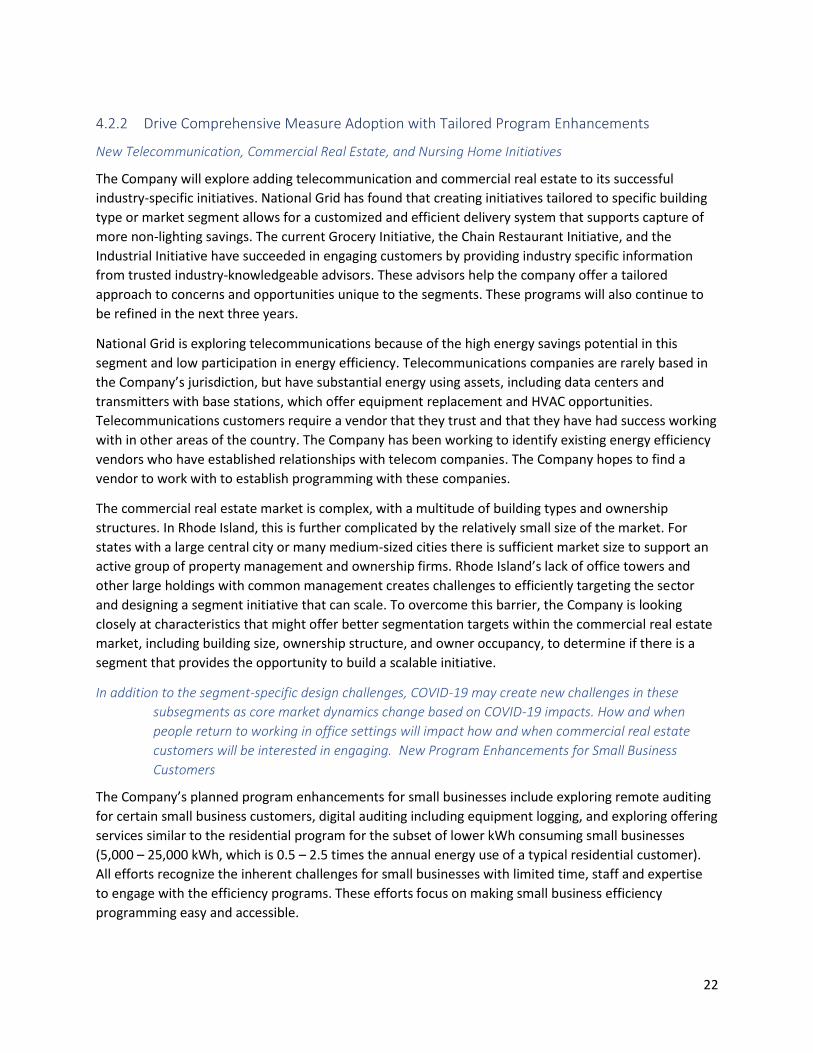
4.2.2 Drive Comprehensive Measure Adoption with Tailored Program Enhancements
New Telecommunication, Commercial Real Estate, and Nursing Home Initiatives
The Company will explore adding telecommunication and commercial real estate to its successful
industry-specific initiatives. National Grid has found that creating initiatives tailored to specific building
type or market segment allows for a customized and efficient delivery system that supports capture of
more non-lighting savings. The current Grocery Initiative, the Chain Restaurant Initiative, and the
Industrial Initiative have succeeded in engaging customers by providing industry specific information
from trusted industry-knowledgeable advisors. These advisors help the company offer a tailored
approach to concerns and opportunities unique to the segments. These programs will also continue to
be refined in the next three years.
National Grid is exploring telecommunications because of the high energy savings potential in this
segment and low participation in energy efficiency. Telecommunications companies are rarely based in
the Company’s jurisdiction, but have substantial energy using assets, including data centers and
transmitters with base stations, which offer equipment replacement and HVAC opportunities.
Telecommunications customers require a vendor that they trust and that they have had success working
with in other areas of the country. The Company has been working to identify existing energy efficiency
vendors who have established relationships with telecom companies. The Company hopes to find a
vendor to work with to establish programming with these companies.
The commercial real estate market is complex, with a multitude of building types and ownership
structures. In Rhode Island, this is further complicated by the relatively small size of the market. For
states with a large central city or many medium-sized cities there is sufficient market size to support an
active group of property management and ownership firms. Rhode Island’s lack of office towers and
other large holdings with common management creates challenges to efficiently targeting the sector
and designing a segment initiative that can scale. To overcome this barrier, the Company is looking
closely at characteristics that might offer better segmentation targets within the commercial real estate
market, including building size, ownership structure, and owner occupancy, to determine if there is a
segment that provides the opportunity to build a scalable initiative.
In addition to the segment-specific design challenges, COVID-19 may create new challenges in these
subsegments as core market dynamics change based on COVID-19 impacts. How and when
people return to working in office settings will impact how and when commercial real estate
customers will be interested in engaging. New Program Enhancements for Small Business
Customers
The Company’s planned program enhancements for small businesses include exploring remote auditing
for certain small business customers, digital auditing including equipment logging, and exploring offering
services similar to the residential program for the subset of lower kWh consuming small businesses
(5,000 – 25,000 kWh, which is 0.5 – 2.5 times the annual energy use of a typical residential customer).
All efforts recognize the inherent challenges for small businesses with limited time, staff and expertise
to engage with the efficiency programs. These efforts focus on making small business efficiency
programming easy and accessible.
23
The Company remains optimistic that remote auditing may decrease the cost to serve smaller
customers, allowing National Grid to serve more customers. The Company has limited experience with
the remote audits, which were rolled out in late April 2020 in response to limitations to on-site visits due
to COVID-19. Even with this minimal roll out, National Grid’s vendors are concerned about ordering
equipment until the space is physically inspected, as ordering the wrong equipment has substantial
impacts on project timing and cost. As the Company continues to gain experience, it can adapt the
remote audit to try to come closer to the full value of on-site audits, potentially having more
photographs and other details provided by the customers. However, National Grid must carefully
balance the amount of customer time requested against the potential to deter their interest in moving
forward with the efficiency sale. Digital auditing will allow the Company to learn more about customer
needs and follow up with them on measures not currently included in the direct install model.
The Company recognizes that many small businesses occupy either converted residential structures or
buildings that share the characteristics that are common to residential structures. The Company’s
residential efficiency auditing and implementation vendors are highly efficient at delivering
weatherization and other energy efficiency services to these building types. Capturing weatherization
opportunities in this segment is particularly important for electrically heated small business, as properly
weatherizing and insulating electrically heated small businesses saves energy and prepares them for
ASHP.
Expand Community Partnerships to Bring in New Customers
The Company will work to expand community partnerships to bring in new customers. As part of the
cross-cutting Community Solutions Initiative detailed in Section 4.4, the C&I team will work to develop
new partnerships and engagement with industrial and technology parks in support of energy efficiency.
New Construction Zero Energy Ready Tier
The goal of the New Construction program in the Draft Three-Year Plan is to continue to influence the
design and construction industry towards higher performing buildings including developer attainment of
LEED, Energy Star, Zero Energy Ready and Passive House certifications.
The new construction program offers a unique opportunity to work at the innovative edge of high-
performance building. Through the new construction program, National Grid can influence the design
and construction of new buildings and additions, major renovations, and substantial alterations in
connection with events like tenant or space changes. By engaging with the construction industry at
these critical moments, we create opportunities to shift the building and design community towards
new technologies and techniques that create ever higher performing buildings.
National Grid’s success in promoting high efficiency technologies and practices, both through the new
construction and retrofit programs, has positively influenced adoption of high-performance building
techniques and highly efficient technologies. This has resulted in ever-higher baselines of industry
standard practice. Taken in combination with Rhode Island’s adoption of the IECC 2015 building code in
late 2019 and likely adoption of at least one energy code update during the 2021-2023 plan cycle, the
elevated program baselines will result in diminished efficiency program claimable savings. The lower
claimable savings will constrain the Company's ability to offer direct incentives.
24
To maintain and grow National Grid’s ability to influence new construction, the Company must focus on
engaging with customers early in the design process and continuing to explore and refine pathways to
move the industry to highest performing, zero energy ready buildings. The key primary areas of
exploration anticipated include:
• Set energy use intensity targets and an aligned path to zero energy ready buildings, which
includes post occupancy verification.
• Implement an energy conservation measures-based worksheet methodology to encourage
program participation by those working on smaller buildings who do not have the design team
support or timing to engage with the more comprehensive support tools of the new
construction program. A simplified methodology can overcome many of the barriers that
smaller projects face in adopting high-performance best practices.
• Work with architectural firms to achieve EUI targets across their entire portfolio and align with
the AIA 2020 challenge for energy performance standards. For large projects this would allow
the Company to leapfrog the development process to the earliest design stages and help ensure
the most aggressive energy savings techniques are considered and explored with customers at
the very earliest stage of design. The early design is also the moment of engagement that offers
the most cost-effective savings opportunities.
In addition to the explorations described above which focus on providing customers direct support for
enrolled projects, the Company will study the market effects and spillover of the new construction
program to help address the limitations on program savings driven by higher baselines, which are often
a direct result of the program's success.
4.2.3 Drive Comprehensive Measure Adoption with Technology-Based Opportunities
Adoption of these advanced technologies are dependent on the program enhancement strategies
described above and successful workforce development efforts.
HVAC and Controls
The Company will look to identify all near-term HVAC failures and approach the customer with
enhanced incentives for bundling new HVAC systems with controls. Providing enhanced incentives for
the bundling of HVAC measures with controls allows the Company to offer customers a more holistic
energy efficiency solution. The most significant barrier to the installation of HVAC measures and controls
is the upfront capital investment. However, increasing the incentives for the bundling of HVAC and may
lower this barrier and allows the customer to benefit from the more comprehensive savings that occurs
when HVAC is coupled with controls. Additionally, the Company will research strategies to increase the
installation of control systems on existing HVAC units.
Lighting Controls
The Company will look to increase customer adoption of luminaires with lighting controls and network
lighting controls (NLC). Luminaires with built in controls allow customers to save additional energy
through daylight harvesting and more granular occupancy sensing without the need to hard wire
additional sensors. A properly designed NLC project can save even more energy than luminaires with
built in controls through the ability to control plug loads, provide feedback to the system controlling the

25
HVAC, and advanced scheduling. These systems can also respond to demand response signals. Both of
these pathways require additional cost and installation expertise but may yield substantial energy and
non-energy benefits. In the next three years, the Company will work with experts in the lighting industry
to make sure that customers and partners are trained on the benefits and proper installation of these
technologies, modify incentives to encourage the growth of this area of the lighting market, and work on
a system to support post installation training or check ins to ensure the system is functioning properly
over the long term.
Air Source Heat Pumps and VRF Systems
Heat pumps and Variable Refrigerant Flow (VRF) systems can be dramatically more efficient than
traditional heating and cooling technologies. Understanding what makes a building a good fit, timing
issues, and customer concerns are critical to further deployment of these technologies. The Company
will look to define the characteristics that make for the successful deployment of air source heat pumps
and VRF systems in commercial and industrial market segments for both heating and cooling
applications.
4.2.4 Expand Active Demand Response
Grow the Existing Active Demand Response Program
The Company implemented an active demand reduction program in 2019 based on the successful pilot
initiated in 2017. The purpose of the demand response program is to reduce the system electrical
demand on the grid during summer peak events. The active demand response program has two
offerings: a targeted dispatch which generally targets a maximum of eight events per summer, and a
daily dispatch with a maximum of 60 events.
This fully integrated initiative uses Curtailment Service Providers (CSPs) and existing energy efficiency
sales teams to assess curtailment opportunities at a facility and deliver curtailment services to enrolled
customers. The Company leverages the existing consultative sales approach employed for large
customers to market to and recruit customers. CSPs then identify specific curtailment opportunities, as
well as demand charge and Installed Capacity (ICAP) tag management opportunities and present a
complete curtailment proposal to the customer.
Customers with interval meters, time of use rates, and demand charges are eligible for participation.
Under the program, the Company calls an event when conditions occur that typically result in system
peak. Customers and CSPs respond to dispatch signals or criteria specified by the Company, generally
using a system peak trigger. Events are called the day before curtailment as needed. The goal of the
offering is to call events at times of peak energy use, however daily peak calls (i.e. daily dispatch
offering) may be able to access greater system benefits. For customers participating in ISO New England
demand response markets, ISO New England event days are excluded from baseline calculations to
avoid interfering with that program or penalizing customers for participating in both programs. The
customer is incentivized to respond to event calls using performance-based incentives. Performance is
measured against a baseline in alignment with ISO New England methodology.
The approach is technology agnostic. Customers can utilize single end use control strategies or combine
multiple end uses and approaches to reduce demand when an event is called. Common technologies
used by customers to participate in demand response include lighting with both manual and automated
26
controls, HVAC with both manual and automated controls, process loads, scheduling changes, excess
CHP capacity, and energy storage. The active demand response offering provides value to large C&I
customers and generates claimable benefits, primarily avoided capacity, transmission, distribution, and
capacity demand reduction induced price effects.
The demand charge and ICAP tag management provide opportunities for direct bill savings to
customers. This fully integrated approach relies on sales delivery teams promoting efficiency and active
demand offerings to customers as they assess opportunities at customer facilities. This approach of
using the existing efficiency delivery apparatus is key to the growth of C&I active demand reduction.
The robust relationships the Company has with target customers (typically large electric customers with
interval meters, time of use rates, and demand charges) have been critical to the success of the program
and are believed to be the source of forward progress on this new program.
Over the next three years, the Company will look to scale energy storage participation with various
customer segments to reduce peak demand. As storage becomes more prevalent in the marketplace,
maximizing the storage potential for demand response benefits the electrical grid to reduce peak
demand, while still meeting customers’ reliability needs.
Explore Adding Electric Vehicles to the Active Demand Response Portfolio
Electric vehicles, similar to batteries, are become more prevalent in the market. They serve an
opportunity to reduce peak demand on the electric grid. The Company will explore adding electric
vehicles to the active demand response portfolio if it does not adversely affect the evaluation of the
electric vehicle time of use charging pilot.
4.2.5 Explore Cutting-Edge Technologies
Fuel Cells
Fuel cells provide an alternative solution to traditional CHP, while offering different operational benefits
that can appeal to specific customer segments. Fuel cells produce electric power using the chemical
energy of a fuel stock to cleanly and efficiently produce electricity. Fuel cells work like batteries, but do
not run down or need recharging. They produce electricity and heat as long as fuel is supplied. Some
fuel cells can also transition to use hydrogen as the fuel stock, offering the potential for the fuel cell to
be a renewable form of electricity and heat.
While it is possible to find a use for the heat produced in the fuel cell process, there are applications
where fuel cells’ operating characteristics, i.e. offering clean power with no local air pollution and being
highly efficient at producing electricity, provide customers a combination of significant efficiency,
reliability and resiliency benefits that are attractive. The target customers for this technology are very
large electricity users with critical reliability needs. For example, large supermarkets and others with
products or processes requiring continuous refrigeration. These customers can see multiple value chains
from fuels cells, while not necessarily having a parallel need for heating. For these customers, fuel cell
technology holds the potential to maximize the efficiency benefit, as well as the demand reduction and
other grid benefits.
27
The best opportunities for fuel cells are in applications with continuous electric power run cycles. This is
a different market than much of the CHP market. Additional attention is needed to define this market,
the unique and full value propositions for different customers including the performance characteristics
needed, and the current state of the art of commercial systems. The Company commits to researching
the performance, barriers and potential market size for fuel cell installation in Rhode Island, while
continuing to work through the existing program delivery chain to serve customers now. The potential
savings and benefits of fully realizing the potential of fuel cell technology both for CHP and non-CHP
application are likely large. However, like CHP, the savings are uneven and hard to predict. Like
traditional CHP, these projects involve substantial capital investments, complex technical requirements
for installation, and long horizons for interconnection. As with the Company’s approach to CHP systems,
National Grid will use the Annual Plans to identify and include CHP projects with realistic expectations of
completion within the calendar year.
Geothermal Systems
Ground-source heat pumps (GSHP) can deliver the highest energy and emissions savings of all HVAC
systems, but uptake is limited due to high upfront costs. Despite these upfront costs, GSHP systems can
be economically competitive over the lifetime of the equipment. As such, National Grid will continue to
explore appropriate incentive options for GSHPs in the next three years, while taking into consideration
additional policy and regulatory matters such as non-pipeline solutions and utility-ownership of GSHP
ground loops.
4.3 Residential & Income Eligible Services Programs
Rhode Island’s residential sector portfolio has successfully driven rapid, market-transforming consumer
adoption of high efficiency lighting in homes and has received recognition from national organizations
including the American Council for an Energy-Efficient Economy, the U.S. Environmental Protection
Agency, and the U.S. Department of Energy. Yet the state’s residential energy efficiency market has
reached a turning point, with savings from residential lighting projected to recede almost completely by
2022. This means that residential programs are at risk of losing significant visibility to customers as
lighting becomes a diminishing portion of the portfolio. High efficiency bulbs directly installed in
customers’ homes during home energy assessments provided an instant value and tangible energy
savings for customers. Program-supported discounting of high efficiency lighting in retail settings was a
key opportunity to showcase efficiency directly to customers in the retail market. This Draft Three-Year
Plan marks the beginning of the Company’s residential programs transformation to meet the changing
efficiency landscape.
National Grid plans to respond to these challenges with multiple program enhancements and
innovations planned for the next three years. The focus of the Draft Three-Year Plan is a reexamination
of the residential portfolio that aims to identify opportunities to increase participation across all
customer segments, drive broader penetration of energy efficiency and demand reduction to new
participants, and secure deeper savings from more continuous and comprehensive engagement with
existing program participants. The residential programs are relatively mature and have had success in
providing customers with incentives and support for their every‐day energy choices. As the Company
pivots in the wake of lightings savings loss and to respond to COVID-19, an early focus will be to reshape
the intake and assessment process for customers, consider more virtual audits, and other solutions that

28
may reduce delivery costs and help maintain the cost effectiveness of the residential program portfolio.
At the same time, intake processes must succeed while convincing customers to pursue more complex
and expensive measures, such as HVAC systems. To provide services while optimizing investments, the
Company must more efficiently target customers and match offers to their savings opportunities,
including reshaping the EnergyWise program to more efficiently target homes with weatherization
opportunities and connect customers with other energy saving needs through other program channels.
Ultimately the Company is likely to need to increase incentives to move customers to action, creating
costs which much be balanced against more participation and leaner delivery costs to maintain the
portfolios cost effectiveness. These programs will continue to offer substantial savings for Rhode Island
customers and support Rhode Island’s greenhouse gas goals and the environment by enhancing energy
efficiency delivery of weatherization and targeting energy savings in the heating sector.
National Grid is committed to ensuring that customers who have a high energy burden and/or difficulty
paying their electric bills participate in, and benefit from, energy efficiency programs. Equity is an
essential component of this Draft Three-Year Plan, and the Company’s Income Eligible Services sector
continues to work to assist customers who may not have as easy access to the cost savings associated
with energy efficiency. National Grid will continue to work to identify and mitigate the specific barriers
and challenges faced by moderate and income eligible customer sub-segments.
The sections below describe a number of Residential and Income Eligible Services program
enhancements and innovations the Company plans to implement in the next three years, in line with the
aforementioned key themes that aim to increase the breadth and depth of the portfolio’s reach to
deliver deeper, more comprehensive savings. The level of detail varies as some elements are more
conceptual in nature at this juncture. Full detail will be provided in subsequent Annual Plans.
4.3.1 Deepen Customer Relationships and Increase Participation Across All Customers
Over the next three years, the Company must find ways to become residential customers’ trusted
energy advisor in order to support them in more continuous, long-term engagements that can deliver
deep, cost-effective savings. The loss of the low-cost lighting puts pressure on the current high
interaction model of providing an in-home professional energy assessment as a key vehicle for securing
weatherization and other deeper efficiency measures. The residential team will experiment with new
ways to increase participant engagement and enhance existing program delivery models to advance
residential customers along a path of continuous energy efficiency improvement. The overarching vision
is to transition customer relationships across all residential programs from transactional, limited term to
holistic, lifetime energy engagement. The enhancements and explorations described below, including
enhanced incentives, customer management systems, equity and finance, cut across all residential
programs and all seek to support more customers to adopt deeper savings.
Enhanced Incentives for Increased Savings
To encourage customers to add additional deeper efficiency measures, the Company will explore
methods to provide enhanced incentives for customers that commit to invest in deeper energy savings
over a specific timeframe. This is a step toward a “Pay for Performance” model, encouraging customers
to demonstrate initiative to invest in deeper savings measures in return for a similar growth in the
portion of co-investment by the Company. The objective is to develop an ongoing relationship with the

29
customer such that they continue to utilize the energy efficiency rebates for ongoing energy upgrades.
The first programs to align with such an incentive structure will be EnergyWise, Income Eligible Services,
and HVAC.
Customer Management Systems
The Company will continue to engage in a continuous improvement process to employ and connect
customer data to better target customers with offers. The process of using available data to segment
customers by certain attributes allows customer service representatives to provide customized
recommendations. When a customer’s call aligns with energy efficiency, the customer is directed to
participate in a home energy assessment or take advantage of National Grid’s marketplace for instant
rebates on efficient products. The Company will continue to refine the types of customer data that can
be compared and will begin to move into more proactive engagement with customers. The Company is
interested in exploring ways to leverage information from online, virtual and in person home
assessments to assist in proactive customer outreach when home heating and water heating equipment
is nearing replacement. The Company will explore opportunities to improve the ability to time
marketing and targeting of customers to when they are most likely to need system upgrades. It is
difficult for customers to learn about and be receptive to energy efficiency offerings when an expensive
critical system, such as a heating or hot water system, fails. Better consumer insight allows the Company
to educate and market to customers before failure occurs, at a time when they may be more receptive
to learning about new technologies. By educating customers when they may be in the market for a
replacement, the Company anticipates a better overall customer experience and less stress associated
with the system purchase.
Equity
This Draft Three-Year Plan is designed to ensure equity across residential programs. In the context of
energy efficiency, this means programs serve all customer segments, the energy efficiency rate has
parity, and energy efficiency services provide assistance to the most vulnerable customers who may pay
a higher proportion of their income towards energy costs.
National Grid remains committed to ensuring that the distribution of energy efficiency funding is
equitable across income and geographic sectors. The Company intends to continue to identify groups or
geographic areas with historically low participation. The residential team will continue to leverage best
practices from other states and will explore conducting a study that identifies which groups of
customers do not participate or have very low participation in energy efficiency programs, like the
Massachusetts non-participant study. To this end, the Company will review the opportunity to conduct a
non-participant study if existing research and analysis does not provide the level of detail assumed to
reach specific groups or geographic sectors.
Explore Finance Offers for Residential Customers
The Company has seen very strong participation among residential customers in uptake of the 0%
interest HEAT loan. In addition to overcoming financial barriers, the 0% has a powerful effect in
marketing the programs, allowing customers to overcome psychological barriers to an energy audit,
knowing that if the findings are significant there is a financing mechanism that would allow them to
move forward. The Company has completed two HEAT loan evaluations, both of which demonstrated
30
that loans are provided to those who need them to overcome financial barriers. As National Grid
considers expanding financing solutions, the Company is interested in exploring interest mechanisms
that would allow for larger loans or longer length loans, on-bill recovery of customer investment funded
with a revolving loan fund, or opportunities for loan loss reserve funds.
4.3.2 Drive Comprehensive Measure Adoption Through Tailored Program Enhancements
EnergyWise
The EnergyWise program has been highly successful in providing Rhode Island homeowners with energy
savings. The model historically relied upon a highly supportive customer experience with an in-home
visit from a professional energy assessor. The in-home assessment provides an opportunity to educate
customers, learn their priorities, and create immediate tangible energy savings benefits (e.g. high
efficiency light bulbs and other direct install measures). The in-home assessment also allows very
accurate estimation and design for weatherization (e.g. insulation and air sealing), HVAC, and water
heating opportunities. The accuracy of the weatherization plans allowed for efficient delivery of
insulation and air sealing measures with predictable costs and savings for the installer, the customer,
and the Company. This in-home assessment as the gateway to cost-effective weatherization was heavily
dependent on the low-cost savings provided by lighting measures. In response to reduced lighting
opportunities, the Company began exploring opportunities to move to more virtual assessments.
The Company had planned a systematic comparison of customer input online combined with virtual
audit data to professional home audit data. The goal was to begin to understand how well virtual audits
might work in replacing or at least helping screen homes for opportunities, particularly in estimating
weatherization opportunities. Due to COVID-19, the residential team’s roll out of virtual home energy
assessments proceeded without the ability to provide a parallel in-home inspection to deliver the
comparison. Once energy professionals can return to in-home visits, the Company can begin a closer
examination and refine the process of necessary data collection. The virtual assessments offered during
COVID-19 were facilitated by professional auditors, which the Company supported with the same fee as
in-home assessments. Items normally installed such as light bulbs and smart strips were mailed to
customers. The Company offered a 100% incentive on insulation up to $15,000, recognizing the
potential for contractors to find a different opportunity upon arrival and wanting to protect the
contractor’s ability to secure all efficiency without presenting the customer with an unanticipated cost.
This new form of engagement necessitated by COVID-19 presents an opportunity to look at customer
receptivity to efficiency and assess barriers that prevent participation. The Company will assess lessons
learned from deployment of virtual home energy assessments during the COVID-19 response and make
improvements to the EnergyWise program as appropriate. This may involve substantial adjustments to
expectations of what data can be gathered from a homeowner through online or virtual audits, in what
formats (i.e. response to questions versus photo uploads), and whether the online virtual audit is more
effective as an assessment tool or a screening tool with in-person follow up. Changes that help unlock
savings opportunities beyond lighting or reduce cost to achieve savings will receive attention.
Multifamily
Multifamily programs came under increased focus after not meeting their electric energy savings goals
in 2018 and 2019 (both market rate and income eligible multifamily programs) due to more rapid
31
declines in lighting energy savings than anticipated. Over the next three years, the Company will work to
increase the agility of all multifamily programs (residential income eligible, residential non-income
eligible, and commercial and industrial) to respond to the significant changes in the market, including
the continued loss of lighting savings and the need to more rapidly incorporate new technologies and
those complicated to deploy. The Company will prioritize program refinements based on evaluation
results, market influence, and market saturation of technologies. The Company is committed to using
data and quality research to inform strategy. The process and impact evaluations due in July 2020 will
provide critical insights to inform program refinements and possible redesign. In addition, National Grid
will engage with vendors and stakeholders to further inform the examination into program refinements
and possible redesign conducted in 2020, with a goal to create a nimbler and more adaptive program.
In parallel, the Company will seek to better understand the characteristics of sub-segments of the
multifamily market. Having been highly successful with the larger multifamily market and with the
single-family market, National Grid will increase its focus on the 5-20-unit market in the next three
years. The aim is to identify characteristics that might allow the program to achieve more success and
deeper savings with these customers. The Company will continue to explore how a tiered incentive
might help influence greater participation for market rate programs.
The Company will also investigate potential in the condominium market and whether additional savings
are possible from refinements to the current design and delivery model. National Grid will work with
the vendor who serves both the multifamily market and the EnergyWise delivery channel to test insights
generated from working with both market segments. One vendor suggestion the Company has adopted
and will continue to implement is creating more parity in incentives and other program elements
between the EnergyWise program and multifamily delivery. The individual condominium owner shares
many characteristics with the EnergyWise single family customer. Recognizing the similarities of these
markets the Company hopes reshaping delivery to provide a more consistent customer experience will
support greater participation from the condominium market, more in line with current participation in
EnergyWise.
Income Eligible Services (IES) Single Family
The Company will improve upon the 2019 Process Evaluation recommendations, which National Grid
has already begun implementing. The Process Evaluation outlined key elements that will improve
program efficiency, set the course for increasing customer participation, and improve consistent
program implementation. The Company will assess new program management and delivery models for
the IES Program that will respond to the current and future program needs. Leveraging funding from
third party sources will remain a priority to expand the reach and equity of energy efficiency services. As
the Company continues to expand its efforts to identify eligible customers for the gas and electric
discount rates, IES will leverage the efforts to increase enrollment.
New Construction Zero Energy Ready Tier
The goal of the New Construction program in the Draft Three-Year Plan is to continue to influence the
design and construction industry towards higher performing buildings including developer attainment of
LEED, Energy Star, Zero Energy Ready and Passive House certifications.
32
The new construction program offers a unique opportunity to work at the innovative edge of high-
performance building. Through the new construction program, National Grid can influence the design
and construction of new buildings and additions as well as major renovations. By engaging with the
construction industry at these critical moments, we create opportunities to shift the building and design
community towards new technologies and techniques that create ever higher performing buildings.
National Grid’s success in promoting high efficiency technologies and practices, both through the new
construction and retrofit programs, has positively influenced adoption of high-performance building
techniques and highly efficient technologies. This has resulted in ever-higher baselines of industry
standard practice. Taken in combination with Rhode Island’s adoption of the IECC 2015 building code in
late 2019 and likely adoption of at least one energy code update during the 2021-2023 plan cycle, the
elevated program baselines will result in diminished efficiency program claimable savings. The lower
claimable savings will constrain the Company's ability to offer direct incentives.
To maintain and grow National Grid’s ability to influence new construction, the Company must continue
to explore and refine pathways to move the industry to highest performing, zero energy ready buildings.
The key primary areas of exploration anticipated include:
• Integrate Zero Energy Ready elements into the New Construction program by 2023.
• Explore opportunities to quantify non-energy benefits associated with various levels of performance or certification and redesign program to promote options that deliver higher levels of benefits.
4.3.3 Drive Comprehensive Measure Adoption with Technology-Based Opportunities
Air Source Heat Pumps
The Company will support the promotion and installation of air source heat pumps to the extent
possible within regulatory guidelines. Current guidelines allow for the replacement of electric resistance
heating systems with air source heat pumps and support for customer access to high efficiency heat
pumps for accessory heating and cooling. At this time, regulation does not enable the Company to
pursue heat pump conversion or displacement for delivered fuels. The Process Evaluation outlined key
improvements to enable program efficiency and increased capacity for the number of customers that
can be served each year. By offering air source heat pumps, the Company will help develop the market
to enable electric resistance customers to purchase a more efficient electric heating system. Air source
heat pumps also provide opportunities for customers to participate in demand response.
4.3.4 Expand Active Demand Response
Connected Solutions
The Company will continue to grow its residential active demand response program offerings by
expanding participation in existing Connected Solutions offerings. Additionally, when the RI time-of-use
electric vehicle pilot concludes, the Company will investigate offering an active demand response
electric vehicle offering. During the next three years, Connected Solutions will support active demand
response through a three-pronged program. Support will continue with smart thermostats which allow
customers to participate in reducing the system peak demand during a limited number of summer
33
events. Small scale batteries are a performance based active demand response offering where up to
sixty events can be called throughout the year and incentives are earned based on the amount of energy
curtailed. Finally, the electric vehicle offering will be developed over the next three years.
National Grid was able to adapt results from a Massachusetts study that looked at the evolution of
smart devices and appliances and the market potential of these devices in an active demand program.
Based on the results of the research, Connected Solutions now offers the top three items identified in
that research. The Company will continue to watch the development and adoption of connected devices
and make decisions on when to bring new technologies into the program. Additionally, National Grid
provides feedback to manufacturers through its demand response management system vendor that
works with nearly fifty utilities across the nation and lends more weight in signaling manufacturers
about interest in connected device offerings. Location specific demand response will be pursued
through non-wires alternative work and leverages the network developed through Connected Solutions.
4.4 Cross-Cutting Programs
Codes and Standards
The Company will expand its current codes and standards work to advance the development and adoption of progressively more efficient energy codes (including stretch codes), appliance/equipment efficiency standards, and existing building energy performance standards. National Grid will provide technical guidance to stakeholders, which may include Rhode Island’s Building Code Commission and OER or the U.S. Department of Energy, to support the development of enhanced codes and standards at the state and national levels, with efforts weighted toward the former. Pending passage of state appliance standards, the Company will investigate providing compliance assistance services to relevant market actors using a similar approach to its Code Compliance Enhancement Initiative.
Reaching untapped markets and underserved customers through this work is a key element of the Company’s overarching strategy of maximizing clean energy from energy efficiency. Codes and standards development support activities will typically be made at least one year in advance of the resulting generation of savings since multiple years typically separate development, adoption, and enforcement of these policies. The Company expects to claim savings for this expanded codes and standards initiative starting in 2021, based on efforts undertaken in 2019-2020 to support the State’s current building code update process.
Workforce Development
The Company anticipates increasing its workforce development budget to roughly 1 percent of total
portfolio expenditures to expand the size and skillset of the efficiency workforce in the next three years.
The Company will utilize a three-prong approach. First, the Company will complete the task of
identifying and quantifying current or anticipated workforce gaps in 2021. Second, the Company will
provide training opportunities and facilitate mentorship programs to help fill these gaps starting as soon
as January 2021. Third, the Company will support curriculum enhancements, career and technical
education opportunities, and other engagement opportunities to schools and communities – including
Community colleges, high schools, and middle schools – to promote a steady, lasting, and more
equitable pipeline of entrants to the energy efficiency industry. The Company will coordinate with state
and local authorities, including the Department of Labor and Training’s Real Jobs Rhode Island program
and Rhode Island Department of Education’s PrepareRI initiative, to guide the development and delivery

34
of these efforts and help promote existing solutions to reduce or eliminate duplication of effort and
expenditures.
Workforce Development efforts will complement programmatic activities aimed at increasing the
adoption of advanced technologies. In the commercial and industrial sector, this includes training on
advanced controls for HVAC and lighting and growing the commissioning workforce. To support the
residential and income eligible sectors, the Company will build relationships with schools and
communities to help grow the constrained pipeline of trades that enable energy efficiency projects like
HVAC technicians (including heat pump installers), electricians, and plumbers.
Community Solutions Initiative
The Rhode Island Community-Based initiative is the Company’s energy efficiency awareness campaign
grounded in deep municipal engagement whereby local official become energy efficiency advocates,
driving resident and small business participation in programs. Since 2013, the Company has successfully
partnered with 23 of the state's 39 municipalities through this initiative.
Building upon the success and lessons learned from this initiative, the Company plans to expand these
activities under a transformed Community Solutions initiative during 2021-2023. The Community
Solutions initiative will continue to grow the number and depth of partnerships with Rhode Island
municipalities, while developing new partnerships with other types of organized communities. This will
include geographic communities that encompass multiple towns (e.g. Aquidneck Island), industrial parks
and technology parks, and other organized communities such as industry groupings with common end
uses (e.g. indoor agriculture). The Community Solutions model allows the Company to take an effective
process and set of solutions developed with municipalities and expand to non-municipal communities
with similar characteristics.
Table 10. Community Solutions Partner Characteristics
Energy Efficiency Opportunity Energy intensive facilities with multiple opportunities for improved
efficiency and savings.
Customer Diversity Participating in multiple National Grid programs (e.g. industrial,
small business, residential, etc.).
Customer Engagement Develop long-term goals for the partnership, identify pilot projects,
and address other customer concerns.
Beyond Efficiency Interest in additional products and services such as demand
response, electric vehicles, and emerging technology.
The key elements of all Community Solutions engagements are:
• A single point of contact
• A shared long-term goal for the partnership including quantifiable energy efficiency savings
• Solutions designed to meet the needs of the community
• Opportunity for streamlined program delivery
35
These partnerships offer opportunities for customer education on technologies and energy best
practices. This education element will remain a key component of the initiative. Education supports
increased participation by commercial customers in facilities upgrades, as well as employee and resident
participation in residential offers.
The Company plans to continue to develop mechanisms to make information on energy efficiency
participation and performance within the community easily accessible to support increased action. The
Company will also explore opportunities for additional external funding to support communities to
execute energy efficiency measures and solutions.
4.5 Multi-Year Strategies
This subsection identifies areas of focus for the Company that span multiple years in the 2021-2023
period, as indicated as a potential new requirement of the Standards.
Combined Heat and Power
Combined Heat and Power (CHP) projects involve long cultivation, planning and design timelines, and
complex approval processes. CHP projects are a cost-effective way to reduce operating costs, increase
resiliency, and decrease greenhouse gas emissions. Historically, the CHP program has resulted in
significant energy savings to Rhode Island customers. Key to this success is National Grid’s go-to-
marketing strategy that includes a CHP manager, sales and technical staff, and technical vendors, all of
whom play a role in identifying opportunities and executing on projects. In order to realize additional
CHP savings, National Grid will focus its outreach on customer segments that have been identified as
suitable candidates for CHP. Additionally, the Company will look to increase the number of smaller CHP
units, and target facilities and places of business that can leverage opportunity fuels or renewable
natural gas (e.g. methane from a landfill) as a primary or secondary fuel source.
CHP projects also present challenges from an implementation perspective. These projects involve
substantial capital investments, complex technical requirements for installation, and long time horizons
for interconnection. Taken as a whole, the lead times for CHP projects can range from 12-36 months
before the equipment is installed and interconnection is complete. These complexities pose challenges
in predicting savings realized within a year. To mitigate some of this unpredictability, the Company plans
to address a project’s probability of completion for inclusion in Annual Plans each year.
The Company has experience with CHP projects that have been delayed, which, in turn, has a serious
negative impact on annual budgets and savings targets. Due to this experience, National Grid will only
include CHP projects with realistic expectations of being completed within the calendar year. Typically,
this means that the customer has placed an order for CHP equipment and is expecting the equipment to
be installed within the calendar year. For planning purposes, this helps to ensure the energy savings
targets can be achieved within the calendar year, and at the budgeted cost per savings. For example, a
large CHP project may be 30,000 Annual MWh, representing 30% of the C&I sector anticipated savings,
at an average cost of $180 per MWh. If the project is delayed, there is little chance that other projects
can be completed in time to make up for the 30,000 Annual MWh if those projects were not already in
development.
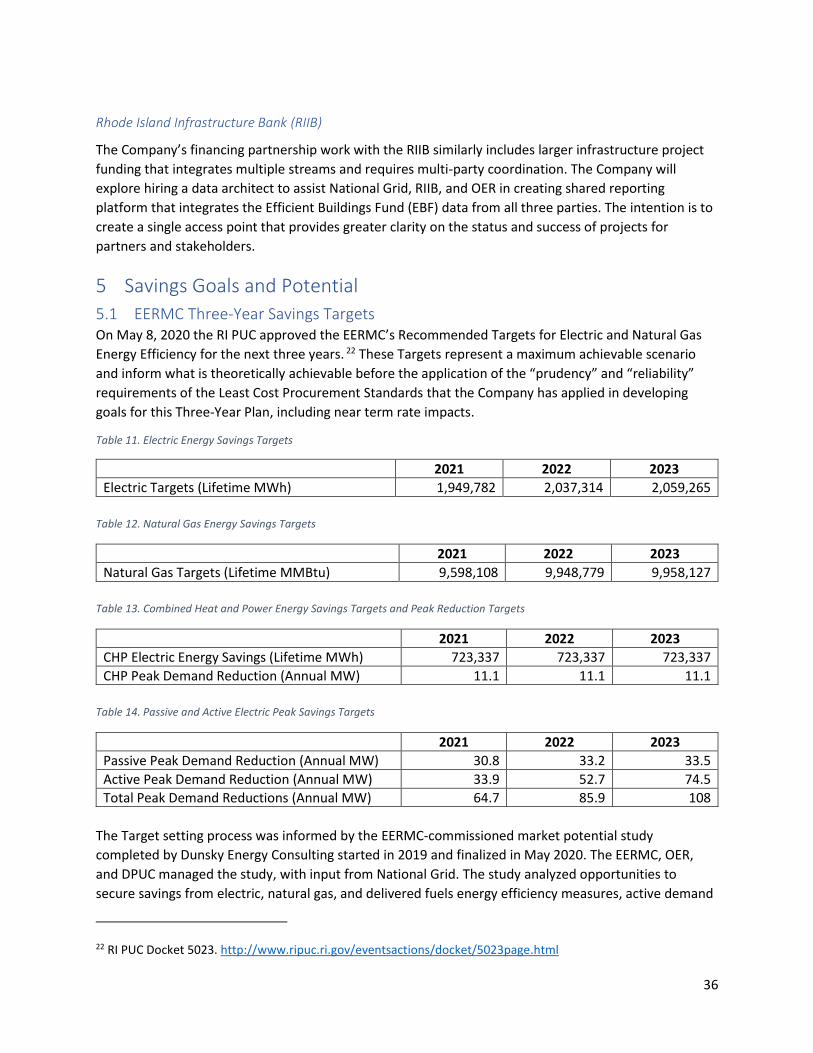
36
Rhode Island Infrastructure Bank (RIIB)
The Company’s financing partnership work with the RIIB similarly includes larger infrastructure project
funding that integrates multiple streams and requires multi-party coordination. The Company will
explore hiring a data architect to assist National Grid, RIIB, and OER in creating shared reporting
platform that integrates the Efficient Buildings Fund (EBF) data from all three parties. The intention is to
create a single access point that provides greater clarity on the status and success of projects for
partners and stakeholders.
5 Savings Goals and Potential
5.1 EERMC Three-Year Savings Targets On May 8, 2020 the RI PUC approved the EERMC’s Recommended Targets for Electric and Natural Gas
Energy Efficiency for the next three years. 22 These Targets represent a maximum achievable scenario
and inform what is theoretically achievable before the application of the “prudency” and “reliability”
requirements of the Least Cost Procurement Standards that the Company has applied in developing
goals for this Three-Year Plan, including near term rate impacts.
Table 11. Electric Energy Savings Targets
2021 2022 2023
Electric Targets (Lifetime MWh) 1,949,782 2,037,314 2,059,265
Table 12. Natural Gas Energy Savings Targets
2021 2022 2023
Natural Gas Targets (Lifetime MMBtu) 9,598,108 9,948,779 9,958,127
Table 13. Combined Heat and Power Energy Savings Targets and Peak Reduction Targets
2021 2022 2023
CHP Electric Energy Savings (Lifetime MWh) 723,337 723,337 723,337
CHP Peak Demand Reduction (Annual MW) 11.1 11.1 11.1
Table 14. Passive and Active Electric Peak Savings Targets
2021 2022 2023
Passive Peak Demand Reduction (Annual MW) 30.8 33.2 33.5
Active Peak Demand Reduction (Annual MW) 33.9 52.7 74.5
Total Peak Demand Reductions (Annual MW) 64.7 85.9 108
The Target setting process was informed by the EERMC-commissioned market potential study
completed by Dunsky Energy Consulting started in 2019 and finalized in May 2020. The EERMC, OER,
and DPUC managed the study, with input from National Grid. The study analyzed opportunities to
secure savings from electric, natural gas, and delivered fuels energy efficiency measures, active demand
22 RI PUC Docket 5023. http://www.ripuc.ri.gov/eventsactions/docket/5023page.html
37
response, heating electrification, combined heat and power (CHP), and solar photovoltaic installation.
The study identified all technically achievable potential, economic potential, and three modeled
scenarios of program achievable potential; a low, mid, and maximum scenario.
The study models were developed starting with the low scenario, which reflects a “business as usual”
case that continues current Company offerings, including program design and delivery methods,
customer rebate and incentive levels, and program budgets. The mid scenario assumes enhancements
to the programs to reduce customer barriers to adoption of energy efficiency and increases incentives to
further improve customer economics. The maximum achievable scenario model assumes the same
barrier reductions as the mid scenario, but increases customer incentives to fully eliminate the
customer’s share of the incremental cost of the efficiency measures.
The EERMC reviewed each scenario of program achievable potential and ultimately filed Targets
associated with the maximum achievable scenario for review and approval by the PUC. Additionally, the
EERMC made two significant changes from past Targets filings. First, savings targets were provided in
lifetime energy savings units, rather than annual energy savings units. Second, this is the first time a
delivered fuels target was included.
The PUC approved the electric energy efficiency, natural gas energy efficiency, CHP energy and peak
demand savings, and electric peak demand savings targets filed by the EERMC, but did not adopt the
delivered fuel target. Thus, the Commission approved 2021-2023 Targets represent maximum program
achievable potential. These are the most aggressive, and most expensive, achievable targets developed
by the potential study, and assume National Grid will fully incentivize all efficiency measures, effectively
eliminating the customer’s share of the incremental cost. When approving these Targets, the PUC
acknowledged that the Targets did not account for prudency and reliability, which are requirements the
Company must demonstrate in its plans. Further, the Commissioners acknowledged this as a difference
from past target setting processes and that these Targets represented high goal posts for what is
potentially achievable with efficiency programs, not accounting for other constraints.
5.1.1 How the Potential Study informed Goals The Company used the market potential study to assess opportunities during the planning process for
this Draft Three-Year Plan and will continue to do so as this draft is finalized. In coordination with the
EERMC and their consultants, the National Grid team cross-referenced the market potential study
models’ output with the Company’s own historic data on measures and end use levels during the
planning process.
National Grid continues to work closely with the EERMC consultants to understand the assumptions
embedded in the market potential study, with particular attention to where they differ from the
Company’s experience on the ground in Rhode Island. For example, the customer barrier adoption levels
assumed in the potential study differ from program experience. This Draft Three-Year Plan reflects a
preliminary incorporation of the potential study results. The Company expects additional conversations
with the EERMC consultants following this draft, which will inform refinement of the goals for each
program, leading to a final version in August. Over the next three years, the market potential study
results will continue to inform Annual Plans, with the Company closely examining what savings levels are
achievable annually and what enhancements can be made to improve programs.

38
This Draft Three-Year Plan includes multiple innovative strategies and program enhancements to
successfully capture the prioritized achievable potential and deliver the most cost-effective energy
savings for customers. These strategies are described Section 4 of the Draft Plan.
5.1.2 Quantitative Savings Goals Table 15, Table 16, and Table 17 show the electric and gas portfolio savings goals with associated
benefits, costs, and benefit-cost results in comparison to the Targets as proposed by the EERMC and
approved by the PUC.
Table 15. 2021-2023 Docket 5023 Electric Energy Targets and Three-Year Plan Proposed Electric Energy Goals23
Ref Electric Energy 2021 2022 2023
a Docket 5023 Electric Energy Targets (Lifetime MWh) 1,949,782 2,037,314 2,059,265
b Docket 5023 Electric Energy CHP Targets (Lifetime MWh)24 723,337 723,337 723,337
c Docket 5023 Electric Energy Total (Lifetime MWh) (a + b) 2,673,119 2,760,651 2,782,602
d 3YP Electric Energy Goal (Lifetime MWh) 1,377,193 1,227,266 1,233,988
e 3YP CHP Energy Goal (Lifetime MWh) 109,460 109,460 109,460
f 3YP Electric Goals Total (Lifetime MWh) 1,486,653 1,336,726 1,343,448
g Difference (f – c) -1,186,466 -1,423,925 -1,439,154
h Docket 5023 Electric Energy Targets (Annual MWh) 182,299 187,378 171,353
i Docket 5023 Electric Energy CHP Targets (Annual MWh) 45,209 45,209 45,209
j Docket 5023 Electric Energy Total (Annual MWh) (h + i) 227,508 232,587 216,562
k 3YP Electric Energy Goal (Annual MWh) 148,444 127,864 126,691
l 3YP CHP Energy Goal (Annual MWh) 5,473 5,473 5,473
m 3YP Electric Goals Total (Annual MWh) (k + l) 153,917 133,337 132,164
n Difference (m – j) -73,591 -99,250 -84,398
Table 16. 2021-2023 Docket 5023 Natural Energy Targets and Three-Year Plan Proposed Natural Gas Energy Goals25
Ref Natural Gas Energy 2021 2022 2023
a Docket 5023 Natural Gas Targets (Lifetime MMBtu) 9,598,108 9,948,779 9,958,127
b 3YP Natural Gas Goals (Lifetime MMBtu) 4,696,581 5,058,290 5,367,851
c Difference (b – a) -4,901,527 -4,890,489 -4,590,276
d Docket 5023 Natural Gas Targets (Annual MMBtu) 749,344 770,569 787,805
e 3YP Natural Gas Goals (Annual MMBtu) 417,882 441,840 459,518
f Difference (e – d) -331,462 -328,729 -328,287
23 The RI PUC approved Targets in lifetime savings units. The equivalent annual savings units from the Market Potential Study “Max Scenario” that is the source of the Targets are shown for comparability with prior Plans that used annual units. 24 The approved targets also included 11.1 MW of annual peak demand reduction from CHP for each year of 2021 - 2023. Not shown in this table. 25 The RI PUC approved Targets in lifetime savings units. The equivalent annual savings units from the Market Potential Study “Max Scenario” that is the source of the Targets are shown for comparability with prior Plans that used annual units.
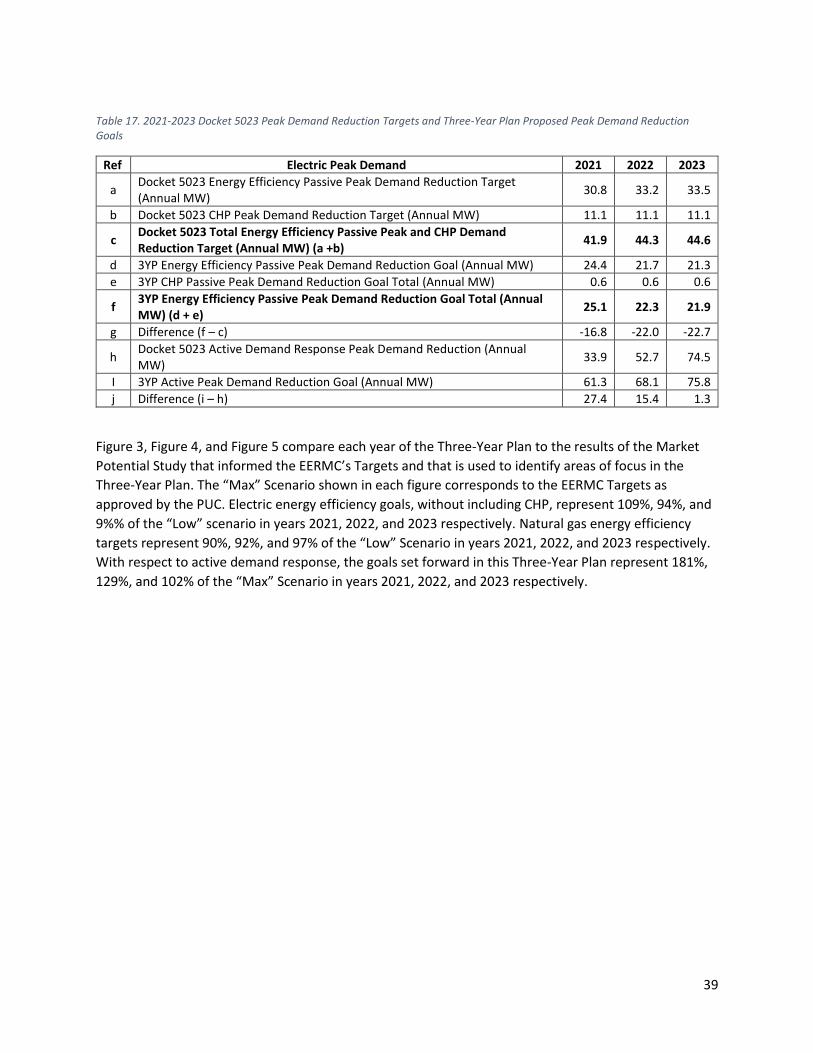
39
Table 17. 2021-2023 Docket 5023 Peak Demand Reduction Targets and Three-Year Plan Proposed Peak Demand Reduction Goals
Ref Electric Peak Demand 2021 2022 2023
a Docket 5023 Energy Efficiency Passive Peak Demand Reduction Target (Annual MW)
30.8 33.2 33.5
b Docket 5023 CHP Peak Demand Reduction Target (Annual MW) 11.1 11.1 11.1
c Docket 5023 Total Energy Efficiency Passive Peak and CHP Demand Reduction Target (Annual MW) (a +b)
41.9 44.3 44.6
d 3YP Energy Efficiency Passive Peak Demand Reduction Goal (Annual MW) 24.4 21.7 21.3
e 3YP CHP Passive Peak Demand Reduction Goal Total (Annual MW) 0.6 0.6 0.6
f 3YP Energy Efficiency Passive Peak Demand Reduction Goal Total (Annual MW) (d + e)
25.1 22.3 21.9
g Difference (f – c) -16.8 -22.0 -22.7
h Docket 5023 Active Demand Response Peak Demand Reduction (Annual MW)
33.9 52.7 74.5
I 3YP Active Peak Demand Reduction Goal (Annual MW) 61.3 68.1 75.8
j Difference (i – h) 27.4 15.4 1.3
Figure 3, Figure 4, and Figure 5 compare each year of the Three-Year Plan to the results of the Market
Potential Study that informed the EERMC’s Targets and that is used to identify areas of focus in the
Three-Year Plan. The “Max” Scenario shown in each figure corresponds to the EERMC Targets as
approved by the PUC. Electric energy efficiency goals, without including CHP, represent 109%, 94%, and
9%% of the “Low” scenario in years 2021, 2022, and 2023 respectively. Natural gas energy efficiency
targets represent 90%, 92%, and 97% of the “Low” Scenario in years 2021, 2022, and 2023 respectively.
With respect to active demand response, the goals set forward in this Three-Year Plan represent 181%,
129%, and 102% of the “Max” Scenario in years 2021, 2022, and 2023 respectively.
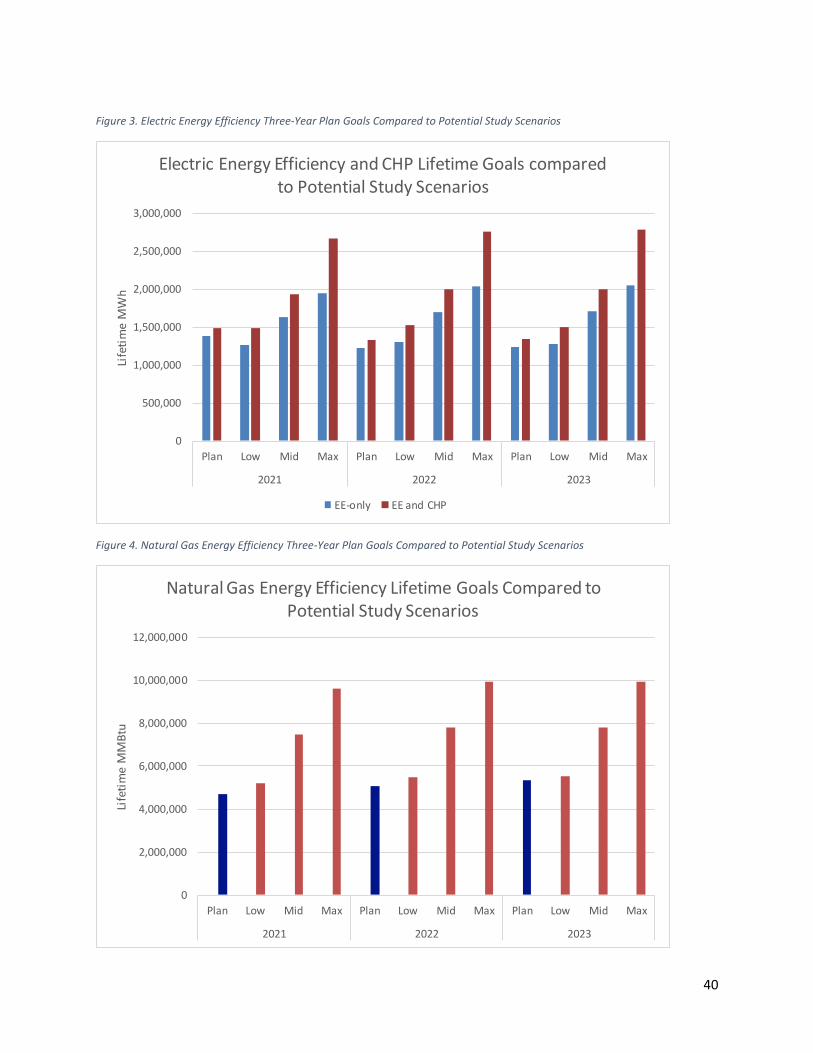
40
Figure 3. Electric Energy Efficiency Three-Year Plan Goals Compared to Potential Study Scenarios
Figure 4. Natural Gas Energy Efficiency Three-Year Plan Goals Compared to Potential Study Scenarios
0
500,000
1,000,000
1,500,000
2,000,000
2,500,000
3,000,000
Plan Low Mid Max Plan Low Mid Max Plan Low Mid Max
2021 2022 2023
Life
tim
e M
Wh
Electric Energy Efficiency and CHP Lifetime Goals compared to Potential Study Scenarios
EE-only EE and CHP
0
2,000,000
4,000,000
6,000,000
8,000,000
10,000,000
12,000,000
Plan Low Mid Max Plan Low Mid Max Plan Low Mid Max
2021 2022 2023
Life
tim
e M
MB
tu
Natural Gas Energy Efficiency Lifetime Goals Compared to Potential Study Scenarios

41
Figure 5. Electric Active Demand Response Three-Year Plan Goals Compared to Potential Study Scenarios
5.1.3 Annual Plans Over the next three years, National Grid will continue to evaluate energy efficiency opportunities as
markets develop and change and will account for such changes in its Annual Plans. The recent past saw
the transformation of the lighting market and reduced opportunities for the programs to claim savings
from efficient lighting. Alternatively, over the course of the last three-year plan, gas savings
opportunities were identified and ensuing annual plans were adjusted to increase goals accordingly. The
recent pause in energy efficiency program implementation prompted by the COVID-19 pandemic is also
likely to impact the Company’s savings trajectory, albeit in a negative manner. As each Annual Plan is
developed, the savings may deviate from the goals established in this Draft Three-Year Plan as a result of
changing market conditions or other unforeseen circumstances.
The EERMC’s Targets Filing Memorandum acknowledge this potential for change:
“Further, to support consideration of the distinction between Targets and the goals associated
with Three-Year EE Procurement Plans and Annual EE Plans, we acknowledge that while the
2021-2023 electric and natural gas savings targets have been developed using the best
information and data available at this time, additional relevant information is likely to be
learned as time passes. Consequently, the annual savings targets, including considerations such
as their associated budgets as estimated during the planning process, should be reviewed each
year during the development of the Annual Plans. Following this review, the plan goals should
either be determined to remain identical to the Targets, or revised in light of new information…
The parties participating in the Annual Plan development should agree that revisions to the
0.0
10.0
20.0
30.0
40.0
50.0
60.0
70.0
80.0
Plan Low Mid Max Plan Low Mid Max Plan Low Mid Max
2021 2022 2023
An
nu
al M
W
Active Demand Response compared to Potential Study Scenarios
42
annual energy savings targets should be based only on clearly documented changes in cost-
effective resource availability, or unforeseeable and/or unavoidable constraints to their full
pursuit and achievement”.26
National Grid, in collaboration with the EERMC and stakeholders, will seek opportunities to continue
driving efficiency savings in its Annual Plans, including revisiting the results of the market potential study
to inform annual planning.
6 Funding Plan The following funding sources may be used in each year. The amounts from each source will be detailed
in Annual Plans. The electric funding plan is funded by the first three sources.
1. One line on the customers’ bill currently labeled “Energy Efficiency Programs” comprised of the existing energy efficiency program charge of $0.01121 per kWh, plus a fully reconciling funding mechanism charge in accordance with RI Gen. Laws § 39-1-27.7. This total of the two factors is represented by the “EE Charge per kWh” row 17 in Attachment 1. Energy Efficiency Funding Plan.
2. Revenue resulting from the participation of energy efficiency resources in ISO-New England’s forward capacity market (FCM).
3. Projected large C&I commitments. 4. Proceeds from the auction of Regional Greenhouse Gas Initiative allowances pursuant to RI Gen.
Laws § 23-82.6. 5. Funds from any state, federal, or international climate or cap and trade legislation or regulation
including, but not limited to, revenue or allowances allocated to expand energy efficiency programs.
6. Other sources as may be identified by the EERMC and the Company.
The gas funding plan is funded by the following sources:
1. One line on the customers’ bill labeled “Energy Efficiency Programs” comprised of the existing average energy efficiency program charge of $0.836 per Dth, plus a fully reconciling funding mechanism charge in accordance with RI Gen. Laws § 39-1-27.7. This total of the two factors is represented by the “EE Program Charge per Dth”, rows 15a and 15b, in Attachment 1. Energy Efficiency Funding Plan.
2. Low Income Weatherization funds from Base Rates.
There are many uncertainties associated with the exact amount of additional funding needed, such as
company sales, customer co-payments, commitments made for future years, the settlement price for
future FCM auctions, identification of additional outside sources of funding, the impacts of COVID-19 on
collections, and the Company’s success in minimizing costs in order to maximize customer benefit. In
26 EERMC Targets Filing Memorandum in RI PUC Docket 5023. http://www.ripuc.ri.gov/eventsactions/docket/5023-EERMC-Targets-Yrs2021-2032Memo%20+%20Slides_2020_03_23.pdf

43
each subsequent Annual Plan, the Company will incorporate new information on each of these
elements.
Due to these uncertainties, the Company illustrates the amount of funding it expects to need in each
year of the Draft Three-Year Plan, and asks for provisional approval of these amounts in order to guide
the development of the Annual Plans. The Company is required to submit its Annual Plans (including a
detailed budget and implementation plan) to the Commission for review and consideration, including a
detailed budget and implementation plan each year by November 1 in the initial year and by October 15
in the following two years.
Although Attachment 1. Energy Efficiency Funding Plan does not show sector-specific funding levels, the
Company will continue its practice of having the residential and commercial and industrial sectors
subsidize income-eligible sector energy efficiency programs in order to provide equity in the availability
of program funds and opportunities to benefit from energy efficiency, which is identified as a desirable
objective in the Standards.
The Company intends to continue to work with various market actors (vendors, distributors, designers,
and builders) to obtain the best pricing for services to achieve program savings goals while controlling
costs. The Annual Plans, including the upcoming filing of the 2021 Annual Plan, will reflect progress
made in leveraging other sources of funding, if applicable.
7 Cost Effectiveness
7.1 RI Test In accordance with the revised Least-Cost Procurement Standards (see Section 3.4), the Company has
evaluated the cost-effectiveness of the proposed investments in this Draft Three-Year Plan using the
Rhode Island Benefit Cost Test (RI Test). The RI Test was refined to comply with the Docket 4600 Benefit-
Cost Framework, which defines how investments should be assessed, and has been in use since 2018.
Prior to the PUC’s completion of the Docket 4600 Benefit-Cost Framework, the Least Cost Procurement
Standards issued triennially defined the categories of benefits and costs to be included in the RI Test.
The shift to using the RI Test has been a positive development for energy efficiency. Per the currently-
effective Standards, the RI Test “more fully reflects the policy objectives of the state with regard to
energy, its costs, benefits, and environmental and societal impacts.”27 Accounting for all costs and
benefits associated with energy efficiency provides a more robust accounting of the societal benefits of
energy efficiency programs deliver to electric and gas customers, the state, and society.
The cost-effectiveness analyses of the proposed programs use avoided energy supply costs developed
by Synapse Energy Economics as part of the “Avoided Energy Supply Components in New England: 2018
Report” (2018 AESC Study), sponsored by New England’s electric and gas efficiency program
administrators.28 The avoided costs reflect current and expected market conditions and are highly
27 Least-Cost Procurement Standards (Standards) approved at the Open Meeting on April 27, 2017 in Docket 4684.
Note that at the time of this draft revised standards in Docket 5015 were not finalized. 28 Synapse Energy Economics, Avoided Energy Supply Components in New England: 2018 Report, Amended October 24, 2018.
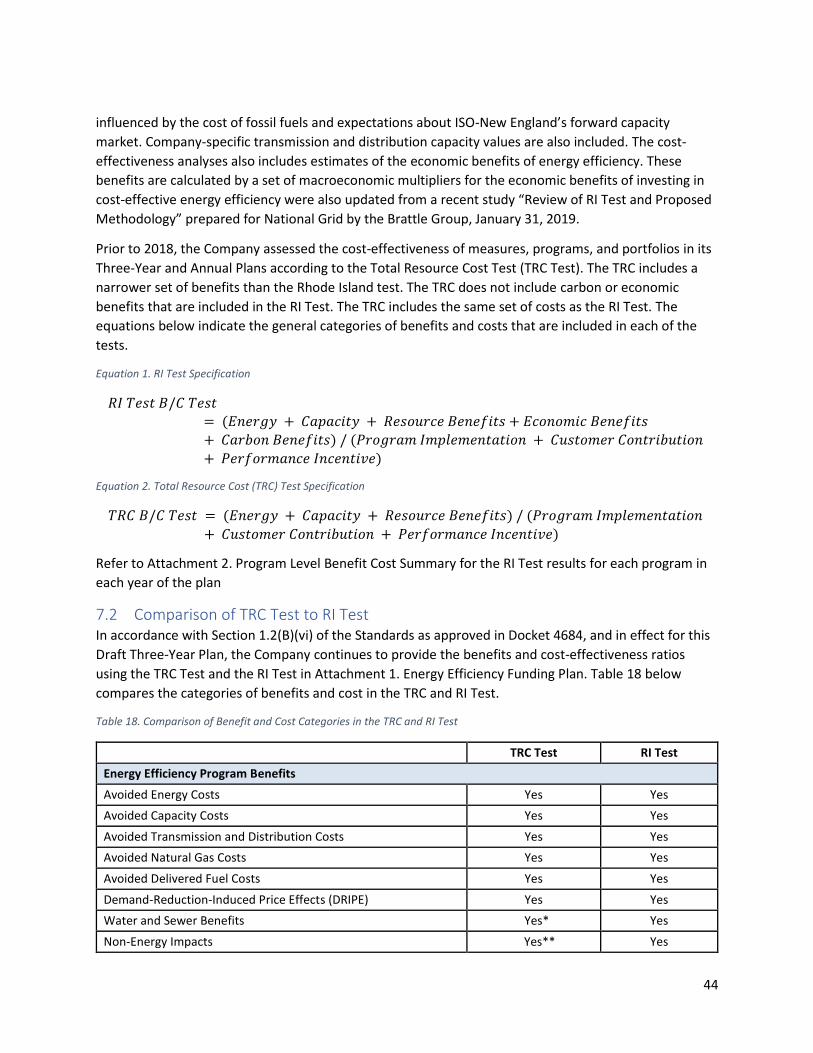
44
influenced by the cost of fossil fuels and expectations about ISO-New England’s forward capacity
market. Company-specific transmission and distribution capacity values are also included. The cost-
effectiveness analyses also includes estimates of the economic benefits of energy efficiency. These
benefits are calculated by a set of macroeconomic multipliers for the economic benefits of investing in
cost-effective energy efficiency were also updated from a recent study “Review of RI Test and Proposed
Methodology” prepared for National Grid by the Brattle Group, January 31, 2019.
Prior to 2018, the Company assessed the cost-effectiveness of measures, programs, and portfolios in its
Three-Year and Annual Plans according to the Total Resource Cost Test (TRC Test). The TRC includes a
narrower set of benefits than the Rhode Island test. The TRC does not include carbon or economic
benefits that are included in the RI Test. The TRC includes the same set of costs as the RI Test. The
equations below indicate the general categories of benefits and costs that are included in each of the
tests.
Equation 1. RI Test Specification
𝑅𝐼 𝑇𝑒𝑠𝑡 𝐵/𝐶 𝑇𝑒𝑠𝑡
= (𝐸𝑛𝑒𝑟𝑔𝑦 + 𝐶𝑎𝑝𝑎𝑐𝑖𝑡𝑦 + 𝑅𝑒𝑠𝑜𝑢𝑟𝑐𝑒 𝐵𝑒𝑛𝑒𝑓𝑖𝑡𝑠 + 𝐸𝑐𝑜𝑛𝑜𝑚𝑖𝑐 𝐵𝑒𝑛𝑒𝑓𝑖𝑡𝑠
+ 𝐶𝑎𝑟𝑏𝑜𝑛 𝐵𝑒𝑛𝑒𝑓𝑖𝑡𝑠) / (𝑃𝑟𝑜𝑔𝑟𝑎𝑚 𝐼𝑚𝑝𝑙𝑒𝑚𝑒𝑛𝑡𝑎𝑡𝑖𝑜𝑛 + 𝐶𝑢𝑠𝑡𝑜𝑚𝑒𝑟 𝐶𝑜𝑛𝑡𝑟𝑖𝑏𝑢𝑡𝑖𝑜𝑛
+ 𝑃𝑒𝑟𝑓𝑜𝑟𝑚𝑎𝑛𝑐𝑒 𝐼𝑛𝑐𝑒𝑛𝑡𝑖𝑣𝑒)
Equation 2. Total Resource Cost (TRC) Test Specification
𝑇𝑅𝐶 𝐵/𝐶 𝑇𝑒𝑠𝑡 = (𝐸𝑛𝑒𝑟𝑔𝑦 + 𝐶𝑎𝑝𝑎𝑐𝑖𝑡𝑦 + 𝑅𝑒𝑠𝑜𝑢𝑟𝑐𝑒 𝐵𝑒𝑛𝑒𝑓𝑖𝑡𝑠) / (𝑃𝑟𝑜𝑔𝑟𝑎𝑚 𝐼𝑚𝑝𝑙𝑒𝑚𝑒𝑛𝑡𝑎𝑡𝑖𝑜𝑛
+ 𝐶𝑢𝑠𝑡𝑜𝑚𝑒𝑟 𝐶𝑜𝑛𝑡𝑟𝑖𝑏𝑢𝑡𝑖𝑜𝑛 + 𝑃𝑒𝑟𝑓𝑜𝑟𝑚𝑎𝑛𝑐𝑒 𝐼𝑛𝑐𝑒𝑛𝑡𝑖𝑣𝑒)
Refer to Attachment 2. Program Level Benefit Cost Summary for the RI Test results for each program in
each year of the plan
7.2 Comparison of TRC Test to RI Test In accordance with Section 1.2(B)(vi) of the Standards as approved in Docket 4684, and in effect for this
Draft Three-Year Plan, the Company continues to provide the benefits and cost-effectiveness ratios
using the TRC Test and the RI Test in Attachment 1. Energy Efficiency Funding Plan. Table 18 below
compares the categories of benefits and cost in the TRC and RI Test.
Table 18. Comparison of Benefit and Cost Categories in the TRC and RI Test
TRC Test RI Test
Energy Efficiency Program Benefits
Avoided Energy Costs Yes Yes
Avoided Capacity Costs Yes Yes
Avoided Transmission and Distribution Costs Yes Yes
Avoided Natural Gas Costs Yes Yes
Avoided Delivered Fuel Costs Yes Yes
Demand-Reduction-Induced Price Effects (DRIPE) Yes Yes
Water and Sewer Benefits Yes* Yes
Non-Energy Impacts Yes** Yes
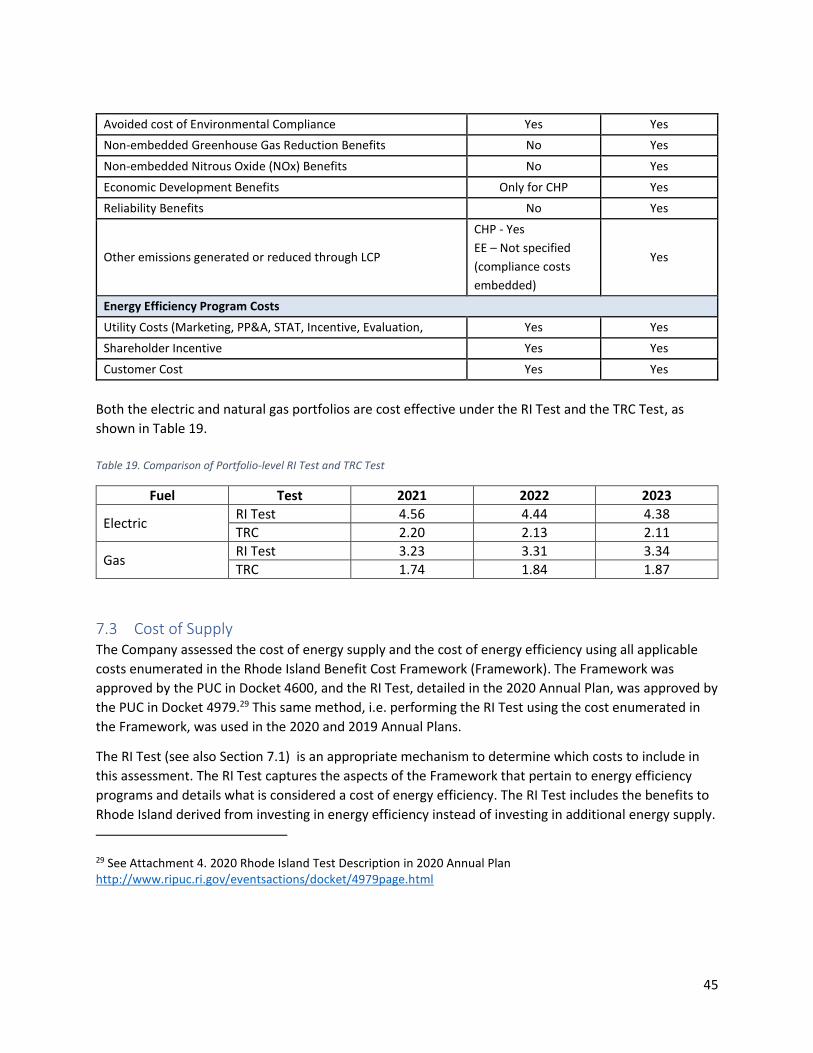
45
Avoided cost of Environmental Compliance Yes Yes
Non-embedded Greenhouse Gas Reduction Benefits No Yes
Non-embedded Nitrous Oxide (NOx) Benefits No Yes
Economic Development Benefits Only for CHP Yes
Reliability Benefits No Yes
Other emissions generated or reduced through LCP
CHP - Yes
EE – Not specified
(compliance costs
embedded)
Yes
Energy Efficiency Program Costs
Utility Costs (Marketing, PP&A, STAT, Incentive, Evaluation, Yes Yes
Shareholder Incentive Yes Yes
Customer Cost Yes Yes
Both the electric and natural gas portfolios are cost effective under the RI Test and the TRC Test, as
shown in Table 19.
Table 19. Comparison of Portfolio-level RI Test and TRC Test
Fuel Test 2021 2022 2023
Electric RI Test 4.56 4.44 4.38
TRC 2.20 2.13 2.11
Gas RI Test 3.23 3.31 3.34
TRC 1.74 1.84 1.87
7.3 Cost of Supply The Company assessed the cost of energy supply and the cost of energy efficiency using all applicable
costs enumerated in the Rhode Island Benefit Cost Framework (Framework). The Framework was
approved by the PUC in Docket 4600, and the RI Test, detailed in the 2020 Annual Plan, was approved by
the PUC in Docket 4979.29 This same method, i.e. performing the RI Test using the cost enumerated in
the Framework, was used in the 2020 and 2019 Annual Plans.
The RI Test (see also Section 7.1) is an appropriate mechanism to determine which costs to include in
this assessment. The RI Test captures the aspects of the Framework that pertain to energy efficiency
programs and details what is considered a cost of energy efficiency. The RI Test includes the benefits to
Rhode Island derived from investing in energy efficiency instead of investing in additional energy supply.
29 See Attachment 4. 2020 Rhode Island Test Description in 2020 Annual Plan http://www.ripuc.ri.gov/eventsactions/docket/4979page.html

46
For the purpose of the RI Test, these energy efficiency benefits are described as avoided costs. The
avoided costs can also be applied as the costs of procuring additional energy supply or cost of supply.
These include costs incurred by the utility to implement the Draft Three-Year Plan and the expense
borne by the customer for its share of the energy efficiency measure cost. The 2018 AESC Study is the
source for many of the values used in running the RI Test analysis for this Draft Three-Year Plan.30
The Company will perform the RI Test to compare the cost of energy efficiency to the cost of energy
supply using the costs categories illustrated in Table 20. The table offers an explanation for why the
Company believes each cost category is either appropriate or not appropriate for inclusion in the
assessment.
Table 20. List of the Cost of Energy Efficiency and Costs of Energy Supply
30 Synapse Energy Economics, Avoided Energy Supply Components in New England: 2018 Report, March 30, 2018.
Cost of Energy Efficiency
Cost Included Explanation
Utility Costs Yes These costs are incurred to achieve implementation of energy efficiency measures and programs. Includes all costs in Attachment 1. Energy Efficiency Funding Plan.
Participant Costs Yes Customer contribution to the installation cost of the efficient measure. Customer costs included in Attachment 1. Energy Efficiency Funding Plan.
Costs of Energy Supply
Electric Energy Costs
Yes Represents the cost of purchasing electric energy supply.
Electric Generation Costs
Yes Represents cost of generation capacity in ISO-NE.
Electric Transmission Capacity Costs
Yes Represents Pool Transmission Facilities (PTF) cost.
Electric Distribution Capacity Costs
Yes Represents the cost of distribution capacity related to increased load.
Natural Gas Costs Yes Represents the cost of purchasing natural gas supply.
Fuel Costs Yes
Non-regulated delivered fuels are an energy supply cost to customers that utilize these fuels for heating. The fuel costs in this category are separate from those embedded in the cost of the electric market. While not a direct cost of electric energy supply, National Grid includes incentives for delivered fuel energy efficiency measures in its electric portfolio. Therefore, to achieve symmetry with costs associated with electric energy efficiency, delivered fuels costs should be included in this comparison.
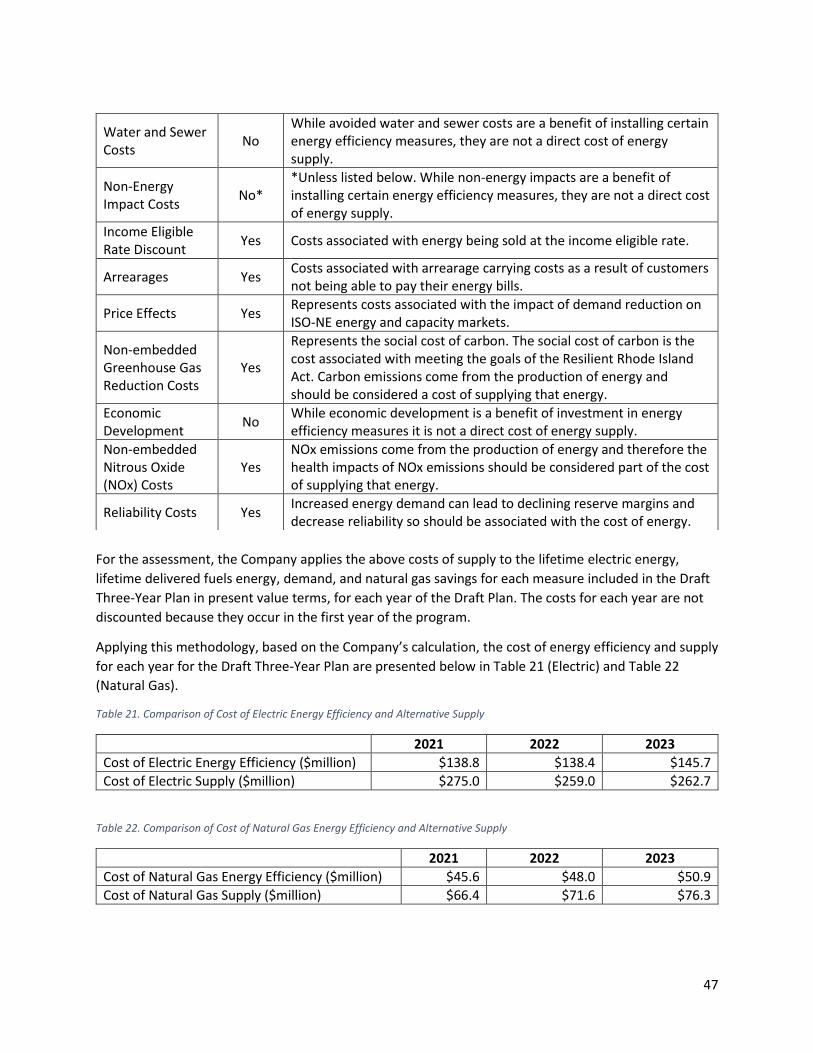
47
For the assessment, the Company applies the above costs of supply to the lifetime electric energy,
lifetime delivered fuels energy, demand, and natural gas savings for each measure included in the Draft
Three-Year Plan in present value terms, for each year of the Draft Plan. The costs for each year are not
discounted because they occur in the first year of the program.
Applying this methodology, based on the Company’s calculation, the cost of energy efficiency and supply
for each year for the Draft Three-Year Plan are presented below in Table 21 (Electric) and Table 22
(Natural Gas).
Table 21. Comparison of Cost of Electric Energy Efficiency and Alternative Supply
2021 2022 2023
Cost of Electric Energy Efficiency ($million) $138.8 $138.4 $145.7
Cost of Electric Supply ($million) $275.0 $259.0 $262.7
Table 22. Comparison of Cost of Natural Gas Energy Efficiency and Alternative Supply
2021 2022 2023
Cost of Natural Gas Energy Efficiency ($million) $45.6 $48.0 $50.9
Cost of Natural Gas Supply ($million) $66.4 $71.6 $76.3
Water and Sewer Costs
No While avoided water and sewer costs are a benefit of installing certain energy efficiency measures, they are not a direct cost of energy supply.
Non-Energy Impact Costs
No* *Unless listed below. While non-energy impacts are a benefit of installing certain energy efficiency measures, they are not a direct cost of energy supply.
Income Eligible Rate Discount
Yes Costs associated with energy being sold at the income eligible rate.
Arrearages Yes Costs associated with arrearage carrying costs as a result of customers not being able to pay their energy bills.
Price Effects Yes Represents costs associated with the impact of demand reduction on ISO-NE energy and capacity markets.
Non-embedded Greenhouse Gas Reduction Costs
Yes
Represents the social cost of carbon. The social cost of carbon is the cost associated with meeting the goals of the Resilient Rhode Island Act. Carbon emissions come from the production of energy and should be considered a cost of supplying that energy.
Economic Development
No While economic development is a benefit of investment in energy efficiency measures it is not a direct cost of energy supply.
Non-embedded Nitrous Oxide (NOx) Costs
Yes NOx emissions come from the production of energy and therefore the health impacts of NOx emissions should be considered part of the cost of supplying that energy.
Reliability Costs Yes Increased energy demand can lead to declining reserve margins and decrease reliability so should be associated with the cost of energy.
48
Based on these calculations, each year of the Draft Plan represents between a $120.6 to $136.2 million
savings for electric energy efficiency, and between a $20.8 to $25.4 million savings for gas energy
efficiency over the lifetime of the energy efficiency measures.
7.4 Environmentally Responsible In accordance with the Least-Cost Procurement Standards approved in Docket 4684 and in place at the
time of this draft and as described in Section 3.4, the Company will procure energy efficiency savings in
an environmentally responsible manner. Energy efficiency represents the most environmentally
responsible energy supply because it avoids consumption regardless of the source of that energy that is
avoided.
7.4.1 Greenhouse Gas Reduction Values The Resilient Rhode Island Act of 2014 set a greenhouse gas (GHG) emissions reduction goal of 80%
below 1990 levels by 2050, and National Grid’s Northeast 80x50 Pathway adopts the same goal.3132
Continuing from the approach used in the 2020 Annual Energy Efficiency Plan, the Company applies the
value of carbon emissions as estimated by the AESC 2018 Report (October 2018 re-release). The report
determined that the marginal abatement cost of CO2 emissions for New England is $68 per short ton,
based on offshore wind as the abatement technology. The costs of compliance with the Regional
Greenhouse Gas Initiative (RGGI) are already included or “embedded” in the projected electric energy
market prices. Therefore, the difference between the $68 per short ton societal cost and the RGGI
compliance costs embedded in projected energy market prices represents the value of carbon emissions
not included in the avoided energy costs.
The electric, gas, and oil energy efficiency measures proposed in this Draft Three-Year Plan will avoid
over 2,943,099 million tons of carbon over the lifetime of the installed measures.33 These reductions will
provide a meaningful contribution to the State’s goal to reduce greenhouse gas as set forth in the
Resilient Rhode Island Act of 2014 and the Company’s Northeast Pathway.
8 Rate and Bill Impacts Energy efficiency investments result in lower costs over the life of installed measures due to avoided
energy usage, price suppression, and avoided infrastructure investments. This investment is funded by a
surcharge on customers’ bills. In each Annual Energy Efficiency Plan, National Grid conducts a Bill Impact
Analysis to determine if all customers, even those who do not participate in energy efficiency projects,
benefit by having lower future energy costs. Previous analysis found that over the lifetime of energy
efficiency programs, the average Rhode Island customer’s bill is lower than it would have been without
such programs. National Grid will continue to conduct the Bill Impact and rate impact analysis in Annual
Plans and is currently undertaking a project to develop an enhanced natural gas bill and rate impact
31 R.I. Gen. Laws § 42-6.2 32 National Grid Northeast 80x50 Pathway: https://www.nationalgridus.com/news/assets/80x50-white-paper-final.pdf 33 This includes the net impact of EE measures on carbon emissions. The marginal carbon emission rates are from “Avoided Energy Supply Components in New England: 2018 Report” Appendix K. pages 368-370. https://www.synapse-energy.com/sites/default/files/AESC-2018-17-080-Oct-ReRelease.pdf
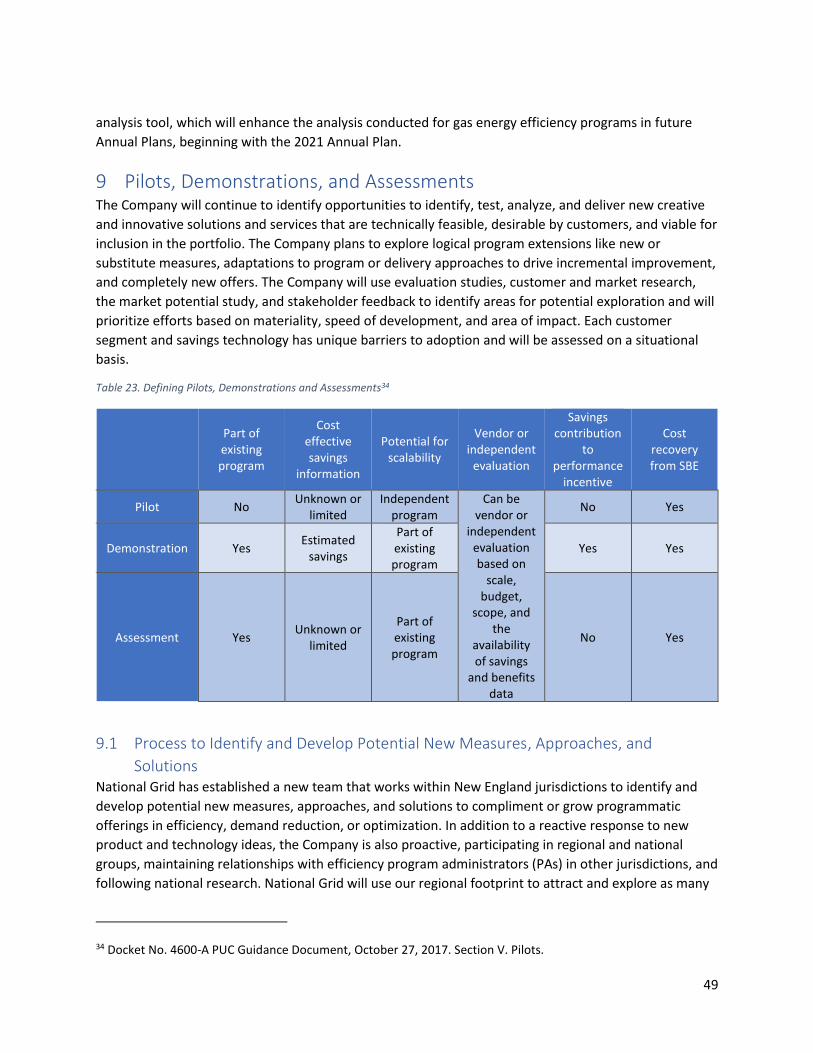
49
analysis tool, which will enhance the analysis conducted for gas energy efficiency programs in future
Annual Plans, beginning with the 2021 Annual Plan.
9 Pilots, Demonstrations, and Assessments The Company will continue to identify opportunities to identify, test, analyze, and deliver new creative
and innovative solutions and services that are technically feasible, desirable by customers, and viable for
inclusion in the portfolio. The Company plans to explore logical program extensions like new or
substitute measures, adaptations to program or delivery approaches to drive incremental improvement,
and completely new offers. The Company will use evaluation studies, customer and market research,
the market potential study, and stakeholder feedback to identify areas for potential exploration and will
prioritize efforts based on materiality, speed of development, and area of impact. Each customer
segment and savings technology has unique barriers to adoption and will be assessed on a situational
basis.
Table 23. Defining Pilots, Demonstrations and Assessments34
Part of existing program
Cost effective savings
information
Potential for scalability
Vendor or independent
evaluation
Savings contribution
to performance
incentive
Cost recovery from SBE
Pilot No Unknown or
limited Independent
program Can be
vendor or independent
evaluation based on
scale, budget,
scope, and the
availability of savings
and benefits data
No Yes
Demonstration Yes Estimated
savings
Part of existing program
Yes Yes
Assessment Yes Unknown or
limited
Part of existing program
No Yes
9.1 Process to Identify and Develop Potential New Measures, Approaches, and
Solutions National Grid has established a new team that works within New England jurisdictions to identify and
develop potential new measures, approaches, and solutions to compliment or grow programmatic
offerings in efficiency, demand reduction, or optimization. In addition to a reactive response to new
product and technology ideas, the Company is also proactive, participating in regional and national
groups, maintaining relationships with efficiency program administrators (PAs) in other jurisdictions, and
following national research. National Grid will use our regional footprint to attract and explore as many
34 Docket No. 4600-A PUC Guidance Document, October 27, 2017. Section V. Pilots.
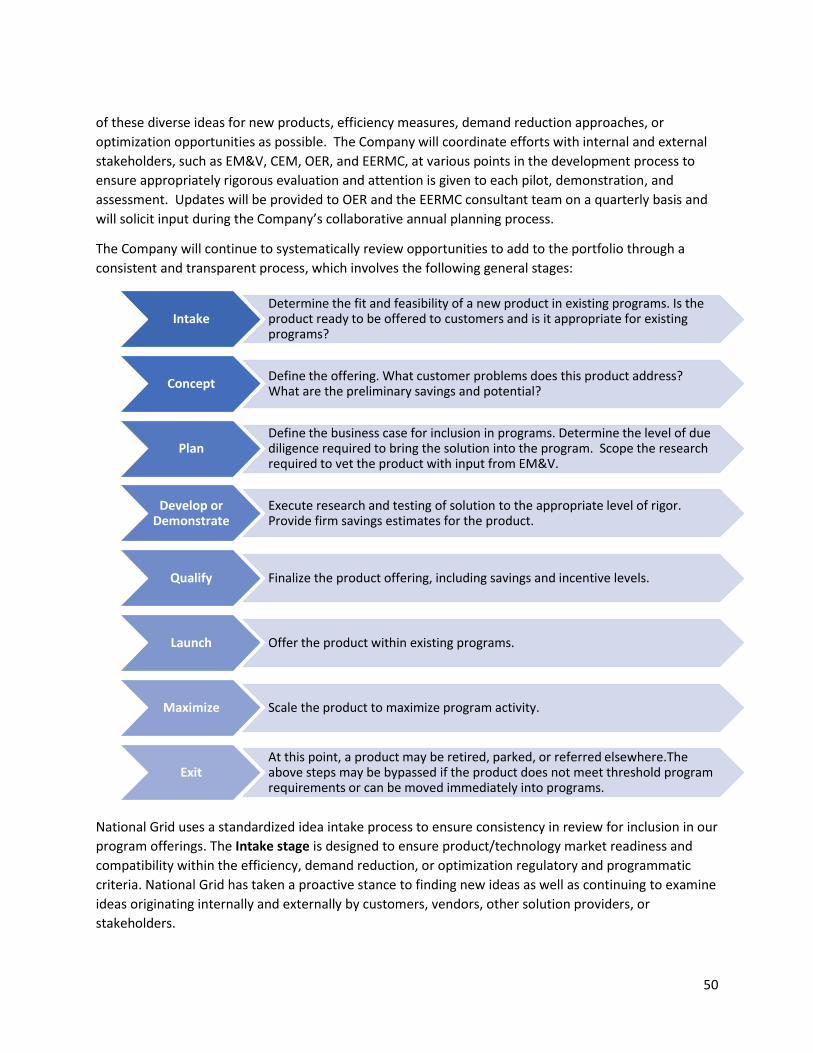
50
of these diverse ideas for new products, efficiency measures, demand reduction approaches, or
optimization opportunities as possible. The Company will coordinate efforts with internal and external
stakeholders, such as EM&V, CEM, OER, and EERMC, at various points in the development process to
ensure appropriately rigorous evaluation and attention is given to each pilot, demonstration, and
assessment. Updates will be provided to OER and the EERMC consultant team on a quarterly basis and
will solicit input during the Company’s collaborative annual planning process.
The Company will continue to systematically review opportunities to add to the portfolio through a
consistent and transparent process, which involves the following general stages:
National Grid uses a standardized idea intake process to ensure consistency in review for inclusion in our
program offerings. The Intake stage is designed to ensure product/technology market readiness and
compatibility within the efficiency, demand reduction, or optimization regulatory and programmatic
criteria. National Grid has taken a proactive stance to finding new ideas as well as continuing to examine
ideas originating internally and externally by customers, vendors, other solution providers, or
stakeholders.
IntakeDetermine the fit and feasibility of a new product in existing programs. Is the product ready to be offered to customers and is it appropriate for existing programs?
ConceptDefine the offering. What customer problems does this product address? What are the preliminary savings and potential?
PlanDefine the business case for inclusion in programs. Determine the level of due diligence required to bring the solution into the program. Scope the research required to vet the product with input from EM&V.
Develop or Demonstrate
Execute research and testing of solution to the appropriate level of rigor. Provide firm savings estimates for the product.
Qualify Finalize the product offering, including savings and incentive levels.
Launch Offer the product within existing programs.
Maximize Scale the product to maximize program activity.
ExitAt this point, a product may be retired, parked, or referred elsewhere.The above steps may be bypassed if the product does not meet threshold program requirements or can be moved immediately into programs.

51
After the Intake stage, the Company ranks ideas based on programmatic fit, savings feasibility, and initial
impression. If the idea already fits within portfolio offerings it will be referred to the appropriate
program. If there is not programmatic fit or feasible savings the idea may be moved to the Retired stage
or placed in a Parking Lot stage until certain specified conditions change (e.g. if a solution requires AMI
as a baseline condition the Company would hold off on that type of intervention until that functionality
was closer to ready). National Grid has a broad and mature portfolio of energy efficiency and demand
reduction programs and measures that can accommodate many manufacturer’s products and solutions.
Frequently vendors and manufacturers need assistance in finding where their products and services fit.
When a technology has a fit in existing offerings the Company will move to Refer the requestor to the
existing appropriate program offerings, thus exiting and concluding the process for that idea.
Ideas determined at a cursory ranking level to be a good fit and feasible can next progress to the
Concept stage. In the Concept stage the Company will define what problems the product addresses,
where the product is expected to fit within the programs and begin to develop research questions and
requirements to help define what “success” means for a given product.
Vetted concepts will move next to the Plan stage. In the Plan stage, the Company looks to make a business case for a given idea by assessing and estimating potential unit savings, cost of savings, likely cost-effectiveness, and materiality at scale. National Grid determines the level of due diligence required, type of evaluation necessary, and proposes the appropriate pathway for inclusion in an Annual Plan, either as a pilot, demonstration, or assessment, as defined in Attachment 3. Definitions. The Company’s EM&V team will participate in the Plan stage. The Company will determine if the pilot, demonstration, or assessment will be evaluated using an independent evaluation or a vendor evaluation during the Plan stage, depending on the specifics of the technology.
The Develop or Demonstrate stage will finalize scope and execute the planned research as determined
in the Plan stage. During this stage, all research questions identified in the Concept and Plan stages will
be answered and savings estimates finalized. Where appropriate, the Develop or Demonstrate stage will
include necessary market research, customer recruitment and installation, pre and post metering,
analysis, and evaluation. If the technology will be assessed by an independent evaluation, EM&V and the
independent evaluator will assist in designing the demonstration and then will evaluate the installations
after they are complete.
The Qualify, Launch, and Maximize stages all relate to post-demonstrated program eligible products
and offerings. The Company will Qualify the offer including developing incentive levels, marketing
approaches, implementation considerations, IT system requirements, and more. At the Launch stage the
product offering will be available to customers and then look to Maximize customer uptake and savings.
9.2 Regional Collaboration to Assess Potential New Measures, Approaches, and
Solutions One example of National Grid’s regional collaboration is the participation in the Massachusetts
Technical Assessment Committee (MTAC), who acts as the reviewing body to assess savings claims of
potential new technologies for program inclusion, if cost-effective. MTAC is both a proactive and
reactive body, consisting of key Massachusetts PA technical staff including several National Grid
representatives working on both the MA and RI portfolios. The committee addresses residential,
commercial and industrial technologies, drawing on the subject matter experts from the committee, PA
52
staff, or outside expertise as necessary. It establishes threshold technical requirements to qualify
products or processes as eligible for program incentives. It documents its findings in a standardized
manner and disseminates them to the PA program managers, technical staff, account managers, and
outside parties such as vendors, customers, and other interested parties, as appropriate. Any
manufacturer or vendor of an emerging or newly‑commercialized efficiency technology can make a
science-based case for acceptance of their product into the Program Administrator offerings.
9.3 Ongoing Pilots, Demonstrations, Assessments This subsection will detail ongoing pilots, demonstrations, and assessments initiated in prior plans that
will continue during at least part of the 2021-2023 plan term, which currently include:
• Zero Net Energy Buildings
The Company plans to continue the Zero Net Energy pilot for commercial buildings, initiated in 2018,
through the first half of this Draft Three-Year Plan. This pilot aims to encourage the Rhode Island
building industry’s interest in and chart a path towards zero energy buildings. National Grid will continue
to focus on education and awareness, marketing, training and supporting zero energy building projects
with technical assistance, incentives, commissioning and documentation. Large and small commercial
buildings above 20,000 square feet are eligible for this pilot. The Company continues to enroll zero
energy building pilot projects, while also working to build lessons learned from the initial pilot period
into the Commercial and Industrial sector’s new construction program.
• Strategic Energy Management
The Company plans to continue the Strategic Energy Management (SEM) pilot through 2021. SEM is a
set of processes for business energy management. The main goal of SEM is to activate industrial and
manufacturing customers through a multiplicity of interventions, including individual and group
coaching, to address operation and maintenance measures in the short term, pursue capital measures in
the medium term, and, most critically, establish a culture of continuous improvement in energy
performance over a longer period. The Company is also working to test new energy management
frameworks for commercial and industrial customers, described in Section 4.2.1 based on lessons
learned in the first year and a half of this ongoing pilot.
9.4 Anticipated Areas of Exploration for Future Pilots, Demonstrations, Assessments The Company will investigate new solutions and services for customers across all sectors, segments and
program intervention types, in accordance with the process described above. Additionally, the Company
will look for opportunities for new intervention types to continue to maintain our leadership status and
innovation, while continuing to support state priorities. At this time, areas of exploration are anticipated
in the following broad categories.
9.4.1 Residential, Multifamily, and Income Eligible Areas of Exploration
• Existing Buildings
• New Buildings
• Active Demand Reduction
53
• Optimization
• Other
9.4.2 Commercial & Industrial Areas of Exploration
• Existing Buildings
• New Buildings
• Active Demand Reduction
• Optimization
• Other
10 Evaluation Measurement and Verification
10.1 EM&V Process and Outlook for the Next Three Years Evaluation, Measurement & Verification (EM&V) provides independent verification of impacts to ensure
that savings and benefits claimed by the Company through its energy efficiency programs are accurate
and credible. In addition, EM&V provides insight into market characteristics and guidance on program
design to support continuous process improvement of energy efficiency programs.
The Company hires third-party firms to conduct evaluation using industry standard methods. The
evaluation process is managed by the Company, with oversight from the EERMC consultant team and
OER. The oversight team follows each study closely and is involved in planning, work plan development,
and results review. The results of the studies are used to update the benefit-cost calculations during
planning. The study methodologies and savings assumptions are documented in the Rhode Island
Technical Reference Manual and reports are published on the EERMC’s website.
In the next three years, the Company’s EM&V efforts will continue to focus on evaluating Rhode Island
customer projects, markets, and energy efficiency programs, while leveraging as many resources as
possible from evaluation studies in other states where National Grid operates to maximize value for
ratepayers while minimizing costs. The study areas to be proposed in annual plans during the course of
2021-2023 will be chosen based on a number of factors including the relative amount of savings in that
program or end use, the date and relative precision of the most recent evaluation study, and the
available evaluation budget. Specific studies to be conducted in each program year will be determined
by the Company during the annual planning process.
As described above, the Company’s EM&V team will provide guidance beginning at the Plan stage for all
pilots, demonstrations, and assessments, to ensure design and data collection are suitable to allow for
effective evaluation of the pilot, demonstration, or assessment. In cases where an independent
evaluation is appropriate, the EM&V team will run the evaluation after demonstration installations are
complete.
10.2 EM&V Studies Influencing Savings and Programs in the Three-Year Plan The table below indicates ongoing studies that may influence savings and program design in the Draft
Three-Year Plan. Note that some listed studies intended to inform the three-year planning process may

54
be delayed from their anticipated completion date (indicated below) due to the ongoing COVID-19
pause in many EM&V studies and program activities, while others are intended to inform the 2021
Annual Plan. With continued uncertainty around COVID-19, this set of studies should be expected to
change during the next several months.
Table 24. Ongoing Rhode Island EM&V Studies that may Influence the 2021-2023 Energy Efficiency Plan
Sector Study name Description
Expected Study
completion (* indicates
possible delay due to
COVID)
Res RI-20-RX-EWSFImpact – Impact Evaluation of EnergyWise Single Family Program
The study will verify energy savings estimates for measures offered through the EnergyWise Single Family program. The results will be used to update savings assumptions for each electric, natural gas, propane and oil measures and/or measure groups installed from 2017 and/or 2018.
Jul 2020*
Res RI-20-RX-EWSFProcess – Process Evaluation of EnergyWise Single Family Program
The study will assess the overall effectiveness of EnergyWise Single Family program delivery and new program elements (i.e. 100% landlord incentive and the Department of Energy home energy scores). This study will also assess free-ridership/spillover rates, offering a qualitative complement to the EnergyWise Single Family impact evaluation.
September 2020 (will inform 2021 Plan)*
Res RI-20-RX-EWMFImpact – Impact Evaluation of EnergyWise Multifamily Program
The study will verify energy savings estimates for measures offered through the EnergyWise Multifamily program. The results will be used to update savings assumptions for electric, natural gas, propane and oil measures offered through the program in 2017 and/or 2018.
July 2020*
Res RI-20-RX-IEMFImpact – Impact Evaluation of Income Eligible Multifamily Program
The study will verify energy savings estimates for measures offered through the Income-Eligible Multifamily program. The results will be used to update savings assumptions for electric, natural gas, propane and oil measures offered in 2017 and/or 2018.
July 2020*
Res RI-20-RX-EWMFProcess – Process Evaluation of EnergyWise Multifamily Program
The study will examine customer participation, vendor participation, and overall program processes of the EnergyWise Multifamily program. The evaluation will also assess free-ridership/spillover rates, offering a qualitative complement to the EnergyWise Multifamily impact evaluation.
September 2020 (will inform 2021 Plan)*
Res RI-20-RX-IEMFProcess –
The study will examine landlord and tenant participation, vendor participation, and overall
September 2020
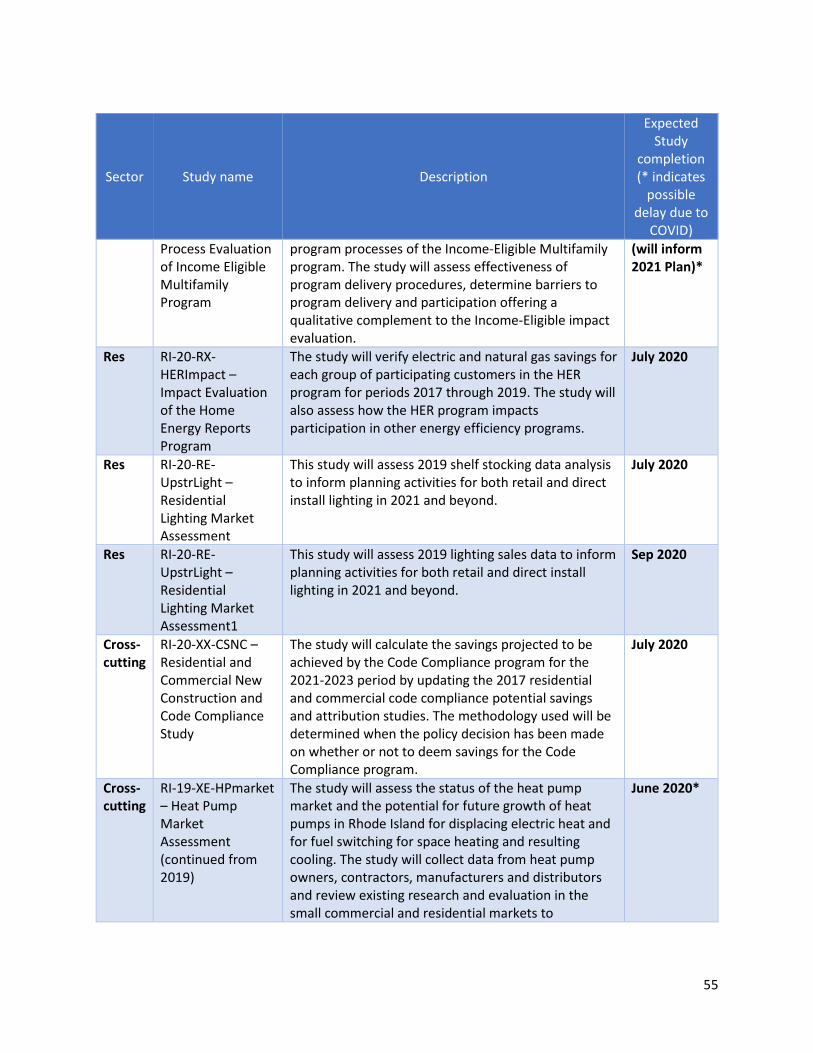
55
Sector Study name Description
Expected Study
completion (* indicates
possible delay due to
COVID)
Process Evaluation of Income Eligible Multifamily Program
program processes of the Income-Eligible Multifamily program. The study will assess effectiveness of program delivery procedures, determine barriers to program delivery and participation offering a qualitative complement to the Income-Eligible impact evaluation.
(will inform 2021 Plan)*
Res RI-20-RX-HERImpact – Impact Evaluation of the Home Energy Reports Program
The study will verify electric and natural gas savings for each group of participating customers in the HER program for periods 2017 through 2019. The study will also assess how the HER program impacts participation in other energy efficiency programs.
July 2020
Res RI-20-RE-UpstrLight – Residential Lighting Market Assessment
This study will assess 2019 shelf stocking data analysis to inform planning activities for both retail and direct install lighting in 2021 and beyond.
July 2020
Res RI-20-RE-UpstrLight – Residential Lighting Market Assessment1
This study will assess 2019 lighting sales data to inform planning activities for both retail and direct install lighting in 2021 and beyond.
Sep 2020
Cross-cutting
RI-20-XX-CSNC – Residential and Commercial New Construction and Code Compliance Study
The study will calculate the savings projected to be achieved by the Code Compliance program for the 2021-2023 period by updating the 2017 residential and commercial code compliance potential savings and attribution studies. The methodology used will be determined when the policy decision has been made on whether or not to deem savings for the Code Compliance program.
July 2020
Cross-cutting
RI-19-XE-HPmarket – Heat Pump Market Assessment (continued from 2019)
The study will assess the status of the heat pump market and the potential for future growth of heat pumps in Rhode Island for displacing electric heat and for fuel switching for space heating and resulting cooling. The study will collect data from heat pump owners, contractors, manufacturers and distributors and review existing research and evaluation in the small commercial and residential markets to
June 2020*
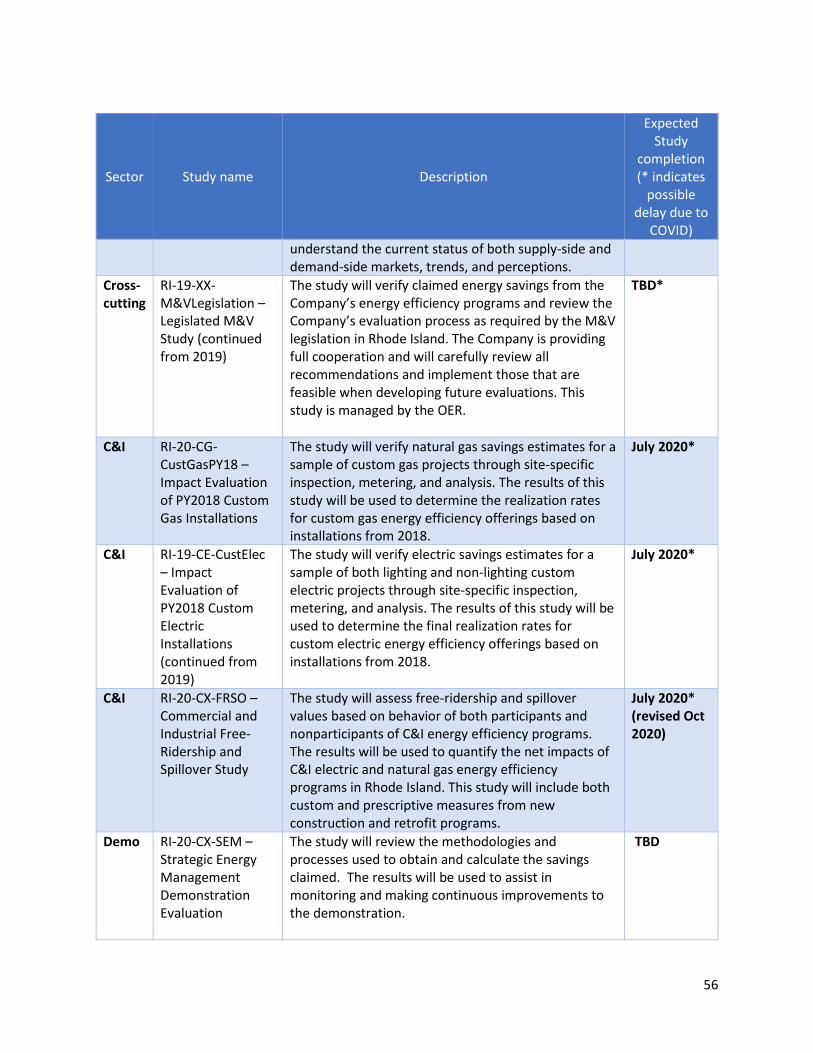
56
Sector Study name Description
Expected Study
completion (* indicates
possible delay due to
COVID)
understand the current status of both supply-side and demand-side markets, trends, and perceptions.
Cross-cutting
RI-19-XX-M&VLegislation – Legislated M&V Study (continued from 2019)
The study will verify claimed energy savings from the Company’s energy efficiency programs and review the Company’s evaluation process as required by the M&V legislation in Rhode Island. The Company is providing full cooperation and will carefully review all recommendations and implement those that are feasible when developing future evaluations. This study is managed by the OER.
TBD*
C&I RI-20-CG-CustGasPY18 – Impact Evaluation of PY2018 Custom Gas Installations
The study will verify natural gas savings estimates for a sample of custom gas projects through site-specific inspection, metering, and analysis. The results of this study will be used to determine the realization rates for custom gas energy efficiency offerings based on installations from 2018.
July 2020*
C&I RI-19-CE-CustElec – Impact Evaluation of PY2018 Custom Electric Installations (continued from 2019)
The study will verify electric savings estimates for a sample of both lighting and non-lighting custom electric projects through site-specific inspection, metering, and analysis. The results of this study will be used to determine the final realization rates for custom electric energy efficiency offerings based on installations from 2018.
July 2020*
C&I RI-20-CX-FRSO – Commercial and Industrial Free-Ridership and Spillover Study
The study will assess free-ridership and spillover values based on behavior of both participants and nonparticipants of C&I energy efficiency programs. The results will be used to quantify the net impacts of C&I electric and natural gas energy efficiency programs in Rhode Island. This study will include both custom and prescriptive measures from new construction and retrofit programs.
July 2020* (revised Oct 2020)
Demo RI-20-CX-SEM – Strategic Energy Management Demonstration Evaluation
The study will review the methodologies and processes used to obtain and calculate the savings claimed. The results will be used to assist in monitoring and making continuous improvements to the demonstration.
TBD

57
11 Performance Incentive Plan
11.1 Proposed Performance Incentive At this time, the Company plans to propose a performance incentive that is decoupled from the
portfolio budgets. Conversations with stakeholders during the 2020 Annual Plan development process
indicated a strong desire by all parties to move away from the historic performance incentive structure,
which ties the Company’s earning opportunity to the plan budget. At the time of this draft,
conversations with OER, DPUC, and EERMC are ongoing and these parties expect to reach a decision on
a performance incentive mechanism for inclusion in the final version of this plan that both represents a
consensus position of these parties and conforms to any guidance and/or direction provided by the
finalized Least Cost Procurement Standards.
11.2 Stakeholder Engagement Following the 2020 Annual Plan development process, the Company initiated conversations with the
EERMC, OER, and DPUC regarding a redesign of the performance incentive for the planning years 2021-
2023. Beginning in April 2020, OER organized and led a working group of stakeholders that includes
National Grid, EERMC, and DPUC staff around the performance incentive redesign. The performance
incentive proposed here reflects the engagement and input of the stakeholders involved.
12 Coordination with Other Energy Policies, Programs, and Dockets Rhode Island’s continued, long-term leadership in energy efficiency necessitates that the Company
coordinate with other parts of the energy system, rather than pursuing savings programs and strategies
in isolation. This Draft Three-Year Plan will be implemented in coordination with other Company filings
and activities, described below. Efforts have also been taken to ensure the Draft Three-Year Plan is
aligned with relevant state policies and objectives, with specific coordination opportunities detailed
below.
12.1 Heating Sector Transformation In an Executive Order issued on July 8, 2019, Governor Raimondo directed the DPUC and OER to identify
the energy, economic, and environmental opportunities and challenges posed by Rhode Island’s heating
sector in the face of a rapidly changing climate. 35 This resulted in an analysis conducted by the Brattle
Group outlining several solutions for decarbonizing the heating sector, described in the April 2020
report “Heating Sector Transformation in Rhode Island: Pathways to Decarbonization by 2050.”36 The
report summarized opportunities in three broad categories relevant to the Company’s efficiency
planning: reducing energy needs by improving building energy efficiency; replacing current fossil heating
fuels with carbon neutral renewable gas or oil; and replacing current fossil-fueled boilers and furnaces
with electric ground source or air source heat pumps powered by carbon-free electricity. The Company
will continue to work with the state to analyze the steps needed to further heating sector
35 Executive Order 19-06, https://governor.ri.gov/documents/orders/Executive%20Order%2019-06.pdf 36 Heating Sector Transformation in Rhode Island, Pathways to Decarbonization by 2050. http://www.energy.ri.gov/documents/HST/RI%20HST%20Final%20Pathways%20Report%204-22-20.pdf
58
transformation (HST) objectives and leverage efficiency opportunities over the course of the Three-Year
Plan. This includes a continued focus on weatherization to prepare for efficient heating system
replacement in the future.
12.2 Heat Pump and Delivered Fuel Policy and Objectives Per the PUC’s ruling on the 2020 Annual Energy Efficiency Plan in Docket 4979, the Company may not
offer incentives for electrification of heating for delivered fuel customers in 2020. The Company will not
offer incentives for these measures in 2021-2023. The Company will continue to pursue opportunities to
engage with the heat pump market and by supporting weatherization for delivered fuel customers.
12.2.1 Heat Pump Implementation, and Education The programs and strategies included in the Draft Three-Year Plan will support the installation of heat
pumps for heating and cooling for customers that utilize electric resistance heating. In an effort to
further develop this market, the Company will continue to seek ways to educate consumers and
installers on the associated cost savings from efficient heat pumps as compared to electric resistance
heating. The Company will coordinate its efforts with state agencies to realize the opportunities related
to heat pumps identified in the Heating Sector Transformation report described in Section 12.1.
12.2.2 Delivered Fuels The Company supports the state’s objective to provide energy efficiency for delivered fuel customers
and is working to serve these customers in multiple ways. Income Eligible customers in single family and
multifamily homes receive the same services as electric and gas customers, with no customer incurred
costs. The Company plans to continue these services over the next three years. For non-income eligible
delivered fuel customers in single family (1-4 unit) and multifamily (5+ unit) homes, the Company will
continue to support weatherization, with financing available via the HEAT loan.
The Company will not offer incentives for customers to convert from delivered fuels to heat pumps per
the aforementioned PUC ruling in Docket 4979. However, National Grid will continue to seek ways to
support the state, including OER, in providing opportunities for delivered fuel customers to utilize
efficient heat pumps for their heating needs.
12.3 Power Sector Transformation Governor Raimondo tasked the PUC, OER, and DPUC with developing a new regulatory framework for
the state’s electric system, which resulted in the Rhode Island Power Sector Transformation (PST)
initiative in Dockets 4770 and 4780.37 This initiative consists of four parallel work streams: 1) utility
business model, 2) distribution system planning, 3) grid connectivity functionality, and 4) strategic
electrification of transportation and heating. The Company will continue to incorporate outcomes of this
initiative into the final Three-Year Plan and subsequent Annual Plans. This includes the Company’s active
demand response program, which will begin educating customers on real-time management of energy
consumption to prepare them for future tools that may be available through grid modernization. These
37 RI PUC Docket 4770: http://www.ripuc.ri.gov/eventsactions/docket/4770page.html RI PUC Docket 4780: http://www.ripuc.ri.gov/eventsactions/docket/4780page.html
59
efficiency programs are planned in coordination with the Company’s advanced metering functionality
(AMF) and grid modernization efforts, discussed subsequently.
12.3.1 Advanced Metering Functionality and Grid Modernization In addition to its energy efficiency planning, the Company also has teams actively working on grid
modernization plans (GMP) and AMF. These three teams work closely to ensure the Company has a
comprehensive view of the benefits and impacts of the roll out of grid modernization and AMF. These
programs will provide increased visibility into customer usage (from AMF) and insights into the
operation of the local distribution system (from grid modernization investments, including AMF). This
will allow for improved efficiency program marketing, more personalized savings offers, more targeted
measure deployment, and optimization of demand side resources. The market potential study
completed by Dunsky Energy consulting included scenario analysis that explored the impact of AMF and
time-of-use rates on energy efficiency programs, specifically demand response programs.
At this time the Company anticipates a GMP and AMF proceeding in Fall 2020. The Energy Efficiency
team will continue to coordinate with the GMP and AMF teams to ensure that the Company has a
comprehensive view of the benefits and impacts of the roll out of grid modernization and AMF.
Specifically, the Company is working to ensure that the benefits estimated in the GMP and AMF Benefit
Cost Analyses (BCA) would constitute a new baseline of savings upon which future energy efficiency
goals are based and to ensure energy savings are not double counted. In addition to the calculation of
benefits, the Company will also examine any possible overlap of costs.
After launching AMF, the Company still anticipates energy efficiency programs would continue to offer
customer incentives for in-home/in-business technologies, such as Wi-Fi programmable thermostats and
smart appliances to drive the achievement of additional incremental energy savings to meet annual
energy savings targets. The Company recognizes that the future energy efficiency plans would include
the total participant costs (i.e., ratepayer-funded rebates and customer contribution costs) associated
with such measures in its BCA methodology.
While the Energy Efficiency, GMP, and AMF teams have been coordinating closely through the filing
process, the need to bifurcate savings and costs associated with these plans would not arise until grid
modernization and AMF investments are approved, deployment begins, and data is collected and
visualized for customers in later years. Therefore, the energy efficiency team anticipates that should the
PUC approve AMF, the important overlap and distinction between GMP, AMF, and energy efficiency
would most likely not arise until after (or, at a minimum, in the later years) of this Draft Three-Year Plan.
At that point the Company anticipates undertaking a more robust discussion of evaluation
methodologies and other key considerations. In the interim, the Company will continue to work with the
TWG to ensure all stakeholders are aware of any future transition.
12.4 Rate Cases The Energy Efficiency program teams will continue to coordinate with the electric and gas businesses as
they develop new rate cases during the term of the Draft Three-Year Plan. For example, the Company
currently earns a performance incentive for Annual MW Capacity Reduction from active electric demand
response that was included in an electric rate case. The demand response programs are run through
Energy Efficiency and in future years, the energy efficiency programs and broader Company will examine
60
if there are adjustments to be made here to align the active demand response program and its
performance incentive with the rest of the energy efficiency programs.
12.5 System Reliability Procurement and Infrastructure, Safety and Reliability The purpose of System Reliability Procurement (SRP) is to identify alternative solutions to standard
electric distribution capacity related upgrades through customer-side and grid-side opportunities that
are prudent, reliable, environmentally responsible, cost-effective, and chart a path to lower supply and
delivery costs for Rhode Island customers. The SRP Plan and its Non-Wires Alternative (NWA) proposals
target solutions for electric grid reliability. This is distinct from the customer measures found in this
Draft Three-Year Plan, which target bulk energy savings for the regional electric grid. Efficiency planning
is concerned with the state and regional level, while SRP is focused on the area, feeder or substation
levels. Despite these distinctions, coordination between these different levels and plans is necessary to
optimize projects and programs and prevent duplication of efforts. In addition to coordination between
National Grid teams, the Company also facilitates communications between the SRP TWG and the
Energy Efficiency TWG.
In previous Three-Year Energy Efficiency Plans, the SRP Plan was submitted as an attachment. In this
cycle, SRP will be filed in a separate three-year plan and more closely align with the Infrastructure,
Safety, and Reliability plans for electric and gas. In addition, the next SRP Plan will explore Non-Pipeline
Alternatives (NPAs) for the natural gas distribution system.
The Company will continue to examine energy efficiency, including demand response, in its distribution
planning process as part of the development of NWA and NPA opportunities. This process occurs before
the Company seeks bids from third-party NWA and NPA solution providers. As long as energy efficiency
or demand response programs are least-cost, cost-effective, reliable, and technically feasible, they may
be deployed as part of an NWA or NPA solution.
12.6 Integration with Renewables As Rhode Island moves toward a clean energy future per Governor Raimondo and the General Assembly,
National Grid will work to better integrate its energy solutions offerings. In addition to energy efficiency
and demand response, this includes electric vehicles, renewable technologies, and battery storage.
National Grid will work to create a seamless experience for the customer to select from these diverse
solutions. As demonstration of these technologies and programs is necessary to determine
effectiveness, benefits, and ease of use, this will require continued work to align Company funding for
efficiency and the current renewables programs (net metering, and Renewable Energy Growth).
Working with both internal and external stakeholders, the Company will identify new opportunities to
enable the delivery of and benefits from integrated energy efficiency and renewable solutions.
12.7 Codes and Standards Program and Accounting for New Codes and Standards Accelerating the state’s adoption of and compliance with residential and commercial building energy
codes helps ensure that energy efficiency is incorporated into buildings when it is least costly – at the
time of construction or alteration. The Company has operated a Code Compliance Enhancement
Initiative (CCEI) sine 2013, one of the country’s only utility programs of its kind. From 2019-2020, the
Company also provided technical support to the state’s energy code update process for the first time.
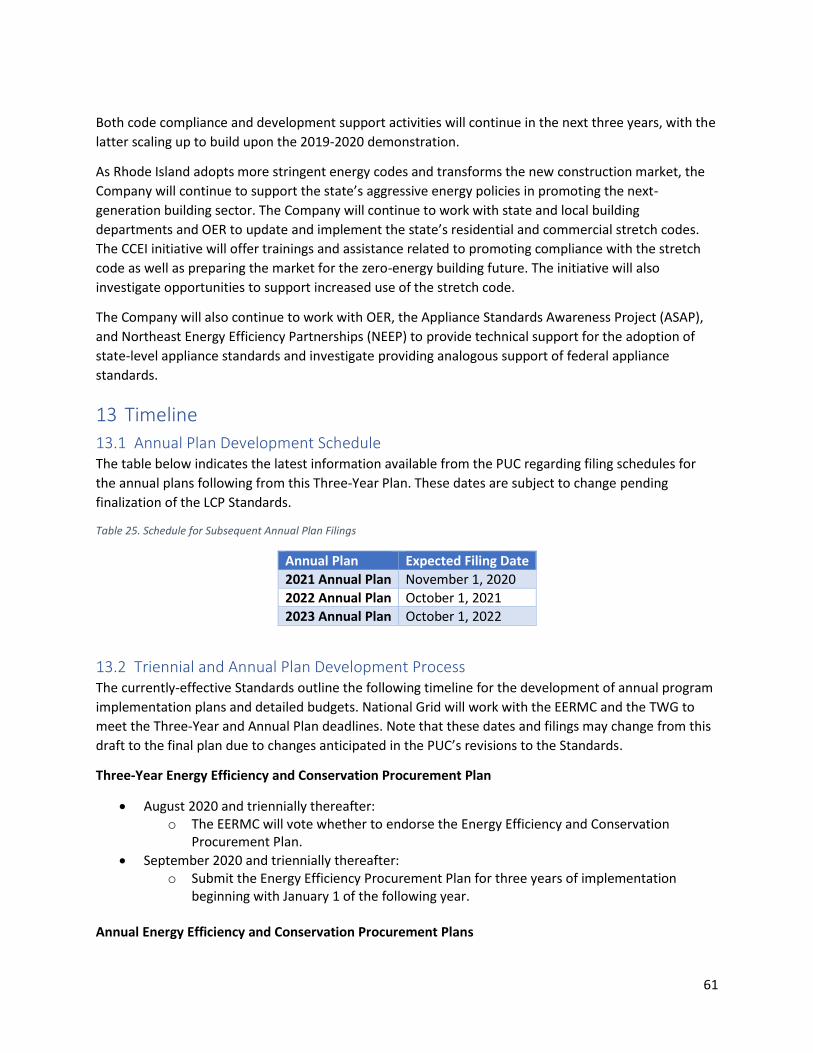
61
Both code compliance and development support activities will continue in the next three years, with the
latter scaling up to build upon the 2019-2020 demonstration.
As Rhode Island adopts more stringent energy codes and transforms the new construction market, the
Company will continue to support the state’s aggressive energy policies in promoting the next-
generation building sector. The Company will continue to work with state and local building
departments and OER to update and implement the state’s residential and commercial stretch codes.
The CCEI initiative will offer trainings and assistance related to promoting compliance with the stretch
code as well as preparing the market for the zero-energy building future. The initiative will also
investigate opportunities to support increased use of the stretch code.
The Company will also continue to work with OER, the Appliance Standards Awareness Project (ASAP),
and Northeast Energy Efficiency Partnerships (NEEP) to provide technical support for the adoption of
state-level appliance standards and investigate providing analogous support of federal appliance
standards.
13 Timeline
13.1 Annual Plan Development Schedule The table below indicates the latest information available from the PUC regarding filing schedules for
the annual plans following from this Three-Year Plan. These dates are subject to change pending
finalization of the LCP Standards.
Table 25. Schedule for Subsequent Annual Plan Filings
Annual Plan Expected Filing Date
2021 Annual Plan November 1, 2020
2022 Annual Plan October 1, 2021
2023 Annual Plan October 1, 2022
13.2 Triennial and Annual Plan Development Process The currently-effective Standards outline the following timeline for the development of annual program
implementation plans and detailed budgets. National Grid will work with the EERMC and the TWG to
meet the Three-Year and Annual Plan deadlines. Note that these dates and filings may change from this
draft to the final plan due to changes anticipated in the PUC’s revisions to the Standards.
Three-Year Energy Efficiency and Conservation Procurement Plan
• August 2020 and triennially thereafter: o The EERMC will vote whether to endorse the Energy Efficiency and Conservation
Procurement Plan.
• September 2020 and triennially thereafter: o Submit the Energy Efficiency Procurement Plan for three years of implementation
beginning with January 1 of the following year.
Annual Energy Efficiency and Conservation Procurement Plans

62
• National Grid will submit a draft Annual Plan to the EERMC for their review and comment at least one week before the EERMC’s scheduled meeting prior to the filing date, annually.
• The EERMC will vote whether to endorse the Annual Plan prior to the filing date, annually.
• November 1, 2020 (and on October 15, 2021 and October 15, 2022): o Submit the annual program implementation plan and detailed budget for the next
program year. The Annual Plan filing shall also provide any adjustments, as needed, to the remaining years of the Energy Efficiency Procurement Plan based on experience, ramp-up, and increased assessment of the resource levels available.
63
14 Conclusion and Requested Rulings The Company requests that the PUC rule on the following, consistent with the draft revisions to the LCP
Standards provided by PUC staff:
• The three-year savings goals for Energy Efficiency and Conservation Procurement programs and portfolio;
• The three-year budgets for Energy Efficiency and Conservation Procurement;
• The three-year performance incentive plan for Energy Efficiency and Conservation Procurement;

64
Attachments
Attachment 1. Energy Efficiency Funding Plans
Note that shareholder incentive is not included in the funding plans in this draft. Shareholder incentive
cost will be included in the Final Plan and the subsequent funding plans.
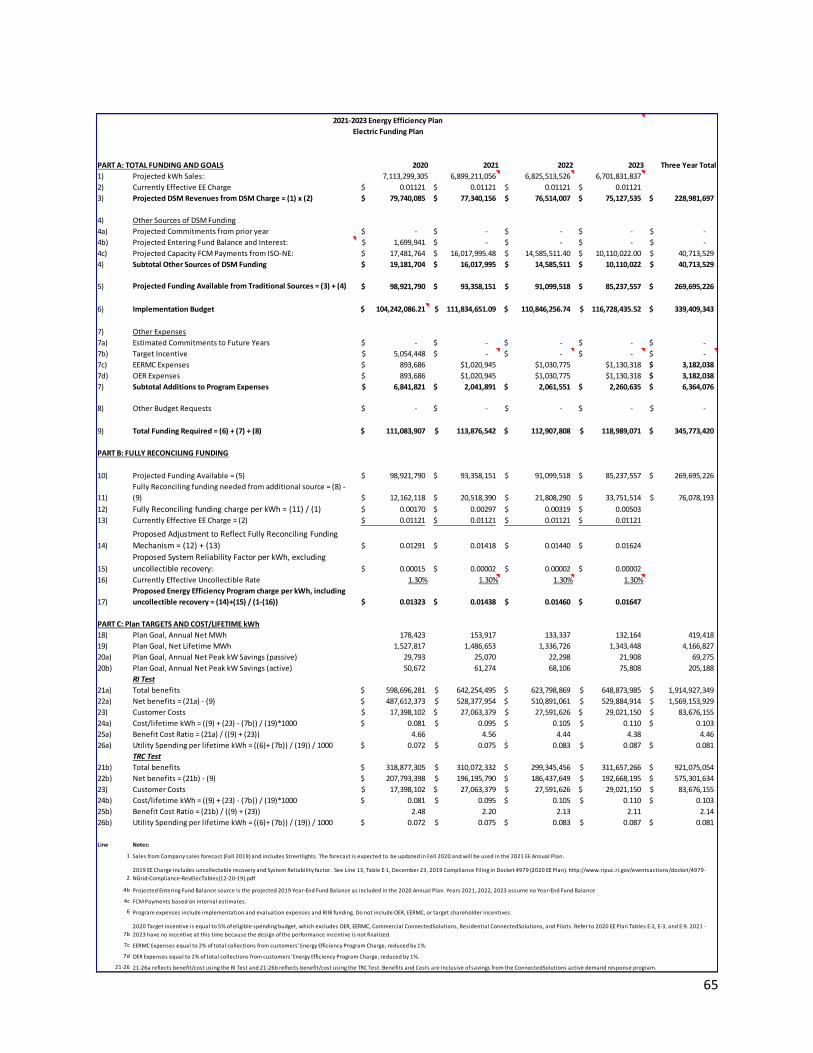
65
PART A: TOTAL FUNDING AND GOALS 2020 2021 2022 2023 Three Year Total
1) Projected kWh Sales: 7,113,299,305 6,899,211,056 6,825,513,526 6,701,831,837
2) Currently Effective EE Charge 0.01121$ 0.01121$ 0.01121$ 0.01121$
3) Projected DSM Revenues from DSM Charge = (1) x (2) 79,740,085$ 77,340,156$ 76,514,007$ 75,127,535$ 228,981,697$
4) Other Sources of DSM Funding
4a) Projected Commitments from prior year -$ -$ -$ -$ -$
4b) Projected Entering Fund Balance and Interest: 1,699,941$ -$ -$ -$ -$
4c) Projected Capacity FCM Payments from ISO-NE: 17,481,764$ 16,017,995.48$ 14,585,511.40$ 10,110,022.00$ 40,713,529$
4) Subtotal Other Sources of DSM Funding 19,181,704$ 16,017,995$ 14,585,511$ 10,110,022$ 40,713,529$
5) Projected Funding Available from Traditional Sources = (3) + (4) 98,921,790$ 93,358,151$ 91,099,518$ 85,237,557$ 269,695,226$
6) Implementation Budget 104,242,086.21$ 111,834,651.09$ 110,846,256.74$ 116,728,435.52$ 339,409,343$
7) Other Expenses
7a) Estimated Commitments to Future Years -$ -$ -$ -$ -$
7b) Target Incentive 5,054,448$ -$ -$ -$ -$
7c) EERMC Expenses 893,686$ $1,020,945 $1,030,775 $1,130,318 3,182,038$
7d) OER Expenses 893,686$ $1,020,945 $1,030,775 $1,130,318 3,182,038$
7) Subtotal Additions to Program Expenses 6,841,821$ 2,041,891$ 2,061,551$ 2,260,635$ 6,364,076$
8) Other Budget Requests -$ -$ -$ -$ -$
9) Total Funding Required = (6) + (7) + (8) 111,083,907$ 113,876,542$ 112,907,808$ 118,989,071$ 345,773,420$
PART B: FULLY RECONCILING FUNDING
10) Projected Funding Available = (5) 98,921,790$ 93,358,151$ 91,099,518$ 85,237,557$ 269,695,226$
11)
Fully Reconciling funding needed from additional source = (8) -
(9) 12,162,118$ 20,518,390$ 21,808,290$ 33,751,514$ 76,078,193$
12) Fully Reconciling funding charge per kWh = (11) / (1) 0.00170$ 0.00297$ 0.00319$ 0.00503$
13) Currently Effective EE Charge = (2) 0.01121$ 0.01121$ 0.01121$ 0.01121$
14)
Proposed Adjustment to Reflect Fully Reconciling Funding
Mechanism = (12) + (13) 0.01291$ 0.01418$ 0.01440$ 0.01624$
15)
Proposed System Reliability Factor per kWh, excluding
uncollectible recovery: 0.00015$ 0.00002$ 0.00002$ 0.00002$
16) Currently Effective Uncollectible Rate 1.30% 1.30% 1.30% 1.30%
17)
Proposed Energy Efficiency Program charge per kWh, including
uncollectible recovery = (14)+(15) / (1-(16)) 0.01323$ 0.01438$ 0.01460$ 0.01647$
PART C: Plan TARGETS AND COST/LIFETIME kWh
18) Plan Goal, Annual Net MWh 178,423 153,917 133,337 132,164 419,418
19) Plan Goal, Net Lifetime MWh 1,527,817 1,486,653 1,336,726 1,343,448 4,166,827
20a) Plan Goal, Annual Net Peak kW Savings (passive) 29,793 25,070 22,298 21,908 69,275
20b) Plan Goal, Annual Net Peak kW Savings (active) 50,672 61,274 68,106 75,808 205,188
RI Test
21a) Total benefits 598,696,281$ 642,254,495$ 623,798,869$ 648,873,985$ 1,914,927,349$
22a) Net benefits = (21a) - (9) 487,612,373$ 528,377,954$ 510,891,061$ 529,884,914$ 1,569,153,929$
23) Customer Costs 17,398,102$ 27,063,379$ 27,591,626$ 29,021,150$ 83,676,155$
24a) Cost/lifetime kWh = ((9) + (23) - (7b)) / (19)*1000 0.081$ 0.095$ 0.105$ 0.110$ 0.103$
25a) Benefit Cost Ratio = (21a) / ((9) + (23)) 4.66 4.56 4.44 4.38 4.46
26a) Utility Spending per lifetime kWh = ((6)+ (7b)) / (19)) / 1000 0.072$ 0.075$ 0.083$ 0.087$ 0.081$
TRC Test
21b) Total benefits 318,877,305$ 310,072,332$ 299,345,456$ 311,657,266$ 921,075,054$
22b) Net benefits = (21b) - (9) 207,793,398$ 196,195,790$ 186,437,649$ 192,668,195$ 575,301,634$
23) Customer Costs 17,398,102$ 27,063,379$ 27,591,626$ 29,021,150$ 83,676,155$
24b) Cost/lifetime kWh = ((9) + (23) - (7b)) / (19)*1000 0.081$ 0.095$ 0.105$ 0.110$ 0.103$
25b) Benefit Cost Ratio = (21b) / ((9) + (23)) 2.48 2.20 2.13 2.11 2.14
26b) Utility Spending per lifetime kWh = ((6)+ (7b)) / (19)) / 1000 0.072$ 0.075$ 0.083$ 0.087$ 0.081$
Line Notes:
1
2
4b Projected Entering Fund Balance source is the projected 2019 Year-End Fund Balance as included in the 2020 Annual Plan. Years 2021, 2022, 2023 assume no Year-End Fund Balance
4c FCM Payments based on internal estimates.
6 Program expenses include implementation and evaluation expenses and RIIB funding. Do not include OER, EERMC, or target shareholder incentives.
7b
7c EERMC Expenses equal to 2% of total collections from customers' Energy Efficiency Program Charge, reduced by 1%.
7d OER Expenses equal to 2% of total collections from customers' Energy Efficiency Program Charge, reduced by 1%.
21-26 21-26a reflects benefit/cost using the RI Test and 21-26b reflects benefit/cost using the TRC Test. Benefits and Costs are Inclusive of savings from the ConnectedSolutions active demand response program.
2020 Target incentive is equal to 5% of eligible spending budget, which excludes OER, EERMC, Commercial ConnectedSolutions, Residential ConnectedSolutions, and Pilots. Refer to 2020 EE Plan Tables E-2, E-3, and E-9. 2021 -
2023 have no incentive at this time because the design of the performance incentive is not finalized.
2021-2023 Energy Efficiency Plan
Electric Funding Plan
Sales from Company sales forecast (Fall 2019) and includes Streetlights. The forecast is expected to be updated in Fall 2020 and will be used in the 2021 EE Annual Plan.
2019 EE Charge includes uncollectable recovery and System Reliability factor. See Line 13, Table E-1, December 23, 2019 Compliance Filing in Docket 4979 (2020 EE Plan). http://www.ripuc.ri.gov/eventsactions/docket/4979-
NGrid-Compliance-RevElecTables(12-20-19).pdf

66
PART A: TOTAL FUNDING AND GOALS 2020 2021 2022 2023 Three Year Total
1) Projected Dth Sales: 42,171,352 42,382,476 42,749,341 43,226,761
2) Currently Effective Average EE Charge 0.601$ 0.836$ 0.836$ 0.836$
3) Projected DSM Revenues from DSM Charge = (1) x (2) 25,347,328$ 35,431,750$ 35,738,449$ 36,137,572$ 107,307,771$
4) Other Sources of DSM Funding
4a) Projected Commitments from prior year -$ -$ -$ -$ -$
4b) Projected Entering Fund Balance and Interest: (1,143,360)$ -$ -$ -$ -$
4c) Low Income Weatherization in Base Rates 200,000$ 200,000$ 200,000$ 200,000$ 600,000$
4) Subtotal Other Sources of DSM Funding (943,360)$ 200,000$ 200,000$ 200,000$ 600,000$
5) Projected Funding Available from Traditional Sources = (3) + (4) 24,403,969$ 35,631,750$ 35,938,449$ 36,337,572$ 107,907,771$
6) Implementation Budget 32,048,029$ 34,963,970$ 36,435,919$ 38,299,055$ 109,698,944$
7) Other Expenses
7a) Estimated Commitments to Future Years -$ -$ -$ -$ -$
7b) Target Incentive 1,578,601$ -$ -$ -$ -$
7c) EERMC Expenses 361,206$ 365,091$ 380,401$ 399,476$ 1,144,968$
7d) OER Expenses 361,206$ 365,091$ 380,401$ 399,476$ 1,144,968$
7) Subtotal Additions to Program Expenses 2,301,013$ 730,182$ 760,801$ 798,952$ 2,289,935$
8) Total Funding Required = (6) + (7) 34,349,042$ 35,694,152$ 37,196,721$ 39,098,007$ 111,988,880$
PART B: POTENTIAL INCREMENTAL FUNDING NEEDED
9) Projected Funding Available = (5) 24,403,969$ 35,631,750$ 35,938,449$ 36,337,572$ 107,907,771$
10) Fully Reconciling funding needed from additional source = (8) - (9) 9,945,073$ 62,402$ 1,258,272$ 2,760,435$ 4,081,108$
11) Fully Reconciling funding charge per Dth = (10) / (1) 0.235$ 0.001$ 0.029$ 0.063$
12) Currently Effective Average EE Charge = (2) 0.601$ 0.836$ 0.836$ 0.836$
13)
Proposed Adjustment to Reflect Fully Reconciling Funding Mechanism =
(11) + (12) 0.836$ 0.837$ 0.865$ 0.899$
14) Currently Effective Uncollectible Rate 1.91% 1.91% 1.91% 1.91%
15)
Proposed Average Energy Efficiency Program charge per Dth including
uncollectible recovery = (13) / (1-(14)) 0.852$ 0.853$ 0.881$ 0.916$
15a)
Proposed Residential Energy Efficiency Program charge per Dth
including uncollectible recovery 1.011$ 1.012$ 1.045$ 1.087$
15b)
Proposed Commercial & Industrial Energy Efficiency Program charge per
Dth including uncollectible recovery 0.704$ 0.705$ 0.728$ 0.757$
PART C: PLAN TARGETS AND COST/LIFETIME Dth
16) Plan Goal, Annual Dth 446,621 417,882 441,840 459,518 1,319,240
17) Plan Goal, Lifetime Dth 4,816,261 4,696,581 5,058,290 5,367,851 15,122,722
RI Test
18a) Total benefits 143,440,133$ 147,633,206$ 159,345,013$ 169,901,382$ 476,879,600$
19a) Net benefits = (18a) - (8) 109,091,091$ 111,939,053$ 122,148,292$ 130,803,375$ 364,890,721$
20) Customer Costs 9,225,261$ 9,967,855$ 10,876,064$ 11,844,082$ 32,688,001$
21a) Cost/lifetime Dth = ((8) + (20)-(7b)) / (17) 8.72$ 9.72$ 9.50$ 9.49$ 9.57$
22a) Benefit-Cost Ratio = (18a) / (8) + (20) 3.29 3.23 3.31 3.34 3.30
23a) Utility Spending per lifetime Dth = ((6)+ (7b)) / (17) 6.98$ 7.44$ 7.20$ 7.13$ 7.25$
TRC Test
18b) Total benefits 79,694,604$ 79,664,847$ 88,301,605$ 95,192,327$ 263,158,780$
19b) Net benefits = (18) - (8) 45,345,562$ 43,970,695$ 51,104,885$ 56,094,320$ 151,169,900$
20) Customer Costs 9,225,261$ 9,967,855$ 10,876,064$ 11,844,082$ 32,688,001$
21b) Cost/lifetime Dth = ((8) + (20)-(7b)) / (17) 8.72$ 9.72$ 9.50$ 9.49$ 9.57$
22b) Benefit-Cost Ratio = (18b) / (8) + (20) 1.83 1.74 1.84 1.87 1.82
23b) Utility Spending per lifetime Dth = ((6)+ (7b)) / (17) 6.98$ 7.44$ 7.20$ 7.13$ 7.25$
Line Notes:
1
2 The Currently Effective Average Charge is illustrated as one charge, shared among residential and commercial customers. The charge is separated into separate charges by customer segment on lines 15a and 15b.
4a There are no commitments planned at this time.
4b Projected Entering Fund Balance source is the projected 2019 Year-End Fund Balance with actuals through June 2019. Fund balance assumed to be $0 in 2021, 2022, 2023 as part of Fully Reconciling Funding.
7b Target incentive is equal to 5.0% of program expenses in 2020. 2021 - 2023 have no incentive at this time because the design of the performance incentive is not finalized.
7c EERMC Expenses equal to 2% of total collections from customers' Energy Efficiency Program Charge, reduced by 1%.
7d OER Expenses equal to 2% of total collections from customers' Energy Efficiency Program Charge, reduced by 1%.
15a & 15b
21-26 21-26a reflects benefit/cost using the RI Test and 21-26b reflects benefit/cost using the TRC Test
2021-2023 Energy Efficiency Plan
Gas Funding Plan
The proposed charges by sector are an illustration for the first draft. The calculations will be updated for the final plan. 3YP is projected at a portfolio level therefore the split between residential and C&I charges is
based of 2020 Annual Plan and will be updated in subsequent Annual Plans.
From the Company's Q2 2019 Gas Forecast. Includes projections for firm and non-firm customers, excludes exempt DG customers. For exempt DG customers, 2020 exemption volume assumed for 2021 - 2023. Pending
update in final plan.
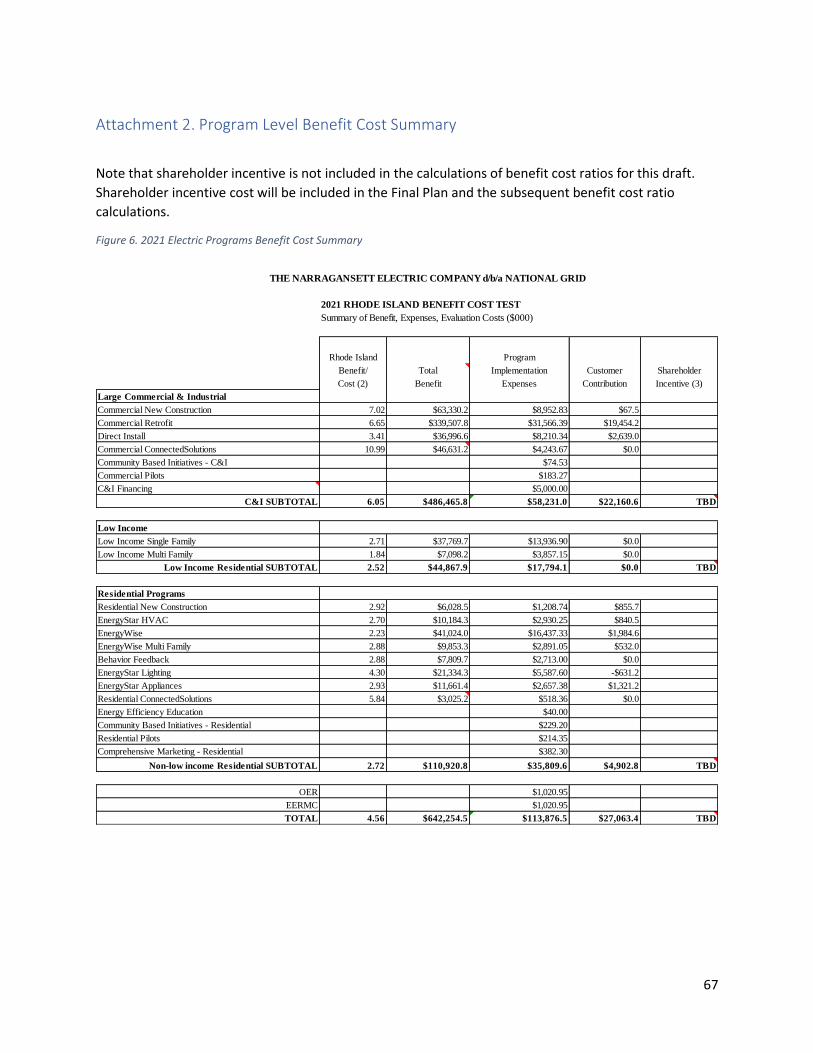
67
Attachment 2. Program Level Benefit Cost Summary
Note that shareholder incentive is not included in the calculations of benefit cost ratios for this draft.
Shareholder incentive cost will be included in the Final Plan and the subsequent benefit cost ratio
calculations.
Figure 6. 2021 Electric Programs Benefit Cost Summary
THE NARRAGANSETT ELECTRIC COMPANY d/b/a NATIONAL GRID
2021 RHODE ISLAND BENEFIT COST TEST
Summary of Benefit, Expenses, Evaluation Costs ($000)
Rhode Island Program
Benefit/ Total Implementation Customer Shareholder
Cost (2) Benefit Expenses Contribution Incentive (3)
Large Commercial & Industrial
Commercial New Construction 7.02 $63,330.2 $8,952.83 $67.5
Commercial Retrofit 6.65 $339,507.8 $31,566.39 $19,454.2
Direct Install 3.41 $36,996.6 $8,210.34 $2,639.0
Commercial ConnectedSolutions 10.99 $46,631.2 $4,243.67 $0.0
Community Based Initiatives - C&I $74.53
Commercial Pilots $183.27
C&I Financing $5,000.00
C&I SUBTOTAL 6.05 $486,465.8 $58,231.0 $22,160.6 TBD
Low Income
Low Income Single Family 2.71 $37,769.7 $13,936.90 $0.0
Low Income Multi Family 1.84 $7,098.2 $3,857.15 $0.0
Low Income Residential SUBTOTAL 2.52 $44,867.9 $17,794.1 $0.0 TBD
Residential Programs
Residential New Construction 2.92 $6,028.5 $1,208.74 $855.7
EnergyStar HVAC 2.70 $10,184.3 $2,930.25 $840.5
EnergyWise 2.23 $41,024.0 $16,437.33 $1,984.6
EnergyWise Multi Family 2.88 $9,853.3 $2,891.05 $532.0
Behavior Feedback 2.88 $7,809.7 $2,713.00 $0.0
EnergyStar Lighting 4.30 $21,334.3 $5,587.60 -$631.2
EnergyStar Appliances 2.93 $11,661.4 $2,657.38 $1,321.2
Residential ConnectedSolutions 5.84 $3,025.2 $518.36 $0.0
Energy Efficiency Education $40.00
Community Based Initiatives - Residential $229.20
Residential Pilots $214.35
Comprehensive Marketing - Residential $382.30
Non-low income Residential SUBTOTAL 2.72 $110,920.8 $35,809.6 $4,902.8 TBD
OER $1,020.95
EERMC $1,020.95
TOTAL 4.56 $642,254.5 $113,876.5 $27,063.4 TBD
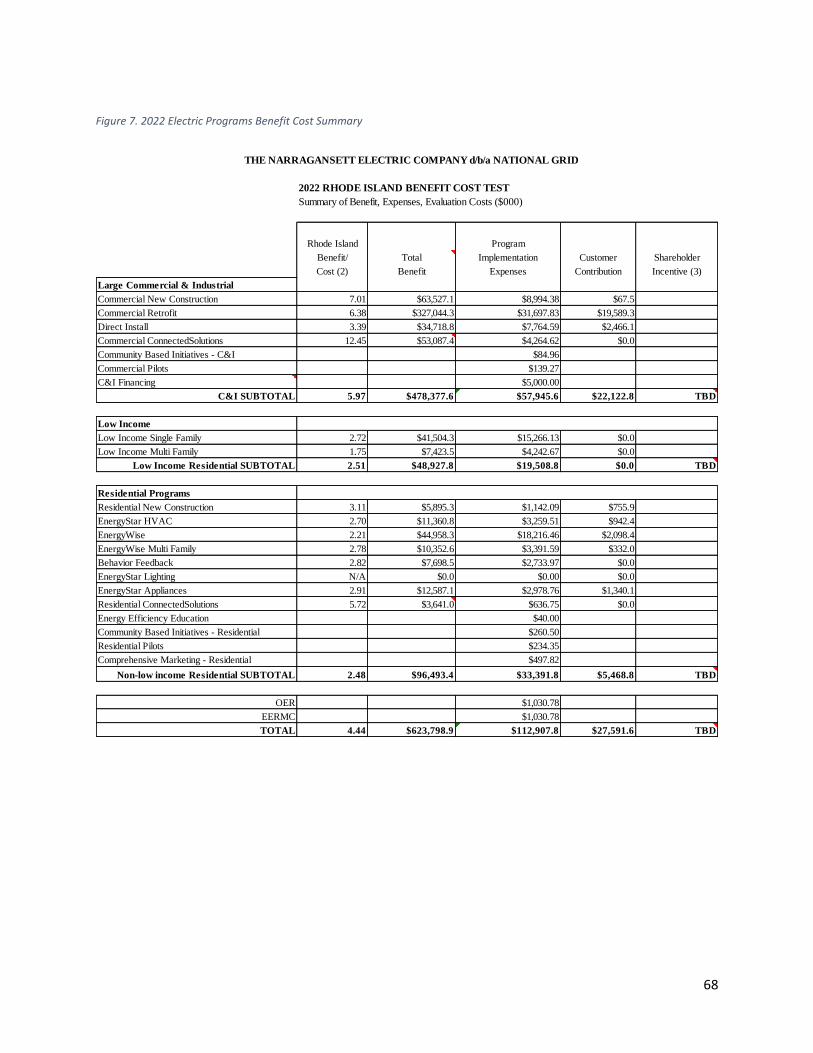
68
Figure 7. 2022 Electric Programs Benefit Cost Summary
THE NARRAGANSETT ELECTRIC COMPANY d/b/a NATIONAL GRID
2022 RHODE ISLAND BENEFIT COST TEST
Summary of Benefit, Expenses, Evaluation Costs ($000)
Rhode Island Program
Benefit/ Total Implementation Customer Shareholder
Cost (2) Benefit Expenses Contribution Incentive (3)
Large Commercial & Industrial
Commercial New Construction 7.01 $63,527.1 $8,994.38 $67.5
Commercial Retrofit 6.38 $327,044.3 $31,697.83 $19,589.3
Direct Install 3.39 $34,718.8 $7,764.59 $2,466.1
Commercial ConnectedSolutions 12.45 $53,087.4 $4,264.62 $0.0
Community Based Initiatives - C&I $84.96
Commercial Pilots $139.27
C&I Financing $5,000.00
C&I SUBTOTAL 5.97 $478,377.6 $57,945.6 $22,122.8 TBD
Low Income
Low Income Single Family 2.72 $41,504.3 $15,266.13 $0.0
Low Income Multi Family 1.75 $7,423.5 $4,242.67 $0.0
Low Income Residential SUBTOTAL 2.51 $48,927.8 $19,508.8 $0.0 TBD
Residential Programs
Residential New Construction 3.11 $5,895.3 $1,142.09 $755.9
EnergyStar HVAC 2.70 $11,360.8 $3,259.51 $942.4
EnergyWise 2.21 $44,958.3 $18,216.46 $2,098.4
EnergyWise Multi Family 2.78 $10,352.6 $3,391.59 $332.0
Behavior Feedback 2.82 $7,698.5 $2,733.97 $0.0
EnergyStar Lighting N/A $0.0 $0.00 $0.0
EnergyStar Appliances 2.91 $12,587.1 $2,978.76 $1,340.1
Residential ConnectedSolutions 5.72 $3,641.0 $636.75 $0.0
Energy Efficiency Education $40.00
Community Based Initiatives - Residential $260.50
Residential Pilots $234.35
Comprehensive Marketing - Residential $497.82
Non-low income Residential SUBTOTAL 2.48 $96,493.4 $33,391.8 $5,468.8 TBD
OER $1,030.78
EERMC $1,030.78
TOTAL 4.44 $623,798.9 $112,907.8 $27,591.6 TBD

69
Figure 8. 2023 Electric Programs Benefit Cost Summary
THE NARRAGANSETT ELECTRIC COMPANY d/b/a NATIONAL GRID
2023 RHODE ISLAND BENEFIT COST TEST
Summary of Benefit, Expenses, Evaluation Costs ($000)
Rhode Island Program
Benefit/ Total Implementation Customer Shareholder
Cost (2) Benefit Expenses Contribution Incentive (3)
Large Commercial & Industrial
Commercial New Construction 7.14 $62,932.0 $8,750.81 $67.5
Commercial Retrofit 6.25 $336,182.7 $33,152.39 $20,629.8
Direct Install 3.38 $32,224.0 $7,256.94 $2,272.9
Commercial ConnectedSolutions 11.98 $62,360.3 $5,206.14 $0.0
Community Based Initiatives - C&I $93.46
Commercial Pilots $622.27
C&I Financing $5,000.00
C&I SUBTOTAL 5.94 $493,699.0 $60,082.0 $22,970.1 TBD
Low Income
Low Income Single Family 2.73 $45,951.4 $16,848.15 $0.0
Low Income Multi Family 1.64 $7,551.3 $4,602.94 $0.0
Low Income Residential SUBTOTAL 2.49 $53,502.7 $21,451.1 $0.0 TBD
Residential Programs
Residential New Construction 3.13 $6,404.0 $1,225.81 $821.9
EnergyStar HVAC 2.74 $12,557.9 $3,522.34 $1,058.0
EnergyWise 2.17 $47,420.7 $19,426.64 $2,430.7
EnergyWise Multi Family 2.61 $10,122.3 $3,551.30 $332.0
Behavior Feedback 2.81 $7,691.5 $2,736.76 $0.0
EnergyStar Lighting N/A $0.0 $0.00 $0.0
EnergyStar Appliances 2.93 $13,046.7 $3,047.93 $1,408.4
Residential ConnectedSolutions 5.32 $4,429.2 $832.88 $0.0
Energy Efficiency Education $40.00
Community Based Initiatives - Residential $285.99
Residential Pilots $27.85
Comprehensive Marketing - Residential $497.82
Non-low income Residential SUBTOTAL 2.47 $101,672.3 $35,195.3 $6,051.0 TBD
OER $1,130.32
EERMC $1,130.32
TOTAL 4.38 $648,874.0 $118,989.1 $29,021.2 TBD

70
Figure 9. 2021 Natural Gas Programs Benefit Cost Summary
THE NARRAGANSETT ELECTRIC COMPANY d/b/a NATIONAL GRID
2021 RHODE ISLAND BENEFIT COST TEST
Summary of Benefit, Expenses, Evaluation Costs ($000)
Rhode Island Program
Benefit/ Total Implementation Customer Shareholder
Cost Benefit Expenses Contribution Incentive
Large Commercial & Industrial
Large Commercial New Construction 5.57 17,835.65$ $2,807.7 $394.7
Large Commercial Retrofit 5.88 43,031.83$ $5,251.3 $2,069.3
Small Business Direct Install 4.50 741.48$ $141.5 $23.2
Commercial & Industrial Multifamily 4.72 5,398.70$ $1,060.3 $84.0
Comprehensive Marketing - Commercial and Industrial $0.0
Commercial Pilots $270.0
Finance Costs $0.0
Community Based Initiatives - C&I $24.8
Finance Costs $500.0
Commercial & Industrial Subtotal 5.31 67,007.65$ $10,055.6 $2,571.3 TBD
Income Eligible Programs
Single Family - Income Eligible Services 2.92 19,895.38$ $6,804.4 $0.0
Income Eligible Multifamily 3.83 12,484.32$ $3,255.9 $0.0
Income Eligible Residential Subtotal 3.22 32,379.70$ 10,060.3$ $0.0 TBD
Residential Programs
Energy Star® HVAC 1.59 11,282.25$ $2,880.1 $4,195.4
EnergyWise 2.06 23,432.99$ $9,198.4 $2,186.2
EnergyWise Multifamily 5.44 10,005.12$ $1,495.3 $344.0
Home Energy Reports 4.66 2,151.52$ $461.5 $0.0
Residential New Construction 1.04 1,373.98$ $655.4 $670.9
Comprehensive Marketing - Residential $79.9
Residential Pilots $0.0
Community Based Initiatives - Residential $77.4
Non-Income Eligible Residential Subtotal 2.17 48,245.86$ $14,848.0 $7,396.6 TBD
EERMC $365.1
OER $365.1
Grand Total 3.23 $147,633.2 $35,694.2 $9,967.9 TBD

71
Figure 10. 2022 Natural Gas Programs Benefit Cost Summary
THE NARRAGANSETT ELECTRIC COMPANY d/b/a NATIONAL GRID
2022 RHODE ISLAND BENEFIT COST TEST
Summary of Benefit, Expenses, Evaluation Costs ($000)
Rhode Island Program
Benefit/ Total Implementation Customer Shareholder
Cost Benefit Expenses Contribution Incentive
Large Commercial & Industrial
Large Commercial New Construction 6.60 22,042.93$ $2,857.6 $480.3
Large Commercial Retrofit 6.22 46,452.48$ $5,196.9 $2,270.7
Small Business Direct Install 4.50 742.48$ $141.7 $23.2
Commercial & Industrial Multifamily 4.72 5,405.88$ $1,061.5 $84.0
Comprehensive Marketing - Commercial and Industrial $0.0
Commercial Pilots $273.3
Finance Costs $0.0
Community Based Initiatives - C&I $28.3
Finance Costs $500.0
Commercial & Industrial Subtotal 5.78 74,643.77$ $10,059.3 $2,858.2 TBD
Income Eligible Programs
Single Family - Income Eligible Services 2.93 21,861.33$ $7,453.9 $0.0
Income Eligible Multifamily 3.84 12,493.49$ $3,255.4 $0.0
Income Eligible Residential Subtotal 3.21 34,354.82$ 10,709.2$ $0.0 TBD
Residential Programs
Energy Star® HVAC 1.60 12,908.17$ $3,252.9 $4,802.6
EnergyWise 1.99 23,981.27$ $9,711.8 $2,325.6
EnergyWise Multifamily 5.47 10,063.23$ $1,495.0 $344.0
Home Energy Reports 4.64 2,141.88$ $461.4 $0.0
Residential New Construction 1.11 1,251.86$ $578.5 $545.6
Comprehensive Marketing - Residential $79.9
Residential Pilots $0.0
Community Based Initiatives - Residential $87.8
Non-Income Eligible Residential Subtotal 2.13 50,346.42$ $15,667.4 $8,017.8 TBD
EERMC $380.4
OER $380.4
Grand Total 3.31 $159,345.0 $37,196.7 $10,876.1 TBD

72
Figure 11. 2023 Natural Gas Programs Benefit Cost Summary
THE NARRAGANSETT ELECTRIC COMPANY d/b/a NATIONAL GRID
2023 RHODE ISLAND BENEFIT COST TEST
Summary of Benefit, Expenses, Evaluation Costs ($000)
Rhode Island Program
Benefit/ Total Implementation Customer Shareholder
Cost Benefit Expenses Contribution Incentive
Large Commercial & Industrial
Large Commercial New Construction 6.53 22,442.07$ $2,931.6 $505.6
Large Commercial Retrofit 6.58 52,440.38$ $5,414.7 $2,559.7
Small Business Direct Install 4.50 744.80$ $142.3 $23.2
Commercial & Industrial Multifamily 4.71 5,426.58$ $1,069.3 $84.0
Comprehensive Marketing - Commercial and Industrial $0.0
Commercial Pilots $276.5
Finance Costs $0.0
Community Based Initiatives - C&I $31.2
Finance Costs $500.0
Commercial & Industrial Subtotal 5.99 81,053.83$ $10,365.6 $3,172.5 TBD
Income Eligible Programs
Single Family - Income Eligible Services 2.94 24,054.93$ $8,186.9 $0.0
Income Eligible Multifamily 3.84 12,512.30$ $3,259.7 $0.0
Income Eligible Residential Subtotal 3.19 36,567.22$ 11,446.6$ $0.0 TBD
Residential Programs
Energy Star® HVAC 1.61 14,209.43$ $3,556.1 $5,281.8
EnergyWise 1.93 24,578.83$ $10,268.7 $2,465.4
EnergyWise Multifamily 5.50 10,126.98$ $1,497.0 $344.0
Home Energy Reports 4.64 2,143.24$ $462.1 $0.0
Residential New Construction 1.04 1,221.85$ $596.2 $580.3
Comprehensive Marketing - Residential $79.9
Residential Pilots $0.0
Community Based Initiatives - Residential $96.3
Non-Income Eligible Residential Subtotal 2.07 52,280.33$ $16,556.4 $8,671.6 TBD
EERMC $364.7
OER $364.7
Grand Total 3.34 $169,901.4 $39,098.0 $11,844.1 TBD
73
Attachment 3. Definitions This attachment provides a reference to commonly used terms in the Three-Year and Annual Energy
Efficiency Plans.
Assessment
An assessment tests a measure, a bundle of measures, or a solution that can be delivered as part of an
existing program where the savings are unknown but will be explored as part of the assessment through
independent evaluation or a vendor evaluation. The scope of evaluation for an assessment depends on
the specifics of the assessment. Assessments are not included in the calculation of the performance
incentive.
Customer Contribution/Customer Cost
The financial cost of a measure and/or service that is not covered by the customer incentive.
Customer Incentive
Financial support and/or services (e.g., rebates, on-bill repayment) provided to participants in attempt
to motivate the installation of measures and/or changes in behavior to achieve energy savings.
On-Bill Repayment (OBR)
A financial mechanism that allows customers to pay back the customer contribution/customer cost of a
measure and/or service on their energy bill.
Demand Response
Active Demand Response: The reduction or shifting of energy use by customers during peak periods or
events when the load on the electric grid or gas distribution system is high.
Passive Demand Response: Energy efficiency measures that permanently shift or reduce electricity use
at all times, contributing to a reduction of peak load.
Demonstration
A demonstration tests a new technology or solution delivered as part of an existing program where a
technical analysis has estimated the savings and determined that the measure is likely to be cost
effective. A technology tested through a demonstration may become offered by that program.
Demonstrations are included in the calculation of the performance incentive.
Evaluation
Independent Evaluation: An independent evaluation uses a third-party evaluation vendor selected via a
competitive Request for Proposals process for the specified evaluation or selected in the recent past for
evaluation services of efficiency programs. An independent evaluation can be both a process and an
impact evaluation.
Vendor Evaluation: A vendor evaluation is conducted by a vendor installing a technology, measure,
strategy, or solution. A vendor evaluation can also be conducted by a Technical Assistance vendor who
74
conducts a savings analysis for the installed technology, measure, or an energy saving strategy. A vendor
evaluation can only be an impact evaluation.
Goals
Goals refer to National Grid’s three-year energy efficiency savings goals.
Market Potential Study
A market potential study is a detailed assessment of the energy efficiency potential in given market. In
this Plan, the term is used in reference to the 2020 Rhode Island Energy Efficiency Market Potential
Study.
Non-Energy Impacts
Non-energy impacts (NEIs) are those other than the energy and demand savings generated by efficiency
programs. Non-energy impacts accrue to program participants (e.g. increased comfort and health,
improved property values), society at large (e.g. greenhouse gas reductions, improved air quality), and
the utility system (e.g. Reduced arrearages).
Non-Participant
A customer that does not directly participate in an efficiency program.
Participant
A customer that reduces or otherwise modifies their energy end use patterns due to involvement in an
efficiency program. Participation is measured differently in different programs. For several programs, a
participant is defined as a customer account (electric or gas). In contrast, the Residential Consumer
Products program measures participation by the number of rebates processed.
Pilots
A small scale, targeted program that is limited in scope, time, and spending and is designed to test the
feasibility of a future program or rate design not currently included in the core energy efficiency
programs. Ideally, a pilot provides net benefits and helps achieve savings goals, but the primary design
and value of a pilot is to test rather than to achieve. If a pilot is successful for commercialization, new
programs and measures may be added to existing core programs. Pilots are not included in the
calculation of the performance incentive.
Portfolio
A collection of programs. The electric portfolio contains programs that primarily focus on delivering
electricity savings and the natural gas portfolio contains programs that primarily focus on delivering
natural gas savings. A portfolio is required to be cost-effective.
Program
A collection of defined services and/or measures carried out by National Grid and/or its vendors and
subcontractors that: target a specific market segment, customer class, or defined end use; are designed
to influence customer behavior to achieve changes in energy usage, equipment preferences,

75
investment, and maintenance practices; and are guided by a specific savings goal and have a benefit-
cost ratio. Programs are typically made up of the following categories that contribute to the overall
program savings goals and benefit-cost ratios.
Sub-Program
Within the Commercial and Industrial Sector, a sub-program is a further grouping of measures
within a program. An example is the upstream lighting sub-program within the Commercial and
Industrial Sector.
Measure
A piece of equipment or customer action that reduces or otherwise modifies energy end use
patterns. This is the most granular level of categorization. For example, an LED light bulb.
Comprehensive Measures: When a customer employs multiple pieces of equipment or actions
that reduce or otherwise modify energy use at the same time, more fully taking advantage of
energy savings opportunities at one time rather than completing piecemeal projects.
Measure Group
A group of measures with similar characteristics within a program. For example, the measure
group LED in the Residential lighting program includes several types of LED light bulbs and the
Compressed Air measure group within the Large Commercial New Construction program
contains all the compressed air measures within that program.
Services
A range of activities to support customer awareness, education, and adoption of energy saving
and energy modification opportunities including free technical assistance, training, analysis, and
reports.
Initiative
A “go to market” strategy within a program that promotes a subset of measures or services
within that program and/or targets a certain segment of customers. For example, the Grocery
Initiative within the Large Commercial and Industrial Retrofit Program.
Assessment defined above.
Demonstration defined above.
Performance Incentive
A financial incentive that the Company has an opportunity to earn based on performance in fulfilling the
savings goals of the approved Annual Plan. The Performance Incentive is authorized and established
through Annual Energy Efficiency Plans by R.I. Gen. Laws § 39-1-27.7(e) and § 39-1-27.7.1.
76
Rebate
A financial incentive paid to a participant in order to obtain a specific action, typically the installation of
equipment. A rebate can also be paid to manufacturers and suppliers of measures to lower the price at
the point of sale to the customer.
Savings
Annual Savings: Energy savings accrued annually from the installed measure(s).
Lifetime Savings: Energy savings accrued over the functional lifetime of the installed measure(s).
Sector
A grouping of participants by customer rate class. Programs are organized by these groupings. There are
three sectors: Residential, Income-Eligible, and Commercial and Industrial.
Targets
Targets refer to the three-year energy efficiency savings targets approved by the PUC.
Technical Assistance (TA) Study
A technical assistance study assesses a measure or group of measures for savings and costs and is
performed by a third-party technical assistance vendor. A TA study quantifies electric and gas savings,
along with delivered fuel and non-energy impacts. TA studies include some or all of the following
activities: facility benchmarking and/or walkthrough, equipment metering or analysis of building energy
management system data, determination of measure baseline, engineering analysis of the operation of
the baseline, and proposed measures and building energy simulations. The TA vendor performs a
benefit-cost screening to assess the estimated payback for the customer along with the impact of costs
and savings. A TA study report is presented to the customer which outlines the methodology followed to
determine estimated project savings, cost, and project payback, along with the results of the study.
Technical Assessment
A technical assessment is engineering research conducted to determine the savings of a new technology
or measure that may not be widely adopted in the market.