National Galleries of Scotland Environmental ...
13
National Galleries of Scotland Environmental Sustainability Report 2016 - 17 Date: November 2017 Version number: 6 Owner: Brian Troddyn, Sustainability Officer Approval route: Audit & Risk Committee and Senior Management Team Approval status: Approved by Audit and Risk Committee
Transcript of National Galleries of Scotland Environmental ...

National Galleries of Scotland Environmental Sustainability Report 2016 - 17
Date: November 2017 Version number: 6 Owner: Brian Troddyn, Sustainability Officer Approval route: Audit & Risk Committee and Senior Management Team Approval status: Approved by Audit and Risk Committee

National Galleries of Scotland
Environmental Sustainability Report 2016-17
Page | 1
1. 2016-17 at a glance 2
2. Introduction 3
3. Overall Performance 4
4. Energy Use 5
5. Transport & Travel 6
6. Waste Management 7
7. Water Consumption 8
8. Action on Biodiversity 9
9. Sustainable Procurement 10
10. Performance Figures 11

National Galleries of Scotland
Environmental Sustainability Report 2016-17
Page | 2
2016-17 at a Glance

National Galleries of Scotland
Environmental Sustainability Report 2016-17
Page | 3
Background
Our Sustainability Journey
Introduction
This report follows on from what was previously
known as the Public Sector Sustainability Report.
This new version reports on the same information
but aims to give a more holistic view of current
environmental activities and performance taking
place within the organisation.
The National Galleries has three main long term
aims as set out in our corporate plan, one of which is
to be a sustainable and efficient organisation. This
report outlines how efforts to reduce our
environmental impact is helping us to achieve this
aim.
This report details our performance in key areas
such as energy use, water use, waste management,
travel, biodiversity and sustainable procurement.
In 2010 we produced our first Carbon Management
Plan using resource use data from 2008/09 as our
baseline year. We set our first target to 20%
reduction in emissions by 2014 from the baseline
year. We successfully managed to surpass this
target and achieved a 30% reduction by this time.
A new target was set of 42% reduction by the end of
financial year 2019/20. This target has now been
successfully reached over two years early as of June
this year, bringing us 11% ahead of predicted
reduction levels for 2016-17.
A lot of work has been done to achieve this target
such as upgrading of plant equipment, water
reduction measures, making our buildings smarter
and improving building fabric where possible
This is against a back drop of increasing demands
on our buildings and facilities with larger visitor
numbers than ever before.
A lot more work needs to be done if we have a long-
term plan to reduce emissions by 80% from baseline
year levels by 2050, keeping in line with Scottish
Government targets.
We are currently developing a new Carbon
Management Plan for the next five years which will
outline a new intermittent reduction target and how
we are going to achieve it.

National Galleries of Scotland
Environmental Sustainability Report 2016-17
Page | 4
2016-17 Overview The following table provides a summary of the progress we have made since the financial year 2008/09 (1
st April to 31
st
March)
Area
2008/09 2016/17 Performance
Change from Baseline Year
Change from last year
Carbon from Energy1
3690 2217 -40% -10.8%
Total Energy Expenditure
£645,939 £406,191 -37.9% -2%
Carbon from Transport1
8.45 14.56 +52.5% +1.4%
Total Transport Expenditure
£10,205 £20,551 +109% +2.2%
Carbon from Waste1
28.38 3.87 -92% +39.7%
Total Waste Expenditure
£18,553 £26,738 +44.1% +20%
Carbon from Water1
18.09 15.39 -18.8% -9%
Total Water Expenditure
£86,157 £57,238 -33.6% -2.5%
Total Carbon Emissions 1
3745 2251 -40% -10.7%
1: Carbon is measured in tonnes of carbon dioxide (CO2) equivalent.
Overall Performance
Carbon Intensity of our Galleries Performance overall shows continuing reductions in
carbon emissions with a 10.7% reduction in last
year’s levels.
Transport is showing below target performance with
both carbon emissions and costs rising steadily. This
will be partly due to the increase in fleet size.
Water emissions, while reducing overall have been
slower and more difficult to reduce over time than
expected.
Looking at our gallery buildings individually we can
see that the Scottish National Gallery are our most
energy intensive buildings, followed closely by the
Modern Two. Our Portrait Gallery is the best
performing building; this is probably the result of
major refurbishment and plant upgrades that took
place in 2011.
0102030405060708090
100
ScottishNationalGallery
PotraitGallery
ModernOne
ModernTwo
KG
CO
2/M
2/Y
R
Gas
Elec

National Galleries of Scotland
Environmental Sustainability Report 2016-17
Page | 5
Progress and Initiatives
Energy Use
Carbon emissions for gas and electricity are
reducing steadily with 14.3% reduction observed in
electricity use compared to 14.6% the previous year.
Reduction in gas use was lower, reducing by only
2.9% in the previous twelve months. Energy
reduction has now reached a plateau where it is
getting harder to achieve the rate of savings from
projects than before. A lot of work has taken place
over the last eight years to reach our current 42%
from the 2008 baseline.
Work continues on our Building Management
System and we are adding more sub meters to the
network, allowing us to see and react quicker to
unusual energy use activities across the estate.
We have successfully switched over all our
exhibition lighting to LED reducing energy
consumption of these lights by 80%. Building on the
success of this we are now pursuing a programme of
switching all office and back of house lighting to
efficient LED
We took part in our fourth WWF Earth Hour this year
switching off lights in our gallery buildings and
raising awareness to staff and the public on the
importance of reducing our impact on the
environment.
0
1000
2000
3000
2008-9 2010-11 2012-13 2014-15 2016-17
ton
ne
s C
O2
e
Financial Years
Carbon Emissions - Energy
Gas Electricity
Challenges
Our galleries are Grade A listed buildings
and so consideration and care must be
taken into account when applying new
technologies to them.
Environmental control of our exhibition
spaces can be energy intensive.
Continue to reduce our energy use through
the adoption of new technologies or
processes as appropriate.
Make our buildings smarter so we can
control the environment more efficiently.
Make our buildings more sustainable
through more efficient building fabric
improvements.
Reduce the impact of our IT equipment by
moving our server’s offsite and moving to
more efficient desktop equipment.
Engage with staff to adopt more sustainable
energy use practise at work.
Future Goals

National Galleries of Scotland
Environmental Sustainability Report 2016-17
Page | 6
Progress and Initiatives
Transport & Travel
Emissions from our fleet increased slightly over last
year but seem to have stabilised from the steady
increase of previous years.
The Energy Saving Trust undertook a Sustainable
Transport Review on NGS and from the
recommendations we recently added a fully electric van
to our fleet. Additionally we installed an electric vehicle
charging point at our Modern Two which is used both
by our own electric van as well as staff and the public.
We undertook a staff travel survey and found that 41%
of our employees use sustainable commuting modes of
travel such as bus and rail. 36% use active travel
means when commuting such as cycling and walking.
Staff took part in the Scottish Workplace Journey
Challenge earlier this year run by Sustrans. This was
an initiative whereby staff used sustainable methods of
transport such as cycling, walking, lift share and buses
to commute. Staff also took part in the Edinburgh Cycle
Challenge 2017 where they were successful in winning
prizes, with one member of the team winning first prize
in the male category for the whole competition.
We are currently working with Workplace Travel
Planning Edinburgh to update our workplace travel
plan. which will outline our plans to encourage staff to
use more sustainable travel methods.
0.00
4.00
8.00
12.00
16.00
20.00
2008-9 2010-11 2012-13 2014-15 2016-17
ton
ne
s C
O2
e
Financial Years
Carbon Emissions - Fleet
Fleet
Challenges Increase in size of fleet is increasing
transport emissions.
Increase the use of active travel to work by
employees.
Replace more of our fleet with electric
vehicles where possible.
Encourage and increase the use of active
travel to work by employees.
Achieve Bike Friendly employer status from
Cycle Scotland within the next twelve
months.
Include carbon emissions from our business
travel activities from next year onwards.
Future Goals
National Galleries of Scotland
Environmental Sustainability Report 2016-17
Page | 7
Progress and Initiatives
Waste Management
Challenges
Incidences of our recycling bins being used
for incorrect waste by staff and the public is
increasing.
Large movement of staff offices has to lead
to an increase in overall waste.
0
5
10
15
20
25
30
2008-9 2010-11 2012-13 2014-15 2016-17
ton
ne
s C
O2
e
Financial Years
Carbon Emissions - Waste
Waste
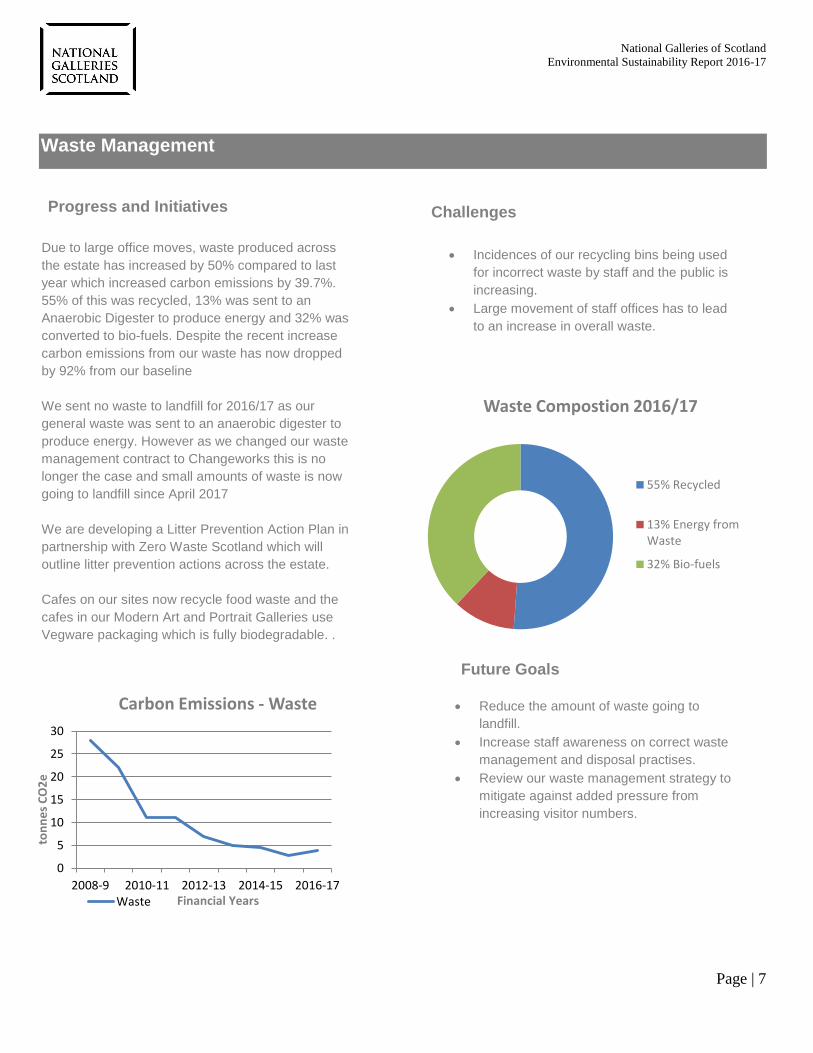
Waste Compostion 2016/17
55% Recycled
13% Energy fromWaste
32% Bio-fuels
Future Goals Reduce the amount of waste going to
landfill.
Increase staff awareness on correct waste
management and disposal practises.
Review our waste management strategy to
mitigate against added pressure from
increasing visitor numbers.
Due to large office moves, waste produced across
the estate has increased by 50% compared to last
year which increased carbon emissions by 39.7%.
55% of this was recycled, 13% was sent to an
Anaerobic Digester to produce energy and 32% was
converted to bio-fuels. Despite the recent increase
carbon emissions from our waste has now dropped
by 92% from our baseline
We sent no waste to landfill for 2016/17 as our
general waste was sent to an anaerobic digester to
produce energy. However as we changed our waste
management contract to Changeworks this is no
longer the case and small amounts of waste is now
going to landfill since April 2017
We are developing a Litter Prevention Action Plan in
partnership with Zero Waste Scotland which will
outline litter prevention actions across the estate.
Cafes on our sites now recycle food waste and the
cafes in our Modern Art and Portrait Galleries use
Vegware packaging which is fully biodegradable. .

National Galleries of Scotland
Environmental Sustainability Report 2016-17
Page | 8
Progress and Initiatives
Water
0.00
5.00
10.00
15.00
20.00
2008-9 2010-11 2012-13 2014-15 2016-17
ton
ne
s C
O2
e
Financial Years
Carbon Emissions - Water
Water
Challenges
Overall water consumption across the estate has
reduced by over 9% compared to last year. Despite
this the long term reduction of water consumption
has been challenging due to high water demands of
our cafes, plant equipment and the Jencks landform.
Water efficient taps and urinals have been fitted to
all our public toilets reducing water consumption in
these areas. We are now looking at what
improvements can be made in our staff toilet
facilities.
We are installing more sub water meters to track our
water consumption more accurately and target areas
of high consumption.
A feasibility study on water harvesting at our Gallery
of Modern Art was undertaken by Resource Efficient
Scotland but was found to be not viable at this site.
Large quantity of water is consumed by the
Jencks landform ponds.
Large amounts of water is consumed by our
humidifiers, Reduction in this will only be
seen in conjunction with more efficient
environmental control of our exhibition
areas.
Future Goals Continue to look into the viability of water
harvesting across other sites in our estate.
Engage with our cafes to investigate more
efficient water use practises.
Install more water efficient devices in our
staff toilet facilities.

National Galleries of Scotland
Environmental Sustainability Report 2016-17
Page | 9
Progress and Initiatives
Action on Biodiversity
Challenges
We are committed to maximising our green spaces for
the encouragement of increased biodiversity as well as
educating the public on the link of food from earth to
plate.
We recently erected 16 bird boxes around the grounds
of the Gallery of Modern Art to encourage more nesting
birds. Along with this we have erected 6 Bat boxes to
encourage more bat activity. Fauna such as foxes,
badgers and squirrels can be regularly observed on the
grounds.
The woodlands around the Gallery of Modern Art
buildings are managed to encourage more insect activity
with fallen tree retention in some areas. Leaves from the
trees are used onsite for composting.
The café has developed a kitchen garden which
produces fresh vegetables, fruits and herbs that are
used on the menu. This garden consists of an orchard,
raised beds, fruit patches, composting area and an
insect hotel.
Two bee hives have been installed in the grounds. We
have had a wild garden planted around it to encourage
honey production from the bees.
A well-established allotment space is situated on the
grounds of Modern Two that is managed by Dean
Allotments. A large array of soft fruits and vegetables
are grown all year round with the grounds surrounded by
apple and pear trees. The space is managed to a high
standard of cultivation and all produce is organic. Green
waste from the surrounding Gallery parkland is
composted and used in the allotments to provide organic
fertiliser.
Green space in our estate is predominantly
at the Gallery of Modern Art, limiting
biodiversity opportunities at our other
galleries.
Continue to look to introduce new measures
and installations that encourage increased
flora and fauna activity onsite.
Produce honey from our bee hives to sell
within our cafes.
Engage and educate the public on
biodiversity where possible.
Future Goals

National Galleries of Scotland
Environmental Sustainability Report 2016-17
Page | 10
Progress and Initiatives
Sustainable Procurement
Challenges
We follow best practise in managing our
procurement processes. Our Procurement Strategy
2016-19 has seven key priorities, one of which is to
deliver sustainable procurement, supporting our
commitment to economic, environmental and social
sustainability.
NGS are signatories to the supplier charter which
gives businesses access to public contracts. Also we
have placed orders through Framework for
Supported factories and businesses, increasing
community benefit where possible.
We run a volunteer program providing opportunities
for people to gain valuable experience in the arts.
We were the first national arts organisation to
achieve the Investing in Volunteers UK quality
standard.
Our IT equipment is Energy Star certified which
ensures they meet stringent environmental and
energy efficiency standards.
Our Office paper is EU-ecolabel certified which
means it meets stringent criteria which take the
whole product life cycle into account - from the
extraction of the raw materials, to production,
packaging and transport, right through to use and
then the recycling bin.
Our cafes use local suppliers to source their food
and supplies leading to a decrease in the carbon
footprint of their supply chain.
We report to government on our sustainable
procurement activities through the annual Climate
Change Duties reporting requirement.
Lack of centralised management for
purchasing can lead to inconsistencies in
our approach to sustainable procurement.
Future Goals
Increase the level of environmentally friendly
office supplies purchased within the
organization.

National Galleries of Scotland
Environmental Sustainability Report 2016-17
Page | 11
The following table provides a summary of how we are performing against our carbon reduction targets.
The following chart provides a summary of how we are performing in energy use.
The following chart provides a summary of how we are performing in transport. Transport Scope 1 2008-09
(Baseline) 2015-16 2016-17 Change from
previous year
Gross Emissions (Tonnes Co2e)
Direct (vehicle fleet)
8.62 14.35 14.56 +1.56%
The following chart provides a summary of how we are performing in water. Scope 3 2008-09
(Baseline) 2015-16 2016-17 Change from
previous year
Water Water m3 20,639 18,383 16,637 -9.5%
Water tonnes (CO2e) 18.09 16.68 15.39 -7.8%
The following chart provides a summary of how we are performing in waste. Scope 3 2008-09
(Baseline) 2015-16 2016-17 Change from
previous year
Waste
Waste Total (tonnes) 117 122 184 +50.8%
Waste Recycled (tonnes) 16 66 122 +84%
Waste to Anaerobic Digestion (tonnes) 0 23 20 -3%
Waste to Refuse Derived Fuel (tonnes) 0 30 69 +230%
Waste to Landfill (tonnes) 97 0 0 0%
Waste (Co2e) tonnes 28.38 2.77 3.87 +43%
EMISSIONS 2008-09 (Baseline)
2015-16 2016-17 Change from previous year
Targets Total Carbon (CO2e) 3,745 2,519 2,251 -10.7%
Our Target - -26.73% -30.55% -3.82%
Actual performance - -34.36% -40.37% +6.01%
Difference - +7.63% +10.82% -
Scopes 2008-09 (Baseline)
2015-16 2016-17 Change from previous year
Gross Emissions (Tonnes Co2e)
Scope 1 : Direct (gas) 1,021 773 765 -1%
Scope 2 : Indirect (electricity generation)
2,476 1,580 1,344 -9.5%
Scope 3 : (electricity transmission & distribution)
193 133 142 +4.6%
Total 3,690 2,486 2,251 -5.9%
Performance Figures

National Galleries of Scotland
Environmental Sustainability Report 2016-17
Page | 12
Emission Factors 2016/17 Electricity Generation (kWh)
Electricity Transmission & Distribution (kWh)
Gas (kWh)
Water Supply (m3)
Water Treatment (m3)
Waste to Landfill (tonne)
Waste Recycled (tonne)
Diesel (Litre)
Petrol (Litre)
0.4493 0.1840 0.3440 0.3440 0.7080 421 21 2.6116 2.1970
Scope Definitions Scope 1: Direct – This includes directly consumption of gas and oil. Emissions from NGS owned fleet vehicles are included. Scope 2: Indirect – This is for emissions which result from energy consumed which is supplied by another party. For us this is electricity generated by another party. Scope 3: Others – This is for emissions relating to official business travel, waste disposal, water supply and treatment and electricity transmission and distribution.