National Evaluation of Up2Us Coach
119
MAKING RESEARCH RELEVANT AMERICAN INSTITUTES FOR RESEARCH | AIR.ORG National Evaluation of Up2Us Coach Program Year 2016–17 FEBRUARY 2018 G. Roger Jarjoura| Jessica Meckes
Transcript of National Evaluation of Up2Us Coach
M AK I NG R E S E A RCH R E L E VA N T
AMERICAN INSTITUTES FOR RESEARCH | AIR.ORG
National Evaluation of Up2Us
Coach
Program Year 2016–17
FEBRUARY 2018
G. Roger Jarjoura| Jessica Meckes


National Evaluation of Up2Us
Coach
Program Year 2016–17
FEBRUARY 2018
G. Roger Jarjoura | Jessica Meckes
1000 Thomas Jefferson Street NW Washington, DC 20007-3835 202.403.5000
www.air.org
Copyright © 2018 American Institutes for Research. All rights reserved.


National Evaluation of Up2Us Coach, 2016-17 Program Year
AMERICAN INSTITUTES FOR RESEARCH | AIR.ORG i
Contents Page
Executive Summary .......................................................................................................................... v
Introduction .................................................................................................................................... 1
Overview of Evaluation ............................................................................................................... 2
Fitness Outcome ......................................................................................................................... 4
High-Impact Attributes ............................................................................................................... 4
Nutritional Habits ........................................................................................................................ 6
Youth Rating of Program/Coach ................................................................................................. 7
Coach Skills .................................................................................................................................. 7
Program Characteristics .............................................................................................................. 9
Program Year 2016–17: Characteristics of Participants and Coaches ...................................... 10
What Host-Site Supervisors and Coaches Said About the Program ......................................... 14
What Youth Said About the Program and Their Coaches ......................................................... 18
Did Up2Us Coach Result in Physical Fitness Improvements? ....................................................... 24
How UC Program Characteristics Related to Fitness Outcomes .............................................. 28
Findings From Focus Groups Regarding Fitness ....................................................................... 32
Does Up2Us Coach Result in Improvements in HIAs? .................................................................. 33
Findings for Core Sample HIAs .................................................................................................. 38
Subgroup Analyses Examining Differences Between UC Core Sample Participants and Comparison Group Youth ......................................................................................................... 61
Findings for Elementary Age Participants ................................................................................. 67
Subgroup Analyses Examining Differences Between UC Elementary Sample Participants and Comparison Group Youth .............................................................................. 80
Findings From Focus Groups Regarding HIAs ........................................................................... 82
Does Up2Us Coach Result in Improvements in Nutritional Habits? ............................................. 84
Findings From Focus Groups Regarding Nutritional Habits ...................................................... 89
What Elements of Program Implementation Contribute to Positive Outcomes? ........................ 89

National Evaluation of Up2Us Coach, 2016-17 Program Year
AMERICAN INSTITUTES FOR RESEARCH | AIR.ORG ii
Multiyear Data .............................................................................................................................. 96
Limitations of the Evaluation ...................................................................................................... 102
Summary and Discussion ............................................................................................................ 103
Tables Page
Table 1. Breakdown of Youth, Coach, and Group Characteristics, Full and Analysis Samples ........................................................................................................................... 10
Table 2. Average Ratings by Youth of Coaches and Programs ..................................................... 20
Table 3. Examination of Alignment Between Youth and Coach Assessments ............................. 20
Table 4. Results of Regression Models, Outcomes for Older Youth (Core Endline Surveys) ....... 92
Table 5. Results of Regression Models, Outcomes for Elementary School Youth and Fitness Outcomes for All ................................................................................................. 95
Figures Page
Figure 1. Up2Us Coach Theory of Change ...................................................................................... 3
Figure 2. Mean PACER Scores at Baseline and Endline ................................................................ 25
Figure 3. Mean Change in PACER Score by Baseline PACER Rank ................................................ 25
Figure 4. Mean PACER Scores for the Intervention and Comparison Sites .................................. 26
Figure 5. Mean Change in PACER Scores From Baseline to Endline ............................................. 27
Figure 6. Breakdown of Cases by Healthy Fitness Zone Standards .............................................. 28
Figure 7. Distribution of Scores on Coach Self-Awareness ........................................................... 29
Figure 8. Mean Change in PACER Score by Coach Self-Awareness a, c .......................................... 30
Figure 9. Mean Change in PACER Score by Coach HIAs ................................................................ 30
Figure 10. Mean Change in PACER Score by Coach Skills ............................................................. 32
Figure 11. Percentage Reporting Improvement or No Change From Baseline to Endline by Baseline Ranking .................................................................................................... 34
Figure 12. Mean Improvement From Baseline to Endline on High-Impact Attributes for Core Sample ................................................................................................................ 36

National Evaluation of Up2Us Coach, 2016-17 Program Year
AMERICAN INSTITUTES FOR RESEARCH | AIR.ORG iii
Figure 13. Mean Improvement From Baseline to Endline on High-Impact Attributes for UC Core Sample and Matched Comparison Group .................................................... 37
Figure 14. Results From Subgroup Analyses for Core Group on Self-Awareness ......................... 41
Figure 15. Results From Subgroup Analyses for Core Group on Positive Identity ....................... 44
Figure 16. Results From Subgroup Analyses for Core Group on Situational Awareness.............. 46
Figure 17. Results From Subgroup Analyses for Core Group on Future Focus and Plan B Thinking ....................................................................................................................... 49
Figure 18. Results From Subgroup Analyses for Core Group on Discipline .................................. 52
Figure 19. Results From Subgroup Analyses for Core Group on Social Confidence ..................... 54
Figure 20. Results From Subgroup Analyses for Core Group on Pro-Social Connections ............ 57
Figure 21. Results From Subgroup Analyses for Core Group on Well-Being ................................ 59
Figure 22. Comparative Analyses for Core Group by Gender ...................................................... 62
Figure 23. Comparative Analyses for Core Group by Grade Level ............................................... 64
Figure 24. Comparative Analyses for Core Group for In-School Versus Afterschool Programming .............................................................................................................. 66
Figure 25. Percentage Reporting Improvement or No Change From Baseline to Endline by Baseline Ranking .................................................................................................... 68
Figure 26. Mean Improvement (Baseline to Endline) on High-Impact Attributes, Elementary Sample ..................................................................................................... 69
Figure 27. Comparative Analysis for HIAs From Elementary Survey ............................................ 69
Figure 28. Results From Subgroup Analyses for Elementary Group on Positive Identity ............ 71
Figure 29. Results From Subgroup Analyses for Elementary Group on Discipline ....................... 73
Figure 30. Results From Subgroup Analyses for Elementary Group on Social Confidence .......... 74
Figure 31. Results From Subgroup Analyses for Elementary Group on Pro-Social Connections ................................................................................................................ 76
Figure 32. Results From Subgroup Analyses for Elementary Group on Well-Being ..................... 78
Figure 33. Comparative Analyses for Elementary Group by Gender............................................ 81
Figure 34. Comparative Analyses for Elementary Youth, In-School Versus Afterschool Programming .............................................................................................................. 82
Figure 35. Mean Improvement From Baseline to Endline on Nutritional Habits ......................... 85
Figure 36. Results From Subgroup Analyses for Core Group on Nutritional Habits ..................... 86
Figure 37. Results From Subgroup Analyses for Elementary Group on Nutritional Habits .......... 88
Figure 38. Breakdown of UC Participants by Length of Time in Program .................................... 96

National Evaluation of Up2Us Coach, 2016-17 Program Year
AMERICAN INSTITUTES FOR RESEARCH | AIR.ORG iv
Figure 39. Mean PACER Scores in Year 1 and Year 2 .................................................................... 97
Figure 40. Results From Multiyear Analyses on PACER Results ................................................... 98
Figure 41. Results From Multiyear Analyses on HIA Results, Core Sample With 2 Years of Data ............................................................................................................................. 99
Figure 42. Results From Multiyear Analyses on HIA Results, Core Sample Based on Length of Time With Program ................................................................................... 100
Figure 43. Multiyear Results for Mean Change From Baseline to Endline on HIAs, Core Sample ....................................................................................................................... 101
Figure 44. Results From Multiyear Analyses on HIA Results, Elementary Sample ..................... 102

National Evaluation of Up2Us Coach, 2016-17 Program Year
AMERICAN INSTITUTES FOR RESEARCH | AIR.ORG v
Executive Summary
This report is an evaluation of Up2Us Sports’ Up2Us Coach (UC) program, as implemented
across 68 sites during the 2016–17 program year. As conducted by the American Institutes for
Research, this evaluation focused on the following research questions:
1. To what extent does working with a UC coach at a host site improve the physical fitness
of youth participants?
2. To what extent does working with a UC coach at a host site increase the development of
attributes that contribute to healthy decision making?
3. To what extent does working with a UC coach at a host site improve the nutritional
habits of youth participants?
4. What elements of program implementation contribute most to positive outcomes?
UC is the flagship program of Up2Us Sports, and supports a network of sports-based youth
development programs based in the nation’s most underserved communities through the
provision of trained coaches. UC coaches complete 40 hours of training emphasizing sports-
based youth development strategies, social-emotional skill-building techniques, and mentoring
strategies for programming with at-risk youth experiencing the adverse effects of poverty and
violence. The support provided by UC to the host sites that appears to enhance capacity and
sustainability for the programming being offered. The host sites also appreciate the ways in
which UC emphasizes training and a culture of trauma-informed, sports-based youth
development. In addition, the coaches report feeling empowered by their understanding of the
needs of the youth they serve and through the internalization of real learning in the
development of their coaching skills. Finally, the youth provide very high ratings on the quality
and impact of the coaches and the program.
Did working with a UC coach at a host site improve the physical fitness of youth participants?
Indeed, participants increased their level of fitness while in the program. We found this
outcome to be true for youth at all levels of initial fitness and for youth at all ages. We also
found incremental improvements that continued if youth were taking part in the program over
time. In addition, if the youth started out below the Healthy Fitness Zone (HFZ) standards, the
programming that they experienced in UC resulted in the achievement of improvements
bringing the youth in line with the standards. Progress toward meeting the HFZ standards is one
of the ways in which the UC programming had a significantly greater impact than was found
with the comparison group. Finally, we found that greater levels of improvement were evident

National Evaluation of Up2Us Coach, 2016-17 Program Year
AMERICAN INSTITUTES FOR RESEARCH | AIR.ORG vi
when the coaches reported higher ratings on each of the coach high-impact attributes (HIAs)
and on several coach skills.
Did working with a UC coach at a host site increase the development of attributes that contribute
to healthy decision making? Results indicated that participants experienced improvements in each
of the HIAs while they were in the program. We found improvements to be evident at all levels of
the baseline scores, with the biggest gains for those youth at the lowest baseline levels. This
evaluation, however, found only limited evidence of significant differences in youth HIAs between
those in UC and youth in a matched comparison group. A series of subgroup analyses provided
further clarification on the conditions under which improvements in the HIAs were more likely. We
found that improvements on the HIAs were most likely for those in high school, those participating
in afterschool programs, and those who had already been participating in the program before the
current year, especially those in the program for 1 year or more. Greater improvements were often
found for those youth working with a single coach and for those youth in groups with at least one
repeating coach. Finally, youth were more likely to experience improvements on the HIAs when
working with male coaches, although girls often showed significant improvements when working
exclusively with female coaches.
Did working with a UC coach at a host site increase the development of attributes that
contribute to improvements in nutritional habits? For the overall analysis sample, we found
evidence that participation in the program was associated with improvements in nutritional
habits. We also found that when youth perceive that the coach is someone they can look up to,
go to for help, and trust and that the program is helpful, they are much more likely to report
significant improvement in each of their HIA and nutritional habit outcomes.
What elements of program implementation contributed most to positive outcomes?
Reported improvements were higher for youth in groups with at least one repeat coach
compared with participants in groups in which all the coaches were new to UC. Similarly, higher
levels of improvement in youth outcomes were evident in groups in which there was only one
coach. There was some evidence of improvements in youth outcomes where the coaches were
not from the same community that they were serving and where there was more regular
contact between the coach and the host-site supervisor. We also found differences in the
impact on youth who participated in the afterschool programs, compared with youth in
programs that took place during the school day. From the multivariate analyses for the youth
outcomes, three key insights emerge regarding UC:

National Evaluation of Up2Us Coach, 2016-17 Program Year
AMERICAN INSTITUTES FOR RESEARCH | AIR.ORG vii
• Dosage matters. When programs provided a greater number of sessions adjusted for the
length of time from the start date to the end date for the current program year, participants
were more likely to report improved outcomes.
• Training matters. When the coaches reported that the skills and strategies they learned from the
Institute made them better coaches, participants were more likely to report improved outcomes.
• Implementation matters. When the coaches reported that their implementation of the UC
model was extremely successful, participants were more likely to report improved outcomes.

National Evaluation of Up2Us Coach, 2016-17 Program Year
AMERICAN INSTITUTES FOR RESEARCH | AIR.ORG 1
Introduction
Up2Us Sports is a leader in the delivery of sports-based youth development programs across
the United States. Its mission is to “inspire youth to achieve their potential by providing them
coaches who are trained in positive youth development.” Its flagship program is Up2Us Coach
(UC), which supports a network of sports-based youth development programs based in the
nation’s most underserved communities through the provision of trained coaches. UC coaches
complete 40 hours of training in youth development and mentoring strategies. In this training,
coaches learn strategies for stimulating physical activity, healthy living, and good decision
making in the youth participants. The coaches receive training with the following emphases:
• Sports-based youth development strategies that help youth translate athletic skills to life
skills
• Social-emotional skill-building techniques appropriate for programming with at-risk youth
experiencing the adverse effects of poverty and violence
• Mentoring strategies that cultivate caring, trust-based relationships with the youth they
serve, including between the youth in their group
For the 2016–17 program year, Up2Us Sports has contracted with the American Institutes for
Research (AIR) to evaluate the effectiveness of the UC program across a number of its sites.
This includes all of the UC sites in New Orleans and all the AmeriCorps National sites across the
U.S. In establishing the contract for this independent evaluation, it was determined that the
goal of this evaluation was to gain information about the program’s ability to influence the
physical fitness, internal attributes, and nutrition of youth participants in the UC program
nationally.
The research questions that this evaluation sought to answer are as follows:
1. To what extent does working with a UC coach at a host site improve the physical fitness of youth participants?
2. To what extent does working with a UC coach at a host site increase the development of attributes that contribute to healthy decision making?
3. To what extent does working with a UC coach at a host site improve the nutritional habits of youth participants?
4. What elements of program implementation contribute most to positive outcomes?
The methodology for the evaluation involved a quasi-experimental design that included
participants from many of the UC sites and youth in comparison groups recruited from New

National Evaluation of Up2Us Coach, 2016-17 Program Year
AMERICAN INSTITUTES FOR RESEARCH | AIR.ORG 2
Orleans and Washington, D.C. The evaluation also involved the collection of quantitative
measures for three key outcomes:
1. PACER (Progressive Aerobic Cardiovascular Endurance Run) fitness test: a timed, multistage assessment of aerobic fitness that measures students’ endurance to run a specified distance with gradually increasing intensity
2. High-Impact Attributes (HIA) survey: a validated survey tool to measure a group of attributes that research has identified as contributing to healthy decision making and positive life outcomes
3. Nutrition recall survey: a self-reported 24-hour recall of diet (selected questions from the California Healthy Kids Survey)
Additional measures were used, including assessments of coaching sessions using an
observation tool designed by Up2Us Sports. Several focus groups and interviews were also held
with host-site supervisors (HSSs), coaches, and youth participants.
This report begins with an overview of the evaluation of Up2Us Coach. This overview is
followed by a descriptive analysis of UC during the 2016–17 program year, in which we examine
the characteristics of the youth participating in the program, their coaches, and the groups in
which the youth are enrolled. We then introduce the comparison group and discuss its
characteristics relative to the youth in UC. Next, we examine how the program operated during
the year that is the focus of this evaluation. This discussion will be followed by the presentation
of the results of the outcome analyses.
We organize the presentation of the findings from the outcome analyses in terms of the
research questions. We will first consider the results on the fitness outcomes. Then we will
examine the results from the analyses of the HIAs. Finally, we will explore whether participation
in UC is related to improvements in nutritional habits. Following the presentation of the
findings, we discuss the limitations of this evaluation, and we conclude the report with a
summary and discussion of the key findings from the evaluation.
Overview of Evaluation
This evaluation was designed to address the four research questions presented earlier. It was
also structured as an exploration of the UC theory of change, which is shown in Figure 1. The
theory of change lays out a model by which the UC intervention is expected to influence youth
outcomes.

National Evaluation of Up2Us Coach, 2016-17 Program Year
AMERICAN INSTITUTES FOR RESEARCH | AIR.ORG 3
As shown in Figure 1, trained coaches should understand the principles and practices of sports-
based youth development, particularly for low-income youth who have previously experienced
trauma. The training, along with the UC structure for the coaches, should contribute to a
greater capacity on the part of the coaches for building relationships with the youth
participants and creating a positive culture within the groups. We also expect that the training
and program support will shape the priorities of the coaches, contribute to a greater sense of
self-efficacy for coaches, and lead to improvements in high-impact attributes of the coaches.
The youth in these programs should experience improvements in fitness, nutritional habits, and
the high-impact attributes. We also explore whether the effects of the training and coach skills
on youth outcomes vary based on several factors related to the demographic characteristics of
the youth, the attendance of the youth, program characteristics, and program structure.
Figure 1. Up2Us Coach Theory of Change
For the current evaluation, data from multiple sources were provided by Up2Us Sports to AIR.
The AIR researchers were responsible for all cleaning and processing of the data and conducted
all the data analyses reported here. Up2Us Sports had in place pretest and posttest
assessments for each of the key outcome variables. The PACER assessments were conducted at
the local program sites by the coaches. UC coaches also administered the baseline and endline
surveys capturing data for all other outcomes. Data were provided by Up2Us Sports on the
demographic characteristics for all youth participants and all coaches. Further data on the
characteristics of the program groups were provided from information compiled by host sites.

National Evaluation of Up2Us Coach, 2016-17 Program Year
AMERICAN INSTITUTES FOR RESEARCH | AIR.ORG 4
Fitness Outcome
The Progressive Aerobic Cardiovascular Endurance Run (PACER) is the measure of fitness used
for this evaluation. The PACER is a measure of aerobic capacity. During the test, the youth run
back and forth across a 20-meter space at a pace that gets faster each minute. The pace is
initially slow, and the youth are expected to arrive at the other end of the 20-meter space
before a beep occurs. This process continues until the youth fail to arrive at the other end
before the beep sounds. For each successful arrival at the other side (i.e., before the beep), the
youth earn one point. The final score is the number of points accumulated before an individual
misses the goal for the second time. The youth participating in selected UC sites completed the
PACER at baseline and again at endline. We calculated an improvement score indicating the
difference between the endline score and the baseline score.
High-Impact Attributes
Items from the baseline and endline surveys compose several scales that represent high-impact
attributes (HIAs) that have been shown to be related to healthy decision making. The HIAs were
first presented in The Anatomy of a Health Seeking Choice: Uncovering a Set of Special Attributes
That Promote Health Seeking Choices Among Young People, by Edgework Consulting.1 Eight HIAs
were identified in this report: self-awareness, identity, situational awareness, Plan B thinking, future
focus, discipline, social confidence, and pro-social connections. In a previous study, Up2Us Sports
worked with School to School International to develop a set of survey items to measure the HIAs.2
In the development of the surveys, the decision was made to combine future focus and Plan B
thinking into a single scale. An additional scale was added to the surveys—a well-being scale that
was derived from the Gallup Student Poll. This scale was included in the Up2Us Sports evaluation
because the Gallup research found that students scoring higher on well-being were more likely to
experience better educational and health outcomes.
From the Core Youth Survey (for youth in Grades 6–12), eight different scales were constructed
representing the HIAs:3
• Self-Awareness—five items in which youth indicated the extent to which they were alert to
changes in moods, able to explain why when in a bad mood, able to change bad thoughts to
happier thoughts, aware of how their mind worked during problem solving, and generally
aware of their own feelings.
1 https://www.sportanddev.org/sites/default/files/downloads/the_anatomy_of_a_health_seeking_choice_.pdf 2 http://homecourt.up2us.org/page/HIA_survey_info/High-Impact-Attributes-survey-tool.htm 3 Although it was not one of the original HIAs, well-being will be referred to in this report as one of the HIAs. Because future focus and Plan B thinking are combined into a single HIA, eight HIAs are examined in this evaluation.

National Evaluation of Up2Us Coach, 2016-17 Program Year
AMERICAN INSTITUTES FOR RESEARCH | AIR.ORG 5
• Positive Identity—five items in which youth indicated the extent to which they believed in
themselves, felt satisfied with themselves, recognized that they had good qualities and that
they were as good as most people, and had an optimistic perspective that things would go
well if they try.
• Situational Awareness—five items in which youth indicated the extent to which they were
always aware of things around themselves, alert to risks regarding personal safety, aware of
things in their environment, and inclined to look for ways to leave unsafe situations.
• Future Focus and Plan B Thinking—seven items in which youth indicated the extent to
which they thought about goals, strategized and planned ways to achieve goals, strove to
reach higher standards, had more than one option to achieve outcomes and solve
problems, and had backup plans when things did not go as planned.
• Discipline—five items in which youth indicated the extent to which they worked hard to
reach goals, exercised self-control to stay out of trouble, finished what they started, and
made decisions that helped them to be a better person.
• Social Confidence—five items in which youth indicated the extent to which they were
comfortable speaking in front of a group, able to work on something even when being
watched, able to talk with all kinds of people, comfortable asking for help when needed,
and not easily embarrassed.
• Pro-Social Connections—five items in which youth indicated the extent to which they had
people they could count on in an emergency, belonged to groups that were good for them
and that brought out their personal strengths and successes, had someone to talk to about
important decisions, and had friends who contribute to personal growth (e.g., “make me a
better person”).
• Well-Being—five items in which youth indicated the extent to which they felt they had
family and friends they could count on if they were in trouble, and whether over the past
day they were treated with respect by others, smiled or laughed a lot, learned or did
something interesting, and had enough energy to get things done.
From the Elementary Youth Survey (for youth in Grades 3–5), there were five different scales
representing the HIAs:
• Positive Identity—four items in which youth indicated the extent to which they agreed with
the following statements: I can do things as well as most other kids; I like myself; I feel that
there are a lot of good things about me; I am happy with who I am.
• Discipline—four items in which youth indicated the extent to which they agreed with the
following statements: I am good at controlling myself to keep out of trouble; I finish everything I
National Evaluation of Up2Us Coach, 2016-17 Program Year
AMERICAN INSTITUTES FOR RESEARCH | AIR.ORG 6
start; I know how to say “no” when someone wants me to do things I know are wrong or
dangerous; before I do something, I think about if it is a good choice or a bad choice.
• Social Confidence—four items in which youth indicated the extent to which they agreed with
the following statements: I like to talk to people who are different than me; I am good at
making friends; it is easy for me to talk with all kinds of people; I ask for help when I need it.
• Pro-Social Connections—four items in which youth indicated the extent to which they
agreed with the following statements: I spend most of my time with good people; when I
am with my friends, I feel good about who I am; when I am in trouble, there are people I
can turn to for help; there is an adult I can talk to about important things.
• Well-Being—five items in which youth indicated the extent to which they agreed with the
following statements: at school, I feel like I fit in; I smiled or laughed a lot yesterday; I enjoy
my schoolwork; I have a lot of energy; and if I am in trouble, I have family or friends I can
count on to help.
For each of the HIA scales, scores across the various items were averaged together so that
there was an overall scale score of 1–5, with higher scores representing a greater level of that
HIA. Because the research questions focus on whether there is improvement in the HIAs from
baseline to endline, we also calculated a change score (the difference between the baseline and
the endline scores) that is the dependent variable in some analyses.
Nutritional Habits
Included on the youth surveys were a small number of items that were adapted from the
California Healthy Kids Survey (Physical Health & Nutrition module). The items were coded so
that higher values represented more healthy choices/behaviors.4 We then calculated a change
score to show improvement from baseline to endline on each of the two scales.
• Nutritional Habits (Core Survey)—four items in which youth were asked to indicate how
many times in the previous 24 hours they drank soda, ate french fries or potato chips, ate
fruit, and ate vegetables.
• Nutritional Habits (Elementary Survey)—two items in which youth reported whether they
knew what foods were healthy and whether they usually eat healthy foods.
4 Items were coded so that higher values represented more healthy choices, so some items were recoded from their original values on the survey, as appropriate.

National Evaluation of Up2Us Coach, 2016-17 Program Year
AMERICAN INSTITUTES FOR RESEARCH | AIR.ORG 7
Youth Rating of Program/Coach
On the endline survey, youth were asked to rate their coaches and the program. All youth were
asked the following questions: Do you trust your coach in this program? Does this program help
you to be healthy? Does this program help you do better at school? Do you ask your coach in
this program for help when you need it? (On the survey for the older youth, the question was
“Is your coach in this program someone you go to for help or advice?”) Two additional
questions were asked on the survey for the older youth: Is your coach in this program a good
role model? Will the things you learned at program or from coach help you in life?
Coach Skills
Several scales were constructed from items on the coach endline survey. We are including
scales in the analyses that were identified in the theory of change.
• Coach Self-Efficacy—five items from the coach endline survey that include responses by the
coach to items indicating: feeling successful as a coach, enjoying coaching, knowing the
sport well that is being coached, knowing how to effectively coach kids, and contributing to
positive change in the lives of youth.
• Coaching Confidence (Building Team Culture)—five items from the coach endline survey that
include responses by the coach to items indicating how confident the coach feels to: build the
self-esteem of the players, build team cohesion, promote good sportsmanship, instill an
attitude of respect for others, and address behavior problems of the youth you work with.
• Coaching Confidence (Role Model)—four items from the coach endline survey that include
responses by the coach to items indicating how confident the coach feels to: motivate the
players, promote good sportsmanship, teach the skills of your sport, and serve as a role
model to the youth you work with.
• Focus on Relationships—three items from the coach endline survey that include responses
by the coach to items indicating how important it is for the coach to: get to know players off
the field as well as on, have the ability to form good relationships with players, and facilitate
good relationships between the players.
• Focus on Skills—four items from the coach endline survey that include responses by the
coach to items indicating how important it is for the coach to: help each player develop
sport skills, give players the opportunity to contribute to practice structure and activities,
dedicate practice time to linking sport skills to life skills, and come to practice with a
detailed practice plan.
• Making a Difference—three items from the coach endline survey that include responses by
the coach to items indicating that: I feel successful as a coach, I know how to effectively

National Evaluation of Up2Us Coach, 2016-17 Program Year
AMERICAN INSTITUTES FOR RESEARCH | AIR.ORG 8
coach kids, and I contribute to positive change in the lives of youth. In addition, we are
including a single item indicating the level of agreement with whether youth learned life
skills or developed attributes through the UC program.
• Trusted Role Model—three items from the coach endline survey that include responses by
the coach to items indicating that: the youth I worked with saw me as a role model, the
youth I worked with saw me as an adult they can trust, and the youth I worked with came to
me when they had problems in their lives.
• Training Impact—a single item in which coaches indicated their level of agreement about
whether they learned skills and strategies from the UC training that made them a better coach.
• Self-Report of Extremely Successful Implementation—a single item that sorted coaches
into two groups based on whether they rated their implementation of the UC model as
extremely successful.
• Self-Awareness—five items from the coach endline survey that are like the items from the
Core Youth Survey for this HIA.
• Positive Identity—five items from the coach endline survey that are like the items from the
Core Youth Survey for this HIA.
• Situational Awareness—five items from the coach endline survey that are like the items
from the Core Youth Survey for this HIA.
• Future Focus and Plan B Thinking—five items from the coach endline survey that are a
subset of the items from the Core Youth Survey for this HIA.
• Discipline—five items from the coach endline survey that are like the items from the Core
Youth Survey for this HIA.
• Social Confidence—five items from the coach endline survey that are like the items from
the Core Youth Survey for this HIA.
• Pro-Social Connections—five items from the coach endline survey that are like the items
from the Core Youth Survey for this HIA.
• Social Confidence—five items from the coach endline survey that are like the items from
the Core Youth Survey for this HIA.
We also constructed a set of four scales from the items on the Observation Tool that was used
to rate individual sessions by the coaches. For these scales, the scores represent a sum of
ratings across all the following items.
• Coach Planning Score—session plan, safe activity space, informal time, and checking in.

National Evaluation of Up2Us Coach, 2016-17 Program Year
AMERICAN INSTITUTES FOR RESEARCH | AIR.ORG 9
• Team Culture Score—the kids are excited, the kids are having fun and smiling, positive peer
interactions, positive kid/coach relationship, and celebrating success.
• Coach Completes Key Tasks Score—describes session goals, highlights sports skills,
highlights life/character skills, clear directions, quick creative transitions, mix of games and
drills, reflection wrap-up activity, and rate experience and performance.
• Coach Exhibits Effective Habits Score—90% to 100% of youth engaged; opportunities for
youth to contribute in a meaningful way; effectively gets the attention of students;
effectively manages behavioral issues with students; gives feedback on sports skills; gives
feedback on life skills; promotes physical fitness; kids are running around sweating more
often than standing still in lines; coach knows names, team rules, routines, and traditions;
small-group opportunities; and deliberate informal time.
Program Characteristics
Throughout the analyses we are interested in assessing the potential moderating effects of
several characteristics of the program groups.
• In-School Versus Afterschool Programming—whether the programming was taking place as
part of the school day or not.
• Full-Time Versus Part-Time Coaches—we distinguished between groups in which all the
coaches were in full-time slots and groups in which all the coaches were in part-time slots.
• Number of Up2Us Coaches for Group—we distinguished between program groups based
on how many UC coaches were engaged: one, two, or three or more UC coaches.
• Gender Breakdown of Coaches—we distinguished between female coaches and male
coaches. For groups with multiple coaches, we distinguished between the groups that had
all-female coaches and the groups that had all-male coaches. A third category included
groups with a mixture of men and women on the coaching team.
• Head Coach Versus Assistant Coach—we compared program groups in which all the UC
coaches were assistant coaches with the groups in which at least one UC coach served as a
head coach.
• Coach From the Community—we distinguished between program groups based on whether
the coach was from the community in which he or she was serving.
• New Coach Versus Returning Coach—we distinguished between program groups based on
whether the coaches on the team were all new to UC or whether at least one of them was a
returning coach from the previous year.

National Evaluation of Up2Us Coach, 2016-17 Program Year
AMERICAN INSTITUTES FOR RESEARCH | AIR.ORG 10
• Contact With the Host-Site Supervisor (HSS)—the final way that we examined differences
in the program group models focused on the level of contact between the coaches and their
HSS. Coaches were asked to report for a typical week on the number of days per week the
coach saw his or her HSS and how many days per week the HSS was present during
programming. We distinguished between program groups in terms of three categories: no
contact—characterized by an average of HSS presence of zero times each week on both
dimensions (how many times a week the coach saw the HSS, and how many times the HSS
was present during programming); low contact—indicated if one of those values was not
zero; and high contact—characterized by nonzero values on both dimensions.
Program Year 2016–17: Characteristics of Participants and Coaches
For the 2016–17 program year, 325 program groups across 68 host sites provided programming
to 9,719 youth. Of these youth, 3,229 (33.2%) participated in the surveys that were
administered at baseline and endline. In addition, 4,271 youth (43.9%) completed the PACER
that was administered at baseline and endline. Results in this report that focus on the fitness
outcomes were based on the subsample for which there was PACER data. All other results were
generated from analyses on the subsample of those youth who completed the surveys. In Table
1, we present a breakdown of youth, coach, and group characteristics for the full sample of
youth served during the program year and the analysis sample. Because the analyses are
reported separately throughout this report for elementary youth and for those in middle and
high school (combined as the “core sample”), we further break down the descriptive
characteristics by the two samples (i.e., core sample and elementary sample).
Table 1. Breakdown of Youth, Coach, and Group Characteristics, Full and Analysis Samples
Elementary
Sample
(N=2,915)
Core
Sample
(N=2,362)
Full
Sample
(N=9,719)
Youth Demographic
Characteristics
Male 53.3% 54.4% 54.5%
Female 46.7% 45.6% 45.5%
African American 83.6% 61.0% 58.3%
Hispanic 8.6% 16.9% 23.8%
Caucasian 4.6% 8.2% 6.5%
Length of Time in
Program
Not Brand New 35.1% 60.5% 47.4%
Brand New to Program 64.9% 39.5% 52.6%
Number of Years in
Program
Less Than Two 81.5% 55.1% 65.9%
Two or More 18.5% 44.9% 34.1%

National Evaluation of Up2Us Coach, 2016-17 Program Year
AMERICAN INSTITUTES FOR RESEARCH | AIR.ORG 11
Elementary
Sample
(N=2,915)
Core
Sample
(N=2,362)
Full
Sample
(N=9,719)
In-school or Afterschool
Program
Program Took Place During School Hours 83.1% 52.8% 61.5%
Program Took Place Outside School Hours 16.9% 47.2% 38.5%
Are Coaches Full-Time or
Part-Time
Full-Time 2.2% 15.2% 15.7%
Part-Time 93.6% 78.8% 78.2%
Both Full-Time and Part-Time 4.2% 5.9% 6.1%
Head Coach?
UC Coach Serves as Assistant Coach 61.0% 63.4% 54.3%
At Least One UC Coach Serves as Lead
During Programming
39.0% 36.6% 45.7%
Number of Coaches in
Group
One 56.7% 66.3% 62.2%
Two 7.9% 18.3% 17.2%
Three or More 35.4% 15.4% 20.6%
Gender Breakdown of
Coaches
Female Coaches Only 37.6% 33.0% 42.3%
Male Coaches Only 34.3% 45.7% 41.1%
Mixed Male and Female Coaches 28.1% 21.2% 16.6%
Is Coach From the
Community?
Coach Not From the Same Community 40.6% 29.6% 29.2%
Coach From the Same Community 59.4% 70.4% 70.8%
Host-Site Supervisor
Contact
None 1.7% 3.9% 6.3%
Low 11.2% 28.9% 20.7%
High 87.0% 67.2% 73.0%
No Repeating Coaches Returning Coach (at Least One) 16.4% 19.5% 18.5%
New Coach(es) Only 83.6% 80.5% 81.5%
Coach Reports: The
youth I worked with saw
me as a role model.
Strongly Disagree 18.5% 9.6% 11.9%
Agree 54.8% 57.1% 49.7%
Strongly Agree 26.7% 33.3% 38.4%
Coach Reports: The
youth I worked with saw
me as an adult they can
trust.
Strongly Disagree 18.5% 9.6% 11.9%
Agree 50.9% 37.3% 37.0%
Strongly Agree 30.6% 53.1% 51.0%
Coach Reports: The
youth I worked with
came to me for help
Strongly Disagree 18.6% 17.8% 14.6%
Neither Agree nor Disagree 6.4% 11.2% 8.2%
Agree 50.5% 39.3% 45.2%

National Evaluation of Up2Us Coach, 2016-17 Program Year
AMERICAN INSTITUTES FOR RESEARCH | AIR.ORG 12
Elementary
Sample
(N=2,915)
Core
Sample
(N=2,362)
Full
Sample
(N=9,719)
when they had problems
in their lives.
Strongly Agree 24.5% 31.7% 32.0%
Self-Report of Extremely
Successful
Implementation
No 41.4% 67.0% 61.5%
Yes 58.6% 33.0% 38.5%
Coach Self-Awareness
Low 39.9% 32.6% 34.9%
Medium 11.2% 22.4% 25.7%
High 48.9% 45.0% 39.4%
Coach Positive Identity
Low 13.9% 20.0% 26.8%
Medium 37.3% 28.9% 30.3%
High 48.9% 51.0% 42.9%
Coach Situational
Awareness
Low 24.7% 13.5% 23.8%
Medium 24.1% 22.1% 22.7%
High 51.1% 64.5% 53.4%
Coach Future Focus and
Plan B Thinking
Low 36.6% 28.3% 39.3%
Medium 13.0% 27.8% 24.7%
High 50.4% 43.9% 36.1%
Coach Discipline
Low 11.2% 20.2% 24.6%
Medium 38.5% 38.9% 38.6%
High 50.3% 40.9% 36.8%
Coach Social Confidence
Low 43.9% 29.2% 34.5%
Medium 25.1% 29.0% 31.2%
High 31.0% 41.8% 34.2%
Coach Pro-Social
Connections
Low 45.5% 23.3% 39.2%
Medium 2.6% 15.4% 9.8%
High 51.9% 61.3% 51.0%
Focus on Skills
Low 26.1% 18.6% 21.5%
Medium 44.0% 39.3% 37.3%
High 29.9% 42.1% 41.2%
Focus on Relationships Low 42.6% 33.7% 34.8%
Medium 3.9% 42.9% 32.3%

National Evaluation of Up2Us Coach, 2016-17 Program Year
AMERICAN INSTITUTES FOR RESEARCH | AIR.ORG 13
Elementary
Sample
(N=2,915)
Core
Sample
(N=2,362)
Full
Sample
(N=9,719)
High 53.5% 23.3% 32.9%
Coach Planning Score
Low 60.4% 20.8% 42.9%
Medium 16.7% 37.0% 20.5%
High 22.9% 42.2% 36.6%
Team Culture Score
Low 33.9% 15.0% 25.4%
Medium 39.0% 38.5% 43.2%
High 27.1% 46.6% 31.5%
Coach Completes Key
Tasks Score
Low 42.3% 26.6% 36.8%
Medium 53.6% 42.5% 41.6%
High 4.1% 30.9% 21.6%
Coach Exhibits Effective
Habits Score
Low 57.0% 29.6% 46.4%
Medium 17.8% 17.1% 19.4%
High 25.2% 53.4% 34.2%
Coach Confidence
(Building Team Culture)
Low 8.0% 25.8% 21.7%
Medium 50.3% 37.1% 38.8%
High 41.7% 37.0% 39.5%
Coach Confidence (Role
Model)
Low 34.1% 27.8% 30.7%
Medium 6.3% 40.2% 31.1%
High 59.6% 32.0% 38.2%
Coach Report: Trusted
Role Model
Low 67.0% 49.1% 45.5%
Medium 9.3% 19.6% 22.6%
High 23.8% 31.3% 31.9%
Coach Report: Making a
Difference
Low 21.2% 20.6% 19.9%
Medium 37.9% 36.1% 42.5%
High 40.9% 43.4% 37.6%
Just over half (55%) of the youth participating in UC were male. Nearly 60% were African
American. In addition, just about one quarter of the youth were Hispanic, and just about 7%
were Caucasian. Just over half of the youth were brand new to the program, but over one third
had been in the program 2 or more years. Just over 60% of the youth were participating in
programming that took place during school hours.

National Evaluation of Up2Us Coach, 2016-17 Program Year
AMERICAN INSTITUTES FOR RESEARCH | AIR.ORG 14
Almost half of the youth were in groups in which at least one UC coach was serving as the head
coach during the programming. More than three fourths of the youth were in groups in which
the coaches were part-time. Six percent of the youth were participating in groups in which
there were both full-time and part-time coaches. More than 80% of the youth were
participating in groups in which all the coaches were new to UC, and 70% of the youth were in
groups in which there was higher contact between the coaches and their host-site supervisor
each week.
More than 60% of the youth were in a group with only one coach, and one fifth were in a group
with three or more UC coaches. In terms of the gender breakdown of the coaches, just over
40% of the youth were in groups in which all the coaches were female. An equal percentage of
the youth were in groups in which all the coaches were male. Just over 70% of the youth were
in groups in which the coach came from the same community.
Most of the youth (more than 75%) were in groups with coaches who reported feeling as
though the youth saw them as a role model, someone the youth could trust, and someone the
youth could come to with problems. We look more closely at the mutual ratings by the youth
and coaches on these dimensions later in this report. Coaches were asked to indicate how
successful they felt their implementation of the program was. Nearly 40% of the youth were in
groups in which the coaches indicated that the implementation was extremely successful.
On the coach endline survey, coaches rated themselves on each of the HIAs. From a visual
inspection of how the coaches clustered together across the full distribution of scores (see
Figure 7 for one example), coaches were sorted into three categories (i.e., low, medium, high).
As shown in Table 1, youth were found to work with coaches across all levels of each of the
HIAs. A few patterns are worth noting. More than half of the youth were in groups with coaches
who had medium situational awareness. In addition, half of the youth in UC took part in groups
in which the coaches rated themselves high on pro-social connections. It is also interesting to
note that across many of the HIAs, youth working with coaches scoring higher on the various
HIAs were more likely to be in the analysis sample. If youth across all groups had a relatively
equal chance of being assigned to participate in the surveys, the data in Table 1 suggest that
coaches with higher scores on the HIAs did a better job of administering the surveys to their
participants.
What Host-Site Supervisors and Coaches Said About the Program
Before we turn to the outcome analyses, we first dig a little deeper into how UC is perceived by
those involved: the host-site supervisors, the coaches, and even the youth. A series of focus

National Evaluation of Up2Us Coach, 2016-17 Program Year
AMERICAN INSTITUTES FOR RESEARCH | AIR.ORG 15
groups and interviews were conducted by Up2Us Sports staff during the evaluation period (in
fall 2016 and spring 2017). As part of the evaluation, AIR conducted qualitative analyses on
transcripts from focus groups of coaches and youth and interviews with host-site supervisors.
From the perspective of the host site, partnering with Up2Us Sports was viewed to be
advantageous in many ways. First, the partnership is a way to build the capacity of the host-site
organization to serve youth in its community. For instance, the use of AmeriCorps funding to
compensate coaches is an affordable model for the partnering organizations. As one HSS noted,
“It’s hard to pay someone part-time and get their total buy-in, but if they’re signing up through
the Up2Us Sports program, they’ve got that buy-in because they’re signing up for this program
and showing that they already have that underlying passion. That goes a long way.” The
partnering organizations can take an active part in the recruitment of coaches for whom the
organizations then have the support of Up2Us Sports for training and providing ongoing
support. This additional support and monitoring provides a foundation for retaining the
coaches through the end of their term of service, which affords a level of stability that many of
the host sites have struggled to achieve with part-time coaches engaged outside UC. It appears,
also, that some of the host sites have used their partnership with Up2Us Sports to expand their
programming in meaningful ways. As noted by one HSS,
Now that we have the financial support of Up2Us and also the expectations from
AmeriCorps and Up2Us to serve a certain demographic of folks, it definitely has
pushed us to work within schools more and develop our school programs. We
have an Up2Us VISTA as well, and one of the VISTA projects for next year is
working with the coaches to develop a really solid curriculum, which I’m really
excited about. I would say overall it’s been really awesome and it’s really helped
us to formulate consistent program models that fit with Up2Us and help us serve
a high-needs population, which we weren’t necessarily doing before.
A second key advantage for the host sites is in the fulfilling of their mission to provide sports-
based youth development programming. Many host-site supervisors recognized the important
fit between the UC model and their own organization’s mission. As one HSS noted, “Wellness
and nutrition is one of our pillars. So healthy eating habits is something we also preach and
teach, along with experiential learning when it comes to science and math. And we are almost
identically aligned when it comes to the physical aspect of the SBYD [sports-based youth
development] approach.” From the HSS interviews, we also noted a recognition that by
focusing so much on the positive youth development aspects of the UC approach, the programs

National Evaluation of Up2Us Coach, 2016-17 Program Year
AMERICAN INSTITUTES FOR RESEARCH | AIR.ORG 16
can realize benefits across all aspects of the programming they offer. As one HSS noted, “The
youth development aspect comes across the strongest, so any skills that they learn for sport
transfers over to poetry or art and anything else that we do.”
A third way that organizations benefit from their partnership with Up2Us Sports has to do with
the quality of the coaching that is made possible. As one HSS noted, the UC coaches offer
advantages over the typical part-time coaches the organizations might engage: “If I’m hiring
another coach, it’s just going to be for the couple hours of practice.” But UC coaches are “here
at least an hour before practice so if students have any issues, they can come in. It builds a
much stronger relationship than just a regular coach.” Another HSS described the benefits for
the recess programming that the organization specializes in: “Just the combo of the recess
training that we provide and the sports-based youth development training that Up2Us [Sports]
provides, I think it makes this well-rounded individual we can trust to send into school to
facilitate the recess program.” In addition, there is a recognition that this training is a
professional development opportunity for those interested in working with youth and/or
coaching. As one HSS, who was a former coach, noted, “I think there are a lot of people who are
in the same shoes that I was in, where you want to work with youth, you want to be a coach,
but it’s like, how do I do that? And I think it’s a great opportunity to do that.”
A fourth advantage for the host sites noted by the host-site supervisors is in the long-term
sustainability that is affected by the UC approach. There seems to be a pipeline effect in that
the UC coaches sometimes become supervisors, and the training they received from the
Institute lays the foundation to further solidify the goals and strategies of UC in the local
organizations. Some of the host-site supervisors even expressed appreciation for the emphasis
that Up2Us Sports places on evaluation. As one HSS noted, “The evaluation piece . . . is
extremely valuable for us.” Finally, being affiliated with Up2Us Sports appears to bring a level of
external credibility that will benefit the organization over time. As one HSS indicated, “It’s a
pretty huge benefit for not a ton of cost in terms of the Institute training being so quality and
the overall clout that you guys have as a larger organization. It definitely adds to our ability to
present ourselves externally to other groups and also internally to have a lot of quality trained
coaches.”
The Up2Us Sports Training Institute, which provided training for UC coaches through a trauma-
informed curriculum, was a major benefit for the host sites. Organizations are attracted to the
quality and impact of the training and are even interested in expanding the number of their
people, over and above the UC coaches, who can complete the training. Coaches learn a set of
principles that become valuable over the course of the year as they are faced with challenging

National Evaluation of Up2Us Coach, 2016-17 Program Year
AMERICAN INSTITUTES FOR RESEARCH | AIR.ORG 17
moments with the participants in their program. The principles offer a foundation on which
problem solving can happen in coaches’ daily work with young people. The host-site supervisors
report a sense of trust and comfort in putting a coach out at the site when that coach has
already completed the training. One HSS noted, “A lot of times when my [UC] coaches go out to
the field, I feel totally safe and secure in what they are doing and the sites they are running, and
I can focus my time on the coaches that are less knowledgeable about what we are looking for
in coaches.” Another HSS put it this way: “You know, because a lot of times, since I am a host
supervisor or just supervisor, I am not in the mix as much as I want. So, I have to trust and
believe that my guys are doing what they are doing and oftentimes, my [UC] coaches are doing
more than what my regular guys are doing. So, it’s just that awesome trust that I know that the
job she is trained for is going to get done.”
The trained coaches became a source of further capacity-building for the local organization in
the diffusion of the learnings to other coaches. One HSS noted, “The trainings, professional
development that she receives outside of us has been helpful, and then she also gets to bring
those lessons back and share them with the rest of our staff. Those are the two big things I can
think of that have been really helpful.” Another HSS related that “with the training that they’ve
had, they’ve really been able to use that in a positive way with the coaching and with our other
coaches as well, our non-Up2Us coaches. It’s great to have them as a resource for our sports
that we do.”
Finally, the focus of the UC model on trauma-informed coaching is an attractive benefit that
HSSs appreciated. The trauma-informed training that was provided by the Institute was
important for the organizations that want their coaches to focus on the whole child and to
create an environment suitable for underserved youth. As one HSS noted, “So, the fact that
they have an idea that there is a deeper level or an enlightenment to coaching really helps
them when it comes to being patient with the kids who are below the average talent standard
or being patient with the ‘trouble-making’ kids because they understand that maybe there is a
story back there that we don’t know about, and if that kid can’t come here, then where is he
going to go.”
The training that focused on trauma-sensitive coaching prepared coaches to be ready for
unexpected difficult situations. As one HSS related, “I don’t think there’s a harder situation in
our industry than to deal with those trauma-sensitive moments. I think you do a great job of
preparing that on the forefront because you don’t have it all the time, but you do need to be
ready for it.” In articulating how the trauma-sensitive focus prepared the UC coaches, one HSS
noted, “I think actually the Up2Us coaches do tend to be more skillful around triggers and when

National Evaluation of Up2Us Coach, 2016-17 Program Year
AMERICAN INSTITUTES FOR RESEARCH | AIR.ORG 18
a kid is triggered. Some of the other volunteers are informed by more of an old-school
disciplinary approach, which we have to work with them and adjust a little bit.”
In their focus groups, the coaches also provided their perspective on the value of the UC
training. A key point that was stressed was how relevant the training was for coaches’ day-to-
day experience in the program. They left the training with a set of tools they could apply in
practice. The coaches appreciated the opportunity to get feedback from other coaches that
they could put into practice at their own sites. The coaches also noted that the training helped
them to be more intentional and strategic in their interactions with the youth. One coach
indicated, “I thought of coaching as just you teach them a skill and that was it, but going
through the training, I realized it was way more than that.”
It was clear from the coaches that UC was unique among sports-based youth programs that
they had been part of in terms of the quality and quantity of the training they received.
Coaches learned a different style of coaching than they had been shown before. There was a
consensus among the coaches in the focus groups that UC involved more training and ongoing
support than they had been used to in previous coaching experiences. Some coaches even
reported having been involved with programs that provided no training on coaching. One coach
summed up what a different experience the UC training was: “All the trainings I’ve done
beside[s] Up2Us have been boring, and we sit there and they just talk and it feels like a lecture,
so I’m just sitting there and it [is] not interactive, we don’t play games and stuff, so I just think
that’s something that’s different.”
The coaches also emphasized how much the training prepared them to work with the
participants in their groups. Coming away from the training, coaches felt that they understood
better how to build relationships with the youth. Coaches indicated that they felt more
confident to be able to help the youth. In particular, they praised the trauma-informed training
that they felt helped them to understand and deal with emotions—especially emotional
outbursts—and the actions of the participants. As one coach noted, “Trauma-informed training
helps us get to the root of the issue and deal with it.”
What Youth Said About the Program and Their Coaches
The youth provided positive ratings about their coaches and the Up2Us Coach program (Table
2). The highest ratings were found in the responses of the youth about whether their coach was
someone they trust and whether the coach is a good role model. Yet this perception did not
always translate into asking the coach for help and advice—these questions elicited the lowest
average scores in the youth assessments. Although the youth rated the programs highly in
National Evaluation of Up2Us Coach, 2016-17 Program Year
AMERICAN INSTITUTES FOR RESEARCH | AIR.ORG 19
terms of helping the youth to be healthy and whether things were learned in the program (or
from the coach) that will help in the youth’s lives, the ratings on whether the program helped
the youth do better at school were somewhat lower.
Did the youth have perceptions of their own experiences that aligned with the perceptions
expressed by their coaches? In their own endline surveys, the coaches were asked to rate their
agreement on the following statements:
• The youth I worked with saw me as a role model.
• The youth I worked with saw me as an adult they can trust.
• The youth I worked with came to me for help when they had problems in their lives.
• Youth learned life skills or developed attributes through this program.
The similarities in these questions across the youth and coach surveys offer an opportunity to
assess how closely the experiences of the coaches and the program participants align. Table 2
presents the ratings by the youth for each of the four survey items on the coach endline
surveys. In general, the coaches indicated a high level of agreement with these statements, so
we focus this examination on the average ratings by the youth when their coaches indicated
either “agree” or “strongly agree” for each of the four statements. There is alignment between
the impressions of the coaches and the perceptions expressed by the youth.

National Evaluation of Up2Us Coach, 2016-17 Program Year
AMERICAN INSTITUTES FOR RESEARCH | AIR.ORG 20
Table 2. Average Ratings by Youth of Coaches and Programs
Elementary School Youth Middle School and High School Youth
Do you ask your coach in this program
for help when you need it?
Do you trust your coach in
this program?
Does this program help
you be healthy?
Does this program help
you do better at school?
Is your coach someone you go to for help
or advice?
Do you trust your coach in
this program?
Is your coach a
good role model?
Will the things you learned at this program or from the coach help you in life?
Does this program
help you be healthy?
Does this program help
you do better at school?
Mean 3.79 4.30 4.01 3.90 3.89 4.27 4.38 4.27 4.25 3.98
N 879 875 876 871 1,063 1,056 1,050 1,052 1,056 1,063
As shown in each of the four sections in Table 3, if the coaches reported agreeing that they were a role model or someone the youth can
trust and ask for help, the youth with whom they were working provided high ratings about the coach and the program. Similarly, the
coaches who agreed that the youth they worked with were learning life skills or developing attributes because of participating in the
program have youth who rated the benefits of the program highly.
Table 3. Examination of Alignment Between Youth and Coach Assessments
The youth I worked with saw
me as a role model.
Elementary School Youth Middle School and High School Youth
Do you ask your coach
in this program for help when
you need it?
Do you trust your coach
in this program?
Does this program
help you be healthy?
Does this program
help you do better at school?
Is your coach someone
you go to for help or advice?
Do you trust your coach
in this program?
Is your coach a
good role model?
Will the things you learned at this program or from the coach help you in life?
Does this program
help you be healthy?
Does this program
help you do better at school?
Agree Mean 3.75 4.23 4.10 3.89 3.85 4.28 4.38 4.26 4.23 3.97
N 374 373 372 372 476 471 468 468 475 475
Strongly
Agree
Mean 4.22 4.50 4.27 4.03 3.67 4.02 4.20 4.09 4.10 3.77
N 129 127 128 126 330 329 329 329 328 332

National Evaluation of Up2Us Coach, 2016-17 Program Year
AMERICAN INSTITUTES FOR RESEARCH | AIR.ORG 21
The youth I
worked with saw
me as an adult
they can trust.
Elementary School Youth Middle School and High School Youth
Do you ask
your coach in
this program
for help when
you need it?
Do you
trust your
coach in
this
program?
Does this
program
help you be
healthy?
Does this
program
help you do
better at
school?
Is your coach in
this program
someone you
go to for help
or advice?
Do you
trust your
coach in
this
program?
Is your
coach a
good role
model?
Will the things
you learned at
this program or
from the coach
help you in life?
Does this
program
help you
be
healthy?
Does this
program
help you do
better at
school?
Agree Mean 3.74 4.19 4.07 3.85 3.76 4.21 4.36 4.23 4.19 3.97
N 344 343 342 342 318 316 312 312 318 317
Strongly
Agree
Mean 4.15 4.54 4.32 4.09 3.79 4.15 4.27 4.16 4.18 3.84
N 159 157 158 156 488 484 485 485 485 490
The youth I worked with
came to me for help when they had problems in
their lives.
Elementary School Youth Middle School and High School Youth
Do you ask your coach in this program
for help when you need it?
Do you trust your coach in
this program?
Does this program
help you be healthy?
Does this program help you do better at school?
Is your coach in this program someone you go to for help
or advice?
Do you trust your coach in
this program?
Is your coach a
good role model?
Will the things you learned at this program or from the coach help you in life?
Does this program help you
be healthy?
Does this program help you do better at school?
Agree Mean 3.76 4.19 4.08 3.85 3.90 4.29 4.41 4.31 4.30 4.09
N 330 329 328 328 340 339 333 334 340 339
Strongly
Agree
Mean 4.18 4.49 4.27 4.05 3.60 3.97 4.16 4.03 4.03 3.66
N 125 123 124 122 303 301 303 303 301 305

National Evaluation of Up2Us Coach, 2016-17 Program Year
AMERICAN INSTITUTES FOR RESEARCH | AIR.ORG 22
Youth learned life skills or developed attributes
through this program.
Elementary School Youth Middle School and High School Youth
Do you ask your coach in this
program for help when you need
it?
Do you trust your coach in
this program?
Does this program help you
be healthy?
Does this program help you do better at school?
Is your coach in this program someone you go to for help
or advice?
Do you trust your coach in
this program?
Is your coach a
good role model?
Will the things you learned at this program or from the coach help you in life?
Does this program help you
be healthy?
Does this program help you do better at school?
Agree Mean 3.77 4.23 4.09 3.88 3.79 4.25 4.39 4.25 4.23 3.98
N 328 328 327 326 336 334 330 330 336 335
Strongly
Agree
Mean 4.07 4.45 4.27 4.04 3.76 4.11 4.24 4.15 4.14 3.83
N 168 165 166 165 466 462 463 463 463 468

National Evaluation of Up2Us Coach, 2016-17 Program Year
AMERICAN INSTITUTES FOR RESEARCH | AIR.ORG 23
The alignment between the youth and coaches is particularly noteworthy for the elementary
school youth. When asked about their perceptions regarding the coach and the program, the
younger children in the evaluation (those in Grades 3–5) offered assessments very similar to
those of their older peers (see Table 2). When we examined those same ratings within
categories of ratings by their coaches, consistently higher average ratings were seen when
coaches offered the strongest assessments (i.e., when the coach strongly agreed). For example,
in response to the question about whether they trusted their coach, the average rating among
the elementary school youth was 4.30. If the coach reported strongly agreeing that the youth
saw him or her as an adult they can trust, then the average rating by the youth increased to
4.54. Similarly, when asked if they would ask their coach for help if they needed assistance, the
average rating among the elementary school youth was 3.79. If their coach strongly agreed that
the youth they worked with came to them for help with personal problems, then the average
rating by those youth increased to 4.18.
In the youth focus groups, several key themes were highlighted. The youth emphasized what
they learned about exercise and fitness, including the positive feelings they had about pushing
themselves in practice and the benefits they felt in terms of their physical health and fitness.
They also gave examples of how the coaches emphasized the fundamentals of the sport(s)
during their practices. In addition, the youth talked about being part of a team and learning to
get along with different kinds of youth who are on the same team. They gave examples of how
the coaches work with individual youth who struggle initially to fit in with the team culture.
Also, in the focus groups, many youth reported that the coaches emphasized how important
school is and sometimes even tied participation in the group activities to doing well at school
(i.e., if the youth were getting in trouble at school, they may not be able to participate in the
group activities during practices). According to the youth in the focus groups, they appreciated
how much fun practices were and how their coaches were not like the coaches that they have
had poor experiences with previously. Finally, the youth reported that they could talk to their
coach about personal matters, which included dealing with stress and interpersonal conflicts at
school, coping with issues at home, and finding alternative strategies for handling anger.
During the focus groups, the youth were asked to describe what a great coach looks like and
then to reflect on how their own coaches were examples of great coaches. The most common
responses pointed to the following ways in which the UC coaches fit this profile:
• The coach makes youth feel good, makes youth feel happy.
• The coach makes participants feel important or special.

National Evaluation of Up2Us Coach, 2016-17 Program Year
AMERICAN INSTITUTES FOR RESEARCH | AIR.ORG 24
• The coach knows what to say to motivate the youth.
• The coach is respectful.
• The coach raises his or her voice only when needed—such as when the group isn’t paying
attention or to be heard when there are too many people—and does not just yell as the
normal way of communicating with the youth in the group.
• The coach has one-on-one conversations with the participants.
• The coach talks to youth when they are having a personal issue and helps with problems
outside sports.
• The coach is helpful.
• The coach shows the participants how to improve.
• The coach is consistent and steady.
• The coach is open-minded (i.e., not judgmental) and understanding.
• The coach encourages the participants when they are feeling down.
• The coach is funny, fun, and has a good sense of humor.
• The coach makes sure that schoolwork comes first and makes sure you get your schoolwork
done.
• The coach pushes the participants to their limits (i.e., pushes them to get better).
The participants appreciated that the coaches focused on all the players and did not show
favoritism to certain players. Participants also noted how much they liked having opportunities
to get to know and feel connected to the other participants. They also expressed appreciation
for the fact that there was no cost to participate in the program. Finally, the youth noted that
they experienced personal improvements because of participating in the UC programs. These
improvements included being in better physical shape and, in some cases, losing weight; doing
better in school; and learning how to be a better teammate and a better person. We look more
closely at ways the youth benefited from participation in Up2Us Sports in the next sections.
Did Up2Us Coach Result in Physical Fitness Improvements?
To address this question, we begin by evaluating the change from baseline to endline for the
fitness outcome. Results for all participants for whom PACER results were reported are
presented in Figure 2.

National Evaluation of Up2Us Coach, 2016-17 Program Year
AMERICAN INSTITUTES FOR RESEARCH | AIR.ORG 25
Figure 2. Mean PACER Scores at Baseline and Endline
For the youth participating in Up2Us Coach across all the UC sites, the average change in PACER
scores was significant from baseline to endline. From these initial results for the overall sample,
we then sought to understand under what conditions were changes in this fitness outcome
more likely. For instance, we wondered whether improvement was possible for any of the
participants anywhere along the continuum of their baseline PACER scores. We ranked youth
based on their PACER scores at baseline. Then we examined the mean improvement from
baseline to endline within each of four quartiles into which the baseline ranks were sorted.
Consider the results in Figure 3. When we ranked the cases into four roughly equal groups
(quartiles), we found a clear pattern—the average improvement was greatest for the group
ranked in the lowest quartile at baseline. As the baseline ranking increased, the average
improvement declined.
Figure 3. Mean Change in PACER Score by Baseline PACER Rank

National Evaluation of Up2Us Coach, 2016-17 Program Year
AMERICAN INSTITUTES FOR RESEARCH | AIR.ORG 26
Those youth ranking in the lowest 25% on their baseline PACER scores averaged an increase of
4.61 in their score at endline. Those youth in the second-lowest quartile averaged an increase
of 2.50 in their endline score. Those youth in the second-highest quartile averaged an increase
of 1.06 in their endline PACER score. Finally, those youth in the highest 25% on their baseline
PACER scores, as a group, averaged a decrease of 3.21 in their endline score. The differences in
average improvement between the four quartiles were statistically significant, except for the
difference between the second and third quartiles.
Because all youth in this analysis were participating in UC, we want to be able to determine if
the changes we observed were due to the programming that the youth experienced. This
determination is best accomplished with a control group or comparison group. The enrollment
process for UC participants did not lend itself to random assignment of youth to UC or a non-UC
alternative, so Up2Us Sports recruited comparison sites in Washington, D.C., and New Orleans.
We examined whether there were significant differences in the fitness outcome between the
UC intervention sites and the comparison sites. Figure 4 shows PACER results for UC and
comparison sites.
Figure 4. Mean PACER Scores for the Intervention and Comparison Sites
At baseline, and again at endline, the participants in UC had substantially (and statistically
significantly) higher PACER scores than those in the comparison group. This result reflects the

National Evaluation of Up2Us Coach, 2016-17 Program Year
AMERICAN INSTITUTES FOR RESEARCH | AIR.ORG 27
comparability of the participants in the comparison sites. Even though the PACER scores were
much higher at baseline for the UC group, we found that over the course of the year there were
significant improvements for each group—that is, the change from baseline to endline was
statistically significant not only for the UC group but also for the comparison group. Although
each group experienced a significant improvement from baseline to endline, and although that
change was greater for the UC group, there was not a statistically significant difference in the
magnitude of the change between the comparison group and the UC group (see Figure 5).
Figure 5. Mean Change in PACER Scores From Baseline to Endline
Given that we found that youth in sports-based programs improved in their fitness over the
course of the program, we wondered if those improvements were tied to standardized age-
appropriate fitness markers. In Figure 6 we show how the youth in each group scored relative
to the Healthy Fitness Zone (HFZ) standards. In this figure, the darkest blue section of each bar
(the bottom portion) represents the proportion of that group that did not meet the HFZ
standards. Those in the lighter blue section of the bar had scores in the “healthy” range based
on their age and gender. Those in the top light blue section exceeded the HFZ standards.
The movement of the youth from baseline to endline differed between the UC and the
comparison groups. We found that in the UC group, a significant percentage of youth moved
from below the standards to meeting the standards, and a smaller percentage moved from
meeting the standards to exceeding the standards over the course of the program. This was not
the case for the comparison group, which showed very little change in the proportion of youth
who met the HFZ standards. These differences between the UC group and the comparison
group were statistically significant.

National Evaluation of Up2Us Coach, 2016-17 Program Year
AMERICAN INSTITUTES FOR RESEARCH | AIR.ORG 28
Figure 6. Breakdown of Cases by Healthy Fitness Zone Standards
How UC Program Characteristics Related to Fitness Outcomes
The next part of the analysis examined the aspects of the implementation of UC that were
related to improvements in fitness outcomes. To do this, we examined the distribution of the
coach skills for all the UC program groups. Consider self-awareness on the part of the coaches.
The distribution of scores, based on the endline surveys completed by the coaches, is shown in
Figure 7.

National Evaluation of Up2Us Coach, 2016-17 Program Year
AMERICAN INSTITUTES FOR RESEARCH | AIR.ORG 29
Figure 7. Distribution of Scores on Coach Self-Awareness
Based on this distribution, we categorized the coaches as low (if they are in the rectangle on
the left side), medium (the rectangle to the right), or high (if they are in the group represented
by the bar at the far right of the distribution. Then we examined how the youth working with
these coaches did in terms of each youth outcome. Regarding the fitness outcome, we looked
at how youth did over the course of the program in terms of changes in PACER scores. As
shown in Figure 8, we found that as coach self-awareness increased, there were stronger
improvements in youth fitness outcomes from baseline to endline. The differences between the
coaches with low self-awareness and those with high self-awareness were statistically
significant. The differences between those coaches with medium self-awareness and those with
high self-awareness were also statistically significant.
In Figure 9, we present the mean change in PACER scores at the various levels on each of the
other coach HIAs. We followed a similar process for examining the distribution across all the
coaches (as shown in Figure 7) and for ranking coaches into three categories that we label as
low, medium, and high. We found that, in general, fitness results for youth tended to increase
as the coaches for their group were ranked from low to medium and/or high on each of the
HIAs. This result suggests that youth may experience better fitness outcomes when

National Evaluation of Up2Us Coach, 2016-17 Program Year
AMERICAN INSTITUTES FOR RESEARCH | AIR.ORG 30
participating in groups in which coaches are more skilled. In addition, as we see in Figure 10,
better fitness results were found for those youth participating in groups in which the coaches
rated themselves higher in their ability to build a team culture and in which coaches indicated
feeling that they were making a difference for the youth they were working with.
Figure 8. Mean Change in PACER Score by Coach Self-Awareness a, c
Note. a The difference between low and medium is statistically significant. c The difference between low and high is statistically significant.
Figure 9. Mean Change in PACER Score by Coach HIAs

National Evaluation of Up2Us Coach, 2016-17 Program Year
AMERICAN INSTITUTES FOR RESEARCH | AIR.ORG 31
Note. a The difference between low and medium is statistically significant. b The difference between medium and high is statistically significant. c The difference between low and high is statistically significant.

National Evaluation of Up2Us Coach, 2016-17 Program Year
AMERICAN INSTITUTES FOR RESEARCH | AIR.ORG 32
Figure 10. Mean Change in PACER Score by Coach Skills
Note. a The difference between low and medium is statistically significant. c The difference between low and high is statistically significant.
Findings From Focus Groups Regarding Fitness
In the focus groups, youth were asked if they felt that there were fitness benefits to
participation in the program. Youth reported a range of benefits and appreciation for what they
got out of taking part in UC. Some of the youth reported that they were attracted to the
program in the first place because of their interest in fitness goals. Youth could point to the
physical benefits of the program activities, and there appeared to be a connection to their
ongoing motivation to continue in the program. As one youth noted, “When I first started I
couldn’t keep up. I was a little fatter and everything. But once I got here I lost some weight and
I feel like I’m playing better. That’s what motivates me and helps me stay.”
The youth also appeared to understand the long-term benefits of the exercise that is part of UC,
and some of the youth pointed to their own fitness goals and the ways that their participation
in UC helped them to achieve those goals. Youth could even see generally how the physical
activity may have benefits that go beyond just the physical. One youth noted:

National Evaluation of Up2Us Coach, 2016-17 Program Year
AMERICAN INSTITUTES FOR RESEARCH | AIR.ORG 33
So when I first came to the baseball academy I was really new and I didn’t know
anyone and I was really scared. . . . I wanted to start playing some games and
starting meeting new people, so I was really excited and started coming more
often and every single day. . . . I just want to come and see the coaches and see
people playing around and having fun and join some games. ’Cause if I stay at
home by myself watching TV and talking to my mom, I will probably just be sad
and end up bored.
The coaches in the focus groups also recognized that the first step was to get the youth to come
out and be physically active and then from that involvement the youth would experience a
range of benefits. Coaches talked about addressing social concerns with sports-based youth
development. As one coach noted, “This is the first generation to ever live 10 years less than
their parents. So being healthier isn’t that hard. Just go outside and play instead of being on the
computer or watching TV for four to six hours per day—just go outside and that’s what we’re
showing them in class. They just have to come to gym class . . . run around, have fun, and get a
workout.” Another coach remarked, “Sports-based youth development is supposed to be
learning life skills from this. It definitely picks up the kids, at least a few of the kids, who
otherwise would not do sports and would otherwise be at home playing video games all day.”
Does Up2Us Coach Result in Improvements in HIAs?
The second research question explored the extent to which working with a UC coach at a host
site increased the development of attributes that contribute to healthy decision making. In this
section of the report, we present findings on each of the HIAs. Because there are differences in
the measurement of those attributes across the surveys for the core sample—those in middle
school and high school—and the elementary school sample, we organize this section into two
segments. We begin with the results for the core sample.
To determine if there was an increase in the development of attributes contributing to healthy
decision making, we looked at whether there was a change in the measures for each attribute
from baseline to endline. We note, however, that for many of the baseline measures, the
average scores were high. This finding suggests that ceiling effects might create complications
for detecting improvements across the program year. Ceiling effects may result when there are
measures, like those from the baseline and endline surveys, for which the youth respond at the
highest level on the baseline instrument. In those cases, it was not possible to detect
improvements using the measures being used for this study. To further explore whether ceiling

National Evaluation of Up2Us Coach, 2016-17 Program Year
AMERICAN INSTITUTES FOR RESEARCH | AIR.ORG 34
effects were a concern for this analysis, we ranked youth based on their responses for the
baseline measures for each scale. Then we examined the improvement from baseline to endline
within each of four quartiles into which the baseline ranks were sorted.
Consider the results in Figure 11. These charts indicate the percentage of cases at each level of
baseline ratings for which the endline ratings were either equal to or greater than the baseline
ratings. The results are presented for each of the four quartiles—Q1 is the lowest quartile and
includes those cases in the bottom 25% when ranked on the baseline level for each HIA, and Q4
is the highest quartile and includes those cases in the top 25% when ranked on baseline levels.
When we ranked the cases into four roughly equal groups (i.e., quartiles), we found a clear
pattern—the percentage of cases showing improvement was greatest for the group ranked in
the lowest quartile at baseline. As the baseline ranking increased, the percentage showing
improvement declined. For each of the eight HIAs, we found similar results. Within the first
quartile, 75% or more of the youth reported improvement. The percentage of cases reporting
improved scores at endline declined in each subsequent quartile, with only 33% to 40% of the
cases in the highest quartile showing improvement. For each of the HIA scales, we found a
statistically significant relationship between the ranking at baseline and the percentage
showing improvement at endline.
Figure 11. Percentage Reporting Improvement or No Change From Baseline to Endline by
Baseline Ranking

National Evaluation of Up2Us Coach, 2016-17 Program Year
AMERICAN INSTITUTES FOR RESEARCH | AIR.ORG 35
Note. * indicates that for that scale, there is a statistically significant association between baseline level and
percentage showing improvement at endline.
The consistency of these patterns of results underscores that youth could benefit from
participating in UC, regardless of how they rated themselves on the HIAs at baseline. That said,
it is also evident that the potential ceiling effects must be taken into consideration when
planning for analyses on the HIA outcomes. As a result, we conducted a series of analyses for
which we restricted the sample to those cases in the first three quartiles on the related baseline
measure.5 Later in the report, we present results from multivariate regression analyses that
include all cases and control statistically for baseline level.
The first step in the analysis was to examine whether there was an overall improvement from
baseline to endline on each of the HIAs. These results are presented in Figure 12. We found that
across all the program sites, the youth in the core sample experienced significant improvement
during the program period on all eight scales. Overall, the youth participating in UC showed
improvements in those attributes that contribute to healthy decision making.
All the youth in this analysis were participating in UC, and we wanted to determine whether the
changes we observed were due to the programming that the youth experienced. We took two
different approaches to achieve this objective. First, we conducted comparative analyses
5 For example, when examining change on self-awareness, we limited the sample to those cases that were ranked in the first three quartiles on the baseline measures of self-awareness. Similarly, for the analyses of change on positive identity, the sample for those analyses was limited to those cases ranked in the first three quartiles on positive identity. And so on.

National Evaluation of Up2Us Coach, 2016-17 Program Year
AMERICAN INSTITUTES FOR RESEARCH | AIR.ORG 36
examining whether those in UC experienced better outcomes than did youth in the comparison
group. Second, we tested whether youth outcomes were related to aspects of the
implementation of the program, as proposed in the theory of change.
Figure 12. Mean Improvement From Baseline to Endline on High-Impact Attributes for Core
Sample
Note. * indicates that for that scale, there is a statistically significant improvement from baseline to endline (p <
.05).

National Evaluation of Up2Us Coach, 2016-17 Program Year
AMERICAN INSTITUTES FOR RESEARCH | AIR.ORG 37
We turn next to whether there were differences in outcomes between those participating in UC
and those in the comparison group. As noted earlier, there were differences between the UC
and comparison groups at baseline across many of the outcomes. This result raised questions
about the appropriateness of the comparison group to serve as a meaningful benchmark by
which to judge the outcomes for the youth participating in the intervention. To address this
issue, we selected a matched comparison group from the overall comparison group. The basis
for matching involved a composite measure of the baseline scores on each of the HIAs. This
composite measure was constructed using factor analysis, and cases in the comparison group
were matched to cases from the UC sample using propensity score matching.
Results from these analyses are presented in Figure 13. As shown in the figure, we found only
one significant difference between the UC participants and the comparison group youth. The
youth participating in UC programming showed a significantly greater improvement from
baseline to endline on well-being. On each of the other seven HIAs, the two groups experienced
similar levels of improvement from baseline to endline. This finding provides limited evidence
that UC may offer a better approach to the development of attributes related to healthy
decision making.
Figure 13. Mean Improvement From Baseline to Endline on High-Impact Attributes for UC
Core Sample and Matched Comparison Group

National Evaluation of Up2Us Coach, 2016-17 Program Year
AMERICAN INSTITUTES FOR RESEARCH | AIR.ORG 38
Note. * indicates that for that scale, there was a statistically significant difference in the improvement from
baseline to endline between the UC and comparison groups (p < .05).
Youth participating in UC experienced significant improvement for each of the HIAs during the
program year. A comparison group of youth from non-UC sports-based youth programs was
also found to experience improvements of similar magnitude on many of the HIAs. To further
understand under what circumstances we are more likely to find gains in the HIAs for UC
participants, we next examined several factors, based on the theory of change, that may
provide such clarification.
Findings for Core Sample HIAs
To this end, for each of the eight HIAs for the core sample (those in middle school and high
school), we broke out the analyses for 13 different factors and examined the change from
baseline to endline for each of the HIAs. The results are presented in a series of charts that
reflect analyses by subgroup. The results for each HIA are shown in a figure with five panels.
Each factor is shown with two or three bars. In the first panel, three variables are examined: the
gender of the youth, whether the youth was in middle school or high school, and youth
race/ethnicity. There are two bars for the different categories of gender: female and male.
There are two bars for the grade level in school: middle school and high school.6 There are
three bars for race/ethnicity: African American, Hispanic, and Caucasian.
6 For purposes of the analyses in this evaluation, middle school youth are those in Grades 6–8, and high school youth are those in Grades 9–12.

National Evaluation of Up2Us Coach, 2016-17 Program Year
AMERICAN INSTITUTES FOR RESEARCH | AIR.ORG 39
In the second panel, there are 3 two-category variables: whether the programming took place
in school or after school; whether the youth were brand new to the program or not; and
whether at baseline the youth had been in the program for less than 1 year or more than 1
year. The third panel also presents 3 two-category variables: whether the UC coaches in the
group were all new to the program or whether at least one UC coach was repeating; whether at
least one of the UC coaches was full-time or not; and whether one of the UC coaches was from
the community in which the programming was offered or not. Three more two-category factors
are examined in the fourth panel: whether only one coach was working with the group or
whether three or more coaches were working with the group;7 whether any of the UC coaches
in the group were acting as the head coach or not; and whether the level of contact with the
host-site supervisor was low or high.
Finally, in the fifth panel we consider a three-category factor: the gender breakdown of the
coaches. Groups are categorized by whether all the coaches are male, all are female, or there is
a mixture of male and female coaches. In thinking about why there may be different effects
found for youth based on the gender of the coaches for their group, we wondered if the impact
might differ by the gender of the youth. To that end, in panel five, we consider the results for
boys only on the left side of the panel and for girls only on the right side of the panel.
In these charts, the height of each bar corresponds to the average change for that HIA from
baseline to endline. The bars extend either above or below a horizontal line that represents no
change over the program period. A positive change—indicating an increase in the HIA from
start to end—is reflected in a bar that rises above the horizontal line. A negative change—
meaning that the score at endline has decreased from the baseline score—is shown by a bar
that extends downward below the horizontal line. The average change for that subgroup is
shown in a label at the top of the bar. If the difference between the average changes for the
categories of the subgroups is statistically significant, then the bars have a striped pattern fill. If
the difference between the average changes for the categories is not statistically significant,
then the bars have a solid fill. Note that for two of the variables—race/ethnicity and gender
breakdown of coaches—the bars are filled with a striped pattern only if that category is
significantly different from the reference category. In the case of race/ethnicity, the reference
7 In preliminary analyses, we found that the key difference was generally between the youth who participated in groups with only one coach and those in groups with three or more coaches. The youth in groups with exactly two coaches were sometimes more like the youth with only one coach and sometimes more like the youth with three or more coaches. As a result, we focus in this section on the differences between the groups at the two extreme levels on this factor.

National Evaluation of Up2Us Coach, 2016-17 Program Year
AMERICAN INSTITUTES FOR RESEARCH | AIR.ORG 40
category is all other races/ethnicities.8 In the case of the gender breakdown of the coaches, the
reference category is the “mixed gender” group.9
As noted earlier in the report, some of the youth score at the highest level on an HIA at
baseline, which means that it is not possible to show improvement over the period of the
program. To avoid confounding the overall results, for this section of the analyses, we consider
only those youth in the first three quartiles (i.e., about 75%) based on their baseline scores.
Self-Awareness
For the sample of youth participating in UC for which we had data on improvement from
baseline to endline on self-awareness, the average change was 0.26.10 The charts shown in
Figure 14 point to subgroups that experienced greater than average improvements in self-
awareness. These subgroups include males, those in high school, Caucasian youth, those
participating in afterschool programs, those in the program more than 1 year, and boys in
groups with male coaches.
Boys reported a significantly greater change in self-awareness from baseline to endline than did
girls. In addition, those youth in high school show significantly greater improvements than do
those in middle school. There were no significant differences in the amount of improvement
during the program year between the subgroups based on race or ethnicity. The subgroup with
the greatest average improvement on self-awareness was the participants in the afterschool
programs, and they experienced significantly greater improvement than those participating
during the school day.
Length of time in the program seemed to matter in terms of improvements in self-awareness
for the participants in middle school and high school. Fifty-three percent of the participants
were brand new to the program. As a group, they reported significantly smaller improvements
than participants who had been with the program before the current program year. About 34%
of the youth in the sample had been with the program for more than 1 year, and as a group,
8 This means that the result for African American youth is tested against all other racial/ethnic groups. Similarly, the results for Hispanic youth and Caucasian youth are tested against all other groups. 9 In the fifth panel, we are presenting results from the tests comparing those in groups with only female coaches to those in groups with a mixture of male and female coaches, as well as tests comparing those in groups with only male coaches to those in groups with a mixture of male and female coaches. To avoid confusion in the presentation of the results, we indicated the significant differences on the bar for female coaches only (if significantly different than groups with a mixture of male and female coaches) or on the bar for male coaches only (if significantly different than groups with a mixture of male and female coaches). The bar for the group with a mixture of male and female coaches will, thus, always display a solid fill. 10 This average change reflects an increase from baseline to endline on the mean score for self-awareness, which ranges from 1-5.

National Evaluation of Up2Us Coach, 2016-17 Program Year
AMERICAN INSTITUTES FOR RESEARCH | AIR.ORG 41
they reported significantly greater improvements on self-awareness than those participants
with the program for less than 1 year.
We considered several different factors pertaining to the structure of the coaching experience
(see panels 3–4). Most of these variables did not point to significant improvements in self-
awareness among the participants. There were two exceptions. In groups in which none of the
UC coaches were full-time, there were significantly larger improvements in self-awareness,
compared with those groups in which there was at least one full-time UC coach. Also, if the
group had only one coach, the reported improvements in self-awareness were significantly
greater than for those in groups with three or more coaches.
The final panel examines the intersection between the gender of the coaches and the gender of
the youth. As a group, boys report larger improvements in self-awareness during the program
than do girls. When limiting the analysis to only boys, we found that they experienced
significantly smaller improvements if they were participating in groups in which all the coaches
were female. When we focused only on girls, we found that they experienced significantly
greater improvements in self-awareness when working with only male coaches compared to
working with a mixture of male and female coaches.
Figure 14. Results From Subgroup Analyses for Core Group on Self-Awareness

National Evaluation of Up2Us Coach, 2016-17 Program Year
AMERICAN INSTITUTES FOR RESEARCH | AIR.ORG 42

National Evaluation of Up2Us Coach, 2016-17 Program Year
AMERICAN INSTITUTES FOR RESEARCH | AIR.ORG 43
Positive Identity
For the sample of youth participating in UC for which we had data on improvement from
baseline to endline on positive identity, the average change was 0.24. The charts shown in
Figure 15 point to subgroups that experienced greater than average improvements in positive
identity. These subgroups include those in high school and boys in groups with only male
coaches. For several of the subgroups, we found substantial and statistically significant
improvements from baseline to endline. For instance, those youth in high school showed
significantly greater improvements than those in middle school.
In the second panel, we found that where the program took place and how long the participants
were in the program made a significant difference in growth on positive identity. Greater levels of
improvement were found for those participating in afterschool programs compared with those in
in-school programs. Greater levels of improvement were found for youth who are not brand new
to the program and for those in the program for more than 1 year.
As was true for scores on self-awareness, only some of the program group structures were
related to significant improvements in positive identity. We found significantly better
improvements for youth in groups in which there was at least one repeating coach and in groups
with only a single coach. Higher levels of contact with the host-site supervisor were also related
to significant improvements in positive identity. Another noteworthy result from the subgroup
analyses is shown for the intersection of the gender of the youth and the gender of the coaches.
Significantly greater improvements in positive identity scores were evident when girls were in the
groups in which all the coaches were either exclusively female or exclusively male, compared to
groups with a mixture of male and female coaches. In addition, boys in groups in which all the
coaches were male experienced significantly better improvements in positive identity.

National Evaluation of Up2Us Coach, 2016-17 Program Year
AMERICAN INSTITUTES FOR RESEARCH | AIR.ORG 44
Figure 15. Results From Subgroup Analyses for Core Group on Positive Identity

National Evaluation of Up2Us Coach, 2016-17 Program Year
AMERICAN INSTITUTES FOR RESEARCH | AIR.ORG 45
Situational Awareness
For the sample of youth participating in UC for which we had data on improvement from
baseline to endline on situational awareness, the average change was 0.15. The charts shown in
Figure 16 point to subgroups that experienced greater than average improvements in
situational awareness. These subgroups include those in high school, Caucasian youth, those in
afterschool programs, those in the program more than 1 year, those in groups with at least one

National Evaluation of Up2Us Coach, 2016-17 Program Year
AMERICAN INSTITUTES FOR RESEARCH | AIR.ORG 46
repeating coach, those in groups with coaches who came from communities different from
those in which the programs were operating, and boys and girls in groups with male coaches.
Those in high school reported a significantly greater change in situational awareness from
baseline to endline than did those in middle school. Similarly, those participating in afterschool
programs exhibited significantly better improvements in situational awareness than did those
taking part during the school day. The type of program group structure appeared to be important
in two ways. There were significantly greater increases in the situational awareness scores when
at least one of the coaches was a repeat coach and when none of the coaches were from the
same community in which the program was operating. Finally, boys experienced significantly
better improvements in situational awareness when at least one of the coaches was male.
Figure 16. Results From Subgroup Analyses for Core Group on Situational Awareness

National Evaluation of Up2Us Coach, 2016-17 Program Year
AMERICAN INSTITUTES FOR RESEARCH | AIR.ORG 47

National Evaluation of Up2Us Coach, 2016-17 Program Year
AMERICAN INSTITUTES FOR RESEARCH | AIR.ORG 48
Future Focus and Plan B Thinking
For the sample of youth participating in UC for which we had data on improvement from
baseline to endline on future focus and Plan B thinking, the average change was 0.16. The
charts shown in Figure 17 point to subgroups that experienced greater than average
improvements in future focus and Plan B thinking. These subgroups include those in high
school, Hispanic youth, those participating in afterschool programs, those who were not new to
the program, those in the program more than 1 year, those in groups with at least one
repeating coach, those in groups with only one coach, those in groups in which at least one UC
coach was the head coach, and boys and girls in groups in which all the coaches were men.
In considering the results shown in Figure 17, we found statistically significant differences in
future focus and Plan B thinking based on several factors. The subgroup with the greatest
average improvement in future focus and Plan B thinking was those participants in high school.
Those youth in high school showed significantly greater improvements than those in middle
school. There were also significantly better increases for those youth participating in
programming after school than for those participating during the school day.
Length of time in the program seemed to matter in terms of improvements in future focus and
Plan B thinking for the participants in middle school and high school. Participants who were brand
new to the program reported significantly smaller improvements than participants who had been
with the program before the current program year. And if the youth had been with the program
for more than 1 year, as a group they reported significantly greater improvements in future focus
and Plan B thinking than did those participants with the program for less than 1 year.
Two factors pertaining to the structure of the coaching experience were found to be associated
with significant differences in improvements in future focus and Plan B thinking among the

National Evaluation of Up2Us Coach, 2016-17 Program Year
AMERICAN INSTITUTES FOR RESEARCH | AIR.ORG 49
participants. In groups in which at least one of the UC coaches was repeating, there were
significantly larger improvements in future focus and Plan B thinking compared with those
groups in which all UC coaches were new. Also, if the group had only one coach, the reported
improvements in future focus and Plan B thinking were significantly greater than for those in
groups with three or more coaches.
When limiting the analysis to only boys, we found that these youth experienced significantly
larger improvements if they were participating in groups in which all the coaches were male
compared to those in groups with both male and female coaches. When we focused only on
girls, we found that they experienced significantly greater improvements in future focus and
Plan B thinking when working with either only female coaches or only male coaches, compared
to working with a mixture of male and female coaches.
Figure 17. Results From Subgroup Analyses for Core Group on Future Focus and Plan B
Thinking

National Evaluation of Up2Us Coach, 2016-17 Program Year
AMERICAN INSTITUTES FOR RESEARCH | AIR.ORG 50

National Evaluation of Up2Us Coach, 2016-17 Program Year
AMERICAN INSTITUTES FOR RESEARCH | AIR.ORG 51
Discipline
For the sample of youth participating in UC for which we have data on improvement from
baseline to endline on discipline, the average change was 0.20. The charts shown in Figure 18
point to subgroups that experienced greater than average improvements in discipline. These
subgroups include those in high school, those in afterschool programs, those participants who
were not new to the program, those in the program more than 1 year, those in groups with at
least one repeating coach, those in groups with only one coach, those in groups with only male
coaches, and girls in groups with only female coaches.
As we have seen for other HIAs, those in high school reported significantly better
improvements in discipline than those in middle school. Significantly greater changes in
discipline were found for those in afterschool programs than for those participating in
programs in school. We also found that improvements in discipline from baseline to endline
were significantly better when the youth were not brand new to the program and when they
had been in the program for more than 1 year.
Two factors pertaining to the structure of the coaching experience were found to be associated
with significant differences in improvements in discipline among the participants. In groups in
which at least one of the UC coaches was repeating, there were significantly larger
improvements in discipline compared with those groups in which all UC coaches were new.
Also, if the group had only one coach, the reported improvements in discipline were
significantly greater than for those in groups with three or more coaches.
The participants also showed significantly greater improvements on discipline when they were
in groups with coaches of only one gender. We found this to be true for boys in groups with

National Evaluation of Up2Us Coach, 2016-17 Program Year
AMERICAN INSTITUTES FOR RESEARCH | AIR.ORG 52
only male coaches. Significantly larger increases in improvements on discipline were also found
for girls in groups with only male or only female coaches.
Figure 18. Results From Subgroup Analyses for Core Group on Discipline

National Evaluation of Up2Us Coach, 2016-17 Program Year
AMERICAN INSTITUTES FOR RESEARCH | AIR.ORG 53
Social Confidence
For the sample of youth participating in UC for which we have data on improvement from
baseline to endline on social confidence, the average change was 0.25. This is among the largest

National Evaluation of Up2Us Coach, 2016-17 Program Year
AMERICAN INSTITUTES FOR RESEARCH | AIR.ORG 54
average improvements among the various HIAs. Among the eight HIAs, social confidence was also
the scale on which UC participants exhibited the lowest average baseline and endline scores.
The charts shown in Figure 19 point to subgroups that experienced greater than average
improvements in social confidence. These subgroups include those in high school, those who were
not new to the program, and those in the program more than 1 year. Although many youth
appeared to improve on social confidence from baseline to endline, there were only two significant
differences based on the various factors we examined in the subgroup analyses. Significantly
greater improvements in social confidence were found for those youth in high school. In addition,
those youth who were new to the program showed significantly less improvement on social
confidence than did their peers who were previously enrolled in the program.
Figure 19. Results From Subgroup Analyses for Core Group on Social Confidence

National Evaluation of Up2Us Coach, 2016-17 Program Year
AMERICAN INSTITUTES FOR RESEARCH | AIR.ORG 55

National Evaluation of Up2Us Coach, 2016-17 Program Year
AMERICAN INSTITUTES FOR RESEARCH | AIR.ORG 56
Pro-Social Connections
For the sample of youth participating in UC for which we had data on improvement from
baseline to endline on pro-social connections, the average change was 0.14. In contrast to the
results for social confidence, for this HIA we found lower levels of improvement for youth in
general but many statistically significant differences based on the subgroup analyses. The
charts shown in Figure 20 point to subgroups that experienced greater than average
improvements in pro-social connections. These subgroups include those in high school,
Caucasian youth, those in afterschool programs, those who were not new to the program,
those in the program more than 1 year, those in groups with at least one repeating coach,
those in groups with at least one full-time UC coach, and those in groups in which there was
high HSS contact. Better than average improvements in pro-social connections were also found
for boys and girls in groups with only male coaches.
Those in high school reported significantly better improvements in pro-social connections than
those in middle school. African American youth reported significantly lower improvements from
baseline to endline than other racial/ethnic groups. Significantly greater changes in pro-social
connections were found for those in afterschool programs than for those participating in
programs in school. We also found that improvements from baseline to endline were
significantly better when the youth were not brand new to the program and when they had
been in the program for more than 1 year.
Significantly greater improvements from baseline to endline on pro-social connections were
also found for youth in groups in which at least one of the UC coaches was repeating. Changes
were also significantly better for youth in programs in which the coach was not from the
community in which the program was based. Compared to groups with three or more UC

National Evaluation of Up2Us Coach, 2016-17 Program Year
AMERICAN INSTITUTES FOR RESEARCH | AIR.ORG 57
coaches, improvements for pro-social connections were shown to be significantly greater if
there was only one coach.
Finally, as has been shown with other HIAs, when girls were in groups in which all the coaches
were female, they reported significantly better improvements in pro-social connections than
did girls in groups with a mixture of male and female coaches. Girls and boys also reported
significantly greater improvements when they were in groups in which all the coaches were
male than if the coaches were a mixture of males and females.
Figure 20. Results From Subgroup Analyses for Core Group on Pro-Social Connections

National Evaluation of Up2Us Coach, 2016-17 Program Year
AMERICAN INSTITUTES FOR RESEARCH | AIR.ORG 58
Well-Being
For the sample of youth participating in UC for which we had data on improvement from
baseline to endline on well-being, the average change was 0.25. The charts shown in Figure 21
point to subgroups that experienced greater than average improvements in well-being. These

National Evaluation of Up2Us Coach, 2016-17 Program Year
AMERICAN INSTITUTES FOR RESEARCH | AIR.ORG 59
subgroups include those in high school, those in afterschool programs, those who were not new
to the program, those in the program more than 1 year, those in groups with only one coach,
those in groups with at least one repeating coach, those in groups in which the coaches were
not from the community, and those in groups in which there was high HSS contact. Better than
average improvements in well-being were also shown for boys in groups with any male coaches
and for girls in groups with only male coaches.
Those in high school reported significantly better improvements in well-being than those in
middle school. Similarly, participants in afterschool programs reported significantly greater
gains in well-being than those in in-school programs. We also found that improvements from
baseline to endline were significantly better when the youth were not brand new to the
program, as they were when youth had already been in the program for more than 1 year.
Finally, when boys participated in groups in which all the coaches were female, they reported
significantly smaller improvements in well-being than if they were in groups in which the
coaches were a mixture of men and women.
Figure 21. Results From Subgroup Analyses for Core Group on Well-Being

National Evaluation of Up2Us Coach, 2016-17 Program Year
AMERICAN INSTITUTES FOR RESEARCH | AIR.ORG 60

National Evaluation of Up2Us Coach, 2016-17 Program Year
AMERICAN INSTITUTES FOR RESEARCH | AIR.ORG 61
Subgroup Analyses Examining Differences Between UC Core Sample Participants
and Comparison Group Youth
Subgroup analyses provide clarification regarding the conditions under which UC participants
experienced significant improvements in the HIAs. We extended the subgroup analyses to
examine whether there were conditions under which the UC participants showed significantly
better improvements on any of the HIAs. We were limited in the subgroup analyses we could
conduct because we had information on the comparison group youth only for gender (Figure
22), grade level (Figure 23), and whether the programming took place during school or after
school (Figure 24).
For these next figures, the columns in the diagram represent the mean improvement from
baseline to endline in each of the HIAs. In Figure 22, the focus is on whether UC boys and girls
experienced significantly greater improvement than their peers of the same gender in the
comparison group. There were only a few significant differences between the UC and
comparison groups when controlling for gender. UC boys realized significantly greater
improvement in self-awareness and positive identity than the boys in the comparison group. UC
girls, though, were shown to have significantly lower improvement on both situational
awareness and future focus and Plan B thinking than the girls in the comparison group. These
differences are consistent with earlier results in which among all UC participants we found
some of the largest improvements from baseline to endline on self-awareness and positive
identity and that UC boys experienced significantly greater improvement over the course of the
program year on self-awareness than UC girls. Although the overall differences were not
significant between the UC and comparison groups on these four HIAs, the average
improvements were higher for UC participants on both self-awareness and positive identity and

National Evaluation of Up2Us Coach, 2016-17 Program Year
AMERICAN INSTITUTES FOR RESEARCH | AIR.ORG 62
higher for the comparison group on both situational awareness and future focus and Plan B
thinking.
Figure 22. Comparative Analyses for Core Group by Gender

National Evaluation of Up2Us Coach, 2016-17 Program Year
AMERICAN INSTITUTES FOR RESEARCH | AIR.ORG 63
Note. * indicates that for that scale, there was a statistically significant difference between the UC group and the
comparison group for that particular subgroup.
Results presented in Figure 23 are from analyses in which we examined differences between
the UC and comparison groups for the subgroups defined by grade level. For the purposes of
this analysis, those youth in Grades 6–8 are classified as being in middle school, and those
youth in Grades 9–12 are classified as being in high school. We found only a few significant
differences between the UC and comparison groups. When we limited the analyses to those
youth in high school, we found that UC participants experienced significantly greater
improvements in self-awareness, positive identity, and well-being than their counterparts in the
comparison group. In contrast, when the analysis was limited to only middle school youth, the
comparison group youth realized significantly greater improvements in future focus and Plan B
thinking than UC participants. Again, these results were consistent with earlier findings showing
that among UC participants, the high school youth consistently experienced significantly greater
improvements than middle school youth for each of these HIAs. Overall differences between
the UC and comparison group participants (recall Figure 13) may have forecasted such results
because the largest differences between the UC and comparison groups were for well-being, in
which the UC group was statistically significantly better, and future focus and Plan B thinking, in
which the comparison group reported larger improvements than the UC participants.

National Evaluation of Up2Us Coach, 2016-17 Program Year
AMERICAN INSTITUTES FOR RESEARCH | AIR.ORG 64
Figure 23. Comparative Analyses for Core Group by Grade Level
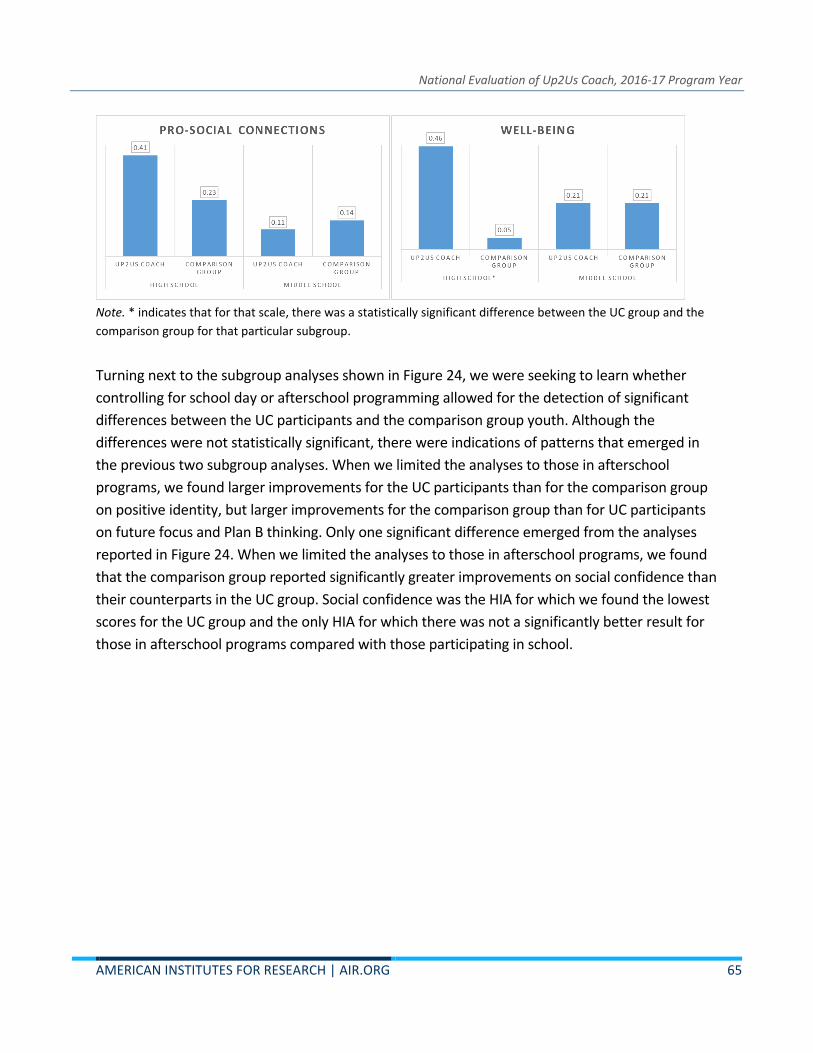
National Evaluation of Up2Us Coach, 2016-17 Program Year
AMERICAN INSTITUTES FOR RESEARCH | AIR.ORG 65
Note. * indicates that for that scale, there was a statistically significant difference between the UC group and the
comparison group for that particular subgroup.
Turning next to the subgroup analyses shown in Figure 24, we were seeking to learn whether
controlling for school day or afterschool programming allowed for the detection of significant
differences between the UC participants and the comparison group youth. Although the
differences were not statistically significant, there were indications of patterns that emerged in
the previous two subgroup analyses. When we limited the analyses to those in afterschool
programs, we found larger improvements for the UC participants than for the comparison group
on positive identity, but larger improvements for the comparison group than for UC participants
on future focus and Plan B thinking. Only one significant difference emerged from the analyses
reported in Figure 24. When we limited the analyses to those in afterschool programs, we found
that the comparison group reported significantly greater improvements on social confidence than
their counterparts in the UC group. Social confidence was the HIA for which we found the lowest
scores for the UC group and the only HIA for which there was not a significantly better result for
those in afterschool programs compared with those participating in school.

National Evaluation of Up2Us Coach, 2016-17 Program Year
AMERICAN INSTITUTES FOR RESEARCH | AIR.ORG 66
Figure 24. Comparative Analyses for Core Group for In-School Versus Afterschool
Programming

National Evaluation of Up2Us Coach, 2016-17 Program Year
AMERICAN INSTITUTES FOR RESEARCH | AIR.ORG 67
Note. * indicates that for that scale, there was a statistically significant difference between the UC group and the
comparison group for that particular subgroup.
Findings for Elementary Age Participants
So far, we have explored the changes in HIAs for youth in middle school and high school—the
core sample for this evaluation. We next examine changes in HIAs for youth in elementary
school. As we found for the core sample, the baseline scores for the elementary school youth
were often high. We ranked the youth based on their responses for the baseline measures for
each scale and then examined the improvement from baseline to endline within each of four
quartiles into which the baseline ranks were sorted. These results are presented in Figure 25.
Again, we found that as the baseline ranking increased, the percentage showing improvement
declined. For each of the five HIAs, we found similar results. Within the first quartile, 78% or
more of the youth reported improvement. The percentage of cases reporting improved scores
at endline declined in each subsequent quartile. For discipline we found the most dramatic
example of this pattern, with 83% in the first quartile showing improvement and only 37% of
those in the fourth quartile showing improvement. For each of the HIA scales, we found a

National Evaluation of Up2Us Coach, 2016-17 Program Year
AMERICAN INSTITUTES FOR RESEARCH | AIR.ORG 68
statistically significant relationship between the ranking at baseline and the percentage
showing improvement at endline.
Figure 25. Percentage Reporting Improvement or No Change From Baseline to Endline by
Baseline Ranking
Note. * indicates that for that scale, there was a statistically significant association between baseline level and
percentage showing improvement at endline.
The elementary school youth showed growth during the program year, regardless of where
they began at baseline. This finding was evident for each of the HIAs. As we did for the core
sample of youth participants, we took into consideration the potential ceiling effects by limiting
the sample to those cases in the first three quartiles on the related baseline measure for each
of the following analyses. We first looked at whether there was an overall improvement from
baseline to endline on each of the HIAs. These results are presented in Figure 26. We found that
across all the UC sites, the youth in the elementary sample experienced significant
improvement during the program period on all five HIAs. These results indicated that, overall,
the youth participating in UC showed improvements in those attributes contributing to healthy
decision making.

National Evaluation of Up2Us Coach, 2016-17 Program Year
AMERICAN INSTITUTES FOR RESEARCH | AIR.ORG 69
Figure 26. Mean Improvement (Baseline to Endline) on High-Impact Attributes, Elementary
Sample
Note. * indicates that for that scale, there was a statistically significant improvement from baseline to endline (p <
.05).
We next considered whether there were differences in outcomes between those participating
in UC and those in the matched comparison group. These results are presented in Figure 27.
We did not find any significant differences between the two groups on the HIAs. For four of the
HIAs, average improvement scores were higher for the UC group than for the comparison
group. The one exception to that pattern was found on positive identity.
Figure 27. Comparative Analysis for HIAs From Elementary Survey
Elementary school youth participating in UC groups realized significant gains on all the HIAs
during the program year. Yet the lack of significant differences between the UC participants and
a matched comparison group meant that we could not conclude that the UC programming is

National Evaluation of Up2Us Coach, 2016-17 Program Year
AMERICAN INSTITUTES FOR RESEARCH | AIR.ORG 70
the cause of growth of the participants in their HIAs. As we did for the core sample, we next
sought to examine under what circumstances we were more likely to find gains in the HIAs for
UC participants in elementary school. Thus, for each of the five HIAs for the elementary school
participants, we broke out the analyses for 12 different youth and group characteristics.
For these analyses, we examined the change from baseline to endline for each of the HIAs. The
results are presented in a series of charts that reflect analyses by subgroup. The results for each
HIA are shown in a figure with four panels. Each factor is shown with two or three bars. In the
first panel, three variables are examined: the gender of the youth, whether the programming
happened during school or after school, and the race/ethnicity of the youth. There are two bars
for the different categories of gender: female and male. There are two bars for whether the
programming took place in school or after school. There are three bars for race/ethnicity:
African American, Hispanic, and Caucasian.
In the second panel, we present three variables: whether the youth were brand new to the
program or not; whether the youth had been in the program for less than 1 year or more than 1
year; and whether the coaches in the group were all new to the program or whether at least
one coach was repeating. In the third panel, we present three additional variables: whether at
least one of the coaches was full-time or not; whether the coaches were from the community
where the programming was offered or not; and whether the number of coaches in the group
was only one or three or more. In the fourth panel, there are three variables: whether any of
the UC coaches were in the role of head coach; whether the level of contact with the host-site
supervisor was low or high; and the gender breakdown of the coaches.
A positive change—indicating an increase in the HIA from baseline to endline—is reflected in a
bar that rises above the horizontal line. A negative change—meaning that the score at endline
has decreased from the baseline score—is shown by a bar that extends downward below the
horizontal line. The average change for that subgroup is shown in a label at the top of the bar. If
the average change is significantly different between the categories of the subgroups, then the
bars have a striped pattern fill. Otherwise, the bars have a solid fill. As we did for the analyses
for the older youth, for this section of the analyses, we considered only those UC participants in
the first three quartiles (i.e., about 75%) based on their baseline scores.
Positive Identity
For the elementary sample of youth participating in UC for which we had data on improvement
from baseline to endline on positive identity, the average change was 0.18. The charts shown in
Figure 28 point to subgroups that experienced greater than average improvements in positive

National Evaluation of Up2Us Coach, 2016-17 Program Year
AMERICAN INSTITUTES FOR RESEARCH | AIR.ORG 71
identity. These subgroups include those in groups with three or more coaches, those in groups
in which there was low HSS contact, and those in groups with both male and female coaches.
We found significantly better improvements for youth in groups with three or more coaches
than in groups with only a single coach. Lower levels of contact with the host-site supervisor
were also related to significant improvements in positive identity. It is interesting to note that
these patterns are the direct opposite of what we found for these subgroup analyses for
positive identity among the middle and high school youth (see Figure 15). Significantly greater
improvements for positive identity scores were evident when elementary youth were in the
groups with a mixture of male and female coaches compared with groups in which all the
coaches were either exclusively female or exclusively male.
Figure 28. Results From Subgroup Analyses for Elementary Group on Positive Identity

National Evaluation of Up2Us Coach, 2016-17 Program Year
AMERICAN INSTITUTES FOR RESEARCH | AIR.ORG 72
Discipline
For the sample of youth participating in UC for which we had data on improvement from
baseline to endline on discipline, the average change was 0.16. The charts in Figure 29 show
subgroups that experienced greater than average improvements in discipline. These subgroups
include those in afterschool programs, Hispanic youth, those who were not brand new to the
program, those who had been in the program for more than 1 year, those in groups in which
the coaches are not from the same community as that in which the program was operating,
those in groups with no UC coaches in the role of head coach, and those in groups in which
there was low HSS contact. There was, however, only one statistically significant difference
found from these analyses. Significantly greater improvements for discipline were more likely
when elementary youth were not brand new to the program compared with those youth who
were brand new.
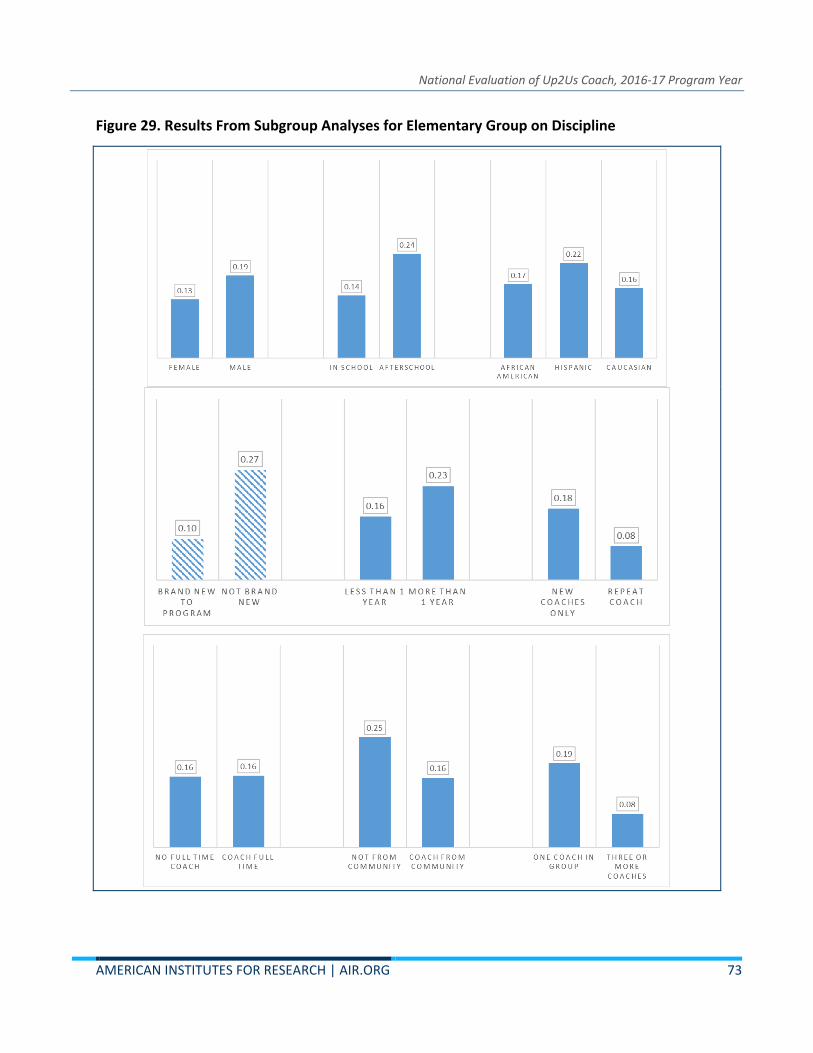
National Evaluation of Up2Us Coach, 2016-17 Program Year
AMERICAN INSTITUTES FOR RESEARCH | AIR.ORG 73
Figure 29. Results From Subgroup Analyses for Elementary Group on Discipline

National Evaluation of Up2Us Coach, 2016-17 Program Year
AMERICAN INSTITUTES FOR RESEARCH | AIR.ORG 74
Social Confidence
For the sample of youth participating in UC for which we had data on improvement from
baseline to endline on social confidence, the average change was 0.25. This improvement was
large compared to other HIAs, but as we found with the older youth, this was the HIA for which
the UC participants reported the lowest average baseline scores. Although many youth
appeared to improve on social confidence from baseline to endline, there were no significant
differences based on the various factors we examined in the subgroup analyses, as presented in
Figure 30.
Figure 30. Results From Subgroup Analyses for Elementary Group on Social Confidence
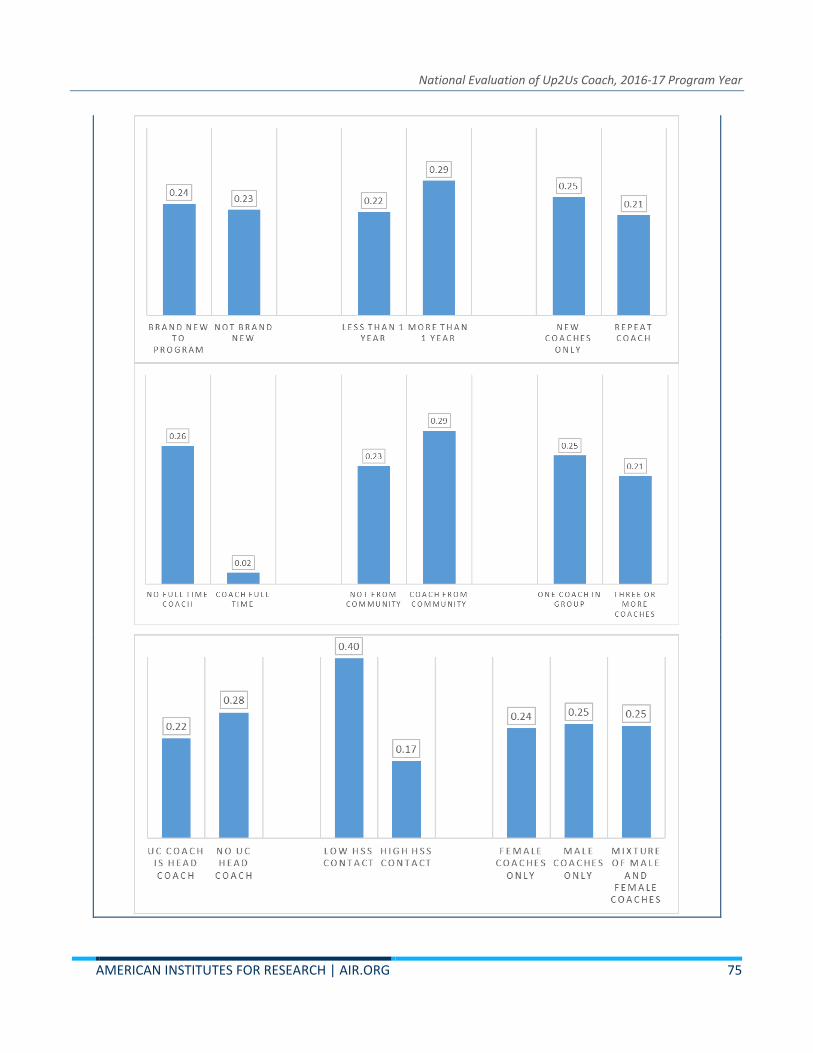
National Evaluation of Up2Us Coach, 2016-17 Program Year
AMERICAN INSTITUTES FOR RESEARCH | AIR.ORG 75

National Evaluation of Up2Us Coach, 2016-17 Program Year
AMERICAN INSTITUTES FOR RESEARCH | AIR.ORG 76
Pro-Social Connections
For the elementary sample of youth participating in UC for which we had data on improvement
from baseline to endline on pro-social connections, the average change was 0.17. In contrast to
the results for social confidence, for this HIA we found lower levels of improvement for youth in
general but several statistically significant improvements based on the subgroup analyses. The
charts shown in Figure 31 point to subgroups that experienced greater than average
improvements in pro-social connections. These subgroups include those participating in in-
school programs, Caucasian youth, those participants in groups with three or more coaches,
those in groups in which no UC coach is the head coach, those in groups in which there is less
HSS contact, and those in groups with a mixture of male and female coaches.
Elementary youth participating in UC programs in school reported greater improvements in
pro-social connections than their counterparts in afterschool programs. Hispanic youth
reported significantly smaller improvements from baseline to endline than youth in other
racial/ethnic groups. Significantly greater changes in pro-social connections were found for the
youth in groups in which none of the coaches were full-time, for youth in groups with three or
more coaches, and for youth in groups in which none of the UC coaches were in the role of
head coach. Finally, significantly greater improvements for pro-social connections were shown
for elementary youth in the groups with a mixture of male and female coaches compared with
groups in which all the coaches were either exclusively female or exclusively male.
Figure 31. Results From Subgroup Analyses for Elementary Group on Pro-Social Connections

National Evaluation of Up2Us Coach, 2016-17 Program Year
AMERICAN INSTITUTES FOR RESEARCH | AIR.ORG 77
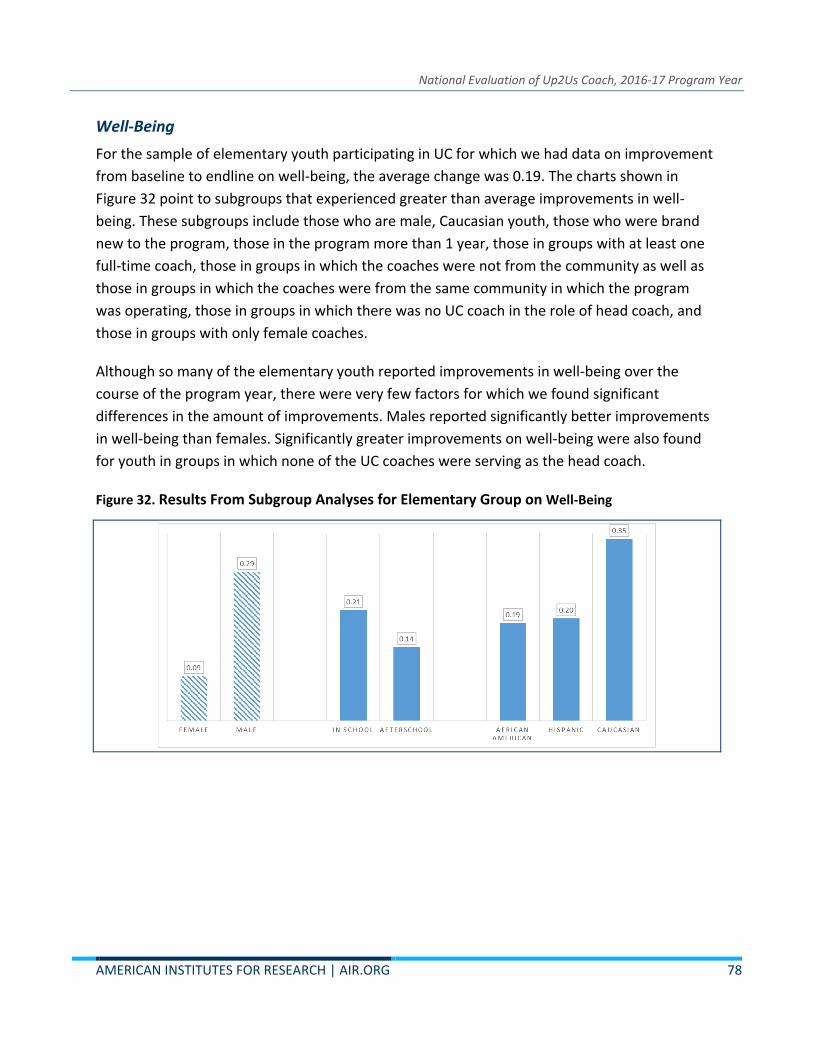
National Evaluation of Up2Us Coach, 2016-17 Program Year
AMERICAN INSTITUTES FOR RESEARCH | AIR.ORG 78
Well-Being
For the sample of elementary youth participating in UC for which we had data on improvement
from baseline to endline on well-being, the average change was 0.19. The charts shown in
Figure 32 point to subgroups that experienced greater than average improvements in well-
being. These subgroups include those who are male, Caucasian youth, those who were brand
new to the program, those in the program more than 1 year, those in groups with at least one
full-time coach, those in groups in which the coaches were not from the community as well as
those in groups in which the coaches were from the same community in which the program
was operating, those in groups in which there was no UC coach in the role of head coach, and
those in groups with only female coaches.
Although so many of the elementary youth reported improvements in well-being over the
course of the program year, there were very few factors for which we found significant
differences in the amount of improvements. Males reported significantly better improvements
in well-being than females. Significantly greater improvements on well-being were also found
for youth in groups in which none of the UC coaches were serving as the head coach.
Figure 32. Results From Subgroup Analyses for Elementary Group on Well-Being

National Evaluation of Up2Us Coach, 2016-17 Program Year
AMERICAN INSTITUTES FOR RESEARCH | AIR.ORG 79

National Evaluation of Up2Us Coach, 2016-17 Program Year
AMERICAN INSTITUTES FOR RESEARCH | AIR.ORG 80
Subgroup Analyses Examining Differences Between UC Elementary Sample
Participants and Comparison Group Youth
The subgroup analyses just presented provided clarification regarding the conditions under
which UC elementary participants experienced significant improvements in the HIAs. We next
extended the subgroup analyses to examine whether there were conditions under which the
UC participants showed significantly better improvements on any of the HIAs. We were limited
in the subgroup analyses that we could conduct because we had information for the
comparison group youth on gender only (Figure 33) and on whether the programming took
place during school or after school (Figure 34).
For these next figures, the columns in the diagram represent the mean improvement from
baseline to endline in each of the HIAs. In Figure 33, the focus is on whether UC boys and girls
experienced significantly greater improvement than their peers of the same gender in the
comparison group. There was only one significant difference between the UC and comparison
groups when controlling for gender. When we limited the analysis to boys, we found that the
UC participants reported significantly greater improvements in discipline than those in the
comparison group.
Turning next to the subgroup analyses shown in Figure 34, we examined if controlling for
whether the programming took place during the school day allowed for the detection of
significant differences between the UC participants and the comparison group youth. Again, we
found only one significant difference for these analyses at the elementary level. In the case of
positive identity, among the youth in afterschool programs, those in the comparison group
experienced significantly greater improvements than those in the UC groups.

National Evaluation of Up2Us Coach, 2016-17 Program Year
AMERICAN INSTITUTES FOR RESEARCH | AIR.ORG 81
Figure 33. Comparative Analyses for Elementary Group by Gender
Note. * indicates that for that scale, there was a statistically significant difference between the UC group and the
comparison group for that particular subgroup.

National Evaluation of Up2Us Coach, 2016-17 Program Year
AMERICAN INSTITUTES FOR RESEARCH | AIR.ORG 82
Figure 34. Comparative Analyses for Elementary Youth, In-School Versus Afterschool
Programming
Note. * indicates that for that scale, there was a statistically significant difference between the UC group and the
comparison group for that particular subgroup.
Findings From Focus Groups Regarding HIAs
During the youth focus groups, the participants articulated ways in which they had improved in
terms of their fitness and nutritional habits. The specific questions that were posed during the
focus groups did not deliberately explore the specific HIAs, so although there are indications
from the comments by the participants about how they improved on some of the HIAs, there
are not necessarily examples for each individual HIA that emerged from those conversations.
In terms of self-awareness, several youth described having had anger issues and feeling that
participation in UC had helped them develop effective strategies for managing their anger. One
youth described the way the coach was helpful: “He taught me how to keep calm sometimes
when I get angry—I say some pretty harsh things because I have a big vocabulary—and how to
close my mouth when things don’t go my way.”

National Evaluation of Up2Us Coach, 2016-17 Program Year
AMERICAN INSTITUTES FOR RESEARCH | AIR.ORG 83
In terms of positive identity, the youth discussed how they were more confident because of
their experiences in UC. As one youth noted, “Don’t let nobody tell you you can’t do anything.
Because you’re more than that. And this could apply to out of sports because, say, if I want to
do something, like I’m applying for a job or something, and like I have competition, I believe in
myself that I can do it. And I’m not going to let nobody tell me that I can’t.”
The youth also reflected on how their participation in the program had helped with goal setting
(i.e., future focus and Plan B thinking). One youth gave an example that highlighted how from
the beginning of the program the coach was modeling how to set goals: “The first time I joined
YRNOLA after cross-country practices, she grabbed a timer and timed how fast I could do a lap
mile and told me that if I practiced the speed I ran in, that in no time I would pass the limit, so
she’s always helpful [in] goal setting.” In addition, the youth gave more general examples of
how participation in UC was associated with improvements in future focus and Plan B thinking.
For example, one participated indicated, “They taught me how to think things through and to
not jump into something.”
The youth talked about ways the program was helpful in building discipline. Examples included
learning how to follow through on responsibilities even when they do not want to, being able to
control their reactions to external stimuli, and making better choices to avoid getting into
trouble. One youth noted, “It gives you the skills and mental strength, and when you’re faced
with adversity in your life, you’ll be able to deal with it. Because if you can make it through this,
you can make it through anything.” Another youth indicated, “Um, we talk about like a lot of
things, like the positive side of it. If like somebody punch[es] me and I’m about to swing back, I
think about what she tells me because like if I don’t hit back, I won’t get in trouble at all, just
the other person will.”
The youth also shared examples of how their participation in UC has improved their social
confidence. Many of the youth reflected on learning to be more open to getting to know and
get along with other youth, including those whom they previously would not have been
interested in connecting with. One youth noted, “I feel like she’s helped me become more open
to different kinds of people. There was a certain time when I didn’t get along with certain
people. But with her, her personality and seeing her around so many different types of people,
you get to see how to get along with those kinds of people who you didn’t get along with.”
In terms of pro-social connections, the youth described the way in which the coach was now a
stable, positive influence in their lives. One youth described his coach as “one of my best
friends, he will drive me home from practice, we will talk about life, and give each other advice.

National Evaluation of Up2Us Coach, 2016-17 Program Year
AMERICAN INSTITUTES FOR RESEARCH | AIR.ORG 84
I can’t give him as much advice as he gives me, but he’s a friend.” In addition, the youth looked
at the other members of their team as part of their social network and support system. One
youth noted, “It’s like having a whole new family. Also, I like coming every day because I’d
rather come here than stay in the house doing nothing. I also like running around, and I have a
lot of family problems going on, so I come here all the time to forget about it.”
Does Up2Us Coach Result in Improvements in Nutritional
Habits?
The third research question explored the extent to which working with a UC coach at a host site
increased the development of attributes contributing to improvements in nutritional habits. As
we did with the analyses for the HIAs, we considered the results separately for those in the core
sample—those in middle school and high school—and the elementary school sample. In
addition, as was true for the youth responses on the HIAs, we found the responses on the
baseline nutritional items to include many youth who rated themselves rather high. The
analyses in this section, therefore, focus on the youth who reported habits such that their
baseline scores were in the first three quartiles.
As shown in Figure 35, we found significant improvements in nutritional habits for the UC
participants in both the elementary sample and the core sample. When comparing the UC
participants to those in the comparison group, we saw that youth in all the groups experienced
improvements from baseline to endline, and no statistically significant differences were found
between the UC group and the comparison group.

National Evaluation of Up2Us Coach, 2016-17 Program Year
AMERICAN INSTITUTES FOR RESEARCH | AIR.ORG 85
Figure 35. Mean Improvement From Baseline to Endline on Nutritional Habits
Note. * indicates that for that scale, there was a statistically significant improvement from baseline to endline (p <
.05).
As with our analyses on healthy decision making, we were interested in understanding the
circumstances under which we were more likely to find improvements in nutritional habits for
UC participants. The next two figures replicate our earlier subgroup analyses for nutritional
habits. First, in Figure 36, we examined the subgroup analysis results for the core sample. There
are several subgroups, all of which represent different program group structures, for which we
found statistically significant differences in the improvements from baseline to endline. For
instance, those youth in groups in which the coaches were not from the community in which
the program was operating showed significantly greater improvements in nutritional habits
than those in groups in which at least one coach was from the same community in which the
program was based.
We also found significantly greater improvements for youth in groups in which there was only
one coach than for youth in groups with three or more coaches. Significantly greater
improvements in nutritional habits were also observed for youth in groups in which none of the
UC coaches were serving as the head coach, compared to those in groups in which at least one
UC coach was the head coach. Interestingly, significantly greater improvements for nutritional
habits are evident when boys are in the groups where all the coaches were exclusively female
compared to groups with a mixture of male and female coaches. When we limited the analysis
to only girls, we found significantly greater improvements for nutritional habits are evident

National Evaluation of Up2Us Coach, 2016-17 Program Year
AMERICAN INSTITUTES FOR RESEARCH | AIR.ORG 86
when all the coaches were exclusively male compared to groups with a mixture of male and
female coaches.
Figure 36. Results From Subgroup Analyses for Core Group on Nutritional Habits

National Evaluation of Up2Us Coach, 2016-17 Program Year
AMERICAN INSTITUTES FOR RESEARCH | AIR.ORG 87
In Figure 37, we examined the subgroup analyses for the elementary sample. Boys reported
significantly greater improvements from baseline to endline than girls. No other significant
differences were found in the subgroup analyses on the elementary sample.
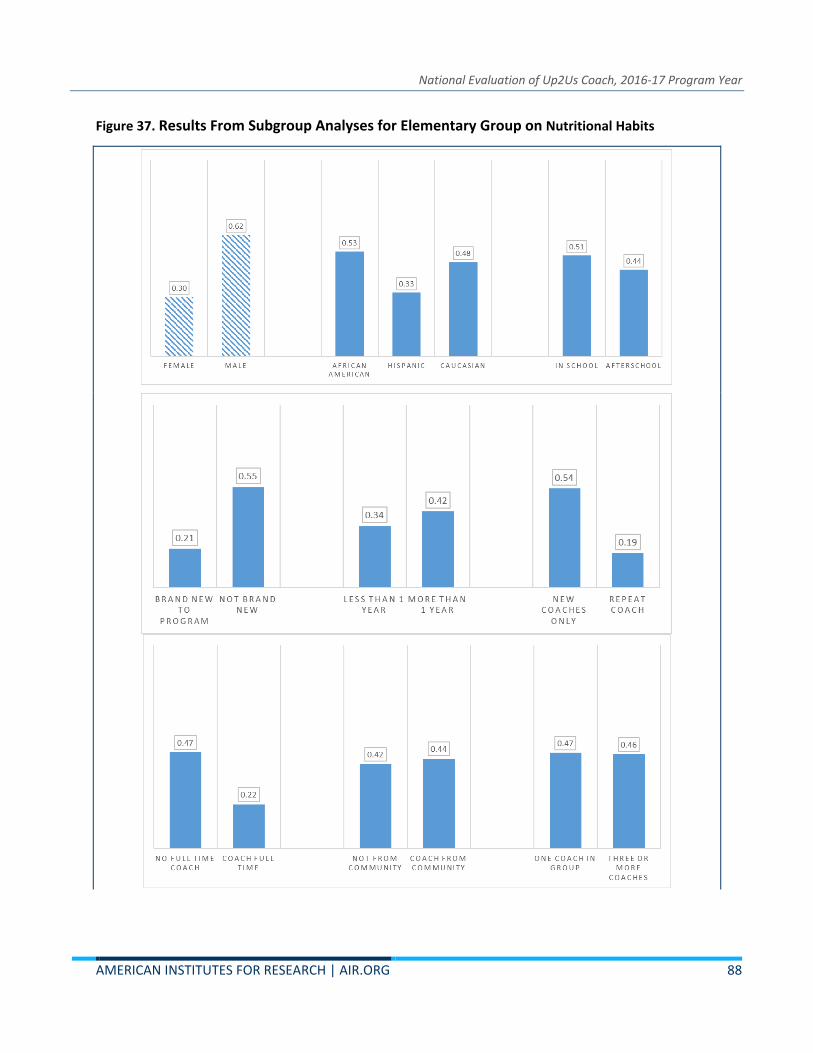
National Evaluation of Up2Us Coach, 2016-17 Program Year
AMERICAN INSTITUTES FOR RESEARCH | AIR.ORG 88
Figure 37. Results From Subgroup Analyses for Elementary Group on Nutritional Habits

National Evaluation of Up2Us Coach, 2016-17 Program Year
AMERICAN INSTITUTES FOR RESEARCH | AIR.ORG 89
Findings From Focus Groups Regarding Nutritional Habits
During the focus groups, the youth had quite a bit to say about how their experiences in the
program shaped their understanding about nutritional habits. They had learned that the food
that they ingested had implications for how healthy they would be. As one youth related, “Eat
healthy; don’t put garbage into your body. Don’t eat McDonald’s during the season because
during season is when you need to eat right. Don’t eat too much sugar, soda isn’t good for you,
anything with a lot of sugar, anything fried is bad.” The youth agreed that they had learned to
eat more vegetables and fruits and to resist the temptation to eat “junk food” and fried foods.
Finally, the youth also had learned to connect what they ate with their moods. One youth
indicated, “Because when you eat healthy, you have the energy, but when you eat unhealthy
things, you[’re] like not in a good mood.” Another youth summed it up: “Coaches preach good
eating. Be careful what you eat because it’ll affect you in the long run.”
What Elements of Program Implementation Contribute to
Positive Outcomes?
In the final phase of the analysis, we examined regression models based on the theory of
change. Using the bivariate analyses reported up to this point in the report, we selected
variables for inclusion in multivariate models in our test of the theory of change. We conducted
preliminary regression analyses to assess potential challenges (i.e., multicollinearity) and to

National Evaluation of Up2Us Coach, 2016-17 Program Year
AMERICAN INSTITUTES FOR RESEARCH | AIR.ORG 90
allow for the choice among similar measures. The preparatory analyses and diagnostic
procedures resulted in the selection of the following items:
• Gender of the youth
• Grade in school of the youth
• Whether the program operated during the school day or after school
• Gender of the coach
• Age of the coach
• Whether the coach and the youth were the same race/ethnicity
• Number of sessions within the program adjusted for the length (in days) of the program
• Coach report of whether the program model was successfully implemented
• Coach report of focus on building relationships with and between participants
• Coach report of focus on the skills of the participants
• Observational rating of the coach on the actions to build a team culture
• Scores from the coach endline survey on the high-impact attributes of positive identity and
situational awareness
• Coach report of whether the Up2Us Coach training was valuable
• Composite score from the youth assessment of the coach and program
A separate regression model was estimated for each of the outcome measures, including the
measures of fitness, high-impact attributes, and nutritional habits. The results of these analyses are
presented in Table 4 and Table 5. As with the bivariate analyses on each of the outcome measures,
the measures of the program characteristics and those of coach skills and quality were more likely
to be associated with the outcomes for the older youth than for the elementary school youth. The
key results for each outcome are highlighted here. The statistically significant predictors for each
outcome are listed in reverse order beginning with the strongest effect.
• When the youth offered positive ratings of the coach and the program, they were more
likely to report an improvement from baseline to endline in their self-awareness. In
addition, when the coach indicated that program implementation was extremely successful,
increases in self-awareness were more likely to be reported among older youth.
Improvements in self-awareness also were more likely (a) if the programs that youth
participated in were delivered more frequently (i.e., the frequency of sessions adjusted for
the length of time, in days, that the program is operating), (b) when the program operated
after school, (c) when observations of the coach indicated high ratings for shaping a team

National Evaluation of Up2Us Coach, 2016-17 Program Year
AMERICAN INSTITUTES FOR RESEARCH | AIR.ORG 91
culture, (d) when the coach reported focusing on building the skills of the participants, (e) as
the grade level in school increased, and (f) when the coach reported focusing on building
relationships with and between the participants.
• The statistically significant predictors of improvements in positive identity from baseline to
endline included the following: (a) the coach reported that program implementation was
extremely successful, (b) the youth offered positive ratings of the coach and the program,
(c) if the programs that youth participated in were delivered more frequently, (d) the coach
reported that he or she was better at coaching because of the skills and strategies learned
from the UC coach training, (e) the grade level of the youth increased, (f) whether any of
the coaches were male, and (g) the coach reported focusing on building the skills of the
participants.
• Improvements in situational awareness from baseline to endline were more likely found
when (a) youth offered positive ratings of the coach and the program, (b) the coach
reported that program implementation was extremely successful, (c) the program operated
after school, (d) the coach reported focusing on building the skills of the participants, and
(e) at least one of the coaches was male.

National Evaluation of Up2Us Coach, 2016-17 Program Year
AMERICAN INSTITUTES FOR RESEARCH | AIR.ORG 92
Table 4. Results of Regression Models, Outcomes for Older Youth (Core Endline Surveys)
Predictor
Self-
Awareness
Positive
Identity
Situational
Awareness
Plan B
Thinking Discipline
Social
Confidence
Pro-Social
Connections Well-Being
Nutritional
Habits
Female Youth -0.016 0.012 0.021 -0.010 -0.023 -0.047 0.044 0.015 0.008
Grade in School 0.113 a 0.107 a 0.065 0.052 0.033 0.030 0.050 0.063 0.006
After School or In School? 0.122 a 0.059 0.111 a 0.169 a 0.171 a 0.060 0.081 a 0.084 a 0.053
Male Coach 0.030 0.100 a 0.073 a 0.083 a 0.072 a -0.009 0.098 a 0.007 -0.059
Age of Coach -0.038 -0.029 -0.012 -0.013 -0.029 -0.028 -0.067 a -0.035 -0.005
Coach and Youth Same Race -0.020 0.047 -0.007 -0.104 a -0.055 0.004 -0.122 a -0.071 a -0.121 a
Dosage 0.176 a 0.172 a 0.086 0.232 a 0.223 a 0.098 a 0.275 a 0.185 a 0.066
Self-Report of Extremely Successful Implementation
0.195 a 0.220 a 0.171 a 0.173 a 0.207 a 0.106 a 0.186 a 0.166 a 0.011
Coach Focus on Relationships 0.060 a -0.009 0.058 -0.021 -0.050 -0.015 0.005 0.067 a 0.076 a
Coach Focus on Skills 0.106 a 0.094 a 0.085 a 0.036 0.041 0.022 0.066 a 0.091 a -0.098
Team Culture Score 0.118 a -0.013 0.001 0.114 a 0.086 0.064 0.171 a 0.124 a 0.149 a
Coach Positive Identity 0.090 -0.073 -0.001 0.144 a 0.097 a 0.037 0.088 0.067 0.111 a
Coach Situational Awareness -0.086 0.029 -0.014 -0.044 -0.021 0.013 -0.125 -0.057 -0.043
Skills and strategies learned from
trainings made me a better coach
0.078 0.132 a 0.091 0.256 a 0.246 a 0.073 0.246 a 0.111 a -0.044
Youth Provides Positive Assessment
of Coach and Impact--Core
0.229 a 0.215 a 0.208 a 0.223 a 0.263 a 0.223 a 0.257 a 0.247 a 0.077 a
R2 0.363
0.304
0.308
0.312
0.368
0.304
0.359
0.377
0.313
Note. Numbers reported in the cells are the standardized regression coefficients (i.e., beta coefficients), which means that within each model the highest (absolute)
values correspond to the strongest effects. a The regression coefficient is significantly greater than 0.

National Evaluation of Up2Us Coach, 2016-17 Program Year
AMERICAN INSTITUTES FOR RESEARCH | AIR.ORG 93
• Improvements in future focus and Plan B thinking from baseline to endline were more
likely when (a) the coach reported being better at coaching because of the skills and
strategies learned from the UC coach training, (b) the dosage of program delivery increased,
(c) youth offered positive ratings of the coach and the program, (d) the coach reported that
program implementation was extremely successful, (e) the program operated after school,
(f) the coach reported higher scores on positive identity, (g) observations of the coach
indicated higher ratings for shaping a team culture, (h) the coaches were not the same
race/ethnicity as the youth, and (i) any of the coaches were male.
• Improvements in discipline from baseline to endline were more likely when (a) youth
offered positive ratings of the coach and the program, (b) the coach reported being better
at coaching because of the skills and strategies learned from the UC coach training, (c) the
dosage of program delivery increased, (d) the coach reported that program implementation
was extremely successful, (e) the program operated after school, (f) the coach reported
higher scores on positive identity, and (g) any of the coaches were male.
• Improvements from baseline to endline in social confidence were more likely when
(a) youth offered positive ratings of the coach and the program, (b) the coach reported that
implementation of the program was extremely successful, and (c) the dosage of program
delivery increased.
• Improvements in pro-social connections from baseline to endline were more likely when (a)
the dosage of program delivery increased, (b) youth offered positive ratings of the coach
and the program, (c) the coach reported being better at coaching because of the skills and
strategies learned from the UC training, (d) the coach reported that program
implementation was extremely successful, (e) observations of the coach indicated high
ratings for shaping a team culture, (f) the coaches were not the same race/ethnicity as the
youth, (g) the program operated after school, (h) the coach was younger, and (i) the coach
reported focusing on building the skills of the participants.
• Improvements from baseline to endline in well-being appeared more likely when (a) youth
offered positive ratings of the coach and the program, (b) the dosage of program delivery
increased, (c) the coach reported that program implementation was extremely successful,
(d) observations of the coach indicated high ratings for shaping a team culture, (e) the
coach reported being better at coaching because of the skills and strategies learned from
the UC training, (f) the coaches were not the same race/ethnicity as the youth, (g) the coach
reported focusing on building the skills of the participants, (h) the program operated after

National Evaluation of Up2Us Coach, 2016-17 Program Year
AMERICAN INSTITUTES FOR RESEARCH | AIR.ORG 94
school, and (i) the coach reported focusing on building relationships with and between the
participants.
• Improvements in nutritional habits for the older youth were more likely when (a)
observations of the coach indicated high ratings for shaping a team culture, (b) the coach
reported higher scores on positive identity, (c) youth offered positive ratings of the coach
and the program, (d) the coaches were not the same race/ethnicity as the youth, and (e)
the coach reported focusing on building relationships with and between the participants.
• Turning to the results in Table 5, the most consistent factor was whether youth offered
positive ratings of the coach and the program. This factor was a significant predictor for
improvements in each HIA and nutritional habits for the elementary school-age
participants. Another consistently significant predictor of improvements in the HIA factors
for the elementary school youth was whether the coach reported higher scores on
situational awareness. In addition, improvements on positive identity and pro-social
connections increased as the age of the coach increased. Greater increases on positive
identity were also more likely for youth participating in programs during school. Finally,
improvements in positive identity and well-being increased for youth in the higher grade
levels.
• In terms of improvements in nutritional habits for elementary school youth, the strongest
predictor was whether the youth offered positive ratings of the coach and program. Other
significant predictors of improvements in nutritional habits included the following: (a) the
coach reported higher scores on positive identity, (b) the program operated after school,
and (c) observations of the coach indicated high ratings for shaping a team culture.
• One of the most consistent findings from the bivariate analyses was that all youth in the
program improved from baseline to endline on the PACER score, which is the key measure
of fitness for this evaluation. Regressing the same set of predictors on this fitness outcome,
we found that several factors were significantly related to improvements in PACER scores:
(a) the program operated after school, (b) the coach reported that program implementation
was extremely successful, (c) the coach reported focusing on building the skills of the
participants, and (d) the coaches were the same race/ethnicity as the youth.

National Evaluation of Up2Us Coach, 2016-17 Program Year
AMERICAN INSTITUTES FOR RESEARCH | AIR.ORG 95
Table 5. Results of Regression Models, Outcomes for Elementary School Youth and Fitness Outcomes for All
Predictor
Positive
Identity Discipline
Social
Confidence
Pro-Social
Connections Well-Being
Nutritional
Habits PACER Score
Female Youth -0.002 0.017 -0.042 0.015 -0.068 a -0.100 a -0.116 a
Grade in School 0.234 a 0.031 -0.003 0.017 0.110 a -0.119 a 0.284 a
After School or In School? -0.177 a 0.076 0.049 -0.073 -0.076 0.171 a 0.189 a
Male Coach -0.070 -0.038 0.004 -0.003 -0.041 -0.044 -0.003
Age of Coach 0.124 a 0.054 0.039 0.177 a 0.008 -0.004 -0.158 a
Coach and Youth Same Race 0.064 0.007 -0.004 -0.004 -0.020 -0.074 0.091 a
Dosage -0.300 -0.107 -0.121 -0.294 -0.140 0.020 -0.044
Self-Report of Extremely Successful
Implementation
-0.048 -0.025 -0.042 -0.046 0.026 -0.029 0.169 a
Coach Focus on Relationships -0.136 -0.076 -0.081 -0.085 -0.095 -0.093 0.021
Coach Focus on Skills -0.087 0.024 0.032 0.048 -0.017 0.010 0.133 a
Team Culture Score -0.353 -0.019 -0.077 -0.221 -0.148 0.140 a -0.036
Coach Positive Identity -0.145 0.093 -0.008 -0.156 0.011 0.202 a 0.000
Coach Situational Awareness 0.228 a 0.084 0.120 a 0.158 a 0.113 a 0.078 -0.140
Skills and strategies learned from trainings
made me a better coach
-0.395 -0.095 -0.165 -0.283 -0.242 0.035 0.064
Youth Provides Positive Assessment of Coach
and Impact--Elementary
0.255 a 0.262 a 0.320 a 0.388 a 0.470 a 0.256 a
R2 0.294 0.338 0.401 0.400 0.441 0.381 0.166
Note. Numbers reported in the cells are the standardized regression coefficients (i.e., beta coefficients), which means that within each model, the highest (absolute) values
correspond to the strongest effects. a The regression coefficient is significantly greater than 0.

National Evaluation of Up2Us Coach, 2016-17 Program Year
AMERICAN INSTITUTES FOR RESEARCH | AIR.ORG 96
Multiyear Data
This evaluation focused on the 2016–17 program year. Yet this program has retained youth
participants for many years and even has some coaches who continue from one year to the
next. We wondered whether the benefits of the program are evident in the first year, or if they
were more likely over time, and whether the improvements are sustained across time.
In Figure 38 we examine a breakdown of the participants based on how long they were in the
program. As we noted earlier, more than half (53%) of the participants were brand new to the
program. Another group (13%) had previously participated but had not yet been with the
program for a full year. One third of all participants had been enrolled with UC sites for more
than 1 year. For the analyses in this section, we are focusing on comparisons between those
who were brand new to the program and those who were not new to UC. Because we also
wanted to understand whether there continued to be incremental benefits when youth
participated over a longer term, we compared those in the program up to 1 year with those
who had been with the program for more than 1 year.
Figure 38. Breakdown of UC Participants by Length of Time in Program

National Evaluation of Up2Us Coach, 2016-17 Program Year
AMERICAN INSTITUTES FOR RESEARCH | AIR.ORG 97
We explored in two different ways the impact of participation in UC over a longer period than
one program year. We received data for a small subset of youth who participated in two
consecutive years (including the year just prior to the program year on which we focused for
this evaluation), and we could examine change from baseline scores in the first year to endline
scores in the second year. Figure 39 is an example of this type of analysis. Here we are looking
at PACER scores at four different points in time: Year 1 baseline, Year 1 endline, Year 2 baseline,
and Year 2 endline. Each of the comparisons in Figure 39 showed statistically significant
improvements. The greatest improvement occurred in Year 1, but it was still possible for the
youth to show improvement in Year 2. The large improvement in Year 1 (for context, consider
the change in Figure 2) may suggest that the youth most likely to continue from year to year are
those who experienced the greatest degree of success in their fitness outcomes.
Figure 39. Mean PACER Scores in Year 1 and Year 2
A second way that we examined the impact of participation over time in UC was to consider
differences in outcomes between those youth who were new to participation at a UC site and
all the other youth who were not new. We also compared those youth who had been in the
program 1 year or less with those who had been in the program more than 1 year. Figure 40
provides an example from this section of the analyses. In Figure 40, we considered the
breakdown of participants by category of HFZ results and length of time in the program. Here
we found that improvements in fitness were evident not only for youth brand new to the
program but also for youth who had already been participating for some time. When we
compared those in the program for 1 year or less to those who had been participating more

National Evaluation of Up2Us Coach, 2016-17 Program Year
AMERICAN INSTITUTES FOR RESEARCH | AIR.ORG 98
than 1 year, we still saw that youth were improving on fitness. There is some evidence that
youth who had been in the program already exhibited higher baseline scores, including a
greater likelihood of meeting the HFZ standards at baseline.
Figure 40. Results From Multiyear Analyses on PACER Results
In turning to the HIAs, we again examined the longitudinal results in two different ways. In
Figure 41, we looked at the scores at the four points in time: Year 1 baseline (Y1 BL), Year 1
endline (Y1 EL), Year 2 baseline (Y2 BL), and Year 2 endline (Y2 EL). Several findings emerged
from these analyses. First, in general we found that across the four points in time, the scores on
each HIA tended to increase at each subsequent point, with discipline being the one key
exception. In every case, the score at the endline in Year 2 was higher than the baseline at Year
1. Differences that are statistically significant are denoted in the chart with an asterisk.

National Evaluation of Up2Us Coach, 2016-17 Program Year
AMERICAN INSTITUTES FOR RESEARCH | AIR.ORG 99
Figure 41. Results From Multiyear Analyses on HIA Results, Core Sample With 2 Years of Data
In contrast to the results on the fitness outcomes, youth tended to sustain their growth over
time. For most of the HIAs, the Year 2 baseline scores tended to be even higher than the Year 1
endline scores.
The next two figures examine the comparisons for UC participants in terms of the HIAs by
length of time in the program. Figure 42 and Figure 43 provide results for the youth in the core
sample, and Figure 44 examines results for the elementary participants. These results are a bit
different from the fitness results in that the improvements did not appear in the initial
experiences the youth had with the program. As a group, those brand new to the program did
not necessarily show growth on the HIAs from baseline to endline. This finding contrasted with
the results for those who were not new to the program and those who had been with the
program for more than 1 year. We were much more likely to see consistent evidence of

National Evaluation of Up2Us Coach, 2016-17 Program Year
AMERICAN INSTITUTES FOR RESEARCH | AIR.ORG 100
improvement from baseline to endline across many of the HIAs for the youth who had
previously participated for some time.
Figure 42. Results From Multiyear Analyses on HIA Results, Core Sample Based on Length of
Time With Program
Another way to consider the results from Figure 42 is to look at the average change from
baseline to endline for each of the three groups. These results are shown in Figure 43. We
consistently found for each of the HIAs that improvement during the current program year was
larger for those youth who were not brand new to the program. Finally, in Figure 44 we present
the results for the elementary sample. Because youth in this sample were in Grades 3–5, only

National Evaluation of Up2Us Coach, 2016-17 Program Year
AMERICAN INSTITUTES FOR RESEARCH | AIR.ORG 101
small numbers of youth had been in the program for more than 1 year. As a result, in Figure 44,
we only considered the differences between those who were brand new to the program and
those who were not brand new. As we found with the older youth, the greatest improvements
on each of the HIAs were found for those youth who were not brand new to the program.
Figure 43. Multiyear Results for Mean Change From Baseline to Endline on HIAs, Core Sample

National Evaluation of Up2Us Coach, 2016-17 Program Year
AMERICAN INSTITUTES FOR RESEARCH | AIR.ORG 102
Figure 44. Results From Multiyear Analyses on HIA Results, Elementary Sample
Limitations of the Evaluation
This evaluation has many strengths. Up2Us Sports has selected (and developed) several high-
quality measures for which reliability and validity have been well established prior to the
measures’ selection for this evaluation or that we have been able to demonstrate are reliable
and appear to be valid for this current sample (see Appendix Volume). In addition, for the coach
skills items, there are several different related measures that lend themselves to triangulation
around the measurement of key constructs. The sample size is also sufficient for the analyses
we sought to conduct as part of this evaluation.
There are, however, limitations that must be acknowledged and taken into consideration
because they have implications for conclusions that may be drawn from this evaluation. First,
there was not enough information about the comparison group to effectively conclude that the
results of this evaluation that address whether UC contributes to improvements in youth
outcomes can be interpreted with confidence. It would strengthen the evaluation if we could
have controlled for the behaviors and attitudes of the coaches in the comparison group. The
key measures are all included in the endline survey and would provide good information for
understanding how similar the coaches in the comparison group are to the coaches in UC.
A second limitation has to do with characteristics of the program groups and the measures of
coach skills. We did find differences in outcomes for youth in certain kinds of program groups
(i.e., groups in which there were no UC coaches serving as the head coach, groups in which
there was at least one full-time coach, groups in which the coaches were not from the
community in which the program is operating, and so on). Yet these characteristics were

National Evaluation of Up2Us Coach, 2016-17 Program Year
AMERICAN INSTITUTES FOR RESEARCH | AIR.ORG 103
correlated with other factors that were also shown to be related to improvements in youth
outcomes. The regression models make clear that there was so much correlation between such
factors as whether the program was in school or after school, whether the head coach was a UC
coach, how much contact there was with the HSS, and the measure of dosage, just to name a
few. This correlation means that even where we detected statistically significant patterns in the
data, we cannot explain why the results were the way they were. So, for instance, we do not
know why we observed better results for youth in groups in which the coaches were not from
the community or why there was better improvement for youth in groups in which none of the
UC coaches were serving as the head coach. A future evaluation may benefit from some case
study analyses of individual sites to better understand the nuances of the context in which the
groups operate.
Finally, as is often the case for evaluations of multisite programs such as Up2Us Coach, missing
data may bias the results in ways that limit the ability to generalize the results to all youth
participating in UC. There were program sites that were scheduled to participate in the surveys
but for which no surveys were administered. There were also sites that were selected to
administer the PACER assessment but did not follow through. Although the sample size was
sufficient for the analyses we conducted, it may be true that the missing cases were not a
random sample of all the youth served during the program year. This may limit how
representative the results of these analyses are; that is, do they reflect all participants across all
UC sites? Related to this concern is the degree to which some of the key measures were missing
data across several cases.
Summary and Discussion
In this section of the report, we summarize and highlight the key findings from the analyses.
Up2Us Coach is a program model that is highly regarded by all involved. The host sites point to
and express appreciation for the ways in which UC emphasizes training and a culture of trauma-
informed sports-based youth development. The support that Up2Us Sports provides to the host
sites appears to enhance capacity and sustainability for the programming that is being offered.
That some coaches go on to fill supervisory roles within the host organizations is one key way
that the UC model goes beyond simply providing highly skilled coaches. In addition, the coaches
report feeling empowered by their understanding of the needs of the youth they serve and
through the internalization of real learning in the development of their coaching skills. Finally,
the youth provided very high ratings on the quality and impact of the coaches and the program.

National Evaluation of Up2Us Coach, 2016-17 Program Year
AMERICAN INSTITUTES FOR RESEARCH | AIR.ORG 104
Did working with a UC coach at a host site improve the physical fitness of youth participants?
The results of our analyses showed that UC had real fitness benefits. The youth participants
increased their level of fitness while in the program. We found this outcome to be true for
youth at all levels of initial fitness. This outcome was also true for youth at all ages. That
improvement continued as long as the youth were taking part in the program. In addition, if the
youth started out below the Healthy Fitness Zone standards, the programming that they
experienced in UC resulted in the achievement of improvements that brought the youth in line
with the standards. Progress toward meeting the HFZ standards was one of the ways in which
the UC programming had a significantly greater impact than the comparison groups.
The fact that the comparison sites achieved statistically significant fitness results suggests that
improvements to fitness can happen when youth participate in regular physical activities and
sports. Sports-based youth development is also about helping the youth to adopt more healthy
habits (i.e., nutrition, decision making). UC offers a program model that is focused on positive
youth development. In the feedback from the HSSs, we heard that they particularly appreciated
the sports-based youth development aspects of the program, so the evaluation gave special
weight to the outcomes beyond the fitness improvements.
Did working with a UC coach at a host site increase the development of attributes that
contribute to healthy decision making? Although there were improvements for all the HIAs
while the youth were in the program, there were limitations to this evaluation that kept us
from determining whether the improvements we found for the HIAs were because of the
youth’s participation in UC. Yet there were patterns of results that pointed to several potential
implications for how the program groups were making a difference for the participants.
When given the chance to rate the program and their coaches, the youth had generally very
positive views. They trusted their coaches, saw the coaches as good role models, and would go
to the coaches for help and advice if they needed to. They also reported that the program
helped them to be healthy and to do better at school. It is not necessarily surprising to find that
youth felt positively about a program in which they were participating, but we believe that two
important findings suggest that these ratings by the youth are particularly noteworthy. First,
when the coaches were asked very similar questions, we found an impressive degree of
alignment in the responses between youth and coach—this alignment was particularly true for
the elementary youth. This finding suggests that the youth were not offering positive ratings in
an arbitrary or general way. Second, youth ratings of the coach and program were significant
predictors of every single youth development and nutritional outcome. What do these findings
mean? It appears that when youth perceived that the coach was someone they could look up

National Evaluation of Up2Us Coach, 2016-17 Program Year
AMERICAN INSTITUTES FOR RESEARCH | AIR.ORG 105
to, go to for help, and trust and that the program was helpful, they were much more likely to
report significant improvements on each of their HIA and nutritional habit outcomes. This is just
the type of result we might look for in a sports-based youth development program.
For the oldest youth in the program (i.e., those in high school), there is consistent evidence that
they were experiencing improvements over the course of the year on many HIAs. And the
results of the subgroup analyses pointed to several different ways in which the older youth are
experiencing benefits from their participation in the program. Conversely, there was less
evidence from the subgroup analyses for the elementary school youth about the conditions
under which the youth were improving over the course of the year on the HIAs. We do note
that, as with the older youth, the one consistent predictor for improvements across all the HIAs
for the elementary school youth was the ratings by those youth on program and coach quality.
There is evidence that many of the positive outcomes were more likely for those youth who
continued in the program beyond the first year. This likelihood was particularly the case for the
older (i.e., non-elementary school) youth. Youth who were new to the program often
experienced the smallest changes among all program participants from baseline to endline. For
some youth, significant improvement was found when looking at the changes from baseline in
one year to endline in the next consecutive year. Improvement in a single program year could
be detected, though, for many youth who had been in the program for more than 1 year. And
we found that improvement within a single year was still possible even after 2 years in the
program. There appeared to be benefits for participants to continue with the program year
after year, and this finding suggests that programs should encourage the youth to keep coming
back in the following seasons.
Did working with a UC coach at a host site increase the development of attributes that
contribute to improvements in nutritional habits? Overall, we found evidence that
participation in the program was associated with improvements in nutritional habits. As with
the HIAs, subgroup analyses pointed to factors related to reports of positive changes to the
nutritional habits for the UC participants.
What elements of program implementation contribute most to positive outcomes? The
evaluation examined whether there were differential effects based on different types of
program group structures. We found that different group structures, based on characteristics of
the coaches, were associated with greater levels of improvement, even if there was not
evidence that the group structures were responsible for those improvements. For example,
although we cannot say that having at least one repeat coach causes greater improvements in

National Evaluation of Up2Us Coach, 2016-17 Program Year
AMERICAN INSTITUTES FOR RESEARCH | AIR.ORG 106
the youth outcomes, we did find for some HIAs that the reported improvements were higher
for youth in groups with at least one repeat coach compared with participants in groups in
which all the coaches were new to UC. Because more than half of the current coaches reported
an intention to continue with the program for another year, this result is promising. Similarly,
higher levels of improvement for youth outcomes were evident in groups in which none of the
UC coaches were serving as the head coach, in which the coaches were not from the same
community in which they were serving, and in which there was more regular contact between
the coach and the host-site supervisor. We also found higher levels of improvement if there
was only one coach in the group. As we discussed in the previous section, a limitation of the
research design for this evaluation was that it was not possible to understand what aspects of
these program group structures might explain the patterns of results. It may make sense in the
evolution of the UC program to use a case study approach in the next evaluation to do a deep
dive into a small number of sites to focus more on these types of questions.
One interesting pattern that emerged in the subgroup analyses was related to the outcomes for
girls. In general, girls experienced lower levels of improvement than boys across most of the
outcomes of interest for this evaluation. Yet we found that among the girls in the program,
those in groups in which all the coaches are also female report significantly greater
improvement in HIAs from baseline to endline than other girls in groups with a mixture of
coaches of both genders. This result appeared to hold only for the older girls—in fact,
elementary school girls appeared to do much better when working with a mixture of men and
women as coaches in their group. Although we do not know what may be the reason that girls
appeared to do so much better when working with female coaches, the consistency of this
result across several different outcomes suggests that it is worth further investigation in future
evaluations of UC.
There was a difference in the impact on youth when they participated in the afterschool
programs, compared with those youth in programs that took place during the school day. This
evaluation did not provide further information for understanding what aspects of the
afterschool programs may make them more effective, but there was evidence from the focus
groups and the coach surveys regarding frustrations they experienced with the programming in
schools. Some coaches expressed how difficult it was to have a structured curriculum within a
recess program. A small number of coaches expressed feelings that they did not make a
difference with the youth they served—those coaches were working in elementary physical
education classes.

National Evaluation of Up2Us Coach, 2016-17 Program Year
AMERICAN INSTITUTES FOR RESEARCH | AIR.ORG 107
The regression results also pointed to many program-related and coach-related factors that
predicted improvements across most of the youth development and nutritional habit outcomes
for the youth participants, including the following:
• Dosage matters. When programs provided a greater number of sessions adjusted for the
length of time from the start date to the end date for the current program year, participants
were more likely to report improved outcomes.
• Training matters. When the coaches reported that the skills and strategies they learned
from the Institute made them better coaches, participants were more likely to report
improved outcomes.
• Implementation matters. When the coaches reported that their implementation of the UC
model was extremely successful, participants were more likely to report improved
outcomes.
• A focus on skills matters. Coaches indicated how important it was to help each player
develop sport skills, give each player the opportunity to contribute to practice structure and
activities, dedicate practice time to linking sport skills to life skills, and come to practice with
a detailed plan for that session. When the coach attributed more importance to these
aspects, participants were more likely to report improved outcomes.
• Situational awareness on the part of the coach matters. When coaches rated themselves
higher in terms of being aware of things around them, being alert to things that may put
personal safety at risk, and being aware of everything in the environment, participants were
more likely to report improved outcomes.
• Building team culture matters. When observation ratings of the coach found that the youth
were excited to see their coach, that the participants were smiling and having fun, that
participants were having positive interactions with other participants, that the team
celebrated success together, and that the youth and coach were respectful to one another,
participants were more likely to report improved outcomes.

LOCATIONS
Domestic: Washington, DC (HQ) | Monterey, Sacramento, and San Mateo, CA | Atlanta, GA | Honolulu, HI | Chicago and Naperville, IL
Indianapolis, IN | Metairie, LA | Waltham, MA | Frederick and Rockville, MD | Chapel Hill, NC | New York, NY | Columbus, OH | Cayce, SC
Austin, TX | Reston, VA
International: El Salvador | Ethiopia | Haiti | Honduras | Zambia
4498_04/18
Established in 1946, the American Institutes for
Research (AIR) is an independent, nonpartisan,
not-for-profit organization that conducts behavioral
and social science research on important social
issues and delivers technical assistance, both
domestically and internationally, in the areas of
education, health, and workforce productivity.
MAKING RESEARCH RELEVANT
AMERICAN INSTITUTES FOR RESEARCH
1000 Thomas Jefferson Street NW
Washington, DC 20007-3835 | 202.403.5000
www.air.org