National Estimates of Marijuana Use and Related Indicators ... · trends for marijuana use and...
32
Surveillance Summaries / Vol. 65 / No. 11 September 2, 2016 U.S. Department of Health and Human Services Centers for Disease Control and Prevention Morbidity and Mortality Weekly Report National Estimates of Marijuana Use and Related Indicators — National Survey on Drug Use and Health, United States, 2002–2014
Transcript of National Estimates of Marijuana Use and Related Indicators ... · trends for marijuana use and...

Surveillance Summaries / Vol. 65 / No. 11 September 2, 2016
U.S. Department of Health and Human ServicesCenters for Disease Control and Prevention
Morbidity and Mortality Weekly Report
National Estimates of Marijuana Use and Related Indicators — National Survey on Drug Use and Health,
United States, 2002–2014

Surveillance Summaries
The MMWR series of publications is published by the Center for Surveillance, Epidemiology, and Laboratory Services, Centers for Disease Control and Prevention (CDC), U.S. Department of Health and Human Services, Atlanta, GA 30329-4027.Suggested citation: [Author names; first three, then et al., if more than six.] [Title]. MMWR Surveill Summ 2016;65(No. SS-#):[inclusive page numbers].
Centers for Disease Control and PreventionThomas R. Frieden, MD, MPH, Director
Harold W. Jaffe, MD, MA, Associate Director for Science Joanne Cono, MD, ScM, Director, Office of Science Quality
Chesley L. Richards, MD, MPH, Deputy Director for Public Health Scientific ServicesMichael F. Iademarco, MD, MPH, Director, Center for Surveillance, Epidemiology, and Laboratory Services
MMWR Editorial and Production Staff (Serials)Sonja A. Rasmussen, MD, MS, Editor-in-Chief
Charlotte K. Kent, PhD, MPH, Executive Editor Christine G. Casey, MD, Editor
Teresa F. Rutledge, Managing EditorDavid C. Johnson, Lead Technical Writer-Editor
Marella Meadows, Project Editor
Martha F. Boyd, Lead Visual Information SpecialistMaureen A. Leahy, Julia C. Martinroe,
Stephen R. Spriggs, Moua Yang, Tong Yang,Visual Information Specialists
Quang M. Doan, MBA, Phyllis H. King, Terraye M. Starr,Information Technology Specialists
MMWR Editorial BoardTimothy F. Jones, MD, ChairmanMatthew L. Boulton, MD, MPH
Virginia A. Caine, MD Katherine Lyon Daniel, PhD
Jonathan E. Fielding, MD, MPH, MBADavid W. Fleming, MD
William E. Halperin, MD, DrPH, MPHKing K. Holmes, MD, PhD
Robin Ikeda, MD, MPH Rima F. Khabbaz, MD
Phyllis Meadows, PhD, MSN, RNJewel Mullen, MD, MPH, MPA
Jeff Niederdeppe, PhDPatricia Quinlisk, MD, MPH
Patrick L. Remington, MD, MPH Carlos Roig, MS, MA
William L. Roper, MD, MPH William Schaffner, MD
CONTENTS
Introduction ............................................................................................................2
Methods ....................................................................................................................2
Results .......................................................................................................................5
Discussion ................................................................................................................8
Limitations ............................................................................................................ 10
Conclusion ............................................................................................................ 10
References ............................................................................................................. 11

Surveillance Summaries
MMWR / September 2, 2016 / Vol. 65 / No. 11 1US Department of Health and Human Services/Centers for Disease Control and Prevention
National Estimates of Marijuana Use and Related Indicators — National Survey on Drug Use and Health, United States, 2002–2014
Alejandro Azofeifa, DDS1
Margaret E. Mattson, PhD1
Gillian Schauer, PhD2
Tim McAfee, MD3
Althea Grant, PhD4
Rob Lyerla, PhD11Division of Evaluation, Analysis and Quality, Center for Behavioral Health Statistics and Quality, Substance Abuse and Mental Health Services Administration
2Battelle Memorial Institute, Public Health Center for Tobacco Research, Guest Researcher for the Office on Smoking and Health, National Center for Chronic Disease Prevention and Health Promotion, CDC
3Office on Smoking and Health, National Center for Chronic Disease Prevention and Health Promotion, CDC4Office of Noncommunicable Diseases, Injury and Environmental Health, CDC
Abstract
Problem/Condition: In the United States, marijuana is the most commonly used illicit drug. In 2013, 7.5% (19.8 million) of the U.S. population aged ≥12 years reported using marijuana during the preceding month. Because of certain state-level policies that have legalized marijuana for medical or recreational use, population-based data on marijuana use and other related indicators are needed to help monitor behavioral health changes in the United States.Period Covered: 2002–2014.Description of System: The National Survey on Drug Use and Health (NSDUH) is a national- and state-level survey of a representative sample of the civilian, noninstitutionalized U.S. population aged ≥12 years. NSDUH collects information about the use of illicit drugs, alcohol, and tobacco; initiation of substance use; frequency of substance use; substance dependence and abuse; perception of substance harm risk or no risk; and other related behavioral health indicators. This report describes national trends for selected marijuana use and related indicators, including prevalence of marijuana use; initiation; perception of harm risk, approval, and attitudes; perception of availability and mode of acquisition; dependence and abuse; and perception of legal penalty for marijuana possession.Results: In 2014, a total of 2.5 million persons aged ≥12 years had used marijuana for the first time during the preceding 12 months, an average of approximately 7,000 new users each day. During 2002–2014, the prevalence of marijuana use during the past month, past year, and daily or almost daily increased among persons aged ≥18 years, but not among those aged 12–17 years. Among persons aged ≥12 years, the prevalence of perceived great risk from smoking marijuana once or twice a week and once a month decreased and the prevalence of perceived no risk increased. The prevalence of past year marijuana dependence and abuse decreased, except among persons aged ≥26 years. Among persons aged ≥12 years, the percentage reporting that marijuana was fairly easy or very easy to obtain increased. The percentage of persons aged ≥12 reporting the mode of acquisition of marijuana was buying it and growing it increased versus getting it for free and sharing it. The percentage of persons aged ≥12 years reporting that the perceived maximum legal penalty for the possession of an ounce or less of marijuana in their state is a fine and no penalty increased versus probation, community service, possible prison sentence, and mandatory prison sentence.Interpretation: Since 2002, marijuana use in the United States has increased among persons aged ≥18 years, but not among those aged 12–17 years. A decrease in the perception of great risk from smoking marijuana combined with increases in the perception of availability (i.e., fairly easy or very easy to obtain marijuana) and fewer punitive legal penalties (e.g., no penalty) for the possession of marijuana for personal use might play a role in increased use among adults.Public Health Action: National- and state-level data can help federal, state, and local public health officials develop targeted prevention activities to reduce youth initiation of marijuana use, prevent marijuana dependence and abuse, and prevent adverse health effects. As
state-level laws on medical and recreational marijuana use change, modifications might be needed to national- and state-level surveys and more timely and comprehensive surveillance systems might be necessary to provide these data. Marijuana use in younger age groups is a particular public health concern, and changing the perception of harm risk from smoking marijuana is needed.
Corresponding author: Alejandro Azofeifa, Division of Evaluation, Analysis and Quality, Center for Behavioral Health Statistics and Quality, Substance Abuse and Mental Health Services Administration. Telephone: 240-276-1282; E-mail: [email protected].

Surveillance Summaries
2 MMWR / September 2, 2016 / Vol. 65 / No. 11 US Department of Health and Human Services/Centers for Disease Control and Prevention
IntroductionIn the United States, marijuana (cannabis) is the most
commonly used illicit drug (1). In 2013, data from the National Survey on Drug Use and Health (NSDUH) indicated that approximately 2.4 million persons aged ≥12 years had used marijuana for the first time during the preceding 12 months, an average of approximately 6,600 new users each day (1). Among persons aged ≥12 years, approximately 8.1 million had used marijuana on 20 or more days during the preceding month (1), and approximately 4.2 million met the criteria for marijuana dependence and abuse* during the preceding year (1). Increased trends in substance use can coincide with decreased trends in perceived risk (1). According to NSDUH data, the prevalence of past month marijuana use among persons aged 12–17 years increased from 6.7% in 2006 to 7.1% in 2013, and the percentage who perceived great risk from smoking marijuana once a month decreased from 34.6% in 2006 to 24.2% in 2013 (1).
The health effects associated with marijuana use are widely debated. However, regular use (i.e., daily or almost daily use) of marijuana or use during adolescence poses potential public health concerns, including reduced educational attainment, potential long-term health consequences, addiction in some users, increased risk for psychoses disorders, altered brain structure and function, and increased risk for injury from driving while under the influence (2–8).
Since 1971, NSDUH has been the principal national source of statistical information on the use of illicit drugs, alcohol, and tobacco. Several national- and state-level reports on substance use have been published by the Substance Abuse and Mental Health Services Administration (SAMHSA) using NSDUH data (9). To date, no comprehensive national report has focused only on a specific substance (e.g., marijuana). This report is the first to present an overview of national estimates for marijuana use and related indicators for the U.S. civilian noninstitutionalized population aged ≥12 years using 2002–2014 NSDUH data. Findings from this report can provide federal, state, and local public health officials with information about behavioral trends for marijuana use and related indicators. Public health officials can use these findings to develop and implement targeted prevention activities to reduce youth initiation and use of marijuana. Findings can also be used to assess the quality, relevance, and timeliness of surveillance capacity to effectively monitor trends of marijuana use.
MethodsData Source and Collection
NSDUH collects information about the use of illicit drugs, alcohol, and tobacco among the U.S. noninstitutionalized civilian population aged ≥12 years (10). NSDUH respondents include residents of households and noninstitutional group quarters (e.g., shelters, rooming houses, dormitories, migratory workers’ camps, and halfway houses) and civilians living on military bases. Homeless persons who do not use shelters, active duty military personnel, and residents of institutional group quarters (e.g., correctional facilities, nursing homes, mental institutions, and long-term hospitals) are excluded. NSDUH data are collected annually via household face-to-face interviews using computer-assisted personal interviewing methods. An independent, multistage area probability sample design for each of the 50 states and the District of Columbia allows for the production of state-level estimates. NSDUH oversamples youth (aged 12–17 years) and young adults (aged 18–25 years) to allow increased precision in those age groups. Additional information about sample design can be found elsewhere (11,12).
NSDUH is planned and managed by the Center for Behavioral Health Statistics and Quality (CBHSQ) at SAMHSA. Data are collected and processed by RTI International (Research Triangle Park, North Carolina) through a contract with CBHSQ. The data presented in this report are limited to the years 2002–2014 using NSDUH’s restricted files. Data are protected under the Confidential Information Protection and Statistical Efficiency Act of 2002 (PL 107-347), which ensures that all NSDUH data are used for statistical purposes only and cannot be used for any other purposes. NSDUH was reviewed and approved by RTI International’s Institutional Review Board (protocol ID no. 13961, project no. 0213986). NSDUH is authorized by Section 505 of the Public Health Service Act (available at https://www.gpo.gov/fdsys/pkg/USCODE-2010-title42/pdf/USCODE-2010-title42-chap6A-subchapIII-A-partA-sec290aa-4.pdf ). More information about confidentiality and Office of Management and Budget approval is available at http://www.reginfo.gov/public/do/PRAViewICR?ref_nbr=200106-0930-004. Changes to the NSDUH survey design and methodology occurred in 1999 and 2002; therefore, survey data collected before 2002 are not comparable to those collected during 2002–2014. These changes included a transition from paper-and-pencil interviewing to computer-assisted interviewing, improvements to data collection quality control procedures,
* Substance use disorder (also known as dependence or abuse) is defined as meeting criteria in the Diagnostic and Statistical Manual of Mental Disorders (DSM-IV) (American Psychiatric Association [APA], 1994) for either dependence or abuse.

Surveillance Summaries
MMWR / September 2, 2016 / Vol. 65 / No. 11 3US Department of Health and Human Services/Centers for Disease Control and Prevention
and the addition of a $30 monetary incentive. During 2002–2014, the only change implemented involved the use of census data to produce the sample weights. In 2002, the 2000 decennial census data were introduced and used in the 2002–2010 sample weights and in 2011, the 2010 census data were introduced and used in the 2011–2014 sample weights. However, those weight changes were not substantial enough to cause a break in comparability with earlier years. Detailed information regarding the NSDUH methodology and questionnaire is available elsewhere (9–12).
Sample DesignDuring 2002–2013, states with the largest population
were designated as large sample states (California, Florida, Illinois, Michigan, New York, Ohio, Pennsylvania, and Texas); these eight states had an annual target sample size of 3,600 participants per state. The remaining 42 states and the District of Columbia had an annual target sample size of 900 participants per state. Beginning in 2014, the sample was redesigned from a two-state sample size group (i.e., 3,600 and 900) to a six-state sample size group (i.e., 4,560, 3,300, 2,400, 1,500, 967, and 960) along with a change in the age-group allocation. This redesign means that the sample allocation is more proportional to the population size in each state (compared with the 2002–2013 sample design), which will result in generally increased precision of national estimates among various age groups (11,12). Additional details about the NSDUH 2014 redesign are available elsewhere (12).
QuestionnaireMarijuana use was defined in NSDUH as a self-report
of using marijuana (pot or grass) or hashish (hash). All questions about marijuana in NSDUH were screened by answering positively to the following question: “Have you ever, even once, used marijuana or hashish?” For this report, national estimates were developed from six related indicators of marijuana use patterns and perceptions: 1) marijuana use; 2) marijuana initiation; 3) perception of harm risk, approval, and attitudes; 4) perception of availability and mode of acquisition; 5) marijuana dependence and abuse; and 6) marijuana possession–criminal justice (Box). The detailed NSDUH questionnaire is available at http://www.samhsa.gov/data/population-data-nsduh/reports?tab=39.
VariablesNSDUH data on marijuana use during the preceding
month include the following demographic characteristics: age, sex, race/ethnicity, highest level of education completed,
current employment status, and geographic area of residence (i.e., census region). Age was categorized into four groups: total (≥12 years), 12–17 years, 18–25 years, and ≥26 years. Sex was categorized into males and females. Race/ethnicity was categorized into seven groups: non-Hispanic white, non-Hispanic black or African America, non-Hispanic American Indian/Alaska Native, non-Hispanic Hawaiian/Other Pacific Islander, non-Hispanic Asian, non-Hispanic two or more races,† and Hispanic or Latino. Highest level of education completed was categorized into four groups: less than high school, high school, some college, and college graduate. Current employment status was categorized into four groups: full-time employment, part-time employment, unemployed, and other (e.g., student, keeping house or caring for children full-time, retired, or disabled). Geographic area of residence was divided into four regions (Northeast, South, Midwest, and West) as defined by the Census Bureau.§ This report presents national estimates of marijuana use and related indicators for all persons aged ≥12 years and three age subgroups (12–17 years, 18–25 years, and ≥26 years).
AnalysisStatistical analyses were performed using SUDAAN
version 11.0.1 (RTI International, Research Triangle Park, North Carolina). Prevalence measures, 95% confidence intervals, linear p-values, and relative prevalence differences for marijuana use and related indicators are presented in this report. Population weights were calibrated through a model-based procedure to state, age group, sex, and race/ethnicity groupings, and variances were calculated accounting for the complex survey design. Thirteen years (2002–2014) of sample survey weights were used to produce national population estimates. Logistic regression analysis was used to examine linear temporal trends during 2002–2014. Each dichotomous indicator (e.g., marijuana use status: yes/no for each group) was separately regressed on year of survey to determine whether year could be a predictor of the likelihood of persons using marijuana over time. A level of α ≤0.05 was used to determine the statistical significance of the trends. The
† Non-Hispanic two or more races category includes persons who reported more than one category (i.e., white, black or African American, American Indian/Alaska Native, Native Hawaiian, Guamanian or Chamorro, Samoan, other Pacific Islander, Asian, or other).
§ Northeast: Connecticut, Maine, Massachusetts, New Hampshire, New Jersey, New York, Pennsylvania, Rhode Island, and Vermont. Midwest: Illinois, Indiana, Iowa, Kansas, Michigan, Minnesota, Missouri, Nebraska, North Dakota, Ohio, South Dakota, and Wisconsin. South: Alabama, Arkansas, Delaware, District of Columbia, Florida, Georgia, Kentucky, Louisiana, Maryland, Mississippi, North Carolina, Oklahoma, South Carolina, Tennessee, Texas, Virginia, and West Virginia. West: Alaska, Arizona, California, Colorado, Hawaii, Idaho, Montana, Nevada, New Mexico, Oregon, Utah, Washington, and Wyoming.

Surveillance Summaries
4 MMWR / September 2, 2016 / Vol. 65 / No. 11 US Department of Health and Human Services/Centers for Disease Control and Prevention
relative prevalence difference (diff ) was calculated between the 2002 and 2014 national estimates, as an overall measure of the relative change in marijuana use or other related indicator over the period. A plus sign (+) indicates an increase in prevalence, a minus sign (-) indicates a decrease in prevalence, and no sign indicates no difference. National estimates presented in the report have met the criteria for statistical reliability. The criteria used to define unreliability of direct estimates from NSDUH are determined on the basis of the prevalence (proportion estimates), relative standard error (RSE, defined as the ratio of the standard error over the estimate), and sample
size for each estimate. Estimates not meeting these criteria were suppressed and not included in the tables or figures, and suppressed estimates were not included in the statistical test analysis. Prevalence estimates were suppressed if any of the following occurred: 1) the prevalence estimate was <0.005% or >99.995%; 2) the RSE of the negative natural logarithm of the estimated proportion p (where p is the prevalence divided by 100) was >0.175 if the prevalence is ≤50%; 3) the RSE of the negative of the natural logarithm of (1-p) is >0.175 if the prevalence is >50%; 4) the actual sample size is <100; or 5) the effective sample size (defined as the sample size divided
BOX. Marijuana use and related indicators — National Survey on Drug Use and Health
Marijuana use• Past month use of marijuana (defined as those who reported
use of marijuana within 30 days preceding the date of interview): “How long has it been since you last used marijuana or hashish?” (Answers were restricted to within the past 30 days.)
• Past year use of marijuana (defined as those who reported use of marijuana within 12 months preceding the date of interview, including those who reported use of marijuana within 30 days preceding the date of interview): “How long has it been since you last used marijuana or hashish?” (Answers were restricted to more than 30 days ago but within the past 12 months or within the past 30 days.)
• Daily or almost daily (frequency) marijuana use in the past year (defined as those having used marijuana on 300 or more days in the past year): “On how many days in the past 12 months did you use marijuana or hashish?” and daily or almost daily (frequency) marijuana use in the past month (defined as those having used marijuana on 20 or more days in the past month): “During the past 30 days, on how many days did you use marijuana or hashish?” (Indicator was also restricted to respondents who reported past year and past month marijuana use.)
Marijuana initiation• Past year marijuana initiates (initiation) among persons at risk
for initiation (defined as those having first used marijuana within the 12-month period before the date of the interview). Recent initiation is determined by a combination of the respondent’s age at the time of interview, their reported age, year and month of first use and imputed day of first use, and date of birth. This indicator also includes mean age of past year initiates of marijuana use.
Perception of harm risk, approval, and attitudes• Perceived great risk and no risk from smoking marijuana
(defined as those who reported that smoking marijuana once a month and once or twice a week might cause harm [great risk] and might not cause harm [no risk]): “How much do people risk harming themselves physically and in other ways when they smoke marijuana once a month?” and “How much do people risk harming themselves physically and in other ways when they smoke marijuana once or twice a week?” (Answers were restricted to great risk and no risk.
• Perceived parental disapproval – (Defined as those aged 12–17 years [youth] who reported perceived parental disapproval as strongly disapprove or somewhat disapprove of trying marijuana once or twice; indicator was also restricted to respondents aged 12–17 years who reported past month marijuana use): “How do you think your parents would feel about you trying marijuana or hashish once or twice?”
– (Defined as those aged 12–17 years [youth] who reported perceived parental disapproval as strongly disapprove or somewhat disapprove of using marijuana once a month or more; indicator was also restricted to respondents aged 12–17 years who reported past month marijuana use): “How do you think your parents would feel about you using marijuana or hashish once a month or more?”
• Attitudes toward peers – (Defined as those aged 12–17 years [youth] who reported that they strongly disapprove or somewhat disapprove of peers trying marijuana once or twice; indicator was also restricted to respondents aged 12–17 years who reported past month marijuana use): “How do you feel about someone your age trying marijuana or hashish once or twice?”

Surveillance Summaries
MMWR / September 2, 2016 / Vol. 65 / No. 11 5US Department of Health and Human Services/Centers for Disease Control and Prevention
by the design effect) is <68. Additional information about NSDUH and its statistical methods and definitions is available elsewhere (9–11). Detailed national and state-level estimates on marijuana use and related indicators are available at http://www.samhsa.gov/atod/marijuana.
ResultsSample Size, Response Rates, and
Population EstimatesDuring 2002–2014, NSDUH data were collected from
884,742 completed individual respondent interviews (68,057 annual average). Annual average weighted response rates for interviews were 74.8%, for an estimated total of 250,065,195 persons of the U.S. population during the 2002–2014 period. Person-level weights were determined on the basis of probabilities of selection, nonresponse adjustments, and poststratification to population estimates obtained from the Census Bureau. Table 1 displays the survey year distributions of sample size, weighted interview rates, and population estimates in NSDUH during 2002–2014.
Marijuana UsePast Month Use
In 2014, the estimated national prevalence of past month marijuana use among persons aged ≥12 years was 8.4%. From 2002 to 2014, the prevalence of past month marijuana use increased by 35.0% (from 6.2% in 2002 to 8.4% in 2014; p<0.001) among persons aged ≥12 years. The prevalence of past month marijuana use increased among persons aged ≥18 years; the increase was greatest among adults aged ≥55 years (Table 2). In general, the prevalence of past month marijuana use increased across the majority of selected demographic characteristics (i.e., sex, race/ethnicity, highest level of education completed, current employment status, and U.S. geographic region) (Figures 1–5).
Past Year UseIn 2014, the estimated national prevalence of past year
marijuana use among persons aged ≥12 years was 13.2%. From 2002 to 2014, the prevalence of marijuana use in the past year increased by 20.0% (from 11.0% in 2002 to 13.2% in 2014; p<0.001) among persons aged ≥12 years. The prevalence of past year marijuana use decreased by 17.0% (from 15.8% in 2002 to 13.1% in 2014; p<0.001) among persons aged
BOX. (Continued) Marijuana use and related indicators — National Survey on Drug Use and Health
– (Defined as those aged 12–17 years [youth] who reported that they strongly disapprove or somewhat disapprove of peers using marijuana once a month or more; indicator was also restricted to respondents aged 12–17 years who reported past month marijuana use): “How do you feel about someone your age using marijuana once a month or more?” (For the 2002–2014 NSDUH surveys, the words “or hashish” were omitted.)
Perception of availability and mode of acquisition• Perceived availability (defined as those who reported
that it would be fairly easy or very easy for them to obtain marijuana if they wanted some): “How difficult or easy would it be for you to get some marijuana, if you wanted some?” (Answers were restricted to fairly easy or very easy.)
• Mode of acquisition (defined as those who reported how they got the marijuana they used for the last time [i.e., bought it, traded something for it, got it for free or shared with someone else, or grew it yourself ]. (This question was only asked of those respondents indicating use of marijuana in the past 12 months): “Now think about the last time you used marijuana. How did you get this marijuana?”
Marijuana dependence and abuse• The questions related to dependence within the past
12 months ask about health and emotional problems associated with substance use, unsuccessful attempts to reduce use, tolerance, withdrawal, reducing other activities to use substances, spending a lot of time engaging in activities related to substance use, or using the substance in greater quantities or for a longer time than intended. The questions related to abuse within the past 12 months ask about problems at work, home, and school; problems with family or friends; physical danger; and trouble with the law because of substance use. (Indicator was also restricted to respondents who reported past year marijuana use.)
Marijuana possession–criminal justice• Perception of legal penalty for marijuana possession
(defined as those who reported their perception of the maximum legal penalty in their state of residence for first offense possession of an ounce or less of marijuana for their own use): “What is the maximum legal penalty in [your state] for first offense possession of an ounce or less of marijuana for your own use?”
Surveillance Summaries
6 MMWR / September 2, 2016 / Vol. 65 / No. 11 US Department of Health and Human Services/Centers for Disease Control and Prevention
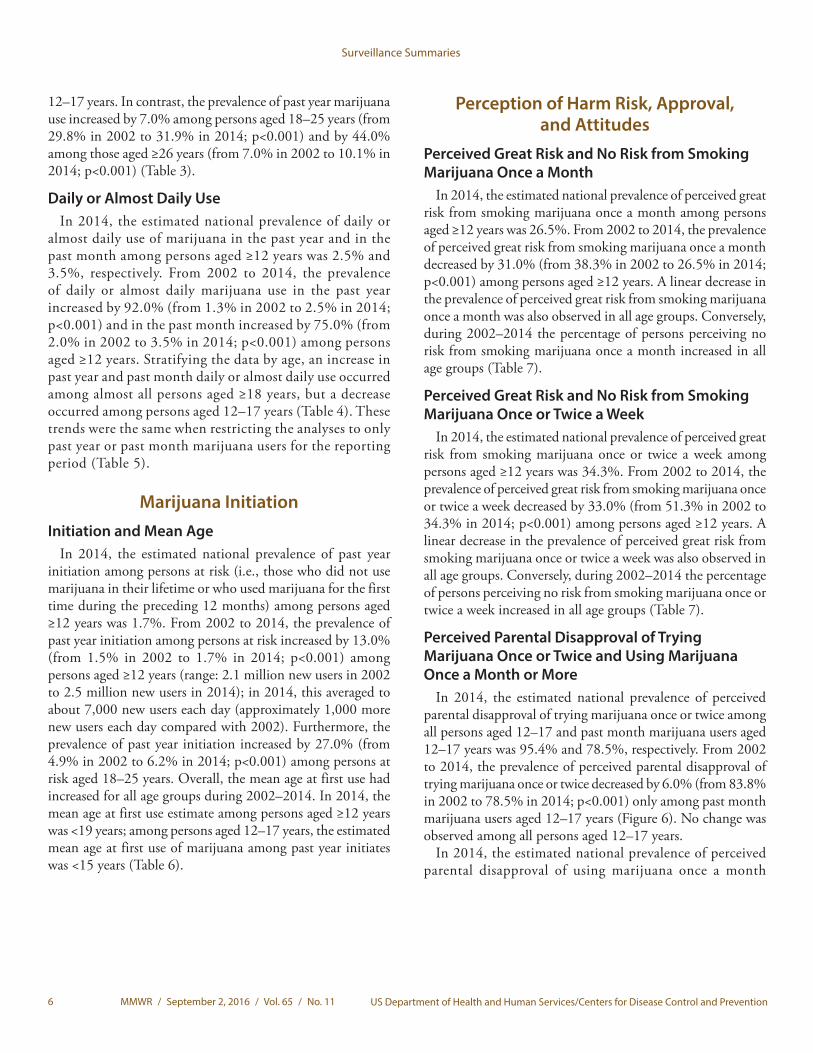
12–17 years. In contrast, the prevalence of past year marijuana use increased by 7.0% among persons aged 18–25 years (from 29.8% in 2002 to 31.9% in 2014; p<0.001) and by 44.0% among those aged ≥26 years (from 7.0% in 2002 to 10.1% in 2014; p<0.001) (Table 3).
Daily or Almost Daily UseIn 2014, the estimated national prevalence of daily or
almost daily use of marijuana in the past year and in the past month among persons aged ≥12 years was 2.5% and 3.5%, respectively. From 2002 to 2014, the prevalence of daily or almost daily marijuana use in the past year increased by 92.0% (from 1.3% in 2002 to 2.5% in 2014; p<0.001) and in the past month increased by 75.0% (from 2.0% in 2002 to 3.5% in 2014; p<0.001) among persons aged ≥12 years. Stratifying the data by age, an increase in past year and past month daily or almost daily use occurred among almost all persons aged ≥18 years, but a decrease occurred among persons aged 12–17 years (Table 4). These trends were the same when restricting the analyses to only past year or past month marijuana users for the reporting period (Table 5).
Marijuana InitiationInitiation and Mean Age
In 2014, the estimated national prevalence of past year initiation among persons at risk (i.e., those who did not use marijuana in their lifetime or who used marijuana for the first time during the preceding 12 months) among persons aged ≥12 years was 1.7%. From 2002 to 2014, the prevalence of past year initiation among persons at risk increased by 13.0% (from 1.5% in 2002 to 1.7% in 2014; p<0.001) among persons aged ≥12 years (range: 2.1 million new users in 2002 to 2.5 million new users in 2014); in 2014, this averaged to about 7,000 new users each day (approximately 1,000 more new users each day compared with 2002). Furthermore, the prevalence of past year initiation increased by 27.0% (from 4.9% in 2002 to 6.2% in 2014; p<0.001) among persons at risk aged 18–25 years. Overall, the mean age at first use had increased for all age groups during 2002–2014. In 2014, the mean age at first use estimate among persons aged ≥12 years was <19 years; among persons aged 12–17 years, the estimated mean age at first use of marijuana among past year initiates was <15 years (Table 6).
Perception of Harm Risk, Approval, and Attitudes
Perceived Great Risk and No Risk from Smoking Marijuana Once a Month
In 2014, the estimated national prevalence of perceived great risk from smoking marijuana once a month among persons aged ≥12 years was 26.5%. From 2002 to 2014, the prevalence of perceived great risk from smoking marijuana once a month decreased by 31.0% (from 38.3% in 2002 to 26.5% in 2014; p<0.001) among persons aged ≥12 years. A linear decrease in the prevalence of perceived great risk from smoking marijuana once a month was also observed in all age groups. Conversely, during 2002–2014 the percentage of persons perceiving no risk from smoking marijuana once a month increased in all age groups (Table 7).
Perceived Great Risk and No Risk from Smoking Marijuana Once or Twice a Week
In 2014, the estimated national prevalence of perceived great risk from smoking marijuana once or twice a week among persons aged ≥12 years was 34.3%. From 2002 to 2014, the prevalence of perceived great risk from smoking marijuana once or twice a week decreased by 33.0% (from 51.3% in 2002 to 34.3% in 2014; p<0.001) among persons aged ≥12 years. A linear decrease in the prevalence of perceived great risk from smoking marijuana once or twice a week was also observed in all age groups. Conversely, during 2002–2014 the percentage of persons perceiving no risk from smoking marijuana once or twice a week increased in all age groups (Table 7).
Perceived Parental Disapproval of Trying Marijuana Once or Twice and Using Marijuana Once a Month or More
In 2014, the estimated national prevalence of perceived parental disapproval of trying marijuana once or twice among all persons aged 12–17 and past month marijuana users aged 12–17 years was 95.4% and 78.5%, respectively. From 2002 to 2014, the prevalence of perceived parental disapproval of trying marijuana once or twice decreased by 6.0% (from 83.8% in 2002 to 78.5% in 2014; p<0.001) only among past month marijuana users aged 12–17 years (Figure 6). No change was observed among all persons aged 12–17 years.
In 2014, the estimated national prevalence of perceived parental disapproval of using marijuana once a month
Surveillance Summaries
MMWR / September 2, 2016 / Vol. 65 / No. 11 7US Department of Health and Human Services/Centers for Disease Control and Prevention
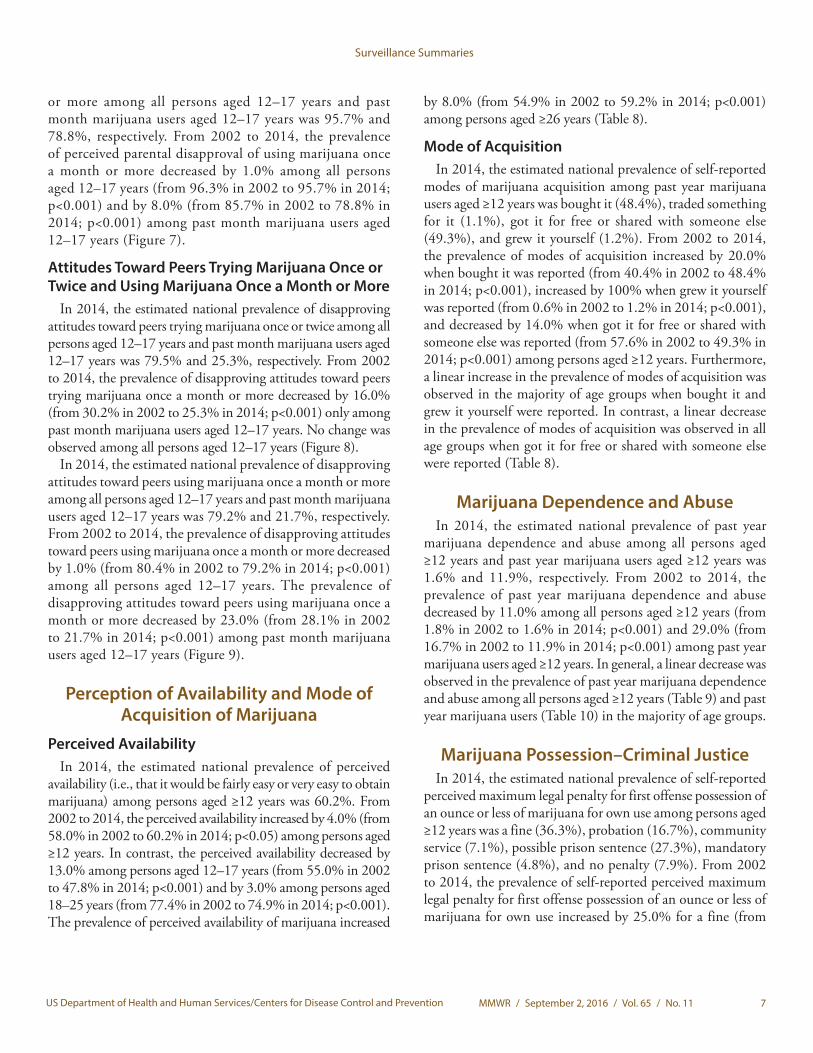
or more among all persons aged 12–17 years and past month marijuana users aged 12–17 years was 95.7% and 78.8%, respectively. From 2002 to 2014, the prevalence of perceived parental disapproval of using marijuana once a month or more decreased by 1.0% among all persons aged 12–17 years (from 96.3% in 2002 to 95.7% in 2014; p<0.001) and by 8.0% (from 85.7% in 2002 to 78.8% in 2014; p<0.001) among past month marijuana users aged 12–17 years (Figure 7).
Attitudes Toward Peers Trying Marijuana Once or Twice and Using Marijuana Once a Month or More
In 2014, the estimated national prevalence of disapproving attitudes toward peers trying marijuana once or twice among all persons aged 12–17 years and past month marijuana users aged 12–17 years was 79.5% and 25.3%, respectively. From 2002 to 2014, the prevalence of disapproving attitudes toward peers trying marijuana once a month or more decreased by 16.0% (from 30.2% in 2002 to 25.3% in 2014; p<0.001) only among past month marijuana users aged 12–17 years. No change was observed among all persons aged 12–17 years (Figure 8).
In 2014, the estimated national prevalence of disapproving attitudes toward peers using marijuana once a month or more among all persons aged 12–17 years and past month marijuana users aged 12–17 years was 79.2% and 21.7%, respectively. From 2002 to 2014, the prevalence of disapproving attitudes toward peers using marijuana once a month or more decreased by 1.0% (from 80.4% in 2002 to 79.2% in 2014; p<0.001) among all persons aged 12–17 years. The prevalence of disapproving attitudes toward peers using marijuana once a month or more decreased by 23.0% (from 28.1% in 2002 to 21.7% in 2014; p<0.001) among past month marijuana users aged 12–17 years (Figure 9).
Perception of Availability and Mode of Acquisition of Marijuana
Perceived AvailabilityIn 2014, the estimated national prevalence of perceived
availability (i.e., that it would be fairly easy or very easy to obtain marijuana) among persons aged ≥12 years was 60.2%. From 2002 to 2014, the perceived availability increased by 4.0% (from 58.0% in 2002 to 60.2% in 2014; p<0.05) among persons aged ≥12 years. In contrast, the perceived availability decreased by 13.0% among persons aged 12–17 years (from 55.0% in 2002 to 47.8% in 2014; p<0.001) and by 3.0% among persons aged 18–25 years (from 77.4% in 2002 to 74.9% in 2014; p<0.001). The prevalence of perceived availability of marijuana increased
by 8.0% (from 54.9% in 2002 to 59.2% in 2014; p<0.001) among persons aged ≥26 years (Table 8).
Mode of AcquisitionIn 2014, the estimated national prevalence of self-reported
modes of marijuana acquisition among past year marijuana users aged ≥12 years was bought it (48.4%), traded something for it (1.1%), got it for free or shared with someone else (49.3%), and grew it yourself (1.2%). From 2002 to 2014, the prevalence of modes of acquisition increased by 20.0% when bought it was reported (from 40.4% in 2002 to 48.4% in 2014; p<0.001), increased by 100% when grew it yourself was reported (from 0.6% in 2002 to 1.2% in 2014; p<0.001), and decreased by 14.0% when got it for free or shared with someone else was reported (from 57.6% in 2002 to 49.3% in 2014; p<0.001) among persons aged ≥12 years. Furthermore, a linear increase in the prevalence of modes of acquisition was observed in the majority of age groups when bought it and grew it yourself were reported. In contrast, a linear decrease in the prevalence of modes of acquisition was observed in all age groups when got it for free or shared with someone else were reported (Table 8).
Marijuana Dependence and AbuseIn 2014, the estimated national prevalence of past year
marijuana dependence and abuse among all persons aged ≥12 years and past year marijuana users aged ≥12 years was 1.6% and 11.9%, respectively. From 2002 to 2014, the prevalence of past year marijuana dependence and abuse decreased by 11.0% among all persons aged ≥12 years (from 1.8% in 2002 to 1.6% in 2014; p<0.001) and 29.0% (from 16.7% in 2002 to 11.9% in 2014; p<0.001) among past year marijuana users aged ≥12 years. In general, a linear decrease was observed in the prevalence of past year marijuana dependence and abuse among all persons aged ≥12 years (Table 9) and past year marijuana users (Table 10) in the majority of age groups.
Marijuana Possession–Criminal JusticeIn 2014, the estimated national prevalence of self-reported
perceived maximum legal penalty for first offense possession of an ounce or less of marijuana for own use among persons aged ≥12 years was a fine (36.3%), probation (16.7%), community service (7.1%), possible prison sentence (27.3%), mandatory prison sentence (4.8%), and no penalty (7.9%). From 2002 to 2014, the prevalence of self-reported perceived maximum legal penalty for first offense possession of an ounce or less of marijuana for own use increased by 25.0% for a fine (from

Surveillance Summaries
8 MMWR / September 2, 2016 / Vol. 65 / No. 11 US Department of Health and Human Services/Centers for Disease Control and Prevention
29.1% in 2002 to 36.3% in 2014; p<0.001) and by 119.0% for no penalty¶ (from 3.6% in 2006 to 7.9% in 2014; p<0.001). In contrast, the prevalence of perceived maximum legal penalty for first offense possession of an ounce or less of marijuana for own use decreased by 6.0% for probation (from 17.8% in 2002 to 16.7% in 2014; p<0.001), by 23.0% for community service (from 9.2% in 2002 to 7.1% in 2014; p<0.001), by 26.0% for possible prison sentence (from 37.0% in 2002 to 27.3% in 2014; p<0.001), and by 30.0% for mandatory prison sentence (from 6.9% in 2002 to 4.8% in 2014; p<0.001). In general, a linear increase in the prevalence of perceived maximum legal penalty of a fine and no penalty was observed in all age groups. In contrast, a linear decrease in perceived maximum legal penalty of probation, community service, possible prison sentence, and mandatory prison sentence was observed in the majority of age groups (Table 11).
DiscussionThis report represents, for the first time, an overview of national estimates for marijuana use and other related indicators among the U.S. noninstitutionalized civilian population aged ≥12 years using 2002–2014 NSDUH data. The report includes at least seven important findings. First, in 2014, a total of 2.5 million persons aged ≥12 years had used marijuana for the first time during the preceding 12 months, an average of approximately 7,000 new users each day. Second, during 2002–2014, the prevalence of marijuana use during the past month, past year, and daily or almost daily increased among persons aged ≥18 years, but not among those aged 12–17 years. Third, among persons aged ≥12 years, the prevalence of perceived great risk from smoking marijuana once or twice a week and once a month decreased and the prevalence of perceived no risk increased. Fourth, the prevalence of past year marijuana dependence and abuse decreased, except among persons aged ≥26 years. Fifth, among persons aged ≥12 years, the percentage reporting that marijuana was fairly easy or very easy to obtain increased. Sixth, the percentage of persons aged ≥12 years reporting the mode of acquisition of marijuana was buying it and growing it increased versus getting it for free and sharing it. Finally, the percentage of persons aged ≥12 years reporting that the perceived maximum legal penalty for the possession of an ounce or less of marijuana in their state is a fine and no penalty increased versus probation, community service, possible prison sentence, and mandatory prison sentence.
During 2002–2014, national estimates for marijuana use have decreased, specifically the past month, past year, and daily
or almost daily marijuana use and past year new initiates among the U.S. population aged 12–17 years. Concurrently, state laws and policies regarding medical or recreational marijuana use have changed (13). Although these behavioral changes in the U.S. population are temporally related to the implementation of new state laws and policies, findings cannot be used to infer causality. Legalization of recreational marijuana in some states is relatively recent, and continued monitoring of marijuana use and frequency of use among youth is needed because these effects might be delayed. Use patterns among youth do not yet provide an accurate reflection of how legalization in some states will affect national estimates on marijuana use. In the interim, additional evaluation might determine that community-based substance use prevention efforts have contributed to this decline.
Since 2002, the prevalence of marijuana use and initiation among U.S. youth has declined. However, findings also indicate that among youth and adults, the prevalence of perceived great risk from smoking marijuana has steadily decreased and the prevalence of perceived no risk from smoking marijuana once or twice a week and once a month has increased. In previous national survey analyses, perception of risk has been inversely associated with prevalence of use (14–17). The data in this report document that the inverse association between perception of great risk from smoking marijuana and prevalence of use was observed only among adults. The fact that this inverse association was not found among youth is notable, given the hypothesis that legalization of medical and recreational marijuana use could lead to increases in youth initiation. One possible explanation could be that changes in state laws might require more time to be reflected in measurable national changes in use among youth. In addition, despite increased perceptions of no risk from smoking marijuana, obtaining marijuana nationally remains more difficult for persons aged 12–17 years than for those aged ≥18, which could explain the lower prevalence of marijuana use and initiation in this age group. In fact, since 2002 the perceived availability (i.e., fairly easy or very easy to obtain marijuana) among persons aged 12–17 and 18–25 years has decreased. However, more local or regional surveillance data are needed to better understand how retail legalization might affect accessibility. Identifying and implementing policies that continue to restrict youth access to marijuana remain important. Ongoing public health prevention efforts are warranted to prevent increases in marijuana initiation and use among youth.
Although NSDUH data suggest increases in daily and almost daily use among adults (both in the overall population and among adult marijuana users), they also suggest steady decreases in the prevalence of marijuana dependence and abuse among adult marijuana users since 2002. Typically,
¶ Data only available starting with 2006 NSDUH survey cycles.

Surveillance Summaries
MMWR / September 2, 2016 / Vol. 65 / No. 11 9US Department of Health and Human Services/Centers for Disease Control and Prevention
increased prevalence of marijuana use has been linked to increased prevalence of marijuana dependence or abuse (17). These findings suggest that refined measures of frequency (e.g., number of times per day, week, month, or year) of use might be needed to better quantify how often and what types of products (e.g., inhaled, eaten, infused, drank) persons are using to better estimate and understand marijuana consumption in the United States. With changes in medical marijuana laws (13) and, in particular, state laws or policies allowing limited access to low percentages of delta-9-tetrahydrocannabinol (THC) or cannabidiol (CBD), persons who use marijuana daily for medical reasons might be using strains that pose lower risk for dependence or abuse. As marijuana use becomes more commonplace, different patterns of use behavior might account for a substantial proportion of the increase in marijuana use among persons aged ≥18 years. Therefore, more research and surveillance data on marijuana use, frequency of use, and dependence are warranted.
Public Health ImplicationsReducing Marijuana Use Among Youth
Heavy or frequent marijuana use has a negative effect on cognitive development, academic achievement, and other health risk behaviors among youth (2–8). Therefore, strategies to prevent youth access and use are still needed. Under the Controlled Substances Act** marijuana is still considered an illegal Schedule I drug. However, since 1996, approximately 40 states have legalized marijuana or allowed the use of products containing CBD, a less-psychoactive compound of the cannabis plant, for medical conditions, retail sales, or both (four states have legalized retail marijuana sales, the District of Columbia has legalized personal use and home cultivation, 23 states and the District of Columbia have legalized medical marijuana use, and 17 states have legalized CBD use) (13). In 2013, the U.S. Department of Justice issued guidance††
on enforcement priorities that included preventing the distribution of marijuana to minors. Although recent trend data from NSDUH regarding marijuana use at the aggregate national level provides some short-term reassurance that national-level increases in use among persons aged 12–17 years have not yet resulted from the policy change, any reassurance is tempered by the knowledge that this situation might not be stable. Changes allowing for legal medical or recreational
marijuana use, combined with the decreased prevalence of perceived great risk from smoking marijuana, potentially could lead to increased use patterns in other age groups. In addition, a study of confiscated marijuana by the Drug Enforcement Administration indicated an increase in potency (i.e., higher levels of THC, the psychoactive compound) of the cannabis plant, potentially posing higher risk for adverse health consequences from marijuana use, particularly among youth (18). Given the variability of state-level legalization of medical and recreational marijuana (13) and the increased potency of the marijuana plant (18), improved surveillance and increased attention to public health prevention strategies are warranted at the federal, state, and local levels. Regardless of whether legalization of medical and recreational marijuana expands or diminishes, public health and other organizations can consider important steps (e.g., educational and prevention activities) to minimize health harms.
Future DirectionsOn the basis of findings from this report and awareness of
state-level legalization of medical and recreational marijuana, the implications for public health surveillance, research, and practice are numerous. These implications include quality, relevance, and timeliness of surveillance capacity in the United States at the national, state, and local levels; initiation and use of marijuana among youth; and minimization and prevention of health harms and disparities related to marijuana initiation, use, and abuse, especially among populations at high risk (e.g., pregnant women, racial and ethnic minorities, and persons with cormorbid mental health and other substance abuse conditions).
Quality, Relevance, and Timeliness of Surveillance Capacity
NSDUH monitors trends on behavioral health measures, including marijuana use and related indicators. However, legislative and policy changes across states might require modifications to national- and state-level surveys (e.g., NSDUH, Behavioral Risk Factor Surveillance System, Pregnancy Risk Assessment Monitoring System, and Youth Risk Behavior Survey) to monitor behavioral health changes in the United States. Additional questions about mode of marijuana use (e.g., smoked, vaped, dabbed, eaten, or drunk), specific quantities of marijuana used (not just number of days of use), and reasons for use (e.g., medical, recreational, or both) could be added to existing surveillance systems or launched in new systems. In addition to traditional public health surveillance, innovative partnerships using health care systems, hospital and emergency department databases, rapid-cycle surveillance
** Comprehensive Drug Abuse Prevention and Control Act of 1970, Pub. L. No. 91-513, 84 Stat. 1236 (Oct. 27, 1970).
†† U.S. Department of Justice Office of the Deputy Attorney General “Memorandum for all United States Attorneys: Guidance Regarding Marijuana Enforcement.” Avai lable at https : / /www.just ice .gov/ i so/opa/resources/3052013829132756857467.pdf.

Surveillance Summaries
10 MMWR / September 2, 2016 / Vol. 65 / No. 11 US Department of Health and Human Services/Centers for Disease Control and Prevention
tools, and data from nonhealth-care sectors (e.g., education, transportation, and law enforcement) could more fully assess the prevalence and public health impact of marijuana use in the United States. Furthermore, it is important to understand local community risk and protective factors associated with marijuana initiation and use among youth. Guidelines to recognize these factors and ways to identify multilevel factors within a community to reduce marijuana use among youth have been published by SAMHSA (19–21).
Many health risks, especially adverse effects associated with marijuana use (e.g., respiratory cancers, depressive disorders, and suicide) are still not well understood (3). In March 2016, the National Institute on Drug Abuse convened a group of experts to review the current body of science.§§ CDC, working with other federal, state, and nongovernmental organizations, commissioned a National Academy of Sciences evidence summary review, including a vison for future research needs. Other federal agencies, including National Institutes of Health, SAMHSA, and the Food and Drug Administration, engaged with academic institutions and other stakeholders to increase the depth and breadth of knowledge. More information about the harms and potential benefits of marijuana and its components could be obtained from enhancements to established behavioral health surveillance systems or state or local surveys.
Youth Initiation and Use of MarijuanaFindings from this report suggest progress in preventing
marijuana use among youth (19–21), but continued prevention efforts are needed to address low perceived risk for harm and perceived marijuana availability (i.e., less likely to obtain marijuana). The evidence for significant short- and long-term negative effects from marijuana use is consistent and strong especially at younger ages when the brain is still developing (2–5,7). To prevent marijuana initiation and use among youth, public health professionals could consider modifying or augmenting successful policies that target tobacco, alcohol, and other substances used or abused by youth. For example, as previously done with tobacco prevention campaigns, carefully designed and well-funded public health campaigns at the local, state, and national levels warning about the negative consequences of marijuana use could help prevent increases in youth initiation. Taxation strategies for legally purchased marijuana that dedicate funding for education and treatment and help maintain price barriers might be important in preventing youth initiation. Finally, in states
allowing marijuana sales to adults, strict regulations and enforcement of under-21 sales and marketing restrictions remain necessary to prevent adverse effects associated with marijuana use. Additional research into these and other policy-based approaches to prevent youth initiation, use, and abuse of marijuana could be used to develop new interventions.
Minimization and Prevention of Health Harms and Health Disparities Related to Initiation, Use, and Abuse of Marijuana
Data from NSDUH demonstrate disparities in use and abuse of marijuana in some age groups. This report did not focus on disparities related to socioeconomic status, race/ethnicity, and other sociodemographic variables, but rather on monitoring national trends during 2002–2014 by three age groups. National (and particularly state-level) data from NSDUH suggest important differences in marijuana use and abuse among youth and other subpopulations. These subpopulations merit special attention in marijuana-related public health programs, in terms of public education and policy development. Oversampling high-risk populations (e.g., pregnant and breastfeeding women, racial and ethnic minorities, the homeless population, and persons with comorbid mental health and other substance abuse conditions) is particularly important as marijuana state laws and policies change.
LimitationsThe findings in this report are subject to at least four
limitations. First, they are limited to the 2002–2014 survey cycles. Substantial methodological changes in NSDUH during 1999–2001 prevent trend analysis before 2002. Second, substance use might be underestimated due to self-report bias and social desirability bias. Third, these analyses are limited to household respondents, which might have excluded some groups at high risk (e.g., homeless persons) for marijuana use. Finally, NSDUH’s question on perception of great risk from smoking marijuana is subjective. The question does not distinguish between the respondent’s own use of marijuana once a month and once or twice a week, or the general population. Additional cognitive testing might help clarify how respondents conceptualize the question.
ConclusionSince 1971, NSDUH has been a principal national data
source reporting on the use of illicit drugs, alcohol, and tobacco. Data can be used to monitor marijuana use and behavior at the national and state levels and to help public
§§ Marijuana and Cannabinoids: A Neuroscience Research Summit was held March 22–23, 2016, at the National Institutes of Health, Bethesda, MD. Meeting summary is available at https://www.drugabuse.gov/sites/default/files/briefmjsummitmeetingsummary.pdf.
Surveillance Summaries
MMWR / September 2, 2016 / Vol. 65 / No. 11 11US Department of Health and Human Services/Centers for Disease Control and Prevention
health officials identify populations with or at risk for marijuana use disorders or dependence. Finally, these data can help monitor progress and challenges remaining toward achieving national Healthy People 2020 (22) and state objectives for marijuana use and perceptions of harm risk among youth. These data can be particularly important for monitoring, planning, implementing, and evaluating behavioral health indicators on marijuana use and perceptions, especially in at-risk populations. Nuances of marijuana laws across states might suggest additional questions for national and state surveys on substance use. Timely and constant monitoring of behavioral measures trends is vital for effective and targeted public health interventions. Because of increases in perception of no risk from smoking marijuana, increases in past month marijuana use among adults, and state-level law and policy changes, further attention to marijuana use among youth and abuse and dependence among adults is warranted.
Acknowledgments
Arthur Hughes, MS, Roeber Carter, PhD, Janet Heekin, MLS, CBHSQ, SAMHSA; Liz Copello, Michael Penne, MPH, Brenda Porter, RTI International.
References 1. Substance Abuse and Mental Health Services Administration. Results
from the 2013 National Survey on Drug Use and Health: summary of national findings. Rockville, MD: Substance Abuse and Mental Health Services Administration; 2014.
2. Volkow ND, Baler RD, Compton WM, Weiss SR. Adverse health effects of marijuana use. N Engl J Med 2014;370:2219–27. http://dx.doi.org/10.1056/NEJMra1402309
3. Hall W, Degenhardt L. The adverse health effects of chronic cannabis use. Drug Test Anal 2014;6:39–45. http://dx.doi.org/10.1002/dta.1506
4. Greydanus DE, Hawver EK, Greydanus MM, Merrick J. Marijuana: current concepts(†). Front Public Health 2013;1:42. http://dx.doi.org/10.3389/fpubh.2013.00042
5. National Institute on Drug Abuse. Research Report Series: Marijuana. Bethesda, MD: National Institutes of Health; 2015. NIH Publication Number 15–3859.
6. Blanco C, Hasin DS, Wall MM, et al. Cannabis use and risk of psychiatric disorders: prospective evidence from a US national longitudinal study. JAMA Psychiatry 2016;73:388–95.
7. Batalla A, Bhattacharyya S, Yücel M, et al. Structural and functional imaging studies in chronic cannabis users: a systematic review of adolescent and adult findings. PLoS One 2013;8:e55821. http://dx.doi.org/10.1371/journal.pone.0055821
8. Hartman RL, Huestis MA. Cannabis effects on driving skills. Clin Chem 2013;59:478–92. http://dx.doi.org/10.1373/clinchem.2012.194381
9. Substance Abuse and Mental Health Services Administration, Center for Behavioral Health Statistics and Quality. National Survey on Drug Use and Health (NSDUH). http://www.samhsa.gov/data/population-data-nsduh/reports
10. Center for Behavioral Health Statistics and Quality. National Survey on Drug Use and Health (NSDUH): summary of methodological studies, 1971–2014; 2014. Substance Abuse and Mental Health Services Administration, Rockville, MD.
11. Center for Behavioral Health Statistics and Quality. 2014 National Survey on Drug Use and Health: Methodological summary and definitions; 2015. Substance Abuse and Mental Health Services Administration Rockville, MD.
12. Center for Behavioral Health Statistics and Quality. National Survey on Drug Use and Health: 2014 and 2015 redesign changes. Substance Abuse and Mental Health Services Administration, Rockville, MD; 2015.
13. National Conference of State Legislatures; 2016. http://www.ncsl.org/research/health/state-medical-marijuana-laws.aspx
14. Pacek LR, Mauro PM, Martins SS. Perceived risk of regular cannabis use in the United States from 2002 to 2012: differences by sex, age, and race/ethnicity. Drug Alcohol Depend 2015;149:232–44. http://dx.doi.org/10.1016/j.drugalcdep.2015.02.009
15. Okaneku J, Vearrier D, McKeever RG, LaSala GS, Greenberg MI. Change in perceived risk associated with marijuana use in the United States from 2002 to 2012. Clin Toxicol (Phila) 2015;53:151–5. http://dx.doi.org/10.3109/15563650.2015.1004581
16. Johnston LD, O’Malley PM, Miech RA, Bachman JG, Schulenberg JE. Monitoring the future: national survey results on drug use 1975–2014: overview, key findings on adolescent drug use. Ann Arbor, MI: Institute for Social Research, The University of Michigan; 2015.
17. Hasin DS, Saha TD, Kerridge BT, et al. Prevalence of marijuana use disorders in the United States between 2001–2002 and 2012–2013. JAMA Psychiatry 2015;72:1235–42. http://dx.doi.org/10.1001/jamapsychiatry.2015.1858
18. ElSohly MA, Mehmedic Z, Foster S, Gon C, Chandra S, Church JC. Changes in cannabis potency over the last 2 decades (1995–2014): analysis of current data in the United States. Biol Psychiatry 2016;79:613–9. http://dx.doi.org/10.1016/j.biopsych.2016.01.004
19. Substance Abuse and Mental Health Services Administration Center for Application of Prevention Technologies. Risk and protective factors associated with youth marijuana use; 2014. http://www.samhsa.gov/capt/tools-learning-resources/risk-protective-factors-associated-youth-marijuana-use
20. Substance Abuse and Mental Health Services Administration Center for Application of Prevention Technologies. Prevention programs that address youth marijuana use; 2014. http://www.samhsa.gov/capt/tools-learning-resources/prevention-programs-address-youth-marijuana-use
21. Substance Abuse and Mental Health Services Administration Center for Application of Prevention Technologies. Strategies and intervention to prevent youth marijuana use: an at-a-glance resource tool; 2014. http://www.samhsa.gov/capt/tools-learning-resources/strategies-interventions-prevent-youth-marijuana-use
22. US Department of Health and Human Services Office of Disease Prevention and Health Promotion. Healthy People 2020 substance abuse objectives. https://www.healthypeople.gov/2020/topics-objectives/topic/substance-abuse

Surveillance Summaries
12 MMWR / September 2, 2016 / Vol. 65 / No. 11 US Department of Health and Human Services/Centers for Disease Control and Prevention
1
0
3
5
7
9
11
13
15
100
2002 2003 2004 2005 2006 2007 2008 2009 2010 2011 2012 2013 2014
Perc
enat
ge
Year
MaleFemale
FIGURE 1. Percentage of past month marijuana use* among persons aged ≥12 years, by sex† — National Survey on Drug Use and Health, United States, 2002–2014
* Past month marijuana use is defined as those who reported use of marijuana within 30 days preceding the date of interview.† Percentage increase over time is statistically significant for males and females (logistic regression, p<0.001).

Surveillance Summaries
MMWR / September 2, 2016 / Vol. 65 / No. 11 13US Department of Health and Human Services/Centers for Disease Control and Prevention
0
10
20
30
40
50
60
70
80
90
100
Perc
enta
ge
Year
HispanicNon-Hispanic two or more racesNon-Hispanic AsianNon-Hispanic Hawaiian/Other Paci�c IslanderNon-Hispanic American Indian/Alaska NativeNon-Hispanic blackNon-Hispanic white
2002 2003 2004 2005 2006 2007 2008 2009 2010 2011 2012 2013 2014
FIGURE 2. Percentage of past month marijuana use* among persons aged ≥12 years, by race/ethnicity† — National Survey on Drug Use and Health, United States, 2002–2014
* Past month marijuana use is defined as those who reported use of marijuana within 30 days preceding the date of interview.† Percentage increase over time is statistically significant for all race/ethnicity groups except non-Hispanic American Indian/Alaska Native and non-Hispanic Hawaiian/
Other Pacific Islander (logistic regression p≤0.01). For 2004, the estimate for non-Hispanic Hawaiian/Other Pacific Islander was suppressed because of small sample size and was not reported.

Surveillance Summaries
14 MMWR / September 2, 2016 / Vol. 65 / No. 11 US Department of Health and Human Services/Centers for Disease Control and Prevention
1
0
3
5
7
9
11
13
15
100
2002 2003 2004 2005 2006 2007 2008 2009 2010 2011 2012 2013 2014
Perc
enta
ge
Year
< High school
High school graduate
Some college
College graduate
FIGURE 3. Percentage of past month marijuana use* among persons aged ≥18 years, by highest level of education completed† — National Survey on Drug Use and Health, United States, 2002–2014
* Past month marijuana use is defined as those who reported use of marijuana within 30 days preceding the date of interview.† Percentage increase over time is statistically significant for all education levels (logistic regression, p<0.001).

Surveillance Summaries
MMWR / September 2, 2016 / Vol. 65 / No. 11 15US Department of Health and Human Services/Centers for Disease Control and Prevention
0
2
4
6
8
10
12
14
16
18
20
100
2002 2003 2004 2005 2006 2007 2008 2009 2010 2011 2012 2013 2014
Perc
enta
ge
Year
Full-timePart-timeUnemployedOther
FIGURE 4. Percentage of past month marijuana use* among persons aged ≥18 years, by current employment status† — National Survey on Drug Use and Health, United States, 2002–2014
* Past month marijuana use is defined as those who reported use of marijuana within 30 days preceding the date of interview.† Percentage increase over time is statistically significant for all current employment statuses except unemployed status (logistic regression, p<0.001).

Surveillance Summaries
16 MMWR / September 2, 2016 / Vol. 65 / No. 11 US Department of Health and Human Services/Centers for Disease Control and Prevention
1
0
3
5
7
9
11
13
15
100
2002 2003 2004 2005 2006 2007 2008 2009 2010 2011 2012 2013 2014
Perc
enta
ge
Year
NortheastMidwestSouthWest
FIGURE 5. Percentage of past month marijuana use* among persons aged ≥12 years, by U.S. geographic region† — National Survey on Drug Use and Health, United States, 2002–2014
* Past month marijuana use is defined as those who reported use of marijuana within 30 days preceding the date of interview.† Percentage increase over time is statistically significant for all geographic regions (logistic regression, p<0.001). Regions are as defined by the Census Bureau.

Surveillance Summaries
MMWR / September 2, 2016 / Vol. 65 / No. 11 17US Department of Health and Human Services/Centers for Disease Control and Prevention
0
60
80
100
2002 2003 2004 2005 2006 2007 2008 2009 2010 2011 2012 2013 2014
Perc
enta
ge
Year
All Past month marijuana users
FIGURE 6. Percentage of perceived parental disapproval of trying marijuana once or twice* among all persons aged 12–17 years and past month marijuana users† aged 12–17 years — National Survey on Drug Use and Health, United States, 2002–2014
* Perceived parental disapproval of trying marijuana once or twice is defined as those aged 12–17 years (youth) who reported perceived parental disapproval as strongly disapprove or somewhat disapprove of trying marijuana once or twice.
† Percentage decrease over time is statistically significant for past month marijuana users only (logistic regression, p<0.001).
0
60
80
100
2002 2003 2004 2005 2006 2007 2008 2009 2010 2011 2012 2013 2014
Perc
enta
ge
Year
AllPast month marijuana users
FIGURE 7. Percentage of perceived parental disapproval of using marijuana once a month or more* among all persons aged 12–17 years and past month marijuana users aged 12–17 years† — National Survey on Drug Use and Health, United States, 2002–2014
* Perceived parental disapproval of using marijuana once a month or more is defined as those aged 12–17 years (youth) who reported perceived parental disapproval as strongly disapprove or somewhat disapprove of using marijuana once a month or more.
† Percentage decrease over time is statistically significant for all persons and past month marijuana users aged 12–17 years (logistic regression, p<0.001).
0
10
20
30
40
50
60
70
80
90
100
2002 2003 2004 2005 2006 2007 2008 2009 2010 2011 2012 2013 2014
Perc
enta
ge
Year
AllPast month marijuana users
FIGURE 8. Percentage of disapproving attitudes toward peers trying marijuana once or twice* among all persons aged 12–17 years and past month marijuana users† aged 12–17 years — National Survey on Drug Use and Health, United States, 2002–2014
* Disapproving attitudes toward peers trying marijuana once or twice is defined as those aged 12–17 years (youth) who reported that they strongly disapprove or somewhat disapprove of peers trying marijuana once or twice.
† Percentage decrease over time is statistically significant for past month marijuana users only (logistic regression, p<0.001).
0
10
20
30
40
50
60
70
80
90
100
2002 2003 2004 2005 2006 2007 2008 2009 2010 2011 2012 2013 2014
Perc
enta
ge
Year
AllPast month marijuana users
FIGURE 9. Percentage of disapproving attitudes toward peers using marijuana once a month or more* among all persons aged 12–17 years and past month marijuana users aged 12–17 years† — National Survey on Drug Use and Health, United States, 2002–2014
* Disapproving attitudes toward peers using marijuana once a month or more is defined as those aged 12–17 years (youth) who reported that they strongly disapprove or somewhat disapprove of peers using marijuana once a month or more.
† Percentage decrease over time is statistically significant for all persons and past month marijuana users aged 12–17 years (logistic regression, p<0.001).

Surveillance Summaries
18 MMWR / September 2, 2016 / Vol. 65 / No. 11 US Department of Health and Human Services/Centers for Disease Control and Prevention
TABLE 1. Sample size,* weighted interview response rates, and population estimates† among all persons aged ≥12 years, by survey year — National Survey on Drug Use and Health, United States, 2002–2014
Survey year Sample sizeWeighted interview
response rate (%) Population estimates
2002 68,126 78.6 235,143,2452003 67,784 77.4 237,682,0092004 67,760 77.0 240,514,8152005 68,308 76.2 243,220,2832006 67,491 74.2 246,021,6562007 67,377 73.9 247,845,2072008 67,928 74.2 249,815,0892009 68,007 75.6 251,815,5332010 67,804 74.6 253,619,1072011 70,109 74.4 257,598,9442012 68,309 73.0 260,057,3252013 67,838 71.7 262,391,4552014 67,901 71.2 265,122,864
Total average 68,057 74.8 250,065,195
* n = 884,742.† 2002–2014 sample survey weights were used to produce national population estimates.
TABLE 2. Percentage of past month marijuana use* among all persons aged ≥12 years, by age group — National Survey on Drug Use and Health, United States, 2002–2014
Age group (yrs)
2002 2003 2004 2005 2006 2007 2008 2009 2010 2011 2012 2013 2014Linear trend
% change (diff)
% (95% CI)
% (95% CI)
% (95% CI)
% (95% CI)
% (95% CI)
% (95% CI)
% (95% CI)
% (95% CI)
% (95% CI)
% (95% CI)
% (95% CI)
% (95% CI)
% (95% CI) p-value†
2002 to 2014
Total 6.2 (5.9–6.5)
6.2 (5.9–6.4)
6.1 (5.8–6.4)
6.0 (5.7–6.3)
6.0 (5.8–6.3)
5.8 (5.6–6.1)
6.1 (5.8–6.4)
6.7 (6.4–7.0)
6.9 (6.6–7.2)
7.0 (6.7–7.3)
7.3 (6.9–7.6)
7.5 (7.2–7.9)
8.4 (8.1–8.7)
<0.001§ +35
12–17 8.2 (7.7–8.6)
7.9 (7.4–8.4)
7.6 (7.1–8.1)
6.8 (6.4–7.3)
6.7 (6.3–7.1)
6.7 (6.3–7.2)
6.7 (6.3–7.1)
7.4 (6.9–7.8)
7.4 (6.9–7.9)
7.9 (7.4–8.4)
7.2 (6.8–7.7)
7.1 (6.6–7.5)
7.4 (6.8–7.9)
NS -10
18–25 17.3 (16.6–18.0)
17.0 (16.3–17.7)
16.1 (15.4–16.9)
16.6 (15.9–17.3)
16.3 (15.6–17.0)
16.5 (15.8–17.2)
16.6 (15.9–17.3)
18.2 (17.5–19.0)
18.5 (17.8–19.3)
19.0 (18.3–19.8)
18.7 (18.0–19.5)
19.1 (18.3–19.8)
19.6 (18.7–20.5)
<0.001§ +13
≥26 4.0 (3.7–4.3)
4.0 (3.7–4.3)
4.1 (3.8–4.4)
4.1 (3.7–4.4)
4.2 (3.8–4.5)
3.9 (3.6–4.2)
4.2 (3.9–4.6)
4.6 (4.3–4.9)
4.8 (4.4–5.1)
4.8 (4.5–5.2)
5.3 (4.9–5.7)
5.6 (5.2–6.0)
6.6 (6.2–6.9)
<0.001§ +65
26–34 7.7(7.0–8.6)
8.4(7.6–9.3)
8.3(7.5–9.3)
8.6(7.7–9.7)
8.5(7.6–9.4)
7.9(7.1–8.8)
8.8(7.9–9.7)
9.6(8.7–10.6)
10.6(9.5–11.7)
10.2(9.2–11.3)
11.3(10.3–12.4)
12.6(11.5–13.9)
12.7(11.9–13.6)
<0.001§ +65
35–44 5.6(5.0–6.4)
6.0(5.3–6.8)
5.5(4.8–6.2)
4.8(4.2–5.5)
5.5(4.8–6.4)
5.0(4.3–5.7)
5.1(4.4–5.8)
4.8(4.2–5.5)
5.4(4.7–6.1)
5.4(4.7–6.2)
5.9(5.1–6.7)
6.3(5.6–7.1)
8.0(7.4–8.7)
<0.001§ +43
45–54 4.0(3.4–4.7)
3.3(2.7–4.0)
4.5(3.7–5.4)
4.3(3.6–5.1)
4.5(3.8–5.3)
4.4(3.6–5.3)
3.9(3.3–4.8)
4.9(4.2–5.7)
5.0(4.2–5.9)
4.9(4.1–5.7)
5.2(4.4–6.1)
5.4(4.5–6.5)
5.9(5.2–6.6)
<0.001§ +48
55–64 1.1(0.6–1.8)
1.2(0.7–1.8)
1.0(0.6–1.7)
1.8(1.2–2.6)
1.4(0.9–2.0)
1.5(1.0–2.2)
3.2(2.2–4.4)
3.1(2.3–4.1)
2.6(1.9–3.5)
3.4(2.6–4.3)
3.7(2.9–4.7)
3.8(3.1–4.6)
6.1(5.2–7.1)
<0.001§ +455
≥65 0.3(0.1–1.0)
0.1(0.0–0.3)
0.1(0.0–0.5)
0.3(0.1–1.0)
0.2(0.1–0.5)
0.2(0.1–0.6)
0.3(0.1–0.7)
0.6(0.2–1.3)
0.5(0.2–1.0)
0.7(0.4–1.2)
0.9(0.5–1.5)
0.9(0.5–1.5)
1.3(0.9–1.8)
<0.001§ +333
Abbreviations: CI = confidence interval; diff = difference; NS = not significant; + = increase; - = decrease.* Past month use of marijuana is defined as those who reported use of marijuana within 30 days preceding the date of interview.† Linear trends were assessed using logistic regression model from the 2002–2014 survey years.§ Logistic regression (p≤0.05).

Surveillance Summaries
MMWR / September 2, 2016 / Vol. 65 / No. 11 19US Department of Health and Human Services/Centers for Disease Control and Prevention
TABLE 3. Percentage of past year marijuana use* among all persons aged ≥12 years, by age group — National Survey on Drug Use and Health, United States, 2002–2014
Age group (yrs)
2002 2003 2004 2005 2006 2007 2008 2009 2010 2011 2012 2013 2014Linear trend
% change (diff)
% (95% CI)
% (95% CI)
% (95% CI)
% (95% CI)
% (95% CI)
% (95% CI)
% (95% CI)
% (95% CI)
% (95% CI)
% (95% CI)
% (95% CI)
% (95% CI)
% (95% CI) p-value†
2002 to 2014
Total 11.0 (10.6–11.3)
10.6 (10.3–11.0)
10.6 (10.2–11.0)
10.4 (10.1–10.8)
10.3 (10.0–10.7)
10.1 (9.8–10.5)
10.4 (10.0–10.7)
11.4 (11.0–11.8)
11.6 (11.1–12.0)
11.5 (11.2–11.9)
12.1 (11.7–12.5)
12.6 (12.1–13.0)
13.2 (12.9–13.7)
<0.001§ +20
12–17 15.8 (15.2–16.4)
15.0 (14.4–15.6)
14.5 (13.9–15.1)
13.3 (12.8–13.9)
13.2 (12.6–13.8)
12.5 (11.9–13.1)
13.1 (12.5–13.7)
13.7 (13.1–14.3)
14.0 (13.4–14.7)
14.2 (13.6–14.9)
13.5 (12.9–14.1)
13.4 (12.8–14.1)
13.1 (12.5–13.8)
<0.001§ -17
18–25 29.8 (28.9–30.7)
28.5 (27.6–29.4)
27.8 (26.9–28.8)
28.0 (27.2–28.9)
28.1 (27.2–29.0)
27.5 (26.6–28.4)
27.8 (26.9–28.7)
30.8 (29.9–31.7)
30.0 (29.0–30.9)
30.8 (29.8–31.7)
31.5 (30.5–32.5)
31.6 (30.7–32.6)
31.9 (30.9–33.0)
<0.001§ +7
≥26 7.0 (6.6–7.5)
6.9 (6.5–7.3)
7.0 (6.6–7.5)
6.9 (6.5–7.4)
6.9 (6.4–7.3)
6.8 (6.4–7.3)
7.0 (6.6–7.5)
7.7 (7.3–8.2)
8.0 (7.6–8.5)
7.9 (7.4–8.4)
8.6 (8.1–9.1)
9.2 (8.7–9.7)
10.1 (9.7–10.5)
<0.001§ +44
Abbreviations: CI = confidence interval; diff = difference; + = increase; - = decrease.* Past year use of marijuana is defined as those who reported use of marijuana within 12 months preceding the date of interview, including those who reported use of marijuana within 30
days preceding the date of interview.† Linear trends were assessed using logistic regression model from the 2002–2014 survey years.§ Logistic regression (p≤0.05).
TABLE 4. Percentage of daily or almost daily marijuana use in the past year and past month among all persons aged ≥12 years, by age group — National Survey on Drug Use and Health, United States, 2002–2014
Age group (yrs)
2002 2003 2004 2005 2006 2007 2008 2009 2010 2011 2012 2013 2014Linear trend
% change (diff)
% (95% CI)
% (95% CI)
% (95% CI)
% (95% CI)
% (95% CI)
% (95% CI)
% (95% CI)
% (95% CI)
% (95% CI)
% (95% CI)
% (95% CI)
% (95% CI)
% (95% CI) p-value§
2002 to 2014
Daily or almost daily marijuana use in the past year*
Total 1.3 (1.2–1.5)
1.3 (1.2–1.4)
1.3 (1.2–1.5)
1.4 (1.3–1.5)
1.3 (1.2–1.4)
1.4 (1.3–1.6)
1.5 (1.4–1.7)
1.6 (1.5–1.8)
1.8 (1.7–2.0)
1.9 (1.8–2.1)
2.1 (1.9–2.2)
2.2 (2.0–2.4)
2.5 (2.3–2.6)
<0.001¶ +92
12–17 1.4 (1.3–1.7)
1.1 (1.0–1.3)
1.4 (1.2–1.6)
1.1 (0.9–1.3)
1.1 (1.0–1.3)
1.0 (0.9–1.2)
1.1 (1.0–1.3)
1.2 (1.0–1.4)
1.4 (1.2–1.6)
1.2 (1.0–1.4)
1.1 (1.0–1.3)
1.2 (1.0–1.4)
1.0 (0.9–1.2)
NS -29
18–25 4.3 (4.0–4.7)
4.3 (4.0–4.7)
4.3 (3.9–4.7)
4.7 (4.3–5.1)
4.5 (4.2–4.9)
4.5 (4.1–4.9)
5.0 (4.7–5.4)
5.0 (4.7–5.4)
5.5 (5.1–5.9)
5.3 (4.9–5.8)
6.2 (5.8–6.8)
6.2 (5.8–6.7)
6.4 (5.9–6.9)
<0.001¶ +49
≥26 0.8 (0.7–0.9)
0.8 (0.7–0.9)
0.8 (0.7–1.0)
0.9 (0.7–1.0)
0.7 (0.6–0.9)
1.1 (0.8–1.1)
1.0 (0.9–1.2)
1.1 (0.9–1.2)
1.2 (1.0–1.4)
1.4 (1.3–1.7)
1.5 (1.3–1.7)
1.6 (1.4–1.9)
2.0 (1.8–2.2)
<0.001¶ +150
Daily or almost daily marijuana use in the past month†
Total 2.0 (1.9–2.2)
2.1 (1.9–2.2)
2.0 (1.9–2.2)
2.1 (1.9–2.3)
2.1 (1.9–2.2)
2.1 (1.9–2.2)
2.2 (2.0–2.4)
2.5 (2.3–2.6)
2.7 (2.5–3.0)
2.7 (2.6–3.0)
2.9 (2.7–3.1)
3.1 (2.9–3.3)
3.5 (3.3–3.7)
<0.001¶ +75
12–17 2.4 (2.2–2.7)
1.9 (1.7–2.2)
2.1 (1.9–2.4)
1.6 (1.4–1.8)
1.7 (1.5–1.9)
1.7 (1.5–1.9)
1.7 (1.5–1.9)
1.8 (1.6–2.1)
1.8 (1.6–2.0)
1.9 (1.7–2.1)
1.7 (1.5–1.9)
1.8 (1.6–2.0)
1.6 (1.4–1.9)
<0.001¶ -33
18–25 6.4 (6.0–6.9)
6.6 (6.1–7.0)
6.2 (5.8–6.7)
6.5 (6.0–6.9)
6.5 (6.1–7.0)
6.3 (5.9–6.8)
6.6 (6.2–7.1)
7.4 (6.9–7.9)
7.8 (7.3–8.3)
7.8 (7.3–8.3)
8.3 (7.8–8.9)
8.1 (7.6–8.6)
8.6 (8.1–9.3)
<0.001¶ +34
≥26 1.2 (1.1–1.4)
1.3 (1.1–1.5)
1.3 (1.1–1.5)
1.4 (1.2–1.6)
1.4 (1.2–1.5)
1.4 (1.2–1.6)
1.5 (1.3–1.7)
1.7 (1.5–1.9)
2.0 (1.7–2.2)
2.0 (1.8–2.2)
2.1 (1.9–2.4)
2.4 (2.1–2.7)
2.8 (2.6–3.1)
<0.001¶ +133
Abbreviations: CI = confidence interval; diff = difference; NS = not significant; + = increase; - = decrease.* Past year daily or almost daily use is defined as having used marijuana on 300 or more days in the past year.† Past month daily or almost daily use is defined as having used marijuana on 20 or more days in the past month.§ Linear trends were assessed using logistic regression model from the 2002–2014 survey years.¶ Logistic regression (p≤0.05).

Surveillance Summaries
20 MMWR / September 2, 2016 / Vol. 65 / No. 11 US Department of Health and Human Services/Centers for Disease Control and Prevention
TABLE 5. Percentage of daily or almost daily marijuana use in the past year and past month among marijuana users* aged ≥12 years, by age group — National Survey on Drug Use and Health, United States, 2002–2014
Age group (yrs)
2002 2003 2004 2005 2006 2007 2008 2009 2010 2011 2012 2013 2014Linear trend
% change (diff)
% (95% CI)
% (95% CI)
% (95% CI)
% (95% CI)
% (95% CI)
% (95% CI)
% (95% CI)
% (95% CI)
% (95% CI)
% (95% CI)
% (95% CI)
% (95% CI)
% (95% CI) p-value¶
2002 to 2014
Daily or almost daily marijuana use in the past year†
Total 12.2 (11.2–13.2)
12.2 (11.3–13.3)
12.7 (11.7–13.9)
13.3 (12.2–14.5)
12.3 (11.3–13.3)
14.1 (13.0–15.4)
15.0 (13.7–16.3)
14.2 (13.1–15.3)
15.7 (14.5–17.0)
16.7 (15.5–18.1)
17.0 (15.8–18.2)
17.4 (16.0–18.8)
18.5 (17.5–19.6)
<0.001** +52
12–17 9.2 (8.0–10.5)
7.5 (6.5–8.7)
9.4 (8.1–10.8)
7.9 (6.7–9.4)
8.6 (7.4–10.0)
8.2 (7.0–9.7)
8.5 (7.3–9.8)
8.7 (7.5–10.0)
9.9 (8.6–11.3)
8.5 (7.4–9.7)
8.2 (7.1–9.6)
8.9 (7.7–10.3)
7.9 (6.6–9.4)
NS -14
18–25 14.5 (13.4–15.6)
15.2 (14.1–16.4)
15.4 (14.2–16.7)
16.7 (15.4–18.0)
16.2 (15.0–17.5)
16.4 (15.2–17.7)
18.1 (16.8–19.5)
16.3 (15.2–17.6)
18.2 (17.0–19.6)
17.3 (16.0–18.6)
19.8 (18.4–21.3)
19.7 (18.3–21.1)
19.9 (18.5–21.4)
<0.001** +37
≥26 11.4 (9.8–13.2)
11.5 (9.8–13.5)
11.8 (10.0–13.9)
12.3 (10.4–14.6)
10.4 (8.7–12.3)
14.0 (12.0–16.2)
14.1 (12.3–16.7)
13.9 (12.2–15.9)
15.3 (13.3–17.7)
18.3 (16.1–20.6)
16.9 (15.0–19.0)
17.5 (15.4–20.0)
19.4 (17.9–21.1)
<0.001** +70
Daily or almost daily marijuana use in the past month§
Total 32.6 (30.7–34.6)
33.4 (31.6–35.3)
33.5 (31.6–35.4)
34.8 (32.8–36.9)
34.4 (32.3–36.5)
35.2 (33.1–37.4)
35.7 (33.5–38.0)
36.7 (34.7–38.8)
39.8 (37.6–42.2)
39.1 (37.1–41.3)
40.3 (38.3–42.4)
41.1 (38.9–43.3)
41.6 (40.0–43.4)
<0.001** +28
12–17 29.8 (27.2–32.6)
24.4 (22.0–27.1)
28.1 (25.4–30.9)
23.1 (20.5–25.9)
25.6 (22.9–28.5)
25.2 (22.6–28.1)
25.3 (22.6–28.1)
24.9 (22.3–27.7)
24.4 (21.7–27.2)
23.7 (21.3–26.3)
23.6 (21.0–26.4)
25.6 (23.0–28.3)
21.8 (19.2–24.7)
<0.001** -27
18–25 37.2 (35.3–39.1)
38.5 (36.5–40.6)
38.4 (36.3–40.5)
38.9 (36.8–41.0)
40.0 (37.8–42.2)
38.4 (36.2–40.6)
39.9 (37.7–42.1)
40.4 (38.4–42.5)
42.1 (40.0–44.3)
41.0 (39.0–43.1)
44.4 (42.4–46.5)
42.5 (40.3–44.6)
44.2 (41.9–46.5)
<0.001** +19
≥26 30.0 (26.6–33.7)
32.1 (28.8–35.6)
31.4 (28.2–34.9)
34.5 (30.9–38.3)
32.5 (29.0–36.1)
35.2 (31.4–39.2)
35.1 (31.3–39.1)
36.6 (33.0–40.3)
41.3 (37.4–45.3)
41.0 (37.5–44.7)
40.6 (37.3–44.0)
42.7 (39.2–46.3)
43.0 (40.6–45.5)
<0.001** +43
Abbreviations: CI = confidence interval; diff = difference; NS = not significant; + = increase; - = decrease. * Analysis limited to marijuana users (i.e., estimate of daily or almost daily use in the past year is among past year marijuana users; estimate of daily or almost daily use in the past month is
among past month marijuana users). † Past year daily or almost daily use is defined as having used marijuana on 300 or more days in the past year. § Past month daily or almost daily use is defined as having used marijuana on 20 or more days in the past month. ¶ Linear trends were assessed using logistic regression model from the 2002–2014 survey years. ** Logistic regression (p≤0.05).

Surveillance Summaries
MMWR / September 2, 2016 / Vol. 65 / No. 11 21US Department of Health and Human Services/Centers for Disease Control and Prevention
TABLE 6. Percentage of past year marijuana initiation among persons aged ≥12 years at risk for initiation,* estimated number at risk for initiation, and mean age at first use of marijuana among past year initiates, by age group — National Survey on Drug Use and Health, United States, 2002–2014
Age group (yrs)
2002 2003 2004 2005 2006 2007 2008 2009 2010 2011 2012 2013 2014Linear trend
% change (diff)
% (95% CI)
% (95% CI)
% (95% CI)
% (95% CI)
% (95% CI)
% (95% CI)
% (95% CI)
% (95% CI)
% (95% CI)
% (95% CI)
% (95% CI)
% (95% CI)
% (95% CI) p-value†
2002 to 2014
Past year marijuana initiation among persons at risk for initiation*Total 1.5
(1.4–1.6)1.4
(1.3–1.5)1.5
(1.4–1.6)1.4
(1.3–1.6)1.4
(1.3–1.5)1.4
(1.3–1.5)1.5
(1.4–1.6)1.6
(1.5–1.7)1.6
(1.5–1.8)1.7
(1.6–1.8)1.6
(1.5–1.7)1.6
(1.5–1.7)1.7
(1.6–1.8)<0.001§ +13
12–17 6.5 (6.1–7.0)
5.7 (5.3–6.1)
5.8 (5.4–6.2)
5.2 (4.8–5.6)
5.4 (5.0–5.8)
5.2 (4.9–5.6)
5.7 (5.3–6.1)
6.2 (5.8–6.6)
5.9 (5.5–6.4)
6.3 (5.8–6.7)
5.7 (5.3–6.2)
5.5 (5.1–5.9)
5.5 (5.0–6.0)
NS -15
18–25 4.9 (4.4–5.4)
4.4 (3.9–4.9)
4.5 (4.0–5.1)
4.5 (4.0–5.0)
4.6 (4.0–5.1)
4.7 (4.2–5.2)
4.8 (4.3–5.4)
5.8 (5.2–6.5)
5.3 (4.7–5.9)
6.0 (5.4–6.8)
5.5 (4.9–6.2)
5.7 (5.2–6.3)
6.2 (5.6–6.9)
<0.001§ +27
≥26 0.1 (0.0–0.1)
0.1 (0.0–0.2)
0.2 (0.1–0.3)
0.2 (0.1–0.5)
0.1 (0.1–0.2)
0.1 (0.1–0.2)
0.1 (0.1–0.3)
0 (0.0–0.1)
0.2 (0.1–0.4)
0.2 (0.1–0.3)
0.2 (0.1–0.3)
0.2 (0.1–0.3)
0.2 (0.2–0.3)
<0.05§ +100
Estimated no. (in 1,000s) of past year marijuana initiation among persons at risk for initiation*Total 2,193
(2,052–2,344)
1,963 (1,821–2,115)
2,142 (1,986–2,309)
2,114 (1,888–2,368)
2,061 (1,909–2,226)
2,089 (1,940–2,249)
2,224 (2,054–2,407)
2,379 (2,227–2,542)
2,439 (2,260–2,632)
2,617 (2,432–2,816)
2,398 (2,215–2,596)
2,427 (2,263–2,602)
2,568 (2,388–2,762)
NA NA
12–17 1,371 (1,277–1,471)
1,217 (1,130–1,311)
1,252 (1,163–1,346)
1,139 (1,056–1,228)
1,194 (1,104–1,290)
1,168 (1,083–1,259)
1,248 (1,156–1,346)
1,343 (1,251–1,442)
1,274 (1,178–1,378)
1,375 (1,274–1,483)
1,255 (1,163–1,354)
1,200 (1,113–1,294)
1,203 (1,105–1,309)
NA NA
18–25 732 (660–812)
666 (595–746)
714 (630–807)
723 (639–817)
742 (658–837)
787 (703–881)
817 (728–918)
988 (886–1,100)
918 (824–1,021)
1,060 (947–1,186)
966 (863–1,081)
1,017 (918–1,125)
1,094 (980–1,221)
NA NA
≥26 90 (52–156)
79 (37–170)
176 (100–310)
252 (118–537)
126 (74–212)
134 (78–231)
159 (92–276)
49 (26–89)
247 (153–398)
182 (108–307)
177 (98–318)
210 (139–317)
271 (195–376)
NA NA
Mean age at first use among past year marijuana initiatesTotal 17.0
(16.6–17.3)17.3
(16.3–18.4)18.0
(16.7–19.3)20.6
(16.2–25.1)17.4
(17.0–17.8)17.8
(17.0–18.7)17.9
(17.2–18.6)17.0
(16.8–17.3)19.2
(17.8–20.7)18.5
(17.0–20.1)18.6
(17.4–19.8)18.6
(17.8–19.3)19.4
(18.5–20.3)<0.05§ +14
12–17 14.8 (14.7–14.9)
14.9 (14.8–15.0)
14.9 (14.8–15.0)
14.9 (14.8–15.0)
15.0 (14.9–15.2)
15.1 (15.0–15.2)
15.0 (14.9–15.1)
15.0 (14.9–15.1)
15.0 (14.9–15.1)
14.9 (14.8–15.0)
15.0 (14.9–15.1)
15.0 (14.8–15.1)
14.9 (14.8–15.0)
NS +1
18–25 19.2 (19.0–19.4)
19.1 (18.9–19.3)
18.9 (18.7–19.1)
19.1 (18.9–19.3)
19.2 (19.0–19.4)
18.9 (18.8–19.1)
19.2 (19.0–19.5)
19.0 (18.8–19.2)
19.1 (18.9–19.3)
19.3 (19.0–19.5)
19.5 (19.3–19.7)
19.3 (19.1–19.5)
19.4 (19.1–19.6)
<0.01§ +1
≥26 31.2 (28.1–34.3)
39.2 (24.9–53.5)
36.6 (29.4–43.7)
51.0 (34.2–67.8)
29.1 (26.7–31.5)
35.2 (28.1–42.2)
33.6 (29.5–37.7)
32.2 (28.7–35.6)
41.8 (34.3–49.2)
41.5 (26.9–56.1)
39.4 (31.3–47.6)
35.5 (30.7–40.2)
39.6 (34.6–44.6)
NS +27
Abbreviations: CI = confidence interval; diff= difference; NA = not applicable; NS = not significant; + = increase; - = decrease.* Past year marijuana initiation (initiates) among persons at risk for initiation is defined as those having first used marijuana within the 12-month period before the date of the interview.† Linear trends were assessed using logistic regression model from the 2002–2014 survey years.§ Logistic regression (p≤0.05).

Surveillance Summaries
22 MMWR / September 2, 2016 / Vol. 65 / No. 11 US Department of Health and Human Services/Centers for Disease Control and Prevention
TABLE 7. Percentage of perceived great risk and no risk from smoking marijuana* once a month and once or twice a week among all persons aged ≥12 years, by age group — National Survey on Drug Use and Health, United States, 2002–2014
Age group (yrs)
2002 2003 2004 2005 2006 2007 2008 2009 2010 2011 2012 2013 2014Linear trend
% change (diff)
% (95% CI)
% (95% CI)
% (95% CI)
% (95% CI)
% (95% CI)
% (95% CI)
% (95% CI)
% (95% CI)
% (95% CI)
% (95% CI)
% (95% CI)
% (95% CI)
% (95% CI) p-value†
2002 to 2014
Perceived great risk from smoking marijuana once a monthTotal 38.3
(37.5–39.1)39.6
(38.9–40.4)39.7
(38.9–40.5)38.3
(37.5–39.0)39.3
(38.5–40.0)38.3
(37.5–39.0)36.9
(36.2–37.7)34.4
(33.7–35.2)32.5
(31.8–33.3)31.9
(31.2–32.7)30.8
(30.1–31.5)28.2
(27.5–29.0)26.5
(26.0–27.1)<0.001§ -31
12–17 32.4 (31.6–33.2)
34.9 (34.1–35.8)
35.0 (34.1–35.8)
34.0 (33.1–34.8)
34.6 (33.8–35.5)
34.4 (33.6–35.2)
33.4 (32.5–34.3)
30.3 (29.5–31.1)
29.6 (28.8–30.5)
27.6 (26.8–28.4)
26.5 (25.7–27.3)
24.2 (23.4–25.0)
22.9 (22.1–23.7)
<0.001§ -29
18–25 23.5 (22.7–24.4)
24.8 (24.0–25.6)
25.6 (24.7–26.4)
24.4 (23.6–25.2)
24.4 (23.7–25.2)
24.7 (23.8–25.6)
22.7 (21.9–23.4)
19.9 (19.1–20.7)
18.5 (17.8–19.3)
18.0 (17.3–18.8)
16.7 (16.0–17.5)
14.9 (14.2–15.6)
13.5 (12.9–14.2)
<0.001§ -43
≥26 41.7 (40.7–42.7)
42.9 (42.0–43.9)
42.9 (41.9–43.8)
41.3 (40.4–42.3)
42.5 (41.5–43.5)
41.1 (40.2–42.1)
39.8 (38.9–40.8)
37.5 (36.6–38.5)
35.4 (34.5–36.3)
34.9 (34.0–35.9)
33.8 (32.9–34.7)
31.0 (30.1–32.0)
29.2 (28.5–29.9)
<0.001§ -30
Perceived no risk from smoking marijuana once a monthTotal 10.0
(9.6–10.4)9.1
(8.7–9.5)9.5
(9.1–10.0)9.5
(9.1–9.9)9.7
(9.3–10.1)10.2
(9.8–10.6)11.3
(10.8–11.7)12.9
(12.4–13.3)14.0
(13.5–14.4)15.0
(14.5–15.5)16.4
(15.9–16.9)18.3
(17.7–18.8)19.9
(19.5–20.4)<0.001§ +99
12–17 8.6 (8.1–9.0)
7.5 (7.0–7.9)
7.8 (7.3–8.3)
7.4 (7.0–7.9)
7.6 (7.1–8.1)
8.0 (7.5–8.5)
8.8 (8.3–9.3)
10.9 (10.3–11.4)
11.3 (10.7–11.9)
13.1 (12.5–13.8)
14.2 (13.5–14.8)
16.7 (16.1–17.4)
17.6 (16.9–18.3)
<0.001§ +105
18–25 18.6 (17.9–19.4)
16.7 (16.1–17.4)
16.2 (15.5–16.9)
17.7 (17.0–18.4)
17.5 (16.9–18.3)
18.4 (17.7–19.1)
20.3 (19.5–21.1)
24.6 (23.8–25.4)
26.4 (25.6–27.2)
28.2 (27.4–29.1)
31.1 (30.2–31.9)
34.0 (33.1–34.9)
36.6 (35.6–37.6)
<0.001§ +97
≥26 8.7 (8.2–9.2)
8.0 (7.5–8.5)
8.6 (8.1–9.2)
8.4 (7.9–8.9)
8.6 (8.1–9.1)
9.1 (8.6–9.6)
10.0 (9.5–10.6)
11.0 (10.5–11.6)
12.1 (11.5–12.7)
12.9 (12.3–13.5)
14.1 (13.5–14.7)
15.7 (15.0–16.4)
17.4 (16.8–17.9)
<0.001§ +100
Perceived great risk from smoking marijuana once or twice a weekTotal 51.3
(50.6–52.1)52.8
(52.1–53.5)52.4
(51.7–53.2)51.5
(50.8–52.2)51.2
(50.5–51.9)50.9
(50.1–51.6)48.7
(48.0–49.5)45.7
(44.9–46.5)43.2
(42.5–44.0)42.3
(41.6–43.1)40.3
(39.6–41.1)37.1
(36.3–37.9)34.3
(33.7–34.9)<0.001§ -33
12–17 51.5 (50.7–52.4)
54.4 (53.5–55.3)
54.7 (53.8–55.6)
55.0 (54.1–55.9)
54.2 (53.3–55.1)
54.6 (53.7–55.5)
52.8 (51.9–53.6)
49.0 (48.1–49.9)
47.2 (46.3–48.1)
44.8 (43.8–45.7)
43.6 (42.7–44.6)
39.5 (38.6–40.4)
37.4 (36.4–38.4)
<0.001§ -27
18–25 35.5 (34.6–36.5)
36.8 (35.9–37.7)
38.1 (37.1–39.1)
37.0 (36.0–37.9)
35.9 (35.0–36.8)
35.8 (34.9–36.8)
33.1 (32.2–34.0)
28.6 (27.8–29.5)
27.0 (26.2–27.9)
25.6 (24.7–26.5)
23.5 (22.6–24.3)
21.0 (20.2–21.9)
18.3 (17.6–19.1)
<0.001§ -48
≥26 54.1 (53.1–55.0)
55.4 (54.5–56.3)
54.7 (53.7–55.6)
53.6 (52.7–54.5)
53.5 (52.6–54.4)
53.0 (52.0–53.9)
50.9 (50.0–51.8)
48.2 (47.2–49.2)
45.6 (44.6–46.6)
44.9 (44.0–45.9)
42.9 (41.9–43.8)
39.6 (38.6–40.6)
36.6 (35.9–37.4)
<0.001§ -32
Perceived no risk from smoking marijuana once or twice a weekTotal 5.6
(5.3–5.9)5.2
(4.9–5.5)5.1
(4.8–5.4)5.4
(5.1–5.7)5.6
(5.4–5.9)6.0
(5.7–6.4)6.9
(6.5–7.2)8.3
(7.9–8.7)9.6
(9.2–10.0)10.2
(9.8–10.6)11.6
(11.2–12.0)13.1
(12.7–13.6)15.2
(14.8–15.6)<0.001§ +171
12–17 5.0 (4.7–5.4)
4.3 (4.0–4.6)
4.5 (4.1–4.9)
4.2 (3.9–4.6)
4.3 (4.0–4.7)
5.1 (4.7–5.5)
5.2 (4.9–5.6)
6.9 (6.5–7.4)
7.3 (6.9–7.8)
8.7 (8.2–9.2)
10.0 (9.5–10.6)
11.6 (11.1–12.2)
13.0 (12.4–13.6)
<0.001§ +160
18–25 11.1 (10.6–11.7)
10.0 (9.5–10.6)
9.3 (8.8–9.9)
10.4 (9.8–10.9)
10.6 (10.0–11.2)
11.7 (11.2–12.3)
12.9 (12.3–13.5)
16.9 (16.2–17.6)
19.0 (18.3–19.7)
20.7 (20.0–21.5)
24.1 (23.3–24.9)
26.9 (26.1–27.7)
29.5 (28.5–30.4)
<0.001§ +166
≥26 4.7 (4.4–5.1)
4.4 (4.1–4.8)
4.4 (4.0–4.8)
4.6 (4.3–5.0)
5.0 (4.6–5.3)
5.2 (4.8–5.6)
6.0 (5.6–6.5)
7.0 (6.5–7.5)
8.2 (7.7–8.7)
8.5 (8.0–9.0)
9.6 (9.1–10.1)
10.9 (10.4–11.6)
13.0 (12.5–13.5)
<0.001§ +177
Abbreviations: CI = confidence interval; diff = difference; + = increase; - = decrease.* Perceived great risk and no risk from smoking marijuana is defined as those who reported that smoking marijuana once a month and once or twice a week might cause harm (great risk)
and might not cause harm (no risk).† Linear trends were assessed using logistic regression model from the 2002–2014 survey years.§ Logistic regression (p≤0.05).

Surveillance Summaries
MMWR / September 2, 2016 / Vol. 65 / No. 11 23US Department of Health and Human Services/Centers for Disease Control and Prevention
TABLE 8. Percentage of perceived availability* among all persons aged ≥12 years and mode of acquisition† of marijuana among past year marijuana users aged ≥12 years, by age group — National Survey on Drug Use and Health, United States, 2002–2014
Age group (yrs)
2002 2003 2004 2005 2006 2007 2008 2009 2010 2011 2012 2013 2014Linear trend
% change (diff)
% (95% CI)
% (95% CI)
% (95% CI)
% (95% CI)
% (95% CI)
% (95% CI)
% (95% CI)
% (95% CI)
% (95% CI)
% (95% CI)
% (95% CI)
% (95% CI)
% (95% CI) p-value§
2002 to 2014
Perceived availabilityTotal 58.0
(57.2–58.8)58.8
(58.0–59.5)57.5
(56.8–58.3)57.3
(56.5–58.1)57.1
(56.4–57.8)57.4
(56.7–58.1)56.0
(55.3–56.8)56.2
(55.4–57.0)57.1
(56.3–57.9)57.5
(56.8–58.2)57.5
(56.7–58.2)58.6
(57.8–59.4)60.2
(59.6–60.9)<0.05¶ +4
12–17 55.0 (54.1–55.8)
53.6 (52.7–54.5)
52.2 (51.3–53.1)
51.0 (50.1–51.8)
50.1 (49.2–51.0)
49.2 (48.3–50.1)
49.4 (48.5–50.3)
50.0 (49.1–50.9)
48.9 (47.9–49.9)
47.7 (46.8–48.7)
47.8 (46.9–48.7)
48.6 (47.7–49.5)
47.8 (46.8–48.7)
<0.001¶ -13
18–25 77.4 (76.6–78.3)
77.9 (77.1–78.7)
76.1 (75.2–76.9)
76.5 (75.7–77.3)
76.6 (75.7–77.4)
76.0 (75.2–76.9)
75.3 (74.5–76.2)
76.1 (75.3–76.9)
75.7 (74.9–76.5)
75.0 (74.2–75.8)
75.2 (74.4–76.0)
75.3 (74.4–76.1)
74.9 (74.0–75.8)
<0.001¶ -3
≥26 54.9(53.9–55.9)
56.0 (55.0–57.0)
54.9 (54.0–55.9)
54.7 (53.6–55.7)
54.6 (53.6–55.5)
55.2 (54.2–56.1)
53.5 (52.6–54.4)
53.4 (52.4–54.5)
54.8 (53.7–55.8)
55.6 (54.7–56.6)
55.5 (54.6–56.4)
56.9 (55.9–57.9)
59.2 (58.4–60.0)
<0.001¶ +8
Mode of acquisition of marijuanaBought itTotal 40.4
(38.7–42.1)40.4
(38.9–41.8)41.1
(39.4–42.8)42.0
(40.3–43.8)43.7
(42.1–45.4)41.6
(39.8–43.4)44.2
(42.4–46.0)43.7
(42.0–45.4)44.5
(42.9–46.2)45.6
(44.0–47.3)46.8
(45.2–48.4)45.4
(43.8–47.1)48.4
(47.0–49.8)<0.001¶ +20
12–17 33.3 (31.4–35.3)
31.7 (29.8–33.6)
34.4 (32.1–36.8)
32.2 (30.0–34.5)
33.3 (31.3–35.5)
33.3 (31.2–35.6)
33.0 (30.7–35.5)
36.5 (34.2–38.9)
35.3 (32.9–37.7)
38.1 (36.0–40.3)
39.2 (36.7–41.7)
39.9 (37.5–42.4)
40.5 (37.8–43.3)
<0.001¶ +22
18–25 38.7 (37.1–40.3)
40.3 (38.8–42.0)
41.1 (39.4–42.8)
40.6 (38.9–42.4)
42.0 (40.2–43.7)
39.9 (38.1–41.7)
43.0 (41.4–44.7)
43.4 (41.8–44.9)
45.7 (44.0–47.5)
44.8 (43.1–46.5)
46.9 (45.3–48.6)
45.8 (44.2–47.4)
47.8 (46.0–49.7)
<0.001¶ +24
≥26 43.8 (40.7–46.9)
42.9 (40.2–45.6)
42.9 (39.9–46.0)
45.5 (42.4–48.6)
47.6 (44.7–50.6)
44.8 (41.6–48.0)
47.5 (44.5–50.6)
45.4 (42.5–48.4)
45.7 (42.9–48.4)
47.8 (45.0–50.7)
48.2 (45.5–50.9)
46.1 (43.4–48.8)
49.9 (47.8–51.9)
<0.001¶ +14
Traded something for itTotal 1.4
(1.0–1.8)1.1
(0.8–1.4)1.5
(1.1–2.2)1.2
(0.9–1.7)1.1
(0.8–1.5)1.6
(1.2–2.2)1.3
(1.0–1.8)1.3
(1.0–1.7)0.9
(0.7–1.2)1.3
(1.0–1.8)1.2
(0.9–1.6)1.7
(1.3–2.2)1.1
(0.9–1.4)NS -21
12–17 1.7 (1.2–2.3)
1.6 (1.2–2.2)
1.7 (1.2–2.3)
0.9 (0.6–1.3)
1.2 (0.8–1.9)
1.5 (1.1–2.1)
1.3 (0.9–1.9)
1.1 (0.7–1.7)
1.3 (0.9–1.9)
1.7 (1.2–2.4)
1.5 (1.0–2.3)
1.2 (0.8–1.8)
1.2 (0.8–1.9)
NS -29
18–25 1.2 (0.9–1.7)
1.0 (0.8–1.4)
1.2 (0.9–1.7)
1.1 (0.8–1.4)
0.8 (0.6–1.2)
1.4 (1.0–1.9)
0.9 (0.6–1.3)
1.1 (0.8–1.5)
0.9 (0.7–1.2)
1.0 (0.8–1.4)
1.1 (0.8–1.5)
1.0 (0.8–1.4)
0.8 (0.5–1.2)
NS -33
≥26 1.4 (0.8–2.3)
1.0 (0.6–1.6)
1.7 (0.9–3.1)
1.4 (0.8–2.4)
1.3 (0.8–2.0)
1.8 (1.1–3.0)
1.6 (1.0–2.6)
1.4 (0.9–2.2)
0.9 (0.6–1.4)
1.4 (0.9–2.3)
1.2 (0.7–2.0)
2.1 (1.4–3.1)
1.3 (0.9–1.8)
NS -7
Got it for free or shared with someone elseTotal 57.6
(56.0–59.3)57.8
(56.3–59.2)56.2
(54.6–57.9)55.7
(53.9–57.4)54.2
(52.6–55.9)56.0
(54.3–57.8)53.6
(51.8–55.4)53.9
(52.2–55.6)53.2
(51.5–54.8)51.7
(50.0–53.3)50.6
(49.0–52.2)50.6
(48.9–52.2)49.3
(47.9–50.7)<0.001¶ -14
12–17 64.2 (62.1–66.3)
65.8 (63.8–67.7)
62.9 (60.5–65.3)
66.1 (63.8–68.3)
64.4 (62.2–66.5)
64.5 (62.3–66.7)
65.0 (62.5–67.4)
61.2 (58.8–63.5)
62.8 (60.3–65.2)
59.8 (57.6–61.9)
58.9 (56.4–61.4)
58.3 (55.9–60.7)
57.3 (54.5–60.0)
<0.001¶ -11
18–25 59.7 (58.1–61.3)
58.0 (56.4–59.5)
57.2 (55.6–58.8)
57.7 (56.0–59.5)
56.6 (54.8–58.4)
58.2 (56.4–60.0)
55.3 (53.6–56.9)
54.7 (53.1–56.3)
52.7 (51.0–54.4)
53.2 (51.4–54.9)
51.1 (49.5–52.8)
52.6 (51.0–54.2)
50.9 (49.1–52.7)
<0.001¶ -15
≥26 54.2 (51.0–57.3)
55.3 (52.6–58.0)
53.7 (50.6–56.8)
51.5 (48.4–54.6)
49.9 (47.0–52.9)
52.5 (49.4–55.7)
49.9 (46.7–53.0)
51.7 (48.8–54.6)
51.4 (48.6–54.2)
48.8 (46.0–51.7)
48.7 (46.0–51.3)
48.1 (45.4–50.7)
47.3 (45.2–49.3)
<0.001¶ -13
Grew it yourselfTotal 0.6
(0.4–1.0)0.8
(0.5–1.2)1.1
(0.7–1.7)1.1
(0.7–1.7)0.9
(0.7–1.2)0.8
(0.5–1.1)0.9
(0.6–1.3)1.2
(0.8–1.6)1.4
(0.9–2.1)1.4
(1.1–1.9)1.4
(1.1–1.9)2.4
(1.7–3.3)1.2
(0.9–1.6)<0.001¶ +100
12–17 0.8 (0.5–1.2)
0.9 (0.6–1.4)
0.9 (0.6–1.5)
0.8 (0.6–1.3)
1.0 (0.7–1.7)
0.7 (0.3–1.2)
0.7 (0.4–1.2)
1.2 (0.7–2.0)
0.6 (0.3–1.2)
0.4 (0.2–0.7)
0.4 (0.2–1.0)
0.5 (0.3–1.0)
1.0 (0.6–1.9)
NS +25
18–25 0.4 (0.2–0.6)
0.7 (0.5–1.0)
0.4 (0.3–0.7)
0.6 (0.4–0.9)
0.6 (0.4–0.9)
0.6 (0.4–0.9)
0.8 (0.5–1.2)
0.8 (0.6–1.2)
0.6 (0.4–1.0)
1.0 (0.7–1.4)
0.8 (0.6–1.2)
0.6 (0.4–0.9)
0.5 (0.3–0.8)
NS +25
≥26 0.7 (0.3–1.5)
0.8 (0.4–1.8)
1.6 (1.0–2.8)
1.6 (0.9–2.8)
1.2 (0.8–1.7)
0.9 (0.5–1.5)
1.0 (0.6–1.8)
1.4 (0.9–2.3)
2.0 (1.2–3.3)
1.9 (1.3–2.8)
2.0 (1.4–2.9)
3.7 (2.5–5.4)
1.6 (1.1–2.2)
<0.001¶ +129
Abbreviations: CI = confidence interval; diff = difference; NS = not significant; + = increase; - = decrease.* Perceived availability is defined as those who reported that it would be fairly easy or very easy for them to obtain marijuana if they wanted some.† Mode of acquisition is defined as those who reported how they got the marijuana they used for the last time (i.e., bought it, traded something for it, got it for free or shared with someone
else, or grew it yourself ).§ Linear trends were assessed using logistic regression model from the 2002–2014 survey years.¶ Logistic regression (p≤0.05).

Surveillance Summaries
24 MMWR / September 2, 2016 / Vol. 65 / No. 11 US Department of Health and Human Services/Centers for Disease Control and Prevention
TABLE 9. Percentage of past year marijuana dependence and abuse* among all persons aged ≥12 years, by age group — National Survey on Drug Use and Health, United States, 2002–2014
Age group (yrs)
2002 2003 2004 2005 2006 2007 2008 2009 2010 2011 2012 2013 2014Linear trend
% change (diff)
% (95% CI)
% (95% CI)
% (95% CI)
% (95% CI)
% (95% CI)
% (95% CI)
% (95% CI)
% (95% CI)
% (95% CI)
% (95% CI)
% (95% CI)
% (95% CI)
% (95% CI) p-value†
2002 to 2014
Total 1.8 (1.7–2.0)
1.8 (1.7–1.9)
1.9 (1.7–2.0)
1.7 (1.6–1.8)
1.7 (1.6–1.8)
1.6 (1.5–1.7)
1.7 (1.6–1.8)
1.7 (1.6–1.8)
1.8 (1.6–1.9)
1.6 (1.5–1.7)
1.7 (1.5–1.8)
1.6 (1.5–1.7)
1.6 (1.5–1.7)
<0.001§ -11
12–17 4.3 (3.9–4.6)
3.8 (3.5–4.2)
3.9 (3.6–4.2)
3.6 (3.3–3.9)
3.4 (3.1–3.7)
3.1 (2.8–3.4)
3.4 (3.1–3.7)
3.4 (3.1–3.7)
3.6 (3.3–3.9)
3.5 (3.2–3.9)
3.2 (2.9–3.6)
2.9 (2.6–3.2)
2.7 (2.4–3.0)
<0.001§ -37
18–25 6.0 (5.6–6.4)
5.9 (5.5–6.4)
6.0 (5.6–6.5)
5.9 (5.5–6.3)
5.7 (5.3–6.1)
5.6 (5.2–6.1)
5.6 (5.2–6.1)
5.6 (5.1–6.0)
5.7 (5.3–6.2)
5.7 (5.3–6.1)
5.5 (5.1–6.0)
5.4 (5.0–5.8)
4.9 (4.5–5.3)
<0.001§ -18
≥26 0.8 (0.6–0.9)
0.7 (0.6–0.9)
0.8 (0.7–1.0)
0.7 (0.6–0.8)
0.8 (0.6–0.9)
0.7 (0.6–0.8)
0.8 (0.7–0.9)
0.8 (0.7–1.0)
0.9 (0.7–1.0)
0.7 (0.6–0.8)
0.8 (0.7–0.9)
0.8 (0.7–1.0)
0.9 (0.8–1.0)
NS +13
Abbreviations: CI = confidence interval; diff = difference; NS = not significant; + = increase; - = decrease.* Substance use disorder (also known as dependence or abuse) is defined as meeting criteria in the Diagnostic and Statistical Manual of Mental Disorders (DSM–IV) (American Psychiatric
Association [APA], 1994) for either dependence or abuse for illicit drugs or alcohol.† Linear trends were assessed using logistic regression model from the 2002–2014 survey years.§ Logistic regression (p≤0.05).
TABLE 10. Percentage of past year marijuana dependence and abuse* among past year marijuana users† aged ≥12 years, by age group — National Survey on Drug Use and Health, United States, 2002–2014
Age group (yrs)
2002 2003 2004 2005 2006 2007 2008 2009 2010 2011 2012 2013 2014Linear trend
% change (diff)
% (95% CI)
% (95% CI)
% (95% CI)
% (95% CI)
% (95% CI)
% (95% CI)
% (95% CI)
% (95% CI)
% (95% CI)
% (95% CI)
% (95% CI)
% (95% CI)
% (95% CI) p-value§
2002 to 2014
Total 16.7 (15.6–17.8)
16.6 (15.6–17.7)
17.6 (16.5–18.7)
16.1 (15.1–17.2)
16.5 (15.4–17.6)
15.7 (14.6–16.8)
16.3 (15.2–17.5)
15.1 (14.0–16.1)
15.4 (14.3–16.5)
14.0 (13.1–14.9)
13.7 (12.7–14.7)
12.8 (11.8–13.8)
11.9 (11.1–12.7)
<0.001¶ -29
12–17 27.0 (25.2–28.9)
25.5 (23.7–27.5)
26.8 (24.9–28.7)
26.8 (24.8–28.9)
25.9 (23.9–28.1)
24.9 (23.0–26.9)
26.0 (23.9–28.1)
24.8 (22.9–26.9)
25.4 (23.5–27.4)
24.8 (22.9–26.8)
24.0 (21.9–26.1)
21.4 (19.5–23.3)
20.4 (18.4–22.7)
<0.001¶ -24
18–25 20.1 (19.0–21.4)
20.8 (19.5–22.2)
21.6 (20.3–23.0)
21.0 (19.7–22.4)
20.3 (19.0–21.6)
20.4 (19.1–21.8)
20.3 (19.0–21.7)
18.0 (16.8–19.4)
19.1 (17.9–20.5)
18.5 (17.2–19.8)
17.4 (16.1–18.9)
17.1 (15.8–18.4)
15.3 (14.1–16.6)
<0.001¶ -24
≥26 10.9 (9.1–13.1)
10.9 (9.3–12.7)
12.1 (10.4–14.1)
9.9 (8.3–11.7)
11.3 (9.5–13.3)
10.1 (8.5–12.1)
11.3 (9.7–13.2)
10.8 (9.3–12.6)
10.7 (9.0–12.7)
8.6 (7.3–10.1)
9.3 (7.8–10.9)
8.7 (7.1–10.5)
8.7 (7.6–9.9) <0.001¶ -20
Abbreviations: CI = confidence interval; diff = difference; + = increase; - = decrease.* Substance use disorder (also known as dependence or abuse) is defined as meeting criteria in the Diagnostic and Statistical Manual of Mental Disorders (DSM–IV) (American Psychiatric
Association [APA], 1994) for either dependence or abuse for illicit drugs or alcohol.† Analysis limited to past year marijuana users (defined as those who reported use of marijuana within 12 months preceding the date of interview, including those who reported use of
marijuana within 30 days preceding the date of interview).§ Linear trends were assessed using logistic regression model from the 2002–2014 survey years.¶ Logistic regression (p≤0.05).

Surveillance Summaries
MMWR / September 2, 2016 / Vol. 65 / No. 11 25US Department of Health and Human Services/Centers for Disease Control and Prevention
TABLE 11. Percentage of perceived maximum legal penalty in your state for first offense possession of an ounce or less of marijuana for your own use* among all persons aged ≥12 years, by age group — National Survey on Drug Use and Health, United States, 2002–2014
Age group (yrs)
2002 2003 2004 2005 2006 2007 2008 2009 2010 2011 2012 2013 2014Linear trend
% change (diff)
% (95% CI)
% (95% CI)
% (95% CI)
% (95% CI)
% (95% CI)
% (95% CI)
% (95% CI)
% (95% CI)
% (95% CI)
% (95% CI)
% (95% CI)
% (95% CI)
% (95% CI) p-value†
2002 to 2014
FineTotal 29.1
(28.2–29.9)28.8
(28.0–29.6)28.3
(27.5–29.1)28.0
(27.2–28.8)29.1
(28.3–29.8)29.9
(29.1–30.8)31.4
(30.5–32.2)32.8
(32.0–33.6)34.0
(33.1–35.0)34.7
(33.9–35.5)35.5
(34.7–36.3)36.9
(36.0–37.7)36.3
(35.6–36.9)<0.001§ +25
12–17 14.6 (14.0–15.3)
13.2 (12.6–13.9)
12.4 (11.8–13.1)
13.1 (12.4–13.8)
15.8 (15.1–16.5)
16.1 (15.4–16.9)
16.7 (16.0–17.5)
19.8 (19.0–20.7)
19.1 (18.3–19.9)
20.3 (19.5–21.1)
20.1 (19.2–20.9)
20.6 (19.8–21.5)
20.2 (19.3–21.1)
<0.001§ +38
18–25 23.5 (22.7–24.4)
22.8 (22.0–23.7)
22.1 (21.3–23.0)
22.6 (21.8–23.5)
25.0 (24.2–25.8)
24.9 (24.0–25.9)
26.2 (25.3–27.1)
29.5 (28.5–30.5)
31.4 (30.4–32.3)
32.2 (31.1–33.2)
32.9 (31.9–33.9)
34.6 (33.6–35.6)
34.0 (33.0–35.1)
<0.001§ +45
≥26 32.8 (31.7–34.0)
32.8 (31.7–33.9)
32.3 (31.2–33.4)
31.7 (30.6–32.8)
32.2 (31.2–33.2)
33.3 (32.2–34.3)
34.8 (33.6–36.0)
35.6 (34.5–36.7)
36.9 (35.7–38.1)
37.4 (36.3–38.5)
38.4 (37.3–39.5)
39.7 (38.6–40.8)
39.0 (38.2–39.9)
<0.001§ +19
ProbationTotal 17.8
(17.1–18.5)17.9
(17.3–18.5)17.8
(17.2–18.5)17.8
(17.1–18.4)17.1
(16.5–17.7)18.1
(17.5–18.7)17.7
(17.1–18.4)17.1
(16.5–17.7)17.0
(16.4–17.7)17.6
(17.0–18.3)17.5
(16.8–18.1)16.6
(16.0–17.2)16.7
(16.2–17.1)<0.001§ -6
12–17 21.6 (2 0.8–22.4)
21.2 (20.4–22.0)
20.5 (19.7–21.4)
22.0 (21.1–22.8)
20.5 (19.7–21.3)
22.0 (21.2–22.9)
21.3 (20.6–22.1)
20.6 (19.8–21.5)
21.9 (21.0–22.8)
22.4 (21.6–23.3)
22.7 (21.9–23.5)
24.1 (23.2–25.1)
23.4 (22.4–24.3)
<0.001§ +8
18–25 20.2 (19.4–21.1)
21.3 (20.5–22.2)
21.1 (20.2–22.0)
21.4 (20.5–22.2)
19.9 (19.1–20.6)
21.3 (20.6–22.1)
21.5 (20.7–22.2)
20.8 (19.9–21.6)
20.5 (19.7–21.3)
21.2 (20.3–22.1)
21.0 (20.2–21.8)
20.5 (19.7–21.3)
19.9 (19.0–20.9)
NS -1
≥26 16.6 (15.7–17.5)
16.6 (15.8–17.4)
16.7 (15.8–17.6)
16.3 (15.4–17.1)
15.9 (15.2–16.7)
16.8 (15.9–17.6)
16.3 (15.5–17.2)
15.7 (14.9–16.6)
15.5 (14.7–16.4)
16.1 (15.3–17.0)
15.9 (15.1–16.7)
14.6 (13.8–15.4)
15.0 (14.4–15.6)
<0.001§ -10
Community serviceTotal 9.2
(8.8–9.7)9.2
(8.7–9.6)9.3
(8.9–9.8)9.4
(8.9–9.9)8.8
(8.4–9.3)8.4
(7.9–8.9)8.0
(7.6–8.5)7.8
(7.4–8.3)7.9
(7.5–8.4)7.8
(7.4–8.3)7.4
(7.0–7.9)7.3
(6.9–7.8)7.1
(6.8–7.5)<0.001§ -23
12–17 16.9 (16.2–17.7)
16.0 (15.3–16.7)
17.3 (16.6–18.1)
15.7 (15.0–16.4)
13.1 (12.5–13.8)
11.7 (11.1–12.4)
10.8 (10.2–11.5)
11.0 (10.4–11.7)
10.3 (9.7–11.0)
10.7 (10.0–11.3)
11.1 (10.5–11.8)
10.8 (10.1–11.4)
10.8 (10.1–11.6)
<0.001§ -36
18–25 10.3 (9.7–10.9)
10.3 (9.7–11.0)
11.3 (10.7–12.0)
10.6 (9.9–11.2)
9.9 (9.3–10.5)
9.8 (9.3–10.4)
9.4 (8.8–10.0)
8.7 (8.2–9.3)
8.3 (7.8–8.9)
8.1 (7.5–8.6)
8.4 (7.9–8.9)
7.8 (7.3–8.3)
7.8 (7.2–8.4)
<0.001§ -24
≥26 7.7 (7.1–8.3)
7.7 (7.1–8.4)
7.6 (7.0–8.2)
8.1 (7.5–8.8)
7.9 (7.3–8.6)
7.5 (6.9–8.2)
7.3 (6.7–8.0)
7.2 (6.6–7.8)
7.5 (6.9–8.1)
7.4 (6.8–8.0)
6.6 (6.1–7.3)
6.7 (6.2–7.4)
6.4 (6.0–6.9)
<0.001§ -17
Possible prison sentenceTotal 37.0
(36.2–37.8)37.1
(36.3–37.9)37.2
(36.4–38.0)38.1
(37.3–39.0)34.4
(33.7–35.2)33.4
(32.6–34.2)32.9
(32.1–33.7)31.7
(30.9–32.5)30.6
(29.8–31.4)28.7
(28.0–29.5)29.4
(28.7–30.2)26.8
(26.0–27.5)27.3
(26.7–27.9)<0.001§ -26
12–17 35.2 (34.3–36.1)
37.8 (36.8–38.7)
37.7 (36.7–38.8)
37.6 (36.7–38.5)
34.3 (33.4–35.3)
33.6 (32.7–34.6)
34.1 (33.1–35.1)
32.1 (31.1–33.0)
32.1 (31.2–33.1)
31.1 (30.2–32.0)
30.8 (29.8–31.7)
28.5 (27.7–29.4)
29.5 (28.5–30.5)
<0.001§ -16
18–25 38.8 (37.8–39.7)
38.2 (37.2–39.2)
37.7 (36.7–38.8)
38.1 (37.2–39.1)
34.7 (33.8–35.7)
33.9 (32.9–34.9)
33.3 (32.4–34.3)
31.6 (30.7–32.6)
30.4 (29.4–31.3)
29.1 (28.1–30.0)
28.1 (27.2–29.1)
26.9 (26.0–27.8)
27.8 (26.8–28.8)
<0.001§ -28
≥26 36.9 (35.8–38.1)
36.8 (35.6–37.9)
37.0 (35.9–38.1)
38.2 (37.1–39.3)
34.4 (33.4–35.4)
33.3 (32.2–34.4)
32.6 (31.6–33.7)
31.6 (30.6–32.7)
30.4 (29.4–31.5)
28.3 (27.3–29.4)
29.5 (28.5–30.6)
26.5 (25.5–27.5)
26.8 (26.1–27.6)
<0.001§ -27
Mandatory prison sentence Total 6.9
(6.5–7.3)7.1
(6.6–7.5)7.3
(6.9–7.8)6.7
(6.3–7.1)6.9
(6.5–7.3)6.5
(6.1–6.9)6.3
(5.9–6.7)6.4
(6.1–6.9)5.9
(5.5–6.3)5.6
(5.2–6.1)5.1
(4.8–5.5)4.8
(4.5–5.2)4.8
(4.6–5.1)<0.001§ -30
12–17 11.6 (11.0–12.3)
11.9 (11.3–12.5)
11.9 (11.3–12.6)
11.7 (11.1–12.4)
12.6 (12.0–13.2)
12.6 (12.0–13.3)
12.5 (11.8–13.2)
12.1 (11.4–12.8)
12.2 (11.5–12.8)
11.1 (10.5–11.7)
11.0 (10.4–11.7)
10.9 (10.2–11.6)
10.8 (10.1–11.5)
<0.001§ -7
18–25 7.2 (6.7–7.7)
7.3 (6.8–7.8)
7.7 (7.2–8.3)
7.3 (6.8–7.9)
7.6 (7.1–8.2)
7.2 (6.7–7.7)
6.8 (6.3–7.3)
6.3 (5.8–6.8)
6.3 (5.9–6.8)
5.6 (5.2–6.2)
5.8 (5.3–6.3)
5.1 (4.7–5.6)
5.2 (4.8–5.7)
<0.001§ -28
≥26 6.0 (5.5–6.6)
6.2 (5.6–6.7)
6.5 (5.9–7.2)
5.7 (5.2–6.3)
5.8 (5.3–6.3)
5.3 (4.8–5.9)
5.2 (4.7–5.7)
5.6 (5.1–6.2)
4.8 (4.3–5.4)
4.8 (4.3–5.4)
4.1 (3.7–4.6)
3.9 (3.4–4.3)
3.9 (3.6–4.2)
<0.001§ -35
No penalty¶
Total DNA DNA DNA DNA 3.6 (3.3–4.0)
3.7 (3.4–4.1)
3.7 (3.4–4.1)
4.1 (3.8–4.5)
4.5 (4.1–4.9)
5.5 (5.0–5.9)
5.1 (4.6–5.5)
7.7 (7.1–8.3)
7.9 (7.5–8.3)
<0.001§ +119**
12–17 DNA DNA DNA DNA 3.6 (3.3–4.0)
3.9 (3.5–4.3)
4.5 (4.1–5.0)
4.4 (4.0–4.9)
4.4 (4.0–4.9)
4.4 (4.0–4.9)
4.3 (3.9–4.7)
5.0 (4.6–5.5)
5.4 (4.9–5.9)
<0.001§ +50**
18–25 DNA DNA DNA DNA 2.9 (2.6–3.3)
2.8 (2.5–3.2)
2.8 (2.5–3.2)
3.1 (2.8–3.5)
3.1 (2.8–3.5)
3.9 (3.4–4.3)
3.8 (3.4–4.2)
5.1 (4.7–5.6)
5.3 (4.7–5.8)
<0.001§ +83**
≥26 DNA DNA DNA DNA 3.8 (3.4–4.3)
3.9 (3.4–4.5)
3.8 (3.3–4.3)
4.3 (3.8–4.8)
4.8 (4.3–5.4)
6.0 (5.4–6.6)
5.4 (4.9–6.1)
8.6 (7.9–9.4)
8.8 (8.3–9.4)
<0.001§ +132**
Abbreviations: CI = confidence interval; diff = difference; DNA = data not available; NS = not significant; + = increase; - = decrease. * Perception of legal penalty for marijuana possession is defined as those who reported their perception of the maximum legal penalty in their state of residence for first offense possession
of an ounce or less of marijuana for their own use. † Linear trends were assessed using logistic regression model from the 2002–2014 survey years. § Logistic regression (p≤0.05). ¶ Tests of slopes should be interpreted with caution given that not all responses options are available for each year of data collection and the percentages are distributions (i.e., they are
affected by the presence or absence of response options). ** Percentage change differences calculations are made from the 2006–2014 survey cycles.


ISSN: 1546-0738 (Print)
The Morbidity and Mortality Weekly Report (MMWR) Series is prepared by the Centers for Disease Control and Prevention (CDC) and is available free of charge in electronic format. To receive an electronic copy each week, visit MMWR’s free subscription page at http://www.cdc.gov/mmwr/mmwrsubscribe.html. Paper copy subscriptions are available through the Superintendent of Documents, U.S. Government Printing Office, Washington, DC 20402; telephone 202-512-1800.
Readers who have difficulty accessing this PDF file may access the HTML file at http://www.cdc.gov/mmwr/volumes/65/ss/ss6511a1.htm?s_cid=ss6511a1_w. Address all inquiries about the MMWR Series, including material to be considered for publication, to Executive Editor, MMWR Series, Mailstop E-90, CDC, 1600 Clifton Rd., N.E., Atlanta, GA 30329-4027 or to [email protected].
All material in the MMWR Series is in the public domain and may be used and reprinted without permission; citation as to source, however, is appreciated.
Use of trade names and commercial sources is for identification only and does not imply endorsement by the U.S. Department of Health and Human Services.
References to non-CDC sites on the Internet are provided as a service to MMWR readers and do not constitute or imply endorsement of these organizations or their programs by CDC or the U.S. Department of Health and Human Services. CDC is not responsible for the content of these sites. URL addresses listed in MMWR were current as of the date of publication.