NATIONAL COLLEGIATE MEN’S VOLLEYBALL RECORDSfs.ncaa.org/Docs/stats/m_volleyball_RB/2018/NC.pdf ·...
47
Individual Records 2 Individual Leaders 4 Annual Individual Champions 25 Team Records 26 Team Leaders 28 Division I Winningest Teams 41 Annual Team Champions 42 AVCA Final Division I Polls 43 NATIONAL COLLEGIATE MEN’S VOLLEYBALL RECORDS
Transcript of NATIONAL COLLEGIATE MEN’S VOLLEYBALL RECORDSfs.ncaa.org/Docs/stats/m_volleyball_RB/2018/NC.pdf ·...
Individual Records 2Individual Leaders 4Annual Individual Champions 25Team Records 26Team Leaders 28Division I Winningest Teams 41Annual Team Champions 42AVCA Final Division I Polls 43
NATIONAL COLLEGIATE
MEN’S VOLLEYBALLRECORDS
Individual Records 2
The format of a match changed in 2008. The term “game” was changed to “set.” In addition, scoring for those sets moved from 30 points to 25 points in 2011, except in matches that go to the full five sets, in which the fifth set is still played to 15. The match format previously changed in 2001, with scoring for each set moving from 15 points to 30 points, except in matches that went the full five sets, in which the winning score again remained at 15. In reflection of these changes, category leaders under the different scoring formats are separated in order to avoid eliminating the achievements of those student-athletes who played under the previ-ous formats.Official NCAA volleyball records began with the 1970 season, corresponding with the first NCAA championship, and are based on information sub-mitted to the NCAA statistics service by institutions participating in the statistics rankings. In statisti-cal rankings, the rounding of percentages and/or averages may indicate ties where none exists. In these cases, the numerical order of the rankings is accurate.Research continues on single match and career data. Official career records include players whose career statistics were recorded during the era of official NCAA play.
ATTACKKillsThree-set match (1970-2000)
32—Chris Wright, SUNY New Paltz vs. Mennonite, Feb. 28, 1998
Three-set match (2001-present)29—Paul Carroll, Pepperdine vs. BYU, March
8, 2008Four-set match (1970-2000)
55—Jason Mulholland, Southern California vs. CSUN, April 28, 1993
Four-set match (2001-present)37—Paul Carroll, Pepperdine vs. UC Irvine,
Feb. 20, 2009Five-set match (1970-2000)
52— Paul Nihipali, UCLA vs. UC Santa Barbara, April 27, 1996
Five-set match (2001-present)37—Brandon Mueller, Springfield vs. Ball
St., Feb. 1, 2004; Paul Carroll, Pepperdine vs. UCLA, Jan. 24, 2007; Paul Carroll, Pepperdine vs. Southern California, May 2, 2009; Evan Romero, Stanford vs. Pepperdine, April 9, 2010
Season (1970-2000)915—Victor Rivera, Lewis, 1998 (123 sets)
Season (30-point scoring; 2001-10)671—Evan Patak, UC Santa Barbara, 2007
(116 sets)Season (25-point scoring; 2010-present)
551—Jonas Umlauft, Hawaii, 2011 (551 sets)Career (1970-2000, sideout scoring)
3,034—Brent Hilliard, Long Beach St., 1990-93 (426 sets)
Career (2001-present, rally scoring)2,198—Costas Theocharidis, Hawaii, 2000-03
(399 sets)
Kills Per SetSeason (1970-2000)
8.65—Curt Toppel, Stanford, 2000 (623 kills in 72 sets)
Season (30-point scoring; 2001-10)6.54—Paul Carroll, Pepperdine, 2008 (497 kills
in 76 sets)Season (25-point scoring; 2011-present)
5.57—Jonas Umlauft, Hawaii, 2011 (551 kills in 99 sets)
Career (1970-2000, sideout scoring)7.81—Yuval Katz, Hawaii, 1995-96 (1,444 kills
in 185 sets)Career (2001-present, rally scoring)
6.03—Curt Toppel, Stanford, 2000-03 (1,840 kills in 305 sets)
Total AttacksThree-set match (1970-2000)
Not AvailableThree-set match (2001-present)
47—Jamion Hartley, Ball St. vs. Limestone, March 29, 2013
Four-set match (1970-2000)99—Tom Sorensen, Pepperdine vs. Long Beach
St., April 15, 1992Four-set match (2001-present)
74—Paul Carroll, Pepperdine vs. Penn St., May 3, 2008
Five-set match (1970-2000)89—Paul Nihipali, UCLA vs. Lewis, March 4,
1997Five-set match (2001-present)
80—Brandon Mueller, Springfield vs. NYU, March 30, 2004
Season (1970-2000)1,568—Victor Rivera, Lewis, 1998 (123 sets)
Season (30-point scoring; 2001-10)1,365—Matt Zbyszewski, Fort Wayne, 2005
(119 sets)Season (25-point scoring; 2010-present)
1,203—Shawn Sangrey, Ohio St., 2012 (109 sets)
Career (1970-2000, sideout scoring)5,678—Brent Hilliard, Long Beach St., 1990-93
(426 sets)Career (2001-present, rally scoring)
4,569—Jeff Menzel, UC Santa Barbara, 2008-11
Attacks Per SetSeason (1970-2000)
18.62—David Rottman, UC Santa Barbara, 1988 (1,285 attacks in 69 sets)
Season (30-point scoring; 2001-10)12.73—Jeff Ptak, Fort Wayne, 2001 (1,044
attacks in 82 sets)Season (25-point scoring; 2011-present)
11.18—Jonas Umlauft, Hawaii, 2011 (1,107 attacks in 99 sets)
Career (1970-2000, sideout scoring)16.60—Matt Rigg, Pepperdine, 1984-87 (3,221
attacks in 194 sets)Career (2001-present, rally scoring)
11.30—Costas Theocharidis, Hawaii, 2000-03 (4,510 attacks in 399 sets)
Hitting Percentage*10 or more attacks
1.000—George Huhmann, Princeton vs. George Mason, Feb. 18, 2017 (10-0/10); Jacob Schmiegelt, Lewis vs. Quincy, March 4, 2017 (10-0/10)
15 or more attacks.889—Chris Underwood, Southern California vs.
Loyola Marymount, Jan. 29, 1992 (17-1/18); Ricky Albano, Springfield vs. Vassar, Feb. 28, 2003 (16-0/18)
20 or more attacks.857—Jonathan Alleman, BYU vs. George
Mason, March 27, 2004 (18-0/21)Season (1970-2000)
.539—Tim Kelly, UCLA, 1994 (193-26/310 in 70 sets)
Season (30-point scoring; 2001-10).562—Max Holt, Penn St., 2009 (270-39/411)
Season (25-point scoring; 2011-present).517—Fabio Diniz, Pfeiffer, 2015 (235-37/383)
Career (1970-2000, sideout scoring).481—Colin McMillan, Ohio St., 1997-2000
(1,206-201/2,089 in 352 sets)Career (2001-present, rally scoring)
.474—Bobby Walsh, Lewis, 2013-16 (742-109/1,336 in 430 sets)
*Hitting percentage is derived by subtracting errors from kills and dividing that difference by total attacks.
SETTINGAssistsThree-set match (1970-2000)
55—Robert Manosca, SUNY New Paltz vs. Mennonite, March 28, 1998
Three-set match (2001-present)57—Kasey Crider, Pepperdine vs. Stanford,
Feb. 19, 2010Four-set match (1970-2000)
74—Robert Manosca, SUNY New Paltz vs. MIT, Feb. 28, 1998
Four-set match (2001-present)77—Carlos Moreno, BYU vs. Pepperdine,
March 13, 2004Five-set match (1970-2000)
129—Donald Suxho, Southern California vs. Ohio St., Jan. 24, 1997
Five-set match (2001-present)84—Carlos Moreno, BYU vs. Stanford, April
20, 2002Season (1970-2000)
2,130—Jason Stimpfig, Long Beach St., 1993 (113 sets)
Season (30-point scoring; 2001-10)1,774—Tyler Hildebrand, Long Beach St., 2004
(2004 sets)Season (25-point scoring; 2010-present)
1,364—Josh Tuaniga, Long Beach St., 2016 (122 sets)
Career (1970-2000, sideout scoring)7,281—Chris Cooper, Ball St., 1987-90 (?? sets)
Career (2001-present, rally scoring)6,651—Tyler Hildebrand, Long Beach St., 2003-
06 (469 sets)
Assists Per SetSeason (1970-2000)
26.57—Jon Wallace, UC Santa Barbara, 1988 (1,860 assists in 70 sets)
Season (30-point scoring; 2001-10)14.25—Carlos Moreno, BYU, 2003 (1,567
assists in 110 sets)Season (25-point scoring; 2010-present)
12.38—Jackson Mettechecchia, Mount Olive, 2011 (817 assists in 66 sets)
Career (1970-2000, sideout scoring)24.44—Jon Wallace, UC Santa Barbara, 1986-
89 (5,011 assists in 205 sets)
INDIVIDUAL RECORDS
Individual Records 3
Career (2001-present, rally scoring)15.60—Jimmy Killian, Southern California,
2005-08 (4,820 assists in 309 sets)
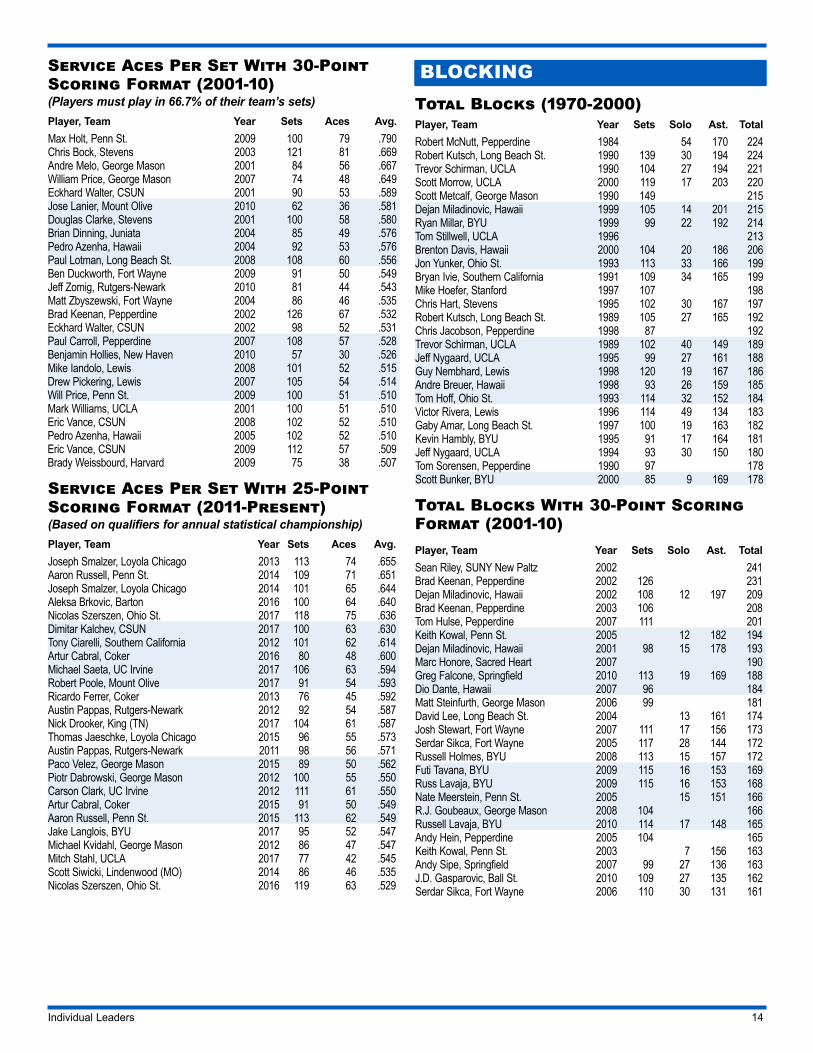
SERVICEService AcesThree-set match (1970-2000)
Not AvailableThree-set match (2001-present)
11—Matt McCarthy, Ball St. vs. Central St. (OH), Feb. 7, 2006; Mark Termion, Ball St. vs. Central St. (OH), Feb. 7, 2006; Tony Ciarelli, Southern California vs. Long Beach St., April 12, 2012
Four-set match (1970-2000)18—Kamil Zitka, SUNY New Paltz vs. Concordia
(NY), Feb. 16, 1995Four-set match (2001-present)
10—Adam Naeve, UCLA vs. Pepperdine, Feb. 3, 2001
Five-set match (1970-2000)16—Jarrod Baranowski, SUNY New Paltz vs.
NYU, Feb. 13, 1995Five-set match (2001-present)
10—Chris Ganke, SUNY New Paltz vs. Yeshiva, March 30, 2004
Season (1970-2000)81—Javier Placer, Springfield, 1993 & 1994
(83 sets)Season (30-point scoring; 2001-10)
81—Chris Bock, Stevens, 2003 (121 sets)Season (25-point scoring; 2010-present)
75—Nicolas Szerszen, Ohio St., 2017 (118 sets)Career (1970-2000, sideout scoring)
247—Javier Placer, Springfield, 1993-96 (300 sets)
Career (2001-present, rally scoring)255—Evan Patak, UC Santa Barbara, 2004-07
(385 sets)
Service Aces Per SetSeason (1970-2000)
.976—Javier Placer, Springfield, 1993 & 1994 (81 aces in 83 sets)
Season (30-point scoring; 2001-10).790—Max Holt, Penn St., 2009 (79 aces in
100 sets)Season (25-point scoring; 2010-present)
.655—Joseph Smalzer, Loyola Chicago, 2013 (74 aces in 113 sets)
Career (1970-2000, sideout scoring).823—Javier Placer, Springfield, 1993-96 (247
aces in 300 sets)Career (2001-present, rally scoring)
.662—Evan Patak, UC Santa Barbara, 2004-07 (255 aces in 385 sets)
Consecutive Points Served
Not Available
Consecutive Points Served To Start Match
Not Available
BLOCKINGTotal BlocksThree-set match (1970-2000)
16—Sky Holden, SUNY New Paltz vs. East Stroudsburg, Feb. 4, 1995 (11 BS/5 BA)
Three-set match (2001-present)14—Matt Walsh, Ball St. vs. Sacred Heart, Jan.
24, 2015Four-set match (1970-2000)
16—Shadow Holden, SUNY New Paltz vs. NYU, Feb. 19, 1997 (6 BS/10 BA)
Four-set match (2001-present)16—Sean Riley, SUNY New Paltz vs. Johnson
& Wales (RI), Feb. 20, 2002 (4 BS/12 BA)Five-set match (1970-2000)
27—Mark Wellborn, Southern California vs. UC Santa Barbara, April 27, 1979 (5 BS/22 BA)
Five-set match (2001-present)19—Josh Spiro, SUNY New Paltz vs. Baruch,
Jan. 26, 2006 (1 BS/18 BA)Season (1970-2000)
224—Robert McNutt, Pepperdine (54 solo, 170 assists)
Season (30-point scoring; 2001-10)241—Sean Riley, SUNY New Paltz, 2002
Season (25-point scoring; 2010-present)178—Piotr Dabrowski, George Mason, 2012
(120 sets, 21 solo, 157 assists)Career (1970-2000, sideout scoring)
682—Trevor Schirman, UCLA, 1987-90 (390 sets, 120 solo, 562 assists)
Career (2001-present, rally scoring)745—Dejan Miladinovic, Hawaii, 1998-99, 2001-
02 (47 solo, 698 assists in 401 sets)
Blocks Per Set (Since 2001)Season (1970-2000)
2.66—Hidde Van Beest, BYU, 1998 (173 total blocks in 65 sets)
Season (30-point scoring; 2001-10)1.97—Dejan Miladinovic, Hawaii, 2001 (193
total blocks in 98 sets)Season (25-point scoring; 2010-present)
1.60—Robert Feathers, Southern California, 2012 (154 total blocks in 96 sets)
Career (1970-2000, sideout scoring)2.64—Dave Shaffer, CSUN, 1982-85 (325 total
in 123 sets)Career (2001-present, rally scoring)
1.86—Dejan Miladinovic, Hawaii, 1998-99, 2001-02 (745 total in 401 sets)
DEFENSEDigsThree-set match (1970-2000)
Not AvailableThree-set match (2001-present)
25—Jeff Lee, SUNY New Paltz vs. New Jersey City, Jan. 31, 2007; Pedro Medina, SUNY New Paltz vs. Vassar, March 5, 2008
Four-set match (1970-2000)Not Available
Four-set match (2001-present)28—Pedro Medina, SUNY New Paltz vs.
Newbury, April 8, 2006Five-set match (1970-2000)
27—Russell Brock, Southern California vs. UC Santa Barbara, April 13, 1994
Five-set match (2001-present)29—Ian Peckler, Ball St. vs. Carthage, Jan.
20, 2006Season (1970-2000)
448—Mike Esposito, Stevens, 2000 (112 sets) Season (30-point scoring; 2001-10)
502—Trent Bruns, Grand Canyon, 2010 (139 sets)
Season (25-point scoring; 2010-present)375—Michael McMahon, Barton, 2015 (123
sets)Career (1970-2000, sideout scoring)
1,223—Will Molina, Stevens, 1998-2001 (359 sets)
Career (2001-present, rally scoring)1,402—Erik Shoji, Stanford, 2009-12 (443 sets)
Digs Per SetSeason (1970-2000)
4.00—Mike Esposito, Stevens, 2000 (448 digs in 112 sets)
Season (30-point scoring; 2001-10)3.93—Mark Hess, Pfeiffer, 2010 (318 digs in
81 sets)Season (25-point scoring; 2010-present)
3.29—Josh Donahue, Mount Olive, 2015 (293 digs in 89 sets)
Career (1970-2000, sideout scoring)3.41—Will Molina, Stevens, 1998-2001 (1,223
digs in 359 sets)Career (2001-present, rally scoring)
3.16—Erik Shoji, Stanford, 2009-12 (1,402 digs in 443 sets)
MISCELLANEOUSMatches PlayedCareer
132—Doug McBride, Lewis, 1994-97; Victor Rivera, Lewis, 1996-99
Consecutive Matches PlayedCareer
119—Sean Rooney, Pepperdine, 2002-05
Sets PlayedCareer
469—Tyler Hildebrand, Long Beach St., 2003-06
Consecutive Sets PlayedCareer
Not Available
Individual Leaders 4
SINGLE-MATCH RECORDS
ATTACKKills, Three-Set Match (1970-2000)No. Player, Team vs. Opponent Date 32 Chris Wright, SUNY New Paltz vs. Mennonite Feb. 28, 199826 Chris Wright, SUNY New Paltz vs. Roger Williams Feb. 21, 1998
Kills, Three-Set Match (2001-Present)No. Player, Team vs. Opponent Date 29 Paul Carroll, Pepperdine vs. BYU March 8, 200826 Brandon Mueller, Springfield vs. Princeton March 6, 200426 Nick Meyer, Ball St. vs. Rutgers-Newark March 4, 200626 Arvis Greene, Jr., CSUN vs. Stanford Feb. 3, 201724 Kyle Weindel, Ball St. vs. Concordia (??) Jan. 11, 200224 Sean Rooney, Pepperdine vs. UCLA April 3, 200424 John Parfitt, Pepperdine vs. CSUN Feb. 23, 200524 Ivan Perez, BYU vs. Stanford Feb. 23, 200824 Paul Carroll, Pepperdine vs. Stanford March 28, 200824 Brad Lawson, Stanford vs. Penn St. May 8, 2010
Kills, Four-Set Match (1970-2000)No. Player, Team vs. Opponent Date 55 Jason Mulholland, Southern California vs. CSUN April 28, 199353 Tom Sorensen, Pepperdine vs. UCLA Feb. 25, 1993
Kills, Four-Set Match (2001-Present)No. Player, Team vs. Opponent Date 37 Paul Carroll, Pepperdine vs. UC Irvine Feb. 20, 200935 Paul Carroll, Pepperdine vs. Penn St. May 3, 200833 Paul Carroll, Pepperdine vs. CSUN April 30, 200930 Nick Meyer, Ball St. vs. George Mason Jan. 19, 200730 Patrick Durbin, Ball St. vs. Lewis April 24, 200829 Curt Toppel, Stanford vs. UC San Diego Feb. 20, 200129 Chris Ganje, SUNY New Paltz vs. Medaille March 2, 200329 Brad Lawson, Stanford vs. Southern California Feb. 20, 201029 Lucas Yoder, Southern California vs. UC Irvine Feb. 3, 201729 Tanner Syftestad, UC San Diego vs. California Baptist March 14, 2017
Kills, Five-Set Match (1970-2000)No. Player, Team vs. Opponent Date 52 Paul Nihipali, UCLA vs. UC Santa Barbara April 27, 1996
Kills, Five-Set Match (2001-Present)No. Player, Team vs. Opponent Date 37 Brandon Mueller, Springfield vs. Ball St. Feb. 1, 200437 Paul Carroll, Pepperdine vs. UCLA Jan. 24, 200737 Paul Carroll, Pepperdine vs. Southern California May 2, 200937 Evan Romero, Stanford vs. Pepperdine April 9, 201036 Brandon Mueller, Springfield vs. NYU March 30, 200436 Sean Rooney, Pepperdine vs. Pacific Jan. 14, 200534 Curt Toppel, Stanford vs. Long Beach St. March 1, 200234 Evan Romero, Stanford vs. Ball St. Feb. 2, 200834 Jacob Delson, UC Santa Barbara vs. UC Irvine Feb. 25, 201733 Lucas Yoder, Southern California vs. Penn St. Jan. 7, 2017
Total Attacks, Three-Set Match (1970-2000)No. Player, Team vs. Opponent Date
Not Available
Total Attacks, Three-Set Match (2001-Present)No. Player, Team vs. Opponent Date 47 Jamion Hartley, Ball St. vs. Limestone March 29, 201345 Brandon Mueller, Springfield vs. Princeton March 6, 200445 Stijn van Tilburg, Hawaii vs. Penn St. May 2, 201744 Nick Meyer, Ball St. vs. Lewis April 21, 200744 Calvin Mende, Penn St. vs. Hawaii May 2, 201743 Nick Meyer, Ball St. vs. Rutgers-Newark March 4, 200642 Brandon Mueller, Springfield vs. George Mason April 19, 200342 Brandon Mueller, Springfield vs. Ball St. Feb. 5, 200541 Brandon Mueller, Springfield vs. Harvard March 27, 200441 Ivan Perez, BYU vs. Long Beach St. March 25, 200541 Eric Fitterer, Lewis vs. Lindenwood (MO) March 22, 2013
Total Attacks, Four-Set Match (1970-2000)No. Player, Team vs. Opponent Date 99 Tom Sorensen, Pepperdine vs. Long Beach St. April 15, 1992
Total Attacks, Four-Set Match (2001-Present)No. Player, Team vs. Opponent Date 74 Paul Carroll, Pepperdine vs. Penn St. May 3, 200869 Paul Carroll, Pepperdine vs. CSUN April 30, 200963 Brandon Mueller, Springfield vs. Loyola Chicago March 26, 200461 Brandon Mueller, Springfield vs. NYU March 10, 200457 Nick Meyer, Ball St. vs. St. Francis (IL) Jan. 13, 200757 Lucas Yoder, Southern California vs. Long Beach St. April 15, 201755 Patrick Durbin, Ball St. vs. Lewis April 24, 200855 Taylor Sander, BYU vs. Long Beach St. March 7, 201454 Nathan Klaas, Lewis vs. St. Francis (IL) Jan. 30, 201054 Brandon Mueller, Springfield vs. NYU Feb. 5, 200354 Brandon Mueller, Springfield vs. Penn St. Feb. 20, 2004
Total Attacks, Five-Set Match (1970-2000)No. Player, Team vs. Opponent Date 89 Paul Nihipali, UCLA vs. Lewis March 4, 1997
Total Attacks, Five-Set Match (2001-Present)No. Player, Team vs. Opponent Date 80 Brandon Mueller, Springfield vs. NYU March 30, 200478 Paul Carroll, Pepperdine vs. Southern California May 2, 200970 Paul Carroll, Pepperdine vs. UCLA Jan. 24, 200767 Brandon Mueller, Springfield vs. Saint Francis (PA) Feb. 7, 200465 Brandon Mueller, Springfield vs. Ball St. Feb. 1, 200465 Brandon Mueller, Springfield vs. Princeton March 23, 200464 Geoff Powell, Lewis vs. Ball St. March 29, 201464 Jacob Delson, UC Santa Barbara vs. UC Irvine Feb. 25, 201762 Jordan Ewert, Stanford vs. UC Santa Barbara Feb. 11, 2017
INDIVIDUAL LEADERS
Individual Leaders 5
No. Player, Team vs. Opponent Date 60 Greg Lardo, Springfield vs. Ohio St. Feb. 2, 200360 Jay Petty, Lewis vs. Ohio St. April 28, 2012
Hitting Percentage*(10 or more attacks)Pct. (K-E/TA) Player, Team vs. Opponent Date1.000 (10-0/10) George Huhmann, Princeton vs. George Mason Feb. 18, 20171.000 (10-0/10) Jacob Schmiegelt, Lewis vs. Quincy March 4, 2017.923 (12-0/13) Michael Burke, BYU vs. Southern California April 15, 2004.917 (11-0/12) Josh Day, Southern California vs. UC Santa
BarbaraJuly 5, 1905
.909 (10-0/11) Andy Hein, Pepperdine vs. Long Beach St. April 30, 2005
.857 (12-0/14) Yosleyder Cala, BYU vs. Stanford March 3, 2006
.846 (11-0/13) Mitchell Penning, Pepperdine vs. BYU March 20, 2015
.833 (10-0/12) Brad Keenan, Pepperdine vs. UC Irvine Jan. 26, 2002
.833 (10-0/12) Futi Tavana, BYU vs. Long Beach St. March 23, 2012
Hitting Percentage*(15 or more attacks)Pct. (K-E/TA) Player, Team vs. Opponent Date.889 (17-1/18) Chris Underwood, Southern California vs.
Loyola MarymountJan. 29, 1992
.889 (16-0/18) Ricky Albano, Springfield vs. Vassar Feb. 28, 2003
.882 (16-1/17) Andy Hein, Pepperdine vs. UC San Diego March 6, 2004
.875 (14-0/16) Tyler Jaynes, Pepperdine vs. California Baptist March 22, 2008
.833 (15-0/18) Luca Berger, Coker vs. Bluefield Col. Feb. 10, 2017
.812 (13-0/16) Scott Rhein, Pepperdine vs. UC San Diego March 15, 2013
.812 (13-0/16) Matt Tarantino, Pepperdine vs. Hawaii Jan. 15, 2016
Hitting Percentage* (20 or more attacks)Pct. (K-E/TA) Player, Team vs. Opponent Date.857 (18-0/21) Jonathan Alleman, BYU vs. George Mason March 27, 2004.810 (17-0/21) Graydon Schroeder, Fort Wayne vs. McKendree Feb. 3, 2017.800 (16-0/20) Kevin Owens, Ball St. vs. Ohio St. March 23, 2014.783 (19-1/23) Geoff Powell, Lewis vs. Quincy Feb. 28, 2014.767 (24-1/30) Geoff Powell, Lewis vs. BYU Jan. 11, 2013.762 (17-1/21) Taylor Sander, BYU vs. Pepperdine March 28, 2013.760 (20-1/25) J.D. Gasparovic, Ball St. vs. St. Francis (IL) Feb. 20, 2010.750 (16-1/20) Taylor Sander, BYU vs. CSUN March 29, 2012.750 (16-1/20) Taylor Sander, BYU vs. Cal Baptist March 8, 2013.739 (18-1/23) Greg Petty, Lewis vs. Ball St. Feb. 22, 2014*Hitting percentage is derived by subtracting errors from kills and dividing that difference by total attacks.
SETTINGAssists, Three-Set Match (1970-2000)No. Player, Team vs. Opponent Date 55 Robert Manosca, SUNY New Paltz vs. Mennonite March 28, 1998
Assists, Three-Set Match (2001-Present)No. Player, Team vs. Opponent Date 57 Kasey Crider, Pepperdine vs. Stanford Feb. 19, 201055 John Mayer, Pepperdine vs. Stanford March 29, 200354 Ethan Pheister, Ball St. vs. St. Francis (IL) April 10, 201053 Kawika Shoji, Stanford vs. BYU Feb. 23, 200853 Mike Iandolo, Lewis vs. Juniata March 19, 201052 Keith Schunzel, Ball St. vs. Fort Wayne April 14, 200152 Keith Schunzel, Ball St. vs. Ohio St. April 12, 200352 Jonathan Winder, Pepperdine vs. UC Santa Barbara April 8, 2006
No. Player, Team vs. Opponent Date 52 Kasey Crider, Pepperdine vs. Pacific Feb. 17, 201052 Kawika Shoji, Stanford vs. Pepperdine Feb. 19, 2010
Assists, Four-Set Match (1970-2000)No. Player, Team vs. Opponent Date 74 Robert Manosca, SUNY New Paltz vs. MIT Feb. 28, 199872 Leandro Lopez, SUNY New Paltz vs. NYU Feb. 19, 199768 Leandro Lopez, SUNY New Paltz vs. Concordia (NY) March 8, 1997
Assists, Four-Set Match (2001-Present)No. Player, Team vs. Opponent Date 77 Carlos Moreno, BYU vs. Pepperdine March 13, 200476 Carlos Moreno, BYU vs. CSUN April 19, 200375 Beau Daniels, Pepperdine vs. Stanford April 13, 200274 Kasey Crider, Pepperdine vs. CSUN Feb. 26, 201070 Kasey Crider, Pepperdine vs. CSUN April 30, 200968 Keith Schunzel, Ball St. vs. Mercyhurst April 20, 200268 Keith Schunzel, Ball St. vs. Lewis April 26, 200266 Andrew Cassius, SUNY New Paltz vs. New Jersey City March 17, 201065 Michael Saeta, UC Irvine vs. Pepperdine March 25, 2017
Assists, Five-Set Match (1970-2000)No. Player, Team vs. Opponent Date 129 Donald Suxho, Southern California vs. Ohio St. Jan. 24, 199773 Robert Manosca, SUNY New Paltz vs. NYU March 10, 1998
Assists, Five-Set Match (2001-Present)No. Player, Team vs. Opponent Date 84 Carlos Moreno, BYU vs. Stanford April 20, 200282 Keith Schunzel, Ball St. vs. Lewis May 1, 200481 Keith Schunzel, Ball St. vs. Loyola Chicago April 5, 200279 Carlos Moreno, BYU vs. Pepperdine April 26, 200377 Beau Daniels, Pepperdine vs. CSUN Jan. 29, 200277 Brett Hughes, Pepperdine vs. UCLA Jan. 24, 200776 Kevin Hansen, Stanford vs. Pepperdine Feb. 22, 200276 Kasey Crider, Pepperdine vs. Southern California Jan. 29, 201075 Hector Lebron, BYU vs. Hawaii April 14, 200175 Ethan Pheister, Ball St. vs. Fort Wayne March 21, 2008
Individual Leaders 6
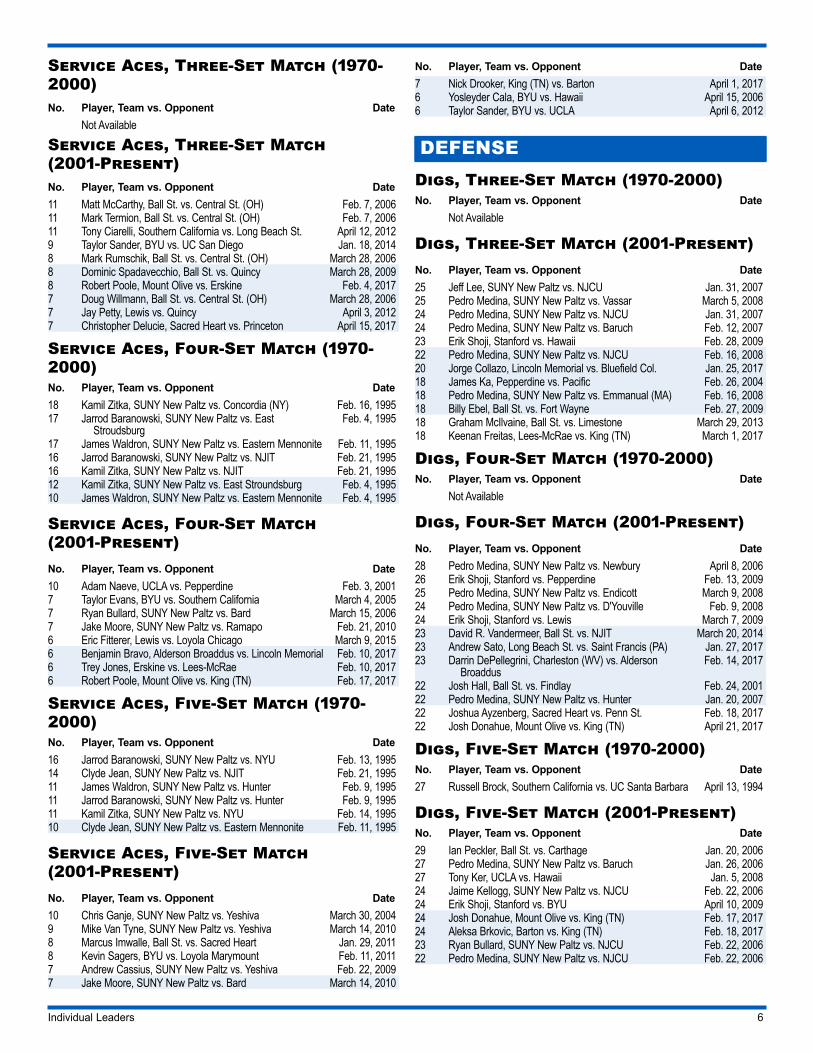
Service Aces, Three-Set Match (1970-2000)No. Player, Team vs. Opponent Date
Not Available
Service Aces, Three-Set Match (2001-Present)No. Player, Team vs. Opponent Date 11 Matt McCarthy, Ball St. vs. Central St. (OH) Feb. 7, 200611 Mark Termion, Ball St. vs. Central St. (OH) Feb. 7, 200611 Tony Ciarelli, Southern California vs. Long Beach St. April 12, 20129 Taylor Sander, BYU vs. UC San Diego Jan. 18, 20148 Mark Rumschik, Ball St. vs. Central St. (OH) March 28, 20068 Dominic Spadavecchio, Ball St. vs. Quincy March 28, 20098 Robert Poole, Mount Olive vs. Erskine Feb. 4, 20177 Doug Willmann, Ball St. vs. Central St. (OH) March 28, 20067 Jay Petty, Lewis vs. Quincy April 3, 20127 Christopher Delucie, Sacred Heart vs. Princeton April 15, 2017
Service Aces, Four-Set Match (1970-2000)No. Player, Team vs. Opponent Date 18 Kamil Zitka, SUNY New Paltz vs. Concordia (NY) Feb. 16, 199517 Jarrod Baranowski, SUNY New Paltz vs. East
StroudsburgFeb. 4, 1995
17 James Waldron, SUNY New Paltz vs. Eastern Mennonite Feb. 11, 199516 Jarrod Baranowski, SUNY New Paltz vs. NJIT Feb. 21, 199516 Kamil Zitka, SUNY New Paltz vs. NJIT Feb. 21, 199512 Kamil Zitka, SUNY New Paltz vs. East Stroundsburg Feb. 4, 199510 James Waldron, SUNY New Paltz vs. Eastern Mennonite Feb. 4, 1995
Service Aces, Four-Set Match (2001-Present)No. Player, Team vs. Opponent Date 10 Adam Naeve, UCLA vs. Pepperdine Feb. 3, 20017 Taylor Evans, BYU vs. Southern California March 4, 20057 Ryan Bullard, SUNY New Paltz vs. Bard March 15, 20067 Jake Moore, SUNY New Paltz vs. Ramapo Feb. 21, 20106 Eric Fitterer, Lewis vs. Loyola Chicago March 9, 20156 Benjamin Bravo, Alderson Broaddus vs. Lincoln Memorial Feb. 10, 20176 Trey Jones, Erskine vs. Lees-McRae Feb. 10, 20176 Robert Poole, Mount Olive vs. King (TN) Feb. 17, 2017
Service Aces, Five-Set Match (1970-2000)No. Player, Team vs. Opponent Date 16 Jarrod Baranowski, SUNY New Paltz vs. NYU Feb. 13, 199514 Clyde Jean, SUNY New Paltz vs. NJIT Feb. 21, 199511 James Waldron, SUNY New Paltz vs. Hunter Feb. 9, 199511 Jarrod Baranowski, SUNY New Paltz vs. Hunter Feb. 9, 199511 Kamil Zitka, SUNY New Paltz vs. NYU Feb. 14, 199510 Clyde Jean, SUNY New Paltz vs. Eastern Mennonite Feb. 11, 1995
Service Aces, Five-Set Match (2001-Present)No. Player, Team vs. Opponent Date 10 Chris Ganje, SUNY New Paltz vs. Yeshiva March 30, 20049 Mike Van Tyne, SUNY New Paltz vs. Yeshiva March 14, 20108 Marcus Imwalle, Ball St. vs. Sacred Heart Jan. 29, 20118 Kevin Sagers, BYU vs. Loyola Marymount Feb. 11, 20117 Andrew Cassius, SUNY New Paltz vs. Yeshiva Feb. 22, 20097 Jake Moore, SUNY New Paltz vs. Bard March 14, 2010
No. Player, Team vs. Opponent Date 7 Nick Drooker, King (TN) vs. Barton April 1, 20176 Yosleyder Cala, BYU vs. Hawaii April 15, 20066 Taylor Sander, BYU vs. UCLA April 6, 2012
DEFENSEDigs, Three-Set Match (1970-2000)No. Player, Team vs. Opponent Date
Not Available
Digs, Three-Set Match (2001-Present)No. Player, Team vs. Opponent Date 25 Jeff Lee, SUNY New Paltz vs. NJCU Jan. 31, 200725 Pedro Medina, SUNY New Paltz vs. Vassar March 5, 200824 Pedro Medina, SUNY New Paltz vs. NJCU Jan. 31, 200724 Pedro Medina, SUNY New Paltz vs. Baruch Feb. 12, 200723 Erik Shoji, Stanford vs. Hawaii Feb. 28, 200922 Pedro Medina, SUNY New Paltz vs. NJCU Feb. 16, 200820 Jorge Collazo, Lincoln Memorial vs. Bluefield Col. Jan. 25, 201718 James Ka, Pepperdine vs. Pacific Feb. 26, 200418 Pedro Medina, SUNY New Paltz vs. Emmanual (MA) Feb. 16, 200818 Billy Ebel, Ball St. vs. Fort Wayne Feb. 27, 200918 Graham McIlvaine, Ball St. vs. Limestone March 29, 201318 Keenan Freitas, Lees-McRae vs. King (TN) March 1, 2017
Digs, Four-Set Match (1970-2000)No. Player, Team vs. Opponent Date
Not Available
Digs, Four-Set Match (2001-Present)No. Player, Team vs. Opponent Date 28 Pedro Medina, SUNY New Paltz vs. Newbury April 8, 200626 Erik Shoji, Stanford vs. Pepperdine Feb. 13, 200925 Pedro Medina, SUNY New Paltz vs. Endicott March 9, 200824 Pedro Medina, SUNY New Paltz vs. D'Youville Feb. 9, 200824 Erik Shoji, Stanford vs. Lewis March 7, 200923 David R. Vandermeer, Ball St. vs. NJIT March 20, 201423 Andrew Sato, Long Beach St. vs. Saint Francis (PA) Jan. 27, 201723 Darrin DePellegrini, Charleston (WV) vs. Alderson
BroaddusFeb. 14, 2017
22 Josh Hall, Ball St. vs. Findlay Feb. 24, 200122 Pedro Medina, SUNY New Paltz vs. Hunter Jan. 20, 200722 Joshua Ayzenberg, Sacred Heart vs. Penn St. Feb. 18, 201722 Josh Donahue, Mount Olive vs. King (TN) April 21, 2017
Digs, Five-Set Match (1970-2000)No. Player, Team vs. Opponent Date 27 Russell Brock, Southern California vs. UC Santa Barbara April 13, 1994
Digs, Five-Set Match (2001-Present)No. Player, Team vs. Opponent Date 29 Ian Peckler, Ball St. vs. Carthage Jan. 20, 200627 Pedro Medina, SUNY New Paltz vs. Baruch Jan. 26, 200627 Tony Ker, UCLA vs. Hawaii Jan. 5, 200824 Jaime Kellogg, SUNY New Paltz vs. NJCU Feb. 22, 200624 Erik Shoji, Stanford vs. BYU April 10, 200924 Josh Donahue, Mount Olive vs. King (TN) Feb. 17, 201724 Aleksa Brkovic, Barton vs. King (TN) Feb. 18, 201723 Ryan Bullard, SUNY New Paltz vs. NJCU Feb. 22, 200622 Pedro Medina, SUNY New Paltz vs. NJCU Feb. 22, 2006
Individual Leaders 7
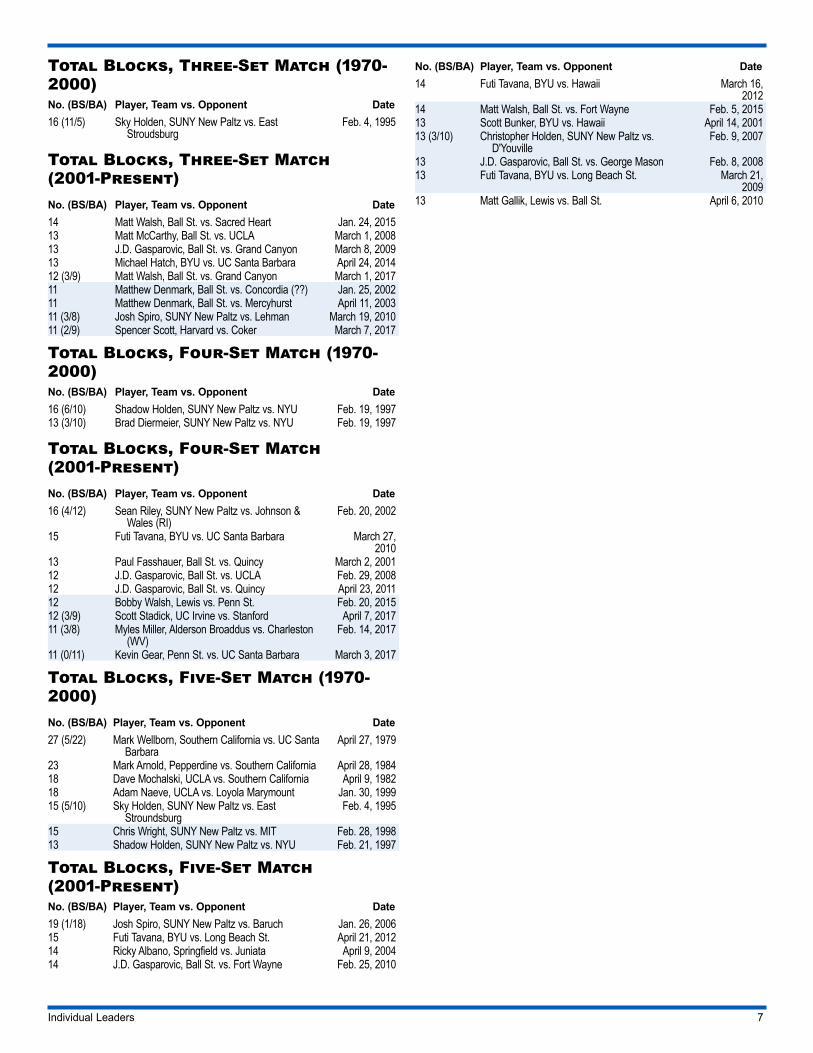
Total Blocks, Three-Set Match (1970-2000)No. (BS/BA) Player, Team vs. Opponent Date 16 (11/5) Sky Holden, SUNY New Paltz vs. East
StroudsburgFeb. 4, 1995
Total Blocks, Three-Set Match (2001-Present)No. (BS/BA) Player, Team vs. Opponent Date 14 Matt Walsh, Ball St. vs. Sacred Heart Jan. 24, 201513 Matt McCarthy, Ball St. vs. UCLA March 1, 200813 J.D. Gasparovic, Ball St. vs. Grand Canyon March 8, 200913 Michael Hatch, BYU vs. UC Santa Barbara April 24, 201412 (3/9) Matt Walsh, Ball St. vs. Grand Canyon March 1, 201711 Matthew Denmark, Ball St. vs. Concordia (??) Jan. 25, 200211 Matthew Denmark, Ball St. vs. Mercyhurst April 11, 200311 (3/8) Josh Spiro, SUNY New Paltz vs. Lehman March 19, 201011 (2/9) Spencer Scott, Harvard vs. Coker March 7, 2017
Total Blocks, Four-Set Match (1970-2000)No. (BS/BA) Player, Team vs. Opponent Date 16 (6/10) Shadow Holden, SUNY New Paltz vs. NYU Feb. 19, 199713 (3/10) Brad Diermeier, SUNY New Paltz vs. NYU Feb. 19, 1997
Total Blocks, Four-Set Match (2001-Present)No. (BS/BA) Player, Team vs. Opponent Date 16 (4/12) Sean Riley, SUNY New Paltz vs. Johnson &
Wales (RI)Feb. 20, 2002
15 Futi Tavana, BYU vs. UC Santa Barbara March 27, 2010
13 Paul Fasshauer, Ball St. vs. Quincy March 2, 200112 J.D. Gasparovic, Ball St. vs. UCLA Feb. 29, 200812 J.D. Gasparovic, Ball St. vs. Quincy April 23, 201112 Bobby Walsh, Lewis vs. Penn St. Feb. 20, 201512 (3/9) Scott Stadick, UC Irvine vs. Stanford April 7, 201711 (3/8) Myles Miller, Alderson Broaddus vs. Charleston
(WV)Feb. 14, 2017
11 (0/11) Kevin Gear, Penn St. vs. UC Santa Barbara March 3, 2017
Total Blocks, Five-Set Match (1970-2000)No. (BS/BA) Player, Team vs. Opponent Date 27 (5/22) Mark Wellborn, Southern California vs. UC Santa
BarbaraApril 27, 1979
23 Mark Arnold, Pepperdine vs. Southern California April 28, 198418 Dave Mochalski, UCLA vs. Southern California April 9, 198218 Adam Naeve, UCLA vs. Loyola Marymount Jan. 30, 199915 (5/10) Sky Holden, SUNY New Paltz vs. East
StroundsburgFeb. 4, 1995
15 Chris Wright, SUNY New Paltz vs. MIT Feb. 28, 199813 Shadow Holden, SUNY New Paltz vs. NYU Feb. 21, 1997
Total Blocks, Five-Set Match (2001-Present)No. (BS/BA) Player, Team vs. Opponent Date 19 (1/18) Josh Spiro, SUNY New Paltz vs. Baruch Jan. 26, 200615 Futi Tavana, BYU vs. Long Beach St. April 21, 201214 Ricky Albano, Springfield vs. Juniata April 9, 200414 J.D. Gasparovic, Ball St. vs. Fort Wayne Feb. 25, 2010
No. (BS/BA) Player, Team vs. Opponent Date 14 Futi Tavana, BYU vs. Hawaii March 16,
201214 Matt Walsh, Ball St. vs. Fort Wayne Feb. 5, 201513 Scott Bunker, BYU vs. Hawaii April 14, 200113 (3/10) Christopher Holden, SUNY New Paltz vs.
D'YouvilleFeb. 9, 2007
13 J.D. Gasparovic, Ball St. vs. George Mason Feb. 8, 200813 Futi Tavana, BYU vs. Long Beach St. March 21,
200913 Matt Gallik, Lewis vs. Ball St. April 6, 2010
Individual Leaders 8
SEASON RECORDS
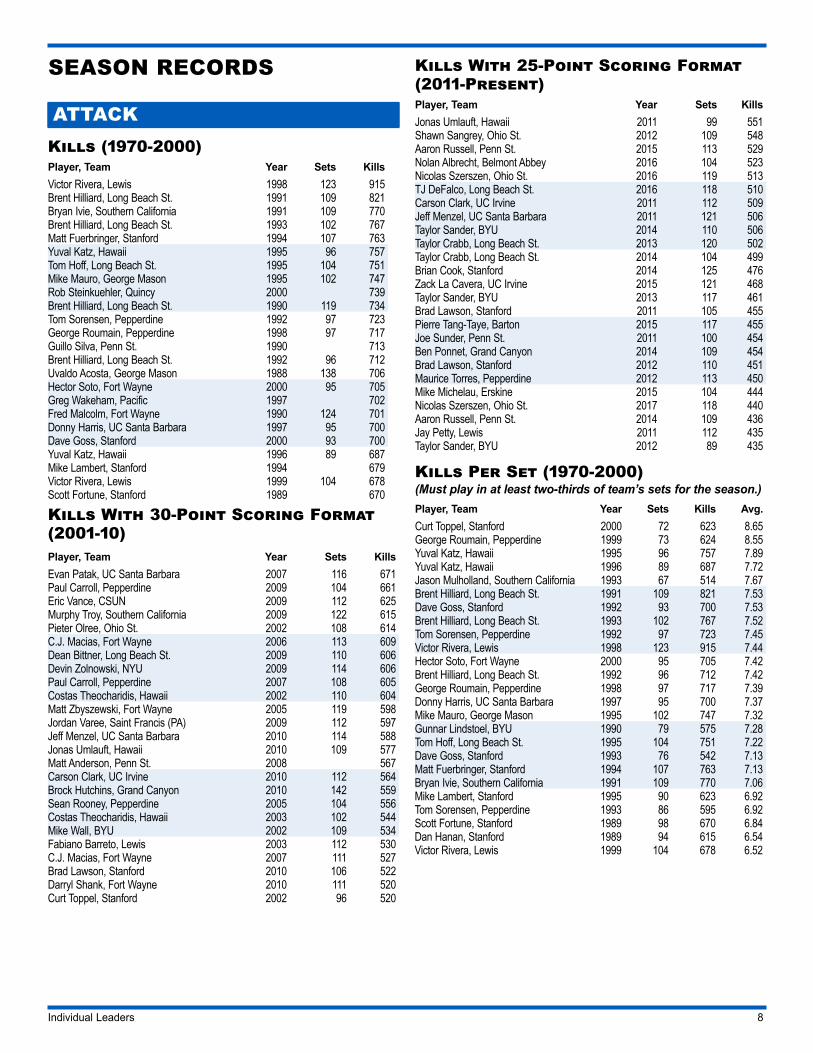
ATTACKKills (1970-2000)Player, Team Year Sets KillsVictor Rivera, Lewis 1998 123 915Brent Hilliard, Long Beach St. 1991 109 821Bryan Ivie, Southern California 1991 109 770Brent Hilliard, Long Beach St. 1993 102 767Matt Fuerbringer, Stanford 1994 107 763Yuval Katz, Hawaii 1995 96 757Tom Hoff, Long Beach St. 1995 104 751Mike Mauro, George Mason 1995 102 747Rob Steinkuehler, Quincy 2000 739Brent Hilliard, Long Beach St. 1990 119 734Tom Sorensen, Pepperdine 1992 97 723George Roumain, Pepperdine 1998 97 717Guillo Silva, Penn St. 1990 713Brent Hilliard, Long Beach St. 1992 96 712Uvaldo Acosta, George Mason 1988 138 706Hector Soto, Fort Wayne 2000 95 705Greg Wakeham, Pacific 1997 702Fred Malcolm, Fort Wayne 1990 124 701Donny Harris, UC Santa Barbara 1997 95 700Dave Goss, Stanford 2000 93 700Yuval Katz, Hawaii 1996 89 687Mike Lambert, Stanford 1994 679Victor Rivera, Lewis 1999 104 678Scott Fortune, Stanford 1989 670
Kills With 30-Point Scoring Format (2001-10)Player, Team Year Sets KillsEvan Patak, UC Santa Barbara 2007 116 671Paul Carroll, Pepperdine 2009 104 661Eric Vance, CSUN 2009 112 625Murphy Troy, Southern California 2009 122 615Pieter Olree, Ohio St. 2002 108 614C.J. Macias, Fort Wayne 2006 113 609Dean Bittner, Long Beach St. 2009 110 606Devin Zolnowski, NYU 2009 114 606Paul Carroll, Pepperdine 2007 108 605Costas Theocharidis, Hawaii 2002 110 604Matt Zbyszewski, Fort Wayne 2005 119 598Jordan Varee, Saint Francis (PA) 2009 112 597Jeff Menzel, UC Santa Barbara 2010 114 588Jonas Umlauft, Hawaii 2010 109 577Matt Anderson, Penn St. 2008 567Carson Clark, UC Irvine 2010 112 564Brock Hutchins, Grand Canyon 2010 142 559Sean Rooney, Pepperdine 2005 104 556Costas Theocharidis, Hawaii 2003 102 544Mike Wall, BYU 2002 109 534Fabiano Barreto, Lewis 2003 112 530C.J. Macias, Fort Wayne 2007 111 527Brad Lawson, Stanford 2010 106 522Darryl Shank, Fort Wayne 2010 111 520Curt Toppel, Stanford 2002 96 520
Kills With 25-Point Scoring Format (2011-Present)Player, Team Year Sets KillsJonas Umlauft, Hawaii 2011 99 551Shawn Sangrey, Ohio St. 2012 109 548Aaron Russell, Penn St. 2015 113 529Nolan Albrecht, Belmont Abbey 2016 104 523Nicolas Szerszen, Ohio St. 2016 119 513TJ DeFalco, Long Beach St. 2016 118 510Carson Clark, UC Irvine 2011 112 509Jeff Menzel, UC Santa Barbara 2011 121 506Taylor Sander, BYU 2014 110 506Taylor Crabb, Long Beach St. 2013 120 502Taylor Crabb, Long Beach St. 2014 104 499Brian Cook, Stanford 2014 125 476Zack La Cavera, UC Irvine 2015 121 468Taylor Sander, BYU 2013 117 461Brad Lawson, Stanford 2011 105 455Pierre Tang-Taye, Barton 2015 117 455Joe Sunder, Penn St. 2011 100 454Ben Ponnet, Grand Canyon 2014 109 454Brad Lawson, Stanford 2012 110 451Maurice Torres, Pepperdine 2012 113 450Mike Michelau, Erskine 2015 104 444Nicolas Szerszen, Ohio St. 2017 118 440Aaron Russell, Penn St. 2014 109 436Jay Petty, Lewis 2011 112 435Taylor Sander, BYU 2012 89 435
Kills Per Set (1970-2000)(Must play in at least two-thirds of team’s sets for the season.)Player, Team Year Sets Kills Avg.Curt Toppel, Stanford 2000 72 623 8.65George Roumain, Pepperdine 1999 73 624 8.55Yuval Katz, Hawaii 1995 96 757 7.89Yuval Katz, Hawaii 1996 89 687 7.72Jason Mulholland, Southern California 1993 67 514 7.67Brent Hilliard, Long Beach St. 1991 109 821 7.53Dave Goss, Stanford 1992 93 700 7.53Brent Hilliard, Long Beach St. 1993 102 767 7.52Tom Sorensen, Pepperdine 1992 97 723 7.45Victor Rivera, Lewis 1998 123 915 7.44Hector Soto, Fort Wayne 2000 95 705 7.42Brent Hilliard, Long Beach St. 1992 96 712 7.42George Roumain, Pepperdine 1998 97 717 7.39Donny Harris, UC Santa Barbara 1997 95 700 7.37Mike Mauro, George Mason 1995 102 747 7.32Gunnar Lindstoel, BYU 1990 79 575 7.28Tom Hoff, Long Beach St. 1995 104 751 7.22Dave Goss, Stanford 1993 76 542 7.13Matt Fuerbringer, Stanford 1994 107 763 7.13Bryan Ivie, Southern California 1991 109 770 7.06Mike Lambert, Stanford 1995 90 623 6.92Tom Sorensen, Pepperdine 1993 86 595 6.92Scott Fortune, Stanford 1989 98 670 6.84Dan Hanan, Stanford 1989 94 615 6.54Victor Rivera, Lewis 1999 104 678 6.52
Individual Leaders 9
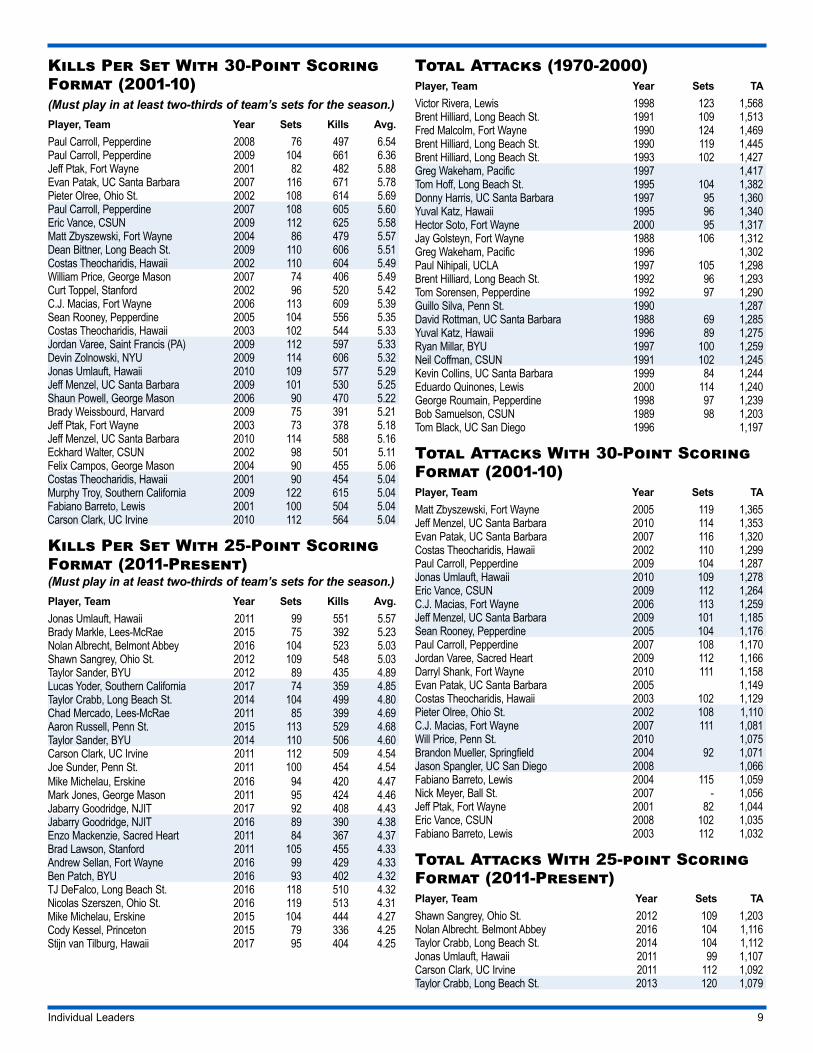
Kills Per Set With 30-Point Scoring Format (2001-10) (Must play in at least two-thirds of team’s sets for the season.)Player, Team Year Sets Kills Avg.Paul Carroll, Pepperdine 2008 76 497 6.54Paul Carroll, Pepperdine 2009 104 661 6.36Jeff Ptak, Fort Wayne 2001 82 482 5.88Evan Patak, UC Santa Barbara 2007 116 671 5.78Pieter Olree, Ohio St. 2002 108 614 5.69Paul Carroll, Pepperdine 2007 108 605 5.60Eric Vance, CSUN 2009 112 625 5.58Matt Zbyszewski, Fort Wayne 2004 86 479 5.57Dean Bittner, Long Beach St. 2009 110 606 5.51Costas Theocharidis, Hawaii 2002 110 604 5.49William Price, George Mason 2007 74 406 5.49Curt Toppel, Stanford 2002 96 520 5.42C.J. Macias, Fort Wayne 2006 113 609 5.39Sean Rooney, Pepperdine 2005 104 556 5.35Costas Theocharidis, Hawaii 2003 102 544 5.33Jordan Varee, Saint Francis (PA) 2009 112 597 5.33Devin Zolnowski, NYU 2009 114 606 5.32Jonas Umlauft, Hawaii 2010 109 577 5.29Jeff Menzel, UC Santa Barbara 2009 101 530 5.25Shaun Powell, George Mason 2006 90 470 5.22Brady Weissbourd, Harvard 2009 75 391 5.21Jeff Ptak, Fort Wayne 2003 73 378 5.18Jeff Menzel, UC Santa Barbara 2010 114 588 5.16Eckhard Walter, CSUN 2002 98 501 5.11Felix Campos, George Mason 2004 90 455 5.06Costas Theocharidis, Hawaii 2001 90 454 5.04Murphy Troy, Southern California 2009 122 615 5.04Fabiano Barreto, Lewis 2001 100 504 5.04Carson Clark, UC Irvine 2010 112 564 5.04
Kills Per Set With 25-Point Scoring Format (2011-Present)(Must play in at least two-thirds of team’s sets for the season.)Player, Team Year Sets Kills Avg.Jonas Umlauft, Hawaii 2011 99 551 5.57Brady Markle, Lees-McRae 2015 75 392 5.23Nolan Albrecht, Belmont Abbey 2016 104 523 5.03Shawn Sangrey, Ohio St. 2012 109 548 5.03Taylor Sander, BYU 2012 89 435 4.89Lucas Yoder, Southern California 2017 74 359 4.85Taylor Crabb, Long Beach St. 2014 104 499 4.80Chad Mercado, Lees-McRae 2011 85 399 4.69Aaron Russell, Penn St. 2015 113 529 4.68Taylor Sander, BYU 2014 110 506 4.60Carson Clark, UC Irvine 2011 112 509 4.54Joe Sunder, Penn St. 2011 100 454 4.54Mike Michelau, Erskine 2016 94 420 4.47Mark Jones, George Mason 2011 95 424 4.46Jabarry Goodridge, NJIT 2017 92 408 4.43Jabarry Goodridge, NJIT 2016 89 390 4.38Enzo Mackenzie, Sacred Heart 2011 84 367 4.37Brad Lawson, Stanford 2011 105 455 4.33Andrew Sellan, Fort Wayne 2016 99 429 4.33Ben Patch, BYU 2016 93 402 4.32TJ DeFalco, Long Beach St. 2016 118 510 4.32Nicolas Szerszen, Ohio St. 2016 119 513 4.31Mike Michelau, Erskine 2015 104 444 4.27Cody Kessel, Princeton 2015 79 336 4.25Stijn van Tilburg, Hawaii 2017 95 404 4.25
Total Attacks (1970-2000)Player, Team Year Sets TAVictor Rivera, Lewis 1998 123 1,568Brent Hilliard, Long Beach St. 1991 109 1,513Fred Malcolm, Fort Wayne 1990 124 1,469Brent Hilliard, Long Beach St. 1990 119 1,445Brent Hilliard, Long Beach St. 1993 102 1,427Greg Wakeham, Pacific 1997 1,417Tom Hoff, Long Beach St. 1995 104 1,382Donny Harris, UC Santa Barbara 1997 95 1,360Yuval Katz, Hawaii 1995 96 1,340Hector Soto, Fort Wayne 2000 95 1,317Jay Golsteyn, Fort Wayne 1988 106 1,312Greg Wakeham, Pacific 1996 1,302Paul Nihipali, UCLA 1997 105 1,298Brent Hilliard, Long Beach St. 1992 96 1,293Tom Sorensen, Pepperdine 1992 97 1,290Guillo Silva, Penn St. 1990 1,287David Rottman, UC Santa Barbara 1988 69 1,285Yuval Katz, Hawaii 1996 89 1,275Ryan Millar, BYU 1997 100 1,259Neil Coffman, CSUN 1991 102 1,245Kevin Collins, UC Santa Barbara 1999 84 1,244Eduardo Quinones, Lewis 2000 114 1,240George Roumain, Pepperdine 1998 97 1,239Bob Samuelson, CSUN 1989 98 1,203Tom Black, UC San Diego 1996 1,197
Total Attacks With 30-Point Scoring Format (2001-10)Player, Team Year Sets TAMatt Zbyszewski, Fort Wayne 2005 119 1,365Jeff Menzel, UC Santa Barbara 2010 114 1,353Evan Patak, UC Santa Barbara 2007 116 1,320Costas Theocharidis, Hawaii 2002 110 1,299Paul Carroll, Pepperdine 2009 104 1,287Jonas Umlauft, Hawaii 2010 109 1,278Eric Vance, CSUN 2009 112 1,264C.J. Macias, Fort Wayne 2006 113 1,259Jeff Menzel, UC Santa Barbara 2009 101 1,185Sean Rooney, Pepperdine 2005 104 1,176Paul Carroll, Pepperdine 2007 108 1,170Jordan Varee, Sacred Heart 2009 112 1,166Darryl Shank, Fort Wayne 2010 111 1,158Evan Patak, UC Santa Barbara 2005 1,149Costas Theocharidis, Hawaii 2003 102 1,129Pieter Olree, Ohio St. 2002 108 1,110C.J. Macias, Fort Wayne 2007 111 1,081Will Price, Penn St. 2010 1,075Brandon Mueller, Springfield 2004 92 1,071Jason Spangler, UC San Diego 2008 1,066Fabiano Barreto, Lewis 2004 115 1,059Nick Meyer, Ball St. 2007 - 1,056Jeff Ptak, Fort Wayne 2001 82 1,044Eric Vance, CSUN 2008 102 1,035Fabiano Barreto, Lewis 2003 112 1,032
Total Attacks With 25-point Scoring Format (2011-Present)Player, Team Year Sets TAShawn Sangrey, Ohio St. 2012 109 1,203Nolan Albrecht. Belmont Abbey 2016 104 1,116Taylor Crabb, Long Beach St. 2014 104 1,112Jonas Umlauft, Hawaii 2011 99 1,107Carson Clark, UC Irvine 2011 112 1,092Taylor Crabb, Long Beach St. 2013 120 1,079
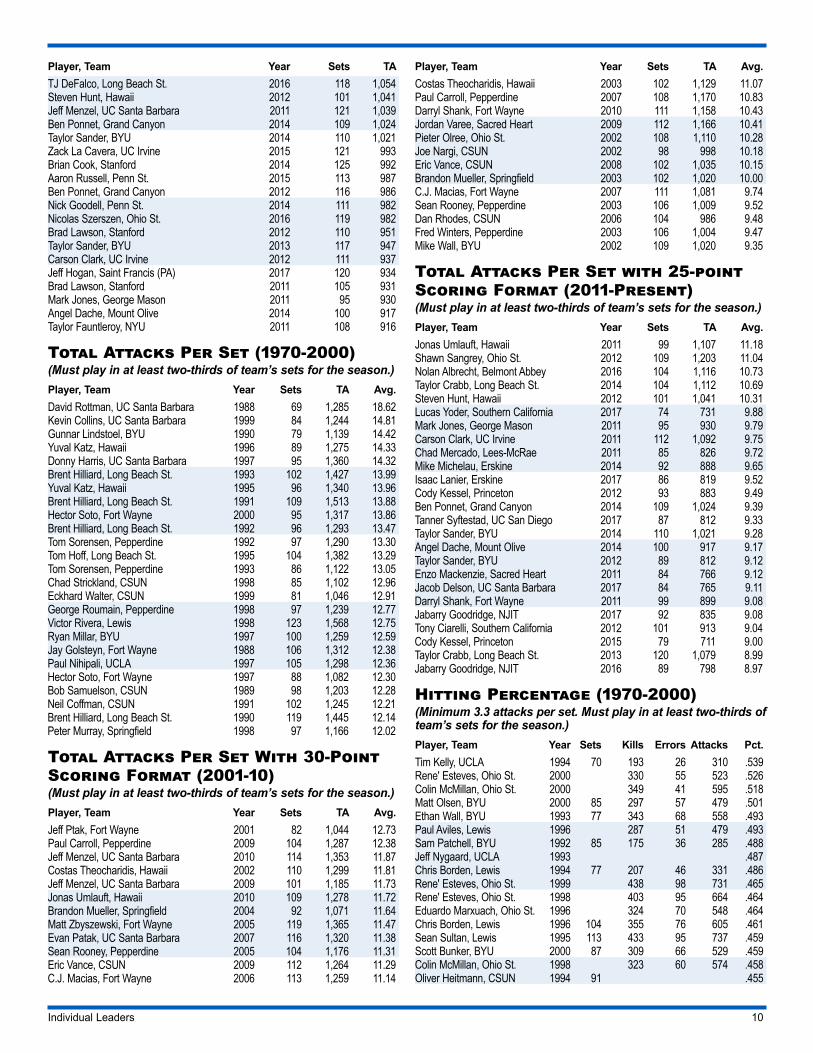
Individual Leaders 10
Player, Team Year Sets TATJ DeFalco, Long Beach St. 2016 118 1,054Steven Hunt, Hawaii 2012 101 1,041Jeff Menzel, UC Santa Barbara 2011 121 1,039Ben Ponnet, Grand Canyon 2014 109 1,024Taylor Sander, BYU 2014 110 1,021Zack La Cavera, UC Irvine 2015 121 993Brian Cook, Stanford 2014 125 992Aaron Russell, Penn St. 2015 113 987Ben Ponnet, Grand Canyon 2012 116 986Nick Goodell, Penn St. 2014 111 982Nicolas Szerszen, Ohio St. 2016 119 982Brad Lawson, Stanford 2012 110 951Taylor Sander, BYU 2013 117 947Carson Clark, UC Irvine 2012 111 937Jeff Hogan, Saint Francis (PA) 2017 120 934Brad Lawson, Stanford 2011 105 931Mark Jones, George Mason 2011 95 930Angel Dache, Mount Olive 2014 100 917Taylor Fauntleroy, NYU 2011 108 916
Total Attacks Per Set (1970-2000)(Must play in at least two-thirds of team’s sets for the season.)Player, Team Year Sets TA Avg.David Rottman, UC Santa Barbara 1988 69 1,285 18.62Kevin Collins, UC Santa Barbara 1999 84 1,244 14.81Gunnar Lindstoel, BYU 1990 79 1,139 14.42Yuval Katz, Hawaii 1996 89 1,275 14.33Donny Harris, UC Santa Barbara 1997 95 1,360 14.32Brent Hilliard, Long Beach St. 1993 102 1,427 13.99Yuval Katz, Hawaii 1995 96 1,340 13.96Brent Hilliard, Long Beach St. 1991 109 1,513 13.88Hector Soto, Fort Wayne 2000 95 1,317 13.86Brent Hilliard, Long Beach St. 1992 96 1,293 13.47Tom Sorensen, Pepperdine 1992 97 1,290 13.30Tom Hoff, Long Beach St. 1995 104 1,382 13.29Tom Sorensen, Pepperdine 1993 86 1,122 13.05Chad Strickland, CSUN 1998 85 1,102 12.96Eckhard Walter, CSUN 1999 81 1,046 12.91George Roumain, Pepperdine 1998 97 1,239 12.77Victor Rivera, Lewis 1998 123 1,568 12.75Ryan Millar, BYU 1997 100 1,259 12.59Jay Golsteyn, Fort Wayne 1988 106 1,312 12.38Paul Nihipali, UCLA 1997 105 1,298 12.36Hector Soto, Fort Wayne 1997 88 1,082 12.30Bob Samuelson, CSUN 1989 98 1,203 12.28Neil Coffman, CSUN 1991 102 1,245 12.21Brent Hilliard, Long Beach St. 1990 119 1,445 12.14Peter Murray, Springfield 1998 97 1,166 12.02
Total Attacks Per Set With 30-Point Scoring Format (2001-10)(Must play in at least two-thirds of team’s sets for the season.)Player, Team Year Sets TA Avg.Jeff Ptak, Fort Wayne 2001 82 1,044 12.73Paul Carroll, Pepperdine 2009 104 1,287 12.38Jeff Menzel, UC Santa Barbara 2010 114 1,353 11.87Costas Theocharidis, Hawaii 2002 110 1,299 11.81Jeff Menzel, UC Santa Barbara 2009 101 1,185 11.73Jonas Umlauft, Hawaii 2010 109 1,278 11.72Brandon Mueller, Springfield 2004 92 1,071 11.64Matt Zbyszewski, Fort Wayne 2005 119 1,365 11.47Evan Patak, UC Santa Barbara 2007 116 1,320 11.38Sean Rooney, Pepperdine 2005 104 1,176 11.31Eric Vance, CSUN 2009 112 1,264 11.29C.J. Macias, Fort Wayne 2006 113 1,259 11.14
Player, Team Year Sets TA Avg.Costas Theocharidis, Hawaii 2003 102 1,129 11.07Paul Carroll, Pepperdine 2007 108 1,170 10.83Darryl Shank, Fort Wayne 2010 111 1,158 10.43Jordan Varee, Sacred Heart 2009 112 1,166 10.41Pieter Olree, Ohio St. 2002 108 1,110 10.28Joe Nargi, CSUN 2002 98 998 10.18Eric Vance, CSUN 2008 102 1,035 10.15Brandon Mueller, Springfield 2003 102 1,020 10.00C.J. Macias, Fort Wayne 2007 111 1,081 9.74Sean Rooney, Pepperdine 2003 106 1,009 9.52Dan Rhodes, CSUN 2006 104 986 9.48Fred Winters, Pepperdine 2003 106 1,004 9.47Mike Wall, BYU 2002 109 1,020 9.35
Total Attacks Per Set with 25-point Scoring Format (2011-Present)(Must play in at least two-thirds of team’s sets for the season.)Player, Team Year Sets TA Avg.Jonas Umlauft, Hawaii 2011 99 1,107 11.18Shawn Sangrey, Ohio St. 2012 109 1,203 11.04Nolan Albrecht, Belmont Abbey 2016 104 1,116 10.73Taylor Crabb, Long Beach St. 2014 104 1,112 10.69Steven Hunt, Hawaii 2012 101 1,041 10.31Lucas Yoder, Southern California 2017 74 731 9.88Mark Jones, George Mason 2011 95 930 9.79Carson Clark, UC Irvine 2011 112 1,092 9.75Chad Mercado, Lees-McRae 2011 85 826 9.72Mike Michelau, Erskine 2014 92 888 9.65Isaac Lanier, Erskine 2017 86 819 9.52Cody Kessel, Princeton 2012 93 883 9.49Ben Ponnet, Grand Canyon 2014 109 1,024 9.39Tanner Syftestad, UC San Diego 2017 87 812 9.33Taylor Sander, BYU 2014 110 1,021 9.28Angel Dache, Mount Olive 2014 100 917 9.17Taylor Sander, BYU 2012 89 812 9.12Enzo Mackenzie, Sacred Heart 2011 84 766 9.12Jacob Delson, UC Santa Barbara 2017 84 765 9.11Darryl Shank, Fort Wayne 2011 99 899 9.08Jabarry Goodridge, NJIT 2017 92 835 9.08Tony Ciarelli, Southern California 2012 101 913 9.04Cody Kessel, Princeton 2015 79 711 9.00Taylor Crabb, Long Beach St. 2013 120 1,079 8.99Jabarry Goodridge, NJIT 2016 89 798 8.97
Hitting Percentage (1970-2000)(Minimum 3.3 attacks per set. Must play in at least two-thirds of team’s sets for the season.)Player, Team Year Sets Kills Errors Attacks Pct.Tim Kelly, UCLA 1994 70 193 26 310 .539Rene' Esteves, Ohio St. 2000 330 55 523 .526Colin McMillan, Ohio St. 2000 349 41 595 .518Matt Olsen, BYU 2000 85 297 57 479 .501Ethan Wall, BYU 1993 77 343 68 558 .493Paul Aviles, Lewis 1996 287 51 479 .493Sam Patchell, BYU 1992 85 175 36 285 .488Jeff Nygaard, UCLA 1993 .487Chris Borden, Lewis 1994 77 207 46 331 .486Rene' Esteves, Ohio St. 1999 438 98 731 .465Rene' Esteves, Ohio St. 1998 403 95 664 .464Eduardo Marxuach, Ohio St. 1996 324 70 548 .464Chris Borden, Lewis 1996 104 355 76 605 .461Sean Sultan, Lewis 1995 113 433 95 737 .459Scott Bunker, BYU 2000 87 309 66 529 .459Colin McMillan, Ohio St. 1998 323 60 574 .458Oliver Heitmann, CSUN 1994 91 .455
Individual Leaders 11
Player, Team Year Sets Kills Errors Attacks Pct.Colin McMillan, Ohio St. 1999 345 70 604 .455Chris Borden, Lewis 1995 127 406 96 682 .455Coley Kyman, CSUN 1993 113 .453Mac Wilson, BYU 1999 97 214 60 342 .450Craig Hewitt, CSUN 1993 92 .447Paul Aviles, Lewis 1999 81 208 40 381 .441Adam Black, CSUN 2000 101 .437Raphael Tulino, CSUN 1988 55 .434Steve Russell, CSUN 1999 69 .434
Hitting Percentage With 30-Point Scoring Format (2001-10) (Minimum 3.3 attacks per set. Must play in at least two-thirds of team’s sets for the season.)Player, Team Year Sets Kills Errors Attacks Pct.Max Holt, Penn St. 2009 100 270 39 411 .562Paul Fasshauer, Ball St. 2002 - 276 37 446 .536Layne Dreven, Ohio St. 2007 93 206 31 328 .534Max Lipsitz, Penn St. 2010 110 397 71 622 .524Adam Pedersen, Ohio St. 2002 91 209 36 344 .503Dan Powers, Juniata 2009 94 273 44 462 .496Joshua Stanhiser, Hawaii 2004 111 .495Paul Johnson, UCLA 2005 .491Kevin Miller, Lewis 2001 75 189 45 294 .490Max Lipsitz, Penn St. 2009 97 272 57 439 .490Camilo Guerci, Mount Olive 2010 62 166 31 279 .484Adam Pedersen, Ohio St. 2003 98 216 41 366 .478Kevin McKniff, CSUN 2010 122 359 62 623 .477Layne Dreven, Ohio St. 2005 106 230 47 385 .475Jacek Ratajczak, CSUN 2009 111 271 47 479 .468J.D. Gasparovic, Ball St. 2009 - 200 34 357 .465Dio Dante, Hawaii 2005 68 .463James Elsea, Lewis 2003 100 244 42 437 .462Dio Dante, Hawaii 2007 96 .460Todd Hill, Ohio St. 2001 99 203 51 331 .459Josh Stewart, Fort Wayne 2007 282 44 520 .458Jacek Ratajczak, CSUN 2010 122 386 72 689 .456Scott Slaughter, UC Santa
Barbara2010 94 247 53 426 .455
Kevin Heine, Ohio St. 2009 76 181 37 317 .454Evan Halteman, Juniata 2009 94 248 55 427 .452
Hitting Percentage With 25-Point Scoring Format (2011-Present)(Minimum 3.3 attacks per set. Must play in at least two-thirds of team’s sets for the season.)Player, Team Year Sets Kills Errors Attacks Pct.Fabio Diniz, Pfeiffer 2015 88 235 37 383 .517Taylor Averill, Hawaii 2015 114 329 59 553 .488Enrique de Diego Garcia,
California Baptist2016 101 209 27 378 .481
Conrad Kaminski, Stanford 2016 93 213 40 362 .478Taylor Averill, Hawaii 2014 102 221 47 365 .477Bobby Walsh, Lewis 2016 115 241 41 425 .471Andrew Sydow, Mount Olive 2015 94 211 35 378 .466Kevin Heine, Ohio St. 2011 108 242 57 400 .463Weston Dunlap, UCLA 2012 105 247 47 434 .461Mark Kochan, Saint Francis
(PA)2014 87 176 38 303 .455
Wyatt Patterson, McKendree 2016 91 200 38 360 .450Matt Walsh, Ball St. 2017 105 223 48 390 .449Wyatt Patterson, McKendree 2015 110 245 66 400 .448Weston Dunlap, UCLA 2011 108 276 66 471 .446Driss Guessous, Ohio St. 2014 103 264 64 448 .446
Player, Team Year Sets Kills Errors Attacks Pct.Scott Siwicki, Lindenwood
(MO)2014 86 176 41 305 .443
Andy Benesh, Southern California
2014 97 190 36 348 .443
Caleb Zimmick, Harvard 2014 84 177 42 307 .440Drake Silbernagel, Grand
Canyon2017 115 228 54 399 .436
Kevin Rakestraw, Stanford 2017 91 197 41 360 .433Jeff Jendryk, Loyola Chicago 2016 103 278 62 501 .431Jeff Jendryk, Loyola Chicago 2017 105 226 39 434 .431Greg Faulkner, CSUN 2014 96 219 52 388 .430Andy Benesh, Southern
California2017 104 199 33 387 .429
Connor Dougherty, Grand Canyon
2014 100 196 48 346 .428
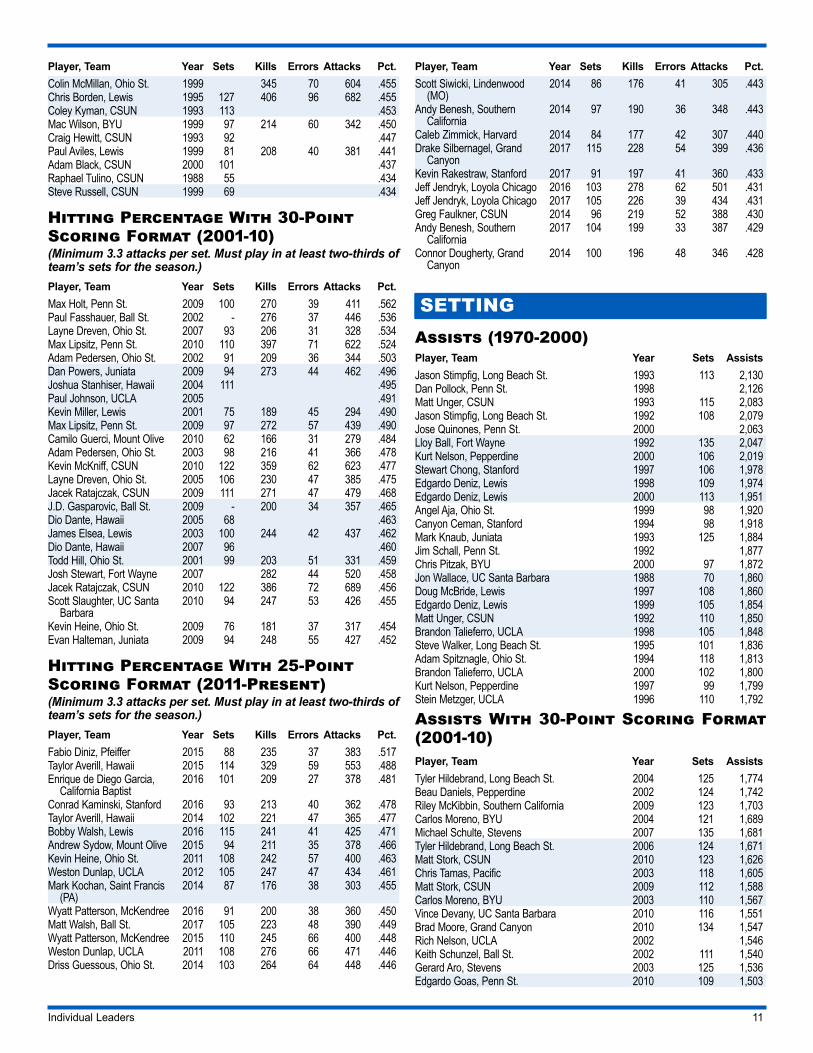
SETTINGAssists (1970-2000)Player, Team Year Sets AssistsJason Stimpfig, Long Beach St. 1993 113 2,130Dan Pollock, Penn St. 1998 2,126Matt Unger, CSUN 1993 115 2,083Jason Stimpfig, Long Beach St. 1992 108 2,079Jose Quinones, Penn St. 2000 2,063Lloy Ball, Fort Wayne 1992 135 2,047Kurt Nelson, Pepperdine 2000 106 2,019Stewart Chong, Stanford 1997 106 1,978Edgardo Deniz, Lewis 1998 109 1,974Edgardo Deniz, Lewis 2000 113 1,951Angel Aja, Ohio St. 1999 98 1,920Canyon Ceman, Stanford 1994 98 1,918Mark Knaub, Juniata 1993 125 1,884Jim Schall, Penn St. 1992 1,877Chris Pitzak, BYU 2000 97 1,872Jon Wallace, UC Santa Barbara 1988 70 1,860Doug McBride, Lewis 1997 108 1,860Edgardo Deniz, Lewis 1999 105 1,854Matt Unger, CSUN 1992 110 1,850Brandon Talieferro, UCLA 1998 105 1,848Steve Walker, Long Beach St. 1995 101 1,836Adam Spitznagle, Ohio St. 1994 118 1,813Brandon Talieferro, UCLA 2000 102 1,800Kurt Nelson, Pepperdine 1997 99 1,799Stein Metzger, UCLA 1996 110 1,792
Assists With 30-Point Scoring Format (2001-10)Player, Team Year Sets AssistsTyler Hildebrand, Long Beach St. 2004 125 1,774Beau Daniels, Pepperdine 2002 124 1,742Riley McKibbin, Southern California 2009 123 1,703Carlos Moreno, BYU 2004 121 1,689Michael Schulte, Stevens 2007 135 1,681Tyler Hildebrand, Long Beach St. 2006 124 1,671Matt Stork, CSUN 2010 123 1,626Chris Tamas, Pacific 2003 118 1,605Matt Stork, CSUN 2009 112 1,588Carlos Moreno, BYU 2003 110 1,567Vince Devany, UC Santa Barbara 2010 116 1,551Brad Moore, Grand Canyon 2010 134 1,547Rich Nelson, UCLA 2002 1,546Keith Schunzel, Ball St. 2002 111 1,540Gerard Aro, Stevens 2003 125 1,536Edgardo Goas, Penn St. 2010 109 1,503
Individual Leaders 12
Player, Team Year Sets AssistsTravis Bluemling, CSUN 2006 111 1,488Rich Nelson, UCLA 2001 1,477Rob Neilson, BYU 2005 111 1,467Keith Schunzel, Ball St. 2004 115 1,463Brandon Sisk, Lewis 2004 121 1,463Kasey Crider, Pepperdine 2010 104 1,461Kawika Shoji, Stanford 2010 105 1,455Daniel Mathews, Ohio St. 2005 111 1,454Kasey Crider, Pepperdine 2009 104 1,446
Assists with 25-point Scoring Format (2011-Present)Player, Team Year Sets AssistsJosh Tuaniga, Long Beach St. 2016 122 1,364Vince Devany, UC Santa Barbara 2011 117 1,362James Shaw, Stanford 2014 125 1,358Matt West, Pepperdine 2012 118 1,343Evan Barry, Stanford 2012 111 1,336Connor Olbright, Long Beach St. 2013 123 1,336Steven Kehoe, Ohio St. 2011 114 1,318Keith Smith, Grand Canyon 2013 120 1,294Mike Becker, Springfield 2011 120 1,283Evan Barry, Stanford 2011 110 1,272Andrew Ouanu, Quincy 2011 127 1,272Matt West, Pepperdine 2015 109 1,231Taylor Hammond, Penn St. 2015 112 1,231Taylor Hammond, Penn St. 2014 108 1,225Tim Schmidt, Lindenwood (MO) 2014 110 1,225Edgardo Goas, Penn St. 2011 111 1,224Christy Blough, Ohio St. 2016 107 1,199Connor Olbright, Long Beach St. 2014 104 1,192Riley McKibbin, Southern California 2011 97 1,187Joe Kauliakamoa, BYU 2012 107 1,178Taylor Hammond, Penn St. 2013 107 1,172Corey Marks, Erskine 2014 103 1,171Peter Hutz, Loyola Chicago 2016 103 1,162Ryan Boyce, BYU 2013 113 1,160Jonah Seif, UC Santa Barbara 2016 111 1,160
Assists Per Set (1970-2000) (Minimum 1,000 assists)Player, Team Year Sets Assists Avg.Jon Wallace, UC Santa Barbara 1988 70 1,860 26.57Josh Lukens, Stanford 2000 82 1,646 20.07Angel Aja, Ohio St. 1999 98 1,920 19.59Canyon Ceman, Stanford 1994 98 1,918 19.57Chris Pitzak, BYU 2000 97 1,872 19.30Jason Stimpfig, Long Beach St. 1992 108 2,079 19.25Angel Aja, Ohio St. 2000 92 1,770 19.24Erik Pichel, Hawaii 1996 84 1,605 19.11Canyon Ceman, Stanford 1992 84 1,600 19.05Kurt Nelson, Pepperdine 2000 106 2,019 19.05Albert Hannemann, Hawaii 1993 73 1,381 18.92Jason Stimpfig, Long Beach St. 1993 113 2,130 18.85J.J. Riley, Pepperdine 1999 87 1,634 18.78Stewart Chong, Stanford 1997 106 1,978 18.66Angel Aja, Ohio St. 1998 92 1,695 18.42Curt Vaughan, Hawaii 1997 96 1,758 18.31Steve Walker, Long Beach St. 1995 101 1,836 18.18Kurt Nelson, Pepperdine 1997 99 1,799 18.17Matt Unger, CSUN 1993 115 2,083 18.11Edgardo Deniz, Lewis 1998 109 1,974 18.11Chris Gisslen, Fort Wayne 2000 98 1,773 18.09Stewart Chong, Stanford 1995 91 1,641 18.03Jason Watson, BYU 1994 70 1,257 17.96
Player, Team Year Sets Assists Avg.Stefan Krejci, Hawaii 2000 93 1,667 17.92Hector Lebron, BYU 1999 84 1,505 17.92
Assists Per Set With 30-Point Scoring Format (2001-10)(Minimum 800 assists)Player, Team Year Sets Assists Avg.Carlos Moreno, BYU 2003 110 1,567 14.25Tyler Hildebrand, Long Beach St. 2004 125 1,774 14.19Matt Stork, CSUN 2009 112 1,588 14.18Carlos Moreno, BYU 2002 97 1,372 14.14Beau Daniels, Pepperdine 2002 124 1,742 14.05Kasey Crider, Pepperdine 2010 104 1,461 14.05Kimo Tuyay, Hawaii 2003 102 1,431 14.03Kasey Crider, Pepperdine 2009 104 1,446 13.90Keith Schunzel, Ball St. 2002 111 1,540 13.87Kawika Shoji, Stanford 2010 105 1,455 13.86Ty Tramblie, CSUN 2003 104 1,441 13.86Riley McKibbin, Southern California 2009 123 1,703 13.85Alex Hoekstra, Mount Olive 2010 65 897 13.80Edgardo Goas, Penn St. 2010 109 1,503 13.79John Mayer, Pepperdine 2004 100 1,375 13.75Kevin Hansen, Stanford 2002 96 1,317 13.72Rich Nelson, UCLA 2002 113 1,546 13.68Dennis Gonzalez, UCLA 2004 78 1,066 13.67Mark Peckham, Ohio St. 2003 101 1,377 13.63Chris Tamas, Pacific 2003 118 1,605 13.60Hector Lebron, BYU 2001 91 1,235 13.57Jonathan Hanners, George Mason 2002 89 1,205 13.54Brian Beckwith, Hawaii 2006 95 1,284 13.52Mike Klipsch, Long Beach St. 2009 106 1,430 13.49Tyler Hildebrand, Long Beach St. 2006 124 1,671 13.48
Assists Per Set With 25-Point Scoring Format (2011-Present)(Based on qualifiers for annual statistical championship)Player, Team Year Sets Assists Avg.Jackson Mettechecchia, Mount Olive 2011 66 817 12.38Riley McKibbin, Southern California 2011 97 1,187 12.24Evan Barry, Stanford 2012 111 1,336 12.04David Specian, Pfeiffer 2015 80 940 11.75Vince Devany, UC Santa Barbara 2011 117 1,362 11.64Micah Christenson, Southern California 2014 90 1,046 11.62Evan Barry, Stanford 2011 110 1,272 11.56Steven Kehoe, Ohio St. 2011 114 1,318 11.56Connor Olbright, Long Beach St. 2014 104 1,192 11.46Peter Hutz, Loyola Chicago 2014 101 1,153 11.42Matt West, Pepperdine 2012 118 1,343 11.38Corey Marks, Erskine 2014 103 1,171 11.37Anthony Spittle, UC Irvine 2011 98 1,113 11.36Taylor Hammond, Penn St. 2014 108 1,225 11.34Matt West Pepperdine 2015 109 1,231 11.29Peter Hutz, Loyola Chicago 2016 103 1,162 11.28Peter Hutz, Loyola Chicago 2015 101 1,137 11.26Matt West Pepperdine 2013 99 1,114 11.25Christy Blough, Ohio St. 2016 107 1,199 11.21Josh Tuaniga, Long Beach St. 2016 122 1,364 11.18Tim Schmidt, Lindenwood (MO) 2014 110 1,225 11.14Edgardo Goas, Penn St. 2012 100 1,111 11,11David Grandy, Erskine 2016 88 976 11.09Josh Tuaniga, Long Beach St. 2017 102 1,128 11.06Christy Blough, Ohio St. 2015 95 1,050 11.05
Individual Leaders 13
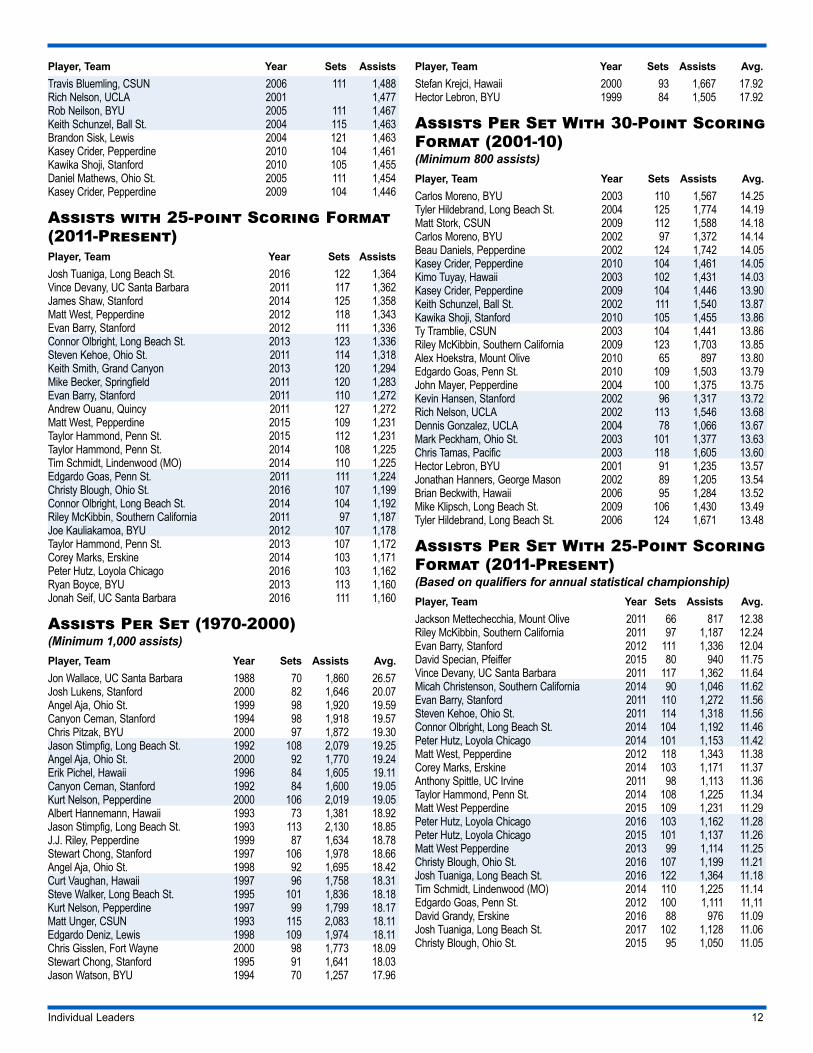
SERVICEService Aces (1970-2000)Player, Team Year Sets AcesJavier Placer, Springfield 1993 83 81Javier Placer, Springfield 1994 83 81Vladimir Andric, Pacific 1997 63Mark Williams, UCLA 2000 128 63Donald Suxho, Southern California 1999 107 63Bart Bachorski, Lewis 1997 108 63Tom Sorensen, Pepperdine 1992 97 61Dave Begarney, Stevens 1995 103 60Brandon Taliaferro, UCLA 2000 102 59Adam Naeve, UCLA 1998 56Scott Wong, Pepperdine 2000 107 56Lloy Ball, Fort Wayne 1994 91 55Kevin Barnett, Pepperdine 1997 99 55Raphael Tulino, CSUN 1991 109 54Mark Presho, Hawaii 1993 93 54Clay Stanley, Hawaii 2000 94 54Eric Mai, UC San Diego 1997 54Tom Sorensen, Pepperdine 1990 97 53Alon Grinberg, Pepperdine 1992 95 53Stein Metzger, UCLA 1996 110 53Chris Gisslen, Fort Wayne 1999 101 52Yuval Katz, Hawaii 1996 89 51Victor Rivera, Lewis 1996 114 50Dag Erlandsson, George Mason 1988 120 49Lloy Ball, Fort Wayne 1992 135 49Dan Fisher, CSUN 1997 92 49George Roumain, Pepperdine 1997 99 49Javier Placer, Springfield 1995 72 49Tim Shawaryn, Juniata 1997 92 49
Service Aces With 30-Point Scoring Format (2001-10)Player, Team Year Sets AcesChris Bock, Stevens 2003 121 81Max Holt, Penn St. 2009 100 79Jake Moore, SUNY New Paltz 2010 75Josean Velasquez, Stevens 2001 73Nils Dauburs, Pacific 2004 71Ryan Bullard, SUNY New Paltz 2005 70Brad Keenan, Pepperdine 2002 126 67Paul Lotman, Long Beach St. 2008 108 60Mike LaRocco, SUNY New Paltz 2005 59Douglas Clarke, Stevens 2001 100 58Chris Bock, Stevens 2004 58Paul Carroll, Pepperdine 2007 108 57Eric Vance, CSUN 2009 112 57Adam Naeve, UCLA 2001 118 56Andre Melo, George Mason 2001 84 56Max Holt, Penn St. 2007 55Drew Pickering, Lewis 2007 105 54Eckhard Walter, CSUN 2001 90 53Pedro Azenha, Hawaii 2004 92 53Mike Alesch, Loyola Chicago 2004 53Chris Kozlarek, Loyola Chicago 2004 53Eckhard Walter, CSUN 2002 98 52Pedro Azenha, Hawaii 2005 102 52Chris Kozlarek, Loyola Chicago 2006 52Eric Vance, CSUN 2008 102 52Mike Iandolo, Lewis 2008 101 52Jake Moore, SUNY New Paltz 2009 52
Service Aces With 25-Point Scoring Format (2011-Present)Player, Team Year Sets AcesNicolas Szerszen, Ohio St. 2017 118 75Joseph Smalzer, Loyola Chicago 2013 113 74Aaron Russell, Penn St. 2014 109 71Joseph Smalzer, Loyola Chicago 2014 101 65Aleksa Brkovic, Barton 2016 100 64Michael Saeta, UC Irvine 2017 106 63Dimitar Kalchev, CSUN 2017 100 63Nicolas Szerszen, Ohio St. 2016 122 63Tony Ciarelli, Southern California 2012 101 62Aaron Russell, Penn St. 2015 113 62Carson Clark, UC Irvine 2012 111 61Nick Drooker, King (TN) 2017 104 61Micah Ma'a, UCLA 2016 121 58Gonzalo Quiroga, UCLA 2014 111 56Austin Pappas, Rutgers-Newark 2011 98 56Thomas Jaeschke, Loyola Chicago 2015 96 55Taylor Sander, BYU 2014 110 55Nick Drooker, King (TN) 2016 115 54Robert Poole, Mount Olive 2017 91 54Austin Pappas, Rutgers-Newark 2012 92 54Michael Saeta, UC Irvine 2016 102 53Jake Langlois, BYU 2017 95 52Gonzalo Quiroga, UCLA 2013 114 52Miles Johnson, Ohio St. 2017 113 50Artur Cabral, Coker 2015 91 50Paco Velez, George Mason 2015 89 50Colin Hackworth, Lindenwood (MO) 2014 109 50
Service Aces Per Set (1970-2000) (Players must play in 66.7% of their team’s sets)Player, Team Year Sets Aces Avg.Javier Placer, Springfield 1993 83 81 .976Javier Placer, Springfield 1994 83 81 .976Javier Placer, Springfield 1995 72 49 .681Tom Sorensen, Pepperdine 1992 97 61 .629Lloy Ball, Fort Wayne 1994 91 55 .604Donald Suxho, Southern California 1999 107 63 .589Bart Bachorski, Lewis 1997 108 63 .583Dave Begarney, Stevens 1995 103 60 .583Mark Presho, Hawaii 1993 93 54 .581Brandon Taliaferro, UCLA 2000 102 59 .578Clay Stanley, Hawaii 2000 94 54 .574Yuval Katz, Hawaii 1996 89 51 .573Andre Melo, George Mason 2000 65 37 .569Alon Grinberg, Pepperdine 1992 95 53 .558Kevin Barnett, Pepperdine 1997 99 55 .556Tom Sorensen, Pepperdine 1990 97 53 .546Dan Fisher, CSUN 1997 92 49 .533Tim Shawaryn, Juniata 1997 92 49 .533Scott Wong, Pepperdine 2000 107 56 .523Chris Gisslen, Fort Wayne 1999 101 52 .515Derek LeDuff, CSUN 1985 79 40 .506Scott Lane, Fort Wayne 1999 92 46 .500Steve Potter, Ohio St. 1995 94 47 .500Kevin Barnett, Pepperdine 1996 96 48 .500Raphael Tulino, CSUN 1991 109 54 .495George Roumain, Pepperdine 1997 99 49 .495Scott Lane, Fort Wayne 2000 97 48 .495
Individual Leaders 14
Service Aces Per Set With 30-Point Scoring Format (2001-10)(Players must play in 66.7% of their team’s sets)Player, Team Year Sets Aces Avg.Max Holt, Penn St. 2009 100 79 .790Chris Bock, Stevens 2003 121 81 .669Andre Melo, George Mason 2001 84 56 .667William Price, George Mason 2007 74 48 .649Eckhard Walter, CSUN 2001 90 53 .589Jose Lanier, Mount Olive 2010 62 36 .581Douglas Clarke, Stevens 2001 100 58 .580Brian Dinning, Juniata 2004 85 49 .576Pedro Azenha, Hawaii 2004 92 53 .576Paul Lotman, Long Beach St. 2008 108 60 .556Ben Duckworth, Fort Wayne 2009 91 50 .549Jeff Zomig, Rutgers-Newark 2010 81 44 .543Matt Zbyszewski, Fort Wayne 2004 86 46 .535Brad Keenan, Pepperdine 2002 126 67 .532Eckhard Walter, CSUN 2002 98 52 .531Paul Carroll, Pepperdine 2007 108 57 .528Benjamin Hollies, New Haven 2010 57 30 .526Mike Iandolo, Lewis 2008 101 52 .515Drew Pickering, Lewis 2007 105 54 .514Will Price, Penn St. 2009 100 51 .510Mark Williams, UCLA 2001 100 51 .510Eric Vance, CSUN 2008 102 52 .510Pedro Azenha, Hawaii 2005 102 52 .510Eric Vance, CSUN 2009 112 57 .509Brady Weissbourd, Harvard 2009 75 38 .507
Service Aces Per Set With 25-Point Scoring Format (2011-Present)(Based on qualifiers for annual statistical championship)Player, Team Year Sets Aces Avg.Joseph Smalzer, Loyola Chicago 2013 113 74 .655Aaron Russell, Penn St. 2014 109 71 .651Joseph Smalzer, Loyola Chicago 2014 101 65 .644Aleksa Brkovic, Barton 2016 100 64 .640Nicolas Szerszen, Ohio St. 2017 118 75 .636Dimitar Kalchev, CSUN 2017 100 63 .630Tony Ciarelli, Southern California 2012 101 62 .614Artur Cabral, Coker 2016 80 48 .600Michael Saeta, UC Irvine 2017 106 63 .594Robert Poole, Mount Olive 2017 91 54 .593Ricardo Ferrer, Coker 2013 76 45 .592Austin Pappas, Rutgers-Newark 2012 92 54 .587Nick Drooker, King (TN) 2017 104 61 .587Thomas Jaeschke, Loyola Chicago 2015 96 55 .573Austin Pappas, Rutgers-Newark 2011 98 56 .571Paco Velez, George Mason 2015 89 50 .562Piotr Dabrowski, George Mason 2012 100 55 .550Carson Clark, UC Irvine 2012 111 61 .550Artur Cabral, Coker 2015 91 50 .549Aaron Russell, Penn St. 2015 113 62 .549Jake Langlois, BYU 2017 95 52 .547Michael Kvidahl, George Mason 2012 86 47 .547Mitch Stahl, UCLA 2017 77 42 .545Scott Siwicki, Lindenwood (MO) 2014 86 46 .535Nicolas Szerszen, Ohio St. 2016 119 63 .529
BLOCKINGTotal Blocks (1970-2000)Player, Team Year Sets Solo Ast. TotalRobert McNutt, Pepperdine 1984 54 170 224Robert Kutsch, Long Beach St. 1990 139 30 194 224Trevor Schirman, UCLA 1990 104 27 194 221Scott Morrow, UCLA 2000 119 17 203 220Scott Metcalf, George Mason 1990 149 215Dejan Miladinovic, Hawaii 1999 105 14 201 215Ryan Millar, BYU 1999 99 22 192 214Tom Stillwell, UCLA 1996 213Brenton Davis, Hawaii 2000 104 20 186 206Jon Yunker, Ohio St. 1993 113 33 166 199Bryan Ivie, Southern California 1991 109 34 165 199Mike Hoefer, Stanford 1997 107 198Chris Hart, Stevens 1995 102 30 167 197Robert Kutsch, Long Beach St. 1989 105 27 165 192Chris Jacobson, Pepperdine 1998 87 192Trevor Schirman, UCLA 1989 102 40 149 189Jeff Nygaard, UCLA 1995 99 27 161 188Guy Nembhard, Lewis 1998 120 19 167 186Andre Breuer, Hawaii 1998 93 26 159 185Tom Hoff, Ohio St. 1993 114 32 152 184Victor Rivera, Lewis 1996 114 49 134 183Gaby Amar, Long Beach St. 1997 100 19 163 182Kevin Hambly, BYU 1995 91 17 164 181Jeff Nygaard, UCLA 1994 93 30 150 180Tom Sorensen, Pepperdine 1990 97 178Scott Bunker, BYU 2000 85 9 169 178
Total Blocks With 30-Point Scoring Format (2001-10)Player, Team Year Sets Solo Ast. TotalSean Riley, SUNY New Paltz 2002 241Brad Keenan, Pepperdine 2002 126 231Dejan Miladinovic, Hawaii 2002 108 12 197 209Brad Keenan, Pepperdine 2003 106 208Tom Hulse, Pepperdine 2007 111 201Keith Kowal, Penn St. 2005 12 182 194Dejan Miladinovic, Hawaii 2001 98 15 178 193Marc Honore, Sacred Heart 2007 190Greg Falcone, Springfield 2010 113 19 169 188Dio Dante, Hawaii 2007 96 184Matt Steinfurth, George Mason 2006 99 181David Lee, Long Beach St. 2004 13 161 174Josh Stewart, Fort Wayne 2007 111 17 156 173Serdar Sikca, Fort Wayne 2005 117 28 144 172Russell Holmes, BYU 2008 113 15 157 172Futi Tavana, BYU 2009 115 16 153 169Russ Lavaja, BYU 2009 115 16 153 168Nate Meerstein, Penn St. 2005 15 151 166R.J. Goubeaux, George Mason 2008 104 166Russell Lavaja, BYU 2010 114 17 148 165Andy Hein, Pepperdine 2005 104 165Keith Kowal, Penn St. 2003 7 156 163Andy Sipe, Springfield 2007 99 27 136 163J.D. Gasparovic, Ball St. 2010 109 27 135 162Serdar Sikca, Fort Wayne 2006 110 30 131 161
Individual Leaders 15
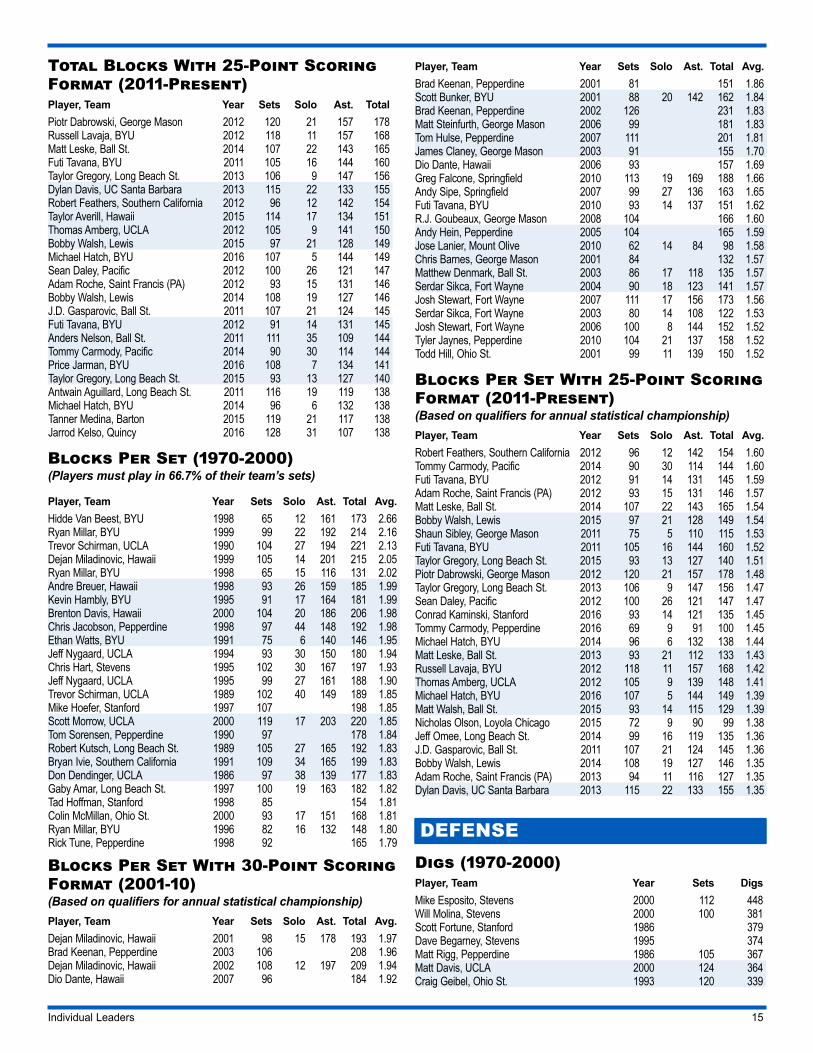
Total Blocks With 25-Point Scoring Format (2011-Present)Player, Team Year Sets Solo Ast. TotalPiotr Dabrowski, George Mason 2012 120 21 157 178Russell Lavaja, BYU 2012 118 11 157 168Matt Leske, Ball St. 2014 107 22 143 165Futi Tavana, BYU 2011 105 16 144 160Taylor Gregory, Long Beach St. 2013 106 9 147 156Dylan Davis, UC Santa Barbara 2013 115 22 133 155Robert Feathers, Southern California 2012 96 12 142 154Taylor Averill, Hawaii 2015 114 17 134 151Thomas Amberg, UCLA 2012 105 9 141 150Bobby Walsh, Lewis 2015 97 21 128 149Michael Hatch, BYU 2016 107 5 144 149Sean Daley, Pacific 2012 100 26 121 147Adam Roche, Saint Francis (PA) 2012 93 15 131 146Bobby Walsh, Lewis 2014 108 19 127 146J.D. Gasparovic, Ball St. 2011 107 21 124 145Futi Tavana, BYU 2012 91 14 131 145Anders Nelson, Ball St. 2011 111 35 109 144Tommy Carmody, Pacific 2014 90 30 114 144Price Jarman, BYU 2016 108 7 134 141Taylor Gregory, Long Beach St. 2015 93 13 127 140Antwain Aguillard, Long Beach St. 2011 116 19 119 138Michael Hatch, BYU 2014 96 6 132 138Tanner Medina, Barton 2015 119 21 117 138Jarrod Kelso, Quincy 2016 128 31 107 138
Blocks Per Set (1970-2000)(Players must play in 66.7% of their team’s sets)
Player, Team Year Sets Solo Ast. Total Avg.Hidde Van Beest, BYU 1998 65 12 161 173 2.66Ryan Millar, BYU 1999 99 22 192 214 2.16Trevor Schirman, UCLA 1990 104 27 194 221 2.13Dejan Miladinovic, Hawaii 1999 105 14 201 215 2.05Ryan Millar, BYU 1998 65 15 116 131 2.02Andre Breuer, Hawaii 1998 93 26 159 185 1.99Kevin Hambly, BYU 1995 91 17 164 181 1.99Brenton Davis, Hawaii 2000 104 20 186 206 1.98Chris Jacobson, Pepperdine 1998 97 44 148 192 1.98Ethan Watts, BYU 1991 75 6 140 146 1.95Jeff Nygaard, UCLA 1994 93 30 150 180 1.94Chris Hart, Stevens 1995 102 30 167 197 1.93Jeff Nygaard, UCLA 1995 99 27 161 188 1.90Trevor Schirman, UCLA 1989 102 40 149 189 1.85Mike Hoefer, Stanford 1997 107 198 1.85Scott Morrow, UCLA 2000 119 17 203 220 1.85Tom Sorensen, Pepperdine 1990 97 178 1.84Robert Kutsch, Long Beach St. 1989 105 27 165 192 1.83Bryan Ivie, Southern California 1991 109 34 165 199 1.83Don Dendinger, UCLA 1986 97 38 139 177 1.83Gaby Amar, Long Beach St. 1997 100 19 163 182 1.82Tad Hoffman, Stanford 1998 85 154 1.81Colin McMillan, Ohio St. 2000 93 17 151 168 1.81Ryan Millar, BYU 1996 82 16 132 148 1.80Rick Tune, Pepperdine 1998 92 165 1.79
Blocks Per Set With 30-Point Scoring Format (2001-10)(Based on qualifiers for annual statistical championship)Player, Team Year Sets Solo Ast. Total Avg.Dejan Miladinovic, Hawaii 2001 98 15 178 193 1.97Brad Keenan, Pepperdine 2003 106 208 1.96Dejan Miladinovic, Hawaii 2002 108 12 197 209 1.94Dio Dante, Hawaii 2007 96 184 1.92
Player, Team Year Sets Solo Ast. Total Avg.Brad Keenan, Pepperdine 2001 81 151 1.86Scott Bunker, BYU 2001 88 20 142 162 1.84Brad Keenan, Pepperdine 2002 126 231 1.83Matt Steinfurth, George Mason 2006 99 181 1.83Tom Hulse, Pepperdine 2007 111 201 1.81James Claney, George Mason 2003 91 155 1.70Dio Dante, Hawaii 2006 93 157 1.69Greg Falcone, Springfield 2010 113 19 169 188 1.66Andy Sipe, Springfield 2007 99 27 136 163 1.65Futi Tavana, BYU 2010 93 14 137 151 1.62R.J. Goubeaux, George Mason 2008 104 166 1.60Andy Hein, Pepperdine 2005 104 165 1.59Jose Lanier, Mount Olive 2010 62 14 84 98 1.58Chris Barnes, George Mason 2001 84 132 1.57Matthew Denmark, Ball St. 2003 86 17 118 135 1.57Serdar Sikca, Fort Wayne 2004 90 18 123 141 1.57Josh Stewart, Fort Wayne 2007 111 17 156 173 1.56Serdar Sikca, Fort Wayne 2003 80 14 108 122 1.53Josh Stewart, Fort Wayne 2006 100 8 144 152 1.52Tyler Jaynes, Pepperdine 2010 104 21 137 158 1.52Todd Hill, Ohio St. 2001 99 11 139 150 1.52
Blocks Per Set With 25-Point Scoring Format (2011-Present)(Based on qualifiers for annual statistical championship)Player, Team Year Sets Solo Ast. Total Avg.Robert Feathers, Southern California 2012 96 12 142 154 1.60Tommy Carmody, Pacific 2014 90 30 114 144 1.60Futi Tavana, BYU 2012 91 14 131 145 1.59Adam Roche, Saint Francis (PA) 2012 93 15 131 146 1.57Matt Leske, Ball St. 2014 107 22 143 165 1.54Bobby Walsh, Lewis 2015 97 21 128 149 1.54Shaun Sibley, George Mason 2011 75 5 110 115 1.53Futi Tavana, BYU 2011 105 16 144 160 1.52Taylor Gregory, Long Beach St. 2015 93 13 127 140 1.51Piotr Dabrowski, George Mason 2012 120 21 157 178 1.48Taylor Gregory, Long Beach St. 2013 106 9 147 156 1.47Sean Daley, Pacific 2012 100 26 121 147 1.47Conrad Kaminski, Stanford 2016 93 14 121 135 1.45Tommy Carmody, Pepperdine 2016 69 9 91 100 1.45Michael Hatch, BYU 2014 96 6 132 138 1.44Matt Leske, Ball St. 2013 93 21 112 133 1.43Russell Lavaja, BYU 2012 118 11 157 168 1.42Thomas Amberg, UCLA 2012 105 9 139 148 1.41Michael Hatch, BYU 2016 107 5 144 149 1.39Matt Walsh, Ball St. 2015 93 14 115 129 1.39Nicholas Olson, Loyola Chicago 2015 72 9 90 99 1.38Jeff Omee, Long Beach St. 2014 99 16 119 135 1.36J.D. Gasparovic, Ball St. 2011 107 21 124 145 1.36Bobby Walsh, Lewis 2014 108 19 127 146 1.35Adam Roche, Saint Francis (PA) 2013 94 11 116 127 1.35Dylan Davis, UC Santa Barbara 2013 115 22 133 155 1.35
DEFENSEDigs (1970-2000)Player, Team Year Sets DigsMike Esposito, Stevens 2000 112 448Will Molina, Stevens 2000 100 381Scott Fortune, Stanford 1986 379Dave Begarney, Stevens 1995 374Matt Rigg, Pepperdine 1986 105 367Matt Davis, UCLA 2000 124 364Craig Geibel, Ohio St. 1993 120 339
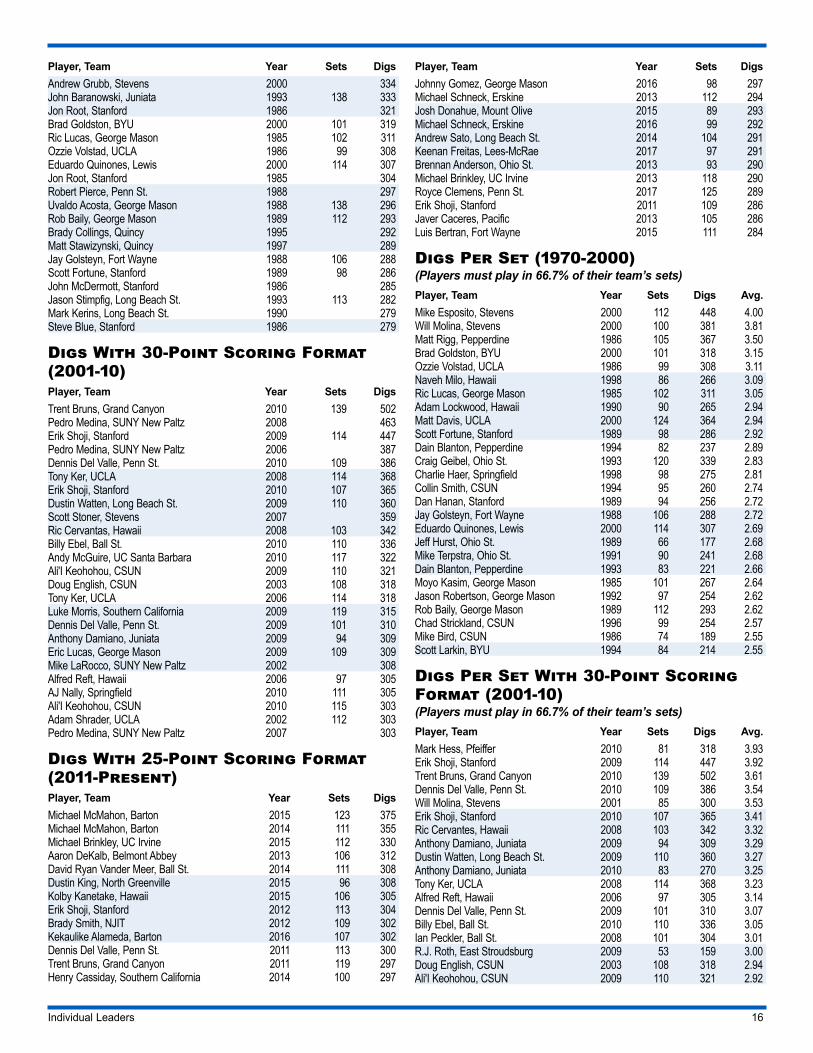
Individual Leaders 16
Player, Team Year Sets DigsAndrew Grubb, Stevens 2000 334John Baranowski, Juniata 1993 138 333Jon Root, Stanford 1986 321Brad Goldston, BYU 2000 101 319Ric Lucas, George Mason 1985 102 311Ozzie Volstad, UCLA 1986 99 308Eduardo Quinones, Lewis 2000 114 307Jon Root, Stanford 1985 304Robert Pierce, Penn St. 1988 297Uvaldo Acosta, George Mason 1988 138 296Rob Baily, George Mason 1989 112 293Brady Collings, Quincy 1995 292Matt Stawizynski, Quincy 1997 289Jay Golsteyn, Fort Wayne 1988 106 288Scott Fortune, Stanford 1989 98 286John McDermott, Stanford 1986 285Jason Stimpfig, Long Beach St. 1993 113 282Mark Kerins, Long Beach St. 1990 279Steve Blue, Stanford 1986 279
Digs With 30-Point Scoring Format (2001-10)Player, Team Year Sets DigsTrent Bruns, Grand Canyon 2010 139 502Pedro Medina, SUNY New Paltz 2008 463Erik Shoji, Stanford 2009 114 447Pedro Medina, SUNY New Paltz 2006 387Dennis Del Valle, Penn St. 2010 109 386Tony Ker, UCLA 2008 114 368Erik Shoji, Stanford 2010 107 365Dustin Watten, Long Beach St. 2009 110 360Scott Stoner, Stevens 2007 359Ric Cervantas, Hawaii 2008 103 342Billy Ebel, Ball St. 2010 110 336Andy McGuire, UC Santa Barbara 2010 117 322Ali'I Keohohou, CSUN 2009 110 321Doug English, CSUN 2003 108 318Tony Ker, UCLA 2006 114 318Luke Morris, Southern California 2009 119 315Dennis Del Valle, Penn St. 2009 101 310Anthony Damiano, Juniata 2009 94 309Eric Lucas, George Mason 2009 109 309Mike LaRocco, SUNY New Paltz 2002 308Alfred Reft, Hawaii 2006 97 305AJ Nally, Springfield 2010 111 305Ali'I Keohohou, CSUN 2010 115 303Adam Shrader, UCLA 2002 112 303Pedro Medina, SUNY New Paltz 2007 303
Digs With 25-Point Scoring Format (2011-Present)Player, Team Year Sets DigsMichael McMahon, Barton 2015 123 375Michael McMahon, Barton 2014 111 355Michael Brinkley, UC Irvine 2015 112 330Aaron DeKalb, Belmont Abbey 2013 106 312David Ryan Vander Meer, Ball St. 2014 111 308Dustin King, North Greenville 2015 96 308Kolby Kanetake, Hawaii 2015 106 305Erik Shoji, Stanford 2012 113 304Brady Smith, NJIT 2012 109 302Kekaulike Alameda, Barton 2016 107 302Dennis Del Valle, Penn St. 2011 113 300Trent Bruns, Grand Canyon 2011 119 297Henry Cassiday, Southern California 2014 100 297
Player, Team Year Sets DigsJohnny Gomez, George Mason 2016 98 297Michael Schneck, Erskine 2013 112 294Josh Donahue, Mount Olive 2015 89 293Michael Schneck, Erskine 2016 99 292Andrew Sato, Long Beach St. 2014 104 291Keenan Freitas, Lees-McRae 2017 97 291Brennan Anderson, Ohio St. 2013 93 290Michael Brinkley, UC Irvine 2013 118 290Royce Clemens, Penn St. 2017 125 289Erik Shoji, Stanford 2011 109 286Javer Caceres, Pacific 2013 105 286Luis Bertran, Fort Wayne 2015 111 284
Digs Per Set (1970-2000) (Players must play in 66.7% of their team’s sets)Player, Team Year Sets Digs Avg.Mike Esposito, Stevens 2000 112 448 4.00Will Molina, Stevens 2000 100 381 3.81Matt Rigg, Pepperdine 1986 105 367 3.50Brad Goldston, BYU 2000 101 318 3.15Ozzie Volstad, UCLA 1986 99 308 3.11Naveh Milo, Hawaii 1998 86 266 3.09Ric Lucas, George Mason 1985 102 311 3.05Adam Lockwood, Hawaii 1990 90 265 2.94Matt Davis, UCLA 2000 124 364 2.94Scott Fortune, Stanford 1989 98 286 2.92Dain Blanton, Pepperdine 1994 82 237 2.89Craig Geibel, Ohio St. 1993 120 339 2.83Charlie Haer, Springfield 1998 98 275 2.81Collin Smith, CSUN 1994 95 260 2.74Dan Hanan, Stanford 1989 94 256 2.72Jay Golsteyn, Fort Wayne 1988 106 288 2.72Eduardo Quinones, Lewis 2000 114 307 2.69Jeff Hurst, Ohio St. 1989 66 177 2.68Mike Terpstra, Ohio St. 1991 90 241 2.68Dain Blanton, Pepperdine 1993 83 221 2.66Moyo Kasim, George Mason 1985 101 267 2.64Jason Robertson, George Mason 1992 97 254 2.62Rob Baily, George Mason 1989 112 293 2.62Chad Strickland, CSUN 1996 99 254 2.57Mike Bird, CSUN 1986 74 189 2.55Scott Larkin, BYU 1994 84 214 2.55
Digs Per Set With 30-Point Scoring Format (2001-10) (Players must play in 66.7% of their team’s sets)Player, Team Year Sets Digs Avg.Mark Hess, Pfeiffer 2010 81 318 3.93Erik Shoji, Stanford 2009 114 447 3.92Trent Bruns, Grand Canyon 2010 139 502 3.61Dennis Del Valle, Penn St. 2010 109 386 3.54Will Molina, Stevens 2001 85 300 3.53Erik Shoji, Stanford 2010 107 365 3.41Ric Cervantes, Hawaii 2008 103 342 3.32Anthony Damiano, Juniata 2009 94 309 3.29Dustin Watten, Long Beach St. 2009 110 360 3.27Anthony Damiano, Juniata 2010 83 270 3.25Tony Ker, UCLA 2008 114 368 3.23Alfred Reft, Hawaii 2006 97 305 3.14Dennis Del Valle, Penn St. 2009 101 310 3.07Billy Ebel, Ball St. 2010 110 336 3.05Ian Peckler, Ball St. 2008 101 304 3.01R.J. Roth, East Stroudsburg 2009 53 159 3.00Doug English, CSUN 2003 108 318 2.94Ali'I Keohohou, CSUN 2009 110 321 2.92
Individual Leaders 17
Player, Team Year Sets Digs Avg.Eric Lucas, George Mason 2009 109 309 2.83Nick Perakes, Lewis 2009 92 259 2.82Tony Ker, UCLA 2006 114 318 2.79Eduardo Stawinski, Springfield 2005 78 216 2.77AJ Nally, Springfield 2010 111 305 2.75Ric Cervantes, Hawaii 2009 75 204 2.72Adam Schrader, UCLA 2002 112 303 2.71
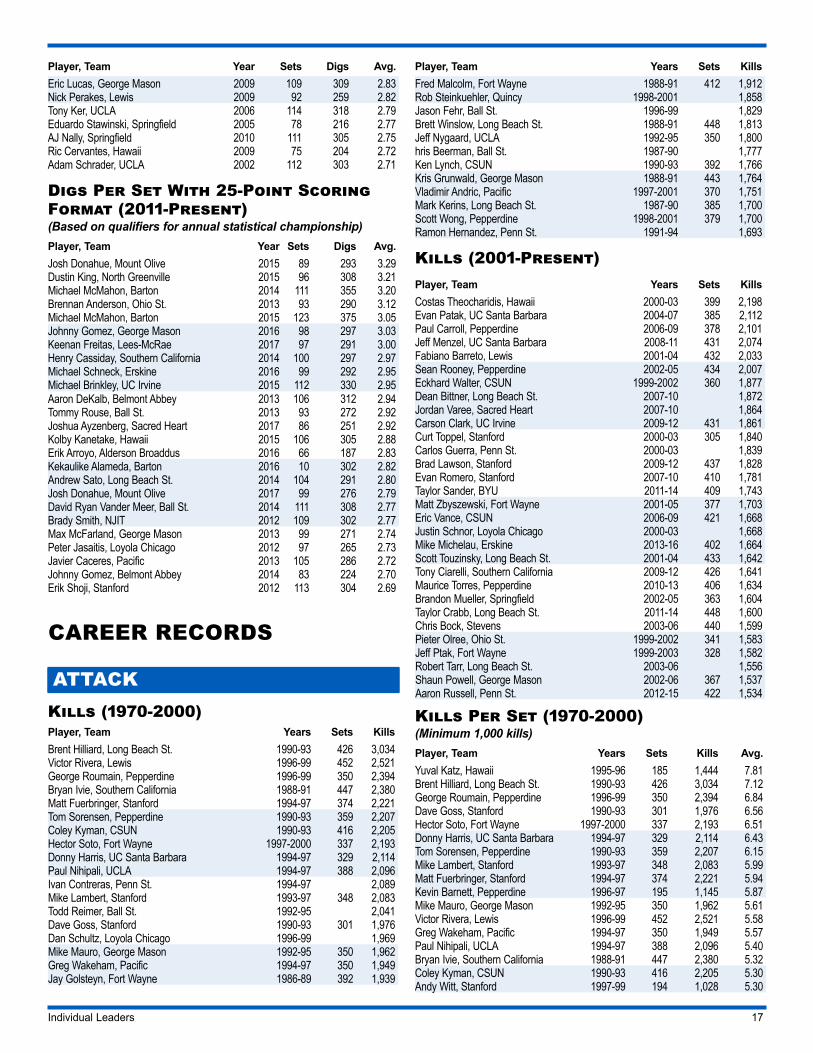
Digs Per Set With 25-Point Scoring Format (2011-Present)(Based on qualifiers for annual statistical championship)Player, Team Year Sets Digs Avg.Josh Donahue, Mount Olive 2015 89 293 3.29Dustin King, North Greenville 2015 96 308 3.21Michael McMahon, Barton 2014 111 355 3.20Brennan Anderson, Ohio St. 2013 93 290 3.12Michael McMahon, Barton 2015 123 375 3.05Johnny Gomez, George Mason 2016 98 297 3.03Keenan Freitas, Lees-McRae 2017 97 291 3.00Henry Cassiday, Southern California 2014 100 297 2.97Michael Schneck, Erskine 2016 99 292 2.95Michael Brinkley, UC Irvine 2015 112 330 2.95Aaron DeKalb, Belmont Abbey 2013 106 312 2.94Tommy Rouse, Ball St. 2013 93 272 2.92Joshua Ayzenberg, Sacred Heart 2017 86 251 2.92Kolby Kanetake, Hawaii 2015 106 305 2.88Erik Arroyo, Alderson Broaddus 2016 66 187 2.83Kekaulike Alameda, Barton 2016 10 302 2.82Andrew Sato, Long Beach St. 2014 104 291 2.80Josh Donahue, Mount Olive 2017 99 276 2.79David Ryan Vander Meer, Ball St. 2014 111 308 2.77Brady Smith, NJIT 2012 109 302 2.77Max McFarland, George Mason 2013 99 271 2.74Peter Jasaitis, Loyola Chicago 2012 97 265 2.73Javier Caceres, Pacific 2013 105 286 2.72Johnny Gomez, Belmont Abbey 2014 83 224 2.70Erik Shoji, Stanford 2012 113 304 2.69
CAREER RECORDS
ATTACKKills (1970-2000)Player, Team Years Sets KillsBrent Hilliard, Long Beach St. 1990-93 426 3,034Victor Rivera, Lewis 1996-99 452 2,521George Roumain, Pepperdine 1996-99 350 2,394Bryan Ivie, Southern California 1988-91 447 2,380Matt Fuerbringer, Stanford 1994-97 374 2,221Tom Sorensen, Pepperdine 1990-93 359 2,207Coley Kyman, CSUN 1990-93 416 2,205Hector Soto, Fort Wayne 1997-2000 337 2,193Donny Harris, UC Santa Barbara 1994-97 329 2,114Paul Nihipali, UCLA 1994-97 388 2,096Ivan Contreras, Penn St. 1994-97 2,089Mike Lambert, Stanford 1993-97 348 2,083Todd Reimer, Ball St. 1992-95 2,041Dave Goss, Stanford 1990-93 301 1,976Dan Schultz, Loyola Chicago 1996-99 1,969Mike Mauro, George Mason 1992-95 350 1,962Greg Wakeham, Pacific 1994-97 350 1,949Jay Golsteyn, Fort Wayne 1986-89 392 1,939
Player, Team Years Sets KillsFred Malcolm, Fort Wayne 1988-91 412 1,912Rob Steinkuehler, Quincy 1998-2001 1,858Jason Fehr, Ball St. 1996-99 1,829Brett Winslow, Long Beach St. 1988-91 448 1,813Jeff Nygaard, UCLA 1992-95 350 1,800hris Beerman, Ball St. 1987-90 1,777Ken Lynch, CSUN 1990-93 392 1,766Kris Grunwald, George Mason 1988-91 443 1,764Vladimir Andric, Pacific 1997-2001 370 1,751Mark Kerins, Long Beach St. 1987-90 385 1,700Scott Wong, Pepperdine 1998-2001 379 1,700Ramon Hernandez, Penn St. 1991-94 1,693
Kills (2001-Present)Player, Team Years Sets KillsCostas Theocharidis, Hawaii 2000-03 399 2,198Evan Patak, UC Santa Barbara 2004-07 385 2,112Paul Carroll, Pepperdine 2006-09 378 2,101Jeff Menzel, UC Santa Barbara 2008-11 431 2,074Fabiano Barreto, Lewis 2001-04 432 2,033Sean Rooney, Pepperdine 2002-05 434 2,007Eckhard Walter, CSUN 1999-2002 360 1,877Dean Bittner, Long Beach St. 2007-10 1,872Jordan Varee, Sacred Heart 2007-10 1,864Carson Clark, UC Irvine 2009-12 431 1,861Curt Toppel, Stanford 2000-03 305 1,840Carlos Guerra, Penn St. 2000-03 1,839Brad Lawson, Stanford 2009-12 437 1,828Evan Romero, Stanford 2007-10 410 1,781Taylor Sander, BYU 2011-14 409 1,743Matt Zbyszewski, Fort Wayne 2001-05 377 1,703Eric Vance, CSUN 2006-09 421 1,668Justin Schnor, Loyola Chicago 2000-03 1,668Mike Michelau, Erskine 2013-16 402 1,664Scott Touzinsky, Long Beach St. 2001-04 433 1,642Tony Ciarelli, Southern California 2009-12 426 1,641Maurice Torres, Pepperdine 2010-13 406 1,634Brandon Mueller, Springfield 2002-05 363 1,604Taylor Crabb, Long Beach St. 2011-14 448 1,600Chris Bock, Stevens 2003-06 440 1,599Pieter Olree, Ohio St. 1999-2002 341 1,583Jeff Ptak, Fort Wayne 1999-2003 328 1,582Robert Tarr, Long Beach St. 2003-06 1,556Shaun Powell, George Mason 2002-06 367 1,537Aaron Russell, Penn St. 2012-15 422 1,534
Kills Per Set (1970-2000)(Minimum 1,000 kills)Player, Team Years Sets Kills Avg.Yuval Katz, Hawaii 1995-96 185 1,444 7.81Brent Hilliard, Long Beach St. 1990-93 426 3,034 7.12George Roumain, Pepperdine 1996-99 350 2,394 6.84Dave Goss, Stanford 1990-93 301 1,976 6.56Hector Soto, Fort Wayne 1997-2000 337 2,193 6.51Donny Harris, UC Santa Barbara 1994-97 329 2,114 6.43Tom Sorensen, Pepperdine 1990-93 359 2,207 6.15Mike Lambert, Stanford 1993-97 348 2,083 5.99Matt Fuerbringer, Stanford 1994-97 374 2,221 5.94Kevin Barnett, Pepperdine 1996-97 195 1,145 5.87Mike Mauro, George Mason 1992-95 350 1,962 5.61Victor Rivera, Lewis 1996-99 452 2,521 5.58Greg Wakeham, Pacific 1994-97 350 1,949 5.57Paul Nihipali, UCLA 1994-97 388 2,096 5.40Bryan Ivie, Southern California 1988-91 447 2,380 5.32Coley Kyman, CSUN 1990-93 416 2,205 5.30Andy Witt, Stanford 1997-99 194 1,028 5.30
Individual Leaders 18
Player, Team Years Sets Kills Avg.David McKienzie, Long Beach St. 1998-2001 312 1,641 5.26Neil Coffman, CSUN 1989-91 296 1,541 5.21Jeff Nygaard, UCLA 1992-95 350 1,800 5.14Uvaldo Acosta, George Mason 1986-88 307 1,554 5.06Geoff Hart, Pepperdine 1988-90 276 1,391 5.04Mark Presho, Hawaii 1990-93 314 1,582 5.04Axel Hager, CSUN 1992-93 226 1,134 5.02Chris Fash, Ohio St. 1998-2001 256 1,274 4.98Jay Golsteyn, Fort Wayne 1986-89 392 1,939 4.95Allen Allen, Hawaii 1986-89 307 1,483 4.83Chris Fazio, Juniata 1994-97 344 1,634 4.75Vladimir Andric, Pacific 1997-2001 370 1,751 4.73James Klimkoski, Springfield 1998-2000 240 1,126 4.69
Kills Per Set (2001-Present)(Minimum 1,000 kills)
Player, Team Years Sets Kills Avg.Curt Toppel, Stanford 2000-03 305 1,840 6.03Paul Carroll, Pepperdine 2006-09 378 2,101 5.56Costas Theocharidis, Hawaii 2000-03 399 2,198 5.51Evan Patak, UC Santa Barbara 2004-07 385 2,112 5.49Jonas Umlauft, Hawaii 2010-11 208 1,128 5.42Eckhard Walter, CSUN 1999-2002 360 1,877 5.21Mike Wall, BYU 1999-2002 295 1,433 4.86Jeff Ptak, Fort Wayne 1999-2003 328 1,582 4.82Jeff Menzel, UC Santa Barbara 2008-11 431 2,074 4.81Fabiano Barreto, Lewis 2001-04 432 2,033 4.71C.J. Macias, Fort Wayne 2006-08 326 1,531 4.70Pieter Olree, Ohio St. 1999-2002 341 1,583 4.64Sean Rooney, Pepperdine 2002-05 434 2,007 4.62Matt Zbyszewski, Fort Wayne 2001-05 377 1,703 4.52Brandon Mueller, Springfield 2002-05 363 1,604 4.42Evan Romero, Stanford 2007-10 410 1,781 4.34Carson Clark, UC Irvine 2009-12 431 1,861 4.32Taylor Sander, BYU 2011-14 409 1,743 4.26Shaun Powell, George Mason 2002-06 367 1,537 4.19Brad Lawson, Stanford 2009-12 437 1,828 4.18Dan Rhodes, CSUN 2004-07 287 1,200 4.18Shawn Sangrey, Ohio St. 2009-12 348 1,441 4.14Mike Michelau, Erskine 2013-16 402 1,664 4.14Maurice Torres, Pepperdine 2010-13 406 1,634 4.02Jabarry Goodridge, NJIT 2014-17 316 1,260 3.99Eric Vance, CSUN 2006-09 421 1,668 3.96Joshua Walker, Hawaii 2008-11 365 1,428 3.91Tony Ciarelli, Southern California 2009-12 426 1,641 3.85Angel Dache, Mount Olive 2011,
13-14263 1,013 3.85
Nick Meyer, Ball St. 2004-07 369 1,415 3.83Greg Lardo, Springfield 2000-03 367 1,404 3.83
Total Attacks (1970-2000)Player, Team Years Sets AttacksBrent Hilliard, Long Beach St. 1990-93 426 5,678Victor Rivera, Lewis 1996-99 452 4,381Hector Soto, Fort Wayne 1997-2000 337 4,246George Roumain, Pepperdine 1996-99 350 4,213Donny Harris, UC Santa Barbara 1994-97 329 4,119Tom Sorensen, Pepperdine 1990-93 359 4,115Coley Kyman, CSUN 1990-93 416 4,044Fred Malcolm, Fort Wayne 1988-91 412 3,995Greg Wakeham, Pacific 1994-97 350 3,995Jay Golsteyn, Fort Wayne 1986-89 392 3,954Ivan Contreras, Penn St. 1994-97 3,737Mark Kerins, Long Beach St. 1987-90 385 3,699Vladimir Andric, Pacific 1997-2001 370 3,615
Player, Team Years Sets AttacksChad Strickland, CSUN 1995-98 352 3,461Ken Lynch, CSUN 1990-93 392 3,445Scott Wong, Pepperdine 1998-2001 379 3,427Ryan Millar, BYU 1996-99 346 3,338David McKienzie, Long Beach St. 1998-2001 3,303Steve Potter, Ohio St. 1992-95 378 3,267Collin Smith, CSUN 1994-97 384 3,252Matt Rigg, Pepperdine 1984-87 194 3,221Ramon Hernandez, Penn St. 1991-94 3,187Brett Winslow, Long Beach St. 1988-91 448 3,182Allen Allen, Hawaii 1986-89 307 3,151Eduardo Quinones, Lewis 1997-2000 363 3,115Mark Presho, Hawaii 1990-93 314 3,016Felipe Ralat, Fort Wayne 1992-95 396 2,998Norman Almodovar, Fort Wayne 1991-94 392 2,974Geoff Hart, Pepperdine 1988-90 276 2,953Tony Luhning, Fort Wayne 1988-91 401 2,927Tom Black, UC San Diego 1993-96 2,912
Total Attacks (2001-Present)Player, Team Years Sets AttacksJeff Menzel, UC Santa Barbara 2008-11 431 4,569Costas Theocharidis, Hawaii 2000-03 399 4,510Paul Carroll, Pepperdine 2006-09 378 4,130Sean Rooney, Pepperdine 2002-05 434 4,067Carson Clark, UC Irvine 2009-12 431 4,041Fabiano Barreto, Lewis 2001-04 432 3,949Dean Bittner, Long Beach St. 2007-10 3,931Jordan Varee, Sacred Heart 2007-10 3,879Brad Lawson, Stanford 2009-12 437 3,816Eckhard Walter, CSUN 1999-2002 360 3,782Tony Ciarelli, Southern California 2009-12 426 3,702Taylor Crabb, Long Beach St. 2011-14 448 3,656Matt Zbyszewski, Fort Wayne 2001-05 377 3,638Carlos Guerra, Penn St. 2000-03 3,617Eric Vance, CSUN 2006-09 421 3,606Mike Michelau, Erskine 2013-16 402 3,595Brandon Mueller, Springfield 2002-05 363 3,585Ben Ponnet, Grand Canyon 2011-14 443 3,562Nick Rivett, Sacred Heart 2007-10 3,482Taylor Sander, BYU 2011-14 409 3,464Evan Patak, UC Santa Barbara 2004-07 385 3,458Taylor Hughes, Pacific 2010-13 392 3,398Fred Winters, Pepperdine 2001-04 413 3,378Scott Touzinsky, Long Beach St. 2001-04 433 3,371Jason Spangler, UC San Diego 2007-10 3,361Joshua Walker, Hawaii 2008-11 365 3,313Jeff Ptak, Fort Wayne 1999-2003 328 3,265Steve Klosterman, UCLA 2004-07 394 3,262Rob Stowell, BYU 2007, 10-12 421 3,209Maurice Torres, Pepperdine 2010-13 406 3,205
Attacks Per Set (1970-2000)(Minimum 2,000 attacks)Player, Team Years Sets Attacks Avg.Matt Rigg, Pepperdine 1984-87 194 3,221 16.60Yuval Katz, Hawaii 1995-96 185 2,615 14.14Brent Hilliard, Long Beach St. 1990-93 426 5,678 13.33Hector Soto, Fort Wayne 1997-2000 337 4,246 12.60Donny Harris, UC Santa Barbara 1994-97 329 4,119 12.52George Roumain, Pepperdine 1996-99 350 4,213 12.04Tom Sorensen, Pepperdine 1990-93 359 4,115 11.46Greg Wakeham, Pacific 1994-97 350 3,995 11.41Geoff Hart, Pepperdine 1988-90 276 2,953 10.70David McKienzie, Long Beach St. 1998-2001 312 3,303 10.59Allen Allen, Hawaii 1986-89 307 3,151 10.26
Individual Leaders 19
Player, Team Years Sets Attacks Avg.Neil Coffman, CSUN 1989-91 296 3,022 10.21Jay Golsteyn, Fort Wayne 1986-89 392 3,954 10.09Chad Strickland, CSUN 1995-98 352 3,461 9.83Vladimir Andric, Pacific 1997-2001 370 3,615 9.77Coley Kyman, CSUN 1990-93 416 4,044 9.72Fred Malcolm, Fort Wayne 1988-91 412 3,995 9.70Victor Rivera, Lewis 1996-99 452 4,381 9.69Ryan Millar, BYU 1996-99 346 3,338 9.65Mark Kerins, Long Beach St. 1987-90 385 3,699 9.61Mark Presho, Hawaii 1990-93 314 3,016 9.61Scott Wong, Pepperdine 1998-2001 379 3,427 9.04Pat Sinclair, BYU 1991-94 310 2,736 8.83Ken Lynch, CSUN 1990-93 392 3,445 8.79Carlos Briceno, Hawaii 1987-90 321 2,776 8.65Steve Potter, Ohio St. 1992-95 378 3,267 8.64Eduardo Quinones, Lewis 1997-2000 363 3,115 8.58Collin Smith, CSUN 1994-97 384 3,252 8.47Mike Prosek, Lewis 1995-97 338 2,858 8.46Scott Larkin, BYU 1992-95 304 2,547 8.37
Attacks Per Set (2001-Present)(Minimum 2,000 attacks)
Player, Team Years Sets Attacks Avg.Costas Theocharidis, Hawaii 2000-03 399 4,510 11.30Paul Carroll, Pepperdine 2006-09 378 4,130 10.93Jeff Menzel, UC Santa Barbara 2008-11 431 4,569 10.60Eckhard Walter, CSUN 1999-2002 360 3,782 10.51Jeff Ptak, Fort Wayne 1999-2003 328 3,265 9.95Brandon Mueller, Springfield 2002-05 363 3,585 9.88C.J. Macias, Fort Wayne 2006-08 326 3,203 9.83Matt Zbyszewski, Fort Wayne 2001-05 377 3,638 9.65Carson Clark, UC Irvine 2009-12 431 4,041 9.38Sean Rooney, Pepperdine 2002-05 434 4,067 9.37Fabiano Barreto, Lewis 2001-04 432 3,949 9.14Joshua Walker, Hawaii 2008-11 365 3,313 9.08Shawn Sangrey, Ohio St. 2009-12 348 3,137 9.01Dan Rhodes, CSUN 2004-07 287 2,584 9.00Evan Patak, UC Santa Barbara 2004-07 385 3,458 8.98Mike Michelau, Erskine 2013-16 402 3,595 8.94Brook Sedore, Hawaii 2012-15 287 2,533 8.83Brad Lawson, Stanford 2009-12 437 3,816 8.73Tony Ciarelli, Southern California 2009-12 426 3,702 8.69Pieter Olree, Ohio St. 1999-2002 341 2,962 8.69Taylor Hughes, Pacific 2010-13 392 3,398 8.67Nick Meyer, Ball St. 2004-07 369 3,175 8.60Eric Vance, CSUN 2006-09 421 3,606 8.57Greg Lardo, Springfield 2000-03 367 3,113 8.48Taylor Sander, BYU 2011-14 409 3,464 8.47Jabarry Goodridge, NJIT 2014-17 316 2,666 8.44Cody Kessel, Princeton 2012-15 317 2,633 8.31Steve Klosterman, UCLA 2004-07 394 3,262 8.28Matt Jones, Harvard 2009-12 324 2,666 8.23Mike Bunting, Loyola Chicago 2009-12 354 2,906 8.21
Hitting Percentage (1970-2000)(Minimum 3.0 attacks/set and players must play in 66.7% of their team’s sets)Player, Team Years Sets K E TA Pct.Colin McMillan, Ohio St. 1997-2000 352 1,206 201 2,089 .481Rene' Esteves, Ohio St. 1997-00 343 1,356 301 2,224 .474Chris Borden, Lewis 1994-96 308 968 218 1,618 .464Ethan Watts, BYU 1991-94 298 1,074 232 1,820 .463Donny Killian, Pepperdine 1998-00 239 522 112 889 .461Paul Aviles, Lewis 1999-2001 265 699 153 1,233 .443
Player, Team Years Sets K E TA Pct.Jason Perkins, Southern
California1990-93 380 1,166 305 2,002 .430
Eduardo Marxuach, Ohio St. 1995-97 199 745 196 1,282 .428Guy Nembhard, Lewis 1998-99 220 717 183 1,251 .427Oliver Heitmann, CSUN 1994-95 188 .420Sean Sultan, Lewis 1994-95 217 802 206 1,427 .418Shawn Patchell, BYU 1990-93 301 675 179 1,245 .412Chris Jacobson, Pepperdine 1995-98 271 851 240 1,517 .403Craig Hewitt, CSUN 1992-94 273 .402Coley Kyman, CSUN 1990-93 416 .401Chris Wright, SUNY New
Paltz1998-2001 1,581 456 2,840 .396
George Roumain, Pepperdine 1996-99 350 2,394 727 4,213 .396Gary Wrobel, Ohio St. 1994-97 285 771 238 1,352 .394Robert Mosca, Springfield 1993-96 287 622 180 1,122 .394Yuval Katz, Hawaii 1995-96 185 1,444 414 2,615 .394Brian Merrick, Pepperdine 1998-01 324 947 270 1,720 .394Gilberto Casas, Springfield 1993-94 170 836 292 1,390 .391Jason Ring, Hawaii 1996-97 182 932 269 1,728 .384Andre Breuer, Hawaii 1998-99 185 921 274 1,691 .383John Bowling, Pepperdine 1994-96 258 626 186 1,167 .377
Hitting Percentage (2001-Present)(Minimum 3.0 attacks/set and players must play in 66.7% of their team’s sets)Player, Team Years Sets K E TA Pct.Bobby Walsh, Lewis 2013-16 430 742 109 1,336 .474Mike Burke, BYU 2003-05 293 768 141 1,333 .470Layne Dreven, Ohio St. 2004-07 298 612 127 1,040 .466Conrad Kaminski, Stanford 2013-16 326 593 119 1,026 .462Kevin Heine, Ohio St. 2008-11 329 723 157 1,241 .456James Elsea, Lewis 2001-04 315 711 135 1,266 .455Cal Palumbo, Springfield 2008-11 418 1,000 229 1,707 .452Driss Guessous, Ohio St. 2014-17 354 703 165 1,198 .449Adam Pedersen, Ohio St. 2001-04 359 743 164 1,300 .445Russell Holmes, BYU 2005-08 414 895 206 1,569 .439Weston Dunlap, UCLA 2009-12 248 573 134 1,023 .429Aaron Flick, Lewis 2009-12 383 637 118 1,224 .424Fabio Diniz, Pfeiffer 2013-16 348 760 169 1,396 .423Josh Stewart, Fort Wayne 2005-08 424 903 182 1,706 .423Taylor Averill, Hawaii 2012-15 401 839 217 1,485 .419Dylan Davis, UC Santa Barbara 2010-13 421 707 161 1,312 .416Matthew Denmark, Ball St. 2001-03 266 684 183 1,207 .415Andy Benesh, Southern
California2014-17 372 658 130 1,273 .415
Matt McCarthy, Ball St. 2006-09 310 718 156 1,362 .413John Albertson, Ohio St. 2006-09 266 642 176 1,134 .411Kevin Owens, Ball St. 2011-14 309 597 135 1,125 .411Kevin Stross, SUNY New Paltz 2009-12 1,239 283 2,337 .409Wyatt Patterson, McKendree 2014-17 410 838 209 1,544 .407Thomas Amberg, UCLA 2009-12 382 839 195 1,593 .404Scott Spurlock, Ohio St. 2003-05 328 619 149 1,165 .403Futi Tavana, BYU 2009-12 404 859 204 1,633 .401Matt Gallik, Lewis 2008,
10-12302 559 153 1,029 .395
Caleb Zimmick, Harvard 2012-15 307 594 167 1,085 .394Russell Lavaja, BYU 2011-14 428 722 203 1,327 .391Serdar Sikca, Fort Wayne 2003-06 397 824 177 1,675 .386
Individual Leaders 20
SETTINGAssists (1970-2000)Player, Team Years Sets AssistsChris Cooper, Ball St. 1987-90 7,281Brandon Taliaferro, UCLA 1997-2000 401 6,840Angel Aja, Ohio St. 1997-2000 367 6,797Eduardo Ferraz, Ball St. 1994-97 6,779Adam Spitznagle, Ohio St. 1993-96 417 6,528Lloy Ball, Fort Wayne 1991-94 436 6,526Doug McBride, Lewis 1994-97 416 6,507Jose Quinones, Penn St. 1999-2002 6,364Jason Stimpfig, Long Beach St. 1990-93 408 6,324Chris Seiffert, Long Beach St. 1997-2000 357 6,099Chris Gisslen, Fort Wayne 1997-2000 371 6,094Canyon Ceman, Stanford 1991-94 321 5,912Edgardo Deniz, Lewis 1998-2000 327 5,779Matt Unger, CSUN 1989,
91-93387 5,732
John Baxter, CSUN 1998-2001 352 5,164Stein Metzger, UCLA 1993-96 317 5,158Stewart Chong, Stanford 1994-97 379 5,144Jon Wallace, UC Santa Barbara 1986-89 205 5,011Todd Rogers, UC Santa Barbara 1993-96 328 4,831Mark Knaub, Juniata 1990-93 414 4,767Dan Pollock, Penn St. 1996-99 4,760Mark Wodzinski, Juniata 1994-97 309 4,679Josh Lukens, Stanford 1998-2001 279 4,654Jason Watson, BYU 1991-94 301 4,649Carlos Ortiz, Penn St. 1993-95 4,609Curt Vaughan, Hawaii 1994-97 267 4,557Brian Cremascoli, Loyola Chicago 1997-99 4,545Hector Lebron, BYU 1997-2001 211 4,284Albert Hannemann, Hawaii 1991-93 247 4,195Kurt Nelson, Pepperdine 1997-2000 268 3,938
Assists (2001-Present)Player, Team Years Sets AssistsTyler Hildebrand, Long Beach St. 2003-06 469 6,651Keith Schunzel, Ball St. 2001-04 5,558Shane Davis, Loyola Chicago 2000-03 5,337Daniel Mathews, Ohio St. 2005-08 415 5,291Brian Guntli, Loyola Chicago 2004-07 5,231Edgardo Goas, Penn St. 2009-12 426 5,205Jonathan Winder, Pepperdine 2005-08 389 5,118Chris Tamas, Pacific 2000-03 378 5,086Kevin Hansen, Stanford 2002-05 392 5,017Dan O'Dell, Penn St. 2003-06 4,993Jimmy Killian, Southern California 2005-08 309 4,820Matt West, Pepperdine 2012-15 424 4,766Taylor Hammond, Penn St. 2013-16 427 4,732Tucker Short, Springfield 2000-03 367 4,728Mark Peckham, Ohio St. 2001-04 359 4,723Matt Werle, Juniata 2006-09 393 4,702Gerard Aro, Stevens 2001-04 416 4,651Vince Delany, UC Santa Barbara 2008-11 4,625Mike Hutz, Loyola Chicago 2008-11 4,601Kimo Tuyay, Hawaii 2001-04 354 4,591Brian Beckwith, Hawaii 2004-07 364 4,509Kawika Shoji, Stanford 2007-10 411 4,504Keith Smith, Grand Canyon 2011-14 441 4,484Shane Conley, Sacred Heart 2006-09 4,477Phil Bannan, UC San Diego 2008-11 4,399BJ Boldog, Lewis 2011-14 419 4,385Brandt Grobeis, Stevens 2008-11 4,384Rich Nelson, UCLA 2001-03 332 4,346
Player, Team Years Sets AssistsJonah Seif, UC Santa Barbara 2013-16 417 4,333Christy Blough, Ohio St. 2014-17 394 4,280
Assists Per Set (1970-2000)(Minimum 2,000 assists)Player, Team Years Sets Assists Avg.Jon Wallace, UC Santa Barbara 1986-89 205 5,011 24.44Hector Lebron, BYU 1997-2001 211 4,284 20.30Angel Aja, Ohio St. 1997-2000 367 6,797 18.52Canyon Ceman, Stanford 1991-94 321 5,912 18.42Erik Pichel, Hawaii 1995-96 141 2,580 18.30Edgardo Deniz, Lewis 1998-2000 327 5,779 17.67Chris Seiffert, Long Beach St. 1997-2000 357 6,099 17.08Curt Vaughan, Hawaii 1994-97 267 4,557 17.07Brandon Taliaferro, UCLA 1997-2000 401 6,840 17.06Albert Hannemann, Hawaii 1991-93 247 4,195 16.98Josh Lukens, Stanford 1998-2001 279 4,654 16.68Chris Gisslen, Fort Wayne 1997-2000 371 6,094 16.43Stein Metzger, UCLA 1993-96 317 5,158 16.27Adam Spitznagle, Ohio St. 1993-96 417 6,528 15.65Doug McBride, Lewis 1994-97 416 6,507 15.64Jason Stimpfig, Long Beach St. 1990-93 408 6,324 15.50Jason Watson, BYU 1991-94 301 4,649 15.45Kip Engen, Stanford 1979-82 168 2,561 15.24Mark Wodzinski, Juniata 1994-97 309 4,679 15.14Lloy Ball, Fort Wayne 1991-94 436 6,526 14.97John Ribarich, Hawaii 1984-86 136 2,030 14.93Matt Unger, CSUN 1989,
91-93387 5,732 14.81
Todd Rogers, UC Santa Barbara 1993-96 328 4,831 14.73Kurt Nelson, Pepperdine 1997-2000 268 3,938 14.69John Baxter, CSUN 1998-2001 352 5,164 14.67Lyman Lacro, Hawaii 1987-90 207 3,031 14.64Craig Lauchner, Stanford 1982-85 174 2,533 14.56Steve Modory, Stanford 1984-87 146 2,109 14.45Kevin Moore, Juniata 1998-2001 258 3,716 14.40Kriss Eglitis, George Mason 1995-99 271 3,857 14.23
Assists Per Set (2001-Present)(Minimum 2,000 assists)Player, Team Years Sets Assists Avg.Jimmy Killian, Southern California 2005-08 309 4,820 15.60Tyler Hildebrand, Long Beach St. 2003-06 469 6,651 14.18Chris Tamas, Pacific 2000-03 378 5,086 13.46Jonathan Winder, Pepperdine 2005-08 389 5,118 13.16Mark Peckham, Ohio St. 2001-04 359 4,723 13.16Keith Schunzel, Ball St. 2001-04 423 5,558 13.14Rich Nelson, UCLA 2001-03 332 4,346 13.09Kimo Tuyay, Hawaii 2001-04 354 4,591 12.97Tucker Short, Springfield 2000-03 367 4,728 12.88Jonathan Hanners, George Mason 1998,
2000-02278 3,558 12.80
Kevin Hansen, Stanford 2002-05 392 5,017 12.80Daniel Mathews, Ohio St. 2005-08 415 5,291 12.75Ty Tramblie, CSUN 2000-04 328 4,090 12.47Brian Beckwith, Hawaii 2004-06 364 4,509 12.39Edgardo Goas, Penn St. 2009-12 426 5,205 12.22Kasey Crider, Pepperdine 2008-11 328 3,989 12.16Mike Iandolo, Lewis 2008-10 282 3,389 12.02Matt Werle, Juniata 2006-09 393 4,702 11.96Michael Schulte, Stevens 2004-07 320 3,746 11.71Jordan Vidovic, Lewis 2006-09 177 2,049 11.58Dave Egan, George Mason 2001,
03-05300 3,424 11.41
Evan Barry, Stanford 2009-12 240 2,739 11.41Eric Shoemaker, Springfield 2007-10 357 4,046 11.33
Individual Leaders 21
Player, Team Years Sets Assists Avg.Matt West, Pepperdine 2012-15 424 4,766 11.24Ethan Pheister, Ball St. 2007-10 366 4,103 11.21Peter Hutz, Loyola Chicago 2013-16 369 4,130 11.19Gerard Aro, Stevens 2001-04 416 4,651 11.18Steven Kehoe, Ohio St. 2008-11 360 4,012 11.14Taylor Hammond, Penn St. 2013-16 427 4,732 11.08Brandon Sisk, Lewis 2003-05 216 2,389 11.06
SERVICEService Aces (1970-2000)Player, Team Years Sets AcesJavier Placer, Springfield 1993-96 300 247Chris Cooper, Ball St. 1987-90 190Adam Naeve, UCLA 1997-2001 389 178Brandon Taliaferro, UCLA 1997-2000 401 176Lloy Ball, Fort Wayne 1991-94 436 167Mark Williams, UCLA 1998-2001 382 164Donald Suxho, Southern California 1997-2000 407 164Jason Fehr, Ball St. 1996-99 155Tom Sorensen, Pepperdine 1990-93 359 155Vladimir Andric, Pacific 1997-2001 370 153Victor Rivera, Lewis 1996-99 452 153Chris Gisslen, Fort Wayne 1997-2000 371 147Tim Shawaryn, Juniata 1995-98 390 142Scott Wong, Pepperdine 1998-2001 372 140Todd Reimer, Ball St. 1992-95 136Dave Begarney, Stevens 1994-98 261 134Steve Drexler, Quincy 1995-98 131George Roumain, Pepperdine 1996-99 350 129Jeff Nygaard, UCLA 1992-95 350 123Steve Potter, Ohio St. 1992-95 378 123Brent Hilliard, Long Beach St. 1990-93 426 121Chris Wright, SUNY New Paltz 1998-2001 116Duncan Blackman, Stanford 1989-92 339 115Norman Almodovar, Fort Wayne 1991-94 392 114Mark Knaub, Juniata 1990-93 414 114Pat Sinclair, BYU 1991-94 310 112Mike Lambert, Stanford 1993-97 348 112Robert Manosca, SUNY New Paltz 1998-2001 111Stein Metzger, UCLA 1993-96 317 110Andre Melo, George Mason 1999-2001 190 110Marcos Cordova, Loyola Chicago 1996-99 110Mike Prosek, Lewis 1995-97 338 110
Service Aces (2001-Present)Player, Team Years Sets AcesEvan Patak, UC Santa Barbara 2004-07 385 255Joseph Smalzer, Loyola Chicago 2011-14 423 234Max Holt, Penn St. 2006-09 207Chris Bock, Stevens 2003-06 440 199Aaron Russell, Penn St. 2012-15 422 198Gonzalo Quiroga, UCLA 2011-14 436 194Brad Keenan, Pepperdine 2000-03 417 187Carson Clark, UC Irvine 2009-12 431 183Eckhard Walter, CSUN 1999-02 360 183Taylor Sander, BYU 2011-14 409 182Eric Vance, CSUN 2006-09 421 181Nicolas Szerszen, Ohio St. 2015-17 340 178Tony Ciarelli, Southern California 2009-12 426 167Michael Saeta, UC Irvine 2014-17 367 161Miles Johnson, Ohio St. 2014-17 424 160Scott Touzinsky, Long Beach St. 2001-04 433 158Brian Woodworth, Stevens 2002-05 158Artur Cabral, Coker 2014-17 299 156
Player, Team Years Sets AcesPaul Carroll, Pepperdine 2006-09 378 154Nils Dauber, Pacific 2003-05 150Mike Michelau, Erskine 2013-16 402 148Brock Ullrich, Fort Wayne 2005-08 422 147Scott Stoner, Stevens 2004-07 145Jordan Varee, Sacred Heart 2007-10 145Nick Drooker, King (TN) 2015-17 317 143Chris Kozlarek, Loyola Chicago 2003-06 142Tomas Bochicchio, Stevens 2006-09 329 142Jake Moore, SUNY New Paltz 2006-07,
09-10142
Drew Pickering, Lewis 2006-09 386 139Jack Gamache, Quincy 2013-16 433 138
Service Aces Per Set (1970-2000)(Minimum 90 aces)Player, Team Years Sets Aces Avg.Javier Placer, Springfield 1993-96 300 247 .823Andre Melo, George Mason 1999-2001 190 110 .579Yuval Katz, Hawaii 1995-96 185 100 .541Kevin Barnett, Pepperdine 1996-97 195 103 .528Dave Begarney, Stevens 1994-98 261 134 .513Adam Naeve, UCLA 1997-2001 389 178 .458Brandon Taliaferro, UCLA 1997-2000 401 176 .439Tom Sorensen, Pepperdine 1990-93 359 155 .432Mark Williams, UCLA 1998-2001 382 164 .429Bart Bachorski, Lewis 1995-97 232 97 .418Vladimir Andric, Pacific 1997-2001 370 153 .414Donald Suxho, Southern California 1997-2000 407 164 .403Chris Gisslen, Fort Wayne 1997-2000 371 147 .396Lloy Ball, Fort Wayne 1991-94 436 167 .383Scott Wong, Pepperdine 1998-2001 372 140 .376George Roumain, Pepperdine 1996-99 350 129 .369Tim Shawaryn, Juniata 1995-98 390 142 .364Pat Sinclair, BYU 1991-94 310 112 .361Jeff Nygaard, UCLA 1992-95 350 123 .351Stein Metzger, UCLA 1993-96 317 110 .347Duncan Blackman, Stanford 1989-92 339 115 .339Victor Rivera, Lewis 1996-99 452 153 .338Mike Prosek, Lewis 1995-97 338 110 .325Steve Potter, Ohio St. 1992-95 378 123 .325Mike Lambert, Stanford 1993-97 348 112 .322Sivan Leoni, Hawaii 1995-98 326 100 .307Mark Knaub, Juniata 1990-93 414 114 .275Matt Fuerbringer, Stanford 1994-97 374 99 .265
Service Aces Per Set (2001-Present)(Minimum 90 aces)Player, Team Years Sets Aces Avg.Evan Patak, UC Santa Barbara 2004-07 385 255 .662Joseph Smalzer, Loyola Chicago 2011-14 423 234 .553Nicolas Szerszen, Ohio St. 2015-17 340 178 .524Artur Cabral, Coker 2014-17 299 156 .522Pedro Azenha, Hawaii 2003-05 236 121 .513Eckhard Walter, CSUN 1999-02 360 183 .508Austin Pappas, Rutgers-Newark 2009-12 250 123 .492Paco Velez, George Mason 2013-16 239 115 .481Aaron Russell, Penn St. 2012-15 422 198 .469Chris Bock, Stevens 2003-06 440 199 .452Nick Drooker, King (TN) 2015-17 317 143 .451Brad Keenan, Pepperdine 2000-03 417 187 .448Taylor Sander, BYU 2011-14 409 182 .445Gonzalo Quiroga, UCLA 2011-14 436 194 .445Michael Saeta, UC Irvine 2014-17 367 161 .439Tomas Bochicchio, Stevens 2006-09 329 142 .432Eric Vance, CSUN 2006-09 421 181 .430
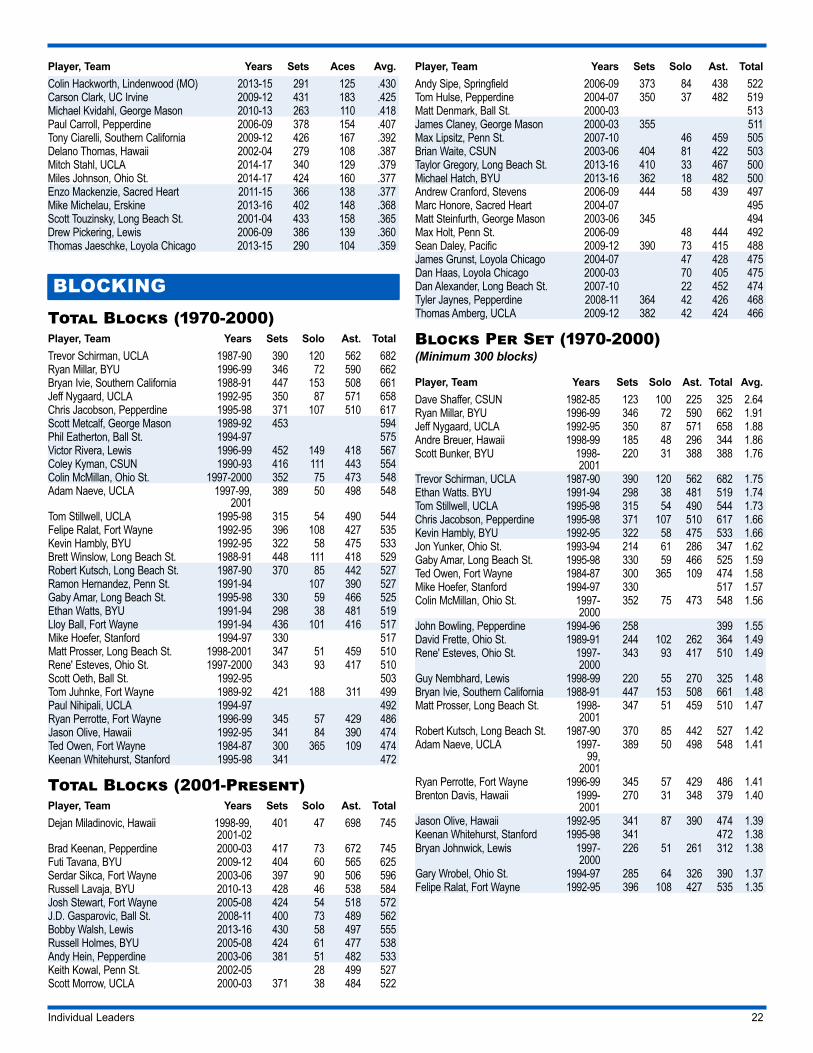
Individual Leaders 22
Player, Team Years Sets Aces Avg.Colin Hackworth, Lindenwood (MO) 2013-15 291 125 .430Carson Clark, UC Irvine 2009-12 431 183 .425Michael Kvidahl, George Mason 2010-13 263 110 .418Paul Carroll, Pepperdine 2006-09 378 154 .407Tony Ciarelli, Southern California 2009-12 426 167 .392Delano Thomas, Hawaii 2002-04 279 108 .387Mitch Stahl, UCLA 2014-17 340 129 .379Miles Johnson, Ohio St. 2014-17 424 160 .377Enzo Mackenzie, Sacred Heart 2011-15 366 138 .377Mike Michelau, Erskine 2013-16 402 148 .368Scott Touzinsky, Long Beach St. 2001-04 433 158 .365Drew Pickering, Lewis 2006-09 386 139 .360Thomas Jaeschke, Loyola Chicago 2013-15 290 104 .359
BLOCKINGTotal Blocks (1970-2000)Player, Team Years Sets Solo Ast. TotalTrevor Schirman, UCLA 1987-90 390 120 562 682Ryan Millar, BYU 1996-99 346 72 590 662Bryan Ivie, Southern California 1988-91 447 153 508 661Jeff Nygaard, UCLA 1992-95 350 87 571 658Chris Jacobson, Pepperdine 1995-98 371 107 510 617Scott Metcalf, George Mason 1989-92 453 594Phil Eatherton, Ball St. 1994-97 575Victor Rivera, Lewis 1996-99 452 149 418 567Coley Kyman, CSUN 1990-93 416 111 443 554Colin McMillan, Ohio St. 1997-2000 352 75 473 548Adam Naeve, UCLA 1997-99,
2001389 50 498 548
Tom Stillwell, UCLA 1995-98 315 54 490 544Felipe Ralat, Fort Wayne 1992-95 396 108 427 535Kevin Hambly, BYU 1992-95 322 58 475 533Brett Winslow, Long Beach St. 1988-91 448 111 418 529Robert Kutsch, Long Beach St. 1987-90 370 85 442 527Ramon Hernandez, Penn St. 1991-94 107 390 527Gaby Amar, Long Beach St. 1995-98 330 59 466 525Ethan Watts, BYU 1991-94 298 38 481 519Lloy Ball, Fort Wayne 1991-94 436 101 416 517Mike Hoefer, Stanford 1994-97 330 517Matt Prosser, Long Beach St. 1998-2001 347 51 459 510Rene' Esteves, Ohio St. 1997-2000 343 93 417 510Scott Oeth, Ball St. 1992-95 503Tom Juhnke, Fort Wayne 1989-92 421 188 311 499Paul Nihipali, UCLA 1994-97 492Ryan Perrotte, Fort Wayne 1996-99 345 57 429 486Jason Olive, Hawaii 1992-95 341 84 390 474Ted Owen, Fort Wayne 1984-87 300 365 109 474Keenan Whitehurst, Stanford 1995-98 341 472
Total Blocks (2001-Present)Player, Team Years Sets Solo Ast. TotalDejan Miladinovic, Hawaii 1998-99,
2001-02401 47 698 745
Brad Keenan, Pepperdine 2000-03 417 73 672 745Futi Tavana, BYU 2009-12 404 60 565 625Serdar Sikca, Fort Wayne 2003-06 397 90 506 596Russell Lavaja, BYU 2010-13 428 46 538 584Josh Stewart, Fort Wayne 2005-08 424 54 518 572J.D. Gasparovic, Ball St. 2008-11 400 73 489 562Bobby Walsh, Lewis 2013-16 430 58 497 555Russell Holmes, BYU 2005-08 424 61 477 538Andy Hein, Pepperdine 2003-06 381 51 482 533Keith Kowal, Penn St. 2002-05 28 499 527Scott Morrow, UCLA 2000-03 371 38 484 522
Player, Team Years Sets Solo Ast. TotalAndy Sipe, Springfield 2006-09 373 84 438 522Tom Hulse, Pepperdine 2004-07 350 37 482 519Matt Denmark, Ball St. 2000-03 513James Claney, George Mason 2000-03 355 511Max Lipsitz, Penn St. 2007-10 46 459 505Brian Waite, CSUN 2003-06 404 81 422 503Taylor Gregory, Long Beach St. 2013-16 410 33 467 500Michael Hatch, BYU 2013-16 362 18 482 500Andrew Cranford, Stevens 2006-09 444 58 439 497Marc Honore, Sacred Heart 2004-07 495Matt Steinfurth, George Mason 2003-06 345 494Max Holt, Penn St. 2006-09 48 444 492Sean Daley, Pacific 2009-12 390 73 415 488James Grunst, Loyola Chicago 2004-07 47 428 475Dan Haas, Loyola Chicago 2000-03 70 405 475Dan Alexander, Long Beach St. 2007-10 22 452 474Tyler Jaynes, Pepperdine 2008-11 364 42 426 468Thomas Amberg, UCLA 2009-12 382 42 424 466
Blocks Per Set (1970-2000)(Minimum 300 blocks)
Player, Team Years Sets Solo Ast. Total Avg.Dave Shaffer, CSUN 1982-85 123 100 225 325 2.64Ryan Millar, BYU 1996-99 346 72 590 662 1.91Jeff Nygaard, UCLA 1992-95 350 87 571 658 1.88Andre Breuer, Hawaii 1998-99 185 48 296 344 1.86Scott Bunker, BYU 1998-
2001220 31 388 388 1.76
Trevor Schirman, UCLA 1987-90 390 120 562 682 1.75Ethan Watts. BYU 1991-94 298 38 481 519 1.74Tom Stillwell, UCLA 1995-98 315 54 490 544 1.73Chris Jacobson, Pepperdine 1995-98 371 107 510 617 1.66Kevin Hambly, BYU 1992-95 322 58 475 533 1.66Jon Yunker, Ohio St. 1993-94 214 61 286 347 1.62Gaby Amar, Long Beach St. 1995-98 330 59 466 525 1.59Ted Owen, Fort Wayne 1984-87 300 365 109 474 1.58Mike Hoefer, Stanford 1994-97 330 517 1.57Colin McMillan, Ohio St. 1997-
2000352 75 473 548 1.56
John Bowling, Pepperdine 1994-96 258 399 1.55David Frette, Ohio St. 1989-91 244 102 262 364 1.49Rene' Esteves, Ohio St. 1997-
2000343 93 417 510 1.49
Guy Nembhard, Lewis 1998-99 220 55 270 325 1.48Bryan Ivie, Southern California 1988-91 447 153 508 661 1.48Matt Prosser, Long Beach St. 1998-
2001347 51 459 510 1.47
Robert Kutsch, Long Beach St. 1987-90 370 85 442 527 1.42Adam Naeve, UCLA 1997-
99, 2001
389 50 498 548 1.41
Ryan Perrotte, Fort Wayne 1996-99 345 57 429 486 1.41Brenton Davis, Hawaii 1999-
2001270 31 348 379 1.40
Jason Olive, Hawaii 1992-95 341 87 390 474 1.39Keenan Whitehurst, Stanford 1995-98 341 472 1.38Bryan Johnwick, Lewis 1997-
2000226 51 261 312 1.38
Gary Wrobel, Ohio St. 1994-97 285 64 326 390 1.37Felipe Ralat, Fort Wayne 1992-95 396 108 427 535 1.35
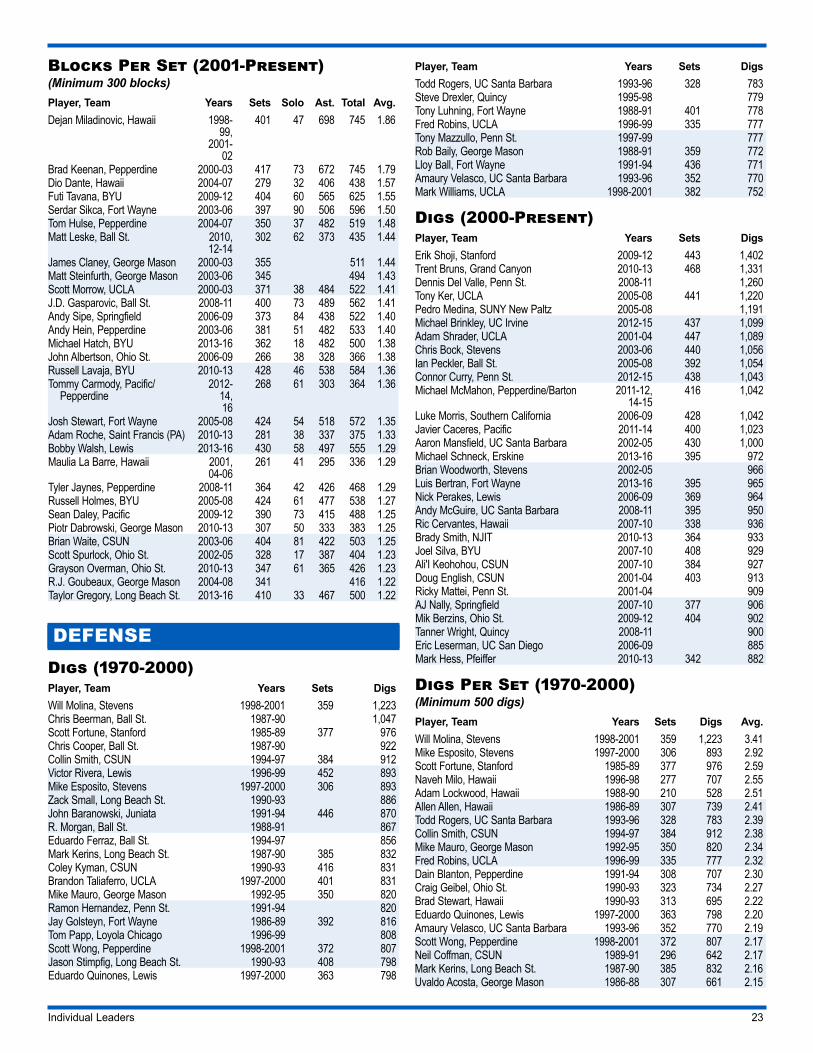
Individual Leaders 23
Blocks Per Set (2001-Present)(Minimum 300 blocks)Player, Team Years Sets Solo Ast. Total Avg.Dejan Miladinovic, Hawaii 1998-
99, 2001-
02
401 47 698 745 1.86
Brad Keenan, Pepperdine 2000-03 417 73 672 745 1.79Dio Dante, Hawaii 2004-07 279 32 406 438 1.57Futi Tavana, BYU 2009-12 404 60 565 625 1.55Serdar Sikca, Fort Wayne 2003-06 397 90 506 596 1.50Tom Hulse, Pepperdine 2004-07 350 37 482 519 1.48Matt Leske, Ball St. 2010,
12-14302 62 373 435 1.44
James Claney, George Mason 2000-03 355 511 1.44Matt Steinfurth, George Mason 2003-06 345 494 1.43Scott Morrow, UCLA 2000-03 371 38 484 522 1.41J.D. Gasparovic, Ball St. 2008-11 400 73 489 562 1.41Andy Sipe, Springfield 2006-09 373 84 438 522 1.40Andy Hein, Pepperdine 2003-06 381 51 482 533 1.40Michael Hatch, BYU 2013-16 362 18 482 500 1.38John Albertson, Ohio St. 2006-09 266 38 328 366 1.38Russell Lavaja, BYU 2010-13 428 46 538 584 1.36Tommy Carmody, Pacific/
Pepperdine2012-
14, 16
268 61 303 364 1.36
Josh Stewart, Fort Wayne 2005-08 424 54 518 572 1.35Adam Roche, Saint Francis (PA) 2010-13 281 38 337 375 1.33Bobby Walsh, Lewis 2013-16 430 58 497 555 1.29Maulia La Barre, Hawaii 2001,
04-06261 41 295 336 1.29
Tyler Jaynes, Pepperdine 2008-11 364 42 426 468 1.29Russell Holmes, BYU 2005-08 424 61 477 538 1.27Sean Daley, Pacific 2009-12 390 73 415 488 1.25Piotr Dabrowski, George Mason 2010-13 307 50 333 383 1.25Brian Waite, CSUN 2003-06 404 81 422 503 1.25Scott Spurlock, Ohio St. 2002-05 328 17 387 404 1.23Grayson Overman, Ohio St. 2010-13 347 61 365 426 1.23R.J. Goubeaux, George Mason 2004-08 341 416 1.22Taylor Gregory, Long Beach St. 2013-16 410 33 467 500 1.22
DEFENSEDigs (1970-2000)Player, Team Years Sets DigsWill Molina, Stevens 1998-2001 359 1,223Chris Beerman, Ball St. 1987-90 1,047Scott Fortune, Stanford 1985-89 377 976Chris Cooper, Ball St. 1987-90 922Collin Smith, CSUN 1994-97 384 912Victor Rivera, Lewis 1996-99 452 893Mike Esposito, Stevens 1997-2000 306 893Zack Small, Long Beach St. 1990-93 886John Baranowski, Juniata 1991-94 446 870R. Morgan, Ball St. 1988-91 867Eduardo Ferraz, Ball St. 1994-97 856Mark Kerins, Long Beach St. 1987-90 385 832Coley Kyman, CSUN 1990-93 416 831Brandon Taliaferro, UCLA 1997-2000 401 831Mike Mauro, George Mason 1992-95 350 820Ramon Hernandez, Penn St. 1991-94 820Jay Golsteyn, Fort Wayne 1986-89 392 816Tom Papp, Loyola Chicago 1996-99 808Scott Wong, Pepperdine 1998-2001 372 807Jason Stimpfig, Long Beach St. 1990-93 408 798Eduardo Quinones, Lewis 1997-2000 363 798
Player, Team Years Sets DigsTodd Rogers, UC Santa Barbara 1993-96 328 783Steve Drexler, Quincy 1995-98 779Tony Luhning, Fort Wayne 1988-91 401 778Fred Robins, UCLA 1996-99 335 777Tony Mazzullo, Penn St. 1997-99 777Rob Baily, George Mason 1988-91 359 772Lloy Ball, Fort Wayne 1991-94 436 771Amaury Velasco, UC Santa Barbara 1993-96 352 770Mark Williams, UCLA 1998-2001 382 752
Digs (2000-Present)Player, Team Years Sets DigsErik Shoji, Stanford 2009-12 443 1,402Trent Bruns, Grand Canyon 2010-13 468 1,331Dennis Del Valle, Penn St. 2008-11 1,260Tony Ker, UCLA 2005-08 441 1,220Pedro Medina, SUNY New Paltz 2005-08 1,191Michael Brinkley, UC Irvine 2012-15 437 1,099Adam Shrader, UCLA 2001-04 447 1,089Chris Bock, Stevens 2003-06 440 1,056Ian Peckler, Ball St. 2005-08 392 1,054Connor Curry, Penn St. 2012-15 438 1,043Michael McMahon, Pepperdine/Barton 2011-12,
14-15416 1,042
Luke Morris, Southern California 2006-09 428 1,042Javier Caceres, Pacific 2011-14 400 1,023Aaron Mansfield, UC Santa Barbara 2002-05 430 1,000Michael Schneck, Erskine 2013-16 395 972Brian Woodworth, Stevens 2002-05 966Luis Bertran, Fort Wayne 2013-16 395 965Nick Perakes, Lewis 2006-09 369 964Andy McGuire, UC Santa Barbara 2008-11 395 950Ric Cervantes, Hawaii 2007-10 338 936Brady Smith, NJIT 2010-13 364 933Joel Silva, BYU 2007-10 408 929Ali'I Keohohou, CSUN 2007-10 384 927Doug English, CSUN 2001-04 403 913Ricky Mattei, Penn St. 2001-04 909AJ Nally, Springfield 2007-10 377 906Mik Berzins, Ohio St. 2009-12 404 902Tanner Wright, Quincy 2008-11 900Eric Leserman, UC San Diego 2006-09 885Mark Hess, Pfeiffer 2010-13 342 882
Digs Per Set (1970-2000)(Minimum 500 digs)Player, Team Years Sets Digs Avg.Will Molina, Stevens 1998-2001 359 1,223 3.41Mike Esposito, Stevens 1997-2000 306 893 2.92Scott Fortune, Stanford 1985-89 377 976 2.59Naveh Milo, Hawaii 1996-98 277 707 2.55Adam Lockwood, Hawaii 1988-90 210 528 2.51Allen Allen, Hawaii 1986-89 307 739 2.41Todd Rogers, UC Santa Barbara 1993-96 328 783 2.39Collin Smith, CSUN 1994-97 384 912 2.38Mike Mauro, George Mason 1992-95 350 820 2.34Fred Robins, UCLA 1996-99 335 777 2.32Dain Blanton, Pepperdine 1991-94 308 707 2.30Craig Geibel, Ohio St. 1990-93 323 734 2.27Brad Stewart, Hawaii 1990-93 313 695 2.22Eduardo Quinones, Lewis 1997-2000 363 798 2.20Amaury Velasco, UC Santa Barbara 1993-96 352 770 2.19Scott Wong, Pepperdine 1998-2001 372 807 2.17Neil Coffman, CSUN 1989-91 296 642 2.17Mark Kerins, Long Beach St. 1987-90 385 832 2.16Uvaldo Acosta, George Mason 1986-88 307 661 2.15
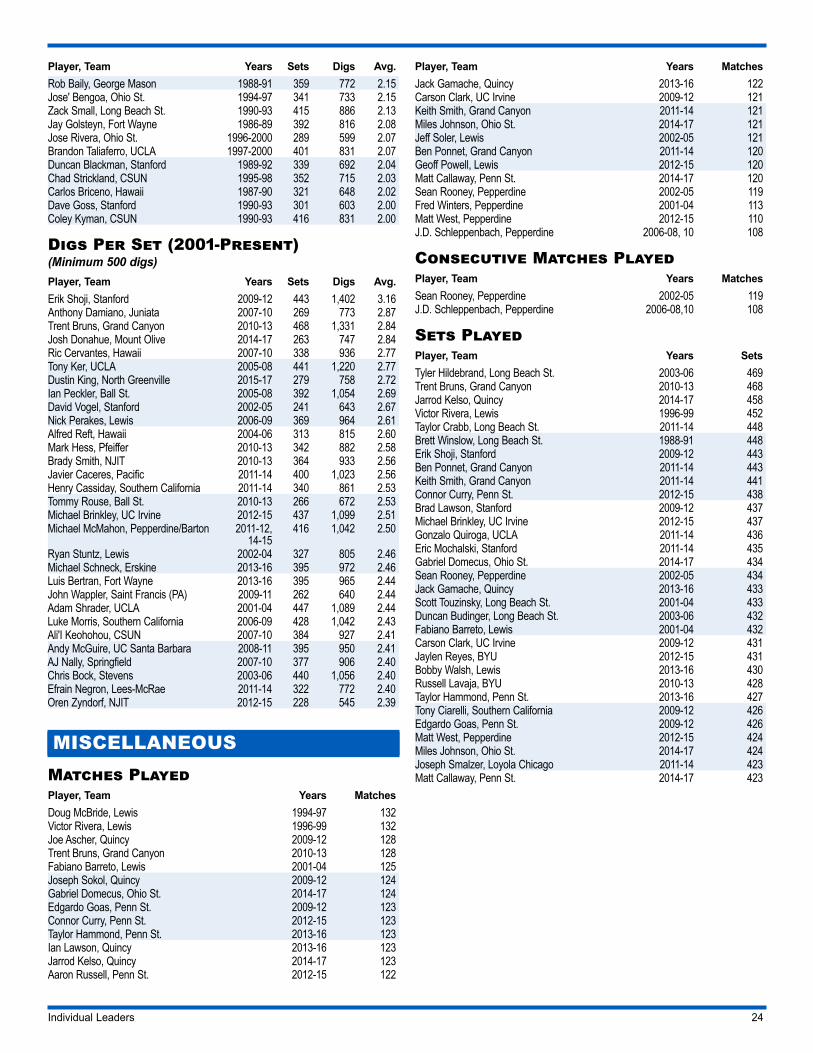
Individual Leaders 24
Player, Team Years Sets Digs Avg.Rob Baily, George Mason 1988-91 359 772 2.15Jose' Bengoa, Ohio St. 1994-97 341 733 2.15Zack Small, Long Beach St. 1990-93 415 886 2.13Jay Golsteyn, Fort Wayne 1986-89 392 816 2.08Jose Rivera, Ohio St. 1996-2000 289 599 2.07Brandon Taliaferro, UCLA 1997-2000 401 831 2.07Duncan Blackman, Stanford 1989-92 339 692 2.04Chad Strickland, CSUN 1995-98 352 715 2.03Carlos Briceno, Hawaii 1987-90 321 648 2.02Dave Goss, Stanford 1990-93 301 603 2.00Coley Kyman, CSUN 1990-93 416 831 2.00
Digs Per Set (2001-Present)(Minimum 500 digs)Player, Team Years Sets Digs Avg.Erik Shoji, Stanford 2009-12 443 1,402 3.16Anthony Damiano, Juniata 2007-10 269 773 2.87Trent Bruns, Grand Canyon 2010-13 468 1,331 2.84Josh Donahue, Mount Olive 2014-17 263 747 2.84Ric Cervantes, Hawaii 2007-10 338 936 2.77Tony Ker, UCLA 2005-08 441 1,220 2.77Dustin King, North Greenville 2015-17 279 758 2.72Ian Peckler, Ball St. 2005-08 392 1,054 2.69David Vogel, Stanford 2002-05 241 643 2.67Nick Perakes, Lewis 2006-09 369 964 2.61Alfred Reft, Hawaii 2004-06 313 815 2.60Mark Hess, Pfeiffer 2010-13 342 882 2.58Brady Smith, NJIT 2010-13 364 933 2.56Javier Caceres, Pacific 2011-14 400 1,023 2.56Henry Cassiday, Southern California 2011-14 340 861 2.53Tommy Rouse, Ball St. 2010-13 266 672 2.53Michael Brinkley, UC Irvine 2012-15 437 1,099 2.51Michael McMahon, Pepperdine/Barton 2011-12,
14-15416 1,042 2.50
Ryan Stuntz, Lewis 2002-04 327 805 2.46Michael Schneck, Erskine 2013-16 395 972 2.46Luis Bertran, Fort Wayne 2013-16 395 965 2.44John Wappler, Saint Francis (PA) 2009-11 262 640 2.44Adam Shrader, UCLA 2001-04 447 1,089 2.44Luke Morris, Southern California 2006-09 428 1,042 2.43Ali'I Keohohou, CSUN 2007-10 384 927 2.41Andy McGuire, UC Santa Barbara 2008-11 395 950 2.41AJ Nally, Springfield 2007-10 377 906 2.40Chris Bock, Stevens 2003-06 440 1,056 2.40Efrain Negron, Lees-McRae 2011-14 322 772 2.40Oren Zyndorf, NJIT 2012-15 228 545 2.39
MISCELLANEOUSMatches PlayedPlayer, Team Years MatchesDoug McBride, Lewis 1994-97 132Victor Rivera, Lewis 1996-99 132Joe Ascher, Quincy 2009-12 128Trent Bruns, Grand Canyon 2010-13 128Fabiano Barreto, Lewis 2001-04 125Joseph Sokol, Quincy 2009-12 124Gabriel Domecus, Ohio St. 2014-17 124Edgardo Goas, Penn St. 2009-12 123Connor Curry, Penn St. 2012-15 123Taylor Hammond, Penn St. 2013-16 123Ian Lawson, Quincy 2013-16 123Jarrod Kelso, Quincy 2014-17 123Aaron Russell, Penn St. 2012-15 122
Player, Team Years MatchesJack Gamache, Quincy 2013-16 122Carson Clark, UC Irvine 2009-12 121Keith Smith, Grand Canyon 2011-14 121Miles Johnson, Ohio St. 2014-17 121Jeff Soler, Lewis 2002-05 121Ben Ponnet, Grand Canyon 2011-14 120Geoff Powell, Lewis 2012-15 120Matt Callaway, Penn St. 2014-17 120Sean Rooney, Pepperdine 2002-05 119Fred Winters, Pepperdine 2001-04 113Matt West, Pepperdine 2012-15 110J.D. Schleppenbach, Pepperdine 2006-08, 10 108
Consecutive Matches PlayedPlayer, Team Years MatchesSean Rooney, Pepperdine 2002-05 119J.D. Schleppenbach, Pepperdine 2006-08,10 108
Sets PlayedPlayer, Team Years SetsTyler Hildebrand, Long Beach St. 2003-06 469Trent Bruns, Grand Canyon 2010-13 468Jarrod Kelso, Quincy 2014-17 458Victor Rivera, Lewis 1996-99 452Taylor Crabb, Long Beach St. 2011-14 448Brett Winslow, Long Beach St. 1988-91 448Erik Shoji, Stanford 2009-12 443Ben Ponnet, Grand Canyon 2011-14 443Keith Smith, Grand Canyon 2011-14 441Connor Curry, Penn St. 2012-15 438Brad Lawson, Stanford 2009-12 437Michael Brinkley, UC Irvine 2012-15 437Gonzalo Quiroga, UCLA 2011-14 436Eric Mochalski, Stanford 2011-14 435Gabriel Domecus, Ohio St. 2014-17 434Sean Rooney, Pepperdine 2002-05 434Jack Gamache, Quincy 2013-16 433Scott Touzinsky, Long Beach St. 2001-04 433Duncan Budinger, Long Beach St. 2003-06 432Fabiano Barreto, Lewis 2001-04 432Carson Clark, UC Irvine 2009-12 431Jaylen Reyes, BYU 2012-15 431Bobby Walsh, Lewis 2013-16 430Russell Lavaja, BYU 2010-13 428Taylor Hammond, Penn St. 2013-16 427Tony Ciarelli, Southern California 2009-12 426Edgardo Goas, Penn St. 2009-12 426Matt West, Pepperdine 2012-15 424Miles Johnson, Ohio St. 2014-17 424Joseph Smalzer, Loyola Chicago 2011-14 423Matt Callaway, Penn St. 2014-17 423
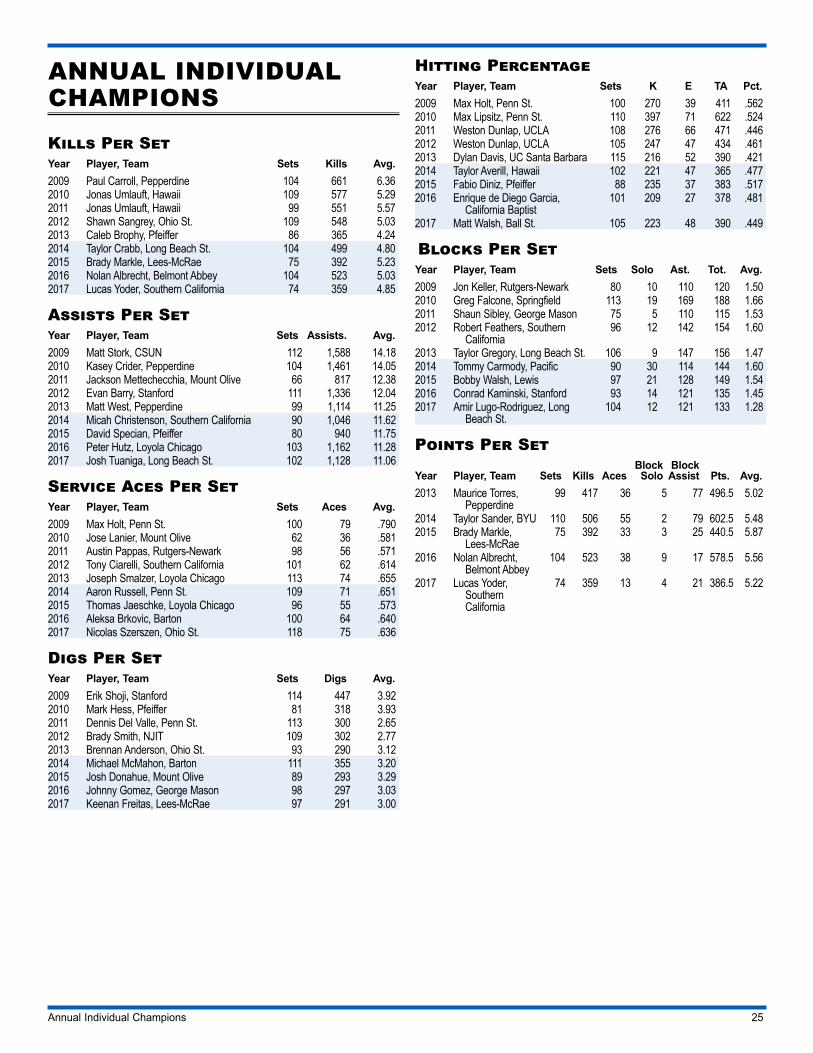
Annual Individual Champions 25
ANNUAL INDIVIDUAL CHAMPIONS
Kills Per SetYear Player, Team Sets Kills Avg.2009 Paul Carroll, Pepperdine 104 661 6.362010 Jonas Umlauft, Hawaii 109 577 5.292011 Jonas Umlauft, Hawaii 99 551 5.572012 Shawn Sangrey, Ohio St. 109 548 5.032013 Caleb Brophy, Pfeiffer 86 365 4.242014 Taylor Crabb, Long Beach St. 104 499 4.802015 Brady Markle, Lees-McRae 75 392 5.232016 Nolan Albrecht, Belmont Abbey 104 523 5.032017 Lucas Yoder, Southern California 74 359 4.85
Assists Per SetYear Player, Team Sets Assists. Avg.2009 Matt Stork, CSUN 112 1,588 14.182010 Kasey Crider, Pepperdine 104 1,461 14.052011 Jackson Mettechecchia, Mount Olive 66 817 12.382012 Evan Barry, Stanford 111 1,336 12.042013 Matt West, Pepperdine 99 1,114 11.252014 Micah Christenson, Southern California 90 1,046 11.622015 David Specian, Pfeiffer 80 940 11.752016 Peter Hutz, Loyola Chicago 103 1,162 11.282017 Josh Tuaniga, Long Beach St. 102 1,128 11.06
Service Aces Per SetYear Player, Team Sets Aces Avg.2009 Max Holt, Penn St. 100 79 .7902010 Jose Lanier, Mount Olive 62 36 .5812011 Austin Pappas, Rutgers-Newark 98 56 .5712012 Tony Ciarelli, Southern California 101 62 .6142013 Joseph Smalzer, Loyola Chicago 113 74 .6552014 Aaron Russell, Penn St. 109 71 .6512015 Thomas Jaeschke, Loyola Chicago 96 55 .5732016 Aleksa Brkovic, Barton 100 64 .6402017 Nicolas Szerszen, Ohio St. 118 75 .636
Digs Per SetYear Player, Team Sets Digs Avg.2009 Erik Shoji, Stanford 114 447 3.922010 Mark Hess, Pfeiffer 81 318 3.932011 Dennis Del Valle, Penn St. 113 300 2.652012 Brady Smith, NJIT 109 302 2.772013 Brennan Anderson, Ohio St. 93 290 3.122014 Michael McMahon, Barton 111 355 3.202015 Josh Donahue, Mount Olive 89 293 3.292016 Johnny Gomez, George Mason 98 297 3.032017 Keenan Freitas, Lees-McRae 97 291 3.00
Hitting PercentageYear Player, Team Sets K E TA Pct.2009 Max Holt, Penn St. 100 270 39 411 .5622010 Max Lipsitz, Penn St. 110 397 71 622 .5242011 Weston Dunlap, UCLA 108 276 66 471 .4462012 Weston Dunlap, UCLA 105 247 47 434 .4612013 Dylan Davis, UC Santa Barbara 115 216 52 390 .4212014 Taylor Averill, Hawaii 102 221 47 365 .4772015 Fabio Diniz, Pfeiffer 88 235 37 383 .5172016 Enrique de Diego Garcia,
California Baptist101 209 27 378 .481
2017 Matt Walsh, Ball St. 105 223 48 390 .449
Blocks Per SetYear Player, Team Sets Solo Ast. Tot. Avg.2009 Jon Keller, Rutgers-Newark 80 10 110 120 1.502010 Greg Falcone, Springfield 113 19 169 188 1.662011 Shaun Sibley, George Mason 75 5 110 115 1.532012 Robert Feathers, Southern
California96 12 142 154 1.60
2013 Taylor Gregory, Long Beach St. 106 9 147 156 1.472014 Tommy Carmody, Pacific 90 30 114 144 1.602015 Bobby Walsh, Lewis 97 21 128 149 1.542016 Conrad Kaminski, Stanford 93 14 121 135 1.452017 Amir Lugo-Rodriguez, Long
Beach St.104 12 121 133 1.28
Points Per Set
Year Player, Team Sets Kills AcesBlock Solo
Block Assist Pts. Avg.
2013 Maurice Torres, Pepperdine
99 417 36 5 77 496.5 5.02
2014 Taylor Sander, BYU 110 506 55 2 79 602.5 5.482015 Brady Markle,
Lees-McRae75 392 33 3 25 440.5 5.87
2016 Nolan Albrecht, Belmont Abbey
104 523 38 9 17 578.5 5.56
2017 Lucas Yoder, Southern California
74 359 13 4 21 386.5 5.22
Team Records 26
TEAM RECORDSOfficial NCAA volleyball records began with the 1981 season and are based on information submitted to the NCAA statistics service by institutions partici-pating in the statistics rankings. In statistical rankings, the rounding of percent-ages and/or averages may indicate ties where none exists. In these cases, the numerical order of the rankings is accurate.In 2011, team season blocking categories were added for seasons since 2001. Research continues on single match data for those seasons. Information on blocking from 1981 to 2000 has not been included in the following records since there appeared to be a significant variance in the methods by which blocking statistics were kept during those years. An “M” located after a number under a “sets played” column indicates the number of matches played, as the number of sets is unavailable.
ATTACKKillsThree-set match (1970-2000, sideout scoring)
Not AvailableThree-set match (2001- present, rally scoring)
63—Springfield vs. Vassar, Feb. 28, 2003Four-set match (1970-2000, sideout scoring)
133—Pepperdine vs. UCLA, Feb. 25, 1993Four-set match (2001- present, rally scoring)
83—Pepperdine vs. CSUN, Feb. 26, 2010Five-set match (1970-2000, sideout scoring)
142—Southern California vs. Ohio St., Jan. 24, 1997Five-set match (2001- present, rally scoring)
99—Ball St. vs. Lewis, May 1, 2004Season (1970-2000, sideout scoring)
3,028—George Mason, 1990 (157 sets)Season (2001-10, 30-point rally scoring)
2,130—UCLA, 2006Season (2011-present, 25-point rally scoring)
1,780—Quincy, 2016 (153 sets)Per set (1970-2000, sideout scoring)
22.77—BYU, 2000 (2,323 kills in 102 sets)Per set (2001-10, 30-point rally scoring)
17.06—Loyola Chicago, 2003 (1,604 kills in 94 sets)Per set (2011-present, 25-point rally scoring)
14.16—Southern California, 2011 (1,430 kills in 101 sets)
Total AttacksThree-set match (1970-2000, sideout scoring)
Not AvailableThree-set match (2001- present, rally scoring)
140—Stanford vs. BYU, Feb. 23, 2008Four-set match (1970-2000, sideout scoring)
Not AvailableFour-set match (2001- present, rally scoring)
186—Stanford vs. UCLA, April 2, 2005Five-set match (1970-2000, sideout scoring)
277—Pepperdine vs. Hawaii, March 24, 1987Five-set match (2001- present, rally scoring)
194—Ball St. vs. Lewis, May 1, 2004Season (1970-2000, sideout scoring)
5,737—Long Beach St., 1990 (146 sets)Season (2001-10, 30-point rally scoring)
4,512—UCLA, 2006 (135 sets)Season (2011-present, 25-point rally scoring)
3,457—UCLA, 2013 (129 sets)Per set (1970-2000, sideout scoring)
66.89—UC Santa Barbara, 1988 (4,682 in 70 sets)Per set (2001-10, 30-point rally scoring)
34.26—Springfield, 2010 (3,871 in 113 sets)Per set (2011, 25-point rally scoring)
30.09—Fort Wayne, 2012 (3,370 in 112 sets)
Hitting Percentage*Three-set match (1970-2000, sideout scoring)
.666—UCLA vs. Loyola Marymount, Feb. 17, 1984 Three-set match (2001- present, rally scoring)
.665—BYU vs. Southern California, Jan. 31, 2001 (42-4/58)Four-set match (1970-2000, sideout scoring)
Not AvailableFour-set match (2001- present, rally scoring)
.545—BYU vs. Pepperdine, March 28, 2013 (53-9/94)Five-set match (1970-2000, sideout scoring)
Not AvailableFive-set match (2001- present, rally scoring)
.434—Penn St. vs. Princeton, Feb. 11, 2017 (70-17/122)Season (1970-2000, sideout scoring)
.420—UCLA, 1993 (1,891-467/3,389)Season (2001-10, 30-point rally scoring)
.399—Penn St., 2008 Season (2011-present, 25-point rally scoring)
.366—Long Beach St., 2017 (1,397-365/2,817 in 105 sets)*Hitting percentage is derived by subtracting errors from kills and dividing that difference by total attacks.
SETTINGAssistsThree-set match (1970-2000, sideout scoring)
Not AvailableThree-set match (2001- present, rally scoring)
61—Ball St. vs. St. Francis (IL), April 10, 2010Four-set match (1970-2000, sideout scoring)
Not AvailableFour-set match (2001- present, rally scoring)
82—BYU vs. Pepperdine, March 13, 2004Five-set match (1970-2000, sideout scoring)
Not AvailableFive-set match (2001- present, rally scoring)
92—Ball St. vs. Lewis, May 1, 2004Season (1970-2000, sideout scoring)
2,652—Long Beach St., 1991 (130 sets)Season (2001-10, 30-point rally scoring)
2,040—Quincy, 2009 (175 sets)Season (2011-present, 25-point rally scoring)
1,654—Quincy, 2016 (153 sets)Per set (1970-2000, sideout scoring)
21.39—BYU, 2000 (2,182 assists in 102 sets)Per set (2001-10, 30-point rally scoring)
15.70—Stanford, 2010 (1,727 assists in 110 sets)Per set (2011-present, 25-point rally scoring)
13.35—Southern California, 2011 (1,348 assists in 101 sets)
SERVICEService AcesThree-set match (1970-2000, sideout scoring)
14—UCLA vs. Southern California, March 7, 1993Three-set match
30—Ball St. vs. Central St. (OH), Feb. 7, 2006Four-set match (1970-2000, sideout scoring)
Not AvailableFour-set match
18—Southern California vs. UC Irvine, Jan. 23, 2001Five-set match (1970-2000, sideout scoring)
15—Southern California vs. Ohio St., March 21, 2000Five-set match
15—Lewis vs. NJIT, Jan. 20, 2006Season (1970-2000, sideout scoring)
234—Fort Wayne, 1984 (??? sets)Season (2001-10, 30-point rally scoring)
289—Stevens, 2007 (??? sets)
Team Records 27
Season (2011-present, 25-point rally scoring)225—Ohio St., 2016 (119 sets); Ohio St., 2017 (119 sets)
Per set (1970-2000, sideout scoring)2.08—Pepperdine, 2000 (??? aces in 108 sets)
Per set (2001-10, 30-point rally scoring)2.75—Stevens, 2001)
Per set (2011-present, 25-point rally scoring)2.05—Coker, 2016 (172 aces in 84 sets)
BLOCKINGTotal BlocksThree-set match (1970-2000, sideout scoring)
Not AvailableThree-set match
23—Ball St. vs. Sacred Heart, Jan. 24, 2015Four-set match (1970-2000, sideout scoring)
Not AvailableFour-set match
26—Southern California vs. Long Beach St., March 26, 2009 (5 BS/42 BA)Five-set match (1970-2000, sideout scoring)
56—Southern California vs. UC Santa Barbara, March 27, 1979 (15 BS/82 BA)
Five-set match27.5—Pepperdine vs. Hawaii, March 2, 2005
Season (1970-2000, sideout scoring)597—Stevens, 1995
Season (2001-10, 30-point rally scoring)473—Penn St., 2005
Season (2011-present, 25-point rally scoring)398.5—BYU, 2012 (122 sets, 49 solo, 699 assists)
Per set (1970-2000, sideout scoring)6.56—Stevens, 1990
Per set (2001-10, 30-point rally scoring)3.93—BYU, 2001 (381.5 total blocks in 97 sets)
Per set (2011-present, 25-point rally scoring)3.40—Lewis, 2015 (374.5 total blocks in 110 sets)
DEFENSEDigsThree-set match (1970-2000, sideout scoring)
Not AvailableThree-set match
61—Stanford vs. Hawaii, Feb. 28, 2009Four-set match (1970-2000, sideout scoring)
Not AvailableFour-set match
71—Ball St. vs. Loyola Chicago, April 15, 2005Five-set match (1970-2000, sideout scoring)
101—Southern California vs. UC Santa Barbara, May 7, 1988Five-set match
75—Ball St. vs. Fort Wayne, Jan. 31, 2014Season (1970-2000, sideout scoring)
2,094—Stevens, 2000 (115 sets)Season (2001-10, 30-point rally scoring)
1,821—Quincy, 2009 (175 sets)Season (2011-present, 25-point rally scoring)
1,224—Stanford, 2014 (125 sets)Per set (1970-2000, sideout scoring)
18.21—Stevens, 2000 (2,094 digs in 115 sets)Per set (2001-10, 30-point rally scoring)
12.11—Pfeiffer, 2010 (981 digs in 81 sets)Per set (2011-present, 25-point rally scoring)
11.39—Long Beach St., 2014 (1,185 digs in 104 sets)
MISCELLANEOUSBest Winning Percentage
1.000—UCLA, 1984 (38-0); UCLA, 1979 (30-0); UCLA, 1982 (29-0)
Consecutive Winning Seasons39—Hawaii, 1979-2017 (current)
Matches Won In a Season38—UCLA, 1984 (38-0); UCLA, 1987 (38-3)
Matches Lost In a Season25—BYU, 1991; Southern California, 2003
Consecutive Matches Won47—UCLA, Jan. 14, 1979 to March 1, 1980; UCLA, April 20, 1983 to Jan.
19, 1985
Consecutive Sets Won32—Hawaii, Feb. 4, 2017 to March 11, 2017
Consecutive Home-Court Matches Won83—UCLA, 1975-82
Consecutive Road Matches Won (includes neutral site matches)
28—UCLA, 1981-83
Consecutive Conference Matches Won(All matches vs. conference opponents)
29—Southern California, March 9, 1985-Feb. 4, 1987 (CIVA/WIVA)
Consecutive Regular-Season Conference Matches Won(Regular-season matches vs. conference opponents)
24—Pepperdine, Feb. 22, 2002 to Feb. 26, 2003 (??)
Most Improved Won-Lost RecordNot Available
Consecutive Matches Lost24—BYU, March 27, 1990-Feb. 22, 1991
Longest MatchNot Available
Shortest MatchNot Available
Consecutive Matches With At Least One Service Ace
Not Available
Team Leaders 28
TEAM LEADERS
SINGLE-MATCH RECORDSATTACKKills, Three-Set Match (1970-2000)No. Team vs. Opponent Date
Not Available
Kills, Three-Set Match (2001-Present)No. Team vs. Opponent Date63 Springfield vs. Vassar Feb. 28, 200362 Pepperdine vs. Pacific Feb. 8, 200362 Pepperdine vs. Stanford March 29, 200362 Lewis vs. Juniata March 19, 201061 Ball St. vs. Loyola Chicago March 1, 200261 Ball St. vs. Ohio St. April 12, 200361 Stanford vs. UC Santa Barbara Jan. 25, 200861 Stanford vs. Hawaii Feb. 26, 200961 Pepperdine vs. Stanford Feb. 19, 201061 Ball St. vs. St. Francis (IL) April 10, 2010
Kills, Four-Set Match (1970-2000)No. Team vs. Opponent Date 133 Pepperdine vs. UCLA Feb. 25, 1993
Kills, Four-Set Match (2001-Present)No. Team vs. Opponent Date 83 Pepperdine vs. CSUN Feb. 26, 201080 Pepperdine vs. Stanford April 13, 200280 Ball St. vs. Lewis April 26, 200280 Hawaii vs. UC Santa Barbara March 5, 200979 Ball St. vs. Mercyhurst April 20, 200279 Hawaii vs. Southern California April 19, 200978 Pepperdine vs. Southern California March 17, 200576 Springfield vs. NYU Feb. 5, 200375 Stanford vs. UC Irvine April 24, 2010
Kills, Five-Set Match (1970-2000)No. Team vs. Opponent Date 142 Southern California vs. Ohio St. Jan. 24, 1997139 UCLA vs. UC Santa Barbara Feb. 12, 1987
Kills, Five-Set Match (2001-Present)No. Team vs. Opponent Date 99 Ball St. vs. Lewis May 1, 200491 BYU vs. Stanford April 20, 200289 BYU vs. UCLA Feb. 23, 200289 Ball St. vs. Loyola Chicago April 5, 200287 BYU vs. Stanford Jan. 12, 200287 Hawaii vs. Stanford Jan. 24, 200387 BYU vs. Pepperdine April 26, 200387 Stanford vs. UCLA Feb. 5, 200986 Hawaii vs. Stanford Jan. 29, 200286 Pepperdine vs. UCLA Jan. 24, 200786 Stanford vs. Pepperdine April 9, 2010
Total Attacks, Three-Set Match (1970-2000)No. Team vs. Opponent Date
Not Available
Total Attacks, Three-Set Match (2001-Present)No. Team vs. Opponent Date140 Stanford vs. BYU Feb. 23, 2008136 Ball St. vs. Ohio St. Feb. 25, 2006134 Stanford vs. Hawaii Feb. 26, 2009134 Lewis vs. Juniata March 19, 2010133 Springfield vs. Rutgers-Newark March 4, 2005128 Stanford vs. Hawaii Feb. 28, 2009126 Lewis vs. Quincy Jan. 13, 2006126 Stanford vs. Ohio St. Jan. 16, 2009125 Ball St. vs. Rutgers-Newark March 4, 2006124 Ball St. vs. Lewis Feb. 1, 2003
Total Attacks, Four-Set Match (1970-2000)No. Team vs. Opponent Date
Not Available
Total Attacks, Four-Set Match (2001-Present)No. Team vs. Opponent Date 186 Stanford vs. UCLA April 2, 2005180 Hawaii vs. Southern California April 18, 2009172 Hawaii vs. Pepperdine Jan. 15, 2009171 Ball St. vs. Fort Wayne March 18, 2006171 Hawaii vs. Southern California March 9, 2010167 Stanford vs. CSUN April 2, 2010166 Ball St. vs. Grand Canyon Jan. 21, 2010163 Ball St. vs. Loyola Chicago April 15, 2005
Total Attacks, Five-Set Match (1970-2000)No. Team vs. Opponent Date 277 Pepperdine vs. Hawaii March 24, 1987
Total Attacks, Five-Set Match (2001-Present)No. Team vs. Opponent Date 194 Ball St. vs. Lewis May 1, 2004192 Ball St. vs. Ohio St. April 1, 2005188 Springfield vs. NYU March 30, 2004186 Stanford vs. Hawaii Feb. 27, 2008185 BYU vs. Long Beach St. Jan. 30, 2004185 Hawaii vs. UC Santa Barbara Feb. 1, 2008181 Ball St. vs. Quincy March 2, 2007179 BYU vs. UCLA Feb. 23, 2002178 Hawaii vs. UC Irvine Jan. 30, 2010178 Lewis vs. Ball St. Feb. 26, 2010
Hitting Percentage, Three-Set Match (1970-2000)(Minimum 15 attacks per set)Pct. (K-E/TA) Team vs. Opponent Date.666 UCLA vs. Loyola Marymount Feb. 17, 1984
Team Leaders 29
Pct. (K-E/TA) Team vs. Opponent Date.636 62-6/88 Southern California vs. UC Irvine March 8, 1994.597 Pepperdine vs. UC Santa Barbara Feb. 6, 1985
Hitting Percentage, Three-Set Match (2001-Present)(Minimum 15 attacks per set)
Pct. (K-E/TA) Team vs. Opponent Date.665 42-4/58 BYU vs. Southern California Jan. 31, 2001.661 43-2/62 CSUN vs. UC Merced Jan. 4, 2017.644 41-3/59 King (TN) vs. Pfeiffer Jan. 31, 2017.632 40-4/57 George Mason vs. McKendree March 3, 2017.573 50-7/75 BYU vs. UC San Diego Feb. 16, 2006
Hitting Percentage, Four-Set Match (1970-2000)(Minimum 15 attacks per set)Pct. (K-E/TA) Team vs. Opponent Date
Not Available
Hitting Percentage, Four-Set Match (2001-Present)(Minimum 15 attacks per set)
Pct. (K-E/TA) Team vs. Opponent Date.545 53-9/94 BYU vs. Pepperdine March 28, 2013.485 59-11/99 Ohio St. vs. Lewis Feb. 9, 2017.479 58-13/94 Penn St. vs. Coker Jan. 28, 2017.475 61-14/99 UCLA vs. UC San Diego Feb. 25, 2017.453 55-12/95 NJIT vs. North Greenville Jan. 11, 2017
Hitting Percentage, Five-Set Match (1970-2000)(Minimum 15 attacks per set)Pct. (K-E/TA) Team vs. Opponent Date
Not Available
Hitting Percentage, Five-Set Match (2001-Present)(Minimum 15 attacks per set)Pct. (K-E/TA) Team vs. Opponent Date.434 70-17/122 Penn St. vs. Princeton Feb. 11, 2017.410 68-20/117 UC Irvine vs. CSUN March 3, 2017.388 68-18/129 UC Irvine vs. UC Santa Barbara Feb. 25, 2017
SETTINGAssists, Three-Set Match (1970-2000)No. Team vs. Opponent Date
Not Available
Assists, Three-Set Match (2001-Present)No. Team vs. Opponent Date61 Ball St. vs. St. Francis (IL) April 10, 201060 Pepperdine vs. Stanford March 29, 200360 Pepperdine vs. Stanford Feb. 19, 201059 Lewis vs. Juniata March 19, 201058 Pepperdine vs. Pacific Jan. 19, 2001
No. Team vs. Opponent Date58 Ball St. vs. Loyola Chicago March 1, 200257 Ball St. vs. Ohio St. April 12, 200356 Stanford vs. UC Santa Barbara Jan. 25, 200856 Stanford vs. BYU Feb. 23, 200856 Stanford vs. Pepperdine Feb. 19, 2010
Assists, Four-Set Match (1970-2000)No. Team vs. Opponent Date
Not Available
Assists, Four-Set Match (2001-Present)No. Team vs. Opponent Date 82 BYU vs. Pepperdine March 13, 200481 Pepperdine vs. CSUN Feb. 26, 201079 Hawaii vs. UC Santa Barbara March 5, 200976 Pepperdine vs. Stanford April 13, 200276 Hawaii vs. Southern California April 18, 200974 Ball St. vs. Lewis April 26, 200274 Pepperdine vs. Hawaii Feb. 26, 200374 Stanford vs. UC Irvine April 24, 201073 Ball St. vs. Mercyhurst April 20, 200273 Ball St. vs. Lewis April 24, 2008
Assists, Five-Set Match (1970-2000)No. Team vs. Opponent Date
Not Available
Assists, Five-Set Match (2001-Present)No. Team vs. Opponent Date 92 Ball St. vs. Lewis May 1, 200491 BYU vs. Stanford April 20, 200286 Ball St. vs. Loyola Chicago April 5, 200286 Stanford vs. UCLA Feb. 5, 200985 BYU vs. UCLA Feb. 23, 200285 Pepperdine vs. UCLA Jan. 24, 200784 Hawaii vs. Stanford Jan. 29, 200283 Stanford vs. Pepperdine April 9, 201082 Pepperdine vs. CSUN Jan. 29, 200282 Stanford vs. Hawaii Jan. 30, 200282 BYU vs. Pepperdine April 26, 2003
SERVICEService Aces, Three-Set Match (1970-2000)No. Team vs. Opponent Date14 UCLA vs. Southern California March 7, 1993
Service Aces, Three-Set Match (2001-Present)No. Team vs. Opponent Date30 Ball St. vs. Central St. (OH) Feb. 7, 200627 Ball St. vs. Central St. (OH) March 28, 200615 BYU vs. UC San Diego Jan. 18, 201415 UCLA vs. Limestone Jan. 10, 201513 Ball St. vs. MSOE Jan. 26, 200713 Lewis vs. Mercyhurst March 14, 200812 Lewis vs. Quincy April 3, 2012
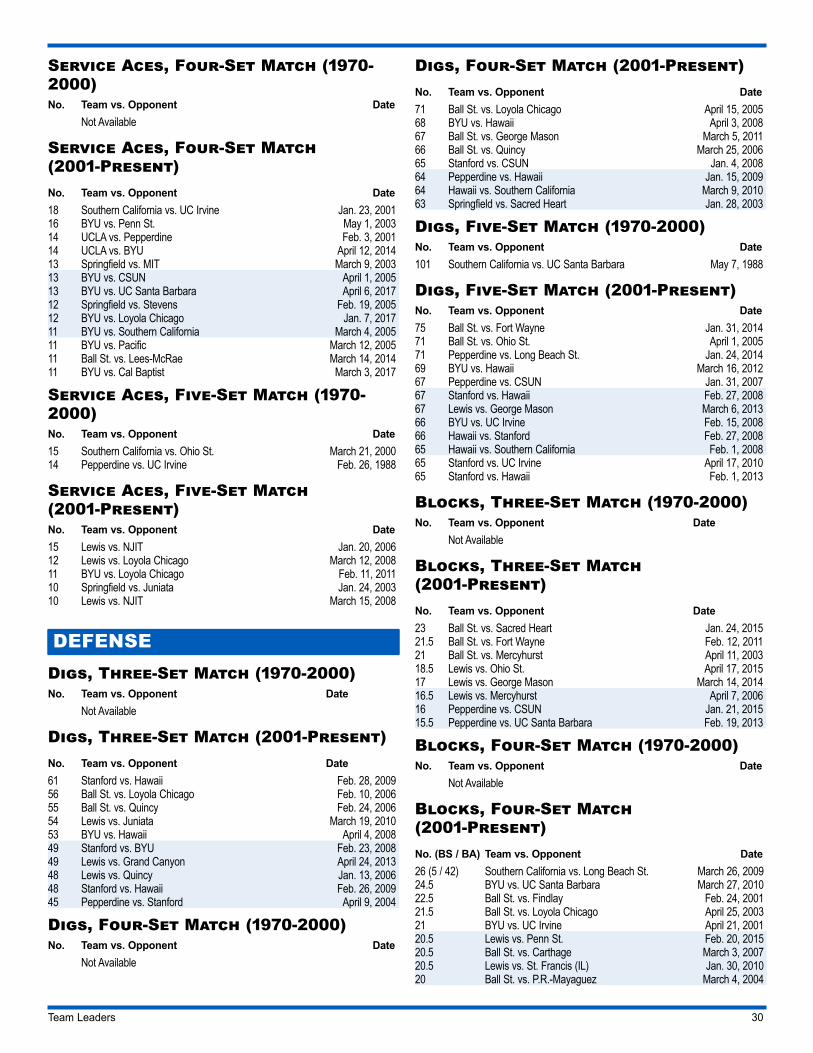
Team Leaders 30
Service Aces, Four-Set Match (1970-2000)No. Team vs. Opponent Date
Not Available
Service Aces, Four-Set Match (2001-Present)No. Team vs. Opponent Date 18 Southern California vs. UC Irvine Jan. 23, 200116 BYU vs. Penn St. May 1, 200314 UCLA vs. Pepperdine Feb. 3, 200114 UCLA vs. BYU April 12, 201413 Springfield vs. MIT March 9, 200313 BYU vs. CSUN April 1, 200513 BYU vs. UC Santa Barbara April 6, 201712 Springfield vs. Stevens Feb. 19, 200512 BYU vs. Loyola Chicago Jan. 7, 201711 BYU vs. Southern California March 4, 200511 BYU vs. Pacific March 12, 200511 Ball St. vs. Lees-McRae March 14, 201411 BYU vs. Cal Baptist March 3, 2017
Service Aces, Five-Set Match (1970-2000)No. Team vs. Opponent Date 15 Southern California vs. Ohio St. March 21, 200014 Pepperdine vs. UC Irvine Feb. 26, 1988
Service Aces, Five-Set Match (2001-Present)No. Team vs. Opponent Date 15 Lewis vs. NJIT Jan. 20, 200612 Lewis vs. Loyola Chicago March 12, 200811 BYU vs. Loyola Chicago Feb. 11, 201110 Springfield vs. Juniata Jan. 24, 200310 Lewis vs. NJIT March 15, 2008
DEFENSEDigs, Three-Set Match (1970-2000)No. Team vs. Opponent Date
Not Available
Digs, Three-Set Match (2001-Present)No. Team vs. Opponent Date61 Stanford vs. Hawaii Feb. 28, 200956 Ball St. vs. Loyola Chicago Feb. 10, 200655 Ball St. vs. Quincy Feb. 24, 200654 Lewis vs. Juniata March 19, 201053 BYU vs. Hawaii April 4, 200849 Stanford vs. BYU Feb. 23, 200849 Lewis vs. Grand Canyon April 24, 201348 Lewis vs. Quincy Jan. 13, 200648 Stanford vs. Hawaii Feb. 26, 200945 Pepperdine vs. Stanford April 9, 2004
Digs, Four-Set Match (1970-2000)No. Team vs. Opponent Date
Not Available
Digs, Four-Set Match (2001-Present)No. Team vs. Opponent Date 71 Ball St. vs. Loyola Chicago April 15, 200568 BYU vs. Hawaii April 3, 200867 Ball St. vs. George Mason March 5, 201166 Ball St. vs. Quincy March 25, 200665 Stanford vs. CSUN Jan. 4, 200864 Pepperdine vs. Hawaii Jan. 15, 200964 Hawaii vs. Southern California March 9, 201063 Springfield vs. Sacred Heart Jan. 28, 2003
Digs, Five-Set Match (1970-2000)No. Team vs. Opponent Date 101 Southern California vs. UC Santa Barbara May 7, 1988
Digs, Five-Set Match (2001-Present)No. Team vs. Opponent Date 75 Ball St. vs. Fort Wayne Jan. 31, 201471 Ball St. vs. Ohio St. April 1, 200571 Pepperdine vs. Long Beach St. Jan. 24, 201469 BYU vs. Hawaii March 16, 201267 Pepperdine vs. CSUN Jan. 31, 200767 Stanford vs. Hawaii Feb. 27, 200867 Lewis vs. George Mason March 6, 201366 BYU vs. UC Irvine Feb. 15, 200866 Hawaii vs. Stanford Feb. 27, 200865 Hawaii vs. Southern California Feb. 1, 200865 Stanford vs. UC Irvine April 17, 201065 Stanford vs. Hawaii Feb. 1, 2013
Blocks, Three-Set Match (1970-2000)No. Team vs. Opponent Date
Not Available
Blocks, Three-Set Match (2001-Present)No. Team vs. Opponent Date23 Ball St. vs. Sacred Heart Jan. 24, 201521.5 Ball St. vs. Fort Wayne Feb. 12, 201121 Ball St. vs. Mercyhurst April 11, 200318.5 Lewis vs. Ohio St. April 17, 201517 Lewis vs. George Mason March 14, 201416.5 Lewis vs. Mercyhurst April 7, 200616 Pepperdine vs. CSUN Jan. 21, 201515.5 Pepperdine vs. UC Santa Barbara Feb. 19, 2013
Blocks, Four-Set Match (1970-2000)No. Team vs. Opponent Date
Not Available
Blocks, Four-Set Match (2001-Present)No. (BS / BA) Team vs. Opponent Date 26 (5 / 42) Southern California vs. Long Beach St. March 26, 200924.5 BYU vs. UC Santa Barbara March 27, 201022.5 Ball St. vs. Findlay Feb. 24, 200121.5 Ball St. vs. Loyola Chicago April 25, 200321 BYU vs. UC Irvine April 21, 200120.5 Lewis vs. Penn St. Feb. 20, 201520.5 Ball St. vs. Carthage March 3, 200720.5 Lewis vs. St. Francis (IL) Jan. 30, 201020 Ball St. vs. P.R.-Mayaguez March 4, 2004
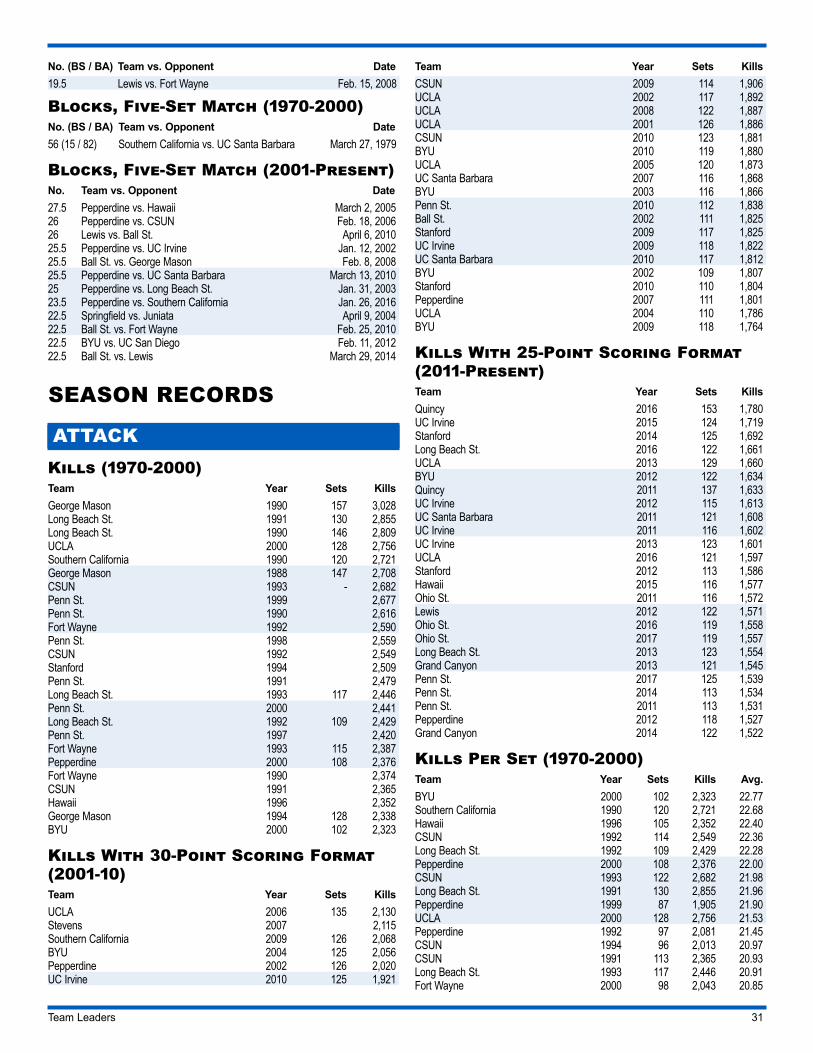
Team Leaders 31
No. (BS / BA) Team vs. Opponent Date 19.5 Lewis vs. Fort Wayne Feb. 15, 2008
Blocks, Five-Set Match (1970-2000)No. (BS / BA) Team vs. Opponent Date 56 (15 / 82) Southern California vs. UC Santa Barbara March 27, 1979
Blocks, Five-Set Match (2001-Present)No. Team vs. Opponent Date 27.5 Pepperdine vs. Hawaii March 2, 200526 Pepperdine vs. CSUN Feb. 18, 200626 Lewis vs. Ball St. April 6, 201025.5 Pepperdine vs. UC Irvine Jan. 12, 200225.5 Ball St. vs. George Mason Feb. 8, 200825.5 Pepperdine vs. UC Santa Barbara March 13, 201025 Pepperdine vs. Long Beach St. Jan. 31, 200323.5 Pepperdine vs. Southern California Jan. 26, 201622.5 Springfield vs. Juniata April 9, 200422.5 Ball St. vs. Fort Wayne Feb. 25, 201022.5 BYU vs. UC San Diego Feb. 11, 201222.5 Ball St. vs. Lewis March 29, 2014
SEASON RECORDS
ATTACKKills (1970-2000)Team Year Sets KillsGeorge Mason 1990 157 3,028Long Beach St. 1991 130 2,855Long Beach St. 1990 146 2,809UCLA 2000 128 2,756Southern California 1990 120 2,721George Mason 1988 147 2,708CSUN 1993 - 2,682Penn St. 1999 2,677Penn St. 1990 2,616Fort Wayne 1992 2,590Penn St. 1998 2,559CSUN 1992 2,549Stanford 1994 2,509Penn St. 1991 2,479Long Beach St. 1993 117 2,446Penn St. 2000 2,441Long Beach St. 1992 109 2,429Penn St. 1997 2,420Fort Wayne 1993 115 2,387Pepperdine 2000 108 2,376Fort Wayne 1990 2,374CSUN 1991 2,365Hawaii 1996 2,352George Mason 1994 128 2,338BYU 2000 102 2,323
Kills With 30-Point Scoring Format (2001-10)Team Year Sets KillsUCLA 2006 135 2,130Stevens 2007 2,115Southern California 2009 126 2,068BYU 2004 125 2,056Pepperdine 2002 126 2,020UC Irvine 2010 125 1,921
Team Year Sets KillsCSUN 2009 114 1,906UCLA 2002 117 1,892UCLA 2008 122 1,887UCLA 2001 126 1,886CSUN 2010 123 1,881BYU 2010 119 1,880UCLA 2005 120 1,873UC Santa Barbara 2007 116 1,868BYU 2003 116 1,866Penn St. 2010 112 1,838Ball St. 2002 111 1,825Stanford 2009 117 1,825UC Irvine 2009 118 1,822UC Santa Barbara 2010 117 1,812BYU 2002 109 1,807Stanford 2010 110 1,804Pepperdine 2007 111 1,801UCLA 2004 110 1,786BYU 2009 118 1,764
Kills With 25-Point Scoring Format (2011-Present)Team Year Sets KillsQuincy 2016 153 1,780UC Irvine 2015 124 1,719Stanford 2014 125 1,692Long Beach St. 2016 122 1,661UCLA 2013 129 1,660BYU 2012 122 1,634Quincy 2011 137 1,633UC Irvine 2012 115 1,613UC Santa Barbara 2011 121 1,608UC Irvine 2011 116 1,602UC Irvine 2013 123 1,601UCLA 2016 121 1,597Stanford 2012 113 1,586Hawaii 2015 116 1,577Ohio St. 2011 116 1,572Lewis 2012 122 1,571Ohio St. 2016 119 1,558Ohio St. 2017 119 1,557Long Beach St. 2013 123 1,554Grand Canyon 2013 121 1,545Penn St. 2017 125 1,539Penn St. 2014 113 1,534Penn St. 2011 113 1,531Pepperdine 2012 118 1,527Grand Canyon 2014 122 1,522
Kills Per Set (1970-2000)Team Year Sets Kills Avg.BYU 2000 102 2,323 22.77Southern California 1990 120 2,721 22.68Hawaii 1996 105 2,352 22.40CSUN 1992 114 2,549 22.36Long Beach St. 1992 109 2,429 22.28Pepperdine 2000 108 2,376 22.00CSUN 1993 122 2,682 21.98Long Beach St. 1991 130 2,855 21.96Pepperdine 1999 87 1,905 21.90UCLA 2000 128 2,756 21.53Pepperdine 1992 97 2,081 21.45CSUN 1994 96 2,013 20.97CSUN 1991 113 2,365 20.93Long Beach St. 1993 117 2,446 20.91Fort Wayne 2000 98 2,043 20.85
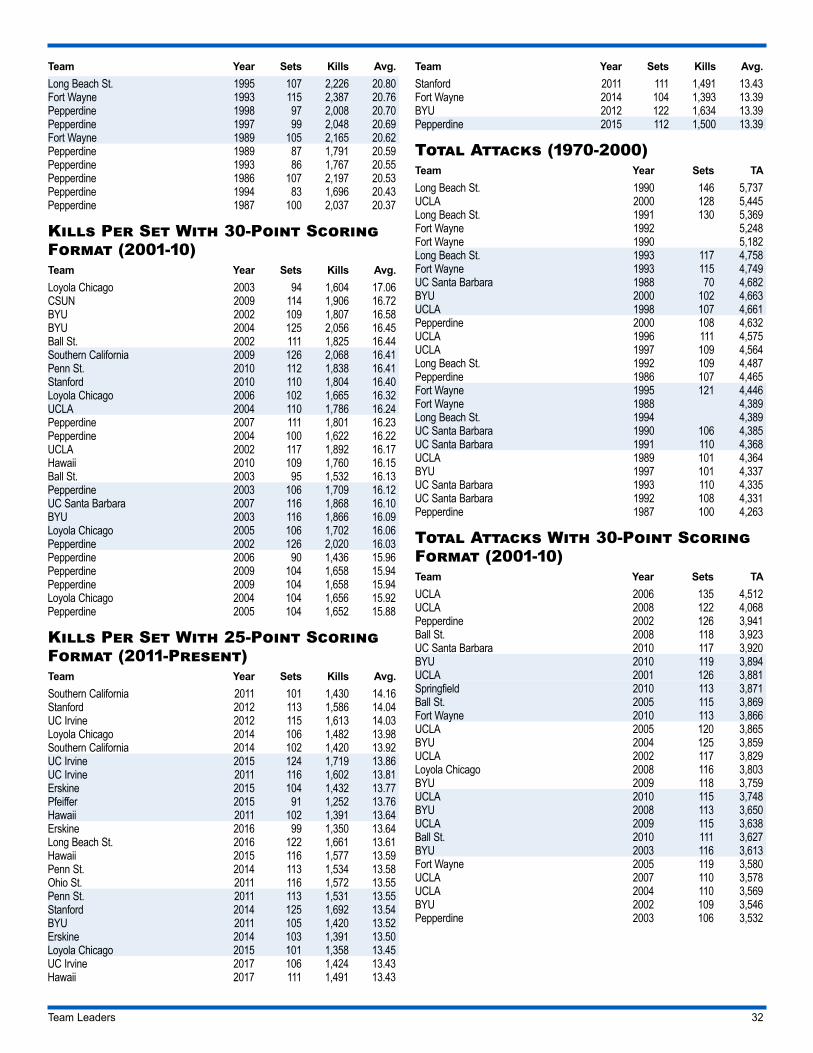
Team Leaders 32
Team Year Sets Kills Avg.Long Beach St. 1995 107 2,226 20.80Fort Wayne 1993 115 2,387 20.76Pepperdine 1998 97 2,008 20.70Pepperdine 1997 99 2,048 20.69Fort Wayne 1989 105 2,165 20.62Pepperdine 1989 87 1,791 20.59Pepperdine 1993 86 1,767 20.55Pepperdine 1986 107 2,197 20.53Pepperdine 1994 83 1,696 20.43Pepperdine 1987 100 2,037 20.37
Kills Per Set With 30-Point Scoring Format (2001-10) Team Year Sets Kills Avg.Loyola Chicago 2003 94 1,604 17.06CSUN 2009 114 1,906 16.72BYU 2002 109 1,807 16.58BYU 2004 125 2,056 16.45Ball St. 2002 111 1,825 16.44Southern California 2009 126 2,068 16.41Penn St. 2010 112 1,838 16.41Stanford 2010 110 1,804 16.40Loyola Chicago 2006 102 1,665 16.32UCLA 2004 110 1,786 16.24Pepperdine 2007 111 1,801 16.23Pepperdine 2004 100 1,622 16.22UCLA 2002 117 1,892 16.17Hawaii 2010 109 1,760 16.15Ball St. 2003 95 1,532 16.13Pepperdine 2003 106 1,709 16.12UC Santa Barbara 2007 116 1,868 16.10BYU 2003 116 1,866 16.09Loyola Chicago 2005 106 1,702 16.06Pepperdine 2002 126 2,020 16.03Pepperdine 2006 90 1,436 15.96Pepperdine 2009 104 1,658 15.94Pepperdine 2009 104 1,658 15.94Loyola Chicago 2004 104 1,656 15.92Pepperdine 2005 104 1,652 15.88
Kills Per Set With 25-Point Scoring Format (2011-Present)Team Year Sets Kills Avg.Southern California 2011 101 1,430 14.16Stanford 2012 113 1,586 14.04UC Irvine 2012 115 1,613 14.03Loyola Chicago 2014 106 1,482 13.98Southern California 2014 102 1,420 13.92UC Irvine 2015 124 1,719 13.86UC Irvine 2011 116 1,602 13.81Erskine 2015 104 1,432 13.77Pfeiffer 2015 91 1,252 13.76Hawaii 2011 102 1,391 13.64Erskine 2016 99 1,350 13.64Long Beach St. 2016 122 1,661 13.61Hawaii 2015 116 1,577 13.59Penn St. 2014 113 1,534 13.58Ohio St. 2011 116 1,572 13.55Penn St. 2011 113 1,531 13.55Stanford 2014 125 1,692 13.54BYU 2011 105 1,420 13.52Erskine 2014 103 1,391 13.50Loyola Chicago 2015 101 1,358 13.45UC Irvine 2017 106 1,424 13.43Hawaii 2017 111 1,491 13.43
Team Year Sets Kills Avg.Stanford 2011 111 1,491 13.43Fort Wayne 2014 104 1,393 13.39BYU 2012 122 1,634 13.39Pepperdine 2015 112 1,500 13.39
Total Attacks (1970-2000)Team Year Sets TALong Beach St. 1990 146 5,737UCLA 2000 128 5,445Long Beach St. 1991 130 5,369Fort Wayne 1992 5,248Fort Wayne 1990 5,182Long Beach St. 1993 117 4,758Fort Wayne 1993 115 4,749UC Santa Barbara 1988 70 4,682BYU 2000 102 4,663UCLA 1998 107 4,661Pepperdine 2000 108 4,632UCLA 1996 111 4,575UCLA 1997 109 4,564Long Beach St. 1992 109 4,487Pepperdine 1986 107 4,465Fort Wayne 1995 121 4,446Fort Wayne 1988 4,389Long Beach St. 1994 4,389UC Santa Barbara 1990 106 4,385UC Santa Barbara 1991 110 4,368UCLA 1989 101 4,364BYU 1997 101 4,337UC Santa Barbara 1993 110 4,335UC Santa Barbara 1992 108 4,331Pepperdine 1987 100 4,263
Total Attacks With 30-Point Scoring Format (2001-10)Team Year Sets TAUCLA 2006 135 4,512UCLA 2008 122 4,068Pepperdine 2002 126 3,941Ball St. 2008 118 3,923UC Santa Barbara 2010 117 3,920BYU 2010 119 3,894UCLA 2001 126 3,881Springfield 2010 113 3,871Ball St. 2005 115 3,869Fort Wayne 2010 113 3,866UCLA 2005 120 3,865BYU 2004 125 3,859UCLA 2002 117 3,829Loyola Chicago 2008 116 3,803BYU 2009 118 3,759UCLA 2010 115 3,748BYU 2008 113 3,650UCLA 2009 115 3,638Ball St. 2010 111 3,627BYU 2003 116 3,613Fort Wayne 2005 119 3,580UCLA 2007 110 3,578UCLA 2004 110 3,569BYU 2002 109 3,546Pepperdine 2003 106 3,532
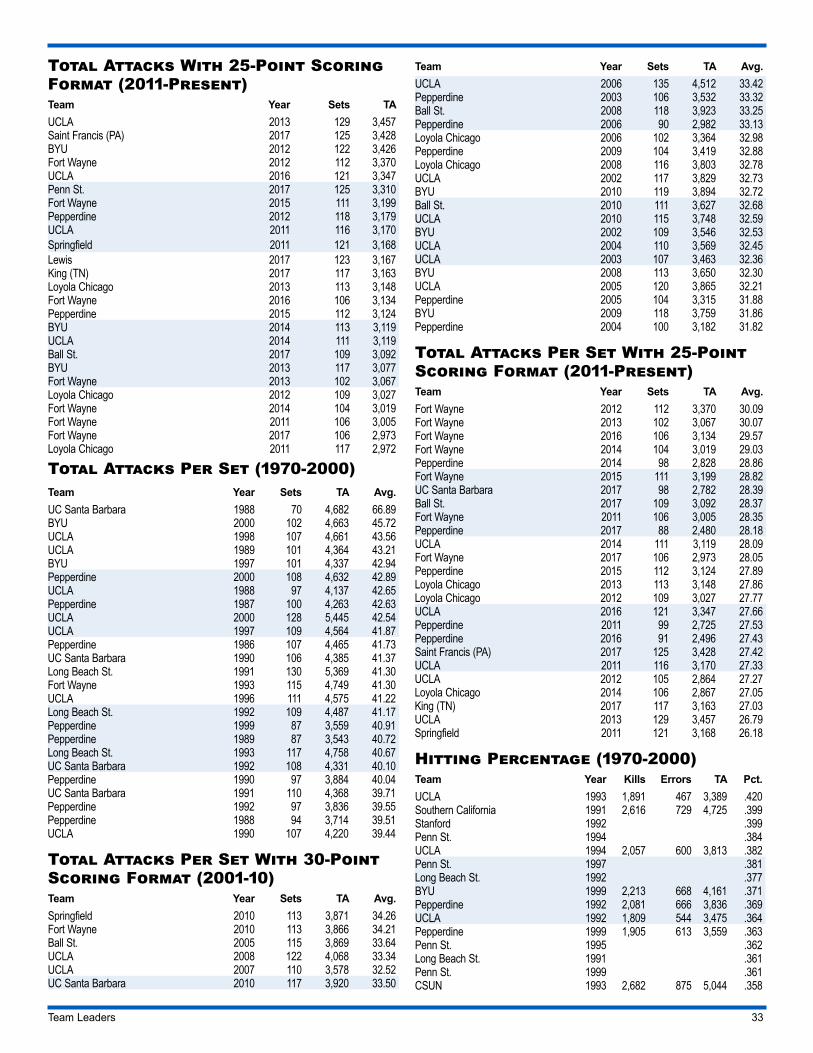
Team Leaders 33
Total Attacks With 25-Point Scoring Format (2011-Present)Team Year Sets TAUCLA 2013 129 3,457Saint Francis (PA) 2017 125 3,428BYU 2012 122 3,426Fort Wayne 2012 112 3,370UCLA 2016 121 3,347Penn St. 2017 125 3,310Fort Wayne 2015 111 3,199Pepperdine 2012 118 3,179UCLA 2011 116 3,170Springfield 2011 121 3,168Lewis 2017 123 3,167King (TN) 2017 117 3,163Loyola Chicago 2013 113 3,148Fort Wayne 2016 106 3,134Pepperdine 2015 112 3,124BYU 2014 113 3,119UCLA 2014 111 3,119Ball St. 2017 109 3,092BYU 2013 117 3,077Fort Wayne 2013 102 3,067Loyola Chicago 2012 109 3,027Fort Wayne 2014 104 3,019Fort Wayne 2011 106 3,005Fort Wayne 2017 106 2,973Loyola Chicago 2011 117 2,972
Total Attacks Per Set (1970-2000)Team Year Sets TA Avg.UC Santa Barbara 1988 70 4,682 66.89BYU 2000 102 4,663 45.72UCLA 1998 107 4,661 43.56UCLA 1989 101 4,364 43.21BYU 1997 101 4,337 42.94Pepperdine 2000 108 4,632 42.89UCLA 1988 97 4,137 42.65Pepperdine 1987 100 4,263 42.63UCLA 2000 128 5,445 42.54UCLA 1997 109 4,564 41.87Pepperdine 1986 107 4,465 41.73UC Santa Barbara 1990 106 4,385 41.37Long Beach St. 1991 130 5,369 41.30Fort Wayne 1993 115 4,749 41.30UCLA 1996 111 4,575 41.22Long Beach St. 1992 109 4,487 41.17Pepperdine 1999 87 3,559 40.91Pepperdine 1989 87 3,543 40.72Long Beach St. 1993 117 4,758 40.67UC Santa Barbara 1992 108 4,331 40.10Pepperdine 1990 97 3,884 40.04UC Santa Barbara 1991 110 4,368 39.71Pepperdine 1992 97 3,836 39.55Pepperdine 1988 94 3,714 39.51UCLA 1990 107 4,220 39.44
Total Attacks Per Set With 30-Point Scoring Format (2001-10)Team Year Sets TA Avg.Springfield 2010 113 3,871 34.26Fort Wayne 2010 113 3,866 34.21Ball St. 2005 115 3,869 33.64UCLA 2008 122 4,068 33.34UCLA 2007 110 3,578 32.52UC Santa Barbara 2010 117 3,920 33.50
Team Year Sets TA Avg.UCLA 2006 135 4,512 33.42Pepperdine 2003 106 3,532 33.32Ball St. 2008 118 3,923 33.25Pepperdine 2006 90 2,982 33.13Loyola Chicago 2006 102 3,364 32.98Pepperdine 2009 104 3,419 32.88Loyola Chicago 2008 116 3,803 32.78UCLA 2002 117 3,829 32.73BYU 2010 119 3,894 32.72Ball St. 2010 111 3,627 32.68UCLA 2010 115 3,748 32.59BYU 2002 109 3,546 32.53UCLA 2004 110 3,569 32.45UCLA 2003 107 3,463 32.36BYU 2008 113 3,650 32.30UCLA 2005 120 3,865 32.21Pepperdine 2005 104 3,315 31.88BYU 2009 118 3,759 31.86Pepperdine 2004 100 3,182 31.82
Total Attacks Per Set With 25-Point Scoring Format (2011-Present)Team Year Sets TA Avg.Fort Wayne 2012 112 3,370 30.09Fort Wayne 2013 102 3,067 30.07Fort Wayne 2016 106 3,134 29.57Fort Wayne 2014 104 3,019 29.03Pepperdine 2014 98 2,828 28.86Fort Wayne 2015 111 3,199 28.82UC Santa Barbara 2017 98 2,782 28.39Ball St. 2017 109 3,092 28.37Fort Wayne 2011 106 3,005 28.35Pepperdine 2017 88 2,480 28.18UCLA 2014 111 3,119 28.09Fort Wayne 2017 106 2,973 28.05Pepperdine 2015 112 3,124 27.89Loyola Chicago 2013 113 3,148 27.86Loyola Chicago 2012 109 3,027 27.77UCLA 2016 121 3,347 27.66Pepperdine 2011 99 2,725 27.53Pepperdine 2016 91 2,496 27.43Saint Francis (PA) 2017 125 3,428 27.42UCLA 2011 116 3,170 27.33UCLA 2012 105 2,864 27.27Loyola Chicago 2014 106 2,867 27.05King (TN) 2017 117 3,163 27.03UCLA 2013 129 3,457 26.79Springfield 2011 121 3,168 26.18
Hitting Percentage (1970-2000)Team Year Kills Errors TA Pct.UCLA 1993 1,891 467 3,389 .420Southern California 1991 2,616 729 4,725 .399Stanford 1992 .399Penn St. 1994 .384UCLA 1994 2,057 600 3,813 .382Penn St. 1997 .381Long Beach St. 1992 .377BYU 1999 2,213 668 4,161 .371Pepperdine 1992 2,081 666 3,836 .369UCLA 1992 1,809 544 3,475 .364Pepperdine 1999 1,905 613 3,559 .363Penn St. 1995 .362Long Beach St. 1991 .361Penn St. 1999 .361CSUN 1993 2,682 875 5,044 .358
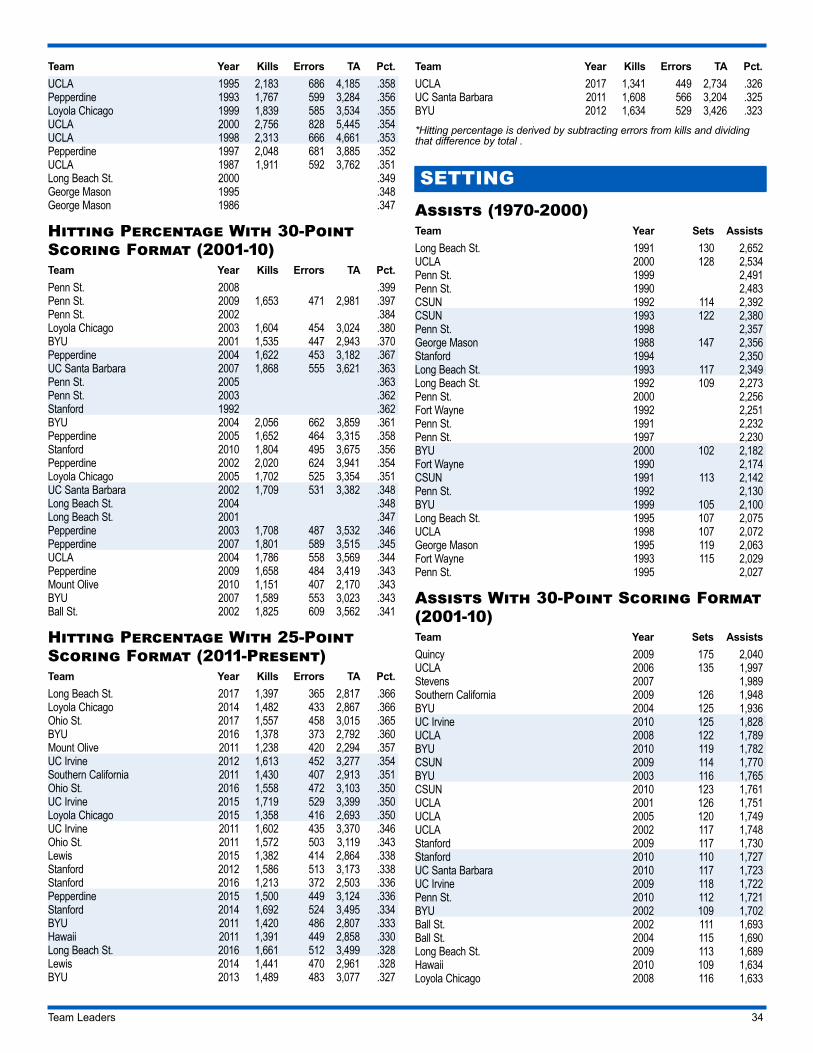
Team Leaders 34
Team Year Kills Errors TA Pct.UCLA 1995 2,183 686 4,185 .358Pepperdine 1993 1,767 599 3,284 .356Loyola Chicago 1999 1,839 585 3,534 .355UCLA 2000 2,756 828 5,445 .354UCLA 1998 2,313 666 4,661 .353Pepperdine 1997 2,048 681 3,885 .352UCLA 1987 1,911 592 3,762 .351Long Beach St. 2000 .349George Mason 1995 .348George Mason 1986 .347
Hitting Percentage With 30-Point Scoring Format (2001-10) Team Year Kills Errors TA Pct.Penn St. 2008 .399Penn St. 2009 1,653 471 2,981 .397Penn St. 2002 .384Loyola Chicago 2003 1,604 454 3,024 .380BYU 2001 1,535 447 2,943 .370Pepperdine 2004 1,622 453 3,182 .367UC Santa Barbara 2007 1,868 555 3,621 .363Penn St. 2005 .363Penn St. 2003 .362Stanford 1992 .362BYU 2004 2,056 662 3,859 .361Pepperdine 2005 1,652 464 3,315 .358Stanford 2010 1,804 495 3,675 .356Pepperdine 2002 2,020 624 3,941 .354Loyola Chicago 2005 1,702 525 3,354 .351UC Santa Barbara 2002 1,709 531 3,382 .348Long Beach St. 2004 .348Long Beach St. 2001 .347Pepperdine 2003 1,708 487 3,532 .346Pepperdine 2007 1,801 589 3,515 .345UCLA 2004 1,786 558 3,569 .344Pepperdine 2009 1,658 484 3,419 .343Mount Olive 2010 1,151 407 2,170 .343BYU 2007 1,589 553 3,023 .343Ball St. 2002 1,825 609 3,562 .341
Hitting Percentage With 25-Point Scoring Format (2011-Present)Team Year Kills Errors TA Pct.Long Beach St. 2017 1,397 365 2,817 .366Loyola Chicago 2014 1,482 433 2,867 .366Ohio St. 2017 1,557 458 3,015 .365BYU 2016 1,378 373 2,792 .360Mount Olive 2011 1,238 420 2,294 .357UC Irvine 2012 1,613 452 3,277 .354Southern California 2011 1,430 407 2,913 .351Ohio St. 2016 1,558 472 3,103 .350UC Irvine 2015 1,719 529 3,399 .350Loyola Chicago 2015 1,358 416 2,693 .350UC Irvine 2011 1,602 435 3,370 .346Ohio St. 2011 1,572 503 3,119 .343Lewis 2015 1,382 414 2,864 .338Stanford 2012 1,586 513 3,173 .338Stanford 2016 1,213 372 2,503 .336Pepperdine 2015 1,500 449 3,124 .336Stanford 2014 1,692 524 3,495 .334BYU 2011 1,420 486 2,807 .333Hawaii 2011 1,391 449 2,858 .330Long Beach St. 2016 1,661 512 3,499 .328Lewis 2014 1,441 470 2,961 .328BYU 2013 1,489 483 3,077 .327
Team Year Kills Errors TA Pct.UCLA 2017 1,341 449 2,734 .326UC Santa Barbara 2011 1,608 566 3,204 .325BYU 2012 1,634 529 3,426 .323*Hitting percentage is derived by subtracting errors from kills and dividing that difference by total .
SETTINGAssists (1970-2000)Team Year Sets AssistsLong Beach St. 1991 130 2,652UCLA 2000 128 2,534Penn St. 1999 2,491Penn St. 1990 2,483CSUN 1992 114 2,392CSUN 1993 122 2,380Penn St. 1998 2,357George Mason 1988 147 2,356Stanford 1994 2,350Long Beach St. 1993 117 2,349Long Beach St. 1992 109 2,273Penn St. 2000 2,256Fort Wayne 1992 2,251Penn St. 1991 2,232Penn St. 1997 2,230BYU 2000 102 2,182Fort Wayne 1990 2,174CSUN 1991 113 2,142Penn St. 1992 2,130BYU 1999 105 2,100Long Beach St. 1995 107 2,075UCLA 1998 107 2,072George Mason 1995 119 2,063Fort Wayne 1993 115 2,029Penn St. 1995 2,027
Assists With 30-Point Scoring Format (2001-10)Team Year Sets AssistsQuincy 2009 175 2,040UCLA 2006 135 1,997Stevens 2007 1,989Southern California 2009 126 1,948BYU 2004 125 1,936UC Irvine 2010 125 1,828UCLA 2008 122 1,789BYU 2010 119 1,782CSUN 2009 114 1,770BYU 2003 116 1,765CSUN 2010 123 1,761UCLA 2001 126 1,751UCLA 2005 120 1,749UCLA 2002 117 1,748Stanford 2009 117 1,730Stanford 2010 110 1,727UC Santa Barbara 2010 117 1,723UC Irvine 2009 118 1,722Penn St. 2010 112 1,721BYU 2002 109 1,702Ball St. 2002 111 1,693Ball St. 2004 115 1,690Long Beach St. 2009 113 1,689Hawaii 2010 109 1,634Loyola Chicago 2008 116 1,633
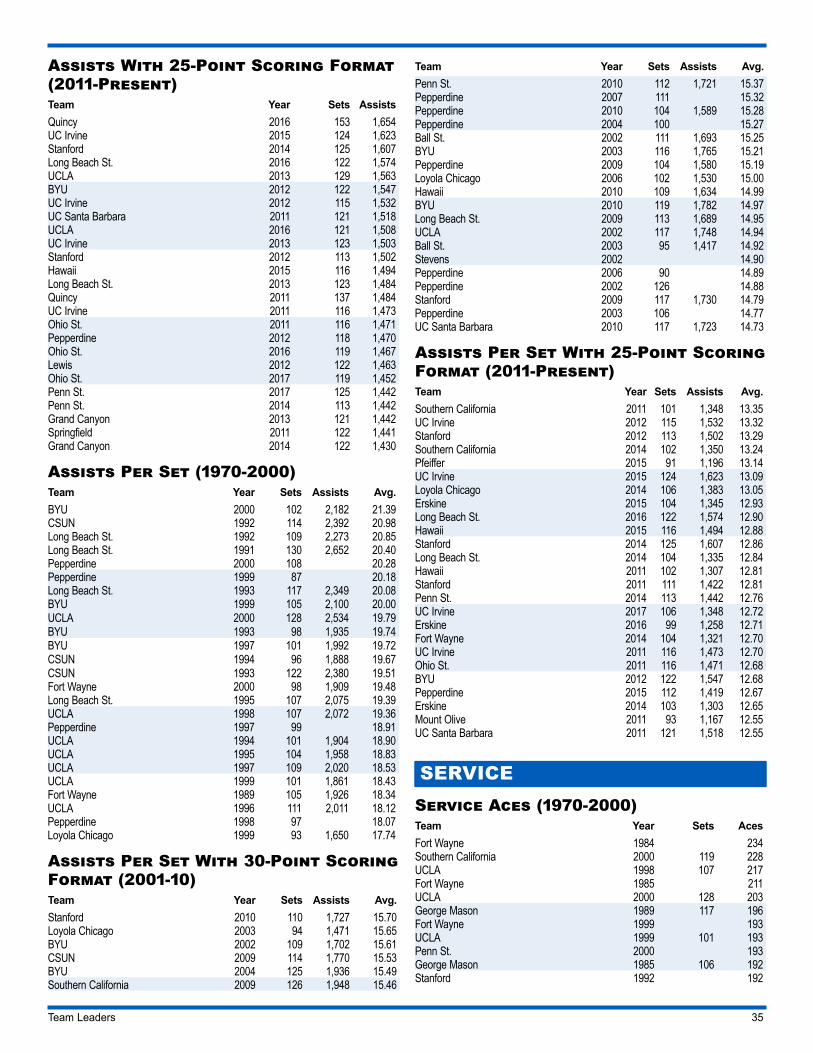
Team Leaders 35
Assists With 25-Point Scoring Format (2011-Present)Team Year Sets AssistsQuincy 2016 153 1,654UC Irvine 2015 124 1,623Stanford 2014 125 1,607Long Beach St. 2016 122 1,574UCLA 2013 129 1,563BYU 2012 122 1,547UC Irvine 2012 115 1,532UC Santa Barbara 2011 121 1,518UCLA 2016 121 1,508UC Irvine 2013 123 1,503Stanford 2012 113 1,502Hawaii 2015 116 1,494Long Beach St. 2013 123 1,484Quincy 2011 137 1,484UC Irvine 2011 116 1,473Ohio St. 2011 116 1,471Pepperdine 2012 118 1,470Ohio St. 2016 119 1,467Lewis 2012 122 1,463Ohio St. 2017 119 1,452Penn St. 2017 125 1,442Penn St. 2014 113 1,442Grand Canyon 2013 121 1,442Springfield 2011 122 1,441Grand Canyon 2014 122 1,430
Assists Per Set (1970-2000) Team Year Sets Assists Avg.BYU 2000 102 2,182 21.39CSUN 1992 114 2,392 20.98Long Beach St. 1992 109 2,273 20.85Long Beach St. 1991 130 2,652 20.40Pepperdine 2000 108 20.28Pepperdine 1999 87 20.18Long Beach St. 1993 117 2,349 20.08BYU 1999 105 2,100 20.00UCLA 2000 128 2,534 19.79BYU 1993 98 1,935 19.74BYU 1997 101 1,992 19.72CSUN 1994 96 1,888 19.67CSUN 1993 122 2,380 19.51Fort Wayne 2000 98 1,909 19.48Long Beach St. 1995 107 2,075 19.39UCLA 1998 107 2,072 19.36Pepperdine 1997 99 18.91UCLA 1994 101 1,904 18.90UCLA 1995 104 1,958 18.83UCLA 1997 109 2,020 18.53UCLA 1999 101 1,861 18.43Fort Wayne 1989 105 1,926 18.34UCLA 1996 111 2,011 18.12Pepperdine 1998 97 18.07Loyola Chicago 1999 93 1,650 17.74
Assists Per Set With 30-Point Scoring Format (2001-10)Team Year Sets Assists Avg.Stanford 2010 110 1,727 15.70Loyola Chicago 2003 94 1,471 15.65BYU 2002 109 1,702 15.61CSUN 2009 114 1,770 15.53BYU 2004 125 1,936 15.49Southern California 2009 126 1,948 15.46
Team Year Sets Assists Avg.Penn St. 2010 112 1,721 15.37Pepperdine 2007 111 15.32Pepperdine 2010 104 1,589 15.28Pepperdine 2004 100 15.27Ball St. 2002 111 1,693 15.25BYU 2003 116 1,765 15.21Pepperdine 2009 104 1,580 15.19Loyola Chicago 2006 102 1,530 15.00Hawaii 2010 109 1,634 14.99BYU 2010 119 1,782 14.97Long Beach St. 2009 113 1,689 14.95UCLA 2002 117 1,748 14.94Ball St. 2003 95 1,417 14.92Stevens 2002 14.90Pepperdine 2006 90 14.89Pepperdine 2002 126 14.88Stanford 2009 117 1,730 14.79Pepperdine 2003 106 14.77UC Santa Barbara 2010 117 1,723 14.73
Assists Per Set With 25-Point Scoring Format (2011-Present)Team Year Sets Assists Avg.Southern California 2011 101 1,348 13.35UC Irvine 2012 115 1,532 13.32Stanford 2012 113 1,502 13.29Southern California 2014 102 1,350 13.24Pfeiffer 2015 91 1,196 13.14UC Irvine 2015 124 1,623 13.09Loyola Chicago 2014 106 1,383 13.05Erskine 2015 104 1,345 12.93Long Beach St. 2016 122 1,574 12.90Hawaii 2015 116 1,494 12.88Stanford 2014 125 1,607 12.86Long Beach St. 2014 104 1,335 12.84Hawaii 2011 102 1,307 12.81Stanford 2011 111 1,422 12.81Penn St. 2014 113 1,442 12.76UC Irvine 2017 106 1,348 12.72Erskine 2016 99 1,258 12.71Fort Wayne 2014 104 1,321 12.70UC Irvine 2011 116 1,473 12.70Ohio St. 2011 116 1,471 12.68BYU 2012 122 1,547 12.68Pepperdine 2015 112 1,419 12.67Erskine 2014 103 1,303 12.65Mount Olive 2011 93 1,167 12.55UC Santa Barbara 2011 121 1,518 12.55
SERVICEService Aces (1970-2000)Team Year Sets AcesFort Wayne 1984 234Southern California 2000 119 228UCLA 1998 107 217Fort Wayne 1985 211UCLA 2000 128 203George Mason 1989 117 196Fort Wayne 1999 193UCLA 1999 101 193Penn St. 2000 193George Mason 1985 106 192Stanford 1992 192
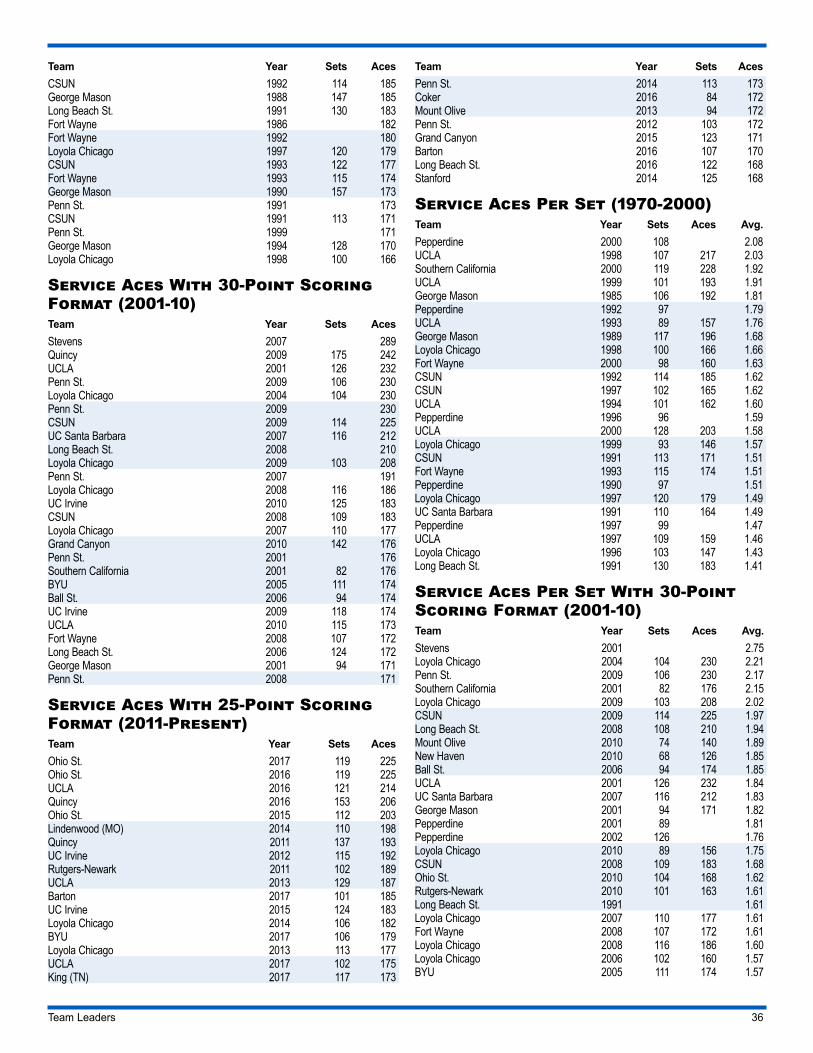
Team Leaders 36
Team Year Sets AcesCSUN 1992 114 185George Mason 1988 147 185Long Beach St. 1991 130 183Fort Wayne 1986 182Fort Wayne 1992 180Loyola Chicago 1997 120 179CSUN 1993 122 177Fort Wayne 1993 115 174George Mason 1990 157 173Penn St. 1991 173CSUN 1991 113 171Penn St. 1999 171George Mason 1994 128 170Loyola Chicago 1998 100 166
Service Aces With 30-Point Scoring Format (2001-10)Team Year Sets AcesStevens 2007 289Quincy 2009 175 242UCLA 2001 126 232Penn St. 2009 106 230Loyola Chicago 2004 104 230Penn St. 2009 230CSUN 2009 114 225UC Santa Barbara 2007 116 212Long Beach St. 2008 210Loyola Chicago 2009 103 208Penn St. 2007 191Loyola Chicago 2008 116 186UC Irvine 2010 125 183CSUN 2008 109 183Loyola Chicago 2007 110 177Grand Canyon 2010 142 176Penn St. 2001 176Southern California 2001 82 176BYU 2005 111 174Ball St. 2006 94 174UC Irvine 2009 118 174UCLA 2010 115 173Fort Wayne 2008 107 172Long Beach St. 2006 124 172George Mason 2001 94 171Penn St. 2008 171
Service Aces With 25-Point Scoring Format (2011-Present)Team Year Sets AcesOhio St. 2017 119 225Ohio St. 2016 119 225UCLA 2016 121 214Quincy 2016 153 206Ohio St. 2015 112 203Lindenwood (MO) 2014 110 198Quincy 2011 137 193UC Irvine 2012 115 192Rutgers-Newark 2011 102 189UCLA 2013 129 187Barton 2017 101 185UC Irvine 2015 124 183Loyola Chicago 2014 106 182BYU 2017 106 179Loyola Chicago 2013 113 177UCLA 2017 102 175King (TN) 2017 117 173
Team Year Sets AcesPenn St. 2014 113 173Coker 2016 84 172Mount Olive 2013 94 172Penn St. 2012 103 172Grand Canyon 2015 123 171Barton 2016 107 170Long Beach St. 2016 122 168Stanford 2014 125 168
Service Aces Per Set (1970-2000) Team Year Sets Aces Avg.Pepperdine 2000 108 2.08UCLA 1998 107 217 2.03Southern California 2000 119 228 1.92UCLA 1999 101 193 1.91George Mason 1985 106 192 1.81Pepperdine 1992 97 1.79UCLA 1993 89 157 1.76George Mason 1989 117 196 1.68Loyola Chicago 1998 100 166 1.66Fort Wayne 2000 98 160 1.63CSUN 1992 114 185 1.62CSUN 1997 102 165 1.62UCLA 1994 101 162 1.60Pepperdine 1996 96 1.59UCLA 2000 128 203 1.58Loyola Chicago 1999 93 146 1.57CSUN 1991 113 171 1.51Fort Wayne 1993 115 174 1.51Pepperdine 1990 97 1.51Loyola Chicago 1997 120 179 1.49UC Santa Barbara 1991 110 164 1.49Pepperdine 1997 99 1.47UCLA 1997 109 159 1.46Loyola Chicago 1996 103 147 1.43Long Beach St. 1991 130 183 1.41
Service Aces Per Set With 30-Point Scoring Format (2001-10)Team Year Sets Aces Avg.Stevens 2001 2.75Loyola Chicago 2004 104 230 2.21Penn St. 2009 106 230 2.17Southern California 2001 82 176 2.15Loyola Chicago 2009 103 208 2.02CSUN 2009 114 225 1.97Long Beach St. 2008 108 210 1.94Mount Olive 2010 74 140 1.89New Haven 2010 68 126 1.85Ball St. 2006 94 174 1.85UCLA 2001 126 232 1.84UC Santa Barbara 2007 116 212 1.83George Mason 2001 94 171 1.82Pepperdine 2001 89 1.81Pepperdine 2002 126 1.76Loyola Chicago 2010 89 156 1.75CSUN 2008 109 183 1.68Ohio St. 2010 104 168 1.62Rutgers-Newark 2010 101 163 1.61Long Beach St. 1991 1.61Loyola Chicago 2007 110 177 1.61Fort Wayne 2008 107 172 1.61Loyola Chicago 2008 116 186 1.60Loyola Chicago 2006 102 160 1.57BYU 2005 111 174 1.57
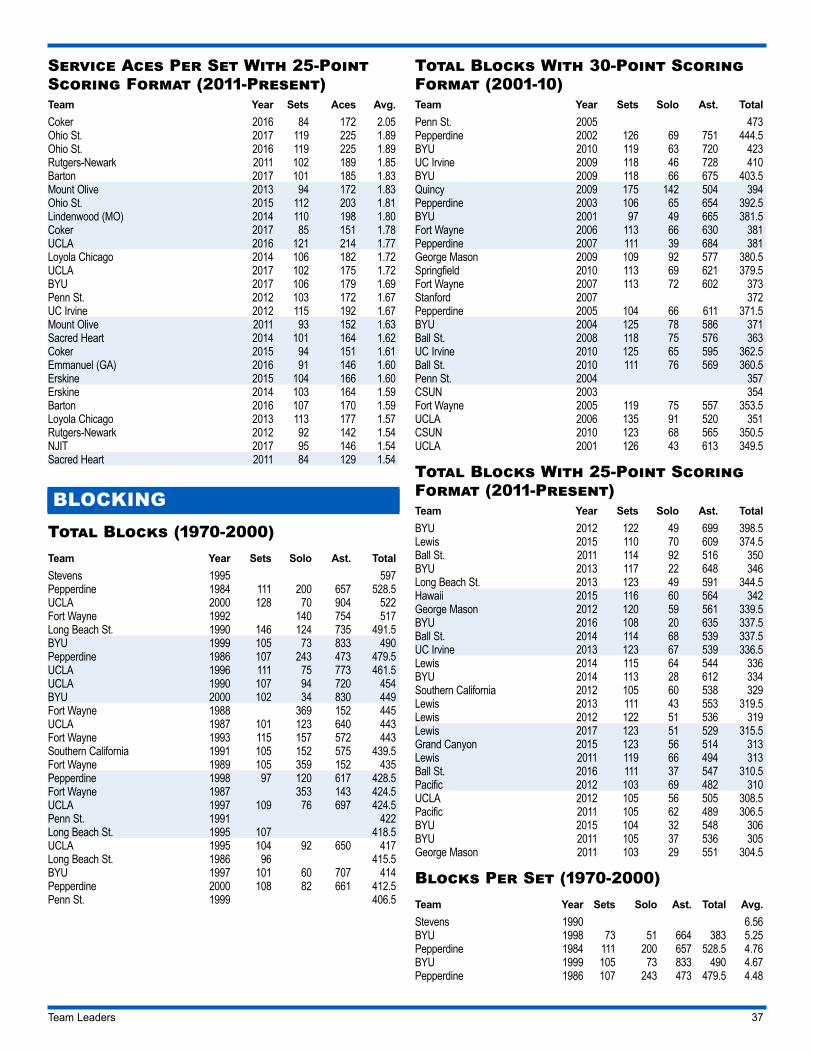
Team Leaders 37
Service Aces Per Set With 25-Point Scoring Format (2011-Present)Team Year Sets Aces Avg.Coker 2016 84 172 2.05Ohio St. 2017 119 225 1.89Ohio St. 2016 119 225 1.89Rutgers-Newark 2011 102 189 1.85Barton 2017 101 185 1.83Mount Olive 2013 94 172 1.83Ohio St. 2015 112 203 1.81Lindenwood (MO) 2014 110 198 1.80Coker 2017 85 151 1.78UCLA 2016 121 214 1.77Loyola Chicago 2014 106 182 1.72UCLA 2017 102 175 1.72BYU 2017 106 179 1.69Penn St. 2012 103 172 1.67UC Irvine 2012 115 192 1.67Mount Olive 2011 93 152 1.63Sacred Heart 2014 101 164 1.62Coker 2015 94 151 1.61Emmanuel (GA) 2016 91 146 1.60Erskine 2015 104 166 1.60Erskine 2014 103 164 1.59Barton 2016 107 170 1.59Loyola Chicago 2013 113 177 1.57Rutgers-Newark 2012 92 142 1.54NJIT 2017 95 146 1.54Sacred Heart 2011 84 129 1.54
BLOCKINGTotal Blocks (1970-2000)Team Year Sets Solo Ast. TotalStevens 1995 597Pepperdine 1984 111 200 657 528.5UCLA 2000 128 70 904 522Fort Wayne 1992 140 754 517Long Beach St. 1990 146 124 735 491.5BYU 1999 105 73 833 490Pepperdine 1986 107 243 473 479.5UCLA 1996 111 75 773 461.5UCLA 1990 107 94 720 454BYU 2000 102 34 830 449Fort Wayne 1988 369 152 445UCLA 1987 101 123 640 443Fort Wayne 1993 115 157 572 443Southern California 1991 105 152 575 439.5Fort Wayne 1989 105 359 152 435Pepperdine 1998 97 120 617 428.5Fort Wayne 1987 353 143 424.5UCLA 1997 109 76 697 424.5Penn St. 1991 422Long Beach St. 1995 107 418.5UCLA 1995 104 92 650 417Long Beach St. 1986 96 415.5BYU 1997 101 60 707 414Pepperdine 2000 108 82 661 412.5Penn St. 1999 406.5
Total Blocks With 30-Point Scoring Format (2001-10)Team Year Sets Solo Ast. TotalPenn St. 2005 473Pepperdine 2002 126 69 751 444.5BYU 2010 119 63 720 423UC Irvine 2009 118 46 728 410BYU 2009 118 66 675 403.5Quincy 2009 175 142 504 394Pepperdine 2003 106 65 654 392.5BYU 2001 97 49 665 381.5Fort Wayne 2006 113 66 630 381Pepperdine 2007 111 39 684 381George Mason 2009 109 92 577 380.5Springfield 2010 113 69 621 379.5Fort Wayne 2007 113 72 602 373Stanford 2007 372Pepperdine 2005 104 66 611 371.5BYU 2004 125 78 586 371Ball St. 2008 118 75 576 363UC Irvine 2010 125 65 595 362.5Ball St. 2010 111 76 569 360.5Penn St. 2004 357CSUN 2003 354Fort Wayne 2005 119 75 557 353.5UCLA 2006 135 91 520 351CSUN 2010 123 68 565 350.5UCLA 2001 126 43 613 349.5
Total Blocks With 25-Point Scoring Format (2011-Present)Team Year Sets Solo Ast. TotalBYU 2012 122 49 699 398.5Lewis 2015 110 70 609 374.5Ball St. 2011 114 92 516 350BYU 2013 117 22 648 346Long Beach St. 2013 123 49 591 344.5Hawaii 2015 116 60 564 342George Mason 2012 120 59 561 339.5BYU 2016 108 20 635 337.5Ball St. 2014 114 68 539 337.5UC Irvine 2013 123 67 539 336.5Lewis 2014 115 64 544 336BYU 2014 113 28 612 334Southern California 2012 105 60 538 329Lewis 2013 111 43 553 319.5Lewis 2012 122 51 536 319Lewis 2017 123 51 529 315.5Grand Canyon 2015 123 56 514 313Lewis 2011 119 66 494 313Ball St. 2016 111 37 547 310.5Pacific 2012 103 69 482 310UCLA 2012 105 56 505 308.5Pacific 2011 105 62 489 306.5BYU 2015 104 32 548 306BYU 2011 105 37 536 305George Mason 2011 103 29 551 304.5
Blocks Per Set (1970-2000)Team Year Sets Solo Ast. Total Avg.Stevens 1990 6.56BYU 1998 73 51 664 383 5.25Pepperdine 1984 111 200 657 528.5 4.76BYU 1999 105 73 833 490 4.67Pepperdine 1986 107 243 473 479.5 4.48
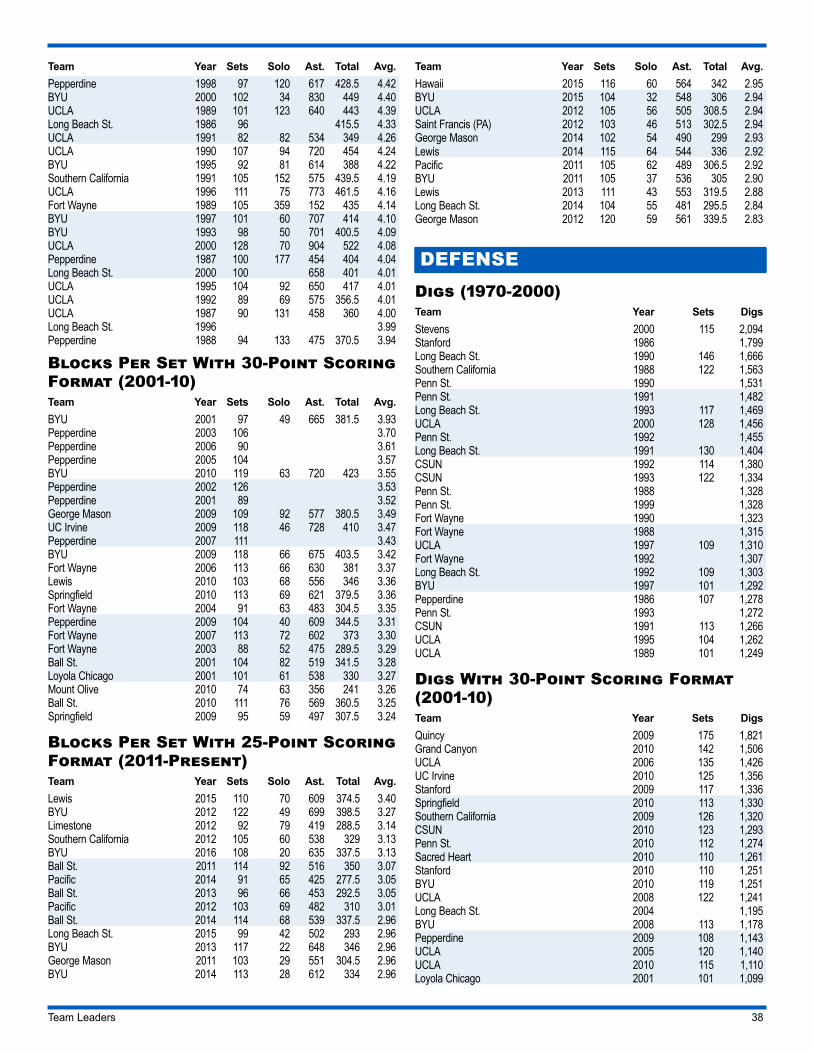
Team Leaders 38
Team Year Sets Solo Ast. Total Avg.Pepperdine 1998 97 120 617 428.5 4.42BYU 2000 102 34 830 449 4.40UCLA 1989 101 123 640 443 4.39Long Beach St. 1986 96 415.5 4.33UCLA 1991 82 82 534 349 4.26UCLA 1990 107 94 720 454 4.24BYU 1995 92 81 614 388 4.22Southern California 1991 105 152 575 439.5 4.19UCLA 1996 111 75 773 461.5 4.16Fort Wayne 1989 105 359 152 435 4.14BYU 1997 101 60 707 414 4.10BYU 1993 98 50 701 400.5 4.09UCLA 2000 128 70 904 522 4.08Pepperdine 1987 100 177 454 404 4.04Long Beach St. 2000 100 658 401 4.01UCLA 1995 104 92 650 417 4.01UCLA 1992 89 69 575 356.5 4.01UCLA 1987 90 131 458 360 4.00Long Beach St. 1996 3.99Pepperdine 1988 94 133 475 370.5 3.94
Blocks Per Set With 30-Point Scoring Format (2001-10)Team Year Sets Solo Ast. Total Avg.BYU 2001 97 49 665 381.5 3.93Pepperdine 2003 106 3.70Pepperdine 2006 90 3.61Pepperdine 2005 104 3.57BYU 2010 119 63 720 423 3.55Pepperdine 2002 126 3.53Pepperdine 2001 89 3.52George Mason 2009 109 92 577 380.5 3.49UC Irvine 2009 118 46 728 410 3.47Pepperdine 2007 111 3.43BYU 2009 118 66 675 403.5 3.42Fort Wayne 2006 113 66 630 381 3.37Lewis 2010 103 68 556 346 3.36Springfield 2010 113 69 621 379.5 3.36Fort Wayne 2004 91 63 483 304.5 3.35Pepperdine 2009 104 40 609 344.5 3.31Fort Wayne 2007 113 72 602 373 3.30Fort Wayne 2003 88 52 475 289.5 3.29Ball St. 2001 104 82 519 341.5 3.28Loyola Chicago 2001 101 61 538 330 3.27Mount Olive 2010 74 63 356 241 3.26Ball St. 2010 111 76 569 360.5 3.25Springfield 2009 95 59 497 307.5 3.24
Blocks Per Set With 25-Point Scoring Format (2011-Present)Team Year Sets Solo Ast. Total Avg.Lewis 2015 110 70 609 374.5 3.40BYU 2012 122 49 699 398.5 3.27Limestone 2012 92 79 419 288.5 3.14Southern California 2012 105 60 538 329 3.13BYU 2016 108 20 635 337.5 3.13Ball St. 2011 114 92 516 350 3.07Pacific 2014 91 65 425 277.5 3.05Ball St. 2013 96 66 453 292.5 3.05Pacific 2012 103 69 482 310 3.01Ball St. 2014 114 68 539 337.5 2.96Long Beach St. 2015 99 42 502 293 2.96BYU 2013 117 22 648 346 2.96George Mason 2011 103 29 551 304.5 2.96BYU 2014 113 28 612 334 2.96
Team Year Sets Solo Ast. Total Avg.Hawaii 2015 116 60 564 342 2.95BYU 2015 104 32 548 306 2.94UCLA 2012 105 56 505 308.5 2.94Saint Francis (PA) 2012 103 46 513 302.5 2.94George Mason 2014 102 54 490 299 2.93Lewis 2014 115 64 544 336 2.92Pacific 2011 105 62 489 306.5 2.92BYU 2011 105 37 536 305 2.90Lewis 2013 111 43 553 319.5 2.88Long Beach St. 2014 104 55 481 295.5 2.84George Mason 2012 120 59 561 339.5 2.83
DEFENSEDigs (1970-2000)Team Year Sets DigsStevens 2000 115 2,094Stanford 1986 1,799Long Beach St. 1990 146 1,666Southern California 1988 122 1,563Penn St. 1990 1,531Penn St. 1991 1,482Long Beach St. 1993 117 1,469UCLA 2000 128 1,456Penn St. 1992 1,455Long Beach St. 1991 130 1,404CSUN 1992 114 1,380CSUN 1993 122 1,334Penn St. 1988 1,328Penn St. 1999 1,328Fort Wayne 1990 1,323Fort Wayne 1988 1,315UCLA 1997 109 1,310Fort Wayne 1992 1,307Long Beach St. 1992 109 1,303BYU 1997 101 1,292Pepperdine 1986 107 1,278Penn St. 1993 1,272CSUN 1991 113 1,266UCLA 1995 104 1,262UCLA 1989 101 1,249
Digs With 30-Point Scoring Format (2001-10)Team Year Sets DigsQuincy 2009 175 1,821Grand Canyon 2010 142 1,506UCLA 2006 135 1,426UC Irvine 2010 125 1,356Stanford 2009 117 1,336Springfield 2010 113 1,330Southern California 2009 126 1,320CSUN 2010 123 1,293Penn St. 2010 112 1,274Sacred Heart 2010 110 1,261Stanford 2010 110 1,251BYU 2010 119 1,251UCLA 2008 122 1,241Long Beach St. 2004 1,195BYU 2008 113 1,178Pepperdine 2009 108 1,143UCLA 2005 120 1,140UCLA 2010 115 1,110Loyola Chicago 2001 101 1,099
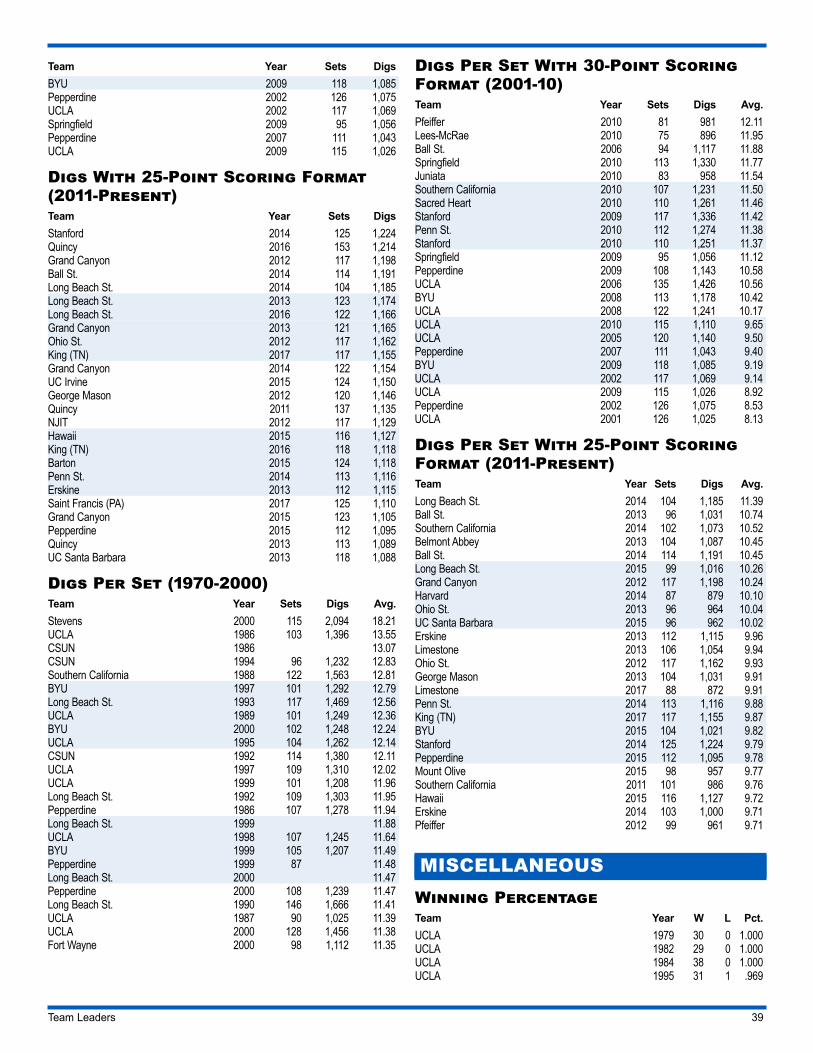
Team Leaders 39
Team Year Sets DigsBYU 2009 118 1,085Pepperdine 2002 126 1,075UCLA 2002 117 1,069Springfield 2009 95 1,056Pepperdine 2007 111 1,043UCLA 2009 115 1,026
Digs With 25-Point Scoring Format (2011-Present)Team Year Sets DigsStanford 2014 125 1,224Quincy 2016 153 1,214Grand Canyon 2012 117 1,198Ball St. 2014 114 1,191Long Beach St. 2014 104 1,185Long Beach St. 2013 123 1,174Long Beach St. 2016 122 1,166Grand Canyon 2013 121 1,165Ohio St. 2012 117 1,162King (TN) 2017 117 1,155Grand Canyon 2014 122 1,154UC Irvine 2015 124 1,150George Mason 2012 120 1,146Quincy 2011 137 1,135NJIT 2012 117 1,129Hawaii 2015 116 1,127King (TN) 2016 118 1,118Barton 2015 124 1,118Penn St. 2014 113 1,116Erskine 2013 112 1,115Saint Francis (PA) 2017 125 1,110Grand Canyon 2015 123 1,105Pepperdine 2015 112 1,095Quincy 2013 113 1,089UC Santa Barbara 2013 118 1,088
Digs Per Set (1970-2000) Team Year Sets Digs Avg.Stevens 2000 115 2,094 18.21UCLA 1986 103 1,396 13.55CSUN 1986 13.07CSUN 1994 96 1,232 12.83Southern California 1988 122 1,563 12.81BYU 1997 101 1,292 12.79Long Beach St. 1993 117 1,469 12.56UCLA 1989 101 1,249 12.36BYU 2000 102 1,248 12.24UCLA 1995 104 1,262 12.14CSUN 1992 114 1,380 12.11UCLA 1997 109 1,310 12.02UCLA 1999 101 1,208 11.96Long Beach St. 1992 109 1,303 11.95Pepperdine 1986 107 1,278 11.94Long Beach St. 1999 11.88UCLA 1998 107 1,245 11.64BYU 1999 105 1,207 11.49Pepperdine 1999 87 11.48Long Beach St. 2000 11.47Pepperdine 2000 108 1,239 11.47Long Beach St. 1990 146 1,666 11.41UCLA 1987 90 1,025 11.39UCLA 2000 128 1,456 11.38Fort Wayne 2000 98 1,112 11.35
Digs Per Set With 30-Point Scoring Format (2001-10) Team Year Sets Digs Avg.Pfeiffer 2010 81 981 12.11Lees-McRae 2010 75 896 11.95Ball St. 2006 94 1,117 11.88Springfield 2010 113 1,330 11.77Juniata 2010 83 958 11.54Southern California 2010 107 1,231 11.50Sacred Heart 2010 110 1,261 11.46Stanford 2009 117 1,336 11.42Penn St. 2010 112 1,274 11.38Stanford 2010 110 1,251 11.37Springfield 2009 95 1,056 11.12Pepperdine 2009 108 1,143 10.58UCLA 2006 135 1,426 10.56BYU 2008 113 1,178 10.42UCLA 2008 122 1,241 10.17UCLA 2010 115 1,110 9.65UCLA 2005 120 1,140 9.50Pepperdine 2007 111 1,043 9.40BYU 2009 118 1,085 9.19UCLA 2002 117 1,069 9.14UCLA 2009 115 1,026 8.92Pepperdine 2002 126 1,075 8.53UCLA 2001 126 1,025 8.13
Digs Per Set With 25-Point Scoring Format (2011-Present)Team Year Sets Digs Avg.Long Beach St. 2014 104 1,185 11.39Ball St. 2013 96 1,031 10.74Southern California 2014 102 1,073 10.52Belmont Abbey 2013 104 1,087 10.45Ball St. 2014 114 1,191 10.45Long Beach St. 2015 99 1,016 10.26Grand Canyon 2012 117 1,198 10.24Harvard 2014 87 879 10.10Ohio St. 2013 96 964 10.04UC Santa Barbara 2015 96 962 10.02Erskine 2013 112 1,115 9.96Limestone 2013 106 1,054 9.94Ohio St. 2012 117 1,162 9.93George Mason 2013 104 1,031 9.91Limestone 2017 88 872 9.91Penn St. 2014 113 1,116 9.88King (TN) 2017 117 1,155 9.87BYU 2015 104 1,021 9.82Stanford 2014 125 1,224 9.79Pepperdine 2015 112 1,095 9.78Mount Olive 2015 98 957 9.77Southern California 2011 101 986 9.76Hawaii 2015 116 1,127 9.72Erskine 2014 103 1,000 9.71Pfeiffer 2012 99 961 9.71
MISCELLANEOUSWinning PercentageTeam Year W L Pct.UCLA 1979 30 0 1.000UCLA 1982 29 0 1.000UCLA 1984 38 0 1.000UCLA 1995 31 1 .969
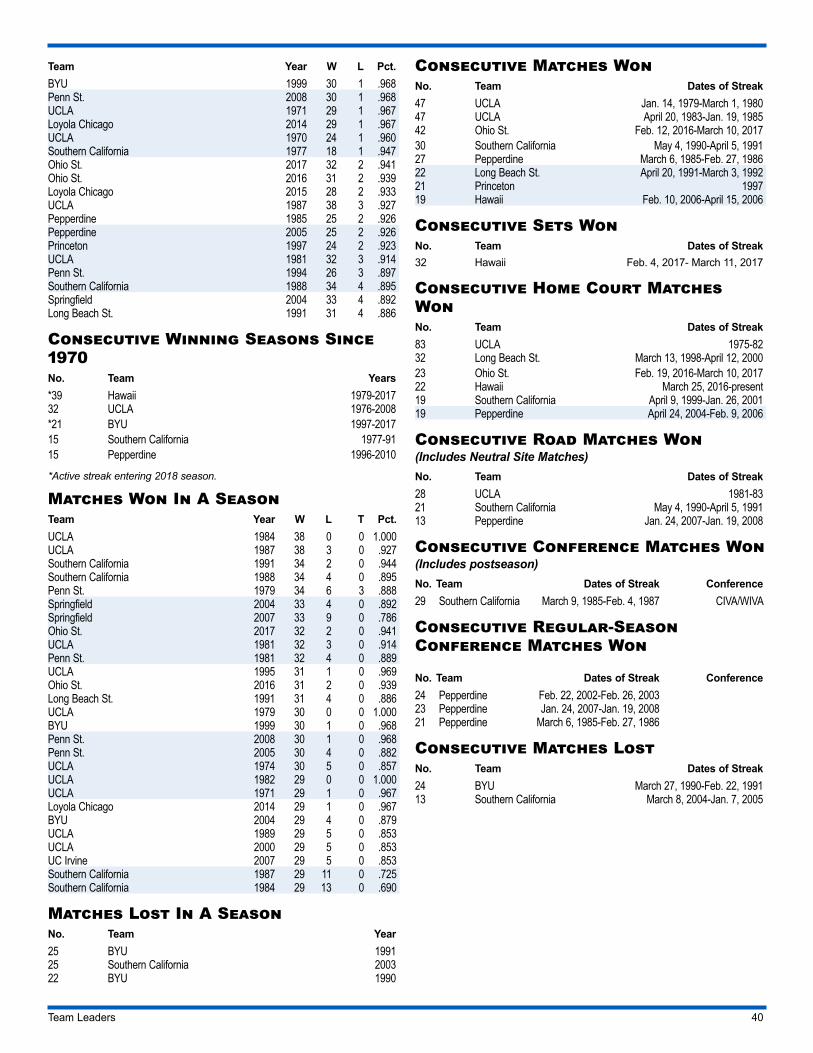
Team Leaders 40
Team Year W L Pct.BYU 1999 30 1 .968Penn St. 2008 30 1 .968UCLA 1971 29 1 .967Loyola Chicago 2014 29 1 .967UCLA 1970 24 1 .960Southern California 1977 18 1 .947Ohio St. 2017 32 2 .941Ohio St. 2016 31 2 .939Loyola Chicago 2015 28 2 .933UCLA 1987 38 3 .927Pepperdine 1985 25 2 .926Pepperdine 2005 25 2 .926Princeton 1997 24 2 .923UCLA 1981 32 3 .914Penn St. 1994 26 3 .897Southern California 1988 34 4 .895Springfield 2004 33 4 .892Long Beach St. 1991 31 4 .886
Consecutive Winning Seasons Since 1970No. Team Years*39 Hawaii 1979-201732 UCLA 1976-2008*21 BYU 1997-201715 Southern California 1977-9115 Pepperdine 1996-2010
*Active streak entering 2018 season.
Matches Won In A SeasonTeam Year W L T Pct.UCLA 1984 38 0 0 1.000UCLA 1987 38 3 0 .927Southern California 1991 34 2 0 .944Southern California 1988 34 4 0 .895Penn St. 1979 34 6 3 .888Springfield 2004 33 4 0 .892Springfield 2007 33 9 0 .786Ohio St. 2017 32 2 0 .941UCLA 1981 32 3 0 .914Penn St. 1981 32 4 0 .889UCLA 1995 31 1 0 .969Ohio St. 2016 31 2 0 .939Long Beach St. 1991 31 4 0 .886UCLA 1979 30 0 0 1.000BYU 1999 30 1 0 .968Penn St. 2008 30 1 0 .968Penn St. 2005 30 4 0 .882UCLA 1974 30 5 0 .857UCLA 1982 29 0 0 1.000UCLA 1971 29 1 0 .967Loyola Chicago 2014 29 1 0 .967BYU 2004 29 4 0 .879UCLA 1989 29 5 0 .853UCLA 2000 29 5 0 .853UC Irvine 2007 29 5 0 .853Southern California 1987 29 11 0 .725Southern California 1984 29 13 0 .690
Matches Lost In A SeasonNo. Team Year25 BYU 199125 Southern California 200322 BYU 1990
Consecutive Matches WonNo. Team Dates of Streak47 UCLA Jan. 14, 1979-March 1, 198047 UCLA April 20, 1983-Jan. 19, 198542 Ohio St. Feb. 12, 2016-March 10, 201730 Southern California May 4, 1990-April 5, 199127 Pepperdine March 6, 1985-Feb. 27, 198622 Long Beach St. April 20, 1991-March 3, 199221 Princeton 199719 Hawaii Feb. 10, 2006-April 15, 2006
Consecutive Sets WonNo. Team Dates of Streak32 Hawaii Feb. 4, 2017- March 11, 2017
Consecutive Home Court Matches WonNo. Team Dates of Streak83 UCLA 1975-8232 Long Beach St. March 13, 1998-April 12, 200023 Ohio St. Feb. 19, 2016-March 10, 201722 Hawaii March 25, 2016-present19 Southern California April 9, 1999-Jan. 26, 200119 Pepperdine April 24, 2004-Feb. 9, 2006
Consecutive Road Matches Won(Includes Neutral Site Matches)No. Team Dates of Streak28 UCLA 1981-8321 Southern California May 4, 1990-April 5, 199113 Pepperdine Jan. 24, 2007-Jan. 19, 2008
Consecutive Conference Matches Won(Includes postseason)No. Team Dates of Streak Conference29 Southern California March 9, 1985-Feb. 4, 1987 CIVA/WIVA
Consecutive Regular-Season Conference Matches Won No. Team Dates of Streak Conference24 Pepperdine Feb. 22, 2002-Feb. 26, 200323 Pepperdine Jan. 24, 2007-Jan. 19, 200821 Pepperdine March 6, 1985-Feb. 27, 1986
Consecutive Matches LostNo. Team Dates of Streak24 BYU March 27, 1990-Feb. 22, 199113 Southern California March 8, 2004-Jan. 7, 2005
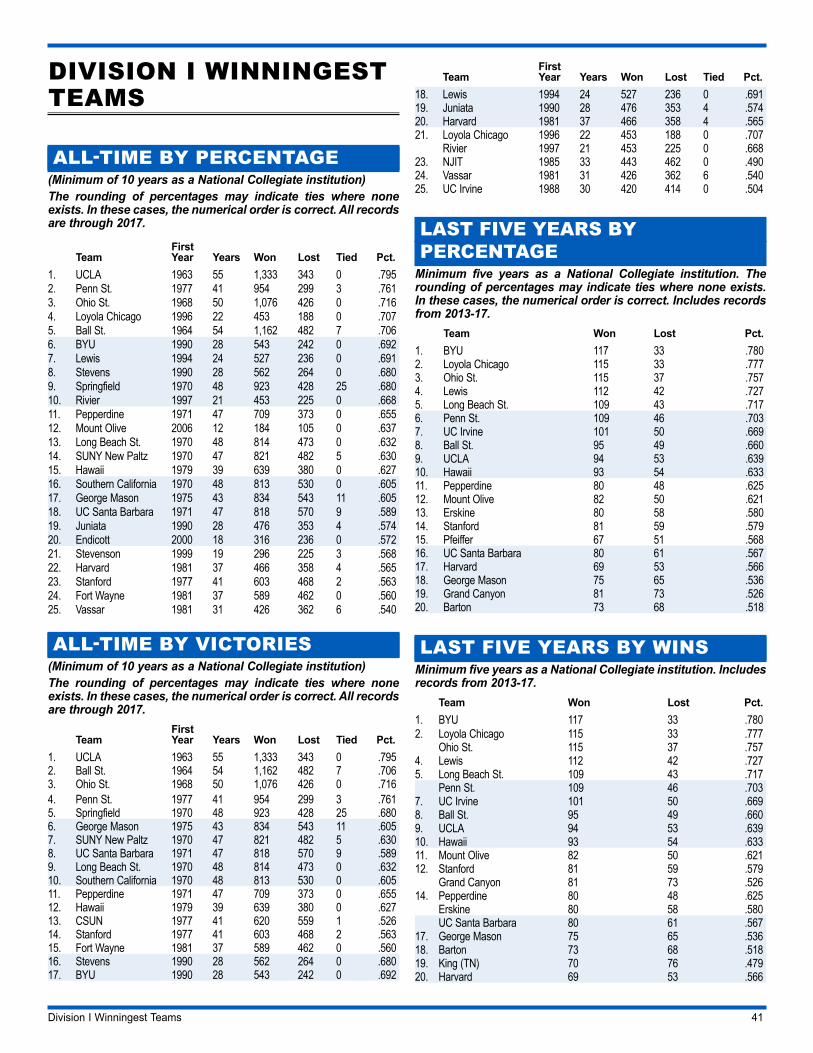
Division I Winningest Teams 41
DIVISION I WINNINGEST TEAMS
ALL-TIME BY PERCENTAGE(Minimum of 10 years as a National Collegiate institution)The rounding of percentages may indicate ties where none exists. In these cases, the numerical order is correct. All records are through 2017.
TeamFirst Year Years Won Lost Tied Pct.
1. UCLA 1963 55 1,333 343 0 .7952. Penn St. 1977 41 954 299 3 .7613. Ohio St. 1968 50 1,076 426 0 .7164. Loyola Chicago 1996 22 453 188 0 .7075. Ball St. 1964 54 1,162 482 7 .7066. BYU 1990 28 543 242 0 .6927. Lewis 1994 24 527 236 0 .6918. Stevens 1990 28 562 264 0 .6809. Springfield 1970 48 923 428 25 .68010. Rivier 1997 21 453 225 0 .66811. Pepperdine 1971 47 709 373 0 .65512. Mount Olive 2006 12 184 105 0 .63713. Long Beach St. 1970 48 814 473 0 .63214. SUNY New Paltz 1970 47 821 482 5 .63015. Hawaii 1979 39 639 380 0 .62716. Southern California 1970 48 813 530 0 .60517. George Mason 1975 43 834 543 11 .60518. UC Santa Barbara 1971 47 818 570 9 .58919. Juniata 1990 28 476 353 4 .57420. Endicott 2000 18 316 236 0 .57221. Stevenson 1999 19 296 225 3 .56822. Harvard 1981 37 466 358 4 .56523. Stanford 1977 41 603 468 2 .56324. Fort Wayne 1981 37 589 462 0 .56025. Vassar 1981 31 426 362 6 .540
ALL-TIME BY VICTORIES(Minimum of 10 years as a National Collegiate institution)The rounding of percentages may indicate ties where none exists. In these cases, the numerical order is correct. All records are through 2017.
TeamFirst Year Years Won Lost Tied Pct.
1. UCLA 1963 55 1,333 343 0 .7952. Ball St. 1964 54 1,162 482 7 .7063. Ohio St. 1968 50 1,076 426 0 .7164. Penn St. 1977 41 954 299 3 .7615. Springfield 1970 48 923 428 25 .6806. George Mason 1975 43 834 543 11 .6057. SUNY New Paltz 1970 47 821 482 5 .6308. UC Santa Barbara 1971 47 818 570 9 .5899. Long Beach St. 1970 48 814 473 0 .63210. Southern California 1970 48 813 530 0 .60511. Pepperdine 1971 47 709 373 0 .65512. Hawaii 1979 39 639 380 0 .62713. CSUN 1977 41 620 559 1 .52614. Stanford 1977 41 603 468 2 .56315. Fort Wayne 1981 37 589 462 0 .56016. Stevens 1990 28 562 264 0 .68017. BYU 1990 28 543 242 0 .692
TeamFirst Year Years Won Lost Tied Pct.
18. Lewis 1994 24 527 236 0 .69119. Juniata 1990 28 476 353 4 .57420. Harvard 1981 37 466 358 4 .56521. Loyola Chicago 1996 22 453 188 0 .707
Rivier 1997 21 453 225 0 .66823. NJIT 1985 33 443 462 0 .49024. Vassar 1981 31 426 362 6 .54025. UC Irvine 1988 30 420 414 0 .504
LAST FIVE YEARS BY PERCENTAGE
Minimum five years as a National Collegiate institution. The rounding of percentages may indicate ties where none exists. In these cases, the numerical order is correct. Includes records from 2013-17.
Team Won Lost Pct.1. BYU 117 33 .7802. Loyola Chicago 115 33 .7773. Ohio St. 115 37 .7574. Lewis 112 42 .7275. Long Beach St. 109 43 .7176. Penn St. 109 46 .7037. UC Irvine 101 50 .6698. Ball St. 95 49 .6609. UCLA 94 53 .63910. Hawaii 93 54 .63311. Pepperdine 80 48 .62512. Mount Olive 82 50 .62113. Erskine 80 58 .58014. Stanford 81 59 .57915. Pfeiffer 67 51 .56816. UC Santa Barbara 80 61 .56717. Harvard 69 53 .56618. George Mason 75 65 .53619. Grand Canyon 81 73 .52620. Barton 73 68 .518
LAST FIVE YEARS BY WINSMinimum five years as a National Collegiate institution. Includes records from 2013-17.
Team Won Lost Pct.1. BYU 117 33 .7802. Loyola Chicago 115 33 .777
Ohio St. 115 37 .7574. Lewis 112 42 .7275. Long Beach St. 109 43 .717
Penn St. 109 46 .7037. UC Irvine 101 50 .6698. Ball St. 95 49 .6609. UCLA 94 53 .63910. Hawaii 93 54 .63311. Mount Olive 82 50 .62112. Stanford 81 59 .579
Grand Canyon 81 73 .52614. Pepperdine 80 48 .625
Erskine 80 58 .580UC Santa Barbara 80 61 .567
17. George Mason 75 65 .53618. Barton 73 68 .51819. King (TN) 70 76 .47920. Harvard 69 53 .566
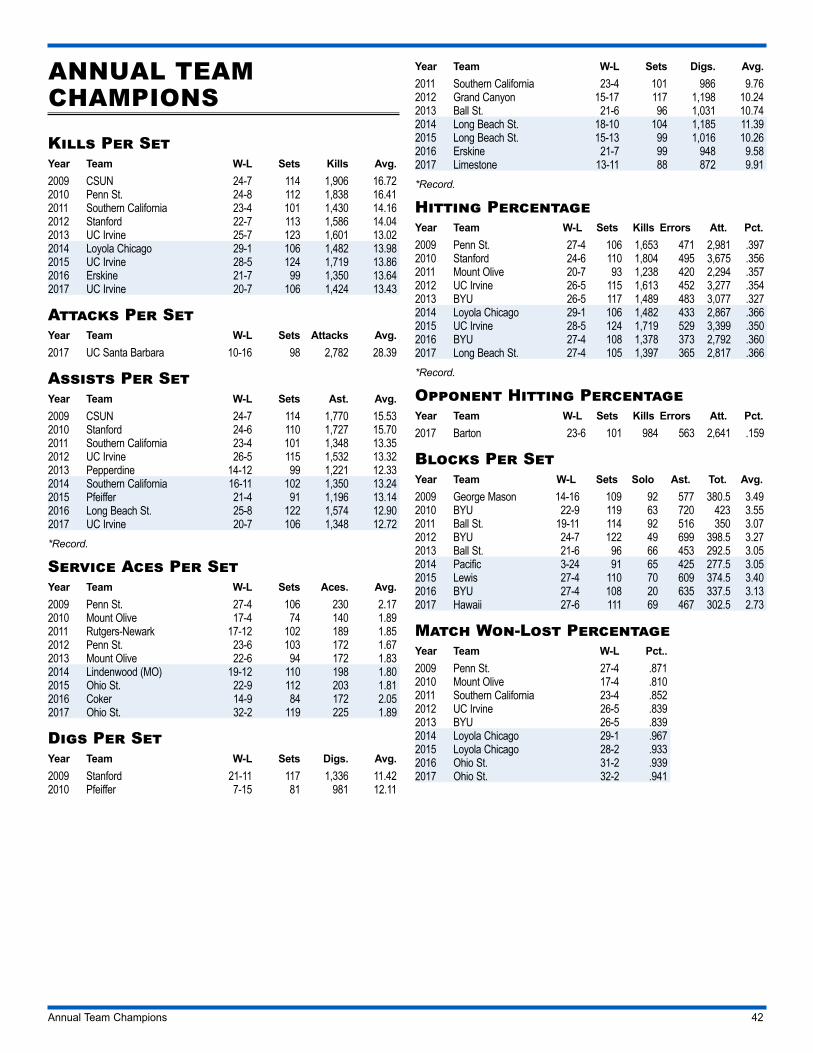
Annual Team Champions 42
ANNUAL TEAM CHAMPIONS
Kills Per SetYear Team W-L Sets Kills Avg.2009 CSUN 24-7 114 1,906 16.722010 Penn St. 24-8 112 1,838 16.412011 Southern California 23-4 101 1,430 14.162012 Stanford 22-7 113 1,586 14.042013 UC Irvine 25-7 123 1,601 13.022014 Loyola Chicago 29-1 106 1,482 13.982015 UC Irvine 28-5 124 1,719 13.862016 Erskine 21-7 99 1,350 13.642017 UC Irvine 20-7 106 1,424 13.43
Attacks Per SetYear Team W-L Sets Attacks Avg.2017 UC Santa Barbara 10-16 98 2,782 28.39
Assists Per SetYear Team W-L Sets Ast. Avg.2009 CSUN 24-7 114 1,770 15.532010 Stanford 24-6 110 1,727 15.702011 Southern California 23-4 101 1,348 13.352012 UC Irvine 26-5 115 1,532 13.322013 Pepperdine 14-12 99 1,221 12.332014 Southern California 16-11 102 1,350 13.242015 Pfeiffer 21-4 91 1,196 13.142016 Long Beach St. 25-8 122 1,574 12.902017 UC Irvine 20-7 106 1,348 12.72*Record.
Service Aces Per SetYear Team W-L Sets Aces. Avg.2009 Penn St. 27-4 106 230 2.172010 Mount Olive 17-4 74 140 1.892011 Rutgers-Newark 17-12 102 189 1.852012 Penn St. 23-6 103 172 1.672013 Mount Olive 22-6 94 172 1.832014 Lindenwood (MO) 19-12 110 198 1.802015 Ohio St. 22-9 112 203 1.812016 Coker 14-9 84 172 2.052017 Ohio St. 32-2 119 225 1.89
Digs Per SetYear Team W-L Sets Digs. Avg.2009 Stanford 21-11 117 1,336 11.422010 Pfeiffer 7-15 81 981 12.11
Year Team W-L Sets Digs. Avg.2011 Southern California 23-4 101 986 9.762012 Grand Canyon 15-17 117 1,198 10.242013 Ball St. 21-6 96 1,031 10.742014 Long Beach St. 18-10 104 1,185 11.392015 Long Beach St. 15-13 99 1,016 10.262016 Erskine 21-7 99 948 9.582017 Limestone 13-11 88 872 9.91*Record.
Hitting PercentageYear Team W-L Sets Kills Errors Att. Pct.2009 Penn St. 27-4 106 1,653 471 2,981 .3972010 Stanford 24-6 110 1,804 495 3,675 .3562011 Mount Olive 20-7 93 1,238 420 2,294 .3572012 UC Irvine 26-5 115 1,613 452 3,277 .3542013 BYU 26-5 117 1,489 483 3,077 .3272014 Loyola Chicago 29-1 106 1,482 433 2,867 .3662015 UC Irvine 28-5 124 1,719 529 3,399 .3502016 BYU 27-4 108 1,378 373 2,792 .3602017 Long Beach St. 27-4 105 1,397 365 2,817 .366*Record.
Opponent Hitting PercentageYear Team W-L Sets Kills Errors Att. Pct.2017 Barton 23-6 101 984 563 2,641 .159
Blocks Per SetYear Team W-L Sets Solo Ast. Tot. Avg.2009 George Mason 14-16 109 92 577 380.5 3.492010 BYU 22-9 119 63 720 423 3.552011 Ball St. 19-11 114 92 516 350 3.072012 BYU 24-7 122 49 699 398.5 3.272013 Ball St. 21-6 96 66 453 292.5 3.052014 Pacific 3-24 91 65 425 277.5 3.052015 Lewis 27-4 110 70 609 374.5 3.402016 BYU 27-4 108 20 635 337.5 3.132017 Hawaii 27-6 111 69 467 302.5 2.73
Match Won-Lost PercentageYear Team W-L Pct..2009 Penn St. 27-4 .8712010 Mount Olive 17-4 .8102011 Southern California 23-4 .8522012 UC Irvine 26-5 .8392013 BYU 26-5 .8392014 Loyola Chicago 29-1 .9672015 Loyola Chicago 28-2 .9332016 Ohio St. 31-2 .9392017 Ohio St. 32-2 .941
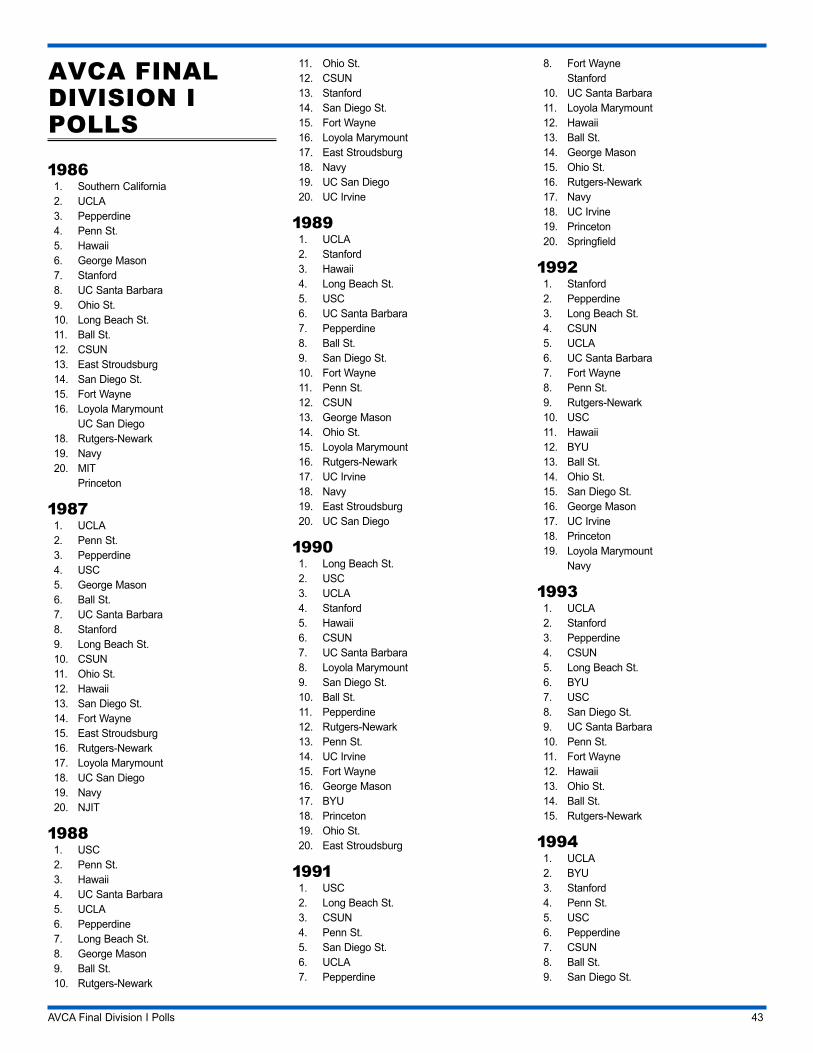
AVCA Final Division I Polls 43
AVCA FINAL DIVISION I POLLS
19861. Southern California2. UCLA3. Pepperdine4. Penn St.5. Hawaii6. George Mason7. Stanford8. UC Santa Barbara9. Ohio St.10. Long Beach St.11. Ball St.12. CSUN13. East Stroudsburg14. San Diego St.15. Fort Wayne16. Loyola Marymount UC San Diego18. Rutgers-Newark19. Navy20. MIT Princeton
19871. UCLA2. Penn St.3. Pepperdine4. USC5. George Mason6. Ball St.7. UC Santa Barbara8. Stanford9. Long Beach St.10. CSUN11. Ohio St. 12. Hawaii13. San Diego St.14. Fort Wayne15. East Stroudsburg16. Rutgers-Newark17. Loyola Marymount18. UC San Diego19. Navy20. NJIT
19881. USC2. Penn St.3. Hawaii4. UC Santa Barbara5. UCLA6. Pepperdine7. Long Beach St.8. George Mason9. Ball St.10. Rutgers-Newark
11. Ohio St.12. CSUN13. Stanford14. San Diego St.15. Fort Wayne16. Loyola Marymount17. East Stroudsburg18. Navy19. UC San Diego20. UC Irvine
19891. UCLA2. Stanford3. Hawaii4. Long Beach St.5. USC6. UC Santa Barbara7. Pepperdine8. Ball St.9. San Diego St.10. Fort Wayne11. Penn St.12. CSUN13. George Mason14. Ohio St.15. Loyola Marymount16. Rutgers-Newark17. UC Irvine18. Navy19. East Stroudsburg20. UC San Diego
19901. Long Beach St.2. USC3. UCLA4. Stanford5. Hawaii6. CSUN7. UC Santa Barbara8. Loyola Marymount9. San Diego St.10. Ball St.11. Pepperdine12. Rutgers-Newark13. Penn St.14. UC Irvine15. Fort Wayne16. George Mason17. BYU18. Princeton19. Ohio St.20. East Stroudsburg
19911. USC2. Long Beach St.3. CSUN4. Penn St.5. San Diego St.6. UCLA7. Pepperdine
8. Fort Wayne Stanford10. UC Santa Barbara11. Loyola Marymount12. Hawaii13. Ball St.14. George Mason15. Ohio St.16. Rutgers-Newark17. Navy18. UC Irvine19. Princeton20. Springfield
19921. Stanford2. Pepperdine3. Long Beach St.4. CSUN5. UCLA6. UC Santa Barbara7. Fort Wayne8. Penn St.9. Rutgers-Newark10. USC11. Hawaii12. BYU13. Ball St.14. Ohio St.15. San Diego St.16. George Mason17. UC Irvine18. Princeton19. Loyola Marymount Navy
19931. UCLA2. Stanford3. Pepperdine4. CSUN5. Long Beach St.6. BYU7. USC8. San Diego St.9. UC Santa Barbara10. Penn St.11. Fort Wayne12. Hawaii13. Ohio St.14. Ball St.15. Rutgers-Newark
19941. UCLA2. BYU3. Stanford4. Penn St.5. USC6. Pepperdine7. CSUN8. Ball St.9. San Diego St.
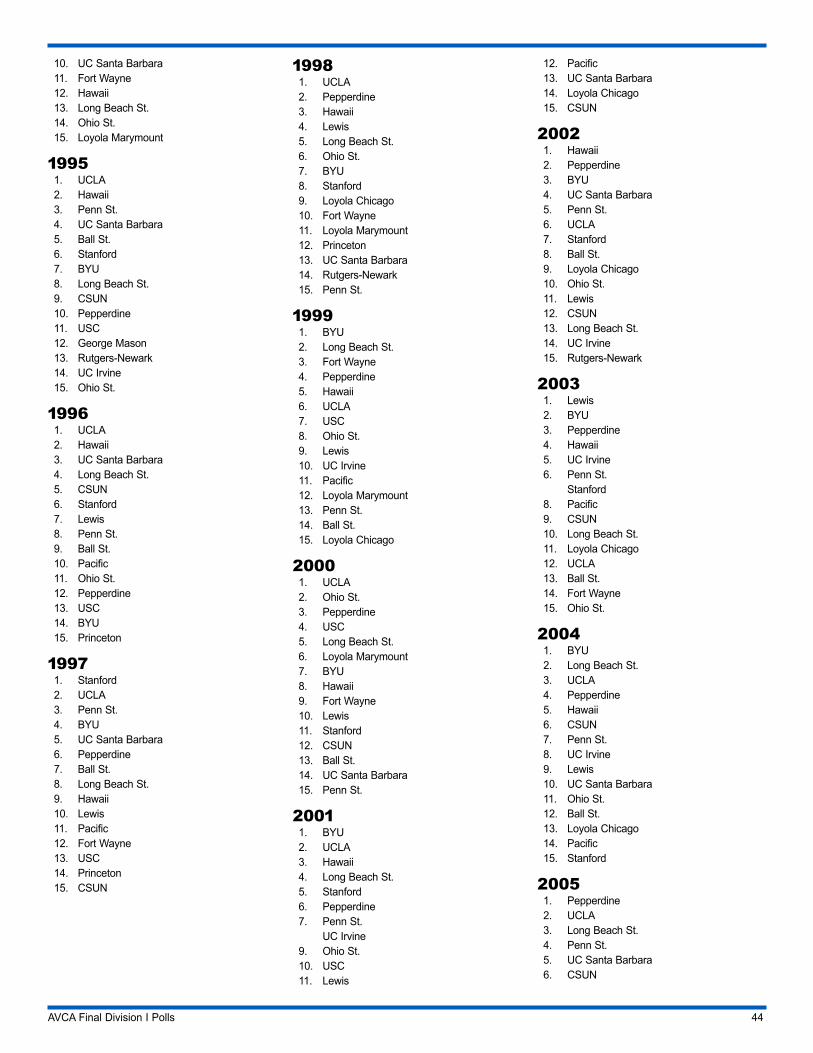
AVCA Final Division I Polls 44
10. UC Santa Barbara11. Fort Wayne12. Hawaii13. Long Beach St.14. Ohio St.15. Loyola Marymount
19951. UCLA2. Hawaii3. Penn St.4. UC Santa Barbara5. Ball St.6. Stanford7. BYU8. Long Beach St.9. CSUN10. Pepperdine11. USC12. George Mason13. Rutgers-Newark14. UC Irvine15. Ohio St.
19961. UCLA2. Hawaii3. UC Santa Barbara4. Long Beach St.5. CSUN6. Stanford7. Lewis8. Penn St.9. Ball St.10. Pacific11. Ohio St.12. Pepperdine13. USC14. BYU15. Princeton
19971. Stanford2. UCLA3. Penn St.4. BYU5. UC Santa Barbara6. Pepperdine7. Ball St.8. Long Beach St.9. Hawaii10. Lewis11. Pacific12. Fort Wayne13. USC14. Princeton15. CSUN
19981. UCLA2. Pepperdine3. Hawaii4. Lewis5. Long Beach St.6. Ohio St.7. BYU8. Stanford9. Loyola Chicago10. Fort Wayne11. Loyola Marymount12. Princeton13. UC Santa Barbara14. Rutgers-Newark15. Penn St.
19991. BYU2. Long Beach St.3. Fort Wayne4. Pepperdine5. Hawaii6. UCLA7. USC8. Ohio St.9. Lewis10. UC Irvine11. Pacific12. Loyola Marymount13. Penn St.14. Ball St.15. Loyola Chicago
20001. UCLA2. Ohio St.3. Pepperdine4. USC5. Long Beach St.6. Loyola Marymount7. BYU8. Hawaii9. Fort Wayne10. Lewis11. Stanford12. CSUN13. Ball St.14. UC Santa Barbara15. Penn St.
20011. BYU2. UCLA3. Hawaii 4. Long Beach St.5. Stanford6. Pepperdine7. Penn St. UC Irvine9. Ohio St.10. USC11. Lewis
12. Pacific13. UC Santa Barbara14. Loyola Chicago15. CSUN
20021. Hawaii2. Pepperdine3. BYU4. UC Santa Barbara5. Penn St.6. UCLA7. Stanford8. Ball St.9. Loyola Chicago10. Ohio St.11. Lewis12. CSUN13. Long Beach St.14. UC Irvine15. Rutgers-Newark
20031. Lewis2. BYU3. Pepperdine4. Hawaii5. UC Irvine6. Penn St. Stanford8. Pacific9. CSUN10. Long Beach St.11. Loyola Chicago12. UCLA13. Ball St.14. Fort Wayne15. Ohio St.
20041. BYU2. Long Beach St.3. UCLA4. Pepperdine5. Hawaii6. CSUN7. Penn St.8. UC Irvine9. Lewis10. UC Santa Barbara11. Ohio St.12. Ball St.13. Loyola Chicago14. Pacific15. Stanford
20051. Pepperdine2. UCLA3. Long Beach St.4. Penn St.5. UC Santa Barbara6. CSUN
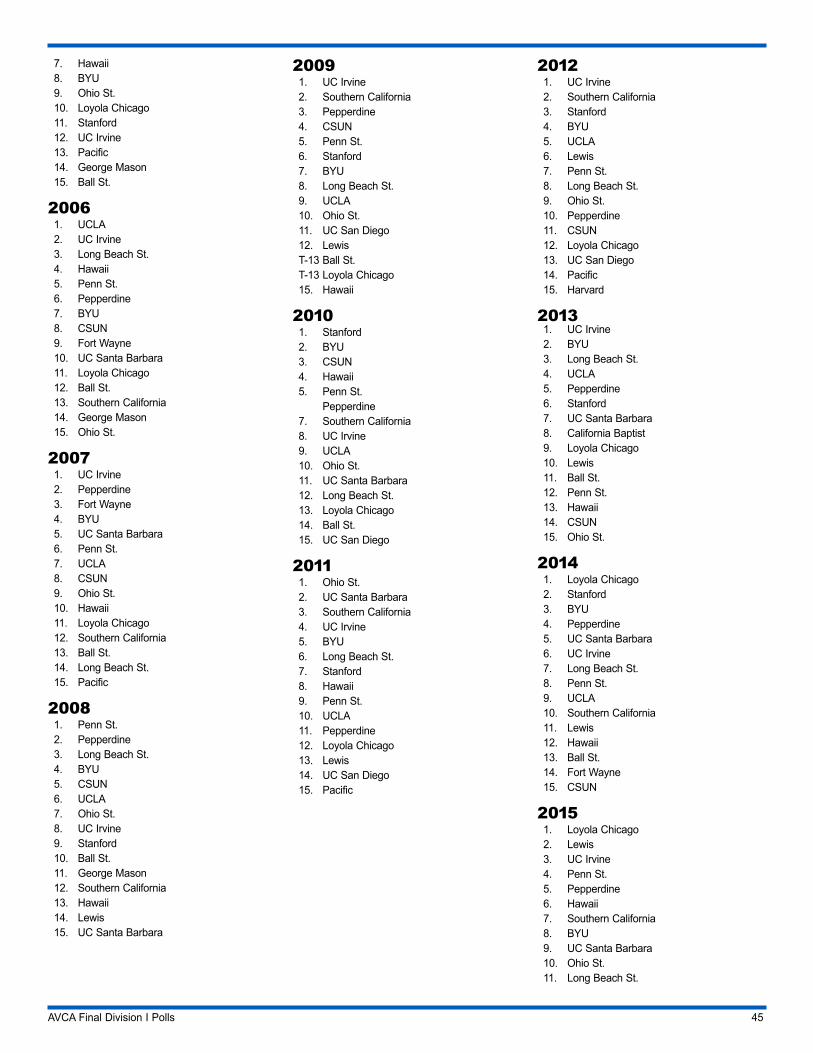
AVCA Final Division I Polls 45
7. Hawaii8. BYU9. Ohio St.10. Loyola Chicago11. Stanford12. UC Irvine13. Pacific14. George Mason15. Ball St.
20061. UCLA2. UC Irvine3. Long Beach St.4. Hawaii5. Penn St.6. Pepperdine7. BYU8. CSUN9. Fort Wayne10. UC Santa Barbara11. Loyola Chicago12. Ball St.13. Southern California14. George Mason15. Ohio St.
20071. UC Irvine2. Pepperdine3. Fort Wayne4. BYU5. UC Santa Barbara6. Penn St.7. UCLA8. CSUN9. Ohio St.10. Hawaii11. Loyola Chicago12. Southern California13. Ball St.14. Long Beach St.15. Pacific
20081. Penn St.2. Pepperdine3. Long Beach St.4. BYU5. CSUN6. UCLA 7. Ohio St.8. UC Irvine9. Stanford10. Ball St.11. George Mason12. Southern California13. Hawaii14. Lewis15. UC Santa Barbara
20091. UC Irvine2. Southern California3. Pepperdine4. CSUN5. Penn St.6. Stanford7. BYU8. Long Beach St.9. UCLA10. Ohio St.11. UC San Diego12. LewisT-13 Ball St.T-13 Loyola Chicago15. Hawaii
20101. Stanford2. BYU3. CSUN4. Hawaii5. Penn St. Pepperdine7. Southern California8. UC Irvine9. UCLA10. Ohio St.11. UC Santa Barbara12. Long Beach St.13. Loyola Chicago14. Ball St.15. UC San Diego
20111. Ohio St.2. UC Santa Barbara3. Southern California4. UC Irvine5. BYU 6. Long Beach St.7. Stanford8. Hawaii9. Penn St.10. UCLA11. Pepperdine12. Loyola Chicago13. Lewis14. UC San Diego15. Pacific
20121. UC Irvine2. Southern California3. Stanford4. BYU5. UCLA6. Lewis7. Penn St.8. Long Beach St.9. Ohio St.10. Pepperdine11. CSUN12. Loyola Chicago13. UC San Diego14. Pacific15. Harvard
20131. UC Irvine2. BYU3. Long Beach St.4. UCLA5. Pepperdine6. Stanford7. UC Santa Barbara8. California Baptist9. Loyola Chicago10. Lewis11. Ball St.12. Penn St.13. Hawaii14. CSUN15. Ohio St.
20141. Loyola Chicago2. Stanford3. BYU4. Pepperdine5. UC Santa Barbara6. UC Irvine7. Long Beach St.8. Penn St.9. UCLA10. Southern California11. Lewis12. Hawaii13. Ball St.14. Fort Wayne15. CSUN
20151. Loyola Chicago2. Lewis3. UC Irvine4. Penn St.5. Pepperdine6. Hawaii7. Southern California8. BYU9. UC Santa Barbara10. Ohio St.11. Long Beach St.
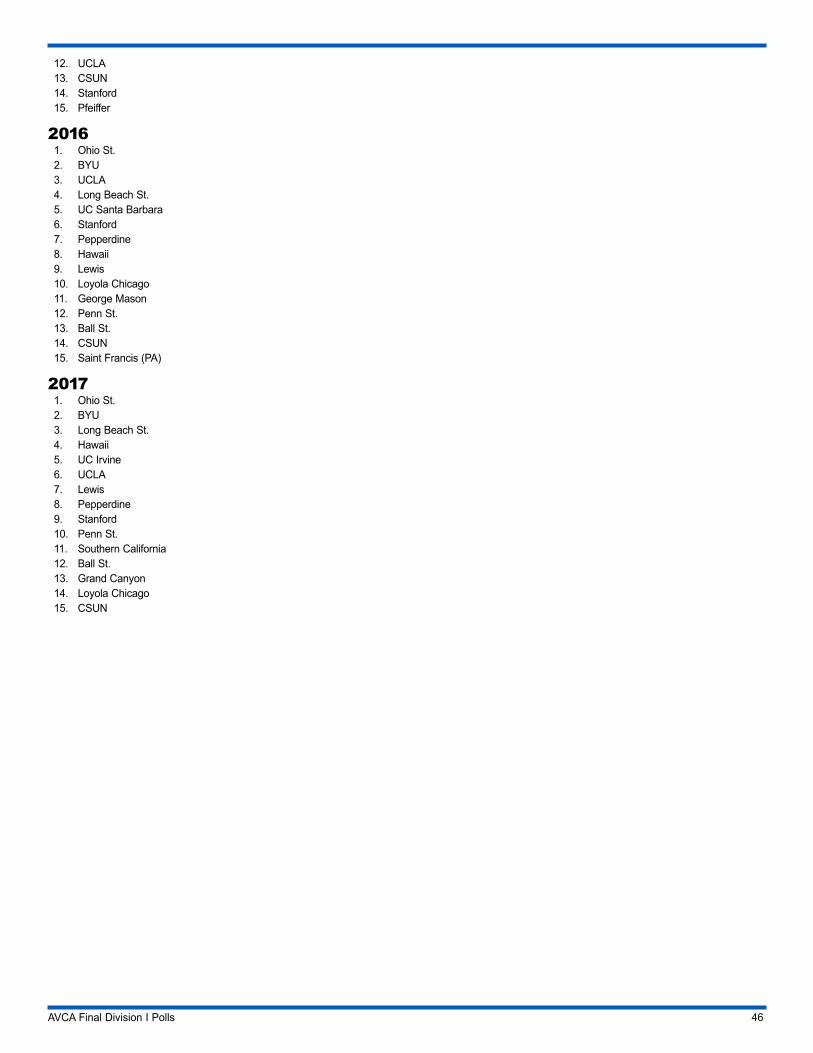
AVCA Final Division I Polls 46
12. UCLA13. CSUN14. Stanford15. Pfeiffer
20161. Ohio St.2. BYU3. UCLA4. Long Beach St.5. UC Santa Barbara6. Stanford7. Pepperdine8. Hawaii9. Lewis10. Loyola Chicago11. George Mason12. Penn St.13. Ball St.14. CSUN15. Saint Francis (PA)
20171. Ohio St.2. BYU3. Long Beach St.4. Hawaii5. UC Irvine6. UCLA7. Lewis8. Pepperdine9. Stanford10. Penn St.11. Southern California12. Ball St.13. Grand Canyon14. Loyola Chicago15. CSUN
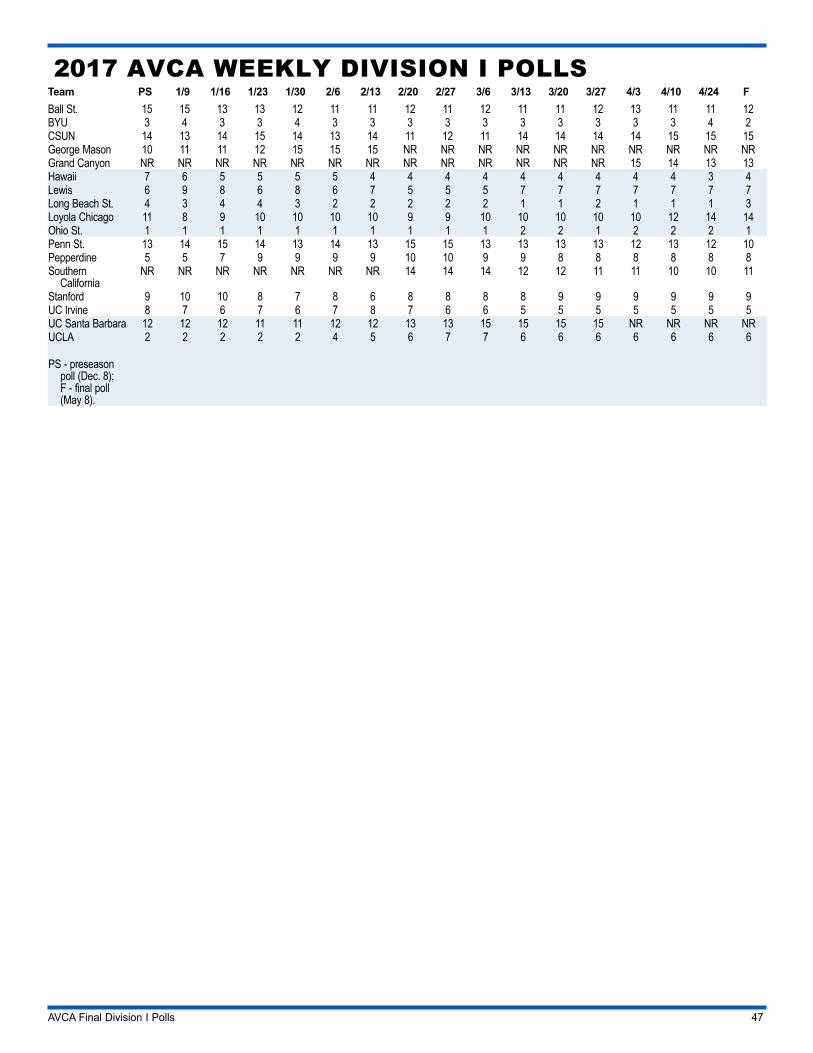
AVCA Final Division I Polls 47
2017 AVCA WEEKLY DIVISION I POLLSTeam PS 1/9 1/16 1/23 1/30 2/6 2/13 2/20 2/27 3/6 3/13 3/20 3/27 4/3 4/10 4/24 FBall St. 15 15 13 13 12 11 11 12 11 12 11 11 12 13 11 11 12BYU 3 4 3 3 4 3 3 3 3 3 3 3 3 3 3 4 2CSUN 14 13 14 15 14 13 14 11 12 11 14 14 14 14 15 15 15George Mason 10 11 11 12 15 15 15 NR NR NR NR NR NR NR NR NR NRGrand Canyon NR NR NR NR NR NR NR NR NR NR NR NR NR 15 14 13 13Hawaii 7 6 5 5 5 5 4 4 4 4 4 4 4 4 4 3 4Lewis 6 9 8 6 8 6 7 5 5 5 7 7 7 7 7 7 7Long Beach St. 4 3 4 4 3 2 2 2 2 2 1 1 2 1 1 1 3Loyola Chicago 11 8 9 10 10 10 10 9 9 10 10 10 10 10 12 14 14Ohio St. 1 1 1 1 1 1 1 1 1 1 2 2 1 2 2 2 1Penn St. 13 14 15 14 13 14 13 15 15 13 13 13 13 12 13 12 10Pepperdine 5 5 7 9 9 9 9 10 10 9 9 8 8 8 8 8 8Southern
CaliforniaNR NR NR NR NR NR NR 14 14 14 12 12 11 11 10 10 11
Stanford 9 10 10 8 7 8 6 8 8 8 8 9 9 9 9 9 9UC Irvine 8 7 6 7 6 7 8 7 6 6 5 5 5 5 5 5 5UC Santa Barbara 12 12 12 11 11 12 12 13 13 15 15 15 15 NR NR NR NRUCLA 2 2 2 2 2 4 5 6 7 7 6 6 6 6 6 6 6
PS - preseason poll (Dec. 8); F - final poll (May 8).