National Center on - U.S. Department of Veterans Affairs Prevalence and Risk of Homelessness among...
77
National Center on Homelessness among Veterans Delivering research-based solutions to end Veteran homelessness. U.S. Department of Veterans Affairs August 2011 Prevalence and Risk of Homelessness among U.S. Veterans: A Multisite Investigation Prepared by: Jamison Fargo, Stephen Metraux, Thomas Byrne, Ellen Munley, Ann Elizabeth Montgomery, Harlan Jones, George Sheldon, Dennis Culhane Acknowledgements Prevalence and Risk of Homelessness among U.S. Veterans: A Multisite Investigation was developed by a team of researchers from the U.S. Department of Veterans Affairs National Center on Homelessness among Veterans. The content of the report benefited greatly from comments and critiques from the following individuals, also associated with the National Center on Homelessness among Veterans: Vincent Kane (Philadelphia, PA), John Kuhn (Philadelphia, PA), Robert Rosenheck (New Haven, CT), and the research staff from the Model Development & Implementation core (Tampa, FL). This report would not have been possible without the generous collaboration and participation of staff from the following Continua of Care: New York City, NY; San Jose, CA; Columbus, OH; Denver, CO; Tampa, FL; Phoenix, AZ; Lansing, MI; and Fall River/Attleboro, MA. Report design by TC Burnett. Table of Contents Executive Summary ................................................... 3 Introduction ................................................................ 5 Data and Methods ...................................................... 12 Results Phase I .......................................................... 19 Results Phase II ......................................................... 21 Discussion .................................................................. 23 Tables and Figures .................................................... 29 Appendices................................................................. 38
-
Upload
phunghuong -
Category
Documents
-
view
219 -
download
1
Transcript of National Center on - U.S. Department of Veterans Affairs Prevalence and Risk of Homelessness among...

National Center on Homelessness among Veterans
Delivering research-based solutions to end Veteran homelessness.
U.S. Department of Veterans Affairs August 2011
Prevalence and Risk of Homelessness among U.S. Veterans: A Multisite Investigation
Prepared by: Jamison Fargo, Stephen Metraux, Thomas Byrne, Ellen Munley, Ann Elizabeth Montgomery, Harlan Jones, George Sheldon, Dennis Culhane
Acknowledgements Prevalence and Risk of Homelessness among U.S.
Veterans: A Multisite Investigation was developed by a
team of researchers from the U.S. Department of
Veterans Affairs National Center on Homelessness
among Veterans. The content of the report benefited
greatly from comments and critiques from the following
individuals, also associated with the National Center on
Homelessness among Veterans: Vincent Kane
(Philadelphia, PA), John Kuhn (Philadelphia, PA),
Robert Rosenheck (New Haven, CT), and the research
staff from the Model Development & Implementation
core (Tampa, FL). This report would not have been
possible without the generous collaboration and
participation of staff from the following Continua of
Care: New York City, NY; San Jose, CA; Columbus,
OH; Denver, CO; Tampa, FL; Phoenix, AZ; Lansing,
MI; and Fall River/Attleboro, MA. Report design by TC
Burnett.
Table of Contents
Executive Summary ................................................... 3
Introduction ................................................................ 5
Data and Methods ...................................................... 12
Results Phase I .......................................................... 19
Results Phase II ......................................................... 21
Discussion .................................................................. 23
Tables and Figures .................................................... 29
Appendices ................................................................. 38

Prevalence and Risk of Homelessness among U.S. Veterans: A Multisite Investigation
2
National Center on Homelessness among Veterans
This report is based on research conducted by the National Center on Homelessness among Veterans funded by the Department of Veterans Affairs. The findings and conclusions in this document are those of the author(s) who are responsible for its contents; the findings and conclusions do not necessarily represent the views of the Department of Veterans Affairs or the United States government. Therefore, no statement in this article should be construed as an official position of the Department of Veterans Affairs. No investigators have any affiliations or financial involvement (e.g., employment, consultancies, honoraria, stock ownership or options, expert testimony, grants or patents received or pending, or royalties) that conflict with material presented in the report.

3
Prevalence and Risk of Homelessness among U.S. Veterans: A Multisite Investigation
National Center on Homelessness among Veterans
Executive Summary
Preventing and ending homelessness among Veterans in five years is a key priority for
the White House as well as the United States Interagency Council on Homelessness and its
member agencies. Prerequisite to this goal is accurate information about the number of
Veterans experiencing homelessness as well as factors that contribute to their risk of
homelessness. This study addresses this need in showcasing novel analyses that use data
currently available from administrative records to provide detailed information about the
prevalence of Veterans within the homeless population; the prevalence of homelessness among
Veterans; and the differential risks for homelessness among Veteran, age, race, poverty, and
sex subgroups.
The results presented here are derived from comparisons of person-level data from local
Homeless Management Information Systems (HMIS) from seven Continuums of Care (CoCs)
with aggregated American Community Survey (ACS) data provided by the U.S. Census Bureau
for matching geographies. HMIS data provided information on the demographic composition of
the sheltered homeless population while ACS data offered complementary information for the
general population and the population living in poverty. Both data sets included information on
race, sex, age, and Veteran status.
Principal Findings from This Study Included
Veterans were overrepresented in the homeless population. Among the homeless
population, approximately 14% of adult males and 2% of adult females were Veterans. For
males, this proportion was about 30% greater than the proportion of Veterans in the general
population, and twice as large as the proportion of Veterans in the population living below
the poverty threshold. Similarly among the female homeless population, Veterans were
overrepresented compared to the general population by a factor of two, and by a factor of
three when compared to the population living in poverty.

Prevalence and Risk of Homelessness among U.S. Veterans: A Multisite Investigation
4
National Center on Homelessness among Veterans
The number of homeless Veterans accounted for approximately 1% of male Veterans and
2% of female Veterans in the general population. These rates were higher for Veterans
identifying as Black (4% for males, 5% for females). When looking only at Veterans living
below the poverty threshold, homeless Veterans were 15% (regardless of sex) of this
population, with this rate increasing to 30% when only looking at Black Veterans living in
poverty.
In multivariable analyses, Veteran status was associated with increased risk of
homelessness. For instance, after controlling for poverty, age, race, and geographic
variation, female Veterans were three times as likely as female non-Veterans to become
homeless, and male Veterans were twice as likely as male non-Veterans to become
homeless.
In terms of age, across the general homeless population (Veterans and non-Veterans),
males had the highest risk for homelessness in the 45–54 year age group. For females, risk
for homelessness was highest among the 18–29 year age group and risk declined as age
increased. Black race (compared to all others) was consistently identified as a strong risk
factor for homelessness, with little variation across sex.
The principal findings here indicate that Veteran status is associated with a higher risk of
homelessness; and that a greater proportion of Veterans were in the homeless population than
in either the general population or the population living in poverty. In addition to these empirical
findings, this study demonstrates the capabilities of administrative data collected on homeless
persons and services through HMIS to inform policy initiatives to prevent and end Veteran
homelessness. Future research promises to expand upon this study as more and richer data on
Veteran homelessness, and homelessness in general, becomes available.

5
Prevalence and Risk of Homelessness among U.S. Veterans: A Multisite Investigation
National Center on Homelessness among Veterans
Introduction
Veterans as a subpopulation of people experiencing homelessness have been the focus
of significant investigation. Much of this work has consisted of surveys and counts estimating
the proportion of Veterans among those experiencing homelessness, and descriptions of the
demographic characteristics of Veterans experiencing homelessness. A primary motivation for
these efforts has been to investigate whether Veterans were overrepresented among people
experiencing homelessness, and whether Veterans were at greater risk of becoming homeless
than their non-Veteran counterparts. This study will build on this research, using homeless and
general population data from a number of localities to assess prevalence and risk of
homelessness among Veterans.
The most systematic of these earlier assessments was conducted by Rosenheck and his
colleagues.1 Using data from four different homeless surveys collected in the late 1980s and the
1987 Current Population Survey (CPS), Rosenheck, Frisman, and Chung2 found a higher
proportion of Veterans (41%) in the homeless male population than in the general male
population (34%). Their results also showed differential risk by age, with the 20–34 year age
group having the highest overrepresentation of Veterans in the homeless population at that
time. This age-related finding is significant, as Veterans in this group would most likely have
served during the immediate post-Vietnam era, a non-combat period that marked the launch of
the all-volunteer military.2 When Gamache, Rosenheck, and Tessler3 followed up this study with
1 Rosenheck, R., Bassuk, E., & Salomon, A. (1998). Special populations of homeless Veterans. In L. B. Fosburg & D. L. Dennis (Eds.), Practical lessons: The 1998 Symposium on Homelessness Research. Washington DC: US Department of Housing and Urban Development.
2 Rosenheck, R., Frisman, L., & Chung, A.M. (1994). The proportion of veterans among homeless men, American Journal of Public Health, 84(3), 466–469.
3 Gamache, G., Rosenheck, R., & Tessler, R. (2001). The proportion of veterans among homeless men: a decade later. Social Psychiatry and Psychiatric Epidemiology, 36, 481–485.

Prevalence and Risk of Homelessness among U.S. Veterans: A Multisite Investigation
6
National Center on Homelessness among Veterans
data from the 1996 National Survey of Homelessness Assistance Providers and Clients4 and the
1996 CPS, they found that the proportion of male Veterans among both the homeless and
general populations had declined to 33% and 28%, respectively. However, male Veterans were
still overrepresented among the male homeless population, and the post-Vietnam age cohort
(then aged 35–44 years) was still at highest risk.
Based on these findings, Rosenheck and his colleagues argued that risk for
homelessness among Veterans was strongly influenced by a cohort effect linked to a social
selection process where early recruits into the all-volunteer military were more likely to have
those personal characteristics—mental illness, substance abuse, and weak family ties—that
pose risk for homelessness.5 This conclusion ran counter to conventional wisdom and early
surveys, which explained homelessness among Veterans as being largely related to adjustment
issues post-combat and argued correspondingly that the highest risk for homelessness among
Veterans was for those who served during the Vietnam era.6
Overrepresentation of Veterans among the homeless population has not been limited to
males. In contrast to the overall number of male Veterans, which has been declining since the
start of the post-Vietnam Era,7-8 the overall number of female Veterans, while much smaller, has
4 Burt, M.R. (1999). Homelessness: Programs and the people they serve: Summary report of the findings of the National Survey of Homeless Assistance Providers and Clients. Washington, DC: The Urban Institute.
5 Tessler, R., Rosenheck, R. A., & Gamache, G. (2002). Comparison of homeless Veterans with other homeless men in a large clinical outreach program. Psychiatric Quarterly, 73(2), 109–119.
6 Robertson, M. (1987). Homeless Veterans: An emerging problem? In R. D. Bingham, R. E. Green, & S. B. White (Eds.), The Homeless in Contemporary Society. Beverly Hills, CA: Sage.
7 Richardson, C. & Waldrop, J. (2003). Veterans: 2000. Census 2000 Brief. Washington DC: United States Census Bureau.
8 VetPop2007 [Electronic Data]. (2008). Washington, DC: National Center for Veterans’ Analysis and Statistics.

7
Prevalence and Risk of Homelessness among U.S. Veterans: A Multisite Investigation
National Center on Homelessness among Veterans
almost doubled since 1980.9 Based on CPS data, the proportion of Veterans in the female
homeless population, estimated at 3–4%, stands in contrast to the 1% level in the overall
population. This indicates that female Veterans are at 2 to 4 times greater risk for homelessness
than the general female population, a substantially higher comparative risk than for male
Veterans. Unlike male Veterans, female Veterans at highest risk for homelessness are those
who served primarily during the Vietnam era. No clear explanation has been offered for either
finding.10 A more recent study examined individual risk factors for Veteran and non-Veteran
homelessness, but offered no insights for the disparities in gender (among Veterans) and age
(among female Veterans).11
Advances in data collection on homeless persons, as well as on the services provided to
them, led to the first nationwide estimates of the extent of Veteran homelessness in 2009. This
assessment was the result of a process that started in 2005, when the U.S. Department of
Housing and Urban Development (HUD) issued its first Annual Homeless Assessment Report
(AHAR)12 based on data collected by local networks of homeless service providers called
Continuums of Care (CoC).13 Each CoC, whose geographic boundaries range in size from a
single city to an entire state, was mandated by HUD to maintain a homeless management
information system (HMIS) containing data on persons utilizing homeless shelter and services, 9 United States Department of Veterans Affairs, Office of Policy and Planning. (2007). Women Veterans: Past, present & future. Washington, DC: Author.
10 Gamache, G., Rosenheck, R., & Tessler, R. (2003).Overrepresentation of women veterans among homeless women. American Journal of Public Health, 93(7), 1132–1136.
11 Washington, D. L., Yano, E. M., McGuire, J., Hines, V., Lee, M., & Gelberg, L. (2010). Risk factors for homelessness among women Veterans. Journal of Health Care for the Poor and Underserved, 21, 81–91.
12 United States Department of Housing and Urban Development. (2007). The Annual Homeless Assessment Report to Congress (2005). Washington, DC: Author.
13 Burt, M. R., Pollock, D., Sosland, A., et al. (2002). Evaluation of Continuums of Care for Homeless People. Washington DC: U.S. Department of Housing and Urban Development, Office of Policy Development and Research.

Prevalence and Risk of Homelessness among U.S. Veterans: A Multisite Investigation
8
National Center on Homelessness among Veterans
and to conduct a point-in-time (PIT) count, which is a single night enumeration of all homeless
persons in the continuum. These HMIS and PIT data, aggregated at the CoC jurisdictional level,
form the basis for the AHAR estimates of the extent and nature of homelessness nationwide.
In 2011, HUD and the U.S. Department of Veterans Affairs (VA) produced the first
Veterans Supplement to the AHAR (Vet-AHAR)14 based on the HMIS and PIT data. Using the
PIT-based count, an estimated 75,609 Veterans nationwide were identified as homeless on a
selected night in January 2009; and, using the HMIS-based count, the estimated number of
homeless Veterans nationwide over the one-year time period from October 2008 through
September 2009 was 136,334. Along with the estimated prevalence of Veteran homelessness,
the Vet-AHAR provided a detailed description of the demographic characteristics of homeless
Veterans, an assessment of risk of homelessness for Veterans, and variations in risk by
demographic group. These demographic strata were available only for the HMIS-based
estimate, and can be compared to the findings from the studies by Rosenheck and his
colleagues that were reviewed above. A summary of these findings and comparisons to
previous research follow.
Gender. Based on the HMIS data reported in the 2009 AHAR, 92% of homeless single
adult Veterans were male. Seventeen percent of homeless single males and 2.7% of homeless
single females identified themselves as Veterans, compared to 24% and 1.4% of adult single
males and females, respectively, in the overall population. For females, these percentages, and
the corresponding overrepresentation of Veterans in the female homeless population, were both
roughly consistent with the results of Gamache and her colleagues. However, for males, the
Vet-AHAR estimate is contrary to a key finding from earlier studies. While Rosenheck et al.15
14 United States Department of Housing and Urban Development & Department of Veterans Affairs. (In press). The 2009 Annual Homeless Assessment Report to Congress, Veteran Supplement. Washington, DC: Authors.
15 Rosenheck, R., Frisman, L., & Chung, A. M. (1994). The proportion of Veterans among homeless men. American Journal of Public Health, 84(3), 466–469.

9
Prevalence and Risk of Homelessness among U.S. Veterans: A Multisite Investigation
National Center on Homelessness among Veterans
and Gamache et al.16 both found overrepresentation of male Veterans in the homeless
population, the Vet-AHAR results showed that male Veterans were underrepresented in the
homeless population compared to male Veterans in the general population.
Age. The Vet-AHAR does not stratify age by gender. However, since 92% of the single
adult Veteran population was male, the overall age breakdowns permit a rough comparison with
the age breakdowns presented in the studies on homeless male Veterans reviewed earlier. The
proportions of Veterans in the homeless population increased in older age categories, with the
greatest disproportions observed among the 51–61 year age group (23.5% Veterans in the
homeless population compared to 14.5% of Veterans in the general population) and in the 18–
30 year age group (4.1% compared to 2.2%). The former age group corresponds to Veterans
who served in the initial years of the all-volunteer military, and is consistent with Rosenheck and
his colleagues’ findings concerning the elevated risk of homelessness found in this cohort.
Race and Ethnicity. In the Vet-AHAR, among the three predominant racial and ethnic
groups—White, Black, and Hispanic—the rates of Veterans among the homeless population
were similar to corresponding rates in the general population. Other racial/ethnic groups—
Asian, American Indian, and Pacific Islander—had somewhat higher rates of Veterans among
their homeless populations, but collectively these three groups comprised only 4% of the
homeless Veteran population.
Poverty. Prior studies comparing Veterans among the homeless population with the
overall population do not take poverty into account. Virtually all homeless persons can be
assumed to have income under the poverty guidelines, and the vast majority of persons at risk
for becoming homeless live in poverty. Accounting for poverty status is particularly important in
a study of homelessness among Veterans because Veterans are substantially
underrepresented among the poverty population when compared to the general population. 16 Gamache, G., Rosenheck, R., & Tessler, R. (2001). The proportion of veterans among homeless men: a decade later. Social Psychiatry and Psychiatric Epidemiology, 36, 481–485.

Prevalence and Risk of Homelessness among U.S. Veterans: A Multisite Investigation
10
National Center on Homelessness among Veterans
According to the 2000 Census, the poverty rate for Veterans was 5.6%, compared to 10.9% of
the U.S. adult population. Comparing Veterans in the homeless population to Veterans living in
poverty would be a more accurate assessment of risk than comparing them with the general
adult population, and has the effect of increasing the relative risk associated with Veteran status
for homelessness.
As an example of this, from the Vet-AHAR, the rate of Veterans in the single adult
homeless population (male and female combined), 13%, is about the same as the rate of
Veterans in the general population, but almost twice the rate of Veterans among the poverty
population (7.2%). Taking poverty into account leads to similar increases in relative risk for
homelessness in conjunction with Veteran status for all of the demographic subgroups just
reviewed.
Homelessness Rates in the Veteran Population. The Vet-AHAR also reported
estimated rates of homelessness for the Veteran population (overall and poverty) and compared
them to the rates for the general population (overall and poverty). This is the first study to do so.
For single adults overall, the levels of homelessness were about the same (0.7%) in the Veteran
and general populations. However, since a lower proportion of Veterans live in poverty, the
homelessness rate among poor Veterans rose to 12.6%, nearly twice the 6.5% homelessness
rate for the general poverty population.
The present study takes a further in-depth look at homelessness among Veterans, both
as a whole and among fine-grained demographic subgroups, based on HMIS data from seven
CoCs and corresponding American Community Survey (ACS) data. While these data are not
nationally representative, the HMIS data do comprise individual records, in contrast to the
jurisdiction-level aggregated data used by the Vet-AHAR. Because of this, the present study can
include more detailed analyses of demographic subgroups and attendant risk for homelessness
among Veterans than were presented in the Vet-AHAR, and provides a vehicle to further
explore findings presented by Rosenheck and his colleagues pertaining to disparities in risk for

11
Prevalence and Risk of Homelessness among U.S. Veterans: A Multisite Investigation
National Center on Homelessness among Veterans
homelessness between age and gender groups. Furthermore, these data provide the capacity
to adjust risk for homelessness by age group, race, and gender to provide a clearer assessment
of Veterans’ risk for homelessness and how this risk compares to the risk of more general
populations.

Prevalence and Risk of Homelessness among U.S. Veterans: A Multisite Investigation
12
National Center on Homelessness among Veterans
Data and Methods
Data for this study came from two sources: person-level, de-identified HMIS data from a
nationally diverse set of CoCs for 200817; and 2006–2008 ACS three-year estimates. HMIS is
administrative data of service use by homeless individuals and families collected by services
providers at the CoC level.18 Each data source, and the process whereby it was prepared for
subsequent analysis, is described below.
HMIS CoC Data. Eleven CoCs initially provided HMIS data consisting of unduplicated,
de-identified, individual records for each adult who, at any point during 2008, utilized emergency
shelter or transitional housing in their jurisdiction.19 HMIS data were usable and sufficiently
complete from seven geographically defined CoCs: New York City, NY; San Jose/Santa Clara
County, CA; Columbus/Franklin County, OH; Denver, CO (Denver, Adams, Arapahoe, Boulder,
Broomfield, Douglas, and Jefferson Counties); Tampa/Hillsborough County, FL;
Phoenix/Maricopa County, AZ; and Lansing/Ingham County, MI. Although most of these
jurisdictions are contiguous with county boundaries, subsequent references in this report to
individual CoCs will refer to them only by the principal city located within each (e.g., Phoenix in
lieu of Phoenix/Maricopa County). The data from four CoCs were later determined to be
unusable because they contained large amounts of missing information. The seven CoCs
17 See the 2009 Annual Homelessness Assessment Report, “Chapter 1: Introduction” for detail regarding the collection of data in HMIS by Continuums of Care.
18 McGah, J., Sokol, B., Spellman, B., & Sullivan, N. (2004). HMIS Project Management Topics and Tools. Boston MA: McCormick Graduate School of Policy Studies, University of Massachusetts, Boston. 19 HMIS data for transitional housing programs were not available from New York City. As a result, only persons who utilized emergency shelter are included in this study. For prior research that has utilized only emergency shelter data to assess prevalence of homelessness see Culhane, D.P, Dejowski, E.F., Ibanez, J. Needham, E. & Macchia, I. (1994). Public shelter admission rates in Philadelphia and New York City: The implications of turnover for sheltered population counts. Housing Policy Debate, 5(2): 107–140.

13
Prevalence and Risk of Homelessness among U.S. Veterans: A Multisite Investigation
National Center on Homelessness among Veterans
providing data for this study represented a heterogeneous sample of urban jurisdictions and a
diverse cross section of the U.S. homeless population.
The HMIS data fields from each CoC included age, race, ethnicity, sex, and self-reported
Veteran status. Age was grouped into five categories: 18–29 years, 30–44 years, 45–54 years,
55–64 years, and 65 years and older in a manner consistent with the ACS. Veteran status, sex,
and race (Black and non-Black) were retained as dichotomous measures, and data on ethnicity
was not used to due to large amounts of missing data on this measure in several jurisdictions.
The HMIS data sets from each of the seven CoCs contained two types of missing data,
item nonresponse and unit nonresponse. The first type, item nonresponse, reflected instances
where records were collected into the HMIS but were incomplete (i.e., missing one or more data
elements). For example, all CoCs had some records where information on Veteran status was
missing. Among the seven CoCs included in this study, such missing data occurred in relatively
small amounts and to varying degrees. The second type of missing data, unit nonresponse,
occurred in instances where a person received homeless services but no record of this person
was included in the HMIS (i.e., entire record missing). Particularly germane to the focus on this
study, homeless services providers affiliated with the VA, including many programs covered
under the Grant and Per Diem Program and the Domiciliary Care for Homeless Veterans
Program, often did not report data to the local HMIS.
Failure to address either type of missing data would result in an underestimate of the
prevalence of both overall and Veteran homelessness; therefore, we applied procedures to
address both sources of missing data. Specifically, we used imputation procedures to estimate
values for incomplete records (item nonresponse) and a data extrapolation procedure to
estimate the additional homeless persons (Veterans and non-Veterans) who used homeless
services but were not recorded doing so (unit nonresponse).
In performing imputation procedures, we sought to estimate missing values so as to

Prevalence and Risk of Homelessness among U.S. Veterans: A Multisite Investigation
14
National Center on Homelessness among Veterans
preserve the overall proportions that were originally observed in the data (with missing values)
for age by race by sex by Veteran status subgroups. To do this, we conducted imputations
separately for each CoC and used discriminant multiple imputation for categorical variables
(continuous age was complete for all CoCs prior to imputation). Discriminant imputation predicts
the most likely value of a categorical variable or factor, based on the conditional distribution
estimated by the included covariates and assuming that the data were at least missing at
random.20,21 For two CoCs, the discriminant function algorithm failed to converge on the first
imputation step. In these cases “hot decking,” an alternative single imputation approach, was
used to estimate missing values.22 Following imputation procedures, differences in proportions
of cases in each age by race by sex by Veteran status subgroup between the original (non-
imputed) and imputed CoC data sets were negligible. All imputation procedures were performed
using SOLAS 3.2.23,24
To address unit nonresponse, we employed a data extrapolation process to estimate the
additional number of homeless individuals for each age by race by sex by Veteran subgroup for
each CoC. This extrapolation procedure was modeled on those used for the 2009 AHAR (as
detailed in Appendix A).25 Modifications to this procedure in the present study allowed for
extrapolation of separate Veteran and non-Veteran subpopulations. The resulting procedure
20 Graham, J. W. (2009). Missing data analysis: Making it work in the real world. Annual Review of Psychology, 60, 549–576. 21 Watanabe, M. & Yamaguchi, K. (Eds). (2003). The EM Algorithm and Related Statistical Models. New York: Marcel Dekker. 22 Ford, B. L. (1983). An overview of hot-deck procedures. In Madow W. G., Olkin I., Rubin D. B. (Eds.), Incomplete Data in Sample Surveys (p. 185–207). New York: Academic Press. 23 Horton, N. J. & Lipsitz, S. R. (2001). Multiple imputation in practice: Comparison of software packages for regression models with missing variables. American Statistician, 55(3), 244–254. 24 Statistical Solutions. (2004). SOLAS, version 3.2. MA: Saugus. http://www.statsol.ie/solas/solas.htm. 25 U.S. Department of Housing and Urban Development. (2010). The 2009 Annual Homeless Assessment Report to Congress. Washington, DC: Author.

15
Prevalence and Risk of Homelessness among U.S. Veterans: A Multisite Investigation
National Center on Homelessness among Veterans
consisted of three steps. First, we estimated the number of unduplicated persons using
emergency shelter or transitional housing beds that were not covered by HMIS in 2008 and not
included in the data provided by the CoCs for this study. To do this, we multiplied the bed
turnover rate (i.e., the number of persons occupying one residential bed in a year) by the
number of beds that were not included in the HMIS data. The number of uncovered beds was
obtained from each CoC’s Housing Inventory Chart, which lists the inventory of emergency
shelter and transitional housing beds in each CoC and whether, or to what extent, these beds
are covered by the CoC’s HMIS. Some of these beds were dedicated for Veteran use only,
while others were available for the general population, either Veteran or non-Veteran. In
addition, VA transitional housing beds operated through the Grant and Per Diem (GPD)
program were, in some CoCs, not included in the Housing Inventory Chart or HMIS data. These
beds dedicated for Veteran use were also used in the estimation. For the second step, we used
additional procedures to subtract persons who used both a bed covered by HMIS and a bed not
covered by HMIS to avoid potential double counting. Finally, we assumed the age, sex, and
race composition of Veterans and non-Veterans using beds not covered by HMIS to be
proportionally equivalent to that of Veterans and non-Veterans in the HMIS data. After
extrapolating the age, race, and sex makeup of Veterans and non-Veterans using beds not
covered by HMIS providers, we added these persons to the Veterans and non-Veterans
included in the HMIS data. This resulted in a complete set, for each of the seven CoCs, of
Veterans and non-Veterans in each age by race by sex subgroup that received homeless
residential services over the course of a year. Results of extrapolation are presented in
Appendices B (for each CoC) and C (for all CoCs combined).
Following the application of imputation and extrapolation procedures to the HMIS data
for each CoC, the individual level HMIS records for each CoC were aggregated so as to
compute frequencies of homeless individuals for each age by race by sex by Veteran status

Prevalence and Risk of Homelessness among U.S. Veterans: A Multisite Investigation
16
National Center on Homelessness among Veterans
subgroup. These frequencies were created so as to mirror those available in the ACS data, as
described in the next section, and to allow comparisons and statistical modeling of ACS and
HMIS frequencies as a function of subgroup characteristics.
American Community Survey Data. To compute rates of homelessness, population
estimates of the total Veteran and non-Veteran populations in each CoC were calculated based
on ACS data. The ACS is an annual survey administered by the Census Bureau that collects
important social, economic, and demographic information from samples of housing units in all
counties in the United States.26 ACS data were available in the form of one-year and three-year
estimates. Three-year estimates (2006 through 2008) were selected for this study, as they are
based on a larger sample size than the one-year estimates and offer better precision, especially
in examining smaller populations such as Veterans, and are more appropriate for smaller
geographies. As boundaries for the CoCs used in this study were not always contiguous with
the geographies for which ACS estimates are publicly available, the Census Bureau provided
ACS estimates that were customized to match the geographic areas of the CoCs used in this
study. This customization largely entailed aggregating estimates for several counties or
extracting estimates for a city nested within a particular county. For each geographic area, the
Census Bureau provided custom tabulated estimates of the number of individuals in specifically
defined age by sex by race by Veteran status by poverty status population subgroups. As with
the HMIS data, age was divided into five categories and the remaining measures were
dichotomous. Poverty status was not included in HMIS because all homeless persons were
considered poor. Stratification on poverty level was included in the ACS data so that rates of
homelessness could be determined for both the poverty and the overall populations.
26 Mather, M., Rivers, K. L., & Jacobsen, L. A. (2005). “The American Community Survey.” Population Bulletin (of the Population Reference Bureau), 60(3), 3–20.

17
Prevalence and Risk of Homelessness among U.S. Veterans: A Multisite Investigation
National Center on Homelessness among Veterans
Data Analysis
The data analyses for this study were conducted in two phases: Phase I estimated rates
of and relative risk for homelessness among Veteran and non-Veteran populations, as well as
among various demographic subgroups. In Phase II, we estimated risk for homelessness as a
function of Veteran status and demographic characteristics using multivariable statistical
modeling techniques. For both phases, results are presented separately for males and females
and only for data from the combined CoCs in the results section that follows, weighted by
population size. Results of the same analyses performed on data for each individual CoC are
available in the appendices. Additionally, we conducted all analyses in both phases using ACS
data for both the total population and for the population living below the poverty guidelines. We
conducted all analyses using the R language and environment for statistical computing.27 Each
phase of analysis is now described in turn in more detail.
Phase I examined Veterans in the homeless population and, conversely, homeless
persons in the Veteran population in terms of prevalence rates and risk ratios. For the former,
prevalence rates of Veterans in the homeless, poverty, and overall populations are presented,
as are corresponding risk ratios for Veterans in the homeless population compared to Veterans
in the poverty and overall populations. The risk ratios provide a simple measure of whether
Veterans were found to be overrepresented in the homeless population and can be used to
compare results between the present study and former investigations by Rosenheck and his
colleagues.
Rates of homelessness are presented for Veteran and non-Veteran populations, both
overall and in poverty. These rates form the basis for risk ratios comparing homelessness
among the Veteran population to homelessness among the non-Veteran population, before and
27 R Development Core Team (2010). R: A language and environment for statistical computing. R Foundation for Statistical Computing, Vienna, Austria. ISBN 3-900051-07-0, URL http://www.R-project.org.

Prevalence and Risk of Homelessness among U.S. Veterans: A Multisite Investigation
18
National Center on Homelessness among Veterans
after taking poverty into account. These risk ratios assess whether homelessness was more
prevalent among the Veteran or non-Veteran populations. We computed prevalence rates and
risk ratios for each age, race, and sex subgroup. Risk ratios were unadjusted for age by sex by
race subgroups, age-adjusted for Black and non-Black (marginal or combined) subgroups, and
were both age- and race-adjusted overall.
The analyses for phase II were driven by two research questions:
1) Is Veteran status associated with an increased risk of homelessness?
2) Does risk of homelessness among Veterans vary as a function of age, race, and sex?
To address both research questions and estimate risk for homelessness among different
demographic subpopulations, we estimated a multivarible regression model in which homeless
status served as the outcome, and age, race, and Veteran status served as predictors. Age was
included as a nominal, rather than continuous, variable with 18–29-year-olds serving as the
reference group. Because we were modeling frequencies, the outcome was a ratio of homeless
(from HMIS data) divided by total (general or poverty population from ACS data) individuals for
each subpopulation, as defined by the frequencies with each age by sex by race by Veteran
status subpopulation. We conducted binomial logistic regression analyses on data from each
CoC separately and also conducted a binomial generalized estimating equation (GEE) analysis
on data pooled from all CoCs. We selected a GEE model to adjust for non-independence due to
clustering within individual CoCs. Both analytical approaches were weighted by the total
frequency within each age by sex by race by Veterans status subgroup. We conducted three
sets of analyses on the data from individual and combined CoCs: 1) univariate-only models
(including one predictor at a time), 2) main-effects-only multivariate models (no interactions),
and 3) main-effects and interactions multivariate models. We computed odds ratios (OR) and
95% confidence intervals from the results of each analysis. Each model was estimated
separately for males and females, and separate models were estimated for the overall
population and for the population living under the poverty income guidelines.

19
Prevalence and Risk of Homelessness among U.S. Veterans: A Multisite Investigation
National Center on Homelessness among Veterans
Results Phase I
Table 1 summarizes demographic information for pooled HMIS, ACS poverty, and ACS
general adult populations from all seven CoCs. After performing the previously described
imputation and extrapolation procedures, an estimated 130,554 adults received homeless
services in the seven CoCs in this study, with 10,726 of these adults (8.2%) reporting Veteran
status. The age distributions on this table are consistent with current patterns among homeless
and Veteran populations where older age groups are typically overrepresented in Veteran
populations and underrepresented in homeless populations. Veterans in each population
(HMIS, ACS poverty, ACS general) were overwhelmingly male, while the sex distribution was
more evenly distributed among the three non-Veteran populations. Race, which was divided into
Black and non-Black, shows that the homeless population, regardless of Veteran status, was
disproportionately Black. Finally, Table 1 shows the distribution of the three pooled populations
broken down by CoC. These distributions for individual CoCs typically fluctuated across
populations and subgroups, indicating that Veterans are unequally distributed across CoCs, and
that the distributions of homeless subgroups by CoC are not necessarily consistent with the
distributions of the poor and overall populations. This would lead to inferences that Veterans are
underrepresented in all three populations in New York City, while being especially
overrepresented in other CoCs such as Tampa and Phoenix.
Table 2 presents the prevalence of Veterans among the pooled HMIS and the two ACS
populations, and presents corresponding risk ratios assessing whether Veterans were
overrepresented among the HMIS population, when compared to the ACS general and poverty
populations. Veterans were overrepresented among the homeless population for both sexes.
For males, 13.5% of the homeless adults were Veterans, while 1.8% of homeless female adults
were Veterans. These rates yielded age- and race-adjusted risk ratios (RR) of 2.1 (male) and
3.0 (female) when compared to the population in poverty, and 1.3 (male) and 2.1 (female) when

Prevalence and Risk of Homelessness among U.S. Veterans: A Multisite Investigation
20
National Center on Homelessness among Veterans
compared to the general population. Looking at the subgroups after further subdividing by race
and age, the proportions of male Veterans increased substantially, for both Black and non-Black
subpopulations, as the age groups got older. For females, the corresponding proportions of
Veterans were much lower and fluctuated across age groups between 1% and 3%. Figures 1
and 2 graphically illustrate the risk ratios of Table 2 broken down by sex, age, and racial
subgroups. Tables summarizing these results for individual CoCs are presented in Appendix D,
and Appendices E and F provide figures illustrating RRs for individual CoCs.
Table 3 shows the prevalence of homelessness among the pooled adult poverty and
general populations for the seven CoCs under study, parsed by Veteran status. The age- and
race-adjusted RRs for homelessness among both male and female populations were higher for
Veterans than for non-Veterans, when using both poverty (RRs of 2.2 and 3.0 for males and
females, respectively) and general populations (respective RRs of 1.4 and 2.3) as denominators.
Rates of homelessness were consistently higher in Veteran populations than in non-Veteran
populations, and among both Veterans and non-Veterans there were substantial racial disparities
in the rates of homelessness. In the most extreme case, among the Black subgroups in the 18–
29 year age range, the number of homeless males and females were 54% and 37% of the
populations in poverty, respectively. The youngest three age groups, up to age 55, showed
homelessness rates in excess of one quarter of the corresponding poverty populations. Tables
breaking these results down by individual CoCs are presented in Appendix D.

21
Prevalence and Risk of Homelessness among U.S. Veterans: A Multisite Investigation
National Center on Homelessness among Veterans
Results Phase II
Results of the GEE analyses using pooled CoC data, stratified by sex, are presented in
Tables 4 and 5, and in Figures 3 and 4. The outcome being modeled was homelessness, with
the study population consisting of homeless persons from the HMIS data combined with data
from the ACS general (Table 4 and Figure 3) and poverty (Table 5 and Figure 4) populations.
Results from univariate and multivariate main-effects-only models are presented; interactions
among main effects were either non-significant or could not be meaningfully interpreted. Similar
tables are available for results of weighted binomial logistic regression analyses for individual
CoCs in Appendix G for the general population and Appendix H for the population in poverty.
Collectively, results show that Veteran status, along with age and Black race, were each
significantly and independently associated with risk of homelessness. Noteworthy among the
results for males in the general population model (Table 4) is how the risk for homelessness
associated with Veteran status goes from a non-significant bivariate relationship in the
unadjusted model to become significant and increased after controlling for the demographic
factors in the adjusted model. Otherwise, the unadjusted and adjusted results for the other
covariates in both the male and the female models were very similar in Table 4. The patterns of
results found in the poverty population results (Table 5) were consistent with those in the
general population (Table 4), but Veteran status was associated with a greater homelessness
risk. Where male Veterans were almost 50% more likely and female Veterans were almost twice
as likely to be homeless than non-Veterans in the general population, male Veterans were more
than two times as likely and female Veterans were more than three times as likely to be
homeless compared to non-Veterans in the poverty population.
Figures 3 and 4 illustrate the probability of homelessness as a function of age and race
by Veteran status and sex in the general (Figure 3) and poverty (Figure 4) populations.
Increased age was significantly associated with homelessness, but its effect, while holding

Prevalence and Risk of Homelessness among U.S. Veterans: A Multisite Investigation
22
National Center on Homelessness among Veterans
similar patterns across race and Veteran categories, differed between men and women. Among
men, risk for homelessness generally increased as a function of age up to the 45–54 year age
range, but declined thereafter (among Veterans and non-Veterans and in both the general and
poverty populations). Males in the 45–54 year age group appeared to be at the highest level of
risk of homelessness, nearly twice and three times more likely (general and poverty populations,
respectively), than their 18–29-year-old counterparts.
Risk for homelessness among females declined at an increasing rate in both the total
population and population in poverty, so that older females were at the lowest risk for
homelessness, compared to the youngest group. The results for the poverty population were
consistent with those of the general population, but the differences between age groups in the
figures became larger and the associated probabilities increased substantially. The greatest risk
for homelessness appeared to be among young female Black Veterans, with nearly a 40%
probability of homelessness when compared to the poverty population and a 9% probability
when compared to the general population. Both of these rates were much larger than what was
observed among their non-Veteran counterparts.
23
Prevalence and Risk of Homelessness among U.S. Veterans: A Multisite Investigation
National Center on Homelessness among Veterans
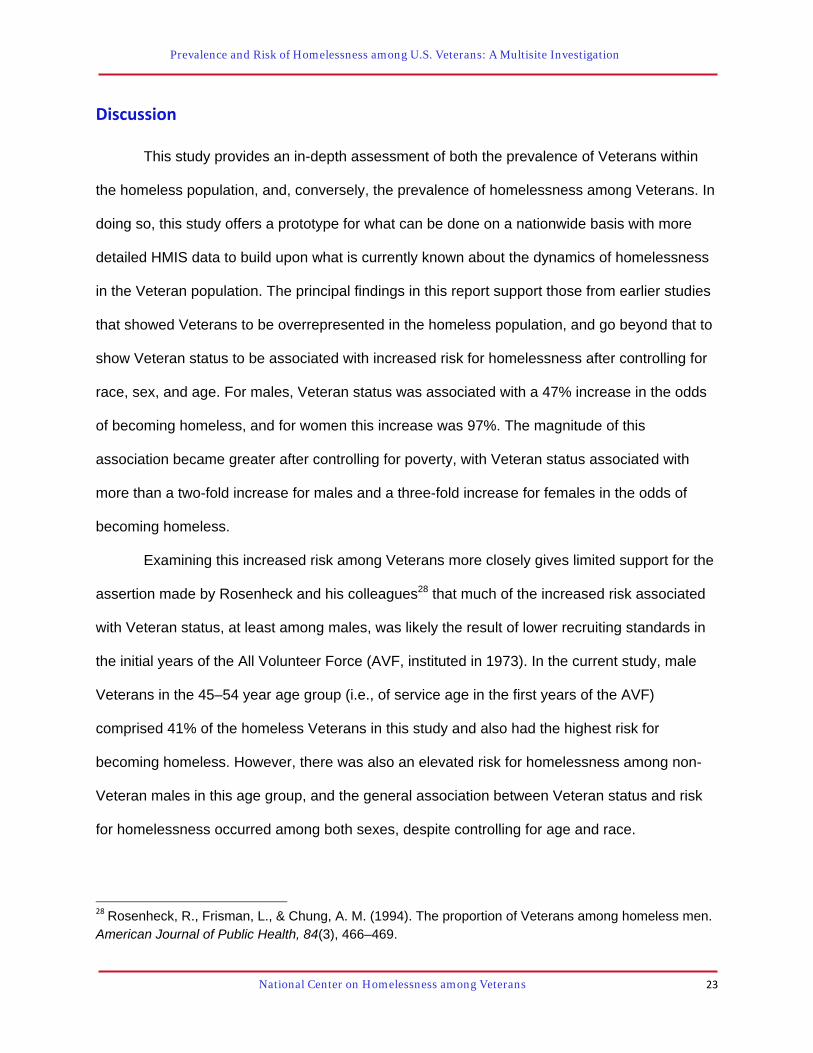
Discussion
This study provides an in-depth assessment of both the prevalence of Veterans within
the homeless population, and, conversely, the prevalence of homelessness among Veterans. In
doing so, this study offers a prototype for what can be done on a nationwide basis with more
detailed HMIS data to build upon what is currently known about the dynamics of homelessness
in the Veteran population. The principal findings in this report support those from earlier studies
that showed Veterans to be overrepresented in the homeless population, and go beyond that to
show Veteran status to be associated with increased risk for homelessness after controlling for
race, sex, and age. For males, Veteran status was associated with a 47% increase in the odds
of becoming homeless, and for women this increase was 97%. The magnitude of this
association became greater after controlling for poverty, with Veteran status associated with
more than a two-fold increase for males and a three-fold increase for females in the odds of
becoming homeless.
Examining this increased risk among Veterans more closely gives limited support for the
assertion made by Rosenheck and his colleagues28 that much of the increased risk associated
with Veteran status, at least among males, was likely the result of lower recruiting standards in
the initial years of the All Volunteer Force (AVF, instituted in 1973). In the current study, male
Veterans in the 45–54 year age group (i.e., of service age in the first years of the AVF)
comprised 41% of the homeless Veterans in this study and also had the highest risk for
becoming homeless. However, there was also an elevated risk for homelessness among non-
Veteran males in this age group, and the general association between Veteran status and risk
for homelessness occurred among both sexes, despite controlling for age and race.
28 Rosenheck, R., Frisman, L., & Chung, A. M. (1994). The proportion of Veterans among homeless men. American Journal of Public Health, 84(3), 466–469.

Prevalence and Risk of Homelessness among U.S. Veterans: A Multisite Investigation
24
National Center on Homelessness among Veterans
The presence of a general cohort effect in which the cohort that is now in the 45 to 54
year age range is most at risk for homelessness is consistent with other research that has found
an aging of the homeless population since the 1980s.29,30 Culhane and Metraux theorize that
this aging is part of a more general cohort effect among the latter part of the so-called baby
boom generation, with a combination of demographic and structural factors leading to a
resurgent homeless population in the 1980s that has grown progressively older since then.31
Such a general effect also would have impacted Veterans in that age group and would explain
at least some of their increased risk for homelessness.
The presence of additional risk for homelessness specifically associated with Veteran
status is puzzling in that it occurs among a population that shows better outcomes on almost all
socioeconomic measures and that has exclusive access to an extensive system of benefits that
include comprehensive healthcare services, disability and pension assistance, and homeless
services.32 Explanations to account for this risk go beyond the basic demographic factors
explained here, and underscore the need for identifying other correlates of homelessness
among the Veteran population as the basis for prevention efforts. One promising means by
which to further those ends is the VA’s initiative to construct a registry of all Veterans who
receive homeless services as part of the VA’s five-year plan to end homelessness presented in
2009. Such a database can be linked with other VA, Department of Defense, and community-
29 Hahn, J. A., Kushel, M. B., Bangsberg, D. R., Riley, E., & Moss, A.R. (2006). The Aging of the Homeless Population: Fourteen-Year Trends in San Francisco. Journal of General Internal Medicine, 21(7), 775–778.
30 Sermons, M. W., & Henry, M. (2010). Demographics of Homelessness Series:The Rising Elderly Population. Washington DC: National Alliance to End Homelessness.
31 Culhane, D. P., Metraux, S., & Bainbridge, J. (2010). The age structure of contemporary homelessness: Risk period or cohort effect? University of Pennsylvania School of Social Policy & Practice Working Paper.
32 Rosenheck, R., Frisman, L., & Chung, A. M. (1994). The proportion of Veterans among homeless men. American Journal of Public Health, 84(3), 466–469.

25
Prevalence and Risk of Homelessness among U.S. Veterans: A Multisite Investigation
National Center on Homelessness among Veterans
based databases to provide identify profiles of persons at elevated risk for homelessness and
times of particular vulnerability.
Among females, and particularly among Black females, the youngest age groups were at
highest risk for homelessness. Given this, homelessness among female Veterans is more
temporally linked to military service when compared to their male counterparts, and is consistent
with media accounts that describe more female Veterans becoming homeless in tandem with
their increasing presence among those returning from the conflicts in Iraq and Afghanistan.33
This finding is also consistent with other research indicating that, among females in general, the
period of highest vulnerability for homelessness is during the time period when they are heading
families with young children.34 With younger cohorts most at risk, female Veterans stand to
benefit most from homelessness prevention efforts tied to reentering civilian life, and also
present the VA with the need to develop services for homeless and at-risk families. One
noteworthy response to the latter need has been the Supportive Services for Veteran Families
program (SSVF), a pilot program in which the VA has allocated $50 million to non-profits in
selected jurisdictions to provide supportive services to very low-income Veteran families
residing in or transitioning to permanent housing.
The increased vulnerability that poor Veterans have to homelessness becomes
magnified by racial disparity to the point that in the youngest age groups the number of persons
enumerated through HMIS data is over 50% of the Black male Veterans and over 30% of the
Black female Veterans living in poverty. While these rates are alarmingly high, it also suggests
that homelessness prevention activities among Veterans may be particularly effective insofar as
they can target a relatively finite poverty population and can further refine this target with a focus
on specific subgroups among the poverty population. While this study shows the potential for 33 Eckholm, E. (2007). Surge seen in number of homeless Veterans. New York Times, November 8.
34 Culhane, D. P. & Metraux S. (1999). Assessing relative risk for homeless shelter usage in New York City and Philadelphia. Population Research and Policy Review,18(3), 219–236.

Prevalence and Risk of Homelessness among U.S. Veterans: A Multisite Investigation
26
National Center on Homelessness among Veterans
using data for such targeting, future investigations of risk factors must go beyond the simple
focus on race and poverty status if they are to be effective.
The high rate of homelessness among Veterans in particular demographic subgroups
also calls attention to one of the inherent limitations in comparing HMIS and ACS data. These
data are the products of vastly different methods. One significant difference is that HMIS
estimates are based on annual data on homeless services users, whereas ACS estimates are
based on a point prevalence survey. Thus, the proportions generated by juxtaposing these two
data sources are most useful for comparison purposes and for showing how, for subgroups like
young Black Veterans, homelessness is a relatively common occurrence. Caution is warranted,
however, when literally stating the HMIS numbers as proportions of the ACS population
estimates.
The sample of seven CoCs for this study also presents limitations to comparing the
results found here with other studies. Although, aggregately, these seven CoCs accounted for
roughly 10% of the U.S. homeless population, it is still a convenience sample of urban
jurisdictions. This becomes apparent when comparing some of the nationwide proportions of
Veterans listed in the Vet-AHAR to those reported in this study. For example, male Veterans
make up 24% of the nationwide general adult male population, but only 13.4% among the
population in the communities studied here. The difference in the proportion of Veterans in the
male homeless population—17% in the Vet-AHAR and 13.5% in the present study—is less
extreme, but nonetheless noteworthy.
These differences likely contributed to the divergence in a key finding between this study
and the Vet-AHAR. Whereas this study demonstrated that male Veterans were overrepresented
among the homeless population (RR of 1.3), the Vet-AHAR found them to be underrepresented
(RR of 0.7). Difference in geographies was not the only reason for these divergent risk ratios,
however. The Vet-AHAR could not age- and race-adjust its risk assessments, meaning that it
could not take into account that the Veteran population is overrepresented in the oldest age

27
Prevalence and Risk of Homelessness among U.S. Veterans: A Multisite Investigation
National Center on Homelessness among Veterans
groups when compared to the non-Veteran population (see Table 1). The risk for homelessness
among the oldest age groups is substantially lower, which also accounts in part for the divergent
findings between this study and the Vet-AHAR. In this study, male Veterans had an unadjusted
risk ratio of 1.0, which increased to 1.3 after adjusting for the age and race imbalances.
Data limitations with respect to this study should also be taken into consideration. The
Veteran status of individuals was based on self-report and likely included persons who reported
being a Veteran but may not have been eligible for VA services, or may also have included
persons eligible for VA services that did not acknowledge Veteran status. Gamache and
colleagues, in a study of a sample of homeless Veterans treated for mental illness, found that
7% of these Veterans were ineligible for VA services due to punitive discharges.35 However,
surveys of incarcerated Veterans, a population overlapping with the homeless population, show
that approximately 20% have discharges that would render them ineligible for VA services.36 If
the proportion of homeless Veterans who are ineligible for VA services is indeed that large, this
would explain some of the association between Veteran status and increased risk for
homelessness. This topic, and the more general topic of the extent to which eligible homeless
Veterans access VA services, warrants further study.
The HMIS data are also limited in the available data fields. While the demographic
information included in the HMIS data, combined with Veteran status, offer substantial insights
into the place of Veterans in the homeless population, the range of available data fields is vastly
inadequate for understanding and eliminating homelessness among such a heterogeneous
population. Additional data fields are needed for clearer theoretical understandings of the
dynamics of homelessness, as well as for making more effective, data-driven policy decisions
towards eliminating and preventing homelessness. As more jurisdictions are able to collect data 35 Gamache, G., Rosenheck, R. A., & Tessler, R. (2000). Military discharge status of homeless Veterans with mental illness. Military Medicine, 165(11), 803–808.
36 Noonan, M. & Mumola, C. (2007). Veterans in state and federal prison, 2004. Washington, DC: U.S. Department of Justice, Office of Justice Programs, Bureau of Justice Statistics.

Prevalence and Risk of Homelessness among U.S. Veterans: A Multisite Investigation
28
National Center on Homelessness among Veterans
that are sufficiently comprehensive and uniform for comparing across geographies, local
variations in the nature and extent of homelessness can be better accommodated, and analyses
that focus only on local jurisdictions become a stronger possibility.
In conclusion, this study presents an expansive examination of Veterans, demographics,
and homelessness prevalence and risk. In doing so, this study offers evidence that supports
and expands upon prior findings on the particular vulnerabilities of Veterans to homelessness,
and showcases the possibilities for research using HMIS data. As more and richer data on
Veteran homelessness, and homelessness in general, become available through HMIS and
other administrative sources, future research will be able to further disentangle the interactions
among demographic characteristics, geographic location, and homelessness among Veterans.
This investigative approach represents a powerful tool for informing policies that can more
efficiently target resources to prevent and end homelessness among Veterans.

29
Prevalence and Risk of Homelessness among U.S. Veterans: A Multisite Investigation
National Center on Homelessness among Veterans
Tables and Figures
Table 1. Demographic and Geographic Information on Homeless Individuals from Combined and Seven Continua of Care.
HMIS Homeless Population ACS Poverty Population ACS General Population
Variable Level VeteranPopulation
Non‐Veteran Population
VeteranPopulation
Non‐Veteran Population
VeteranPopulation
Non‐Veteran Population
(n=10,726) (n=119,828) (n=63,655) (n=1,841,455) (n=1,023,515)
(n=13,684,925)
Age <29 6.8% 32.4% 6.2% 33.6% 4.3% 24.9% 30–44 24.0% 38.5% 14.2% 28.1% 15.3% 31.3%
45–54 40.8% 21.0% 20.0% 14.5% 15.0% 18.5%
55–64 23.3% 6.7% 25.5% 10.2% 25.4% 12.5%
65+ 5.1% 1.4% 34.1% 13.7% 40.1% 12.9%
Sex
Female 10.2% 48.9% 9.8% 60.2% 6.8% 54.8%
Male 89.8% 51.1% 90.2% 39.8% 93.2% 45.2%
Race
Black 46.0% 46.9% 21.2% 19.4% 11.4% 13.9%
Non‐Black 54.0% 53.1% 79.8% 80.6% 88.6% 86.1%
Continuum of
Care
Columbus OH 6.4% 4.4% 7.2% 6.1% 7.5% 5.6%
Denver CO 7.6% 3.3% 16.3% 10.6% 19.5% 13.5%
Lansing MI 2.4% 1.7% 2.0% 2.0% 1.6% 1.5%
New York City 36.5% 62.2% 35.4% 54.8% 24.5% 45.7%
Phoenix AZ 20.2% 12.3% 24.9% 16.1% 29.2% 18.7%
San Jose CA 17.5% 12.0% 5.9% 5.3% 7.6% 9.2%
Tampa FL 9.3% 4.1% 8.3% 5.1% 10.1% 5.8%
Note. Values represent % of total within each variable column-wise.

Prevalence and Risk of Homelessness among U.S. Veterans: A Multisite Investigation
30
National Center on Homelessness among Veterans
Table 2. Prevalence of Veterans among the Homeless, Poverty, and Overall Populations and Corresponding Risk Ratios for Veteran Status Among the Homeless Population Compared to Poverty and Overall Populations for Seven Continua of Care.
Prevalence of
Veterans in
Homeless Pop.
Prevalence of
Veterans in
Poverty Pop.
Risk Ratio of
Veteran Status
among the
Homeless Pop.
Compared to
Poverty Pop.
Prevalence of
Veterans in
General Pop.
Risk Ratio of
Veteran Status
among the
Homeless Pop.
Compared to
General Pop.
HV/H V/Poverty Pop.
HV/H :
V/Poverty Pop. V/General Pop.
HV/H : V/General
Pop.
Age Race Male Female Male Female Male Female Male Female Male Female
18–29 Black 3.8% 1.0% 0.9% 0.4% 4.2 2.2 1.9% 0.6% 2.0 1.7
Non‐Black 2.7% 1.0% 1.3% 0.3% 2.2 3.1 2.1% 0.5% 1.3 2.0
30–44 Black 8.2% 3.2% 5.9% 1.3% 1.4 2.5 7.3% 1.6% 1.1 1.9
Non‐Black 7.6% 1.3% 3.5% 0.4% 2.1 2.9 5.9% 0.8% 1.3 1.6
45–54 Black 21.0% 2.7% 14.7% 1.0% 1.4 2.6 14.7% 1.7% 1.4 1.6
Non‐Black 19.6% 3.1% 9.2% 1.1% 2.1 2.9 9.8% 1.2% 2.0 2.5
55–64 Black 31.9% 1.8% 20.8% 0.8% 1.5 2.3 23.0% 0.9% 1.4 1.9
Non‐Black 30.6% 3.1% 19.0% 0.6% 1.6 4.9 27.6% 1.0% 1.1 3.1
65+ Black 32.3% 1.4% 26.7% 0.5% 1.2 2.9 33.2% 0.6% 1.0 2.6
Non‐Black 33.7% 2.4% 21.9% 0.9% 1.5 2.8 45.4% 1.1% 0.7 2.1
*All Black 13.7% 2.0% 9.4% 0.8% 2.4 2.5 11.8% 1.1% 1.4 1.9
*All Non‐Black 13.4% 1.6% 7.4% 0.6% 2.0 3.1 13.6% 0.9% 1.3 2.1
**All Cases 13.6% 1.8% 7.8% 0.6% 2.1 3.0 13.4% 0.9% 1.3 2.1
Note. HV = Homeless Veteran; H = Homeless; V = Veteran; Pop. = Population. *Risk ratios are age-adjusted. **Risk ratios are both age- and race-adjusted.

31
Prevalence and Risk of Homelessness among U.S. Veterans: A Multisite Investigation
National Center on Homelessness among Veterans
Table 3. Prevalence of Homelessness among Veteran and non-Veteran Adults in the Poverty and General Populations, and Corresponding Risk Ratios, for Seven Continua of Care.
Prevalence of
Homelessness
among Veterans
in Poverty Pop.
Prevalence of
Homelessness
among Non‐
Veterans in
Poverty Pop.
Risk Ratio of
Homelessness
among
Veterans
Compared to
Non‐Veterans
(Poverty Pop.)
Prevalence of
Homelessness
among
Veterans in
General Pop.
Prevalence of
Homelessness
among Non‐
Veterans in
General Pop.
Risk Ratio of
Homelessness
among
Veterans
Compared to
Non‐Veterans
(General Pop.)
HV/V (in Poverty
Pop.)
HNV/NV (in
Poverty Pop.) HV/V : HNV/NV
HV/V (in
General Pop.)
HNV/NV (in
General Pop.) HV/V : HNV/NV
Age Race Male Female Male Female Male Female Male Female Male Female Male Female
18–29 Black 52.8% 36.3% 11.8% 15.7% 4.5 2.3 5.4% 7.9% 2.6% 4.6% 2.1 1.7
Non‐Black 7.3% 11.9% 3.3% 3.9% 2.2 3.10 0.7% 1.6% 0.5% 0.8% 1.4 2.1
30–44 Black 33.8% 35.4% 23.7% 13.8% 1.4 2.6 4.7% 6.3% 4.1% 3.2% 1.1 2.0
Non‐Black 17.2% 12.1% 7.7% 4.4% 2.2 2.8 1.0% 0.9% 0.7% 0.6% 1.3 1.5
45–54 Black 38.0% 29.1% 24.6% 10.7% 1.5 2.7 7.3% 3.2% 4.8% 2.0% 1.5 1.6
Non‐Black 21.0% 12.3% 8.7% 4.1% 2.4 3.0 1.9% 1.1% 0.9% 0.4% 2.2 2.7
55–64 Black 24.2% 9.1% 13.6% 3.7% 1.8 2.4 3.8% 1.4% 2.4% 0.7% 1.6 2.1
Non‐Black 10.5% 9.3% 5.6% 1.8% 1.9 5.2 0.6% 0.6% 0.6% 0.2% 1.1 3.3
65+ Black 4.8% 1.7% 3.6% 0.6% 1.3 2.8 0.6% 0.4% 0.6% 0.1% 1.0 3.2
Non‐Black 2.1% 0.8% 1.2% 0.3% 1.8 2.9 0.1% 0.1% 0.1% 0.0% 0.7 2.3
*All Black 26.8% 29.7% 17.7% 11.6% 2.5 2.5 4.0% 4.9% 3.4% 2.7% 1.5 2.1
*All Non‐Black 10.6% 9.2% 5.5% 3.3% 2.2 3.2 0.6% 0.8% 0.7% 0.5% 1.4 2.3
**All Cases 14.6% 15.0% 7.9% 5.1% 2.2 3.0 1.0% 1.6% 1.0% 0.8% 1.4 2.3
Note. HV = Homeless Veteran; H = Homeless; V = Veteran; Pop. = Population; HNV = Homeless non-Veteran; NV = non-Veteran. *Risk ratios are age-adjusted. **Risk ratios are both age- and race-adjusted.

Prevalence and Risk of Homelessness among U.S. Veterans: A Multisite Investigation
32
National Center on Homelessness among Veterans
Table 4. Predictors of Homelessness from a Generalized Estimating Equation (GEE) Analysis Based on Pooled HMIS and ACS General Populations from Seven Continua of Care, Stratified by Sex.
Univariate Multivariate
95% CI 95% CI
Group Predictor OR Lower Upper p OR Lower Upper p
Female Veteran 1.99 1.19 3.30 0.009 1.97 1.25 3.12 0.004
Black 5.67 4.39 7.33 <0.001 5.42 4.21 6.98 <0.001
Age Group 30–44 0.70 0.49 0.99 0.041 0.73 0.52 1.02 0.058
Age Group 45–54 0.47 0.27 0.83 0.008 0.49 0.27 0.87 0.015
Age Group 55–64 0.18 0.08 0.42 <0.001 0.19 0.08 0.46 <0.001
Age Group 65+ 0.03 0.01 0.09 <0.001 0.04 0.01 0.10 <0.001
Male Veteran 1.02 0.88 1.18 0.822 1.47 1.19 1.81 <0.001
Black 5.45 4.22 7.03 <0.001 5.38 4.17 6.94 <0.001
Age Group 30–44 1.42 1.06 1.89 0.019 1.51 1.18 1.93 <0.001
Age Group 45–54 1.84 1.17 2.90 0.008 1.85 1.18 2.88 0.007
Age Group 55–64 1.01 0.57 1.78 1.000 0.99 0.56 1.74 0.973
Age Group 65+ 0.21 0.13 0.35 <0.001 0.20 0.13 0.33 <0.001
Note. For age, 18–29 years old was the reference group.

33
Prevalence and Risk of Homelessness among U.S. Veterans: A Multisite Investigation
National Center on Homelessness among Veterans
Table 5. Predictors of Homelessness from a Generalized Estimating Equation (GEE) Analysis Based on Pooled HMIS and ACS Poverty Populations from Seven Continua of Care, Stratified by Sex.
Univariate Multivariate
95% CI 95% CI
Group Predictor OR Lower Upper p OR Lower Upper p
Female Veteran 3.28 1.94 5.54 <0.001 3.33 2.17 5.13 <0.001
Black 3.80 2.85 5.05 <0.001 3.68 2.75 4.93 <0.001
Age Group 30–44 0.99 0.60 1.64 0.967 0.99 0.61 1.62 0.976
Age Group 45–54 0.87 0.38 2.00 0.738 0.83 0.36 1.91 0.663
Age Group 55–64 0.32 0.10 1.01 0.053 0.32 0.10 0.99 0.047
Age Group 65+ 0.05 0.01 0.18 <0.001 0.05 0.01 0.18 <0.001
Male Veteran 2.00 1.76 2.28 <0.001 2.20 1.96 2.48 <0.001
Black 3.59 2.72 4.74 <0.001 3.47 2.61 4.61 <0.001
Age Group 30–44 2.36 1.64 3.41 <0.001 2.34 1.68 3.27 <0.001
Age Group 45–54 3.00 1.54 5.86 <0.001 2.65 1.41 4.97 0.002
Age Group 55–64 1.74 0.81 3.70 0.152 1.43 0.71 2.90 0.315
Age Group 65+ 0.34 0.14 0.81 0.015 0.28 0.13 0.59 <0.001
Note. For age, 18–29 years old was the reference group.

Prevalence and Risk of Homelessness among U.S. Veterans: A Multisite Investigation
34
National Center on Homelessness among Veterans
Figure 1. Risk ratios indicating whether the proportion of Veterans among the homeless population exceeds (>1.0) the proportion of Veterans among the population in poverty, stratified by age, race, and sex.

35
Prevalence and Risk of Homelessness among U.S. Veterans: A Multisite Investigation
National Center on Homelessness among Veterans
Figure 2. Risk ratios indicating whether the proportion of Veterans among the homeless population exceeds (>1.0) the proportion of Veterans among the general population, stratified by age, race, and sex.

Prevalence and Risk of Homelessness among U.S. Veterans: A Multisite Investigation
36 National Center on Homelessness among Veterans
Figure 3. Probability of homelessness among the general population as a function of Veteran status, age, race, and sex.

Prevalence and Risk of Homelessness among U.S. Veterans: A Multisite Investigation
National Center on Homelessness among Veterans 37
Figure 4. Probability of homelessness among the population in poverty as a function of Veteran status, age, race, and sex.

Prevalence and Risk of Homelessness among U.S. Veterans: A Multisite Investigation
38
National Center on Homelessness among Veterans
Appendices
Appendix A. Diagram of Procedures Used to Extrapolate Continuum of Care HMIS Data.

39
Prevalence and Risk of Homelessness among U.S. Veterans: A Multisite Investigation
National Center on Homelessness among Veterans
Appendix B. Extrapolated Counts for Each Continuum of Care for the Homeless, General, and Poverty Populations.
Table B1. Extrapolated Counts for Columbus.
Homeless ACS General Population
ACS Poverty Population
Sex Age Race Veteran Non-
Veteran Veteran Non-
Veteran Veteran Non-
Veteran Female 18-29 Black 6 458 180 22,700 65 9,445
Non-Black 2 236 365 80,115 60 19,415 30-44 Black 8 487 540 24,750 40 7,060 Non-Black 3 302 1,365 102,605 70 10,670 45-54 Black 6 219 205 14,905 0 2,715 Non-Black 3 138 1,145 65,820 65 5,015 55-64 Black 1 46 185 9,215 15 1,820 Non-Black 1 42 700 46,990 0 4,050 65+ Black 0 8 45 9,260 30 1,570 Non-Black 0 8 840 54,875 15 5,165
Male 18-29 Black 8 352 440 20,830 20 5,750 Non-Black 14 281 1,605 85,140 235 17,835 30-44 Black 93 908 2,180 19,690 595 4,075 Non-Black 67 587 11,445 97,300 410 6,390 45-54 Black 227 707 2,860 10,260 315 2,225 Non-Black 110 380 9,215 54,505 500 4,395 55-64 Black 74 145 2,895 4,285 205 780 Non-Black 57 91 16,365 27,085 685 2,220 65+ Black 14 23 3,415 2,645 395 720
Non-Black 6 18 21,225 16,215 810 1,370

Prevalence and Risk of Homelessness among U.S. Veterans: A Multisite Investigation
40
National Center on Homelessness among Veterans
Table B2. Extrapolated Counts for Denver.
Homeless ACS General Population
ACS Poverty Population
Sex Age Race Veteran Non-
Veteran Veteran Non-
Veteran Veteran Non-
Veteran Female 18-29 Black 0 175 60 11,230 0 3,480
Non-Black 3 277 1,555 215,370 95 38,020 30-44 Black 0 168 400 13,385 85 2,940 Non-Black 10 377 4,355 282,105 280 30,265 45-54 Black 3 119 330 9,580 45 1,955 Non-Black 10 192 3,465 192,510 190 12,930 55-64 Black 0 23 265 5,260 65 1,175 Non-Black 7 82 2,045 139,565 155 9,540 65+ Black 0 4 20 5,695 20 1,015 Non-Black 0 21 2,880 136,090 395 13,400
Male 18-29 Black 4 112 350 11,825 0 3,070 Non-Black 9 295 6,150 231,030 690 31,195 30-44 Black 33 206 2,395 13,345 100 1,955 Non-Black 110 763 27,125 276,885 1,480 22,575 45-54 Black 138 249 2,965 7,015 185 950 Non-Black 250 583 27,230 167,535 1,655 9,745 55-64 Black 80 73 2,625 3,220 365 835 Non-Black 144 268 50,375 86,340 1,950 6,740 65+ Black 7 1 2,565 1,560 285 470
Non-Black 18 25 62,310 42,305 2,175 3,000

41
Prevalence and Risk of Homelessness among U.S. Veterans: A Multisite Investigation
National Center on Homelessness among Veterans
Table B3. Extrapolated Counts for Lansing.
Homeless ACS General Population
ACS Poverty Population
Sex Age Race Veteran Non-
Veteran Veteran Non-
Veteran Veteran Non-
Veteran Female <29 Black 4 191 0 4,010 10 1,775
Non-Black 0 219 85 33,655 10 10,655 30-44 Black 1 225 105 2,660 15 890 Non-Black 0 213 115 23,650 25 3,155 45-54 Black 1 81 0 1,985 0 350 Non-Black 4 131 160 17,515 15 1,740 55-64 Black 3 16 15 1,050 0 195 Non-Black 5 38 205 13,500 85 1,260 65+ Black 0 5 0 1,135 0 340 Non-Black 0 8 120 15,215 15 1,925
Male <29 Black 4 98 40 3,650 0 1,170 Non-Black 14 128 630 32,045 100 7,320 30-44 Black 23 161 175 2,290 0 310 Non-Black 33 195 1,975 21,570 80 2,320 45-54 Black 52 126 450 1,205 75 405 Non-Black 48 136 2,080 13,965 210 1,420 55-64 Black 20 43 345 685 35 105 Non-Black 43 48 3,965 8,955 200 805 65+ Black 8 5 360 315 90 50
Non-Black 4 3 5,485 5,255 270 610

Prevalence and Risk of Homelessness among U.S. Veterans: A Multisite Investigation
42
National Center on Homelessness among Veterans
Table B4. Extrapolated Counts for New York City.
Homeless ACS General Population
ACS Poverty Population
Sex Age Race Veteran Non-
Veteran Veteran Non-
Veteran Veteran Non-
Veteran Female 18-29 Black 116 11,548 890 199,475 100 46,690
Non-Black 66 7,423 1,030 564,625 230 115,545 30-44 Black 285 8,131 2,320 228,435 315 45,270 Non-Black 55 5,708 1,820 774,620 235 128,140 45-54 Black 52 3,105 1,720 154,210 115 26,050 Non-Black 17 1,833 1,585 441,455 285 62,945 55-64 Black 3 692 520 114,950 35 19,760 Non-Black 7 487 905 351,005 25 53,865 65+ Black 1 146 635 136,695 120 27,540 Non-Black 3 106 2,035 480,855 250 95,200
Male 18-29 Black 226 5,370 2,340 179,260 150 32,605 Non-Black 60 4,081 5,785 554,860 515 93,440 30-44 Black 496 7,373 7,990 173,260 940 23,030 Non-Black 324 6,125 18,020 762,330 1,045 80,545 45-54 Black 876 5,799 11,620 109,185 1,875 16,210 Non-Black 381 3,211 15,865 413,670 1,835 50,475 55-64 Black 428 1,293 12,810 66,960 1,705 10,010 Non-Black 235 1,239 43,800 262,400 3,525 30,760 65+ Black 96 281 20,220 53,940 2,560 8,410
Non-Black 83 326 98,640 229,430 6,290 42,710

43
Prevalence and Risk of Homelessness among U.S. Veterans: A Multisite Investigation
National Center on Homelessness among Veterans
Table B5. Extrapolated Counts for Phoenix.
Homeless ACS General Population
ACS Poverty Population
Sex Age Race Veteran Non-
Veteran Veteran Non-
Veteran Veteran Non-
Veteran Female 18-29 Black 3 410 165 14,710 35 3,425
Non-Black 10 1,508 2,420 309,735 260 57,265 30-44 Black 14 623 655 16,495 125 2,895 Non-Black 33 2,378 5,675 385,645 330 50,250 45-54 Black 15 299 500 9,300 15 1,435 Non-Black 63 1,156 5,230 236,140 365 19,605 55-64 Black 2 82 50 6,010 0 1,060 Non-Black 15 543 2,810 187,975 175 14,785 65+ Black 0 19 80 5,685 0 740 Non-Black 3 129 4,030 231,960 405 18,990
Male <29 Black 15 397 840 16,155 45 3,410 Non-Black 46 1,156 11,790 340,235 875 48,560 30-44 Black 135 696 2,490 15,975 15 1,645 Non-Black 274 2,487 37,340 385,935 1,650 38,515 45-54 Black 250 488 3,220 7,385 445 1,225 Non-Black 640 1,770 35,185 202,150 2,515 15,625 55-64 Black 135 168 2,770 3,015 385 665 Non-Black 438 660 68,835 106,585 3,900 9,030 65+ Black 19 32 2,515 1,825 220 360
Non-Black 91 129 112,450 74,580 4,860 6,235

Prevalence and Risk of Homelessness among U.S. Veterans: A Multisite Investigation
44
National Center on Homelessness among Veterans
Table B6. Extrapolated Counts for San Jose.
Homeless ACS General Population
ACS Poverty Population
Sex Age Race Veteran Non-
Veteran Veteran Non-
Veteran Veteran Non-
Veteran Female 18-29 Black 0 208 0 4165 0 810
Non-Black 11 1121 215 126930 75 18370 30-44 Black 12 310 90 4570 0 480 Non-Black 29 2049 470 194920 0 15010 45-54 Black 23 189 65 3240 0 350 Non-Black 44 1202 920 121250 15 7540 55-64 Black 2 66 85 2155 20 275 Non-Black 15 436 780 87145 45 5620 65+ Black 2 15 0 1880 0 215 Non-Black 4 119 1675 101745 105 7140
Male 18-29 Black 6 276 50 4825 0 615 Non-Black 49 1346 1610 144545 105 15890 30-44 Black 75 571 460 5025 0 630 Non-Black 246 3094 8235 215360 515 10785 45-54 Black 198 467 835 3130 130 400 Non-Black 515 2199 9215 120980 750 6965 55-64 Black 120 163 1000 1360 0 90 Non-Black 391 807 19220 65115 995 3950 65+ Black 32 34 795 580 30 30
Non-Black 130 168 32150 47685 895 3035

45
Prevalence and Risk of Homelessness among U.S. Veterans: A Multisite Investigation
National Center on Homelessness among Veterans
Table B7. Extrapolated Counts for Tampa.
Homeless ACS General Population
ACS Poverty Population
Sex Age Race Veteran Non-
Veteran Veteran Non-
Veteran Veteran Non-
Veteran Female 18-29 Black 2 256 225 19,920 20 5,340
Non-Black 15 256 845 79,795 65 13,745 30-44 Black 14 292 835 19,865 30 4,060 Non-Black 15 406 2,100 104,880 115 12,175 45-54 Black 17 177 655 11,900 110 2,090 Non-Black 19 285 1,620 72,625 200 6,365 55-64 Black 7 52 175 7,650 45 1,085 Non-Black 5 84 1,200 58,780 50 5,110 65+ Black 0 10 95 7,425 0 1,505 Non-Black 0 16 1,040 68,390 85 6,745
Male 18-29 Black 5 129 660 17,870 25 3,350 Non-Black 20 260 3,365 82,550 180 9,735 30-44 Black 76 516 3,265 14,205 175 1,925 Non-Black 102 801 12,695 96,890 365 8,685 45-54 Black 202 482 2,570 7,960 140 955 Non-Black 221 604 12,385 59,575 665 4,660 55-64 Black 110 184 2,220 4,190 335 665 Non-Black 158 216 22,775 33,050 1,235 2,475 65+ Black 8 10 1,995 3,310 165 365
Non-Black 22 26 32,335 23,025 1,220 2,560

Prevalence and Risk of Homelessness among U.S. Veterans: A Multisite Investigation
46
National Center on Homelessness among Veterans
Appendix C. Extrapolated Counts for Combined Continua of Care for the Homeless, General, and Poverty Populations.
Table C1. Extrapolated Counts for Combined Continua of Care for the
Homeless, General, and Poverty Populations.
Homeless ACS General Population ACS Poverty Population Sex Age Race Veteran Non-Veteran Veteran Non-Veteran Veteran Non-Veteran
Female 18-29 Black 131 13,246 1,520 276,210 230 70,965 Non-Black 107 11,040 6,515 1,410,225 795 273,015 30-44 Black 334 10,236 4,945 310,160 610 63,595 Non-Black 145 11,433 15,900 1,868,425 1,055 249,665 45-54 Black 117 4,189 3,475 205,120 285 34,945 Non-Black 160 4,937 14,125 1,147,315 1,135 116,140 55-64 Black 18 977 1,295 146,290 180 25,370 Non-Black 55 1,712 8,645 884,960 535 94,230 65+ Black 3 207 875 167,775 170 32,925 Non-Black 10 407 12,620 1,089,130 1,270 148,565
Male 18-29 Black 268 6,734 4,720 254,415 240 49,970 Non-Black 212 7,547 30,935 1,470,405 2,700 223,975 30-44 Black 931 10,431 18,955 243,790 1,825 33,570 Non-Black 1,156 14,052 116,835 1,856,270 5,545 169,815 45-54 Black 1,943 7,318 24,520 146,140 3,165 22,370 Non-Black 2,165 8,883 111,175 1,032,380 8,130 93,285 55-64 Black 967 2,069 24,665 83,715 3,030 13,150 Non-Black 1,466 3,329 225,335 589,530 12,490 55,980 65+ Black 184 386 31,865 64,175 3,745 10,405 Non-Black 354 695 364,595 438,495 16,520 59,520

47
Prevalence and Risk of Homelessness among U.S. Veterans: A Multisite Investigation
National Center on Homelessness among Veterans
Table D1a. Prevalence and Risk of Veteran Homelessness for
Columbus as compared to the Veteran population.
Prevalence of Veterans in
Homeless Pop.
Prevalence of Veterans in Poverty Pop.
Risk Ratio of Homelessness
among Veterans in Poverty Pop.
Prevalence of Veterans in
General Pop.
Risk Ratio of Homelessness
among Veterans in
General Pop.
HV/H V/Poverty Pop.
HV/H : V/Poverty
Pop. V/General Pop.
HV/H : V/General
Pop. Age Race Male Female Male Female Male Female Male Female Male Female
18-29 Black 2.2% 1.3% 0.5% 0.7% 4.4 1.9 2.1% 0.8% 1.0 1.6 Non-Black 4.7% 0.8% 1.4% 0.3% 3.4 2.7 1.9% 0.5% 2.5 1.6
30-44 Black 9.3% 1.6% 12.1% 0.6% 0.8 2.7 9.9% 2.1% 0.9 0.8 Non-Black 10.2% 1.0% 6.4% 0.7% 1.6 1.4 10.5% 1.3% 1.0 0.8
45-54 Black 24.3% 2.7% 15.6% 0.2% 1.6 13.5 22.0% 1.4% 1.1 1.9 Non-Black 22.4% 2.1% 11.3% 1.3% 2.0 1.6 14.5% 1.7% 1.5 1.2
55-64 Black 33.8% 2.1% 23.2% 0.9% 1.5 2.3 40.1% 2.0% 0.8 1.1 Non-Black 38.5% 2.3% 24.3% 0.0% 1.6 NA 37.7% 1.5% 1.0 1.5
65+ Black 37.8% 0.0% 35.5% 1.9% 1.1 0.0 56.2% 0.5% 0.7 0.0 Non-Black 25.0% 0.0% 37.0% 0.3% 0.7 0.0 56.7% 1.5% 0.4 0.0
All Black 16.3% 1.7% 11.0% 0.7% 1.5 2.4 16.9% 1.4% 1.0 1.2 All Non-Black 15.8% 1.2% 7.9% 0.5% 2.0 2.4 17.6% 1.2% 0.9 1.0 All Cases 16.1% 1.5% 8.9% 0.6% 1.8 2.5 17.5% 1.3% 0.9 1.2
Note. HV = Homeless Veteran; H = Homeless; V = Veteran; Pop. = Population.

Prevalence and Risk of Homelessness among U.S. Veterans: A Multisite Investigation
48
National Center on Homelessness among Veterans
Table D1b. Prevalence and Risk of Veteran Homelessness for Columbus as compared to the non‐Veteran population.
Prevalence of
Homelessness
among
Veterans in
Poverty Pop.
Prevalence of
Homelessness
among Non‐
Veterans in
Poverty Pop.
Risk Ratio of
Homelessness
among
Veterans
Compared to
Non‐Veterans
(Poverty Pop.)
Prevalence of
Homelessness
among
Veterans in
General Pop.
Prevalence of
Homelessness
among Non‐
Veterans in
General Pop.
Risk Ratio of
Homelessness
among
Veterans
Compared to
Non‐Veterans
(General Pop.)
HV/V (in
Poverty Pop.)
HNV/NV (in
Poverty Pop.)
HV/V :
HNV/NV
HV/V (in
General Pop.)
HNV/NV (in
General Pop.)
HV/V :
HNV/NV
Age Race Male Female Male Female Male Female Male Female Male Female Male Female
18‐29 Black 28.6% 8.5% 5.8% 4.6% 4.9 1.8 1.8% 3.2% 1.7% 2.0% 1.1 1.6
Non‐Black 5.6% 3.2% 1.6% 1.2% 3.5 2.7 0.9% 0.5% 0.3% 0.3% 3.0 1.7
30‐44 Black 13.5% 16.7% 18.2% 6.5% 0.7 2.6 4.1% 1.5% 4.4% 1.9% 0.9 0.8
Non‐Black 14.0% 4.1% 8.4% 2.8% 1.7 1.5 0.6% 0.2% 0.6% 0.3% 1.0 0.7
45‐54 Black 41.9% 100.0% 24.1% 7.5% 1.7 13.3 7.4% 2.8% 6.4% 1.4% 1.2 2.0
Non‐Black 18.0% 4.4% 8.0% 2.7% 2.2 1.6 1.2% 0.3% 0.7% 0.2% 1.7 1.5
55‐64 Black 26.5% 6.2% 15.7% 2.5% 1.7 2.5 2.5% 0.5% 3.3% 0.5% 0.8 1.0
Non‐Black 7.7% 100.0% 3.9% 1.0% 2.0 100.0 0.3% 0.1% 0.3% 0.1% 1.0 1.0
65+ Black 3.4% 0.0% 3.1% 0.5% 1.1 0.0 0.4% 0.0% 0.9% 0.1% 0.4 0.0
Non‐Black 0.7% 0.0% 1.3% 0.2% 0.5 0.0 0.0% 0.0% 0.1% 0.0% 0.0 0.0
All Black 21.4% 12.3% 13.6% 5.1% 1.6 2.4 3.4% 1.8% 3.6% 1.5% 0.9 1.2
All Non‐Black 8.8% 4.1% 4.0% 1.6% 2.2 2.6 0.4% 0.2% 0.5% 0.2% 0.8 1.0
All Cases 13.8% 7.7% 7.1% 2.8% 1.9 2.8 0.9% 0.5% 1.0% 0.4% 0.9 1.2
Note. HV = Homeless Veteran; H = Homeless; V = Veteran; Pop. = Population; HNV = Homeless non-Veteran; NV = non-Veteran.

49
Prevalence and Risk of Homelessness among U.S. Veterans: A Multisite Investigation
National Center on Homelessness among Veterans
Table D2a. Prevalence and Risk of Veteran Homelessness for Denver as compared to the Veteran population.
Prevalence of
Veterans in
Homeless Pop.
Prevalence of
Veterans in
Poverty Pop.
Risk Ratio of
Homelessness
among
Veterans in
Poverty Pop.
Prevalence of
Veterans in
General Pop.
Risk Ratio of
Homelessness
among Veterans
in General Pop.
HV/H V/Poverty Pop.
HV/H :
V/Poverty
Pop. V/General Pop.
HV/H :
V/General Pop.
Age Race Male Female Male Female Male Female Male Female Male Female
18‐29 Black 3.4% 0.0% 0.1% 0.0% 34.0 0.0 2.9% 0.5% 1.2 0.0
Non‐Black 3.0% 1.1% 2.2% 0.3% 1.4 3.7 2.6% 0.7% 1.2 1.6
30‐44 Black 13.8% 0.0% 5.8% 2.7% 2.4 0.0 15.2% 2.9% 0.9 0.0
Non‐Black 12.6% 2.6% 6.4% 0.9% 2.0 2.9 8.9% 1.5% 1.4 1.7
45‐54 Black 35.7% 2.5% 21.2% 2.3% 1.7 1.1 29.9% 3.3% 1.2 0.8
Non‐Black 30.0% 5.0% 15.6% 1.5% 1.9 3.3 14.0% 1.8% 2.1 2.8
55‐64 Black 52.3% 0.0% 32.9% 5.1% 1.6 0.0 45.1% 4.8% 1.2 0.0
Non‐Black 35.0% 7.9% 23.0% 1.7% 1.5 4.6 36.8% 1.4% 1.0 5.6
65+ Black 87.5% 0.0% 38.3% 1.9% 2.3 0.0 62.2% 0.3% 1.4 0.0
Non‐Black 41.9% 0.0% 42.0% 2.9% 1.0 0.0 59.6% 2.1% 0.7 0.0
All Black 29.0% 0.6% 13.1% 1.9% 2.2 0.3 22.9% 2.3% 1.3 0.3
All Non‐Black 21.5% 3.1% 10.1% 1.1% 2.1 2.8 17.7% 1.5% 1.2 2.1
All Cases 23.5% 2.2% 10.4% 1.2% 2.3 1.8 18.0% 1.5% 1.3 1.5
Note. HV = Homeless Veteran; H = Homeless; V = Veteran; Pop. = Population.

Prevalence and Risk of Homelessness among U.S. Veterans: A Multisite Investigation
50
National Center on Homelessness among Veterans
Table D2b. Prevalence and Risk of Veteran Homelessness for Denver as compared to the non‐Veteran population.
Prevalence of
Homelessness
among Veterans
in Poverty Pop.
Prevalence of
Homelessness
among Non‐
Veterans in
Poverty Pop.
Risk Ratio of
Homelessness
among
Veterans
Compared to
Non‐Veterans
(Poverty Pop.)
Prevalence of
Homelessness
among
Veterans in
General Pop.
Prevalence of
Homelessness
among Non‐
Veterans in
General Pop.
Risk Ratio of
Homelessness
among
Veterans
Compared to
Non‐Veterans
(General Pop.)
HV/V (in Poverty
Pop.)
HNV/NV (in
Poverty Pop.)
HV/V : HNV/NV HV/V (in
General Pop.)
HNV/NV (in
General Pop.)
HV/V :
HNV/NV
Age Race Male Female Male Female Male Female Male Female Male Female Male Female
18‐29 Black 100.0% 0.0% 3.5% 4.8% 28.6 0.0 1.1% 0.0% 0.9% 1.5% 1.2 0.0
Non‐Black 1.3% 3.1% 0.9% 0.7% 1.4 4.4 0.1% 0.2% 0.1% 0.1% 1.0 2.0
30‐44 Black 24.8% 0.0% 9.5% 5.4% 2.6 0.0 1.4% 0.0% 1.5% 1.2% 0.9 0.0
Non‐Black 6.9% 3.4% 3.3% 1.2% 2.1 2.8 0.4% 0.2% 0.3% 0.1% 1.3 2.0
45‐54 Black 42.7% 6.2% 20.8% 5.7% 2.1 1.1 4.4% 0.9% 3.4% 1.2% 1.3 0.8
Non‐Black 13.1% 5.0% 5.6% 1.5% 2.3 3.3 0.9% 0.3% 0.3% 0.1% 3.0 3.0
55‐64 Black 18.0% 0.0% 8.0% 1.9% 2.2 0.0 3.0% 0.0% 2.2% 0.4% 1.4 0.0
Non‐Black 6.9% 4.3% 3.8% 0.9% 1.8 4.8 0.3% 0.3% 0.3% 0.1% 1.0 3.0
65+ Black 2.4% 0.0% 0.2% 0.4% 12.0 0.0 0.3% 0.0% 0.1% 0.1% 3.0 0.0
Non‐Black 0.8% 0.0% 0.8% 0.2% 1.0 0.0 0.0% 0.0% 0.1% 0.0% 0.0 0.0
All Black 21.9% 1.4% 8.1% 4.4% 2.7 0.3 2.3% 0.3% 1.7% 1.1% 1.4 0.3
All Non‐Black 6.3% 2.6% 2.6% 0.9% 2.4 2.9 0.3% 0.2% 0.2% 0.1% 1.5 2.0
All Cases 8.2% 2.4% 3.1% 1.2% 2.6 2.0 0.4% 0.2% 0.3% 0.1% 1.3 2.0
Note. HV = Homeless Veteran; H = Homeless; V = Veteran; Pop. = Population; HNV = Homeless non-Veteran; NV = non-Veteran.

51
Prevalence and Risk of Homelessness among U.S. Veterans: A Multisite Investigation
National Center on Homelessness among Veterans
Table D3a. Prevalence and Risk of Veteran Homelessness for Lansing
as compared to the Veteran population.
Prevalence of
Veterans in
Homeless Pop.
Prevalence of
Veterans in
Poverty Pop.
Risk Ratio of
Homelessness
among
Veterans in
Poverty Pop.
Prevalence of
Veterans in
General Pop.
Risk Ratio of
Homelessness
among
Veterans in
General Pop.
HV/H V/Poverty Pop.
HV/H :
V/Poverty
Pop. V/General Pop.
HV/H :
V/General
Pop.
Age Race Male Female Male Female Male Female Male Female Male Female
18‐29 Black 3.9% 2.1% 0.3% 0.7% 13.0 3.0 1.2% 0.1% 3.2 21.0
Non‐Black 9.9% 0.0% 1.5% 0.1% 6.6 0.0 2.0% 0.3% 5.0 0.0
30‐44 Black 12.5% 0.4% 4.7% 1.4% 2.7 0.3 7.5% 3.5% 1.7 0.1
Non‐Black 14.5% 0.0% 4.3% 0.7% 3.4 0.0 8.4% 0.5% 1.7 0.0
45‐54 Black 29.2% 1.2% 19.3% 0.2% 1.5 6.0 27.4% 0.0% 1.1 NA
Non‐Black 26.1% 3.0% 14.2% 1.0% 1.8 3.0 13.1% 0.9% 2.0 3.3
55‐64 Black 31.7% 15.8% 27.1% 1.4% 1.2 11.3 33.4% 1.7% 0.9 9.3
Non‐Black 47.3% 11.6% 22.2% 6.5% 2.1 1.8 30.8% 1.5% 1.5 7.7
65+ Black 61.5% 0.0% 64.1% 0.0% 1.0 0.0 53.5% 0.0% 1.1 0.0
Non‐Black 57.1% 0.0% 30.9% 0.8% 1.8 0.0 51.1% 0.8% 1.1 0.0
All Black 19.8% 1.7% 11.0% 0.8% 1.8 2.1 14.7% 1.1% 1.3 1.5
All Non‐Black 21.8% 1.5% 7.2% 0.8% 3.0 1.9 14.8% 0.7% 1.5 2.1
All Cases 20.9% 1.6% 7.8% 0.8% 2.7 2.0 14.8% 0.7% 1.4 2.3
Note. HV = Homeless Veteran; H = Homeless; V = Veteran; Pop. = Population.

Prevalence and Risk of Homelessness among U.S. Veterans: A Multisite Investigation
52
National Center on Homelessness among Veterans
Table D3b. Prevalence and Risk of Veteran Homelessness for Lansing as compared to the non‐Veteran population.
Prevalence of
Homelessness
among Veterans
in Poverty Pop.
Prevalence of
Homelessness
among Non‐
Veterans in
Poverty Pop.
Risk Ratio of
Homelessness
among
Veterans
Compared to
Non‐Veterans
(Poverty Pop.)
Prevalence of
Homelessness
among Veterans
in General Pop.
Prevalence of
Homelessness
among Non‐
Veterans in
General Pop.
Risk Ratio of
Homelessness
among
Veterans
Compared to
Non‐Veterans
(General Pop.)
HV/V (in Poverty
Pop.)
HNV/NV (in
Poverty Pop.) HV/V : HNV/NV
HV/V (in
General Pop.)
HNV/NV (in
General Pop.)
HV/V :
HNV/NV
Age Race Male Female Male Female Male Female Male Female Male Female Male Female
18‐29 Black 100.0% 28.6% 7.7% 9.7% 13.0 2.9 9.1% 100.0% 2.6% 4.5% 3.5 22.2
Non‐Black 12.3% 0.0% 1.7% 2.0% 7.2 0.0 2.2% 0.0% 0.4% 0.6% 5.5 0.0
30‐44 Black 100.0% 6.2% 34.2% 20.2% 2.9 0.3 11.6% 0.9% 6.6% 7.8% 1.8 0.1
Non‐Black 29.2% 0.0% 7.8% 6.3% 3.7 0.0 1.6% 0.0% 0.9% 0.9% 1.8 0.0
45‐54 Black 40.9% 100.0% 23.7% 18.8% 1.7 5.3 10.4% 100.0% 9.5% 3.9% 1.1 25.6
Non‐Black 18.6% 21.1% 8.7% 7.0% 2.1 3.0 2.3% 2.4% 1.0% 0.7% 2.3 3.4
55‐64 Black 36.4% 100.0% 29.1% 7.6% 1.3 13.2 5.5% 16.7% 5.9% 1.5% 0.9 11.1
Non‐Black 17.7% 5.6% 5.6% 2.9% 3.2 1.9 1.1% 2.4% 0.5% 0.3% 2.2 8.0
65+ Black 8.2% 0.0% 9.1% 1.4% 0.9 0.0 2.2% 0.0% 1.6% 0.4% 1.4 0.0
Non‐Black 1.5% 0.0% 0.5% 0.4% 3.0 0.0 0.1% 0.0% 0.1% 0.1% 1.0 0.0
All Black 34.9% 26.5% 17.5% 12.7% 2.0 2.1 7.2% 7.0% 5.0% 4.6% 1.4 1.5
All Non‐Black 14.2% 5.7% 3.9% 3.1% 3.6 1.8 1.0% 1.3% 0.6% 0.6% 1.7 2.2
All Cases 19.0% 9.3% 6.1% 4.8% 3.1 1.9 1.6% 2.2% 1.0% 1.0% 1.6 2.2
Note. HV = Homeless Veteran; H = Homeless; V = Veteran; Pop. = Population; HNV = Homeless non-Veteran; NV = non-Veteran.

53
Prevalence and Risk of Homelessness among U.S. Veterans: A Multisite Investigation
National Center on Homelessness among Veterans
Table D4a. Prevalence and Risk of Veteran Homelessness for New York City
as compared to the Veteran population.
Prevalence of
Veterans in
Homeless Pop.
Prevalence of
Veterans in
Poverty Pop.
Risk Ratio of
Homelessness
among Veterans
in Poverty Pop.
Prevalence of
Veterans in
General Pop.
Risk Ratio of
Homelessness
among
Veterans in
General Pop.
HV/H V/Poverty Pop.
HV/H :
V/Poverty Pop. V/General Pop.
HV/H :
V/General
Pop.
Age Race Male Female Male Female Male Female Male Female Male Female
18‐29 Black 4.0% 1.0% 1.0% 0.4% 4.0 2.5 1.4% 0.5% 2.9 2.0
Non‐Black 1.4% 0.9% 0.6% 0.2% 2.3 5.0 1.0% 0.2% 1.4 4.5
30‐44 Black 6.3% 3.4% 4.5% 1.1% 1.4 3.1 4.5% 1.1% 1.4 3.1
Non‐Black 5.0% 1.0% 1.6% 0.2% 3.1 4.5 2.3% 0.2% 2.2 5.0
45‐54 Black 15.4% 1.6% 11.6% 0.6% 1.3 2.7 9.9% 1.1% 1.6 1.5
Non‐Black 10.6% 0.9% 4.0% 0.5% 2.6 1.8 3.8% 0.4% 2.8 2.2
55‐64 Black 24.9% 0.4% 15.9% 0.2% 1.6 2.0 16.3% 0.5% 1.5 0.8
Non‐Black 15.9% 1.4% 10.5% 0.1% 1.5 14.0 14.3% 0.3% 1.1 4.7
65+ Black 25.5% 0.7% 23.4% 0.4% 1.1 1.7 27.3v 0.5% 0.9 1.4
Non‐Black 20.3% 2.8% 12.9% 0.3% 1.6 9.3 30.1% 0.4% 0.7 0.7
All Black 10.0% 1.9% 7.9% 0.6% 1.3 3.2 8.7% 0.8% 1.1 2.4
All Non‐Black 6.7% 0.9% 4.4% 0.2% 1.5 4.5 7.6% 0.3% 0.9 3.0
All Cases 8.6% 1.5% 5.3% 0.4% 1.6 5.0 7.8% 0.4% 1.1 3.8
Note. HV = Homeless Veteran; H = Homeless; V = Veteran; Pop. = Population.

Prevalence and Risk of Homelessness among U.S. Veterans: A Multisite Investigation
54
National Center on Homelessness among Veterans
Table D4b. Prevalence and Risk of Veteran Homelessness for New York City as compared to the non‐Veteran population.
Prevalence of
Homelessness
among Veterans
in Poverty Pop.
Prevalence of
Homelessness
among Non‐
Veterans in
Poverty Pop.
Risk Ratio of
Homelessness
among
Veterans
Compared to
Non‐Veterans
(Poverty Pop.)
Prevalence of
Homelessness
among
Veterans in
General Pop.
Prevalence of
Homelessness
among Non‐
Veterans in
General Pop.
Risk Ratio of
Homelessness
among
Veterans
Compared to
Non‐Veterans
(General Pop.)
HV/V (in Poverty
Pop.)
HNV/NV (in
Poverty Pop.) HV/V : HNV/NV
HV/V (in
General Pop.)
HNV/NV (in
General Pop.) HV/V : HNV/NV
Age Race Male Female Male Female Male Female Male Female Male Female Male Female
18‐29 Black 60.1% 53.7% 14.1% 19.8% 4.3 2.7 8.8% 11.5 % 2.9% 5.5% 3.0 2.1
Non‐Black 10.4% 22.3% 4.2% 6.0% 2.5 3.7 1.1% 6.0% 0.7% 1.3% 1.4 4.6
30‐44 Black 34.5% 47.5% 24.3% 15.2% 1.4 3.1 6.1% 11.3% 4.1% 3.4% 1.4 3.2
Non‐Black 23.7% 19.0% 7.1% 4.3% 3.3 4.4 1.8% 3.0% 0.8% 0.7% 2.2 4.1
45‐54 Black 31.8% 31.1% 22.8% 10.6% 1.4 2.9 7.3% 3.0% 4.2% 2.0% 1.7 1.4
Non‐Black 17.2% 5.6% 6.0% 2.8% 2.9 2.0 2.4% 1.1% 0.8% 0.4% 2.9 2.8
55‐64 Black 20.1% 7.9% 11.4% 3.4% 1.8 2.3 3.4% 0.8% 1.9% 0.6% 1.7 1.0
Non‐Black 6.2% 21.9% 3.9% 0.9% 1.6 24.3 0.6% 0.8% 0.5% 0.1% 1.0 8.0
65+ Black 3.8% 0.8% 3.2% 0.5% 1.1 1.6 0.5% 0.2% 0.5% 0.1% 1.0 2.0
Non‐Black 1.3% 1.2% 0.8% 0.1% 1.6 1.0 0.1% 0.2% 0.1% 0.0% 1.0 NA
All Black 23.5% 41.1% 18.1% 13.0% 1.3 3.2 3.9% 7.3% 3.2% 2.8% 1.2 2.5
All Non‐Black 7.9% 13.1% 5.0% 3.4% 1.6 3.9 0.6% 2.1% 0.7% 0.6% 0.9 3.3
All Cases 14.1% 27.0% 8.4% 6.2% 1.7 4.4 1.4% 4.5% 1.2% 1.1% 1.1 3.9
Note. HV = Homeless Veteran; H = Homeless; V = Veteran; Pop. = Population; HNV = Homeless non-Veteran; NV = non-Veteran.

55
Prevalence and Risk of Homelessness among U.S. Veterans: A Multisite Investigation
National Center on Homelessness among Veterans
Table D5a. Prevalence and Risk of Veteran Homelessness for Phoenix as compared to the Veteran population.
Prevalence of Veterans in
Homeless Pop.
Prevalence of Veterans in Poverty Pop.
Risk Ratio of Homelessness
among Veterans in Poverty Pop.
Prevalence of Veterans in
General Pop.
Risk Ratio of Homelessness
among Veterans in
General Pop.
HV/H V/Poverty Pop.
HV/H : V/Poverty
Pop. V/General Pop.
HV/H : V/General
Pop. Age Race Male Female Male Female Male Female Male Female Male Female
18-29 Black 3.6% 0.7% 1.6% 1.0% 2.2 0.7 4.9% 1.1% 0.7 0.6 Non-Black 3.8% 0.7% 1.8% 0.5% 2.1 1.4 3.4% 0.8% 1.1 0.9
30-44 Black 16.2% 2.2% 6.0% 3.8% 2.7 0.6 13.6% 3.8% 1.2 0.6 Non-Black 9.9% 1.4% 4.5% 0.7% 2.2 2.0 8.8% 1.4% 1.1 1.0
45-54 Black 33.9% 4.8% 28.9% 1.7% 1.2 2.8 30.6% 5.1% 1.1 0.9 Non-Black 26.6% 5.2% 15.4% 2.0% 1.7 2.6 14.9% 2.2% 1.8 2.4
55-64 Black 44.6% 2.4% 38.4% 0.2% 1.2 12.0 47.7% 0.8% 0.9 3.0 Non-Black 39.9% 2.7% 30.9% 1.2% 1.3 2.3 39.2% 1.5% 1.0 1.8
65+ Black 37.3% 0.0% 37.9% 0.0% 1.0 0.0 57.7% 1.4% 0.6 0.0 Non-Black 41.4% 2.3% 43.8% 2.1% 0.9 1.1 60.1% 1.7% 0.7 1.4
All Black 23.7% 2.3% 15.5% 1.9% 1.5 1.2 21.2% 2.7% 1.1 0.9 All Non-Black 19.4% 2.1% 11.0% 1.0% 1.8 2.1 19.3% 1.5% 1.0 1.4 All Cases 20.4% 2.2% 11.3% 1.0% 1.8 2.2 19.4% 1.5% 1.1 1.5
Note. HV = Homeless Veteran; H = Homeless; V = Veteran; Pop. = Population.

Prevalence and Risk of Homelessness among U.S. Veterans: A Multisite Investigation
56
National Center on Homelessness among Veterans
Note. HV = Homeless Veteran; H = Homeless; V = Veteran; Pop. = Population; HNV = Homeless non-Veteran; NV = non-Veteran.
Table D5b. Prevalence and Risk of Veteran Homelessness for Phoenix as compared to the non‐Veteran population.
Prevalence of
Homelessness
among Veterans
in Poverty Pop.
Prevalence of
Homelessness
among Non‐
Veterans in
Poverty Pop.
Risk Ratio of
Homelessness
among
Veterans
Compared to
Non‐Veterans
(Poverty Pop.)
Prevalence of
Homelessness
among
Veterans in
General Pop.
Prevalence of
Homelessness
among Non‐
Veterans in
General Pop.
Risk Ratio of
Homelessness
among
Veterans
Compared to
Non‐Veterans
(General Pop.)
HV/V (in Poverty
Pop.)
HNV/NV (in
Poverty Pop.)
HV/V : HNV/NV HV/V (in
General Pop.)
HNV/NV (in
General Pop.)
HV/V : HNV/NV
Age Race Male Female Male Female Male Female Male Female Male Female Male Female
18‐29 Black 25.0% 7.9% 10.4% 10.7% 2.4 0.7 1.8% 1.8% 2.4% 2.7% 0.8 0.7
Non‐Black 5.0% 3.7% 2.3% 2.6% 2.2 1.4 0.4% 0.4% 0.3% 0.5% 1.3 0.8
30‐44 Black 90.0% 10.1% 29.7% 17.7% 3.0 0.6 5.1% 2.1% 4.2% 3.6% 1.2 0.6
Non‐Black 14.2% 9.1% 6.1% 4.5% 2.3 2.0 0.7% 0.6% 0.6% 0.6% 1.2 1.0
45‐54 Black 36.0% 50.0% 28.5% 17.2% 1.3 2.9 7.2% 2.9% 6.2% 3.1% 1.2 0.9
Non‐Black 20.3% 14.7% 10.2% 5.6% 2.0 2.6 1.8% 1.2% 0.9% 0.5% 2.0 2.4
55‐64 Black 26.0% 100.0% 20.2% 7.2% 1.3 13.9 4.6% 3.8% 5.3% 1.3% 0.9 2.9
Non‐Black 10.1% 7.9% 6.8% 3.5% 1.5 2.3 0.6% 0.5% 0.6% 0.3% 1.0 1.7
65+ Black 7.9% 0.0% 8.2% 2.5% 1.0 0.0 0.7% 0.0% 1.7% 0.3% 0.4 0.0
Non‐Black 1.8% 0.7% 2.0% 0.7% 0.9 1.0 0.1% 0.1% 0.2% 0.1% 0.5 1.0
All Black 33.3% 16.3% 19.6% 13.0% 1.7 1.3 4.5% 2.3% 3.9% 2.7% 1.2 0.9
All Non‐Black 9.7% 7.5% 5.0% 3.4% 1.9 2.2 0.6% 0.6% 0.6% 0.4% 1.0 1.5
All Cases 12.1% 8.5% 6.0% 4.0% 2.0 2.1 0.7% 0.7% 0.7% 0.5% 1.0 1.4

57
Prevalence and Risk of Homelessness among U.S. Veterans: A Multisite Investigation
National Center on Homelessness among Veterans
Table D6a. Prevalence and Risk of Veteran Homelessness for San Jose as compared to the Veteran population.
Prevalence of
Veterans in
Homeless Pop.
Prevalence of
Veterans in
Poverty Pop.
Risk Ratio of
Homelessness
among
Veterans in
Poverty Pop.
Prevalence of
Veterans in
General Pop.
Risk Ratio of
Homelessness
among
Veterans in
General Pop.
HV/H V/Poverty Pop.
HV/H :
V/Poverty Pop. V/General Pop.
HV/H :
V/General Pop.
Age Race Male Female Male Female Male Female Male Female Male Female
18‐29 Black 2.1% 0.0% 0.7% 0.0% 3.0 0.0 1.1% 0.0% 1.9 0.0
Non‐Black 3.5% 1.0% 0.9% 0.4% 3.9 2.5 1.1% 0.2% 3.2 5.0
30‐44 Black 11.6% 3.7% 5.9% 1.5% 2.0 2.5 8.7% 2.0% 1.3 1.8
Non‐Black 7.4% 1.4% 5.2% 0.2% 1.4 7.0 3.7% 0.3% 2.0 4.7
45‐54 Black 29.8% 10.8% 27.4% 4.1% 1.1 2.6 22.3% 2.5% 1.3 4.3
Non‐Black 19.0% 3.5% 12.1% 0.7% 1.6 5.0 7.3% 0.8% 2.6 4.4
55‐64 Black 42.4% 2.9% 32.2% 6.1% 1.3 0.5 42.4% 3.8% 1.0 0.8
Non‐Black 32.6% 3.3% 22.6% 1.0% 1.4 3.3 22.9% 0.9% 1.4 3.7
65+ Black 48.5% 11.8% 49.2% 0.9% 1.0 13.1 57.4% 0.1% 0.8 118.0
Non‐Black 43.6% 3.3% 24.2% 1.5% 1.8 2.2 40.3% 1.6% 1.1 2.1
All Black 22.2% 4.7% 15.3% 2.0% 1.5 2.4 17.9% 1.6% 1.2 2.9
All Non‐Black 14.9% 2.0% 8.7% 0.6% 1.7 3.3 10.7% 0.6v 1.4 3.3
All Cases 16.2% 2.4% 9.1% 0.6% 1.8 4.0 10.9% 0.7% 1.5 3.4
Note. HV = Homeless Veteran; H = Homeless; V = Veteran; Pop. = Population.

Prevalence and Risk of Homelessness among U.S. Veterans: A Multisite Investigation
58
National Center on Homelessness among Veterans
Note. HV = Homeless Veteran; H = Homeless; V = Veteran; Pop. = Population; HNV = Homeless non-Veteran; NV = non-Veteran.
Table D6b. Prevalence and Risk of Veteran Homelessness for San Jose Tampa as compared to the non‐Veteran population.
Prevalence of
Homelessness
among Veterans
in Poverty Pop.
Prevalence of
Homelessness
among Non‐
Veterans in
Poverty Pop.
Risk Ratio of
Homelessness
among
Veterans
Compared to
Non‐Veterans
(Poverty Pop.)
Prevalence of
Homelessness
among Veterans
in General Pop.
Prevalence of
Homelessness
among Non‐
Veterans in
General Pop.
Risk Ratio of
Homelessness
among
Veterans
Compared to
Non‐Veterans
(General Pop.)
HV/V (in Poverty
Pop.)
HNV/NV (in
Poverty Pop.)
HV/V :
HNV/NV
HV/V (in
General Pop.)
HNV/NV (in
General Pop.)
HV/V :
HNV/NV
Age Race Male Female Male Female Male Female Male Female Male Female Male Female
18‐29 Black 100.0% 0.0% 31.0% 20.4% 3.2 0.0 10.7% 0.0% 5.4% 4.8% 2.0 0.0
Non‐Black 31.8% 12.8% 7.8% 5.8% 4.1 2.2 3.0% 4.9% 0.9% 0.9% 3.3 5.4
30‐44 Black 100.0% 100.0% 47.5% 39.2% 2.1 2.6 14.0% 11.8% 10.2% 6.4% 1.4 1.8
Non‐Black 32.3% 100.0% 22.3% 12.0% 1.4 8.3 2.9% 5.8% 1.4% 1.0% 2.1 5.8
45‐54 Black 60.4% 100.0% 53.9% 35.1% 1.1 2.8 19.2% 26.1% 13.0% 5.5% 1.5 4.7
Non‐Black 40.7% 74.6% 24.0% 13.7% 1.7 5.4 5.3% 4.6% 1.8% 1.0% 2.9 4.6
55‐64 Black 100.0% 9.1% 64.4% 19.4% 1.6 0.5 10.7% 2.3% 10.7% 3.0% 1.0 0.8
Non‐Black 28.2% 25.0% 17.0% 7.2% 1.7 3.5 2.0% 1.9% 1.2% 0.5% 1.7 3.8
65+ Black 51.6% 100.0% 53.1% 6.5% 1.0 15.4 3.9% 100.0% 5.5% 0.8% 0.7 125.0
Non‐Black 12.7% 3.7% 5.2% 1.6% 2.4 2.3 0.4% 0.2% 0.4% 0.1% 1.0 2.0
All Black 72.9% 66.1% 46.1% 27.0% 1.6 2.4 12.1% 14.0% 9.2% 4.7% 1.3 3.0
All Non‐Black 29.0% 30.0% 15.8% 8.4% 1.8 3.6 1.9% 2.5% 1.3% 0.8% 1.5 3.1
All Cases 34.0% 35.3% 17.7% 9.3% 1.9 3.8 2.3% 3.2% 1.5% 0.9% 1.5 3.6

59
Prevalence and Risk of Homelessness among U.S. Veterans: A Multisite Investigation
National Center on Homelessness among Veterans
Note. HV = Homeless Veteran; H = Homeless; V = Veteran; Pop. = Population; HNV = Homeless non-Veteran; NV =non-Veteran.
Table D7a. Prevalence and Risk of Veteran Homelessness for Tampa as compared to the Veteran population.
Prevalence of
Veterans in
Homeless Pop.
Prevalence of
Veterans in
Poverty Pop.
Risk Ratio of
Homelessness
among Veterans
in Poverty Pop.
Prevalence of
Veterans in General
Pop.
Risk Ratio of
Homelessness
among Veterans
in General Pop.
HV/H V/Poverty Pop.
HV/H :
V/Poverty Pop. V/General Pop.
HV/H : V/General
Pop.
Age Race Male Female Male Female Male Female Male Female Male Female
18‐29 Black 3.7% 0.8% 0.9% 0.4% 4.1 2.0 3.6% 1.1% 1.0 0.7
Non‐Black 7.1% 5.5% 2.0% 0.6% 3.5 9.2 3.9% 1.1% 1.8 5.0
30‐44 Black 12.8% 4.6% 9.3% 1.0% 1.4 4.6 18.5% 4.0% 0.7 1.1
Non‐Black 11.3% 3.6% 4.7% 1.0% 2.4 3.6 11.6% 2.0% 1.0 1.8
45‐54 Black 29.5% 8.8% 19.2% 5.3% 1.5 1.7 24.7% 5.3% 1.2 1.7
Non‐Black 26.8% 6.2% 14.4% 3.2% 1.9 1.9 17.3% 2.2% 1.5 2.8
55‐64 Black 37.4% 11.9% 34.4% 4.4% 1.1 2.7 34.8% 2.3% 1.1 5.2
Non‐Black 42.2% 5.6% 34.1% 1.0% 1.2 5.6 40.8% 2.0% 1.0 2.8
65+ Black 44.4% 0.0% 31.6% 0.0% 1.4 0.0 37.6% 1.3% 1.2 0.0
Non‐Black 45.8% 0.0% 32.4% 1.2% 1.4 0.0 58.4% 1.5% 0.8 0.0
All Black 23.3% 4.8% 12.6% 1.6% 1.8 3.0 18.5% 2.9% 1.3 1.7
All Non‐Black 21.5% 4.9% 12.2% 1.2% 1.8 4.1 22.1% 1.7% 1.0 2.9
All Cases 22.3% 4.9% 12.3% 1.3% 1.8 3.8 21.6% 1.9% 1.0 2.6

Prevalence and Risk of Homelessness among U.S. Veterans: A Multisite Investigation
60
National Center on Homelessness among Veterans
Table D7b. Prevalence and Risk of Veteran Homelessness for Tampa as compared to the non‐Veteran population.
Prevalence of
Homelessness
among Veterans
in Poverty Pop.
Prevalence of
Homelessness
among Non‐
Veterans in
Poverty Pop.
Risk Ratio of
Homelessness
among
Veterans
Compared to
Non‐Veterans
(Poverty Pop.)
Prevalence of
Homelessness
among
Veterans in
General Pop.
Prevalence of
Homelessness
among Non‐
Veterans in
General Pop.
Risk Ratio of
Homelessness
among
Veterans
Compared to
Non‐Veterans
(General Pop.)
HV/V (in Poverty
Pop.)
HNV/NV (in
Poverty Pop.) HV/V : HNV/NV
HV/V (in
General Pop.)
HNV/NV (in
General Pop.)
HV/V :
HNV/NV
Age Race Male Female Male Female Male Female Male Female Male Female Male Female
18‐29 Black 16.7% 9.1% 3.7% 4.6% 4.5 2.0 0.8% 0.9% 0.7% 1.3% 1.1 0.7
Non‐Black 10.0% 18.8% 2.6% 1.8% 3.8 10.4 0.6% 1.7% 0.3% 0.3% 2.0 5.7
30‐44 Black 30.3% 31.8% 21.1% 6.7% 1.4 4.7 2.3% 1.6% 3.5% 1.4% 0.7 1.1
Non‐Black 21.8% 11.5% 8.4% 3.2% 2.6 3.6 0.8% 0.7% 0.8% 0.4% 1.0 1.7
45‐54 Black 59.1% 13.4% 33.5% 7.8% 1.8 1.7 7.3% 2.5% 5.7% 1.5% 1.3 1.7
Non‐Black 24.9% 8.7% 11.5% 4.3% 2.2 2.0 1.8% 1.2% 1.0% 0.4% 1.8 3.0
55‐64 Black 24.7% 13.5% 21.7% 4.6% 1.1 2.9 4.7% 3.8% 4.2% 0.7% 1.1 5.4
Non‐Black 11.3% 9.1% 8.0% 1.6% 1.4 5.7 0.7% 0.4% 0.6% 0.1% 1.2 4.0
65+ Black 4.6% 0.0% 2.7% 0.7% 1.7 0.0 0.4% 0.0% 0.3% 0.1% 1.3 0.0
Non‐Black 1.8% 0.0% 1.0% 0.2% 1.8 0.0 0.1% 0.0% 0.1% 0.0% 1.0 0.0
All Black 32.3% 16.3% 15.4% 5.3% 2.1 3.1 3.6% 2.0% 2.7% 1.2% 1.3 1.7
All Non‐Black 12.5% 9.5% 6.4% 2.3% 2.0 4.1 0.6% 0.8% 0.6% 0.3% 1.0 2.7
All Cases 17.0% 11.5% 8.4% 3.1% 2.0 3.7 1.0% 1.1% 0.9% 0.4% 1.1 2.8
Note. HV = Homeless Veteran; H = Homeless; V = Veteran; Pop. = Population; HNV = Homeless non veteran; NV = non veteran

61
Prevalence and Risk of Homelessness among U.S. Veterans: A Multisite Investigation
National Center on Homelessness among Veterans
Appendix E. Figure Illustrating Risk of Veteran Homelessness for Each Continuum of Care by Age, Sex, and Race within the General Population.
Risk ratios for each Continuum of Care indicating whether the proportion of Veterans among the homeless population exceeds (>1.0) the proportion of Veterans among the general population, stratified by age, race, and sex.

Prevalence and Risk of Homelessness among U.S. Veterans: A Multisite Investigation
62
National Center on Homelessness among Veterans
Appendix F. Figure Illustrating Risk of Veteran Homelessness for Each Continuum of Care by Age, Sex, and Race within the Population in Poverty.
Risk ratios for each Continuum of Care indicating whether the proportion of Veterans among the homeless population exceeds (>1.0) the proportion of Veterans among the population in poverty, stratified by age, race, and sex.

63
Prevalence and Risk of Homelessness among U.S. Veterans: A Multisite Investigation
National Center on Homelessness among Veterans
Appendix G. Logistic Regression Analyses Predicting Homelessness for Each Continuum of Care among the General Population, Stratified by Sex.
Table G1. Logistic Regression Analyses Predicting Homelessness for Columbus among the General Population, Stratified by Sex.
Univariate Multivariate 95% CI 95% CI Group Predictor OR Lower Upper p OR Lower Upper p Female Veteran 1.19 0.81 1.68 0.335 1.13 0.77 1.60 0.499 Black 7.30 6.66 8.00 <0.001 6.74 6.15 7.39 <0.001 Age 18-29 vs. 30-44 0.91 0.82 1.01 0.073 0.97 0.88 1.08 0.603 Age 18-29 vs. 45-54 0.66 0.58 0.74 <0.001 0.72 0.64 0.82 <0.001 Age 18-29 vs. 55-64 0.23 0.19 0.29 <0.001 0.27 0.22 0.34 <0.001 Age 18-29 vs. 65+ 0.04 0.02 0.06 <0.001 0.05 0.03 0.07 <0.001 Male Veteran 0.91 0.83 0.98 0.019 1.08 0.99 1.18 0.073 Black 7.75 7.28 8.25 <0.001 7.71 7.24 8.21 <0.001 Age 18-29 vs. 30-44 2.09 1.91 2.29 <0.001 2.26 2.07 2.48 <0.001 Age 18-29 vs. 45-54 3.06 2.79 3.36 <0.001 3.25 2.95 3.57 <0.001 Age 18-29 vs. 55-64 1.20 1.05 1.36 0.006 1.38 1.20 1.57 <0.001 Age 18-29 vs. 65+ 0.23 0.18 0.30 <0.001 0.26 0.20 0.34 <0.001

Prevalence and Risk of Homelessness among U.S. Veterans: A Multisite Investigation
64
National Center on Homelessness among Veterans
Table G2. Logistic Regression Analyses Predicting Homelessness for Denver among the General Population, Stratified by Sex.
Univariate Multivariate 95% CI 95% CI Group Predictor OR Lower Upper p OR Lower Upper p Female Veteran 1.51 1.05 2.09 0.020 1.37 0.95 1.90 0.079 Black 10.65 9.55 11.87 <0.001 10.22 9.16 11.39 <0.001 Age 18-29 vs. 30-44 0.93 0.82 1.05 0.232 0.94 0.83 1.07 0.371 Age 18-29 vs. 45-54 0.79 0.68 0.91 <0.001 0.79 0.69 0.91 <0.001 Age 18-29 vs. 55-64 0.38 0.31 0.47 <0.001 0.41 0.33 0.50 <0.001 Age 18-29 vs. 65+ 0.09 0.06 0.13 <0.001 0.09 0.06 0.13 <0.001 Male Veteran 1.41 1.30 1.52 <0.001 1.48 1.36 1.61 <0.001 Black 7.48 6.92 8.07 <0.001 7.07 6.54 7.63 <0.001 Age 18-29 vs. 30-44 2.06 1.85 2.31 <0.001 1.99 1.78 2.23 <0.001 Age 18-29 vs. 45-54 3.54 3.17 3.96 <0.001 3.29 2.94 3.69 <0.001 Age 18-29 vs. 55-64 2.35 2.07 2.67 <0.001 2.08 1.83 2.38 <0.001 Age 18-29 vs. 65+ 0.28 0.21 0.37 <0.001 0.23 0.17 0.31 <0.001

65
Prevalence and Risk of Homelessness among U.S. Veterans: A Multisite Investigation
National Center on Homelessness among Veterans
Table G3. Logistic Regression Analyses Predicting Homelessness for Lansing among the General Population, Stratified by Sex.
Univariate Multivariate 95% CI 95% CI Group Predictor OR Lower Upper p OR Lower Upper p Female Veteran 2.27 1.37 3.52 <0.001 1.66 0.98 2.62 0.042 Black 8.11 7.21 9.12 <0.001 7.47 6.63 8.40 <0.001 Age 18-29 vs. 30-44 1.51 1.32 1.73 <0.001 1.50 1.31 1.72 <0.001 Age 18-29 vs. 45-54 1.01 0.85 1.19 0.939 1.03 0.87 1.21 0.743 Age 18-29 vs. 55-64 0.38 0.29 0.50 <0.001 0.44 0.33 0.57 <0.001 Age 18-29 vs. 65+ 0.07 0.04 0.12 <0.001 0.08 0.05 0.14 <0.001 Male Veteran 1.53 1.33 1.76 <0.001 1.77 1.52 2.07 <0.001 Black 8.35 7.43 9.37 <0.001 7.97 7.09 8.95 <0.001 Age 18-29 vs. 30-44 2.36 2.02 2.77 <0.001 2.31 1.97 2.72 <0.001 Age 18-29 vs. 45-54 3.05 2.59 3.59 <0.001 2.77 2.34 3.29 <0.001 Age 18-29 vs. 55-64 1.65 1.34 2.01 <0.001 1.51 1.21 1.86 <0.001 Age 18-29 vs. 65+ 0.26 0.16 0.40 <0.001 0.23 0.14 0.35 <0.001

Prevalence and Risk of Homelessness among U.S. Veterans: A Multisite Investigation
66
National Center on Homelessness among Veterans
Table G4. Logistic Regression Analyses Predicting Homelessness for New York City among the General Population, Stratified by Sex.
Univariate Multivariate 95% CI 95% CI Group Predictor OR Lower Upper p OR Lower Upper p Female Veteran 3.95 3.64 4.29 <0.001 2.94 2.70 3.20 <0.001 Black 4.78 4.69 4.88 <0.001 4.59 4.50 4.68 <0.001 Age 18-29 vs. 30-44 0.56 0.55 0.58 <0.001 0.59 0.58 0.61 <0.001 Age 18-29 vs. 45-54 0.33 0.32 0.34 <0.001 0.33 0.32 0.34 <0.001 Age 18-29 vs. 55-64 0.10 0.10 0.11 <0.001 0.10 0.10 0.11 <0.001 Age 18-29 vs. 65+ 0.02 0.01 0.02 <0.001 0.02 0.02 0.02 <0.001 Male Veteran 1.11 1.07 1.15 <0.001 1.74 1.67 1.81 <0.001 Black 4.99 4.88 5.09 <0.001 4.85 4.75 4.95 <0.001 Age 18-29 vs. 30-44 1.14 1.11 1.16 <0.001 1.26 1.22 1.29 <0.001 Age 18-29 vs. 45-54 1.28 1.25 1.32 <0.001 1.29 1.26 1.33 <0.001 Age 18-29 vs. 55-64 0.63 0.61 0.66 <0.001 0.62 0.59 0.64 <0.001 Age 18-29 vs. 65+ 0.15 0.14 0.16 <0.001 0.14 0.13 0.15 <0.001

67
Prevalence and Risk of Homelessness among U.S. Veterans: A Multisite Investigation
National Center on Homelessness among Veterans
Table G5. Logistic Regression Analyses Predicting Homelessness for Phoenix among the General Population, Stratified by Sex.
Univariate Multivariate 95% CI 95% CI Group Predictor OR Lower Upper p OR Lower Upper p Female Veteran 1.44 1.22 1.68 <0.001 1.24 1.05 1.45 0.008 Black 6.42 6.06 6.81 <0.001 5.88 5.54 6.23 <0.001 Age 18-29 vs. 30-44 1.26 1.19 1.34 <0.001 1.28 1.21 1.35 <0.001 Age 18-29 vs. 45-54 1.03 0.97 1.11 0.335 1.06 0.99 1.13 0.115 Age 18-29 vs. 55-64 0.55 0.50 0.60 <0.001 0.59 0.54 0.64 <0.001 Age 18-29 vs. 65+ 0.11 0.09 0.12 <0.001 0.12 0.10 0.14 <0.001 Male Veteran 1.06 1.01 1.12 0.012 1.26 1.20 1.33 <0.001 Black 7.43 7.09 7.79 <0.001 7.01 6.68 7.35 <0.001 Age 18-29 vs. 30-44 1.86 1.75 1.97 <0.001 1.87 1.76 1.98 <0.001 Age 18-29 vs. 45-54 2.90 2.73 3.08 <0.001 2.84 2.67 3.02 <0.001 Age 18-29 vs. 55-64 1.77 1.65 1.90 <0.001 1.73 1.60 1.86 <0.001 Age 18-29 vs. 65+ 0.32 0.28 0.37 <0.001 0.32 0.28 0.36 <0.001

Prevalence and Risk of Homelessness among U.S. Veterans: A Multisite Investigation
68
National Center on Homelessness among Veterans
Table G6. Logistic Regression Analyses Predicting Homelessness for San Jose among the General Population, Stratified by Sex.
Univariate Multivariate 95% CI 95% CI Group Predictor OR Lower Upper p OR Lower Upper p Female Veteran 3.74 3.15 4.42 <0.001 4.23 3.54 5.02 <0.001 Black 6.44 5.97 6.93 <0.001 5.98 5.54 6.44 <0.001 Age 18-29 vs. 30-44 1.18 1.10 1.26 <0.001 1.21 1.13 1.29 <0.001 Age 18-29 vs. 45-54 1.14 1.06 1.23 <0.001 1.14 1.05 1.22 <0.001 Age 18-29 vs. 55-64 0.56 0.51 0.62 <0.001 0.56 0.51 0.62 <0.001 Age 18-29 vs. 65+ 0.13 0.11 0.15 <0.001 0.13 0.11 0.16 <0.001 Male Veteran 1.60 1.52 1.68 <0.001 1.97 1.86 2.08 <0.001 Black 7.98 7.58 8.40 <0.001 7.25 6.88 7.64 <0.001 Age 18-29 vs. 30-44 1.57 1.48 1.66 <0.001 1.59 1.50 1.68 <0.001 Age 18-29 vs. 45-54 2.27 2.14 2.41 <0.001 2.13 2.00 2.26 <0.001 Age 18-29 vs. 55-64 1.54 1.43 1.65 <0.001 1.28 1.18 1.37 <0.001 Age 18-29 vs. 65+ 0.40 0.36 0.45 <0.001 0.31 0.28 0.35 <0.001

69
Prevalence and Risk of Homelessness among U.S. Veterans: A Multisite Investigation
National Center on Homelessness among Veterans
Table G7. Logistic Regression Analyses Predicting Homelessness for Tampa among the General Population, Stratified by Sex.
Univariate Multivariate 95% CI 95% CI Group Predictor OR Lower Upper p OR Lower Upper p Female Veteran 2.63 2.12 3.22 <0.001 2.08 1.68 2.56 <0.001 Black 4.28 3.90 4.68 <0.001 3.82 3.49 4.18 <0.001 Age 18-29 vs. 30-44 1.08 0.97 1.21 0.155 1.14 1.02 1.28 0.020 Age 18-29 vs. 45-54 1.09 0.97 1.24 0.155 1.19 1.05 1.34 0.007 Age 18-29 vs. 55-64 0.42 0.35 0.50 <0.001 0.49 0.40 0.58 <0.001 Age 18-29 vs. 65+ 0.06 0.04 0.09 <0.001 0.08 0.05 0.11 <0.001 Male Veteran 1.04 0.97 1.12 0.291 1.16 1.07 1.25 <0.001 Black 4.61 4.33 4.90 <0.001 4.68 4.39 4.98 <0.001 Age 18-29 vs. 30-44 2.97 2.66 3.31 <0.001 3.20 2.87 3.58 <0.001 Age 18-29 vs. 45-54 4.62 4.14 5.15 <0.001 5.04 4.52 5.64 <0.001 Age 18-29 vs. 55-64 2.71 2.40 3.06 <0.001 3.06 2.70 3.48 <0.001 Age 18-29 vs. 65+ 0.27 0.21 0.35 <0.001 0.32 0.24 0.41 <0.001
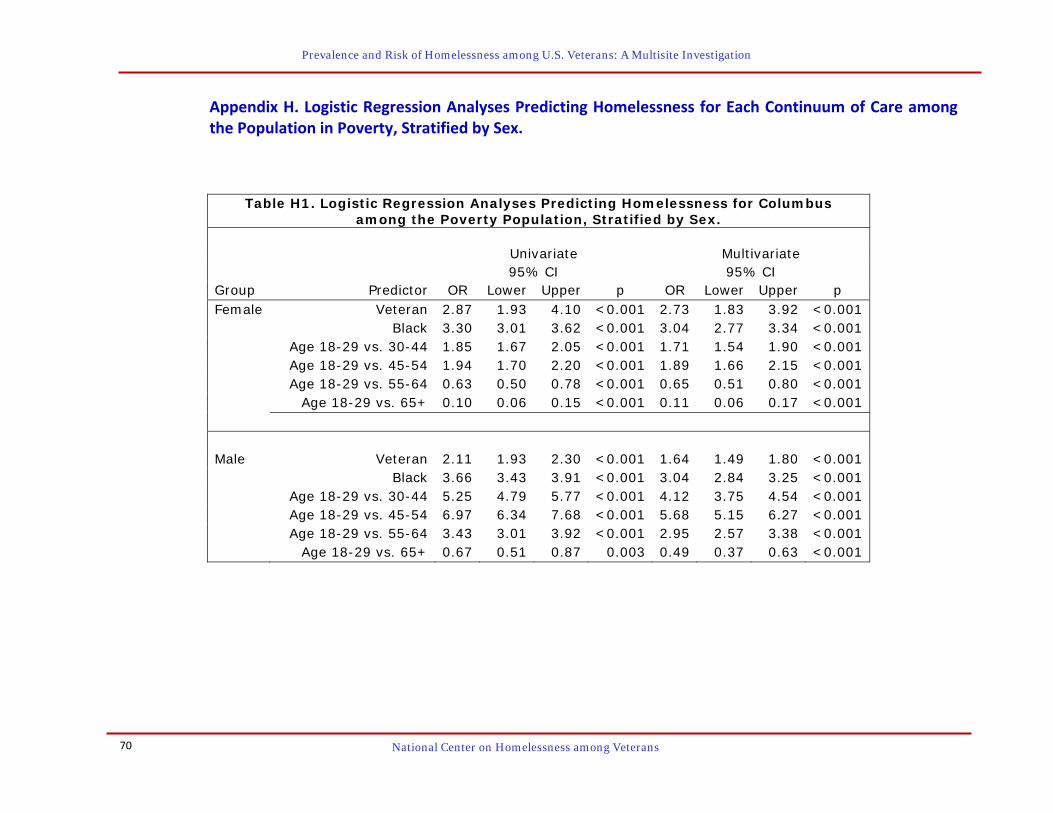
Prevalence and Risk of Homelessness among U.S. Veterans: A Multisite Investigation
70
National Center on Homelessness among Veterans
Appendix H. Logistic Regression Analyses Predicting Homelessness for Each Continuum of Care among the Population in Poverty, Stratified by Sex.
Table H1. Logistic Regression Analyses Predicting Homelessness for Columbus among the Poverty Population, Stratified by Sex.
Univariate Multivariate 95% CI 95% CI Group Predictor OR Lower Upper p OR Lower Upper p Female Veteran 2.87 1.93 4.10 <0.001 2.73 1.83 3.92 <0.001 Black 3.30 3.01 3.62 <0.001 3.04 2.77 3.34 <0.001 Age 18-29 vs. 30-44 1.85 1.67 2.05 <0.001 1.71 1.54 1.90 <0.001 Age 18-29 vs. 45-54 1.94 1.70 2.20 <0.001 1.89 1.66 2.15 <0.001 Age 18-29 vs. 55-64 0.63 0.50 0.78 <0.001 0.65 0.51 0.80 <0.001 Age 18-29 vs. 65+ 0.10 0.06 0.15 <0.001 0.11 0.06 0.17 <0.001 Male Veteran 2.11 1.93 2.30 <0.001 1.64 1.49 1.80 <0.001 Black 3.66 3.43 3.91 <0.001 3.04 2.84 3.25 <0.001 Age 18-29 vs. 30-44 5.25 4.79 5.77 <0.001 4.12 3.75 4.54 <0.001 Age 18-29 vs. 45-54 6.97 6.34 7.68 <0.001 5.68 5.15 6.27 <0.001 Age 18-29 vs. 55-64 3.43 3.01 3.92 <0.001 2.95 2.57 3.38 <0.001 Age 18-29 vs. 65+ 0.67 0.51 0.87 0.003 0.49 0.37 0.63 <0.001

71
Prevalence and Risk of Homelessness among U.S. Veterans: A Multisite Investigation
National Center on Homelessness among Veterans
Table H2. Logistic Regression Analyses Predicting Homelessness for Denver among the Poverty Population, Stratified by Sex.
Univariate Multivariate 95% CI 95% CI Group Predictor OR Lower Upper p OR Lower Upper p Female Veteran 1.98 1.37 2.76 <0.001 1.82 1.25 2.56 <0.001 Black 4.91 4.39 5.48 <0.001 4.60 4.11 5.14 <0.001 Age 18-29 vs. 30-44 1.51 1.33 1.71 <0.001 1.47 1.30 1.67 <0.001 Age 18-29 vs. 45-54 1.96 1.70 2.26 <0.001 1.71 1.48 1.98 <0.001 Age 18-29 vs. 55-64 0.94 0.76 1.15 0.535 0.85 0.69 1.05 0.135 Age 18-29 vs. 65+ 0.15 0.10 0.23 <0.001 0.16 0.10 0.23 <0.001 Male Veteran 2.79 2.57 3.03 <0.001 2.31 2.11 2.52 <0.001 Black 3.62 3.34 3.92 <0.001 3.53 3.25 3.83 <0.001 Age 18-29 vs. 30-44 3.54 3.17 3.97 <0.001 3.43 3.06 3.85 <0.001 Age 18-29 vs. 45-54 8.10 7.24 9.08 <0.001 6.79 6.06 7.63 <0.001 Age 18-29 vs. 55-64 4.75 4.18 5.41 <0.001 3.46 3.03 3.95 <0.001 Age 18-29 vs. 65+ 0.72 0.53 0.95 0.025 0.44 0.33 0.59 <0.001

Prevalence and Risk of Homelessness among U.S. Veterans: A Multisite Investigation
72
National Center on Homelessness among Veterans
Table H3. Logistic Regression Analyses Predicting Homelessness for Lansing among the Poverty Population, Stratified by Sex.
Univariate Multivariate 95% CI 95% CI Group Predictor OR Lower Upper p OR Lower Upper p Female Veteran 2.03 1.21 3.22 0.004 1.87 1.08 3.05 0.017 Black 4.50 3.99 5.09 <0.001 4.08 3.60 4.61 <0.001 Age 18-29 vs. 30-44 3.23 2.81 3.71 <0.001 2.78 2.41 3.20 <0.001 Age 18-29 vs. 45-54 3.10 2.61 3.67 <0.001 3.00 2.52 3.56 <0.001 Age 18-29 vs. 55-64 1.21 0.91 1.58 0.168 1.22 0.92 1.60 0.156 Age 18-29 vs. 65+ 0.17 0.09 0.29 <0.001 0.17 0.09 0.28 <0.001 Male Veteran 3.62 3.10 4.21 <0.001 3.25 2.71 3.89 <0.001 Black 4.93 4.36 5.57 <0.001 4.70 4.12 5.35 <0.001 Age 18-29 vs. 30-44 5.35 4.55 6.31 <0.001 5.27 4.45 6.24 <0.001 Age 18-29 vs. 45-54 6.04 5.10 7.16 <0.001 4.01 3.35 4.80 <0.001 Age 18-29 vs. 55-64 4.73 3.83 5.84 <0.001 3.44 2.74 4.32 <0.001 Age 18-29 vs. 65+ 0.69 0.42 1.07 0.115 0.35 0.21 0.55 <0.001

73
Prevalence and Risk of Homelessness among U.S. Veterans: A Multisite Investigation
National Center on Homelessness among Veterans
Table H4. Logistic Regression Analyses Predicting Homelessness for New York City among the Poverty Population, Stratified by Sex.
Univariate Multivariate 95% CI 95% CI Group Predictor OR Lower Upper p OR Lower Upper p Female Veteran 5.61 5.10 6.15 <0.001 4.57 4.12 5.05 <0.001 Black 4.22 4.13 4.31 <0.001 3.96 3.87 4.04 <0.001 Age 18-29 vs. 30-44 0.69 0.68 0.71 <0.001 0.71 0.70 0.73 <0.001 Age 18-29 vs. 45-54 0.48 0.46 0.49 <0.001 0.47 0.45 0.48 <0.001 Age 18-29 vs. 55-64 0.14 0.13 0.15 <0.001 0.14 0.13 0.15 <0.001 Age 18-29 vs. 65+ 0.02 0.02 0.02 <0.001 0.02 0.02 0.02 <0.001 Male Veteran 1.79 1.72 1.86 <0.001 2.13 2.04 2.22 <0.001 Black 4.22 4.13 4.31 <0.001 3.97 3.89 4.06 <0.001 Age 18-29 vs. 30-44 1.77 1.72 1.81 <0.001 1.82 1.77 1.87 <0.001 Age 18-29 vs. 45-54 1.71 1.66 1.77 <0.001 1.60 1.55 1.65 <0.001 Age 18-29 vs. 55-64 0.90 0.87 0.94 <0.001 0.81 0.77 0.84 <0.001 Age 18-29 vs. 65+ 0.17 0.16 0.18 <0.001 0.16 0.15 0.18 <0.001

Prevalence and Risk of Homelessness among U.S. Veterans: A Multisite Investigation
74
National Center on Homelessness among Veterans
Table H5. Logistic Regression Analyses Predicting Homelessness for Phoenix among the Poverty Population, Stratified by Sex.
Univariate Multivariate 95% CI 95% CI Group Predictor OR Lower Upper p OR Lower Upper p Female Veteran 2.20 1.86 2.59 <0.001 1.93 1.62 2.28 <0.001 Black 4.19 3.95 4.46 <0.001 3.96 3.72 4.21 <0.001 Age 18-29 vs. 30-44 1.80 1.69 1.90 <0.001 1.79 1.69 1.89 <0.001 Age 18-29 vs. 45-54 2.26 2.11 2.42 <0.001 2.18 2.04 2.34 <0.001 Age 18-29 vs. 55-64 1.27 1.15 1.39 <0.001 1.24 1.13 1.36 <0.001 Age 18-29 vs. 65+ 0.24 0.20 0.28 <0.001 0.25 0.21 0.29 <0.001 Male Veteran 2.15 2.04 2.26 <0.001 1.95 1.83 2.06 <0.001 Black 4.75 4.52 5.00 <0.001 4.52 4.28 4.77 <0.001 Age 18-29 vs. 30-44 2.81 2.65 2.99 <0.001 2.92 2.75 3.11 <0.001 Age 18-29 vs. 45-54 5.21 4.89 5.54 <0.001 4.43 4.16 4.73 <0.001 Age 18-29 vs. 55-64 3.28 3.05 3.54 <0.001 2.55 2.35 2.76 <0.001 Age 18-29 vs. 65+ 0.76 0.67 0.86 <0.001 0.58 0.50 0.66 <0.001

75
Prevalence and Risk of Homelessness among U.S. Veterans: A Multisite Investigation
National Center on Homelessness among Veterans
Table H6. Logistic Regression Analyses Predicting Homelessness for San Jose among the Poverty Population, Stratified by Sex.
Univariate Multivariate 95% CI 95% CI Group Predictor OR Lower Upper p OR Lower Upper p Female Veteran 4.14 3.31 5.14 <0.001 3.30 2.61 4.12 <0.001 Black 2.35 2.14 2.57 <0.001 2.22 2.02 2.43 <0.001 Age 18-29 vs. 30-44 1.61 1.44 1.80 <0.001 1.64 1.46 1.84 <0.001 Age 18-29 vs. 45-54 2.06 1.82 2.33 <0.001 1.98 1.74 2.25 <0.001 Age 18-29 vs. 55-64 0.85 0.71 1.02 0.090 0.91 0.75 1.09 0.295 Age 18-29 vs. 65+ 0.11 0.07 0.16 <0.001 0.12 0.08 0.18 <0.001 Male Veteran 2.39 2.25 2.55 <0.001 2.11 1.97 2.26 <0.001 Black 4.95 4.63 5.29 <0.001 4.38 4.09 4.70 <0.001 Age 18-29 vs. 30-44 3.31 3.11 3.52 <0.001 3.11 2.92 3.31 <0.001 Age 18-29 vs. 45-54 4.06 3.81 4.33 <0.001 3.45 3.23 3.69 <0.001 Age 18-29 vs. 55-64 2.91 2.70 3.15 <0.001 2.44 2.25 2.64 <0.001 Age 18-29 vs. 65+ 0.90 0.80 1.02 0.093 0.75 0.66 0.85 <0.001

Prevalence and Risk of Homelessness among U.S. Veterans: A Multisite Investigation
76
National Center on Homelessness among Veterans
Table H7. Logistic Regression Analyses Predicting Homelessness for Tampa among the Poverty Population, Stratified by Sex.
Univariate Multivariate 95% CI 95% CI Group Predictor OR Lower Upper p OR Lower Upper p Female Veteran 5.33 4.33 6.54 <0.001 6.63 5.25 8.35 <0.001 Black 4.12 3.78 4.49 <0.001 4.01 3.67 4.38 <0.001 Age 18-29 vs. 30-44 2.23 2.08 2.39 <0.001 2.30 2.15 2.47 <0.001 Age 18-29 vs. 45-54 2.65 2.45 2.87 <0.001 2.62 2.42 2.84 <0.001 Age 18-29 vs. 55-64 1.25 1.13 1.39 <0.001 1.19 1.07 1.32 <0.001 Age 18-29 vs. 65+ 0.27 0.23 0.32 <0.001 0.26 0.22 0.32 <0.001 Male Veteran 2.25 2.08 2.43 <0.001 2.12 1.94 2.32 <0.001 Black 2.78 2.60 2.97 <0.001 2.89 2.70 3.10 <0.001 Age 18-29 vs. 30-44 4.30 3.85 4.82 <0.001 4.47 3.99 5.01 <0.001 Age 18-29 vs. 45-54 7.55 6.75 8.45 <0.001 7.25 6.47 8.15 <0.001 Age 18-29 vs. 55-64 4.55 4.01 5.17 <0.001 3.58 3.13 4.09 <0.001 Age 18-29 vs. 65+ 0.49 0.38 0.63 <0.001 0.44 0.33 0.57 <0.001

The National Center on
Homelessness among Veterans
4100 Chester Avenue, Suite 201
Philadelphia, PA 19104