National Cancer Institute CPTAC... · October 17, 2012) and ... (2006-2010), which experienced a...
19
Center for Strategic Scientific Initiatives The Clinical Proteomic Tumor Analysis Consortium (CPTAC) Program Evaluation (independent evaluation performed by Thomson Reuters and Westat) January 2015 National Cancer Institute
Transcript of National Cancer Institute CPTAC... · October 17, 2012) and ... (2006-2010), which experienced a...

Center for Strategic Scientific Initiatives
The Clinical Proteomic Tumor Analysis Consortium
(CPTAC)
Program Evaluation
(independent evaluation performed by Thomson Reuters and Westat)
January 2015
Nat
iona
l Can
cer I
nstit
ute

CUTIVE SUMMARY
Prepared for: Office of Cancer Clinical Proteomics Research National Cancer Institute National Institutes of Health 31 Center Drive, MS 2580 Bethesda, MD 20892
Prepared by:
Authors: Vincent S. Huang Pawel Sulima Yuen Lau Catherine Bernaciak Di Cross Thomson Reuters
Eden Segal Westat
Thomson Reuters IP & Science 1455 Research Boulevard Rockville, MD 20850
IMPACT EVALUATION OF THE CLINICAL PROTEOMIC TUMOR ANALYSIS CONSORTIUM (CPTAC) PHASE 2
EXECUTIVE SUMMARY MARCH 2015

EXECUTIVE SUMMARY
PROGRAM OVERVIEW & EVALUATION GOALS
While significant progress has been made in unraveling the genomic basis of cancer, our understanding of the proteomic basis of cancer has been hampered by a lack of consolidated standard study tools. The Clinical Proteomic Technologies for Cancer initiative at the National Cancer Institute (NCI) was launched in August of 2006 with a primary objective of bridging this knowledge gap by developing a standardized technological platform and infrastructure for proteomic research to lay the groundwork for future reproducible studies of proteome characterization. The program consisted of three components: Clinical Proteomic Technology Assessment for Cancer (CPTAC1), Advanced Proteomic Platforms and Computational Sciences and Proteomic Reagents and Resources Core. The CPTAC1 arm provided funding to five institutions for collaborative research to increase the understanding of experimental sources of error and to provide the basis for communicating findings to the field. Five CPTAC1 analysis centers received funding for the CPTAC1 effort: Broad Institute associated with the Fred Hutchinson Cancer Research Center (Broad/FHCRC), Vanderbilt University (Vanderbilt), University of California San Francisco (UCSF), Purdue University (Purdue), and Memorial Sloan Kettering Cancer Center (MSKCC). CPTAC1 ended in August 2011, having demonstrated the effectiveness of a multi-disciplinary, multi-institutional approach to developing a technical platform necessary to overcoming inherent variability in specific proteomic analysis. The Advanced Proteomic Platforms and Computational Sciences arm provided grants (16) to individual investigators (R01, R21/R33) to develop platforms or algorithms related to proteomic research. The proteomic reagents and resources core produced monoclonal antibodies, which were well characterized and available to the research community.
Building on the knowledge and analytical standards developed in CPTAC1, the Clinical Proteomic Tumor Analysis Consortium (CPTAC2) was launched in August of 2011 to gain deeper insight into the biological understanding of the proteome of cancer and how it relates to the genomic understanding of cancer. Its goal was to apply the standards developed for proteomic analyses in CPTAC1 to genomically-characterized tumors in a concerted effort to uncover the relationships between the proteome and the genome of tumorigenic cells. Five Proteome Characterization Centers (PCCs) received funding for CPTAC2: Broad/FHCRC, Vanderbilt, Johns Hopkins University (JHU), Washington University/Baylor University/University of North Carolina (WashU/Baylor/UNC), and Pacific Northwest National Laboratory (PNNL).
Here we analyze outputs that were associated with CPTAC1 and CPTAC2 funds that were awarded via the U24 Resource-Related Research Project – Cooperative Agreement mechanism, highlighting the overarching mission that the program serves to improve the capability of resources to facilitate proteomic cancer research. For both CPTAC1 and 2 programs, a breakdown of the number of applications, awards and average cost per year is shown in Table 1. In this table, the average yearly cost for CPTAC1 reflects the amount of funding during all five years of CPTAC1, whereas the average yearly cost for CPTAC2 reflects the first four years of funding.
1

CPTAC1 CPTAC2 RFA-CA-07-012 (U24) RFA-CA-10-016 (U24)
Applications Received Awards Average Cost
Per Year Applications
Received Awards Average Cost Per Year
14 5 $9M 25 5 $13M
Table 1: Applications, awards and average yearly costs for the CPTAC1 and 2 programs
This executive summary addresses four main aspects of CPTAC2 with four questions regarding program evaluation:
1. Building infrastructure to support proteomic research:
Is CPTAC2 infrastructure sufficient to foster collaboration and produce strong scientificresearch?
2. Catalyzing application of CPTAC1 standardized research platform in biological discovery:
Has the mission of CPTAC2 helped to shift research focus from technology/platformdevelopment to more biological applications?
3. Supporting collaboration between genomic and proteomic research:
Has there been an increase in collaboration between CPTAC2 and The Cancer GenomeAtlas (TCGA) researchers?
4. Facilitating scientific impact:
Are outputs from CPTAC2 being used and adopted by the scientific community?
To address these questions, Thomson Reuters and Westat conducted extensive analysis of processes and outputs of CPTAC1 and CPTAC2. Data obtained from CPTAC program Extended Scientific Report (ESR) submitted annually by each PCC and the use of platforms such as PubMed (MEDLINE®), and Thomson Reuters Web of Science™ (WoS) extended from September 2006 through January 2015. This includes 34 CPTAC2 publications from between December 1, 2014 and January 31, 2015. Interviews and surveys were conducted with two expert panel focus groups of 15 CPTAC2 PIs and other key investigators (conducted October 17, 2012) and complemented with telephone interviews of 37 CPTAC2 and non-CPTAC2 scientists (conducted October 4, 2013 through November 20, 2013) and separate web-based surveys submitted to two lists of email addresses provided by NCI (one of TCGA investigators and one of recipients of the NCI Proteomics News Listserv (conducted March 4, 2014 through April 3, 2014). The key findings and conclusions of our analyses are presented here.
2

KEY FINDINGS 1. Is CPTAC2 infrastructure sufficient to foster collaboration and produce strong scientific research?
CPTAC2 output has increased at an annual rate of over 12 publications per year since program inception while collaborations between PCCs have increased in both volume and diversity.
The publication count of CPTAC2 has increased rapidly since 2011 (Figure 1-1). We can measure this increase as a rate by calculating the increase in number of publications over time. During the four years between 2011 and 2014, an increase from three to 52 annual publications was observed for CPTAC2, which corresponds to a rate of 12.3 publications per year. Comparing to the most productive years of CPTAC1 (2006-2010), which experienced a publication rate of 7.6 publications per year, the growth rate of CPTAC2 was 1.6 times greater than that of CPTAC1.
Figure 1-1: Publication rate of CPTAC1 and 2 publications
Not only has the publication rate increased as compared to CPTAC1, but also the volume and diversity of inter-PCC collaborations. In CPTAC1 a few key individuals had strong collaborations between PCCs, most notably between Vanderbilt and Broad/FHCRC. In CPTAC2 this pattern is observed to have changed, both in volume and in distribution. In CPTAC2, there are more investigators within each PCC collaborating with investigators from other PCCs.
Caveat: Directly comparing CPTAC1 to CPTAC2 rates is not straightforward as both the program goals and awarded centers are different. It is also expected that there will be differences in publication output between groups focused on technology development versus those focused on biological applications.
3
2. Has the mission of CPTAC2 helped to shift research focus from technology/platform development tomore biological applications?
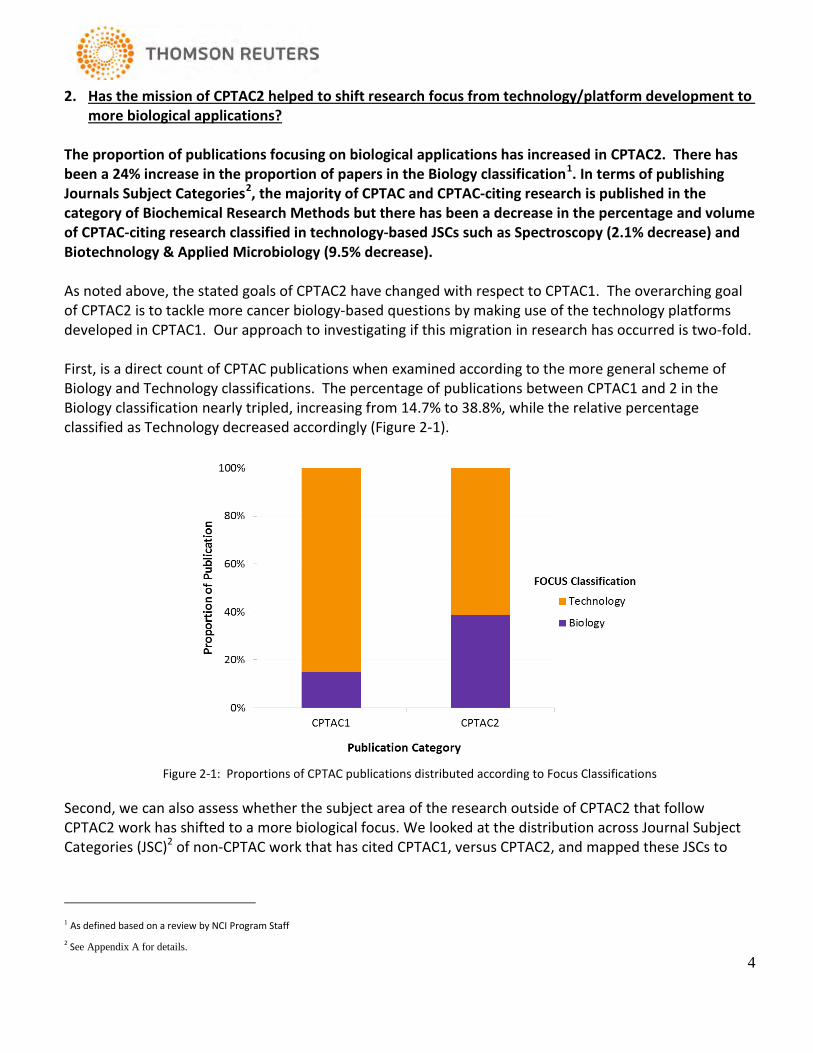
The proportion of publications focusing on biological applications has increased in CPTAC2. There has been a 24% increase in the proportion of papers in the Biology classification1. In terms of publishing Journals Subject Categories2, the majority of CPTAC and CPTAC-citing research is published in the category of Biochemical Research Methods but there has been a decrease in the percentage and volume of CPTAC-citing research classified in technology-based JSCs such as Spectroscopy (2.1% decrease) and Biotechnology & Applied Microbiology (9.5% decrease).
As noted above, the stated goals of CPTAC2 have changed with respect to CPTAC1. The overarching goal of CPTAC2 is to tackle more cancer biology-based questions by making use of the technology platforms developed in CPTAC1. Our approach to investigating if this migration in research has occurred is two-fold.
First, is a direct count of CPTAC publications when examined according to the more general scheme of Biology and Technology classifications. The percentage of publications between CPTAC1 and 2 in the Biology classification nearly tripled, increasing from 14.7% to 38.8%, while the relative percentage classified as Technology decreased accordingly (Figure 2-1).
Figure 2-1: Proportions of CPTAC publications distributed according to Focus Classifications
Second, we can also assess whether the subject area of the research outside of CPTAC2 that follow CPTAC2 work has shifted to a more biological focus. We looked at the distribution across Journal Subject Categories (JSC)2 of non-CPTAC work that has cited CPTAC1, versus CPTAC2, and mapped these JSCs to
1 As defined based on a review by NCI Program Staff 2 See Appendix A for details.
4

‘Biology’ or ‘Technology3’. As shown in Figure 2-2, there was a reduction by nearly 5% from CPTAC1 and 2 for non-CPTAC publications citing CPTAC work within the Technology focused category of Biochemical Research Methods. As well, there were percentage increases of non-CPTAC publications citing CPTAC work in the Biology focused categories of Oncology, Cell Biology, and Genetics & Heredity as well as decreases in the Technology focused categories of Spectroscopy and Biotechnology & Applied Microbiology between CPTAC 1 and 2. These relative changes indicate migration away from technology-based research during CPTAC2 for non-CPTAC work that has cited CPTAC research.
Figure 2-2: Distributions across JSC for non-CPTAC publications citing CPTAC work
3 See Appendix B “Mapping Journal Subject Categories to Biology and Technology” for details 5

3. Has there been an increase in collaboration between CPTAC and TCGA researchers?
The number of publications co-authored by CPTAC and TCGA researchers between CPTAC1 and 2 has moderately increased, which may be due to unexpectedly low levels of familiarity with the CPTAC2 program among TCGA investigators.
A goal of CPTAC2 (as stated in RFA-CA-10-016) was to utilize TCGA and other genomically-characterized tumors in proteomic analyses at the funded PCCs. Although this expectation was clear in the RFA, the program has had limited success in fostering such collaborations as can be seen in Figure 3-1 and 3-2, which shows the publication counts of all joint CPTAC-TCGA publications (both CPTAC funded and non-CPTAC funded. It should be noted that the publication counts shown in Figure 3-1 are considered for the PCCs of CPTAC2 during the CPTAC1 time frame. Of these 526 overall publications, five were CPTAC1-funded, five were CPTAC2-funded, 146 are proteomic studies not funded by CPTAC, and 370 are non-proteomic studies.
Figure 3-1: Number of publications, including non-CPTAC, co-authored by CPTAC1 and TCGA researchers at CPTAC2 PCCs
Figure 3-2: Number of publications, including non-CPTAC, co-authored by CPTAC2 and TCGA researchers at CPTAC2 PCCs 6

For all PCCs except WashU/Baylor/UNC, the number of collaborative papers increased at most by approximately 10-fold (JHU between 2011 and 2013). While most CPTAC-TCGA collaborative publications are driven by WashU/Baylor/UNC, it should be noted that at this PCC, some investigators hold membership in both CPTAC and TCGA. Those individuals are not double-counted4 in the publication counts in the figures above. It is likely that the presence of these individuals may raise local (intra-PCC) awareness about the TCGA program, making collaboration more likely at that institution.
One possible explanation for the relatively small increase in collaboration between TCGA and most CPTAC2 PCCs can be gained from the qualitative analysis performed in early 2014. When surveyed5 on their level of familiarity with proteomics, TCGA investigators (Figure 3-3) most commonly replied that they were ‘somewhat’ (63%) or ‘not at all’ (20%) familiar with proteomics and were overwhelmingly ‘not at all’ (80%) familiar with the CPTAC2 program. A different result is seen with NCI Proteomics Listserv email recipients, who were mostly ‘very’ (61%) or ‘somewhat’ (35%) familiar with proteomics and had a higher level of familiarity with CPTAC2 than TCGA researchers with 50% being ‘somewhat’ and 26% being ‘not at all’ familiar with CPTAC2.
Figure 3-3: (L) TCGA investigators’ and (R) Proteomics Listserv recipients’ familiarity with proteomics and CPTAC2
An examination of the specific collaborative grants between TCGA and CPTAC researchers reveals two grant applications, only one of which was funded. These application or funded grants are identified in Table 3-1 below.
Grant Number Application (A) or Funded Grant (G) Year
RC1CA144914 A 2009 U10CA180860 G 2014
Table 3-1: Identification of collaborative grants between TCGA and CPTAC researchers
4 A publication is not considered collaborative just by virtue of inclusion of one of the investigators who is a member of both CPTAC and TCGA, but includes other members of TCGA.
5 125 TCGA surveys were completed, with a response rate of 42% of the sample. 48 respondents from the Proteomics Listserv sample completed the CPTAC survey, with a response rate of 23%.
TCGA Survey Responses Proteomics Listserv Survey Responses
7

4. Are outputs from CPTAC being used and adopted by the scientific community?
CPTAC papers have been highly used by the scientific community as indicated by the average number of citations received when compared to the global average of similar document type and subject. A knowledge dissemination analysis revealed that CPTAC research has been cited more than 1500 times by investigators from over 200 institutions from 159 countries not associated with the CPTAC program.
Community-wide uptake of CPTAC research is evident when examining average total citations of CPTAC publications by non-CPTAC institutions. In all years, for both CPTAC1 and 2, the average number of citations was consistently more than the expected average number of citations received by global publications of the same document type in comparable journal subject categories, as indicated in Figure 4-1 below (a ratio of 1 is the global average). Specifically, CPTAC research has been cited more than 1500 times by investigators from over 200 non-CPTAC institutions from 159 countries with the top five countries being the U.S., China, Germany, England, and Canada.
Figure 4-1: Productivity and Average Cumulative Citation Ratio of all CPTAC1 and 2 publications
8

Another indication of uptake – the number of potential breakthrough publications - is also based on
citation rates. Potential breakthrough publications were identified6 by isolating publications that have sufficient citations at its five-year anniversary to be in the top 1% of its peer group (matching Journal Subject Category7 and Document Type7). For more recent publications that are less than five-year old, projected 5-year citations was obtained by linear extrapolation. In this way, publications are compared only to its peers within the same JSC and with the same Document Type (e.g. Article, Review). This is noteworthy because it is sometimes the case that certain types of documents tend to garner more citations over time and because of this the projected number of citations will be different across JSCs and Document Types. For example, Review articles tend to attract a wider readership, and hence more citations. Publications with actual or projected citation counts surpassing the threshold within their JSC and Document type category are deemed to be potential breakthroughs. Following this procedure, five CPTAC publications were identified to be potential breakthroughs. These are listed in Table 4-1 below.
Table 4-1: Newly identified potential breakthrough publications for CPTAC1 and 2
The final three columns in Table 4-1 indicate, from left to right, the total number of citations the paper has accumulated to date, the number of citations the publication was projected to have five years after publication date (for papers older than 5 years, the actual number of citations is available and is listed
6Ponomarev IV et al., Predicting highly cited papers: A Method for Early Detection of Candidate Breakthroughs., Technological Forecasting and Social Change, 81:49-55, 2014 7 See Appendix A for definition
Phase PCCs Publication Total Citation Count to
date
5-Year Citation Count (project
or actual)
Breakthrough 5-Year Citation
Threshold CPTAC1 Broad Keshishian, Hasmik et al., Quantitative,
multiplexed assays for low abundance proteins in plasma by targeted mass spectrometry and stable isotope dilution, MOLECULAR & CELLULAR PROTEOMICS (2007) (Article)
364 251 (actual)
213
CPTAC1 Broad Mueller, Lukas N et al., An assessment of software solutions for the analysis of mass spectrometry based quantitative proteomics data, JOURNAL OF PROTEOME RESEARCH (2008) (Review)
243 201 (actual)
201
CPTAC1 Broad, MSKCC, Purdue, UCSF, Vanderbilt
Addona, Terri A et al., Multi-site assessment of the precision and reproducibility of multiple reaction monitoring-based measurements of proteins in plasma, NATURE BIOTECHNOLOGY (2009) (Article)
413 374 (actual)
210
CPTAC1 Purdue, UCSF
Drake, Penelope M et al., Sweetening the Pot: Adding Glycosylation to the Biomarker Discovery Equation, CLINICAL CHEMISTRY (2010) (Review)
99 98 (actual)
79
CPTAC2 Vanderbilt Wang, Jing et al., WEB-based GEne SeT AnaLysis Toolkit (WebGestalt): update 2013, NUCLEIC ACIDS RESEARCH (2013) (Article)
78 163 (projected)
154
9

instead), and the threshold number of citations a paper should receive in order to become a breakthrough
publication. As citations take some time to accumulate, it is still relatively early to determine if other CPTAC2 papers will accumulate the minimum number of 5-year threshold citations to qualify as potential breakthroughs. A search for recent CPTAC2 publications indicated 3 papers of interest (Table 4-2). In 2014, several publications were notable, which includes the first program-wide study on utilizing CPTAC developed platforms to characterize a tumor type (Zhang et al., 2014). While it is too early for sufficient citations to have been accumulated for definitive assessment, the expectation is that these publications will be the benchmark that demonstrates the effectiveness of the CPTAC program in accelerating proteomic research.
Publication Citations Zhang, Bing et al., Proteogenomic characterization of human colon and rectal cancer, NATURE (September 2014) 12
Kim, Min-Sik et al., A draft map of the human proteome, NATURE (May 2014) 46
Kennedy, Jacob J et al., Demonstrating the feasibility of large-scale development of standardized assays to quantify human proteins, NATURE METHODS (February 2014) 5
Table 4-2: Recently notable publications for CPTAC2
Other than metrics based on citation rates, another method for measuring uptake by the scientific community is to examine the journal quality of published CPTAC research. It is expected that journals with higher impact factors will attract a larger readership. An examination of the journal quality of CPTAC research indicates that CPTAC publications were consistently published in the first quartile (top 25%) of journals as ranked by Journal Impact Factor (JIF) (Figure 4-2).
10

Figure 4-2: Distribution of all CPTAC1 and 2 publications across Journal Impact Factor quartiles of publication source
The JIF distribution of CPTAC publications was also compared against other NCI funded cooperative research programs. NCI Program Staff used NIH RePORTER to search and download all relevant scientific publications linked to a number of different translational and collaborative research programs sponsored by the NCI8 based off their Request for Funding Application (RFA) numbers. Specifically, CPTAC2 was compared to non-CPTAC NCI cooperative programs (i.e., Early Detection Research Network (EDRN), Integrative Cancer Biology Program (ICBP), NCI Alliance for Nanotechnology in Cancer (NANO), and TCGA). This comparison is shown in Figure 4-3 and indicates that approximately 85% of CPTAC2 publications are published in top quartile publications. The distribution by JIF is not markedly different between CPTAC and the publication outputs of other research programs, with the exception of TCGA.
Figure 4-3: Distribution of JIF Quartile Ranking in NIH RePORTER
8 See Appendix B “JIF Analysis Methodology” for details 11

On a final note pertaining to research uptake, CPTAC has established web portals where data and resources generated by CPTAC investigators can be used by the broader community. These include:
• CPTAC Data Portal (proteomics.cancer.gov): launched in 2012, 6.2 TB raw file (or 89 TB equivalent)downloaded
• CPTAC Assay Portal (assay.cancer.gov): launched in 2015 with 554 standardized targeted assays,has 4,800 users per month
• CPTAC Antibody Portal (antibodies.cancer.gov): launched in the fourth quarter of 2008 with 314mAbs. 2,171 units have been distributed.
Caveat: There is an embargo period that ends 15 months after public release of data on CPTAC Data Portal, or ends when a CPTAC study is published. Non-CPTAC scientists may use the data for their research, but may not publish until after the embargo period is over. Therefore, we do not expect work citing CPTAC data before corresponding embargo dates. These include data for:
• Colorectal cancer (embargo period ended September 20149)• Breast cancer (May 2015)• Ovarian cancer (September 2015)
CONCLUSIONS In general, the key findings of this set of analyses can be summarized as follows:
Question #1 Key Findings • There was a notably higher publication rate (number of publications per unit time) for CPTAC2
(12.3 publications per year) than CPTAC1 (7.6 publications per year) (Figure 1-1).• Intra-CPTAC PCC collaborations have generally increased and included more investigators between
PCCs within CPTAC1 and 2.
Question #2 Key Findings • There has been a notable migration from a focus on technology development to biological
applications from CPTAC1 to CPTAC 2 (Figure 2-1).• The majority of non-CPTAC work citing CPTAC research has been published in more biology-related
Journal Subject Categories in CPTAC2 than in CPTAC1 (Figure 2-2).
Question #3 Key Findings • A modest increase in the amount of collaboration between TCGA and CPTAC2 researchers is noted
(Figure 3-1 and Figure 3-2), despite low levels of familiarity TCGA researchers had regardingCPTAC2 (Figure 3-3). This has resulted in only two grant applications co-led by TCGA and CPTAC2researchers.
Question #4 Key Findings
9 Zhang B et al., Proteogenomic characterization of human colon and rectal cancer, Nature 513(7518):382-387, September 2014 12

• In general, both CPTAC1 and 2 research have been well-cited, with above-average citation ratesover all years (Figure 4-1).
• The vast majority of CPTAC1 and 2 publications were published in top-quartile journals whencompared to other publications in Web of Science globally and other publications produced fromnon-CPTAC NCI cooperative programs (Figures 4-2 and 4-3).
• The external scientific community has shown strong interest in CPTAC research, citing CPTAC morethan 1500 times by investigators from over 200 non-CPTAC institutions.
• Five potential breakthrough publications (Table 4-1) and three notable publications (Table 4-2)were identified.
13

RECOMMENDATIONS
Cross-over to more Biology-related research platforms There are early indications that CPTAC2 research has succeeded in crossing over to address more cancer biology-questions while using technology platforms developed in CPTAC1. Future study may confirm that this crossover has become more apparent. It has been shown that the median lag to publication for a new grant is 3 years10 and it typically takes a few more years for the publication to be cited. Due to the short time scope of CPTAC2 evaluation, the full scope and scale of this crossover may not be fully understood. Demonstrable applications of CPTAC-developed standards in other tumor types can provide the necessary tools to jump start proteomic research in additional cancer areas.
Leveraging Collaborative Infrastructure to fast-track Proteomic Research beyond CPTAC Much of the intra-CPTAC and CPTAC-TCGA collaborations are not CPTAC-funded indicating the infrastructure created could be leveraged for research studies beyond specific topics outlined within the CPTAC program
Inter-TCGA-CPTAC Collaboration Efforts to increase exposure of genomic-focused researchers to the CPTAC mission and activities such as targeted workshops may result in more collaboration between the groups. Existing CPTAC researchers who are also TCGA members could potentially facilitate this effort.
Translational Research Acceleration While there has been a shift in focus from technology development to biology discovery, the majority of CPTAC research remains in Biochemical Research Methods. To accelerate translational research, additional infrastructure and resources that foster eventual clinical trial studies are recommended.
10 Boyack KW, Jordan P, Metrics associated with NIH funding: a high-level view. Journal of the American Medical Informatics Association 18:423-431, 2011 14

APPENDIX A:
Journal Subject Category (JSC) – Each Web of Science Core Collections record is assigned to a subject category depending on the classification of its publication source. The Web of Science scheme comprises more than 250 subject areas in science, social sciences, and arts & humanities. Many broad areas such as physics and materials science are represented by smaller subfields. Records may be classified to more than one category. Full list of JSC: http://incites.isiknowledge.com/common/help/h_field_category_wos.html A list of Journals according to JSC: http://science.thomsonreuters.com/cgi-bin/jrnlst/jlsubcatg.cgi?PC=D
Document Type - Each Web of Science Core Collection record can be classified as one of 38 different document types. Several common types of document are, i.e. Article, Meeting Abstract, Review, etc.
Focus Classification – A list of CPTAC1 and 2 publications provided to Thomson Reuters by NCI CPTAC were classified (as defined by NCI program staff) as either ‘Biology’ or ‘Technology’.
APPENDIX B: Methodology Details
Mapping Journal Subject Categories to Biology and Technology A mapping between the Biology/Technology classifications and Journal Subject Category classifications was defined using CPTAC papers. A Journal Subject Category was considered “Biology” if among the CPTAC papers in that JSC, there were more “Biology” papers than “Technology” papers. If there were more “Technology” CPTAC papers, than the JSC was considered “Technology.” A Journal Subject Category was both “Biology” and “Technology” if there was an even split of CPTAC papers. We then found the Journal Subject Categories of the non-CPTAC publications citing CPTAC work and use the mapping to infer whether these publications could be classified as either Biology or Technology. The results of this procedure are shown in Figure 2-2 as boxes labeled either ‘Biology’ or ‘Technology.’ The papers classified to the JSC of Genetics & Heredity were split evenly between the Biology and Technology classifications.
JIF Analysis Methodology NCI Program Staff used NIH RePORTer (http://projectreporter.nih.gov/reporter.cfm) to search and download all relevant scientific publications linked to the number of different RFA for other translational and collaborative research programs sponsored by the NCI.
The following RFAs were selected: RFA-CA-09-010, RFA-CA-09-011, RFA-CA-09-012, RFA-CA-09-013, RFA-CA-09-014, RFA-CA-09-017, RFA-CA-09-018, RFA-CA-09-019, RFA-CA-09-020 and RFA-CA-10-016.
All publications that were linked to the RFA by their respective grant numbers were included as outputs from the RFA inclusive of publications from Type-2 grant applications. No date range was imposed upon the publication search.
The Journal Citation Reports published by Thomson Reuters provides annual ranking of journals in their respective journal subject categories based on their Journal Impact Factor (JIF). JIF Quartile ranking for
15

each journal is derived from the JIF distribution of the journal’s respective subject category in a year. Thus, a journal is in the top quartile if its JIF falls within the range of the top 25% of the JIF distribution.
APPENDIX C: Additional CPTAC Publications Identified
The following CPTAC studies were published or indexed after our analysis had begun, and thus could not be included in the analysis.
1. Zawadzka, Anna M et al. Variation and quantification among a target set of phosphopeptides in humanplasma by multiple reaction monitoring and SWATH-MS2 data-independent acquisition.ELECTROPHORESIS. 35(24):3487-3497. 2014.
2. Tripathi, Brajendra K et al. CDK5 is a major regulator of the tumor suppressor DLC1. JOURNAL OF CELLBIOLOGY. 207(5):627-642. 2014.
3. Xu, Zhe et al. Comprehensive Quantitative Analysis of Ovarian and Breast Cancer Tumor Peptidomes.JOURNAL OF PROTEOME RESEARCH. 14(1):422-433. 2015.
4. Yang, Shuang et al. Glycoproteins identified from heart failure and treatment models. PROTEOMICS.15(2-3):567-579. 2015.
5. Blair, Brian G et al. A phosphoproteomic screen demonstrates differential dependence on HER3 forMAP kinase pathway activation by distinct PIK3CA mutations. PROTEOMICS. 15(2-3):318-326. 2015.
6. Tian, Ye et al. KDDN: an open-source Cytoscape app for constructing differential dependencynetworks with significant rewiring. BIOINFORMATICS. 31(2):287-289. 2015.
16