NATIONAL BIODIVERSITY FINANCE PLAN · Aidan Jullian Asekenye National Environment Management...
66
NATIONAL BIODIVERSITY FINANCE PLAN 2019/20 - 2027/28 THE REPUBLIC OF UGANDA MAY 2019
Transcript of NATIONAL BIODIVERSITY FINANCE PLAN · Aidan Jullian Asekenye National Environment Management...

NATIONAL BIODIVERSITY FINANCE PLAN
2019/20 - 2027/28
THE REPUBLIC OF UGANDA
MAY 2019


MAY 2019
THE REPUBLIC OF UGANDA
NATIONAL BIODIVERSITY FINANCE PLAN
2019/20 - 2027/28


Copyright ©2019 by National Environment Management Authority (NEMA)
NATIONAL ENVIRONMENT MANAGEMENT AUTHORITY (NEMA)P.O. Box 22255 Kampala, UgandaCitation: NEMA, UNDP and Global BIOFIN (2019), National Biodiversity Finance Plan, National Environment Management Authority, Kampala
ISBN: 978-9970-881-15-4
Editorial Team
Editors in Chief
Sabino Francis Ogwal BIOFIN National Project CoordinatorNational Environment Management Authority
David Meyers Former - Senior Technical Advisor, Global BIOFIN Project
Hervé Barois Regional Technical Advisor, Global BIOFIN Project
Editors
Tom O. Okurut National Environment Management Authority
Elizabeth Birabwa Aliro Economic Policy Research Centre
Evelyn Lutalo National Environment Management Authority
Fred Onyai National Environment Management Authority
James Elungat National Environment Management Authority
Mary Nabatanzi ENR Africa Centre
Monique Akullo BIOFIN/National Environment Management Authority
Aidan Jullian Asekenye National Environment Management Authority
Bob Nuwagira National Environment Management Authority
Elizabeth Mutayanjulwa National Environment Management Authority
Patience Nsereko National Environment Management Authority
National BIOFIN Expert Team
Moses Masiga BIOFIN - Biodiversity/ Environmental Economics National Expert
Francis Mwaura BIOFIN - Private Finance /Business National Expert
Fred Roland Muwanika BIOFIN - Private Finance /Business National Expert


National Biodiversity Finance Plan i
FOREWORD
The world is facing unprecedented loss of biodiversity. As many as 70 percent of the world’s known species are at risk of extinction. These trends have profound implications for human wellbeing particularly for the world’s poorest communities who depend on biodiversity and ecosystem services for the basic necessities of life. In Uganda, the loss of biodiversity is observed in the high loss of forest cover, degradation of wetland resources, extinction of species and pollution of aquatic ecosystems especially streams, rivers and lakes.
The Government of Uganda, basing on its commitment as a Party to the Convention on Biological Diversity (CBD) supported by the United Nations Development Programme (UNDP) participated in the Global Biodiversity Finance Initiative (BIOFIN) project. The objective of the project is to assist developing countries in identifying, accessing, combining and sequencing sources of biodiversity funding to meet their specific needs hence closing the global financing gaps for conservation and sustainable use of biological diversity.
BIOFIN is a UNDP-managed global partnership that supports countries to enhance their financial management for biodiversity and ecosystems. Whereas BIOFIN was developed in response to resource mobilisation challenges identified by the 10th Conference of the Parties (COP-10) of the CBD, in Uganda financial limitations were highlighted in both the first and second National Biodiversity Strategy and Action Plan (NBSAP I and NBSAP II).
The National Biodiversity Finance Plan is the ultimate result of the BIOFIN project in Uganda. It was developed through wide stakeholder consultation. The Plan is the final product of a three-year process that also comprised the Biodiversity Policy and Institutional Review, the Biodiversity Expenditure Review and the biodiversity Finance Needs Assessment. The Plan streamlines and articulates the national priorities for financial resource mobilisation for biodiversity management for period 2019/20 up to 2027/28.
Uganda’s National Biodiversity Finance Plan comprises eight finance solutions that capture a breadth of innovation and practicability. All the finance solutions are focused on increasing investment into biodiversity including for restoration and protection of biodiversity, which a core element of NBSAPII, the National Development Plan II and Vision 2040. The Plan has been developed to support Ministry of Finance, Planning and Economic Development in planning, budgeting and allocation of financial resources for biodiversity conservation and management for the sustainable national development and human wellbeing. I call up on all stakeholders to use this Plan for mobilizing additional resources for biodiversity management in Uganda.
………………………………………………..
Hon. Sam Cheptoris
MINISTER FOR WATER AND ENVIRONMENT

National Biodiversity Finance Plan ii
ACKNOWLEDGMENTS
The National Environment Management Authority (NEMA), on behalf of the Government of Uganda (GoU), the United Nations Development Programme (UNDP) and the Biodiversity Finance Initiative (BIOFIN) extend gratitude to all stakeholders who have made contribution towards the development and completion of the National Biodiversity Finance Plan (NBFP). The NBFP was developed in a participatory BIOFIN process involving private sector, civil society, Ministries, Agencies and Local Governments (MALGs). The following institutions are specifically acknowledged:
Minister of Finance, Planning and Economic DevelopmentMinistry of Water and EnvironmentMinistry of Tourism, Wildlife and AntiquitiesMinistry of Agriculture, Animal Industry and Fisheries -Department of FisheriesMineral of Energy and Mineral DevelopmentMinistry of Works and TransportMinistry of Local GovernmentMinistry of Gender, Labour and Social DevelopmentNational Planning Authority Uganda National Council for Science and TechnologyNational Agricultural Research Organization and the affiliate Research InstitutesNational Forestry AuthorityUganda Wildlife Authority/ Bwindi Impenetrable National ParkNational Animal Genetic Resources Centre & Data Bank Uganda Export Promotion BoardUganda Bureau of StatisticsMakerere University College of Agriculture & Environmental Sciences Makerere University College of Natural SciencesDistrict Local of GovernmentsTechnical Committee on Biodiversity ConservationWildlife Conservation SocietyUganda Wildlife Education CentreRhino Fund UgandaBujagali Hydro Power Station Isimba Hydro Power StationNature UgandaInternational Union for the Conservation of Nature (IUCN)World Wide Fund (WWF)Kayonza Tea Factory (in Kanungu District)Total E & P Uganda
NEMA acknowledges the technical support from the United Nation Development Programme Country Office (UNDP-CO), UNDP Global BIOFIN project. NEMA is grateful to European Union (EU), the Government of Germany, Norway, Switzerland and the Flanders for the financial support from. The Technical Steering Committee for the project played a very critical in reviewing and providing technical support. NEMA appreciates their contribution.

National Biodiversity Finance Plan iii
NEMA commends Mr. Sabino Francis Ogwal, the Natural Resources Manager (Biodiversity and Rangelands) who is also the CBD National Focal Point and Ms. Monique Akullo, the Senior Internal Monitoring Officer (NEMA)/ Project Management Officer (BIOFIN) for effectively coordinating and guiding the BIOFIN project on behalf of the Government.
………………………………………………..Dr. Tom O. OkurutEXECUTIVE DIRECTORNATIONAL ENVIRONMENT MANAGEMENT AUTHORITY

National Biodiversity Finance Plan iv
ACRONYMS
AfDB African Development BankBER Biodiversity Expenditure ReviewBFP Biodiversity Finance PlanBMCT Bwindi Mgahinga Conservation TrustCECF Community Environment Conservation FundDWRM Directorate of Water Resources Management ECOTRUST Environmental Conservation Trust (Uganda)FAO Food and Agriculture Organisation of the United Nations FNA Finance Needs AssessmentGEF Global Environment FacilityIFOAM International Federation of Organic Agriculture MovementIPLCs Indigenous Peoples and Local CommunitiesIUCN International Union for the Conservation of NatureIWRM Integrated Water Resource ManagementLGFC Local Government Finance Commission MAAIF Ministry of Agriculture, Animal Industry and Fisheries MALGs Ministries Agencies Local GovernmentsMEMD Ministry of Energy and Mineral DevelopmentMFPED Ministry of Finance Planning and Economic DevelopmentMoJCA Ministry of Justice and Constitutional AffairsMoLG Ministry of Local GovernmentMTWA Ministry of Tourism Wildlife and AntiquitiesMWE Ministry of Water and EnvironmentNBSAP National Biodiversity Strategy and Action PlanNCA National Capital AccountNCCP National Climate Change PolicyNDC Nationally Determined ContributionsNDP National Development PlanNEMA National Environment Management Authority NFA National Forestry AuthorityNOGAMU National Organic Agriculture Movement of Uganda NPA National Planning AuthorityNWSC National Water and Sewerage CorporationPIR Policy and Institutional ReviewPSFU Private Sector Foundation UgandaSDGs Sustainable Development GoalsSNA Systems of National AccountsUBTF Uganda Biodiversity Trust FundUGGDS Uganda Green Growth Development StrategyUNDP United Nations Development ProgrammeUNEP United Nations Environnent Programme/ UN EnvironnentUSAID United States Agency for International DevelopmentUWA Uganda Wildlife AuthorityUWCEC Uganda Wildlife Conservation Education CentreWCS Wildlife Conservation SocietyWWF World Wide Fund for Nature
National Biodiversity Finance Plan v
EXECUTIVE SUMMARY
As the world faces unprecedented loss of biodiversity, Uganda too is losing its biodiversity and ecosystems at a very high rate. Since 1990, Uganda has lost over 62.5% of its forest cover and the functional wetland area halved from 15.6% to 8% of land cover due to degradation. The pollution pressure from effluent discharges on the main lake system, the Lake Victoria, in Kampala and Jinja cities has constrained abstraction of water for domestic and industrial use, and reduced fishing and tourism activities in the main bays. Loss of forest, farmland, wetlands and freshwater habitat has led to the decline in species abundance which in turn continues to reduce the ecosystem services including flood control, effluent treatment and pollution regulation, pollinator services for crops, and provisioning of wood, and foods, among others.
Uganda’s second National Biodiversity Strategy and Action Plan (NBSAP II) concluded that inadequate financial resources for implementing planned activities was one of the key barriers limiting realisation of the country’ biodiversity targets. The Government set about addressing the financial barrier by developing guidelines and actions for financing biodiversity conservation in Uganda. In 2015, the Government embarked on a definitive process of developing a financial resource mobilisation plan when it joined the Biodiversity Finance Initiative (BIOFIN). BIOFIN was developed in response to the 10th Conference of the Parties (COP-10) of the Convention on Biological Diversity (CBD) which identified the need for better information on current expenditures and financing needs, and for a comprehensive methodology to develop resource mobilization strategies. At country level, BIOFIN brought together a core group of national stakeholders from the ministries, water for environment (MWE); Tourism, Wildlife and Antiquities (MTWA); Energy and Mineral Development (MEMD); Agriculture, Animal Industry and Fisheries (MAAIF); Local Government (MoLG); and Gender, Labour and Social Development (MoGLSD), the private sector (Private Sector Foundation Uganda-PSFU), and civil society (including the International Union for the Conservation of Nature – IUCN, Environment Conservation Trust (ECOTRUST) Uganda, and Nature Uganda) to implement a road map that led to this National Biodiversity Finance Plan. Uganda’s BIOFIN project produced four outputs, the Biodiversity Policy and Institutional Review (PIR), the Biodiversity Expenditure Review (BER), the Biodiversity Finance Needs Assessment (FNA), and the National Biodiversity Finance Plan (NBFP).
The Vision for Uganda’s NBFP is “sustainable and innovative financing for biodiversity conservation and management attained by 2027/28”. The mission of the NBFP is “to mobilise adequate additional financial resources to meet the biodiversity funding gap as well as ensure that funds are used efficiently and effectively to address the biodiversity and ecosystem challenges in biodiversity and ecosystem conservation and management.”
The goal of the plan is to achieve “optimal and sustainable financing for biodiversity conservation and management attained by 2027/28.” Three objectives complement the goal of the NBFP. The objectives are: (i) to develop and implement a biodiversity and ecosystem index and payments for ecosystem services; (ii) enhance the use of economic instruments as incentives for biodiversity conservation and management; and (iii) scale up innovative biodiversity management and conservation actions that enhance livelihoods and increase national revenue. The eight finance solutions are:
1. A national biodiversity and ecosystem index and biodiversity fiscal transfers.2. A national programme on payments for ecosystem services. 3. Scaling up bottom-up enforcement for biodiversity and ecosystem management based on community
regulatory systems and incentives model.4. Upgrading the ecotourism value chain for Ramsar sites and Kampala city and Mbarara municipality.5. Upgrading the value chain for organic agriculture, natural ingredient, cosmetics and pharmaceuticals.6. Rationalise and implement revised charge systems for biodiversity and ecosystem conservation and
management.7. A financing model for biodiversity conservation for central forest reserves.8. Standardize and regulate implementation of biodiversity offsets.

National Biodiversity Finance Plan vi
In the governance framework for Uganda’s NBFP the Ministry of Finance Planning and Economic Development (MFPED) provides overall leadership. At the core of the framework is an overlap functions and respective leadership on implementation of restoration and maintenance actions, generation of financial resources and maintenance of a National Biodiversity Mitigation Banking system between NEMA, Ministries, Agencies and Local Governments (MALGs).
Governance framework for the NBFPResource mobilisation strategy for implementing the Plan proposes four main sources of financing, support from donors and government through grants and/or budgetary and non-budget support, own revenue mobilised from non-tax revenues, revenues mobilised for biodiversity conservation and stored in the different biodiversity funds, particularly the National Biodiversity Mitigation Banking System that will be integrated as window of the National Environment Fund (NEF) in NEMA. Private sector will provide finance through investments under the innovative public-private-producer partnership (4Ps) (IFAD/MAAIF 2017). The 4 Ps innovations emerged because many times, the communities continue to have a stewardship and ecosystem services access to biodiversity. There is a risk that a public-private partnership may push local stewards out of the biodiversity and ecosystems as they are not part of the memorandums of understanding. Under 4 Ps the communities are part and parcel of the sustainable development and use of biodiversity to mobilise additional financing for biodiversity management.
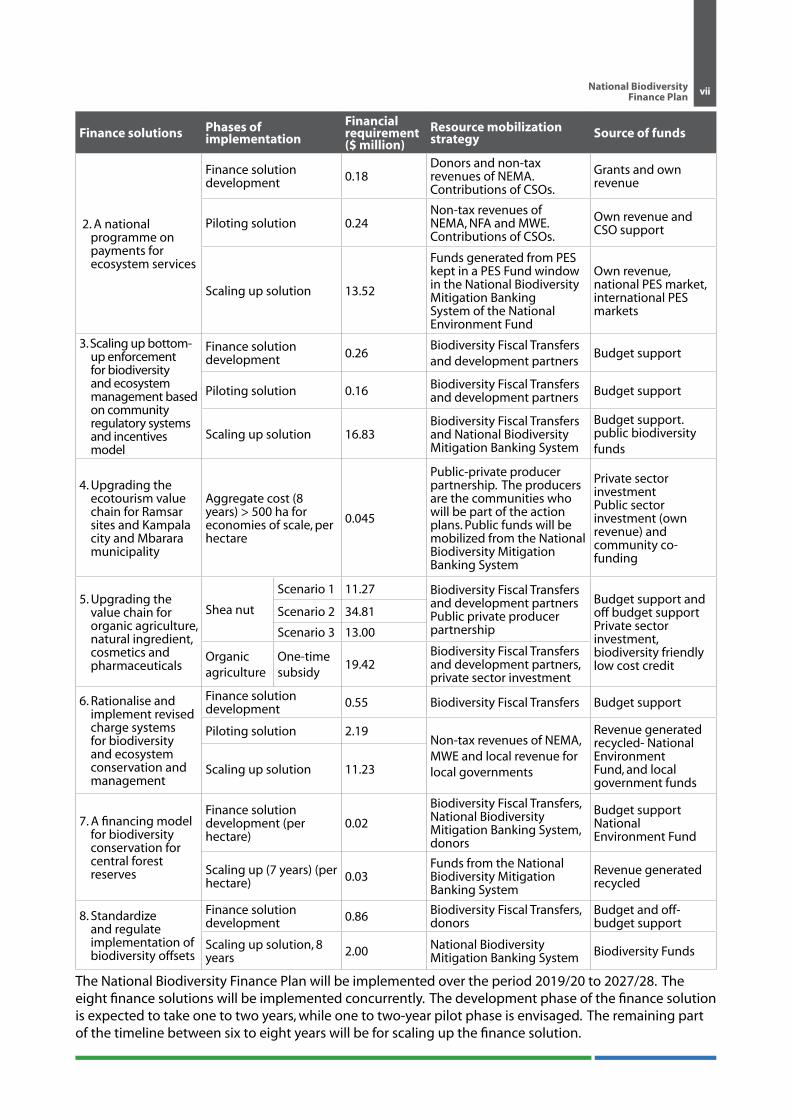
Summarised financial resource mobilisation strategy for the NBFP
Finance solutions Phases of implementation
Financial requirement ($ million)
Resource mobilization strategy Source of funds
1. A national biodiversity and ecosystem index and biodiversity fiscal transfers.
Finance solution development 0.30
Donors and non-tax revenues of NEMA, MWE and local revenue for local governments
Grants and own revenue
Piloting solution 0.24 Biodiversity Fiscal Transfers and Development partners
Grants - international biodiversity conservation funds
Scaling up solution, 6 years 19.93
Funds from the National Biodiversity Mitigation Banking System, and Biodiversity Fiscal Transfers
Own revenue and grants
MFPED Public Sector
budget and off budgetNational
Planning Authority; and Office of prime
Minister
Donors/ development
partners
Private Sector
Civil Society Organizations
National biodiversity managers
RegulatorCommunities
and Local Governments
National Biodiversity Finance Plan vii
Finance solutions Phases of implementation
Financial requirement ($ million)
Resource mobilization strategy Source of funds
2. A national programme on payments for ecosystem services
Finance solution development 0.18
Donors and non-tax revenues of NEMA. Contributions of CSOs.
Grants and own revenue
Piloting solution 0.24Non-tax revenues of NEMA, NFA and MWE. Contributions of CSOs.
Own revenue and CSO support
Scaling up solution 13.52
Funds generated from PES kept in a PES Fund window in the National Biodiversity Mitigation Banking System of the National Environment Fund
Own revenue, national PES market, international PES markets
3. Scaling up bottom-up enforcement for biodiversity and ecosystem management based on community regulatory systems and incentives model
Finance solution development 0.26
Biodiversity Fiscal Transfers and development partners
Budget support
Piloting solution 0.16 Biodiversity Fiscal Transfers and development partners Budget support
Scaling up solution 16.83Biodiversity Fiscal Transfers and National Biodiversity Mitigation Banking System
Budget support. public biodiversity funds
4. Upgrading the ecotourism value chain for Ramsar sites and Kampala city and Mbarara municipality
Aggregate cost (8 years) > 500 ha for economies of scale, per hectare
0.045
Public-private producer partnership. The producers are the communities who will be part of the action plans. Public funds will be mobilized from the National Biodiversity Mitigation Banking System
Private sector investmentPublic sector investment (own revenue) and community co-funding
5. Upgrading the value chain for organic agriculture, natural ingredient, cosmetics and pharmaceuticals
Shea nut
Scenario 1 11.27 Biodiversity Fiscal Transfers and development partnersPublic private producer partnership
Budget support and off budget support Private sector investment,biodiversity friendly low cost credit
Scenario 2 34.81
Scenario 3 13.00
Organic agriculture
One-time subsidy
19.42Biodiversity Fiscal Transfers and development partners, private sector investment
6. Rationalise and implement revised charge systems for biodiversity and ecosystem conservation and management
Finance solution development 0.55 Biodiversity Fiscal Transfers Budget support
Piloting solution 2.19Non-tax revenues of NEMA, MWE and local revenue for local governments
Revenue generated recycled- National Environment Fund, and local government funds
Scaling up solution 11.23
7. A financing model for biodiversity conservation for central forest reserves
Finance solution development (per hectare)
0.02
Biodiversity Fiscal Transfers, National Biodiversity Mitigation Banking System, donors
Budget supportNational Environment Fund
Scaling up (7 years) (per hectare) 0.03
Funds from the National Biodiversity Mitigation Banking System
Revenue generated recycled
8. Standardize and regulate implementation of biodiversity offsets
Finance solution development 0.86 Biodiversity Fiscal Transfers,
donors Budget and off-budget support
Scaling up solution, 8 years 2.00 National Biodiversity
Mitigation Banking System Biodiversity Funds
The National Biodiversity Finance Plan will be implemented over the period 2019/20 to 2027/28. The eight finance solutions will be implemented concurrently. The development phase of the finance solution is expected to take one to two years, while one to two-year pilot phase is envisaged. The remaining part of the timeline between six to eight years will be for scaling up the finance solution.

National Biodiversity Finance Plan viii
TABLE OF CONTENTS
FOREWORD ............................................................................................................................................................................................ iACKNOWLEDGMENTS ......................................................................................................................................................................... iiACRONYMS ......................................................................................................................................................................................... ivEXECUTIVE SUMMARY ........................................................................................................................................................................ v
1. THE BIODIVERSITY CONSERVATION AND MANAGEMENT CHALLENGE .............................................................1
1.1 Importance of biodiversity in Uganda ..........................................................................................................................1
1.2 Challenges of biodiversity and ecosystems conservation and management ..............................................2
1.3.1 Forestry resources ..................................................................................................................................................................2
1.3.2 Wetland resources .................................................................................................................................................................4
1.3.3 Species diversity .....................................................................................................................................................................5
1.3.4 Link between finance solutions and NBSAP II targets ............................................................................................5
1.3.5 Limitations of current regulatory and enforcement mechanisms .....................................................................6
1.4 Finance Plan Targets .......................................................................................................................................................... 12
2. VISION, MISSION, GOAL AND BIODIVERSITY FINANCE SOLUTIONS ................................................................... 13
2.1 Vision of Biodiversity Finance Plan .............................................................................................................................. 13
2.2 The BIOFIN process............................................................................................................................................................. 14
2.3 Goal and objectives and biodiversity finance solutions ..................................................................................... 15
3. FINANCE SOLUTIONS AND THEIR BUSINESS CASE ...................................................................................................... 16
3.1 National biodiversity and ecosystem index and biodiversity fiscal transfers ............................................. 16
3.1.1 The finance solution .......................................................................................................................................................... 16
3.1.2 Proposed Actions ................................................................................................................................................................ 16
3.1.3 Feasibility of finance .......................................................................................................................................................... 18
3.2 National payments for ecosystem services programme .................................................................................... 18
3.2.1 The finance solution .......................................................................................................................................................... 18
3.2.2 Proposed Actions ................................................................................................................................................................ 19
3.2.3 Feasibility of finance solution ........................................................................................................................................ 20
3.3 Scale up bottom-up enforcement for biodiversity and ecosystem management
based on community regulatory systems and incentives model ................................................................... 20
3.3.1 The finance solution .......................................................................................................................................................... 20
3.3.2 Proposed Actions ................................................................................................................................................................ 21
3.3.3 Feasibility of the finance solution ................................................................................................................................ 21
3.4 Upgrading the ecotourism value chain for Uganda ............................................................................................. 22
3.4.1 Introduction .......................................................................................................................................................................... 22
3.4.2 Proposed Actions ................................................................................................................................................................ 22
3.4.3 Feasibility of finance solution ........................................................................................................................................ 23
3.5 Upgrading the value chain for organic agriculture, natural ingredient, cosmetics and pharmaceuticals .................................................................................................................................................................. 24
3.5.1 The finance solution .......................................................................................................................................................... 24
3.5.2 Proposed Actions ................................................................................................................................................................ 25
3.5.3 Feasibility of finance solution ........................................................................................................................................ 25

National Biodiversity Finance Plan ix
3.6 Rationalise and implement revised charge systems for biodiversity and ecosystem
conservation and management ................................................................................................................................... 27
3.6.1 Introduction .......................................................................................................................................................................... 27
3.6.2 Proposed Actions ................................................................................................................................................................ 28
3.6.3 Feasibility of the finance solution ................................................................................................................................ 28
3.7 Financing model for biodiversity conservation for central forest reserves ................................................. 28
3.7.1 The finance solution .......................................................................................................................................................... 28
3.7.2 Proposed Actions ................................................................................................................................................................ 29
3.7.3 Feasibility of the finance solution ................................................................................................................................ 29
3.8 Standardize and regulate implementation of biodiversity offsets ................................................................. 30
3.8.1 Introduction .......................................................................................................................................................................... 30
3.8.2 Proposed Actions ................................................................................................................................................................ 30
3.8.3 Feasibility of the finance solution ................................................................................................................................ 31
4. ACTION PLAN AND FINANCIAL REQUIREMENT ............................................................................................................. 32
4.1 Governance plan and institutional arrangements ................................................................................................ 32
4.2 Enabling conditions ........................................................................................................................................................... 33
4.2.1 Establishment of a National Biodiversity Mitigation Banking system ........................................................... 33
4.2.2 Regulatory, institutional and policy reforms ............................................................................................................ 34
4.2.3 A public-private sector engagement platform on biodiversity ....................................................................... 34
4.2.4 Knowledge networks for biodiversity management and conservation ...................................................... 35
4.2.5 Capacity building to develop and implement feasible and viable biodiversity and ecosystem conservation management projects ........................................................................................................................... 35
4.3 Resource mobilisation strategy for implementation of the plan .................................................................... 35
4.4 Work plan for implementing the NBFP ...................................................................................................................... 37
REFERENCES ........................................................................................................................................................................................ 38
ANNEXES ........................................................................................................................................................................................ 39
ANNEX I: Process of developing the finance solutions and their appropriateness............................................ 39
ANNEX II: Viability assessment for finance solution on developing and implementing biodiversity and ecosystem index and transfers ............................................................................................................................. 40
ANNEX III: Viability assessment for finance solution on national payments for ecosystem services programme .................................................................................................................................................................. 41
ANNEX IV: Viability assessment for finance solution on bottom-up enforcement and compliance for biodiversity and ecosystem conservation and management ................................................................. 42
ANNEX V: Viability assessment for finance solution on rationalising and implementing revised charge systems for biodiversity and ecosystem conservation and management ......................................... 43
ANNEX VI: Viability assessment for finance solution on model for biodiversity conservation for central forest reserves ............................................................................................................................................................. 45
ANNEX VII: Viability assessment for finance solution on standardizing and regulate implementation of biodiversity offsets .................................................................................................................................................... 46
Annex VIII: The Technical Steering Committee for the BIOFIN project ....................................................................... 47
National Biodiversity Finance Plan x
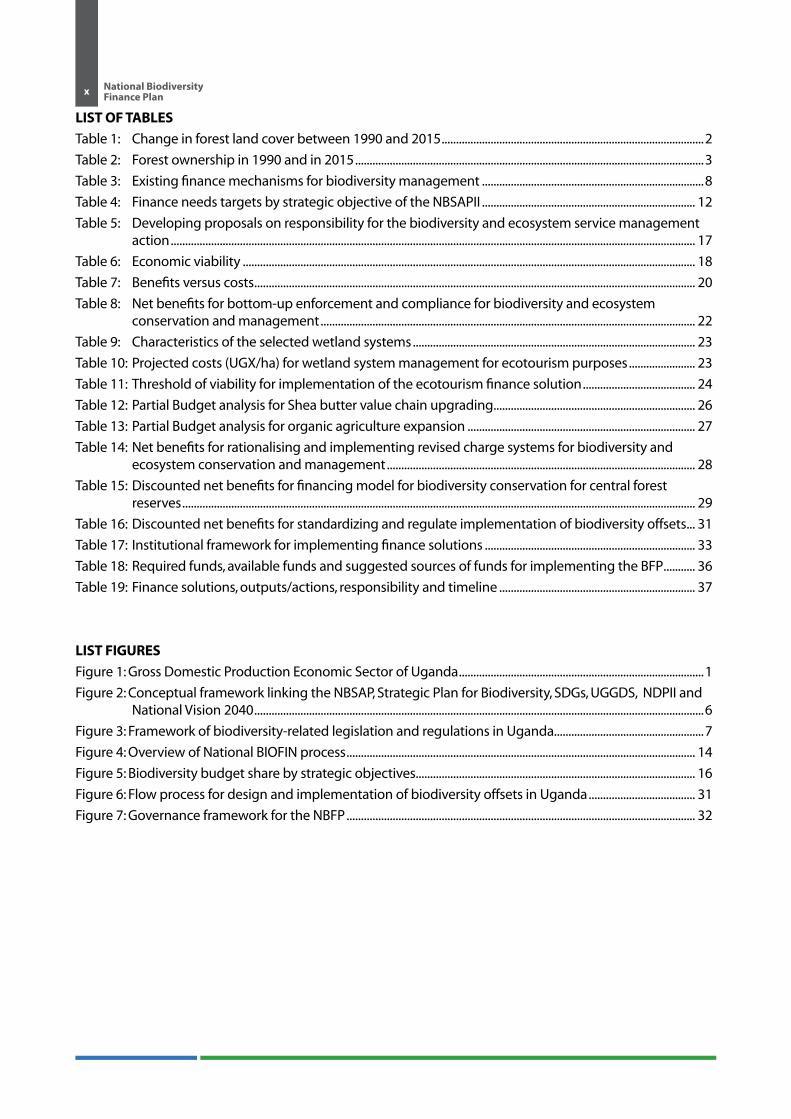
LIST OF TABLES
Table 1: Change in forest land cover between 1990 and 2015 ...........................................................................................2
Table 2: Forest ownership in 1990 and in 2015 .........................................................................................................................3
Table 3: Existing finance mechanisms for biodiversity management .............................................................................8
Table 4: Finance needs targets by strategic objective of the NBSAPII .......................................................................... 12
Table 5: Developing proposals on responsibility for the biodiversity and ecosystem service management action ...................................................................................................................................................................................... 17
Table 6: Economic viability ............................................................................................................................................................. 18
Table 7: Benefits versus costs ......................................................................................................................................................... 20
Table 8: Net benefits for bottom-up enforcement and compliance for biodiversity and ecosystem conservation and management .................................................................................................................................. 22
Table 9: Characteristics of the selected wetland systems .................................................................................................. 23
Table 10: Projected costs (UGX/ha) for wetland system management for ecotourism purposes ....................... 23
Table 11: Threshold of viability for implementation of the ecotourism finance solution ....................................... 24
Table 12: Partial Budget analysis for Shea butter value chain upgrading ...................................................................... 26
Table 13: Partial Budget analysis for organic agriculture expansion ............................................................................... 27
Table 14: Net benefits for rationalising and implementing revised charge systems for biodiversity and ecosystem conservation and management ........................................................................................................... 28
Table 15: Discounted net benefits for financing model for biodiversity conservation for central forest reserves .................................................................................................................................................................................. 29
Table 16: Discounted net benefits for standardizing and regulate implementation of biodiversity offsets ... 31
Table 17: Institutional framework for implementing finance solutions ......................................................................... 33
Table 18: Required funds, available funds and suggested sources of funds for implementing the BFP ........... 36
Table 19: Finance solutions, outputs/actions, responsibility and timeline .................................................................... 37
LIST FIGURES
Figure 1: Gross Domestic Production Economic Sector of Uganda .....................................................................................1
Figure 2: Conceptual framework linking the NBSAP, Strategic Plan for Biodiversity, SDGs, UGGDS, NDPII and National Vision 2040 ............................................................................................................................................................6
Figure 3: Framework of biodiversity-related legislation and regulations in Uganda....................................................7
Figure 4: Overview of National BIOFIN process ......................................................................................................................... 14
Figure 5: Biodiversity budget share by strategic objectives................................................................................................. 16
Figure 6: Flow process for design and implementation of biodiversity offsets in Uganda ..................................... 31
Figure 7: Governance framework for the NBFP ......................................................................................................................... 32
National Biodiversity Finance Plan 1
1. THE BIODIVERSITY CONSERVATION AND MANAGEMENT CHALLENGE
1.1 Importance of biodiversity in Uganda
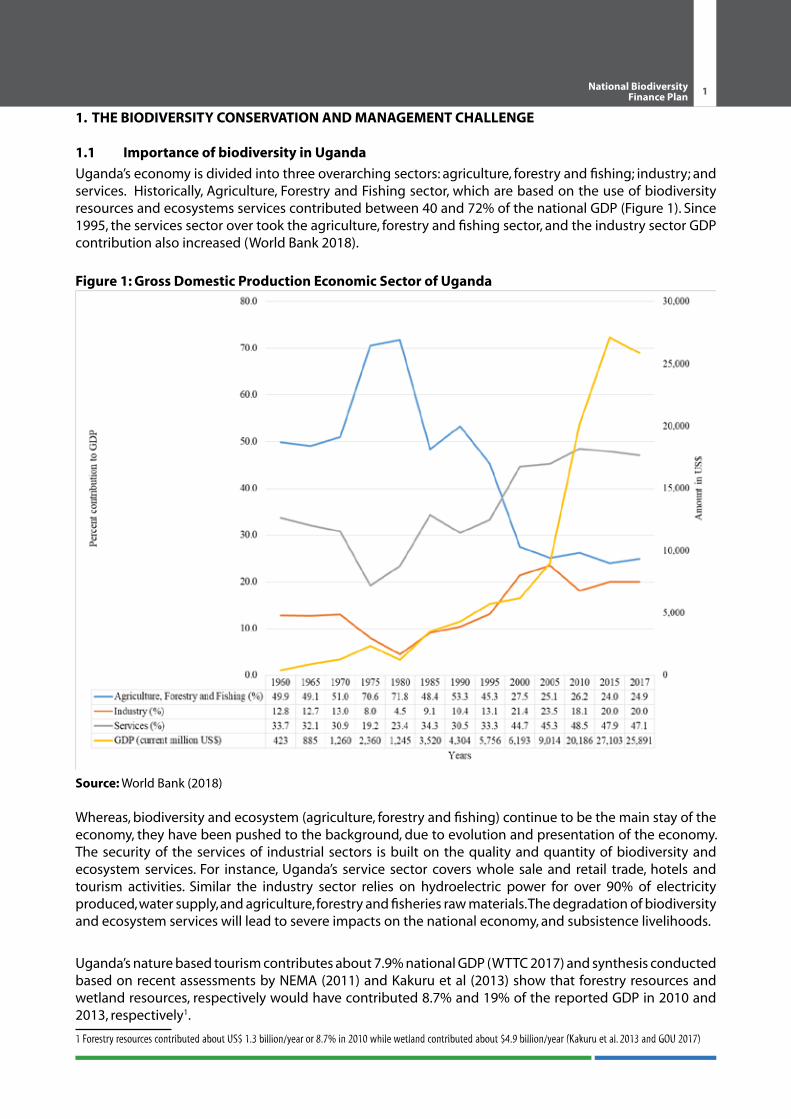
Uganda’s economy is divided into three overarching sectors: agriculture, forestry and fishing; industry; and services. Historically, Agriculture, Forestry and Fishing sector, which are based on the use of biodiversity resources and ecosystems services contributed between 40 and 72% of the national GDP (Figure 1). Since 1995, the services sector over took the agriculture, forestry and fishing sector, and the industry sector GDP contribution also increased (World Bank 2018).
Figure 1: Gross Domestic Production Economic Sector of Uganda
Source: World Bank (2018)
Whereas, biodiversity and ecosystem (agriculture, forestry and fishing) continue to be the main stay of the economy, they have been pushed to the background, due to evolution and presentation of the economy. The security of the services of industrial sectors is built on the quality and quantity of biodiversity and ecosystem services. For instance, Uganda’s service sector covers whole sale and retail trade, hotels and tourism activities. Similar the industry sector relies on hydroelectric power for over 90% of electricity produced, water supply, and agriculture, forestry and fisheries raw materials. The degradation of biodiversity and ecosystem services will lead to severe impacts on the national economy, and subsistence livelihoods.
Uganda’s nature based tourism contributes about 7.9% national GDP (WTTC 2017) and synthesis conducted based on recent assessments by NEMA (2011) and Kakuru et al (2013) show that forestry resources and wetland resources, respectively would have contributed 8.7% and 19% of the reported GDP in 2010 and 2013, respectively1.
1 Forestry resources contributed about US$ 1.3 billion/year or 8.7% in 2010 while wetland contributed about $4.9 billion/year (Kakuru et al. 2013 and GOU 2017)

National Biodiversity Finance Plan 2
Despite the importance of maintaining their direct and indirect contributions to the economy, the general state of biodiversity and ecosystems in Uganda is in decline (NEMA 2014). The clearest evidence of deterioration of biodiversity is provided by the rapid loss of country’s forest estate. Between 1990 and 2015, Uganda lost 62.5% of its forest cover. The forest natural estate declined from 4.9 million ha to 1.83 million ha in just 25 years. The fastest decline of the forest resource occurred between 2005 and 2010, when annual forest cover decline was over 200,000 ha/year (MWE 2016). Wetland resources, particularly in the urban and peri-urban areas have declined considerably with estimated decline from 15.6% of land cover in 1994 to about 8% of land cover by 2010 (GoU 2013). The loss of critical wetland means the remaining wetlands in key urban centres of Kampala city and Jinja Municipality are unable to adequately treat the point source and non-point source waste water from the urban areas that enters into surface water systems. The pollution has resulted into loss of livelihoods of fishing and tourism, and high economic costs of water treatment in Kampala (World Bank 2012) among others.
1.2 Challenges of biodiversity and ecosystems conservation and management
1.3.1 Forestry resources
a) Failure to meet the forest restoration target and to reduce deforestation
The core challenges for the forestry sub-sector are the urgency to slow down the high rate of deforestation, which remains above 85,000 ha per year (Diisi 2018) and achieving the national target to restore 3.0 million ha of forest cover by 2040, i.e. 150,000 ha/year.
Uganda’s forest estate consists of natural forests of Tropical High Forests (THF) well stocked and low-stocked and woodlands, and plantation forests (conifers and broadleaved) (Table 1). The woodlands in Uganda are natural forests with a sparse cover comprising of shrubs and average size trees. Woodland trees produce high quality wood fuel, particularly charcoal. The high deforestation rate that occurred between 2005 and 2015 was largely linked to the targeting of woodlands for charcoal production for domestic consumption in urban areas (NEMA et al. 2016). Tropical High Forests represent prime natural forest estate for wood production including timber and poles, among other wood products. Well stocked and low stocked THF were targeted for timber and land conversion for agriculture (Turyahabwe et al. 2015). The THF are also important habitats for mammals, birds and other species biodiversity. Efforts to expand plantation tree production on private land and in central forest reserves (CFR) have had limited impact. Between 1990 and 2015, Uganda forest plantations expanded by only 75,533 ha against a forest cover loss of 3.05 million ha.
Table 1: Change in forest land cover between 1990 and 2015
Forest category Type of forest1990 2015 Percent change
Hectares Percent Hectares Percent
PlantationsBroad leaved 16,634 0.37 44,298 2.27 166%Conifers 15,699 0.35 63,568 3.25 305%
Natural Forest THF Well stocked 743,154 16.34 529,186 27.09 -29%THF Low stocked 227,373 5.00 102,000 5.22 -55%Woodlands 3,544,793 77.95 1,214,478 62.17 -66%
Total 4,880,000 100.00% 1,953,530 100.00% -57%Source: MWE (2016)
b) Impact of forestry sector reforms and the decentralization processes
The most significant implementation challenge for forestry resources; however, is how to reduce the highest loss of forests cover that occurs on private land (Table 2). Over 75% of forests on private land were lost between 1990 and 2015 (MWE 2016). The high loss of forests on private land was precipitated by a combination of factors linked to changes of forest governance. The forestry sector reforms that produced the National Forestry Policy (2001) and the National Forestry and Tree Planting Act (2003) also replaced and subdivided the management of forests, a role which was centrally under the Forest Department (in the

National Biodiversity Finance Plan 3
then Ministry of Water, Lands and Environment now the Ministry of Water and Environment), into a District Forest Service (DFS) and the National Forestry Authority (NFA). The DFS2 which comprises a District Forest Officer and a Forest Ranger was put in charge of coordinating management of all local forest reserves and forests on private land. Considering that forests on private land were 68% and 64% of the country’s forest estate in 1990 and 2001, the DFS was made the main managers for forest resources in the country. Similarly, the NFA was put in charge of CFRs, which was only 16% of the forest cover in 2003. This was despite the NFA retaining and the NFA retained the core of the technical capacity and financial resource mobilisation capacity of the disbanded Forest Department.
Table 2: Forest ownership in 1990 and in 2015
Types of forest ownership1990 2015 Percent
changeHectares Percent Hectares PercentAll forest area 4,933,271 100% 1,956,664 100% -60%Forests under UWA (National Parks and Wildlife Reserves)
794,881 16% 624,578 32% -21%
Forests under NFA (Central Forest Reserves) 791,240 16% 504,391 26% -36%Forests on Private Land 3,347,150 68% 827,695 42% -75%
Source: MWE (2016)
When the DFS was created there were only 55 districts, which shared between then central government transfers including funding for forestry management. Between 2003 and 2018, the Government increased the number of districts to 121, with each district expected to have an independent DFS with little or no financial support from central government and the DLGs themselves. Consequently, districts lack the capacity to supervise forests management activities on private land.
An increasing population (population growth rate of 3.2%) with a high demand for wood, and a poorly segregated governance system were key drivers to the high deforestation. Other factors such as civil strife in the mainly woodland areas and limited livelihoods options also contributed to the high rates of deforestation.
c) Over harvesting of natural forests in protected areas
Central Forest Reserves, National Parks and Wildlife Reserves, which in addition to being protected areas (PAs) also came under pressure from the high demand for wood fuel and timber. Poor practices such as illegal harvest, overharvesting of natural forests and the poor replanting practice and forest land conversion for agriculture and settlements, among others (Turyahabwe et al 2015) have affected the integrity of forests in PAs and on private land.
d) Failure to address the livelihoods impacts of losers from deforestation
Among the many losers from the high rates of deforestation, the impact on communities living adjacent to forests has been largest. The trade-offs between long-term livelihoods of sustainable wood supply, non-wood forest products such as Shea butter, honey, medicinal plants and fibre as well as the ecosystem services such as an improved microclimate for agricultural production, pollinator services and hydrology has led to poorer households in many areas of northern and central Uganda (CIU 2015 and IUCN and MWE 2018). Communities have a strong dependence on forests ecosystems and ecosystem services and where forest resources were degraded, communities are generally more vulnerability income poverty and food insecurity. Access to forest ecosystem services provides a social safeguards reducing the impacts of poverty, immigration and food insecurity (CIU 2015).
2 The DFS (District Forest Officer and Forest Ranger) are staff of the District Local Governments. The governance change decentralised forestry management for just over 64% of the forest estate in 2003.

National Biodiversity Finance Plan 4
1.3.2 Wetland resourcesa) Reduction in functional area of wetland resources
Uganda’s wetland cover is approximately 10.9% of the land cover 7.6% seasonal wetlands and 3.4% permanent wetlands (MWE/JSR 2017). However, due to the degradation of many wetland areas, the functional wetland area was estimated at 8% (NEMA 2017). Uganda’s strategy on wetlands is to restore “functional” wetlands to long-term land cover of 30,000 km2 (in 1994), 13% of the country’s surface area. The proposed restoration effort was estimated at 523 km2 per year, which would allow the country to increase functional wetland cover from 18,500 km2 (2018) to 30,000 km2 by 2040. Currently, annual average restoration effort is estimated at 13 km2 per year (NEMA 2017). Since FY2016/17 there has been marked improvement in restoration effort. The Ministry of Water and Environment (MWE) reported demarcation of 167.7 km2 of critical wetlands, and restored a total of 476 ha of degraded wetlands. Even though, restoration efforts increased, the high social cost of evacuating largely poor households whose livelihoods are dependent their use of wetlands and wetland ecosystem services reduces the sustainability of wetland management interventions. Because communities are the custodians of the wetland resources, they tend to return to the same degrading activities (paddy rice production, conversion for agricultural lands and settlements, and clay mining for bricks, among others) based on the livelihoods they practiced within the wetlands (GoU 2016).
b) Spatially focused challenges of wetland management
In 2016, the Government of Uganda (GoU) with support from UN Environment and UNDP developed the National Wetland Atlas Volume II (2016). The Atlas showed the wetlands in the country aggregated into seven wetlands basins (Lake Victoria, Lake Kyoga, Lake Albert, Lake Edward, Albert Nile, Achwa River and Albert Nile wetland basins). The challenges of wetland biodiversity and ecosystem management are described below.
The leading indirect drivers for wetland degradation are the high population growth rate in the country (3.2% per annum) and the high urbanization rate of 6.6% (UBOS 2014). Wetlands encroachment is directly related to proximity to built-up area and roads, population density, market accessibility and market influence (Lwasa, 2006). Erratic development plans encourage wetlands degradation with investors including government institutions being licensed to develop wetlands. Wetlands were traditionally seen as vast, cheap and unencumbered land available for development (GoU 20163). Industries put pressure on wetlands through heavy pollution loads and drainage for infrastructure development, among others.
The increasing human population in new and growing urban areas puts pressure on the wetland to provide space for agriculture, settlement and urban development. Encroachment for settlements and increased intensity of use have led to conflict between local communities over right of access and ownership, new economic activities of oil and gas exploration and development, and planned infrastructure development to support the oil and gas development.
Agricultural use of wetlands includes cultivation up to the water line; and waste (including human excreta) disposed off directly into the waters. Sand mining, open defecation and washing bays are all directed at the streams. Most wetlands are under customary land ownership and this at times complicates matters as the communities feel that they can do as they please with the wetlands.
Whereas the Nile Basin wetlands support hydroelectric power generation, and in the Achwa Wetland Basin biodiversity based enterprises of Shea, charcoal and firewood and for water for domestic use and agriculture supports rural livelihoods, the socio-political conditions have not always been conducive. The prolonged insurgency (armed rebellion) intensified poverty and increased dependence on natural resources. Due to the high levels of poverty, unsustainable exploitation of the natural resources including wetlands and the Shea tree, among others places high pressure that limits restoration through natural regeneration. 3 The allocation of wetlands for industrial development, for instance through the Kampala Development Plan 1972, set the stage for wetlands encroachment (GOU
2016).

National Biodiversity Finance Plan 5
Other challenges include encroachment on wetlands that buffer lakes and rivers, where neighbouring communities often ignore the 100m exclusion zone as specified under the law. Much of the natural vegetation that used to stabilise the riverbanks have been replaced with agricultural crops (GOU 2016). Fencing off of private land restricts the communities from freely accessing the wetland resources. Overstocking of livestock has led to hardening of soils, increased runoff, and increased soil erosion and sedimentation (IUCN 2015).
1.3.3 Species diversity
Uganda has a rich species diversity with reported occurrence of over 18,783 species of flora and fauna. However, knowledge of the species diversity is generally confined to a few taxa, specifically; birds, mammals, butterflies, higher plants, reptiles, amphibians and fish. This is because of their relative conspicuousness and economic importance. Little is known about the less conspicuous ones including important forms such as belowground biodiversity. Since 1999, the National Biodiversity Data Bank at the College of Agriculture and Environment Sciences (CAES) Makerere University has spearheaded the production of the State of Uganda’s Biodiversity reports. The state and trends of biodiversity are assessed based on nine indicators under the categories of: agricultural and pastoral areas, tourism, forests, wetlands and open waters, wildlife, biodiversity capital, Albertine Rift, urban areas and the living planet. The current methodology used for assessing biodiversity of species is based on 298 lines of time-series data, covering a period between 1960 and 2016. But the data itself shows that most lines only have data for two years, separated by at least three years while 15 lines have no data yet. The current data set is heavily biased towards birds and mammals with only seven data sets for plants, all of which are trees, monitored, while invertebrates are represented only by 10 sets of butterfly and moth counts. There is one line for fish, one for reptiles (Nile Crocodiles in Murchison Falls NP), 104 for birds and 161 for mammals, and 18 data lines for habitat extents.
Beyond ecosystems, such as forests and wetlands, there is a strong need to integrate management of species diversity into biodiversity conservation and management because: (i) species functional characteristics strongly influence ecosystem properties (e.g., competition, facilitation, mutualism, disease, and predation). Alteration of the animal or plan life (biota) in ecosystems via species invasions and extinctions caused by human activities also alters ecosystem goods and services. Moreover, many of these changes are difficult, expensive, or impossible to reverse or fix with technological solutions; (iii) the effects of species loss or changes in composition, and the mechanisms by which the effects manifest themselves, can differ among ecosystem properties, ecosystem types, and pathways of potential community change; (iv) some ecosystem properties are initially insensitive to species loss because (a) ecosystems may have multiple species that carry out similar functional roles, (b) some species may contribute relatively little to ecosystem properties, or (c) properties may be primarily controlled by abiotic environmental conditions; and (v) More species are needed to insure a stable supply of ecosystem goods and services as spatial and temporal variability increases (Hooper et al. 2005).
To strengthen links to policy and management, there is need to integrate ecological knowledge of biodiversity with understanding of the social and economic constraints of potential management practices. Understanding this complexity, while taking strong steps to minimize current losses of species, is necessary for responsible management of ecosystems and biodiversity (Hooper et al. 2005). Alongside the loss in spatial cover of ecosystems, human actions are altering the composition of biological communities. The limited knowledge on the ecological functions of biodiversity and integration within the values approach limits the prospects of achieving comprehensive biodiversity conservation and management. By introducing an ecosystem based management system biodiversity values can be segregated to show socio-cultural, economic and ecological indicators (Laurila-Pant et al. 2015) to guide the broad scope of sustainable development.
1.3.4 Link between finance solutions and NBSAP II targets
The links between the NBFP and its finance solutions, the NBSAP II, and NDPII, National Vision 2040, and international frameworks of the Strategic Plan for Biodiversity (2010-2020) and the Sustainable Development

National Biodiversity Finance Plan 6
Goals (SDG) are shown in Figure 2. The NDPII has integrated the SDGs, which in turn were also developed with integration of the Strategic Plan for Biodiversity (2010-2020) at the global level. The finance solutions presented specifically address the constraints identified in the BIOFIN process, but also communicated in national sector performance reports, priorities highlighted in Uganda’s development planning processes, and the National State of Environment Report (NSOER 2016) and the National State of Forestry Resources Report (2016), among others.
Figure 2: Conceptual framework linking the NBSAP, Strategic Plan for Biodiversity, SDGs, UGGDS, NDPII and National Vision 2040
Source: Adapted from NEMA (2016; GOU 2017)
In 2017, the Government of Uganda completed the Uganda Green Growth Development Strategy (UGDDS). The UGGDS specified the Government’s sustainable development priorities and the process benefited from and integrated Uganda’s BIOFIN process. Uganda’s NBSAPII was already mainstreamed into the NDP II, however, the UGGDS provides specific actionable plan for national implementation.
1.3.5 Limitations of current regulatory and enforcement mechanisms
The legislative core for biodiversity management lies into the National Environment Act Cap 153, the Wildlife Act Cap 200, the National Forestry and Tree Planting Act (2003), the Public Finance Management Act (2015), among others made provisions for mobilisation and/or utilisation of financing for biodiversity management purposes (Figure 3).
NATIONAL VISION 2040
National Biodiversity
Targets
Strategic Plan for Biodiversity
(2011 – 2020)
National Development Plan (NDP II), 2015/16 – 2019/20
Uganda Green Growth Development Strategy
2018/19 – 2039/30
Sustainable Development
Goals
SDG processGlobal integration
NBSAP Process/
NBFP
NBSAP integrate NBFP Implement

National Biodiversity Finance Plan 7
Figure 3: Framework of biodiversity-related legislation and regulations in Uganda
Constitution (1995), esp. Article 39
Local Bylaws:
The Jinja Wetlands Reserve Management Bylaw (2000)
The Kampala City Council (Solid Waste Management Ordinance) (2000)
Conservation Bylaws in Mt. Elgon Ecosystem, and the Upper Aswa sub-catchment
Regulations:The EIA Regulations (1998)The Water (waste discharge) regulations (1998)The Water Resources Regulations (1998)The National Environment (Wetlands, River Banks and Lake Shore Management) Regulations, 2000The National Environment (Hilly and Mountainous Areas Management) Regulations, 2000The National Environment (Minimum Standards for Management of Soil Quality) Regulations, 2000National Environment Audit Regulations, 2006
Standards: The Discharge of Effluent into Water or Land Standards Quality (1999)
Basic Laws: National Environment Act cap 153
Specialised laws: National Water Act cap 152, Uganda Wildlife Act cap 200, National Forestry and Tree Planting Act 2003, The Land Act cap 227, Mining Act 2003, Uganda Electricity Act cap 135
Source: NEMA et al. 2017
When natural resources, including minerals, oil and gas, water abstraction for hydropower, are extracted from an area, the laws provide that the Local Governments obtain royalties while the central government obtains resources rents through taxes and revenue sharing agreements with private companies (Crawford et al. 2015). The laws and policies require that resource rents and royalties are used for, among other uses, biodiversity and ecosystem management. However, during the PIR process and subsequent consultations with DLGs showed that resource rents and royalties have not been strongly aligned with biodiversity conservation as the Government of Uganda does not implement an earmarking policy. It is also likely that these charges are too low and are not based on a realistic cost and benefit analysis (NEMA et al. 2016). Nonetheless, resource rents and royalties have potential to contribute significantly to biodiversity management.
International finance instruments such as the Global Environment Facility (GEF), Global Climate Facility (GCF), financial resources mobilised through multilateral and bilateral relationships with the European Union (EU) and EU countries, and United Stated Agency for International Development (USAID), among others contribute to bridging the financing gap for biodiversity management in the country. As the need for use and conservation of biodiversity and ecosystems increased in the country, it is expected that the international finance instruments will play an increased role, particularly in supporting financing solutions to current biodiversity conservation and management challenges.
Resource user rights, conservation funds and private sector instruments are implemented as complementary instruments for biodiversity management financing. Resource user rights and conservation funds complement compliance and natural resource management instruments while private sector instruments generally support conservation activities of non-governmental organisations (NGOs).

National Biodiversity Finance Plan 8
Tab
le 3
: Exi
stin
g fi
nan
ce m
ech
anis
ms
for
bio
div
ersi
ty m
anag
emen
t
Fina
nce m
echa
nism
Legi
slatio
nCo
ntrib
utio
n to
bio
dive
rsity
Mai
n lim
itatio
ns
Envi
ronm
enta
l tax
es an
d en
viro
nmen
tal c
ompl
ianc
e ins
trum
ents
1. En
viron
men
tal L
evy
and p
ropo
sed O
il and
gas
envir
onm
enta
l tax
esPu
blic F
inanc
e Act
2015
Avoid
ed po
llutio
n with
heav
y met
als
and c
hem
icals
to w
etlan
ds, a
nd w
ater
ca
tchm
ents
and a
ir poll
ution
The f
unds
colle
cted a
re tr
ansfe
rred t
o the
cons
olida
ted f
und a
nd w
ith no
spec
ific
earm
arkin
g biod
iversi
ty m
anag
emen
t
2. Fe
es, E
nfor
cem
ent
Fines
& Ch
arge
sEIA
Regu
lation
s 199
8 Nat
ional
Envir
onm
ent A
ct Ca
p 153
Com
plian
ce to
natio
nal e
nviro
nmen
tal
man
agem
ent s
tand
ards
The E
IA re
gulat
ion an
d Env
ironm
ent A
udit
Regu
lation
s pro
vide b
asis
for fi
nes a
nd
char
ges.
How
ever,
ther
e is l
imite
d dat
a to s
how
how
instru
men
t has
perfo
rmed
. M
oreo
ver, a
buse
of EI
A con
dition
s occ
urs r
egula
rly.
3. Pe
rform
ance
Bond
sUn
der t
he N
ation
al En
viron
men
t Act
Cap
153
Prev
entiv
e cha
rge f
or co
mpli
ance
to
envir
onm
enta
l man
agem
ent s
tand
ards
Are n
ot im
plem
ente
d eve
n tho
ugh t
hey w
ere d
escri
bed i
n the
Nat
ional
Envir
onm
ent A
ct Ca
p 153
.
4. W
etlan
d Use
r Per
mit
Fees
Natio
nal E
nviro
nmen
t Act
Cap 1
53Re
sour
ce us
e reg
ulatio
n cha
rge
Gene
rally
abus
ed w
ith ill
egal
struc
ture
s and
indiv
idual
use o
ver s
ociet
al we
lfare.
5. W
etlan
d Res
tora
tion
orde
rsNa
tiona
l Env
ironm
ent A
ct Ca
p 153
Wat
er Ac
t cap
153
Pena
lties
to co
mply
to na
tiona
l en
viron
men
tal m
anag
emen
t sta
ndar
dsTh
ere l
imite
d dat
a on h
ow in
strum
ent h
as pe
rform
ed. H
owev
er, m
isuse
of
wetla
nds i
s majo
r env
ironm
enta
l con
cern
.
6. Bi
odive
rsity
Offs
ets
Natio
nal E
nviro
nmen
t Act
No. 5
of 20
19Co
mpli
ance
to na
tiona
l env
ironm
enta
l m
anag
emen
t sta
ndar
ds
Instr
umen
t was
not p
rescr
ibed u
nder
the N
ation
al En
viron
men
t Act
Cap 1
53 bu
t em
erge
d as a
good
prac
tice.
Im
plem
enta
tion c
halle
nges
inclu
de us
e of o
ffset
com
pens
ation
for n
on-
cons
erva
tion a
ctivit
ies as
incre
asing
salar
ies an
d adm
inistr
ative
costs
.Ov
erlap
betw
een o
ffset
activ
ities
and c
lashe
s bet
ween
proje
ct de
velop
ers a
nd
regu
lator
s
7. Pa
ymen
t for
Ecos
yste
m
Serv
ices
Natio
nal E
nviro
nmen
t Act
No. 5
of 20
19In
strum
ent a
re pr
escri
bed u
nder
the N
ation
al En
viron
men
t Act
2018
as a
good
pr
actic
e mea
sure.
PES
will
be an
activ
ity al
lowed
as pa
rt of
miti
gatio
n acti
ons
pres
cribe
d in t
he EI
A reg
ulatio
ns.
Cent
ral G
over
nmen
t tra
nsfe
rs
1. Se
ctora
l Allo
catio
ns to
MW
E and
its A
genc
ies,
MTTI
and i
ts ag
encie
s, MA
AIF a
nd it
s age
ncies
Publi
c Fina
nce A
ct 20
15Bu
dget
ary a
lloca
tion i
n the
Nat
ional
Deve
lopm
ent P
lan an
d Visi
on 20
40Ce
ntra
l gov
ernm
ent t
rans
fers c
ore t
o poli
cy, c
oord
inatio
n, m
onito
ring a
nd
resto
ratio
n acti
ons. T
here
is ge
nera
lly Li
mite
d cap
ital in
vestm
ents.
2. Bu
dget
ary A
lloca
tions
to
Loca
l Gov
ernm
ent
spec
ifica
lly PA
F Fun
ds fo
r W
etlan
d Man
agem
ent
Publi
c Fina
nce A
ct 20
15, L
ocal
Gove
rnm
ent A
ct Ca
p 243
.Bu
dget
ary a
lloca
tion f
or w
etlan
d co
nser
vatio
n and
staff
salar
ies fo
r un
derta
king e
nviro
nmen
tal m
anag
emen
t
The r
esou
rces a
lloca
ted a
re us
ually
limite
d and
limite
d to w
etlan
ds m
anag
emen
t. No
clea
r crit
eria
exist
exce
pt la
nd si
ze of
distr
ict. O
nly 2
0% of
the w
etlan
d m
anag
emen
t acti
vities
are c
ater
ed fo
r.

National Biodiversity Finance Plan 9
Fina
nce m
echa
nism
Legi
slatio
nCo
ntrib
utio
n to
bio
dive
rsity
Mai
n lim
itatio
ns
Natu
ral r
esou
rce m
anag
emen
t ins
trum
ents
1. F
ish
levi
es fo
r boa
ts,
fish
mon
gers
and
fis
hing
lice
nse
Fish (
Beac
h Man
agem
ent)
Rules
, 200
3 (S
.I. No
. 35 o
f 200
3)Or
igina
lly in
tend
ed to
limit
the fi
shing
effor
t to
susta
inable
leve
ls.
Poor
imple
men
tatio
n of in
strum
ent l
ed to
incre
ased
illeg
al fis
hing p
racti
ces.
Fishe
ries w
ere d
evelo
ped b
etwe
en 20
05 an
d 200
8, an
d gov
ernm
ent t
urne
d to
Mini
stry e
nfor
cem
ent a
ction
s and
2. C
harg
es o
n ti
mbe
r an
d w
ood
fuel
(li
cens
e to
har
vest
ti
mbe
r or p
rodu
ce
char
coal
, mov
emen
t pe
rmit
)
Natio
nal F
ores
try an
d Tre
e Plan
ting A
ct,
2003
The c
harg
es ar
e aim
ed at
ensu
ring a
n ac
cura
te re
cord
of w
ood t
rade
and t
o coll
ect
rent
s for
the D
LGW
here
as in
strum
ents
are s
uppo
sed t
o app
ly th
e prin
ciple
of su
staina
ble us
e, po
or
gove
rnan
ce re
sulte
d int
o abu
ses t
hat e
ncou
rage
d defo
resta
tion.
3. C
atch
men
t M
anag
emen
t C
omm
itte
es
Wat
er Ac
t cap
152
Catch
men
t Man
agem
ent G
uideli
nes
Man
date
with
supp
ort o
f DW
RM to
plan
for
susta
inable
man
agem
ent o
f cat
chm
ents
base
d on g
uideli
nes p
uttin
g fina
ncial
re
sour
ces t
oget
her f
or m
anag
ing ca
tchm
ent
The m
odel
for m
obiliz
ing fu
nds,
use a
nd go
vern
ance
for fi
nanc
ial re
sour
ces i
s un
clear.
4. G
ate
Fees
or
entr
ance
fees
Ugan
da W
ildlif
e Act
Cap 2
00; U
gand
a W
ildlif
e Edu
catio
n Cen
tre Ac
t 201
5; an
d Na
tiona
l For
estry
& Tr
ee Pl
antin
g Act,
20
03
Obta
in re
venu
es fo
r run
ning i
nstit
ution
and
man
age n
umbe
r of v
isito
rsTh
e per
form
ance
of th
e ins
trum
ent w
ell do
cum
ent a
nd in
form
ation
used
as ba
sis
for r
even
ue sh
aring
with
com
mun
ities
.
5. To
uris
m P
acka
ges
fees
(hot
sprin
gs, M
t. cl
imbi
ng, g
ame
driv
es,
spor
t fish
ing,
etc
.
Ugan
da W
ildlife
Auth
ority
and U
gand
a W
ildlife
Educ
ation
Cent
re Bil
lNa
tiona
l For
estry
& Tr
ee Pl
antin
g Act,
2003
Obta
in re
sour
ces f
or m
anag
ing bi
odive
rsity
un
der j
urisd
iction
prov
ide to
urist
s and
visit
ors w
ith a
quali
ty
serv
ice an
d exp
erien
ce
The p
erfo
rman
ce of
the i
nstru
men
t well
docu
men
t and
info
rmat
ion us
ed as
main
fo
rm of
non-
tax r
even
ue (N
TR) f
or U
WA,
NEM
A and
UW
EC.
Mar
ket b
ased
inst
rum
ents
1. C
DM
PoA
mun
icip
al
solid
was
te p
roje
ctLo
cal G
over
nmen
t Act
cap 2
34Ai
med
at im
prov
ing so
lid w
aste
m
anag
emen
t and
prod
ucing
high
quali
ty
orga
nic m
anur
e for
use o
n far
ms,
also
achie
ve G
HG em
ission
s red
uctio
ns
In ur
ban w
here
solid
was
te an
d was
te w
ater
are a
majo
r sou
rce of
pollu
tion t
o we
tland
s and
surfa
ce w
ater
syste
ms
3. E
mis
sion
s of
Redu
ctio
ns fo
r car
bon
– C
DM
, vol
unta
ry
carb
on p
roje
cts
UNFC
CC, N
ation
al Fo
restr
y Poli
cy (2
001)
, Na
tiona
l For
estry
& Tr
ee Pl
antin
g Act,
20
03Aff
ores
tatio
n and
refo
resta
tion a
ctivit
ies in
Na
tura
l For
ests
Affor
esta
tion/
refo
resta
tion a
ctivit
ies ar
e rela
tively
small
and t
hey a
re vo
lunta
ry.
A/R p
rojec
ts ag
ro-fo
restr
y hav
e bee
n use
d to r
eintro
duce
limite
d im
pact
on
pres
sure
to en
croac
h on n
atur
al fo
rests
4. EB
A Clim
ate A
dapt
ation
Fu
nd fo
r Mt.
Elgon
Ec
osys
tem
Prop
osed
unde
r Rev
ised N
ation
al En
viron
men
t Bill
Adap
tatio
n thr
ough
land
scap
e res
tora
tion
activ
ities
and s
uppo
rting
agric
ultur
al liv
eliho
ods a
nd so
il and
wat
er co
nser
vatio
n pr
actic
es
The a
dapt
ation
fund
show
ed st
rong
pote
ntial
for r
esto
ratio
n of m
ount
ain
lands
cape
s whe
re ag
ricult
ure i
s pra
ctice
d. Th
e sco
pe of
prac
tice i
s lim
ited a
nd
scali
ng up
is re
quire
d.
National Biodiversity Finance Plan 10
Fina
nce m
echa
nism
Legi
slatio
nCo
ntrib
utio
n to
bio
dive
rsity
Mai
n lim
itatio
ns
5. Ca
rbon
Bank
for M
t. Elg
on Ec
osys
tem
Ugan
da N
GO Re
gistra
tion A
ct 19
89Re
fore
statio
n acti
ons a
nd es
tabli
shing
a fu
nd
to bu
ffer c
arbo
n seq
uestr
ation
miti
gatio
n for
ve
rified
emiss
ion re
ducti
ons u
nder
the P
lan
Vivo S
tand
ard
The c
arbo
n fun
d sho
wed s
trong
pote
ntial
for r
esto
ratio
n of m
ount
ain la
ndsc
apes
wh
ere a
gricu
lture
is pr
actic
ed. T
he sc
ope o
f pra
ctice
is lim
ited a
nd sc
aling
up is
re
quire
d.
Reso
urce
Ren
ts an
d Ro
yalti
es
1. M
inera
ls se
ctor
reso
urce
rent
s & ro
yalti
esM
ining
Act 2
003
Retu
rns f
or re
sour
ce ex
tracti
on to
go
vern
men
t on b
ehalf
of ci
tizen
s.A r
eview
cond
ucte
d by I
ISD (C
rawf
ord e
t al. 2
015)
foun
d tha
t res
ource
rent
s and
ro
yalti
es w
ere n
ot fu
lly im
plem
ente
d in t
he m
inera
l sec
tor.
This
was l
inked
to po
or
gove
rnan
ce an
d lim
ited m
onito
ring o
f instr
umen
ts.
2. Oi
l and
gas s
ecto
r re
sour
ce re
nts &
roya
lties
Oil a
nd ga
s rev
enue
man
agem
ent p
olicy
(2
008)
,Re
turn
s for
reso
urce
extra
ction
to
gove
rnm
ent o
n beh
alf of
citiz
ens.
The l
egisl
ative
fram
ewor
k has
been
deve
loped
. Reg
ulatio
ns an
d guid
eline
s are
be
ing de
velop
. Im
plem
enta
tion e
xpec
ted t
o beg
in in
2020
.
3. Re
venu
e Sha
ring w
ith
com
mun
ities
neigh
borin
g PA
.Ug
anda
Wild
life A
ct Ca
p 200
Enha
nce c
omm
unity
parti
cipat
ion in
fore
st co
nser
vatio
n and
cons
erva
tion o
f pro
tecte
d ar
eas e
.g. N
ation
al Pa
rks
Instr
umen
t well
docu
men
ted a
nd m
onito
red b
y Dist
ricts
adjac
ent t
o Pro
tecte
d Ar
eas,
with
exce
ption
of fo
rest
rese
rves
and w
etlan
ds.
Inte
rnat
iona
l fina
nce i
nstr
umen
ts
1. Gr
een C
limat
e Fun
d Pr
oject
UNFC
CC in
supp
ort o
f Rio
MEA
sBu
ilding
Resil
ient C
omm
uniti
es, W
etlan
d Ec
osys
tem
s and
Asso
ciate
d Cat
chm
ents
in Ug
anda
Proje
ctTh
e pro
ject i
s im
plem
entin
g clim
ate c
hang
e ada
ptat
ion th
roug
h wet
land
man
agem
ent a
nd bu
ilding
resil
ience
for w
etlan
d.
2. Gl
obal
Envir
onm
ent
Facil
ityCo
nven
tion o
n Biol
ogica
l Dive
rsity,
UN
FCCC
, UNC
CD
Supp
ort i
mple
men
tatio
n biod
iversi
ty
cons
erva
tion p
riorit
ies in
the N
BSAP
sGE
F sup
port
to in
stitu
tiona
l cap
acity
build
ing an
d pro
ject i
mple
men
tatio
n is w
ell
docu
men
ted
3. Co
nces
siona
l Lan
d lea
ses u
nder
Sawl
og
Prod
uctio
n Gra
nt Sc
hem
e
EU Fu
nding
Na
tiona
l For
estry
& Tr
ee Pl
antin
g Act,
20
03In
creas
e sus
taina
ble pr
oduc
tion o
f tim
ber t
o m
eet t
he co
untry
’s nee
dsTh
e pro
ject w
here
as su
ccessf
ul on
ly ad
dres
sed a
small
com
pone
nt of
Uga
nda’s
de
fore
statio
n cha
lleng
e. Th
e foc
us ha
s bee
n on e
nhan
cing c
omm
ercia
l fore
stry
prod
uctio
n. T
he im
pact
on bi
odive
rsity
cons
erva
tion h
as no
t bee
n doc
umen
ted.
4. Fa
rmer
Inco
me
Enha
ncem
ent a
nd Fo
rest
Cons
erva
tion
EU fu
nding
Natio
nal F
ores
try &
Tree
Plan
ting A
ct,
2003
Incre
ase l
ivelih
oods
and s
usta
inable
tree
pr
oduc
tion o
n far
m la
nds
The f
ocus
of pr
oject
has b
een i
nteg
ratin
g agr
o-fo
restr
y and
wat
ersh
ed
man
agem
ent i
nto f
arm
ing sy
stem
s. Th
e im
pact
on bi
odive
rsity
cons
erva
tion h
as
not b
een d
ocum
ente
d.
Reso
urce
Use
r Rig
hts
1. Co
llabo
rativ
e Res
ource
m
anag
emen
tNa
tiona
l For
estry
and T
ree P
lantin
g Act,
20
03. U
gand
a Wild
life A
ct Ca
p 200
Enha
nce c
omm
unity
parti
cipat
ion in
fore
st co
nser
vatio
n and
cons
erva
tion o
f pro
tecte
d ar
eas B
enefi
t sha
ring f
or N
Ps an
d Wild
life
Rese
rves
Stew
ards
hip pr
ogra
mm
es th
at ar
e poo
rly do
cum
ente
d. Th
eir co
ntrib
ution
to
secto
ral p
erfo
rman
ce an
d nat
ional
econ
omy h
as no
t bee
n arti
culat
ed.
Their
pote
ntial
co-b
enefi
ts ar
e high
for c
omm
unity
liveli
hood
s. Ho
weve
r the
be
nefic
iaries
are u
suall
y abo
ut 10
-20 p
arish
es (1
paris
h has
6-8)
i.e. a
bout
3000
ho
useh
old/v
illage
s pro
tecte
d are
as co
mm
uniti
es ad
jacen
t to t
he PA
s; 2.
Wet
land u
ser
com
mitt
ees
Natio
nal E
nviro
nmen
t Act
Cap 1
53,
Natio
nal W
etlan
d Poli
cy 19
95En
hanc
e com
mun
ity an
d sus
taina
ble us
e of
wetla
nd re
sour
ces,
Limit
degr
adat
ion fr
om
encro
ache
rs

National Biodiversity Finance Plan 11
Fina
nce m
echa
nism
Legi
slatio
nCo
ntrib
utio
n to
bio
dive
rsity
Mai
n lim
itatio
ns
Cons
erva
tion
Fund
s
1. Ug
anda
Biod
iversi
ty
Trust
Fund
Revis
ed N
ation
al En
viron
men
t Bill,
Ug
anda
Wild
life A
ct Ca
p 200
Prov
ide a
fund
ing po
ol fo
r all b
iodive
rsity
co
nser
vatio
n acti
ons i
n the
coun
tryTh
e fun
d see
ks to
mob
ilise U
GX 5
billio
n bet
ween
2018
and 2
020.
So fa
r the
fund
ha
s mob
ilized
$100
,000.
Ther
e may
be ne
ed fo
r incre
ased
inte
grat
ion of
publi
c fin
ancin
g int
o the
Trus
t Fun
d’s ac
tiviti
es.
2. Bw
indi M
gahin
ga
Cons
erva
tion F
und
Ugan
da W
ildlif
e Act
Cap 2
00
Prov
ide in
cent
ives f
or co
mm
uniti
es to
co
ntrib
ute t
o Mou
ntain
Gor
illa Co
nser
vatio
n in
BINP
and M
GNP.
Inve
sts on
the N
ew Yo
rk
Stoc
k Exc
hang
e to i
ncre
ase f
unds
avail
able
for c
onse
rvat
ion.
The m
ost s
ucce
ssful
biodiv
ersit
y con
serv
ation
fund
in th
e cou
ntry.
Has
a na
rrow
scope
for t
he Bw
indi-M
gahin
ga Co
nser
vatio
n Are
a (BM
CA).
Need
s to b
e sca
led up
.
3. Co
mm
unity
En
viron
men
t Co
nser
vatio
n Fun
d
NGO
Act 2
016,
Ugan
da W
ater
Act C
ap 15
2Ca
tchm
ent M
anag
emen
t Guid
eline
s, Na
tiona
l For
estry
and T
ree P
lantin
g Act,
20
03
Supp
ort F
ores
t Lan
dsca
pe Re
stora
tion;
and
catch
men
t man
agem
ent t
hrou
gh pr
ovidi
ng
liveli
hood
s for
inte
grat
ed w
ater
reso
urce
s m
anag
emen
t (IW
RM)
Succe
ssful
mod
el at
micr
o-ca
tchm
ent l
evel
and n
eeds
to be
scale
d up t
o lar
ge
lands
cape
s, su
b-ca
tchm
ents
and c
atch
men
ts.
Priv
ate S
ecto
r ins
trum
ents
1. Co
rpor
ate S
ocial
Re
spon
sibilit
y (Co
ca Co
la,
Stan
dard
Bank
, Sta
ndar
d Ch
arte
red B
ank,
MTN,
Ai
rtel e
tc.
Priva
te co
rpor
ate s
ocial
resp
onsib
ility
fund
s, Co
rpor
ate o
utre
ach.
Givin
g bac
k to c
onsu
mer
com
mun
ities
and
cont
ribut
ion to
poor
com
mun
ities
’ welf
are.
Gene
rally
limite
d in s
cope
, and
gene
rally
dicta
ted b
y priv
ate s
ecto
r. Th
ere i
s po
tent
ial fo
r impr
oved
artic
ulatio
n of t
he ro
le of
biod
iversi
ty m
anag
emen
t to
socie
ty an
d the
com
mer
cial b
anks
’ corp
orat
e res
pons
ibilit
y.
2. Ca
tchm
ent
Man
agem
ent fi
nanc
ing
(Coca
Cola,
Bugo
ye
Hydr
opow
er, KC
CL, H
ima
Cem
ent.
Inve
stmen
t pac
k in r
educ
ing op
erat
ional
costs
.Ca
tchm
ent r
esto
ratio
n acti
vities
to re
duce
sil
tatio
n in t
he w
ater,
mud
slide
s and
clos
e of
oper
ation
s tha
t lea
d to r
even
ue lo
sses.
The fi
nanc
ing in
strum
ent a
re no
t clea
rly ar
ticula
ted.
The c
atch
men
ts co
mm
ittee
s do
not h
ave a
regu
lated
finan
cing s
yste
m. M
icro-
finan
cing i
nstit
ution
s are
used
bu
t reg
ulate
d con
serv
ation
finan
cing s
yste
m is
need
ed.
4. Va
lue ch
ains f
or ni
che
lands
cape
biod
iversi
ty
prod
ucts
(She
a But
ter,
Gum
Arab
ic, re
sins,
papy
rus,
and o
rgan
ic ag
ricult
ure
Natio
nal A
gricu
ltura
l Poli
cy, 2
013;
Orga
nic Ag
ricult
ure P
olicy
(Dra
ft);
Natio
nal E
nviro
nmen
t Act
Cap 1
53;
Natio
nal F
ores
try an
d Tre
e Plan
ting A
ct 20
03; a
nd U
gand
a Wild
life A
ct Ca
p 200
Prod
ucing
food
in a
com
plete
cycle
with
m
inim
al ex
tern
al inp
uts a
nd co
mpli
ance
to
high o
rgan
ic sta
ndar
ds.
Whe
reas
the v
alue c
hains
have
high
pote
ntial
. Thy
have
a lim
ited c
onsid
erat
ion on
go
vern
men
t poli
cy. N
eed t
o arti
culat
e the
pote
ntial
, pro
vide a
ppro
priat
e poli
cy,
legisl
ative
and i
nstit
ution
al su
ppor
t.
Sou
rce:
NEM
A/U
ND
P/G
lob
al B
IOFI
N (2
017)

National Biodiversity Finance Plan 12
Uganda’s Biodiversity Expenditure Review (BER) showed that public expenditure on biodiversity conservation and management between 2005/6 and 2014/15 averaged UGX 9 billion/year (real term) equivalent to 1.2% of the annual budget of the Government of Uganda. The public biodiversity expenditure review was based on biodiversity specific expenditure for the Ministries of Agriculture, animal Industry and Fisheries, Energy and Mineral Development, Tourism, Wildlife and Antiquities, and water and environment. The BER also showed a natural focus social services on sectors such security, health and education, followed by industrial sectors of transport, energy and mineral development. Biodiversity related sectors of agriculture, forestry, fishing and tourism received less than 10% of the national budget. The finance needs assessment for the biodiversity management and conservation for the four core sectors (agriculture, energy and mineral development, water and environment, and tourism, wildlife and antiquities) was estimated at average of UGX 472 billion/year (129.5 million/year)
Nonetheless, the guidelines and action for financing biodiversity conservation in Uganda (NEMA 2016) had estimated an aggregate of $670.7 million/year for all biodiversity related expenditure across government for public and private sector. The FNA provided a refined and prioritised biodiversity specific finance needs of $ 129.5 million/yea, for public investments in the four core biodiversity management sectors
1.4 Finance Plan TargetsThe resource mobilisation target for biodiversity and ecosystem management is two-fold. The first target was established as part of the development of NBSAP II for Uganda. The biodiversity related financing gap was estimated as part of the Guidelines and Action Plan for Financing Biodiversity Management in Uganda (NEMA 2016). The second target of financing plan was based on the finance needs assessment and financing gap (FNA) for biodiversity management in Uganda. The specific gaps are described below.
The finance needs assessment (FNA) conducted comprehensive assessment of Uganda’s priority finance needs. The total cost of the implementation of the NBSAP was estimated at UGBX 2,859.9 billion on average, Uganda required about UGX 472.6 billion for biodiversity conservation and management per fiscal year (Table 4). Furthermore, about 96.6% of the total cost of implementation of the NBSAP II are to implement the strategic objective 3; these costs are related to the restoration of forests and wetlands. About 81% and 17% of this annual total cost are for activities related to restoration of forest and fragile ecosystems respectively. The remainder of the finance needs is shared out in the other six strategic objectives.
Table 4: Finance needs targets by strategic objective of the NBSAPII
Fiscal Year (UGX-billion)Strategic objectives 2018/19 2019/20 2020/21 2021/22 2022/23 2023/24 2024/25
1. Strengthen stakeholder co-ordination and frameworks for biodiversity management 3.0 3.2 4.0 3.9 3.8 3.7 5.9
2. To facilitate and build capacity for research, knowledge and information management and exchange on biodiversity
2.5 2.5 2.6 2.9 2.9 3.2 3.4
3. To reduce and manage negative impacts while enhancing positive impacts on biodiversity 391.9 411.7 432.5 454.4 479.3 500.3 524.9
4. To promote the sustainable use and equitable sharing of costs and benefits of biodiversity 3.1 3.4 3.9 4.1 4.1 4.0 4.3
5. To enhance awareness and education on biodiversity issues 2.7 3.2 2.8 3.0 3.1 3.9 3.4
6. To harness modern biotechnology for socio-economic development with adequate safety measures for human health and the environment
1.7 1.9 1.9 2.1 2.0 2.0 2.1
7. To promote innovative and sustainable funding mechanisms to support NBSAP implementation 0.4 0.4 0.6 0.4 0.4 0.4 0.5
Overall 405.3 426.2 448.2 470.7 495.6 517.6 544.5Source: NEMA, UNDP and BIOFIN (2018)

National Biodiversity Finance Plan 13
2. VISION, MISSION, GOAL AND BIODIVERSITY FINANCE SOLUTIONS
2.1 Vision of Biodiversity Finance Plan The vision for Uganda’s NBFP is “sustainable and innovative financing for biodiversity conservation and management attained by 2027/28”. The finance plan supports implementation of the country’s National Biodiversity Strategy and Action Plan (NBSAPII 2015/16 – 2024/25). The Vision of Uganda’s NBSAPII is “to maintain a rich biodiversity benefiting the present and future generations for socio-economic development” while the goal is “to enhance biodiversity conservation, management and sustainable utilisation and fair sharing of its benefits by 2025”.
The mission of the NBFP is “to mobilise adequate additional financial resources to meet the biodiversity funding gap as well as ensure that funds are used efficiently and effectively to address the biodiversity and ecosystem challenges in biodiversity and ecosystem conservation and management.” The National Focal Point for mobilising funds for biodiversity conservation and management in Uganda is the Ministry of Finance Planning and Economic Development (MFPED), while NEMA is the Focal Point on implementation of the Convention on Biological Diversity (CBD) and the lead on implementation of the NBSAP II.
Biodiversity management is at the centre of Uganda’s green economy strategy and economic transformation as indicated in the Constitution of Uganda (1995), the National Development Plan II (2015/16 – 2019/20), and Vision 2040 (2010/11 – 2039/40). Under Objective XXVII, the Constitution indicates that the State shall promote sustainable development and public awareness of the need to manage land, air, water resources in a balanced and sustainable, and utilization of natural resources to meet the development and environmental needs of present and future generations. Also, that the State, including local governments, shall create and develop parks, reserves and recreation areas and ensure the conservation of natural resources, and promote rational use of natural resources so as to safeguard and protect biodiversity (GoU 1995).
In line with the national constitution, the legislation for biodiversity and ecosystem conservation and management whereas fundamentally covered under sector legislation on forestry, environmental management, agriculture, mining, wildlife and energy, among others, was specifically reinforced under the national land legislation. The land Act Cap 227 provides for the tenure, ownership and management of land; to amend and consolidate the law relating to tenure, ownership and management of land; and to provide for other related or incidental matters. The Land Act, Cap 227 (Section 43) indicated that whoever owns or occupies land must manage and utilize the land in accordance with the Forest Act, the Mining Act, the National Environment Act, Water Act, the Uganda Wildlife Act and any other law. In addition, (under Section 44 (1)), the Land Act Cap 227 provides that Government or local government hold in trust for the people and protect natural lakes, rivers, ground water, natural streams and ponds, wetlands, forest reserves, national parks and any other land reserved for ecological and touristic purposes for the common good of the citizens of Uganda.
The NBSAP provides the Government with a framework for implementing its obligations under the CBD as well as the setting of conservation priorities, channeling of investments and building of the necessary capacity for the conservation and sustainable use of biodiversity in the country (NEMA 2016). The strategic objectives of biodiversity conservation and management as set out in the NBSAP II are:
(i) To strengthen stakeholder co-ordination and frameworks for biodiversity management. (i) Facilitate and enhance capacity for research, monitoring, information management and exchange on
biodiversity. (ii) Put in place measures to reduce and manage negative impacts on biodiversity. (iii) Promote the sustainable use and equitable sharing of costs and benefits of biodiversity. (iv) Enhance awareness and education on biodiversity issues among the various stakeholders. (v) Harness modern biotechnology for socio-economic development with adequate safety measures for
human health and the environment. (vi) To promote innovative sustainable funding mechanisms to mobilize resource for implementing the
Strategy.

National Biodiversity Finance Plan 14
2.2 The BIOFIN process
Globally, BIOFIN is managed by the UNDP Ecosystems and Biodiversity Programme in partnership with the European Union, and the Governments of Germany, Switzerland, Norway, and the Flanders.
In Uganda, the BIOFIN project was launched in August 2015. The project was implemented in the standard phased approach. The first phase comprised of two studies, the Biodiversity Finance Policy and Institutional Review (PIR), and the Biodiversity Expenditure Review (BER). The second phase comprised of the Biodiversity Finance Needs Assessment (FNA) and the National Biodiversity Finance Plan (NBFP) (as shown in Figure 4).
Figure 4: Overview of National BIOFIN process
Source: UNDP (2016)
The key outcomes of the PIR was the synthesis of the financing mechanisms used for financing biodiversity in the country, and assessment of the historical and current policy and institutional process and practice of biodiversity management. The BER provided an indication of the public sector appropriations and expenditures realised in biodiversity conservation and management in the country. The BER focused on four national ministries of agriculture, animal industry and fisheries (MAAIF), water and environment (MWE), tourism, wildlife and antiquities (MTWA), and energy and mineral development (MEMD). The most important outcome of the BER was the fact that less than one-quarter of the funds current allocated to biodiversity are actually invested into restoration and maintenance of biodiversity instead funds are generally invested in coordination and policy actions.
The finance needs assessment benefited from the results of the PIR and BER. The finance needs assessment showed that more than 90% funds raised for biodiversity in the country will be invested directed in restoration, maintenance and protection of biodiversity.
At a process level, the technical process in Uganda were based on stakeholder consultation processes. Formally, a technical steering committee was used to direct the process of implementing the activities of the project. National stakeholder meetings were used to discuss and prioritise the technical findings of the national BIOFIN consultations through the project implementation. NEMA, the National Forestry Authority (NFA), Uganda Wildlife Authority (UWA) and the Ministry of Tourism Wildlife and Antiquities (MTWA) were more involved in regular key informant meetings.
National BIOFIN Process
Policy and Institutional Review
Biodiversity Expenditure Review
Finance Needs Assessment
National Biodiversity Finance Plan

National Biodiversity Finance Plan 15
Both UNDP and Global BIOFIN provided direct and regular technical support through a regional technical advisor. The Global BIOFIN team also provided regional clinics for country teams at which the technical process was discussed both with the Global team, external experts from UNDP and other national BIOFIN teams provided a chance for cross learning. An online platform through webinars, Skype calls and phone conversations also increased the intensity of engagement.
The finance solutions developed in the NBFP were initially obtained as a long list from the financing mechanisms in the PIR. The BER report and process of developing the FNA provided additional information for sieving and prioritising the finance solution. Out of a long list of 50 finance solutions the BIOFIN Prioritisation Excel was used to reduce the list to 17 finance solutions that had an average score of 80% on priorities such as contribution to biodiversity management, innovation, clarity of finance mechanism, socio-political considerations and ability to mobilise funds for biodiversity management, among others. An initial Draft NBFP report was produced with the 17 finance solutions. Interventions of the technical steering committee, the technical support team in NEMA, Global BIOFIN, and revisions by the national BIOFIN team led to the outcome eight (8) finance solutions. The final eight (8) finance solutions were extensively reviewed and developed to provide a clear path for addressing the joint challenge of resource mobilisation and biodiversity conservation and management.
2.3 Goal and objectives and biodiversity finance solutions
The goal of the plan is to achieve “optimal and sustainable financing for biodiversity conservation and management attained by 2027/28.” Three objectives complement the goal of the NBFP.
The objectives are:
(1) To develop and implement a biodiversity and ecosystem index and payments for ecosystem services.(2) Enhance the use of economic instruments as incentives for biodiversity conservation and management. (3) Scale up innovative biodiversity management and conservation actions that enhance livelihoods and
increase national revenue.
There are eight (8) finance solutions developed for implementing the NBFP. The eight finance solutions are:
1. A national biodiversity and ecosystem index and biodiversity fiscal transfers.2. A national programme on payments for ecosystem services. 3. Scaling up bottom-up enforcement for biodiversity and ecosystem management based on community
regulatory systems and incentives model.4. Upgrading the ecotourism value chain for Ramsar sites and Kampala city and Mbarara municipality.5. Upgrading the value chain for organic agriculture, natural ingredient, cosmetics and pharmaceuticals.6. Rationalise and implement revised charge systems for biodiversity and ecosystem conservation and
management.7. A financing model for biodiversity conservation for central forest reserves.8. Standardize and regulate implementation of biodiversity offsets.

National Biodiversity Finance Plan 16
3. FINANCE SOLUTIONS AND THEIR BUSINESS CASE
3.1 National biodiversity and ecosystem index and biodiversity fiscal transfers
3.1.1 The finance solution
The finance solution seeks to ensure that there is clear accountability for biodiversity investment funds by developing and implementing a national index, with flexibility at sub-national level, that allows for government, and other funding partners to monitor the performance of biodiversity investment, but to also ensure that the investments are scored in line with the NBSAPII, the NDPII and funding agencies expectations. Therefore, in addition to the index, a guide will be developed for implementing biodiversity fiscal transfers. Fiscal transfer guide will be adapted for both public and non-public sector financing.
The rationale for the finance solution is based on the findings of the BER and PIR reports, which showed that a disproportionately large percentage, 45.6% according to the BER (Figure 4), of the financing meant for biodiversity conservation and management was spent on strengthening coordination and policy actions. Consequently, only about 22-25% of the budget was actually invested directly into biodiversity restoration or maintenance despite the high, year on year, rate of biodiversity and ecosystems loss.
Figure 5: Biodiversity budget share by strategic objectives
13.7%
18.6%
0.4%
8.5%
13.2%
45.6%
Build capacity for research, knowledge and information management and exchange on biodiversityTo enhance awareness and education on biodiversity issues among the various stakeholders
To harness modern biotechnology for socio-economic development
To promote the sustainable use and equitable sharing of costs and benefits of biodiversityTo reduce and manage negative impacts while enhancing positive impacts on biodiversity
To strengthen stakeholder and frameworks for biodiversity management
Source: NEMA, UNDP and BIOFIN (2017b)
3.1.2 Proposed Actions
There are four proposed four actions for developing the biodiversity and ecosystem service index and guidelines for biodiversity fiscal transfers described below.

National Biodiversity Finance Plan 17
1. Develop the biodiversity and ecosystem services index
The proposed national biodiversity and ecosystem services index serves as a tool that specifies qualitative and quantitative unit of effort required to achieve the biodiversity conservation management targets described in the NBSAP II and the Vision 2040 and second National Development Plan (NDPII). The index which coalesces all the biophysical and qualitative indicators then guides appropriation of ecological transfers to be made for biodiversity and ecosystem management, across the different stakeholders in the country. The index will generally categorise actions under two groupings of restoration and management actions. The development of the index through development of weights (units of effort) of restoration or management, that provide an effective indication of effort of biodiversity and ecosystem restoration or management. The metrics used in the index may include hectares to restore, specified species of biodiversity to re-introduce and hectares or numbers of a specified invasive alien species to remove. The smallest unit of effort will be at appropriate for individual household level interventions but aggregated can be aggregated larger scales of sub-counties, Districts, sub-programmes, programmes (sub-sectors) and sectors to guide implementation of fiscal transfers. The index will provide the basis for the technical efficiency or cost-effectiveness assessments, on the other hand, and provide an indication for financial appropriation and allocative efficiency assessment.
2. Determine responsibility for biodiversity and ecosystem management
The interventions will be sub-divided and responsibility specified for different stakeholders. Suppliers (producers) of ecosystem services, and stakeholders that consume or use ecosystem services will have prescribed metrics of effort (Table 5). The index will benefit from natural capital accounting. The biodiversity and ecosystem service index will be matched with stakeholders through supply and use tables. Attribution of responsibility of the expected contribution towards management and restoration actions and the options considered.
Table 5: Developing proposals on responsibility for the biodiversity and ecosystem service management action
Component by management action Options for interventions Metrics Guidance for fiscal transfers/ reforms
Users:
Wetlands: include private sector and communities who abstract water, extract sand, and harvest papyrus, fish, foods, grass, among others
Forests include commercial harvesters and community users for timber, wood fuel among others
Water resources: private sector and communities who abstract water, fish etc.
A use plan based on maximum sustainable yield thresholds.
Employ moratoriums for degraded resources.
Contribute funds to sustainable management of wetland resources.
Employ efficient technologies that minimize damage to biodiversity and ecosystems.
Employ efficient technology that minimizes quantity of resources.
Savings in area of ecosystem degraded.
Savings on fuel consumption translated into forest area (or biomass)
Savings in wetland area encroached
Area of wetland sustainably utilized
Voluntary compliance certification.
Waivers on compliance charges.
Renewal of user licenseesFiscal transfers to support scaling up of successful technologies
Producers: Wetlands include communities living within or adjacent to wetlands, MALGs who coordinate management actions
Forests/ wildlife include private forest owners, communal forest owners, farmers practicing agro-forestry, NFA, UWA and DLGs who coordinate management actions
Water resources: private sector and communities living within or adjacent to water resources MDAs and DLGs who coordinate management actions
Have sustainable production plans.Marking and restore degraded areas.
Maintain ecological buffers between critical biodiversity and livelihoods activities.Cleaning up pollution damage.Restricting access for encroachers
Undertaking community conservation and production actions such as apiary, community wildlife use rights, ecotourism,
Area sustainably managed Areas restored based on stated baseline or benchmarkWater quality improvements
Ecosystem service yield restoration levels (fisheries, sustainable water supply enhanced, grass or forage production, wildlife habitats restored)
Area of farm lands under forestry production
Transfers to MALGs responsible Transfers to community associations responsible
Transfers to private farmers/ private sector responsible
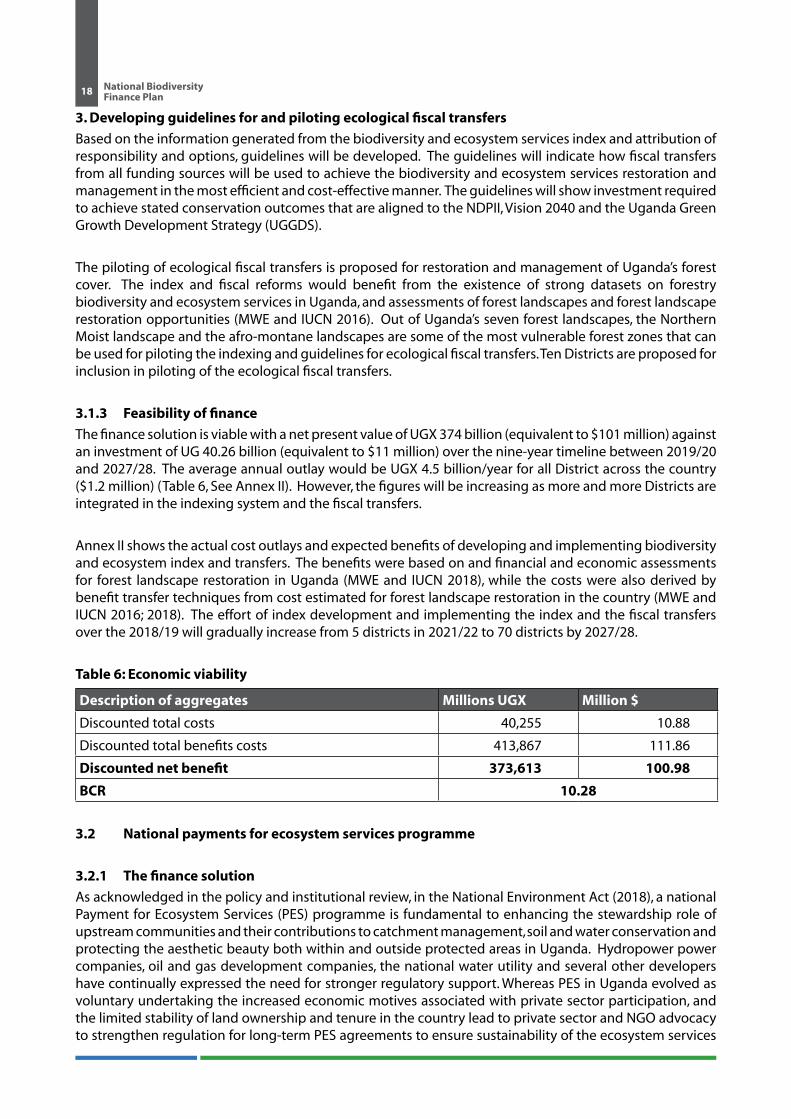
National Biodiversity Finance Plan 18
3. Developing guidelines for and piloting ecological fiscal transfers
Based on the information generated from the biodiversity and ecosystem services index and attribution of responsibility and options, guidelines will be developed. The guidelines will indicate how fiscal transfers from all funding sources will be used to achieve the biodiversity and ecosystem services restoration and management in the most efficient and cost-effective manner. The guidelines will show investment required to achieve stated conservation outcomes that are aligned to the NDPII, Vision 2040 and the Uganda Green Growth Development Strategy (UGGDS).
The piloting of ecological fiscal transfers is proposed for restoration and management of Uganda’s forest cover. The index and fiscal reforms would benefit from the existence of strong datasets on forestry biodiversity and ecosystem services in Uganda, and assessments of forest landscapes and forest landscape restoration opportunities (MWE and IUCN 2016). Out of Uganda’s seven forest landscapes, the Northern Moist landscape and the afro-montane landscapes are some of the most vulnerable forest zones that can be used for piloting the indexing and guidelines for ecological fiscal transfers. Ten Districts are proposed for inclusion in piloting of the ecological fiscal transfers.
3.1.3 Feasibility of finance
The finance solution is viable with a net present value of UGX 374 billion (equivalent to $101 million) against an investment of UG 40.26 billion (equivalent to $11 million) over the nine-year timeline between 2019/20 and 2027/28. The average annual outlay would be UGX 4.5 billion/year for all District across the country ($1.2 million) (Table 6, See Annex II). However, the figures will be increasing as more and more Districts are integrated in the indexing system and the fiscal transfers.
Annex II shows the actual cost outlays and expected benefits of developing and implementing biodiversity and ecosystem index and transfers. The benefits were based on and financial and economic assessments for forest landscape restoration in Uganda (MWE and IUCN 2018), while the costs were also derived by benefit transfer techniques from cost estimated for forest landscape restoration in the country (MWE and IUCN 2016; 2018). The effort of index development and implementing the index and the fiscal transfers over the 2018/19 will gradually increase from 5 districts in 2021/22 to 70 districts by 2027/28.
Table 6: Economic viability
Description of aggregates Millions UGX Million $
Discounted total costs 40,255 10.88
Discounted total benefits costs 413,867 111.86
Discounted net benefit 373,613 100.98
BCR 10.28
3.2 National payments for ecosystem services programme
3.2.1 The finance solution
As acknowledged in the policy and institutional review, in the National Environment Act (2018), a national Payment for Ecosystem Services (PES) programme is fundamental to enhancing the stewardship role of upstream communities and their contributions to catchment management, soil and water conservation and protecting the aesthetic beauty both within and outside protected areas in Uganda. Hydropower power companies, oil and gas development companies, the national water utility and several other developers have continually expressed the need for stronger regulatory support. Whereas PES in Uganda evolved as voluntary undertaking the increased economic motives associated with private sector participation, and the limited stability of land ownership and tenure in the country lead to private sector and NGO advocacy to strengthen regulation for long-term PES agreements to ensure sustainability of the ecosystem services

National Biodiversity Finance Plan 19
that serve as their raw materials. The National Environment Act No. 5 of 2019 proposed the introduction of PES as an additional economic instrument to support biodiversity conservation. The finance solution seeks to support establishment of the national PES programme covering the sub-national activities but coordinated at national level to ensure security of contracts, protect communities’ rights of access to biodiversity and ecosystem services, and minimise any potential negative impacts and enhance positive impacts on biodiversity. A national regulation for the PES programme will be developed and piloted.
3.2.2 Proposed Actions
1. Regulatory system
The first step to establishing a national PES programme is to develop a national regulation. Under current practice, PES interventions are voluntary interventions. Regulatory reform for PES offers two types of opportunities; it will strengthen of contractual laws particularly for public resource such as a wetland, central forest reserve or a National Park and Wildlife Reserve, and implementation of both compliance and voluntary Environmental Management and Mitigation Plans, which are monitored through compliance or voluntary environmental audits. Additionally, the National Environment Act No. 15 of 2019 proposed PES among its clauses and additional regulations and guidelines will be required for the design of watershed payments, biodiversity conservation payments, and any other payments supporting biodiversity management and areas with synergies such as climate change management.
2. Capacity building for regulators and lead agencies to biodiversity and ecosystem management
Technical and institutional capacity building in the design, implementation, coordination and compliance support for PES will be required. The starting point for capacity building are the existing best practices within the country and from outside the country. The capacity building will strengthen PES regulatory support office at NEMA and focal points for PES coordination and compliance support in the natural resource managing entities; UWA, NFA, DWRM and DLGs, among others. Capacity building and awareness creation will also enable developers and their environmental practitioners to design efficient and effective PES actions.
3. Design and pilot system for managing PES funds/ Managing Entities for the PES
Under current best practice PES contracts will be signed between the buyers and sellers of the ecosystem services with the support of an intermediary, a managing entity. The contracts will show that buyers pay for specified ecosystems provided with clear metrics. Current experience is that the funds are held by a registered non-profit company which charges a modest administrative fee to both the seller and buyer of the ecosystem services. A payment plan is prepared and buyers makes payments based on a cash flow process that matches the payments received with verified and/or certified ecosystem services provided. Therefore, both the managing entity and the regulatory must have capacity to undertake monitoring, reporting and verification (MRV) for ecosystem services. Many times, the managing entity, which comprises a technical team or firm, is hired to mediate the contract, ensure the technical efficiencies sought by the PES buyers are met. The technical efficiency is ascertained through MRV and issuance of verification and/or certification, by a trusted authority. At the same time the managing entity ensures that ecosystem service providers get paid for the ecosystem services provided.
A core issue in the design and system is agreement on the metrics to use for the ecosystem service and the reward in terms of the payment. Regulator intervention, and technical support from the managing entity and external agencies will be sought to define levels of technical performance and efficiency required to command a payment from buyers of the ecosystem service. Existing best practice for watersheds and agricultural landscapes have been documented by Shames et al. 2015, and current work by WWF in the Rwenzori Mountain National Park landscape.

National Biodiversity Finance Plan 20
Three pilots are proposed for the PES. In all three cases the starting point is rationalising the designing of existing PES programmes. The national pilot with focus on areas where willing buyers and sellers of ecosystem services have been identified, and the feasibility of the PES has been studied. The three PES projects that will serve as pilots are; Watershed payments; Biodiversity conservation PES opportunity in areas adjacent to protected areas and/or rich in species biodiversity, particularly wildlife, and payments for farm agricultural and mountain landscape biodiversity.
3.2.3 Feasibility of finance solution
The business case for the national PES programme showed a net benefit of UGX 370.1 billion (equivalent to $100 million) mostly in ecosystem services protected through community stewardship actions. The specific costs of implementing the PES programme were estimated at UGX 28.7 billion ($7.75 million) over an eight-year timeline (Table 7). The PES programme is expected to grow from at least one district to 24 districts by 2027/28. The benefit cost ratio obtained was 13.9. The benefit-cost ration shows that the economic benefits of undertaking a PES are very high and robust and significant changes in the ecosystem would still mean a high economic value for continuing with the ecosystem services. The financial viability on the other hand would need to be undertaken on a case by case basis and may have significant variability. As a public intervention the economic returns support implementation of the programme. The costs and benefit cycles are respectively highlighted in Annex III.
Table 7: Benefits versus costs
Description of aggregatesAggregate amount
Millions UGX Million $Discounted total benefits 398,820 107.79Discounted total costs 28,692 7.75Discounted net benefit 370,128 100.03BCR 13.90
3.3 Scale up bottom-up enforcement for biodiversity and ecosystem management based on community regulatory systems and incentives model
3.3.1 The finance solution
Due to limited budgeting for the Environment and Natural Resources Sector, less than 1% of the national budget (NEMA et al. 2017b), the institutional framework designed for biodiversity and ecosystem management at community and sub-national level is non-functional. The National Environment Act Cap 153 established an institutional structure for environmental management based on Local Environment Committees (LECs) at village and parish level, and Sub-country and District Environment Committees (SECs and DECs). However, the structure proved too costly for the Government when the development partners who supported pilot activities, the World Bank and the United States Agency for International Development (USAID) pulled out (NEMA et al. 2017a). The failure to sustain the institutional framework is one of the major causes of decline in structured biodiversity and ecosystem management actions at community level within the country (NEMA et al 2017a). Whereas the idealised institutional framework is considered too costly to sustain, the emergence of isolated but successful bottom-up institutional arrangements proved so successful through Community Environment Conservation Funds (CECF) and other revolving groups that it has been proposed as an alternative and cheaper option, and integrated into the undertakings of the Water and Environment Joint Sector Review (JSR) 2018. The bottom-up institutional framework is proposed as an alternative institutional arrangement for implementing community level biodiversity and ecosystem management actions within the National Environment Act No. 5 of 2019 with a scale-down public sector budget compared to the institutional arrangement pilot under the previous law, the National Environment Act Cap 153.
National Biodiversity Finance Plan 21
3.3.2 Proposed Actions
1. Rationalise and carefully design institutional framework for bottom up biodiversity and ecosystem conservation and management
The first action will be to rationalise (feasibility assessment) and carefully design an institutional and governance framework for bottom up biodiversity and ecosystem conservation and management that is widely adaptable with salient features that fit different regions and communities. The institutional structure will involve community committees aggregated at parish level represented at sub county and district level, the intervention will lead to development of local biodiversity and ecosystem management action plan, sub county by laws and district ordinances. At national level the institution and governance system will be completed by national biodiversity policy which is aligned to the national environment act. It should be noted that the National Environment Act No. 5 of 2019 proposes strengthening of institutions and governance framework for environmental management.
2. Set-up an appropriate incentive system
The second action will be to develop an incentive system for the institutional framework developed. The finance solution incentives will be based on the stewardship rights awarded to communities. The communities will be able to plan for and manage biodiversity and ecosystem with support of the District Local Government. The bylaws and ordinances will empower community on enforcement of regularities against degradation and laws on sustainable use with support of DLGs, and national Ministries and Agencies. To allow the transition into the stewardships to run, revolving fund based on a cooperative structure will be established. The revolving fund will be governed within the bylaws, agreements and MOUs. Funds will be transmitted from central government, DLGs, donors and private sector, use fir conservation, sustainable use, and livelihoods activities that remove or reduce damage to biodiversity and ecosystems. The third sub-component is to scale-up the institutional systems for enforcement of biodiversity and ecosystem regulations. Also the sub-component covers the incentives of the bottom-up system.
3. Scaling up the enforcement and compliance system and incentives
In the implementation phase of the financing solution the bottom-up of enforcement for biodiversity and ecosystem management is based on community regulatory systems and incentives model will be scaled up. The scaling up will start with five Districts and increase to 140 Districts by the end of the seven years of NBSAPII.
3.3.3 Feasibility of the finance solution
The net present value obtained out of the business case for bottom-up enforcement and compliance for biodiversity and ecosystem conservation and management shows a viable finance solution. The net present value obtained out of the benefit versus cost cycles (Table 8) is projected at UGX 182.86 billion (equivalent to $49.42 million) over the nine years of piloting and implementing the finance solution.
The benefit cost ratio of 2.25 shows that the benefits provide have a 125% buffer above the costs of the finance solution suggesting that the bottom-up enforcement and compliance for biodiversity and ecosystem conservation and management is a very robust intervention with a high chance for success. The finance solution would be successful if implemented on its own, even though the high viability also suggests that it would work well in combination with the finance solutions 1 and 2, the biodiversity and ecosystem service index and guidelines for ecological fiscal reforms, and the national PES programme.
The pilot investment in the finance solution will likely focus on the feasibility studies, design of regulatory and incentive framework and a one-year pilot, over a three to four-year timeline. The cost of the pilot investment is estimated at UGX 5.02 billion. Annex IV highlights the results of the cost and benefit cycles.

National Biodiversity Finance Plan 22
Table 8: Net benefits for bottom-up enforcement and compliance for biodiversity and ecosystem conservation and management
Business case cycle Aggregate amount (UGX millions) Aggregate amount ($ millions)
Discounted benefits 329,364 89.02
Discounted costs 146,502 39.60
Net benefits 182,862 49.42
Benefit Cost Ratio 2.25
3.4 Upgrading the ecotourism value chain for Uganda
3.4.1 Introduction
Whereas critical wetland catchments such as Ramsar sites and wetlands in key urban areas provide a lot of ecosystem services, the pressure to encroach them particularly for land use change for urban settlements, and/or agriculture production is high. Nature Uganda (2015) while under community action planning for Nabajjuzi and Lake Nabugabo wetlands found that in the absence of external support to maintain sustainable use and management of critical wetlands, the communities would degrade them. The finance solution seeks to support development of sustainable use for critically endangered wetland systems of national and international importance. The most valuable non-consumptive use of the wetland systems that can be organised alongside sustainable access to ecosystems from communities, is ecotourism development. Source of value for the wetlands develop the ecotourism potential of all 12 Ramsar sites, and the Lubigi and Nakivubo wetlands in Kampala city and River Rwizi in Mbarara Municipality. Ecotourism activities will be developed for Lake Bisinia wetland system, Lake Opeta wetland system, Sango-Bay – Musambwa Island – Kagera (SAMUKA) wetland system, and Lake Nakuwa wetland all Ramsar sites in excess of 50,000 ha. Additionally, ecotourism opportunities will be developed for Nakivubo and Lubigi wetlands in Greater Kampala Metropolitan area.
3.4.2 Proposed Actions
The main ecotourism products and services to be developed are: (i) bird watching, (ii) butterfly watching, (iii) sport fishing, (iv) boat cruises, (v) canoeing, and (vi) scenery viewing. The specific upgrade investments are onsite investments in: (i) facilities: specifically; (a) accommodation as part of the eco-tourism experience conservation ethic and facilities or investments for operation of the ecotourism activity e.g. transport, communication and offices; design of the tourism package comprising the service; (a) total experience of the guests, (b) understanding activity, and (c) other needs; and the luxury; (a) leisure environmental services available to guests; (b) education, satisfaction, appreciation and style components. The onsite ecotourism experience will be rounded off with programming which comprises: (a) implementation of on-site experiences; (b) implementation development of off-site long-lasting benefits; (c) contact and education pre-, during and post-vacation; and (d) implementation interlinked experiences or activities i.e. packages.
Offsite activities are marketing, sharing of benefits and monitoring of performance: Marketing is composed of developing: (a) specialty market niches-nature/adventure/culture/education; (b) wilderness ethic, environmental stewardship enlightenment; (c) benefits plus responsibilities; and (d) Green reality (eco ethnic). Sharing benefits comprises: (a) operator, community, resource (varied benefits); and (b) for tourists the benefits that last longer than actual vacation. On the other hand, monitoring of performance is composed of assessing: (a) repeat visits and word of mouth views; (b) customer enlightenment; (c) Community/operator quality of life, cultural renewal and pride; (d) Spreading out visitation period; (e) Positive economic impact and variable business trends assessment; and (f ) Resource conservation.
The wetland systems proposed for ecotourism development are highlighted in Table 9. The species abundance for wetland species, globally threatened species and regionally threatened and/or endangered species mean that they have strong conservation and tourism value.

National Biodiversity Finance Plan 23
Table 9: Characteristics of the selected wetland systems
Wetland systems Area (ha) Location (Districts) No. of species
No. of wetland
species
Global threatened
species
Regional Red data
species
Lake Bisinia wetland system 54,229 Kumi, Katakwi and Soroti 162 81 4 21
Lake Opeta wetland system 68,912 Nakapiripirit, Bulambuli, Katakwi, Kumi 174 93 3 22
Sango-Bay – Musambwa Island – Kagera (SAMUKA) wetland system 55,110 Masaka, Rakai 372 105 3 19
Lake George Wetland system 15,000 Kasese 491 167 9 28
Lake Nakuwa wetland 91,150 Kaliro, Pallisa, Soroti 258 88 3 21
Kampala-Lubigi wetland system (proxy Mabamba) 245 Kampala and Wakiso 200 91 3 19
Kampala-Nakivubo Wetland system 190 Kampala, Wakiso and Mukono 157 44 3 18
River Rwizi* (proxy Mburo-Nakivale) 24,000 Mbarara, Sheema, Buhweju Kiruhura and Ntungamo 312 92 7 28
* Conditions proxy Lake Mburo-Nakivale wetlands, one of Uganda’s Ramsar sites; Nabajjuzi Wetland system proxy for Lubigi and Kampala Nakivubo wetlands; and Mabamba wetlands proxy for Kampala – Nakivubo wetland systems.
3.4.3 Feasibility of finance solutionThe projected costs are based on linear extrapolation for the results obtained from communication ecotourism planning (Nature Uganda 2014) for Mabamba wetland system in Wakiso District. The highest cost is the tourism development and promotion and regulated resource harvesting (Table 10). Other important costs are the management costs for halting wetland burning through implementation of local bylaws and community awareness. Regulation of illegal fishing, sand mining and pollution of wetland are within the local bylaws but require separate enforcement actions through community committees and paid workers who provide surveillance and report, and facilitation of local police to provide back up support to the community ecotourism. It should be noted that the communities work with private sector partners and have a partnership where a percentage of the revenues obtained is taken by the communities (usually 20 to 40%).
Table 10: Projected costs (UGX/ha) for wetland system management for ecotourism purposes
OUTCOMES Projected costs (UGX/ha)
2019 2020 2021 2022 2023 2024 2025 2026 2027 20281.Tourism development and Promotion 25,887 27,800 29,713 31,626 33,539 35,452 37,365 39,278 41,190 43,103
2.Burning of wetland stopped 13,033 14,034 15,035 16,036 17,037 18,038 19,039 20,041 21,042 22,043
3.Mabamba catchment forested 12,944 13,900 14,857 15,813 16,769 17,726 18,682 19,639 20,595 21,552
4.Illegal Fishing Controlled 9,775 10,526 11,276 12,027 12,778 13,529 14,280 15,030 15,781 16,532
5.Regulated Resource harvesting 25,887 27,800 29,713 31,626 33,539 35,452 37,365 39,278 41,190 43,103
6.Sand mining & Pollution of the wetland Controlled
13,112 14,160 15,208 16,256 17,305 18,353 19,401 20,450 21,498 22,546
Annual Total 110,297 123,155 136,013 148,871 161,729 174,587 187,445 200,303 213,161 226,019
Source: Nature Uganda (2014)

National Biodiversity Finance Plan 24
Results of the break-even analysis, conducted to establish the threshold of viability, show that if each of the eight ecotourism sites individually averaged 27,356 visitors per year or altogether the eight ecotourism sites received 218,842 visitors/year, the investment in ecotourism would be viable (Table 11). The viability of the investment is based on the assumption that the average expenditure per tourist or visitor is UGX 112,500/ visit, irrespective of whether they are national residents, forest residents or foreign non-residents. The discount rate for benefits and the compounding rate for costs were both set at 12% (MFPED 2018).
Table 11: Threshold of viability for implementation of the ecotourism finance solution
Description Total amounts in billion UGX Total
2019 2020 2021 2022 2023 2024 2025 2026 2027 2028Discounted Total costs 10.2 11.4 12,6 13.8 15.0 16.2 17.4 18.6 19.7 20.9 155.8Discounted Total benefits 24.6 22.0 19.6 17.5 15.6 14.0 12.5 11.1 9.9 8.8 155.8Average Price ($30/ visitor) ($1=UGX 3750) 112,500Aggregate Number of visitors 218,842Average number of visitors for the 8 sites 27,356
An assessment of tourism value as part of the ecosystem service valuation for Budongo central forest reserve, Murchison Falls National Park and Semuliki National Park found that average the modal payment by visitors was $35 (UGX 129,500) per visitor and the wetland systems with developed tourism activities e.g. Mabamba wetland system, Lutembe Bay wetland system and Lake Nabugabo wetlands average over 30,000 visitors per year. Therefore, the investment in the ecotourism activity would be feasible. Community management action plans can guarantee communities sustainable access to fisheries, water supply, papyrus, and other sustainably harvested products. The ecosystem service value for products obtained by communities are estimated at about $3,000/ha of wetland system (Kakuru et al. 2013).
3.5 Upgrading the value chain for organic agriculture, natural ingredient, cosmetics and pharmaceuticals
3.5.1 The finance solution
The finance solution seeks to upgrade the shea butter and organic agriculture value chains. The finance solution for shea butter involves three actions, improved collection of shea nuts, improved maintenance of trees through tending and long-term enrichment planting, as well as improved processing and marking of shea nuts and shea butter to enhance revenue. By increasing the value earned shea can be conserved and incentives will be created for communities in northern Uganda to undertake sustainable management and use actions for valuable biodiversity. In absence of alternative valuable use trees such as shea and acacia Senegal (for Gum Arabica) are harvested for wood production. Woodlands are the most vulnerable form of forest estate to deforestation for fuelwood in Uganda. Even though bylaws have been developed to protect valuable tree species, additional incentives are needed to change the mind-set of the Indigenous Peoples and Local Communities (IPLCs).
Uganda has an extensive shea butter belt in northern Uganda. Potential levels of Shea nut production in the Ugandan shea ranges between 70,000 and 385,000 metric tonnes, or 15 to 80 million litres of oil using traditional methods value at $30 million. But currently exports stand at 3 metric tonnes of shea nut butter equivalent $21,000 (UGX 77 million) per week equivalent to $1.09 million/year of shea product exports/year (UEPB 2018). Moreover, Uganda grows the Vitellaria nilotica variety of shea nut which is preferred by cosmetics firms due to its higher olein fraction (i.e. the Ugandan sample had a 59% oleic acid content compared with 47% for Nigeria and only 39% for Burkina Faso (Ferris et al. 2001). With improved collections, management of shea trees, processing technology and marketing shea butter oil production can be increased to 120 million litres leading to two to three-fold increase in export value to $60 to 90 million (NEMA and UNDP 2018). The limited press technology capacity and poorly developed value chain

National Biodiversity Finance Plan 25
and market structure means that Uganda loses between $59 to 89 million/year of the value that can be captured in the shea nut/oil value chain (NEMA and UNDP 2018; UEPB 2018).
With regard to organic agriculture, the National Organic Agriculture Movement of Uganda (NOGAMU) in 2016 indicated that the country receives orders of at least $300 million every year. Even though Uganda’s organic agriculture exports have grown from $4.6 million/year in 2002/03 to $55 million by 2015/16, the progress is still too slow. Uganda has the largest number of certified organic agriculture farmers in Africa (190,000) and the second largest area under organic (231,157 ha) on the continent (NOGAMU 2016). More importantly, Ugandan farmers generally produce with little external input and generally prefer organic agriculture production (Lustig 20084). The key constraints to organic agriculture in Uganda are related to: (a) production, (b) market access and marketing, and (c) institutional and policy-related issues. In the absence of institutional and policy support, the smallholder farmers bear a high cost of organic certification, and conversion at farmer level. The efforts to enhance market access are fairly successful in recent times, but the farmers are unable to obtain the economies of scale from the premium due to small size. The finance solution seeks a threefold increase in the area of certified organic agriculture, and policy and institutional support to lower operation costs through public support in organic certification, and maintenance of current market
3.5.2 Proposed Actions
a) Shea nut and Shea oil/butter
The two key interventions proposed that can enhance the performance are: (i) upgrading press technology and increasing access of this technology close to farmers, and (ii) the supply side performance of shea nut collections through maintenance of trees, and regular collections and access to buyers of the shea nuts.
The extraction efficiency increased from about 12.6% to about 25% of the oil extracted (NEMA and UNDP 2018). The shea oil content is estimated at 41-45% (Okullo et al. 2010) therefore extraction efficiency can improve quantity of shea produced.
b) Organic agriculture5
The proposed interventions for the organic agriculture sector will first be: (i) support development of enabling conditions comprising of a policy and enabling environment; (ii) financing support to the value chain for farmers with capacity to expand current production or increase number of farmer, and processors with capacity to increase processing and traders with export deficits. Government through policy and institutional support, and extension will support expansion of organic agriculture land three fold from 231,157 ha (2016) to 693,471ha by 2027/28. The additional production realised will require improved value addition, marketing costs, and certification and conversion costs, as well as the opportunity cost of current production for farmers who switch. The gains from organic agriculture include improved farm management practices which also benefit the conventionally managed farms, i.e. Good Agriculture Practices of records keeping, tracing all inputs used, booking keeping and social inclusiveness such as farm hygiene and the improved welfare of workers.
3.5.3 Feasibility of finance solution
a) Shea nuts and Shea Butter
Partial budget analysis conducted for the shea nut/shea butter value chain shows improvements from the current net annual revenues of $198,600 to $824,577, $15.7million, $13.1 million under three alternative scenarios (Table 12). The three alternative scenarios respectively are Scenario 1: Increase oil seed collections
4 Lessons in marketing organic from Africa -the EPOPA Programme Peter Lustig 24th of September2008, Export Promotion of Organic Products from Africa, Presentation Kampala
5 Note sometimes Shea is categorized as an organic product, oil crop or organic oil crop. However, it is considered separate from the organic products, in this context.

National Biodiversity Finance Plan 26
and maintenance of shea trees and processed oil exported, Scenario 2: Improved collections, restoration and improved processed oil exported and Scenario 3: Increase oil seed collections and maintenance of shea trees and improved processed oil exported. Scenario 2 had the highest net benefit of $15.7 million because it was focused on increasing processing and export of processed shea butter/oil and improved access to the local market.
Scenario 3 seems most favourable as it is focused on maintenance and expansion of area under collection as well as a steady increase in shea nut seed collections and improved processing for the domestic market and export. Scenario 2 is focused on modest improvements through restoration, improved processing and sale of shea nuts and processed shea butter/oil exported. The partial budget analysis points to increased profitability and make the finance solution sound for a private sector intervention supported through upgrading the value chain.
Table 12: Partial Budget analysis for Shea butter value chain upgrading
Description of costs and benefit cycles
Baseline status (2018) Shea nut processed for oil and oil exported
Scenario 1: Increase oil seed collections and maintenance of Shea trees and processed oil exported
Scenario 2: Improved collections, restoration and improved processed oil exported
Scenario 3: Increase oil seed collections and maintenance of Shea trees and improved processed oil exported
Current collections (2018)
Projected collections (2028)
Projected collections (2028)
Projected collections (2028)
Area 7,117.9 100,000 200,000 100,000Shea nut yield (Mt/ha) 0.13 0.13 0.13 0.13Shea nut production (Mt/year) 936 26,300 39,450 26,300Shea nut processed for export (Mt/year) 486 13,150 13,150 6,575
Price of Shea nuts seed $/tonne 600 600 600 600Sub-total value of seed 291,600 7,890,000 7,890,000 3,945,000Processed oil current yield (333kg/Mt of Shea nut), MT 3 438.29 5,917.5 2,958.75
Export Price $/tonne 7000 7000 7,000 7,000Sub-total $ 21,000 3,000,000 41,422,500 20,711,250Local Market sales 30 300 300 300Export Price $/tonne 4000 4000 4000 4000Local value 120,000 1,200,000 1,200,000 1,200,000Total Value 432,600 12,090,000 50,512,500 25,856,250Costs 52 Farm gate costs based on current production prices $/tonne (production) $250/tonne
234,000 6,575,000 9,862,500 6,575,000
Restoration costs 16,891,891 Tree maintenance costs 4,229,973 4,229,973 4,229,973
Upgrading processing and refinery
1 4 2 300,000 1,200,000 600,000
Upgrading quality assurance 100,000 100,000 100,000Added marketing costs 60,450 2,525,625 1,292,813Total costs 234,000 11,265,423 34,809,989 12,797,786Net Annual Revenues 198,600 824,577 15,702,511 13,058,464
b) Organic agriculturePartial budget analysis for the organic agriculture value chain upgrade shows the results of integrating economies of scale by expanding area under production, and public sector interventions on certification costs, and maintaining good access to export markets. The net benefits obtained from the three-fold expansion and public support was $85.7 million/year (Table 13) as additional earnings in addition to the documented $55 million/year.

National Biodiversity Finance Plan 27
Table 13: Partial Budget analysis for organic agriculture expansion
Description of categories of costs/benefitsCosts ($)
Current costs Added costs Reduced costs Area 231,157 462,314 462,314Costs Establishment costs up to first harvest (18 months) 619 309 309Annual maintenance costs ($/year) 0 0 0Certification costs (Average annual cost) $/ha/year, average 2.34 ha 128 43 85Total $/ha/year 746.67 352.33 394.33Amount 172,597,227 162,888,633 182,305,821Gross added costs 19,417,188 Benefits Added benefits Reduced benefitsAdded export value 110,000,000Current crop income lost 43,732,405Amount 110,000,000 43,732,405Gross benefits 66,267,595Net benefit 85,684,783
Sources: adapted from NOGAMU 2018;
3.6 Rationalise and implement revised charge systems for biodiversity and ecosystem conservation and management
3.6.1 Introduction
Uganda environmental policy reforms generally occurred between 1994 and 2003. Biodiversity and ecosystem conservation/management laws were formulated in the order of the National Environment Act Cap 153 (in 1995), Wildlife Act Cap 200 (1996), the Water Act Cap 152 (1997) and the National Forestry and Tree Planting Act (2003). The key regulatory instruments that contain schedules of the charge, licensing and permit systems critical to regulation of biodiversity and ecosystem use include:
(i) National Environment (Access to Genetic Resources and Benefit Sharing) Regulations 2005(ii) The National Environment (Wetlands, River Banks and Lake Shores Management) Regulations, No.
3/2000)(iii) Local Government Act Cap 243 (1997), departmental revenue: a. Fees from sustainable wood production and processing b. Fees from sustainable wetland use c. Fees from environmental compliance for extractive activities (e.g. sand, gravel, stones, etc.) and fines and charges for poor waste management
The finance solution seeks to rationalise and redesign the charge systems to reflect the current cost of biodiversity and ecosystem management. The instrument rates were generally fixed amounts based on the prevalent compliance challenge at the time. For example, between 1999 and 2000 when the regulations and instruments were developed the Uganda shilling’s dollar exchange rate was $1 to UGX 1,000 – 1,200. Currently, the Uganda shilling’s dollar exchange rate stands at $1 to UGX 3,740 – 3,780 (Bank of Uganda, November 2018). Moreover, given that the Government operates an inflation target of about 5% per annum, and an economic discount rate of 11% (MFPED 2018), the charge rates need to be revised regularly to reflect economic conditions. Other factors to be considered in the feasibility assessments are the change in size of resource, and current livelihoods associated with the ecosystem services.

National Biodiversity Finance Plan 28
3.6.2 Proposed Actions
1. Rationalise and revise charges 1) Conduct technical studies to establish cost recovery, the value of biodiversity and ecosystem services,
the remedial and social welfare costs/ opportunity cost of using biodiversity and ecosystem services.
2) Undertake weighting of the use rates and the appropriate fees levels. The weighting or calibration fees should be consistent with sustainability principles such as the polluter pays and user pays principle but should also apply principles such as no-net loss of biodiversity.
3) Design revised schedules, fees structure, instruments and guidance, among others in line with requirements of the regulations NEMA (2016).
2. Pilot the new charge system and scale out based on success of pilots.
All eight instruments will be piloted for at least one year. The piloting and subsequent review will allow for integrating of stakeholder concerns and conditions on ground. Proposals will then be made to adopt the revised charge systems in the revised regulations and/or schedules.
3.6.3 Feasibility of the finance solution
The benefit cost analysis conducted for developing the five charges and/or economic instruments showed a discounted net benefit of $22.4 million, equivalent to UGX 83 billion, over the course of the nine-year project (Tables 14). The benefit cost ratio obtained was 3.17. Therefore, the finance solution can be considered robust with a buffer of 217% above the breakeven threshold.
Table 14: Net benefits for rationalising and implementing revised charge systems for biodiversity and ecosystem conservation and management
Action Aggregate Amount in million UGX Aggregate Amount in million $Discounted Benefits 38,295 10.35Discounted costs 121,323 32.79Discounted Net Benefit 83,028 22.44Benefit Cost Ratio 3.17
3.7 Financing model for biodiversity conservation for central forest reserves
3.7.1 The finance solution
According to the NFA Strategic Plan 2015 – 2020, the NFA’s financial performance in the previous Strategic plan was rated at 31.5%. The financial performance assessment reflects inadequate funding for CFRs. Out of the financial forecast for the Strategic Plan (2009 – 2014) of UGX 292.7 billion, only UGX 91.9Bn (31.3%) funding was realised. Funding was obtained from the Development partners and Non-Tax Revenue (NTR). However, due to change in priorities of the partners, grants/donor funding reduced, this forced Government to increase funding of the NFA by taking up the wage bill and introducing a Community Tree Planting Program. The 2015 – 2020 Strategic Plan was built on a similar approach as the previous strategy. Non-Tax Revenues (NTRs) are expected to generate the bulk of financial resources 55.6% while Government of Uganda support is expected to be 20.36% and donors 19.13% of the projected aggregate budget of UGX 199.12.
Out of the remaining 1.83 million ha of forest estate in Uganda, 504,391 ha (27.6%) are central forest reserves (CFRs) under the management of the National Forestry Authority (NFA). Central forest reserves are Uganda’s prime forest estate with 14.4% (73,000 ha) as forest plantations and 85.6% (431,391 ha) as natural forests. The natural forest reserves contain the country’s natural tree germ plasm, and other forest biodiversity including chimpanzees, birds and forest elephants, among others. The Forest Investment Plan (MWE 2017), the Forest Landscape Restoration (FLR) opportunities assessment and the Reduced Emissions from Deforestation and forest Degradation (REDD+) have all urged for a cessation of natural forest harvest

National Biodiversity Finance Plan 29
in CFRs in order to protect the prime forest estate. On the one hand, the urgency to protect the prime forest estate is high on the other hand, the funding for maintenance and management of the same forest estate is declining and rate at less than one-third of the required resources.
The finance solution seeks to mobilise optimal financing for conservation of biodiversity as well as shift the paradigm of raising funds for the management and maintenance of Uganda’s prime forest estate from continued reliance on wood harvest to investments in ecotourism, bio-prospecting, payments for ecosystem services and value chains for non-wood forest products.
3.7.2 Proposed Actions
1. Develop a revised business plan for management of central forest
Conduct a feasibility analysis of the proposed financing alternatives for NTR including scaling up ecotourism activities, bio-prospecting, supply of non-wood forest products and payments for ecosystem services. Technical efficiency analysis (using production function and ecosystem supply projections) and economic efficiency analysis (based on cost-benefit analysis) will be undertaken.
Undertake business planning for the feasible and viable package of ecotourism, bio-prospecting, payments for ecosystem services and PES, and value chains for non-wood forest products across the seven forest landscapes in the country (Northern Moist, Karamoja, Afro-montane, Lake Victoria Crescent, Southeast L. Kyoga Floodplains, Southwest Rangelands and the Western Mid-Altitude (MWE/NFA 2016)). Forty-seven priority CFRs were selected in preliminary planning with the NFA. The 47 CFRs represent the prioritised CFRs out of 506 CFRs in the country, and by landscape.
2. Pilot the revised business plan and review and reinforce performance
The revised business plan will be piloted for at least three years. The financial revenue plan would be used to scale up successful options to cover all the CFRs in the country. The financing plan would also offer viable financing solutions for restoration, management and maintenance of natural forests on private land.
3.7.3 Feasibility of the finance solution
The economic viability of developing a financing model for biodiversity conservation in Uganda’s central forest reserves was assessed based on financial and economic analysis of the FLR opportunities in the country (MWE and IUCN 2018). The discounted benefits per hectare show that over a nine-year timeline, investment in ecotourism, ecosystem services and the stewardship ecosystem service benefits of communities adjacent to the central forest reserve were UGX 28million/ha, equivalent to $7,633/ha (Table 15). If averaged over the project timeline the net benefits would be equivalent to UGX 3.5 million/ha/year ($954/ha/year).
Table 15: Discounted net benefits for financing model for biodiversity conservation for central forest reserves
Description of aggregates Aggregate amount in ‘000 UGX Aggregate Amount $Discounted benefits 175,394 47,404Discounted costs 147,152 39,771Discounted net benefits 28,242 7,633Benefit cost ratio 1.192

National Biodiversity Finance Plan 30
3.8 Standardize and regulate implementation of biodiversity offsets
3.8.1 Introduction
Since 2005, biodiversity offset, when the Kalagala offsets were developed as part of the Bujagali Hydro Power Plant, are increasingly used as part of environmental compliance for infrastructure projects of hydropower projects and read construction, among others. One-off offsets have been developed for several hydropower projects or power lines and now oil and gas projects in the Albertine Rift and the Albertine Graben (UETCL 2018; MEMD 2018). Biodiversity offsets are implemented to cater for residual impact of environmental compliance through environmental social impact assessment (ESIA), as part of the environmental mitigation hierarchy. Whereas the biodiversity offset, particularly one off, offsets, have gained traction for NEMA and the authority has realised that both the design and implementation of the offsets easily falls below national expectations of environmental compliance. In many cases, the biodiversity offsets are treated as additional revenue and used in administrative, operational and human resource expenditures, infrastructure developments have occurred in areas overlapping offsets leading to conflict between the Government and the agencies that funded the offset.
As part of implementing biodiversity offsets as included in the National Environment Act No. 5 of 2019, the finance solution seeks to develop clear regulations, guidelines and pilot a system of implementing biodiversity offsets that is standardised and meets the national strategic environment and natural resource management, development and conservation needs. This will streamline obligations of different actors, minimise conflict over offsets, and ensure that no net biodiversity loss occurs as part of the offsetting process.
3.8.2 Proposed Actions
1. Review strategic environmental assessments (SEA)
Conducting strategic environmental assessments (SEA) for wetlands, central forest reserves and national parks and wildlife reserves that lie within the large scale development or highly settled areas in the country. The SEA will show that the areas’ most vulnerable to land use change and environmental damage as a result of planned development. The development strategies to be considered in the SEA include; the oil and gas development, transport master plan, industrial development master plan, the Greater Kampala Metropolitan Area (GKMA) strategic plan, and the electricity generation and transmission strategic plans among others. The sea will show the biodiversity and ecosystems under risks of use change or damage and areas where future offsets can be undertaken. Critically the SEA will be able to show the mitigation hierarchy would eventually reduce the environmental impact as well as residue cost.
2. Design of biodiversity offsets and the offsetting planning and recommend offset rates for established systems earmarked for strategic investments or use
Flow Process of implementation arrangements for designing and implementing biodiversity offsets comprises of four steps. The first step is the design step. It involves estimation of the residual biodiversity loss both in qualitative, quantitative and monetary terms (Figure 6).

National Biodiversity Finance Plan 31
Figure 6: Flow process for design and implementation of biodiversity offsets in Uganda
Source: adapted from Forest Trends (2013); UETCL (2018)
The step of designing biodiversity offsets comprises specific spatial considerations, social economic factors, social-political and socio-cultural considerations. The result is an indicative offset rate for the three systems under consideration. The offset also integrates the specific features of spatial considerations, social economic factor, sociocultural and socio-political factors.
3. Pilot national park and wildlife reserves, central forest reserves and wetland offsetting and guidelines for biodiversity offsetting Wetland offset of the GKMA will be piloted in line with the government of Uganda road map on wetland restoration in the country. The offset rate developed will be piloted for the Lake Victoria Basin wetland and later wetland offset will be scaled up to wetlands already impacted and/or at risk of degradation and damage due to development activities.
Guidelines for biodiversity offset will be integrated into the plans of the different sectors (MALGs) whose activities include either management of forests, wetlands, national parks and wildlife reserves and those whose activities impact on biodiversity and ecosystems. The integration of guidelines consists of training activities and ownership which often requires developing sector specific guidelines to compliment the national guidelines.
3.8.3 Feasibility of the finance solutionThe discounted net benefits were estimated as UGX 17.8 billion equivalent to $ 4.81 million over the nine-year timeline of design and piloting standardised biodiversity offsets (Table 16). The benefit cost ratio obtained was 3.24. Therefore, the discounted benefits of the finance solution have a 224% buffer above the discounted costs. Therefore, the viability of the finance show is robust and can withstand changes moderate to medium changes in biophysical performance of the ecosystem and ecosystem services obtained.
Table 16: Discounted net benefits for standardizing and regulate implementation of biodiversity offsets
Aggregates of discounted net benefits Aggregate in UGX millions Aggregate amount $ million Discounted Net benefits 17,785 4.81Discounted total costs 25,727 6.95Discounted Net benefit 17,785 4.81Benefit-cost ratio 3.24

National Biodiversity Finance Plan 32
4. ACTION PLAN AND FINANCIAL REQUIREMENT
4.1 Governance plan and institutional arrangements
Leadership for resource mobilisation for biodiversity conservation and management in Uganda lies with the Ministry of Finance Planning and Economic Development (MFPED). In the coordination and implementation the governance of the NBFP comprises an overlap of some functions and respective leadership on implementation of restoration and maintenance actions, generation of financial resources and maintenance of a National Biodiversity Mitigation Banking system between NEMA, Ministries, Agencies and Local Governments (MALGs). NEMA, the lead regulator, coordinates implementation and manages the monitoring, reporting and verification processes (Figure 7). The instruments to be implemented are shared by the core, often with overlapping roles for the core institutions.
Figure 7: Governance framework for the NBFP
MFPED Public Sector
budget and off budgetNational
Planning Authority; and Office of prime
Minister
Donors/ development
partners
Private Sector
Civil Society Organizations
National biodiversity managers
RegulatorCommunities
and Local Governments
Accountability for implementation of the NDPII and the UGGDS is the role of the National Planning Authority (NPA). The office of the Prime Ministers monitors and determines national indicators of performance for all Government programmes, including many components of the NBFP. The outer axis comprises, funding institutions, which on their own have governance mechanism which have to be integrated into the governance system of the core institutions and the other partner institutions.
Management of public finance is conducted by the MFPED, which also the focal point for resource mobilisation, and the overall lead agency for implementing the NBFP. Donors contribute to on-budget and off budget financing, while CSOs both implement and finance the NBFP. Private sector has a role as an investor in enterprise components of biodiversity and ecosystem services use, through compliance to biodiversity management, and financial contributions through donations and/or corporate social responsibility (CSR).
The institutional arrangements change from one finance solution to another. Table 17 shows, the proposed institutional arrangements comprising the lead institutions on

National Biodiversity Finance Plan 33
Table 17: Institutional framework for implementing finance solutions
Finance solution Lead institution Financing
innovative instrumentImplementation Financial
Management MRV
Type of institution Public Private CSO Public Public
1 A national biodiversity and ecosystem index and biodiversity fiscal transfers.
NEMANFAMWEUWALGs
PSFUWSWWFIUCN
MFPEDNEMAUWANFA
NEMAUWAMWENFA
A biodiversity & ecosystem indexBiodiversity Fiscal Transfer
2. A national programme on payments for ecosystem services NEMA PSFU
ECOTRUSTIUCNWWF
Joint national PES committee NEMA, PSFU and CSO representative
NEMAECOTRUSTWWFIUCN
National Biodiversity Mitigation Banking System for public (part of NEF) UBTC for private sector and CSOs
3. Scaling up bottom-up enforcement for biodiversity and ecosystem management based on community regulatory systems and incentives model
LGsNEMA
USSIA IUCNCARE
MFPEDDLGs
MWENEMA
Biodiversity fiscal transfers
Regulatory reform based on Environment Act (2018), District ordinances & bylaws
4. Upgrading the ecotourism value chain for Ramsar sites and Kampala city and Mbarara municipality
MWEMTWA PSFU Nature
Uganda MTWA NEMA
Public – Private – Producer – Partnerships (4Ps) Community ecotourism action plan
5. Upgrading the value chain for organic agriculture, natural ingredient, cosmetics and pharmaceuticals
NEMAMAAIFMTICUEPB
UWAUSSIA
NOGAMIUCN
NEMAMAAIFMTIC
UEPBMAAIF
Subsidy for organic certification 4 Ps (for production, processing and export)
6. Rationalise and implement revised charge systems for biodiversity and ecosystem conservation and management
NEMALocal government
USSIA IUCNECOTRUST NEMA
NEMALocal Government Finance Commission (LGFC)
National biodiversity mitigation banking system Local government biodiversity fund
7. A financing model for biodiversity conservation for central forest reserves
NFALGs
UTGA (leakage)
WCSECOTRUSTWWF
NFA/MWE
NFANEMAUWADLG
Revised national forest business plan
8. Standardize and regulate implementation of biodiversity offsets
NEMAUWANFAMWE
PSFUUWAUSSIA
WCSNature UgandaEcotrust
NEMAMFPED
NEMAMWEUWANFA
National biodiversity Mitigation Banking System/NEF
4.2 Enabling conditions
4.2.1 Establishment of a National Biodiversity Mitigation Banking system
The Government will establish a National Biodiversity Mitigation Banking system. The hybrid system will have both voluntary and regulated biodiversity mitigation credits that will be used for achieving biodiversity no net loss for projects with significant impacts on biodiversity conservation. Biodiversity damaging entities will be able to offset their damage by acquiring credits from entities that have invested in biodiversity conservation, and some entities will be able to obtain public and private credits including payments for investment in biodiversity conservation. The national biodiversity mitigation banking platform will be established based on regulations and guidelines to be developed as part of the implementation of the National Environment Act 2018. The national biodiversity banking platform will provide project developers and communities to turn biodiversity into an asset instead of a liability. The biodiversity mitigation

National Biodiversity Finance Plan 34
banking system will provide an opportunity for communities, private sector and public agencies to invest in biodiversity conservation to support the biodiversity conservation mitigation requirements of project developers as part of implementation of environmental compliance.
The Government biodiversity banking platform will be managed as an additional window of the National Environment Fund. The platform will support regulated compliance actions of project developers as well as national biodiversity assets that are critically endangered as a result of public projects, particularly infrastructure development activities.
The Government will support the development of private sector biodiversity banking platform managed by selected Civil Society Organisations (CSOs) and funds. However, these private sector platforms will be regulated by Government.
Government regulation will include among others:(a) Setting and/or regulation of the price paid for mitigation banking; (b) Ensuring that critical biodiversity resources are not included in the mitigation banking platforms;(c) Protection of the rights of Government, communities, and individuals who may lose out from the
investments into biodiversity conservation by public and private agencies;(d) Fining those who damage the ecosystems (through endangered species laws, for instance) or by
paying those who conserve it (providing tax breaks or subsidies for conservation, for example);(e) Providing regulatory support for voluntary transactions set the price, e.g. voluntary biodiversity offsets.(f ) Establish sustainable thresholds of biodiversity mitigation banking and conservation or protection of
biodiversity.
4.2.2 Regulatory, institutional and policy reformsIn November 2018, the Parliament of Uganda passed a new law that will support the implementation of the NBFP. Implementation of the new law will require development of several regulations including regulations on biodiversity offsets and a national PES programme, among others. These reforms will require adjustments in institutional practice policies for biodiversity management, and institutional reforms including human resources and technical capacity enhancement to support effective implementation of the NBFP. New regulations are expected on:
a) National biodiversity and ecosystem index to inform ecological fiscal transfersb) National payments for ecosystem services programme c) bottom-up enforcement for biodiversity and ecosystem management based on community regulatory
systems and incentives modeld) charge systems for biodiversity and ecosystem conservation and managemente) implementation of biodiversity offsets
4.2.3 A public-private sector engagement platform on biodiversityThe Government through the National Planning Authority (NPA) and NEMA, NGOs such as the Wildlife Conservation Society (WCS), the International Union for Conservation of Nature (IUCN) and Nature Uganda, as well as private partners including Total ENP, and academia including Oxford University and Makerere University initiated a biodiversity platform. The NBFP will scale-up the platform to include national private sector umbrella organisations including the Private Sector Foundation Uganda (PSFU) Uganda Manufacturer’s Association (UMA), Uganda Small-scale Industries Association (USSIA) and Uganda Bankers’ Association (UBA), among others. Several other national and international NGOs will be invited to the platform including the World Wide Fund for nature (WWF), Advocates Coalition for Development and Environment (ACODE), Environment Conservation Trust (ECOTRUST) Uganda and Environmental Alert, among others.
The public-private sector engagement will create a platform for balancing minimisation of business risks such as operational risk; (ii) reputational risks; (iii) regulatory and legal risks; and (iv) financial risks related to biodiversity and ecosystems with the need to ensure optimal biodiversity conservation and management

National Biodiversity Finance Plan 35
in the country. Proposed actions will include establishment of a secretariat and a national public-private biodiversity forum. Establishment of a fund for research that can support both biodiversity management compliance and improved performance of private sector with minimal impact on biodiversity.
4.2.4 Knowledge networks for biodiversity management and conservation
The existing networks for biodiversity conservation and management information are linked through the Clearing House Mechanism (CHM), the National Biodiversity Databank, and the NBSAP and national reporting process, as well as committees for implementation of biodiversity projects. The national knowledge network needs to be strengthened largely because results of ongoing activities including research, and lessons learned from practice and policy reforms are not used. Implementation of projects on enhancing biodiversity knowledge networks showed poor coordination and many quality limitations in the knowledge available. Moreover, a lot of the knowledge generated locally is not used in development and/or implementation of projects (NEMA-CONNECT Project 2018). Knowledge networks will be developed by enhancing the capacity of the CHM to collate research and knowledge, annual outreach activities with Indigenous Peoples and Local Communities (IPLCs), and a national conference on knowledge networks for biodiversity conservation.
4.2.5 Capacity building to develop and implement feasible and viable biodiversity and ecosystem conservation management projects
To effectively develop and implement actions that can lead to sustainable biodiversity and ecosystem management, as well as tap into the finance solutions proposed capacity is needed in areas of impact assessment and feasibility/viability assessment, appropriate and adequate capacity is needed. The proposed capacity building will be undertaken as a sub-component for implementation of all the developed finance solutions. The stakeholders targeted for training will be based on the stakeholder categories in the NBSAPII.
4.3 Resource mobilisation strategy for implementation of the plan
The resource mobilisation strategy is summarised in Table 18 below. The financial requirements for developing the finance solution are generally the lowest of the three costs which also include piloting and scaling up the finance solutions. The resource mobilisation strategy proposed four main sources of financing, support from donors and government through grants and/or budgetary and non-budget support, own revenue mobilised from non-tax revenues, revenues mobilised for biodiversity conservation and stored in the different biodiversity funds, particularly the National Biodiversity Mitigation Banking System that will be integrated as window of the National Environment Fund (NEF) in NEMA. Private sector will provide finance through investments under the innovative public-private-producer partnership (4Ps) (IFAD/MAAIF 2017). The 4 Ps innovation emerged because many times, the Indigenous Peoples and Local Communities (IPLCs) continue to have a stewardship and ecosystem services access to biodiversity. There is a risk that a public-private partnership may push local stewards out of the biodiversity and ecosystems as they are not part of the memorandums of understanding. Under 4 Ps the IPLCs are part and parcel of the sustainable development and use of biodiversity to mobilise additional financing for biodiversity management.
The largest financial requirement will be towards scaling up of the financing solutions. At least six out of the eight finance solutions will generate their own revenue either as NTR or funds kept in a fund. Therefore, in the long-term the finance solutions will be able to set aside funds for maintaining the operations of the finale solutions, in addition to continue to mobilise funds from biodiversity fiscals, donor support and international biodiversity conservation and management funds, among others.
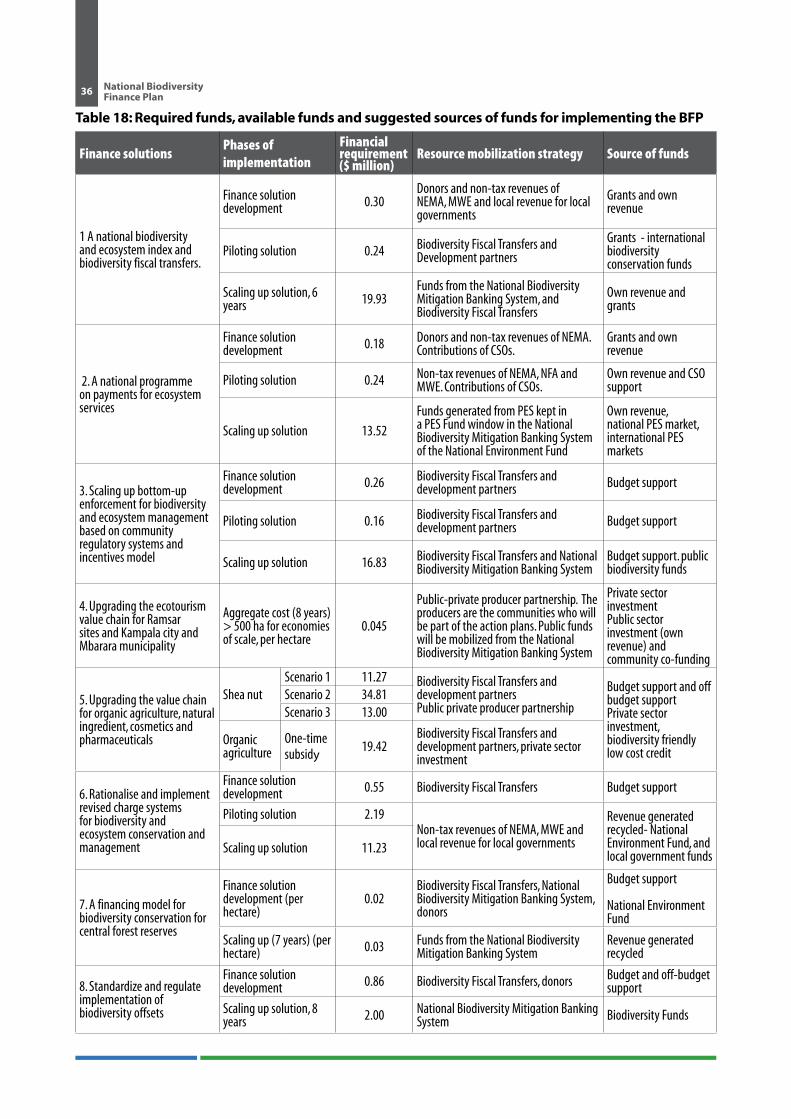
National Biodiversity Finance Plan 36
Table 18: Required funds, available funds and suggested sources of funds for implementing the BFP
Finance solutions Phases of implementation
Financial requirement ($ million)
Resource mobilization strategy Source of funds
1 A national biodiversity and ecosystem index and biodiversity fiscal transfers.
Finance solution development 0.30
Donors and non-tax revenues of NEMA, MWE and local revenue for local governments
Grants and own revenue
Piloting solution 0.24 Biodiversity Fiscal Transfers and Development partners
Grants - international biodiversity conservation funds
Scaling up solution, 6 years 19.93
Funds from the National Biodiversity Mitigation Banking System, and Biodiversity Fiscal Transfers
Own revenue and grants
2. A national programme on payments for ecosystem services
Finance solution development 0.18 Donors and non-tax revenues of NEMA.
Contributions of CSOs.Grants and own revenue
Piloting solution 0.24 Non-tax revenues of NEMA, NFA and MWE. Contributions of CSOs.
Own revenue and CSO support
Scaling up solution 13.52
Funds generated from PES kept in a PES Fund window in the National Biodiversity Mitigation Banking System of the National Environment Fund
Own revenue, national PES market, international PES markets
3. Scaling up bottom-up enforcement for biodiversity and ecosystem management based on community regulatory systems and incentives model
Finance solution development 0.26 Biodiversity Fiscal Transfers and
development partners Budget support
Piloting solution 0.16 Biodiversity Fiscal Transfers and development partners Budget support
Scaling up solution 16.83 Biodiversity Fiscal Transfers and National Biodiversity Mitigation Banking System
Budget support. public biodiversity funds
4. Upgrading the ecotourism value chain for Ramsar sites and Kampala city and Mbarara municipality
Aggregate cost (8 years) > 500 ha for economies of scale, per hectare
0.045
Public-private producer partnership. The producers are the communities who will be part of the action plans. Public funds will be mobilized from the National Biodiversity Mitigation Banking System
Private sector investmentPublic sector investment (own revenue) and community co-funding
5. Upgrading the value chain for organic agriculture, natural ingredient, cosmetics and pharmaceuticals
Shea nutScenario 1 11.27 Biodiversity Fiscal Transfers and
development partnersPublic private producer partnership
Budget support and off budget support Private sector investment,biodiversity friendly low cost credit
Scenario 2 34.81Scenario 3 13.00
Organic agriculture
One-time subsidy
19.42Biodiversity Fiscal Transfers and development partners, private sector investment
6. Rationalise and implement revised charge systems for biodiversity and ecosystem conservation and management
Finance solution development 0.55 Biodiversity Fiscal Transfers Budget support
Piloting solution 2.19Non-tax revenues of NEMA, MWE and local revenue for local governments
Revenue generated recycled- National Environment Fund, and local government funds
Scaling up solution 11.23
7. A financing model for biodiversity conservation for central forest reserves
Finance solution development (per hectare)
0.02Biodiversity Fiscal Transfers, National Biodiversity Mitigation Banking System, donors
Budget support
National Environment Fund
Scaling up (7 years) (per hectare) 0.03 Funds from the National Biodiversity
Mitigation Banking SystemRevenue generated recycled
8. Standardize and regulate implementation of biodiversity offsets
Finance solution development 0.86 Biodiversity Fiscal Transfers, donors Budget and off-budget
support
Scaling up solution, 8 years 2.00 National Biodiversity Mitigation Banking
System Biodiversity Funds

National Biodiversity Finance Plan 37
4.4 Work plan for implementing the NBFP
The finance plan will be implemented over the 2019/20 to 2027/28 timeline. The eight finance solutions will be implemented concurrently (Table 20). The development phase of the finance solution is expected to take one to two years, while a one to two-year pilot phase is envisaged. The remaining part of the timeline between six to eight years will be for scaling up the finance solution.
Table 19: Finance solutions, outputs/actions, responsibility and timeline
Finance solution Phase of implementing 2019/20 2020/21 2021/22 2022/23 2023/24 2024/25 2025/26 2026/27 2027/28
1 A national biodiversity and ecosystem index and biodiversity fiscal transfers.
Finance solution development
Piloting solution
Scaling up solution, 6 years
2. A national programme on payments for ecosystem services
Finance solution development
Piloting solution
Scaling up solution
3. Scaling up bottom-up enforcement for biodiversity and ecosystem management based on community regulatory systems and incentives model
Finance solution development
Piloting solution
Scaling up solution
4. Upgrading the ecotourism value chain for Ramsar sites and Kampala city and Mbarara municipality
Aggregate cost/ha (8 years) > 500 ha for economies of scale
Finance solution development
Implementing solution
5. Upgrading the value chain for organic agriculture, natural ingredient, cosmetics and pharmaceuticals
Shea nut
Scenario 1
Scenario 2
Scenario 3
Organic agriculture
One-time subsidy
6. Rationalise and implement revised charge systems for biodiversity and ecosystem conservation and management
Finance solution development
Piloting solution
Scaling up solution
7. A financing model for biodiversity conservation for central forest reserves
Finance solution development
Scaling up (7 years)
8. Standardize and regulate implementation of biodiversity offsets
Finance solution development
Scaling up solution, 8 years
National Biodiversity Finance Plan 38
REFERENCES
Emerton, L. and E. Muramira. 1999. Uganda Biodiversity: Economic Assessment. IUCN – The World Conservation Union. Nairobi, Kenya. 52pp.
Francis W.N. Nsubuga, O.J. Botai, Jane M. Olwoch, C.J. deW Rautenbach, Yvette Bevis & Adebayo O. Adetunji (2014) The nature of rainfall in the main drainage sub-basins of Uganda, Hydrological Sciences Journal, 59:2, 278-299, DOI: 10.1080/02626667.2013.804188
GoU (2010) Uganda Vision 2040, National Planning Authority of the Government of Uganda, Kampala. Available at http://www.npa.ug
GOU (2015) Uganda National Development Plan II (2015/16 – 2019/20), National Planning Authority of the Government of Uganda, Kampala. Available at http://www.npa.ug
GoU (2017) Uganda Green Growth Development Strategy, National Planning Authority of the Government of Uganda, Kampala. Available at http://www.npa.ug
GoU 2016 Uganda Wetland Atlas, Ministry of Water and Environment Kampala, available at http://www.mwe.go.ug
Kakuru, W., Turyahabwe, N. and Mugisha, J. (2013) Total Economic Value of Wetlands Products and Services in Uganda. The Scientific World Journal 2013(192656): 13 pages
Lwasa, S. 2006. Informal land markets and residential housing development: processes and Implications for Planning in Kampala. PhD, Makerere.
Moyini, Y. and T. E. Muramira (2001). The Costs of Environmental Degradation and Loss to Uganda’s Economy with Particular Reference to Poverty Eradication. IUCN-The World Conservation Union. 60pp.
MWE (2016) Strategic Plan and Bankable Project for Catchment Management for the Inner Murchison Bay in the Greater Kampala Metropolitan Area, Ministry of Water and Environment, Directorate of Water Resources Management, Entebbe
MWE/JSR (2017) Water and Environment Sector Joint Sector Review Meeting Report, Ministry of Water and Environment Kampala, available at http://www.mwe.go.ug
MWE/SPR (2016) Ministry of Water and Environment Sector Performance Report 2016, Ministry of Water and Environment Kampala, available at http://www.mwe.go.ug
NEMA (2011) The Contribution of Forestry Resources to Uganda’s Economy: A Natural Resource Accounting Approach, National Environment Management Authority, Kampala, Available at http://www.nemaug.org
NEMA (2016) Guidelines and Action Plan for Financing Biodiversity Management in Uganda, National Environment Management Authority, Kampala, Available at http://www.nemaug.org
NEMA, UNDP and BIOFIN Global (2017) Biodiversity Policy and Institutional Review for Uganda, National Environment Management Authority, Kampala, Available at http://www.biofin.net
NEMA, UNDP and BIOFIN Global (2018) Biodiversity Expenditure Review for Uganda, National Environment Management Authority, Kampala, Available at http://www.biofin.net
Crawford, A., Disney K. and Harris, M. 2015 UGANDA: Assessment of implementation readiness, Supporting Implementation of the Mining Policy Framework in Member States of the Intergovernmental Forum on Mining, Minerals, Metals and Sustainable Development, International Institute for Sustainable Development, Manitoba http://www.iisd.org
UBOS 2014 Uganda National Statistical Abstract, Uganda Bureau of Statistics, Kampala. Available at http://www.ubos.org
Tumushabe, G., Ruhweza, A., Masiga, M and Naturinda, B. (2008) Integrated Assessment of the National Organic Agriculture Policy, Advocates Coalition for Development and the Environment (ACODE), Kampala, Uganda
World Bank (2012) Uganda Country Water Resources Assistance Strategy: Technical Study Water Resources Economics, World Bank Country Office, Kampala

National Biodiversity Finance Plan 39
ANNEXES
ANNEX I: Process of developing the finance solutions and their appropriateness
The finance solutions were developed through consultative, synthesis and prioritization process with feedback from policy processors and stakeholder consultations. The policy and institutional review provided an indication of the key drivers of biodiversity management and degradation in the country, the policy and practice and details on existing finance mechanisms for biodiversity management in the country. Through a review of the current financing mechanisms and policy and practice of biodiversity management, key issues emerged on the priorities for biodiversity management, and on the financing mechanisms which had the highest potential for enhancing biodiversity management finance in the country. The biodiversity expenditure review showed the difficult associated with conducting an expenditure review in the country. An expenditure review was conducted for the public component of four sectors; agriculture, water and environment, energy and mineral development and tourism, wildlife and antiquities. The finance needs assessment built on the activities of the expenditure review, and established public finance needs for the four key sectors as well as the financial requirements for implementation of Uganda’s NBSAP II.
Prioritization of the finance needs was arrived at through a three step process. In the first step all the potential financing mechanisms to address the biodiversity management challenges were listed based on the policy and institutional review and suggestions from stakeholder engagement. A long list of 50 finance solutions was obtained from which a short list of 17 finance solution was used to produce an early draft finance plan. The early draft finance was review by both the national and global BIOFIN teams, and discussed through key informant discussions with BIOFIN technical steering committee, Joint Sector Review of the Water and Environment sector, the top management of the Ministry of Water and Environment. Additional consultations were made with the senior and top management of the National Environment Management Authority (NEMA), and the Project Board meetings hosted by UNDP Country Office. The consultations and prioritization processes led to the final 8 finance solutions.

National Biodiversity Finance Plan 40
ANNEX II: Viability assessment for finance solution on developing and implementing biodiversity and ecosystem index and transfers
Cost of developing and implementing biodiversity and ecosystem index and transfers
Costable Action Unit cost (mill. UGX)
Amount million UGX/Yr.2019/20 2020/21 2021/22 2022/23 2023/24 2024/25 2025/26 2026/27 2027/28
Develop Index
Natural capital accounting External support contract + 25% admin. cost
150 150 300
Specification of restoration target, Consultation costs 37.5 37.5
Specification of sustainable use targets, Consultation costs 37.5 37.5
Determine Responses For Biodiversity And Ecosystem Management
Complete supply use table, External support contract + 25% admin. cost
93.75 93.75 187.5
Allocation of responsibility for restoration actions, Consultation costs
37.5 37.5
Allocation of responsibility for sustainable action, Consultation costs
37.5 37.5
Develop EFT Guidelines
Developing and testing of EFT Guidelines, External support contract + 25% admin. cost
75
Pilot EFT guidelines and restoration and sustainable use of biodiversity and ecosystems
Restoration costs for forestry (5 districts 400 ha/district)- 5, 10, 20, 30,40,50,60,70, External contract 100ha/District
1.25 625 2,500 5,000 7,500 10,000 12,500 15,000
Restoration and/ or sustainable use cost for wetlands (40.29ha/district, External contract 40.29ha/District
1.25 251.83 1,007 2,015 3,022 4,0295 5,0365 6,044
Total 394 713 877 3,507 7,015 10,522 14,029 17,536 21,044
Discounted total 394 642 712 2,564 4,621 6,244 7,500 8,446 9,131
Source: adapted from MWE and IUCN (2018)

National Biodiversity Finance Plan 41
Benefit of developing and implementing biodiversity and ecosystem index and transfers
Benefits Description of effort
Gross ecosystem services UGX million/ha
Amount in UGX millions
2019/20 2020/21 2021/22 2022/23 2023/24 2024/25 2025/26 2026/27 2027/28
Forests on private land: Restoration and Avoided deforestation/degradation (districts 100 ha/district)- 5, 10, 20, 30,40,50,60,70)
THFs (24.5%) of natural forest = 24.5ha/ District/yr
1.8275 894 3,180 7,154 10,731 14,308 17,885 21,462
Woodlands (78.5%) of natural forest, 75.5 ha/ District/ yr
0.54875 829 3,314 53,031 9,943 13,258 132,578 19,887
Wetlands Restoration and sustainable use (districts 80.58 ha/district)- 5, 10, 20, 30,40,50,60,70
Permanent wetlands 7.0675 2,848 11,390 22,780 34,170 45,526 227,800 68,340
Total - - 4,570 17,884 82,965 54,844 73,092 378,263 109,689
Discounted total - - 4,117 14,515 60,663 36,128 43,376 202,235 52,832
Source: adapted from MWE and IUCN (2018)
ANNEX III: Viability assessment for finance solution on national payments for ecosystem services programme
Cost cycle for national payments for ecosystem services programme
Costable Action Effort Amount (UGX millions)
2019/20 2020/21 2021/22 2022/23 2023/24 2024/25 2025/26 2026/27 2027/28
Regulatory system
PES regulation 1 187.5
PES guidelines 1 93.75
Capacity building and awareness creation
Train regulators, DLGs, agencies communities, 1/yr 375
Engagements with private sector, public sector
Disseminate information, refine operational manualsContractual instruments
1/yr 93.75
Pilot a national PES programme
Biodiversity of forest protected trees - THFs 98ha/ District/yr, Cost of management products
0 500 1,000 2,000 3,000 4,000 5,000 6,000 7,000
Watershed payments, 80.58 ha/district 1/sub catchment 0 100.7 201.45 402.9 604.35 805.80 10,072.50 1,208.70 1,395.75
Agro-biodiversity and mountain landscape 200ha/ District/year
3 districts /yr 0 210 420 630 840 1,050 1,260 1,470 1,680
Total 656 904 1,621 3,033 4,444 5,856 16,333 8,679 10,076
Discounted total 656 815 1,316 2,218 2,928 3,475 8,732 4,180 4,372

National Biodiversity Finance Plan 42
Benefit cycle for National payments for ecosystem services programme
CategoryRevenue/Ha (UGX million/ha)
Area (ha)
Amount (UGX millions)
2019/20 2020/21 2021/22 2022/23 2023/24 2024/25 2025/26 2026/27 2027/28Biodiversity of forest protected trees
UGX 4.2m/ha/year 98 412 617 823 1,029 1,235 1,441 1,646
Watershed payments
UGX 24.2m/ha/year 80.58 0 0 2,058 8,232 16,464 24,696 32,928 41,160 49,392
Agro-biodiversity and mountain landscape
UGX 1.07m/ha/year 200 0 0 6,769 27,075 54,150 81,225 108,300 135,374 162,449
Total - - 9,238 35,924 71,437 106,950 142,462 177,975 213,488Discounted total - - 7,498 26,268 47,058 63,469 76,166 85,723 92,638
ANNEX IV: Viability assessment for finance solution on bottom-up enforcement and compliance for biodiversity and ecosystem conservation and management
Cost cycle for bottom-up enforcement and compliance for biodiversity and ecosystem conservation and management
Costable Action District unit cost ($)
Amount in UGX million2019/20 2020/21 2021/22 2022/23 2023/24 2024/25 2025/26 2026/27 2027/28
Rationalize and refine bottom-up system for environmental enforcement and compliance
Feasibility assessment and design the most feasible bottom-up systems of the institutional External contract/ consultancy contracts, and administrative, supervision costs. 4 national catchments 7 forest management zones7 wetland basins
$75,000 843.75
Create incentives
Develop guidelines for biodiversity and ecosystem stewardship
$ 30,000 112.50
Develop and sign relevant agreements, agreements and MOUs between communities and DLGs and/or MDAs specifying objectives
2,000 0.0 37.5 150 300 450 600 750 900 1050
Scaling up the enforcement and compliance system and incentives
Scale up enforcement and compliance system: Training & Equipment costs
$5,000
$10,0000.00 56.25 225.0 450.00 675 900 1,125 1350 1575
Scale-up incentives (commercial office/Natural resource): Funds for revolving funds & Support for DLGs
96,000,000 480 1920 3840 5760 7680 9600 11520 13440
Total 956 574 2,295 4,590 6,885 9,180 11,475 13,770 16,065Discounted total 956 517 1,863 3,356 4,535 5,448 6,135 6,632 6,971
NB; scale up 1-5; 2-20; 3-40; 4-60; 5-80; 6-100; 7-120; 8-140

National Biodiversity Finance Plan 43
Benefits cycle for bottom-up enforcement and compliance for biodiversity and ecosystem conservation and management
Type of Revenue Area/ha/District Amount in UGX million
2019/20 2020/21 2021/22 2022/23 2023/24 2024/25 2025/26 2026/27 2027/28
Forest resources
Revenue from natural forests (THF), 25% of ecosystem services, revenue/Ha - 3,654,574
98 ha 0.00 0.00 269 1,074 2,149 3,223 4,298 5,372 6,447
Natural forest-woodlands, 25% of ecosystem services, revenue/Ha - 1,754196
302 0.00 0.00 265 1,060 2,119 3,179 4,238.14 5,298 6,357
Wetland resources/ catchments
Avoided cost of wetland degradation, 25% of ecosystem services, revenue/Ha - 11,308,210
80.58 0.00 0.00 1,139 4,556 9,112 13,668 18,224.32 22,780.4 27,336
Total - - 1,673 6,690 13,380 20,070 26,760 33,450 40,140Discounted total - - 1,358 4,892 8,814 11,911 14,307 16,112 17,418
THF – 3, 12, 24, 36, 48, 60, 72, 84; Woodlands – 2, 8, 16, 24, 32, 40, 48, 56; wetlands scale up
ANNEX V: Viability assessment for finance solution on rationalising and implementing revised charge systems for biodiversity and ecosystem conservation and management
Cost cycle for rationalising and implementing revised charge systems for biodiversity and ecosystem conservation and management
Action Costable Action
Unit cost ($/instr.)
Amount in ‘000 $2019/20 2020/21 2021/22 2022/23 2023/24 2024/25 2025/26 2026/27 2027/28
Technical Assessments (5 instruments/ charge systems)
Establish cost recovery, the value of biodiversity and ecosystem services.
50,000 125 125
Participatory and technical assessment including sociopolitical considerations
Stakeholder consultations at community and political levels
30,000 150
Design of fees schedule, rationalizing appropriate fees
Design revised schedules, fees structure, instruments and guidance.
30,000 150
Implementation costs (30% of revenue raised), rest in biodiversity fund
Awareness creation among stakeholders, and set up of payments and monitoring system with banks
25,000 2,188 2,188 2,188 2,260 2,260 2,260 2,260
Total costs 125 425 2,188 2,188 2,188 2,260 2,260 2,260 2,260
Disc. costs 125 386 1,808 1,644 1,494 1,403 1,275 1,160 1,054

National Biodiversity Finance Plan 44
Benefit cycle for rationalising and implementing revised charge systems for biodiversity and ecosystem conservation and management
Categories of instruments
Current amount estimate
Amount in ‘000$
2019/20 2020/21 2021/22 2022/23 2023/24 2024/25 2025/26 2026/27 2027/28
National Environment (Access to Genetic Resources and Benefit Sharing) Regulations 2005
$120 per permit, for 200 people per year increasing to 400 after first three pilot years for National Parks, Central Forest Reserves, Wildlife Reserves, Community Wildlife Reserves
240 240 240 480 480 480 480
The National Environment (Wetlands, River Banks and Lake Shores Management) Regulations, No. 3/2000
Average charges and fines $50 for at least 8000 people. Based on the developments considered under voluntary audit records
160 160 160 160 160 160 160
Local Government Act Cap 243 (1997), Sustainable wetland management charge system
200 DLGs, average UGX 2.5million, average 10 licenses/year
1,351 1,351 1,351 1,351 1,351 1,351 1,351
Local Government Act Cap 243 (1997), Sustainable forest management charge system
200 DLGs, average UGX 5million, average 15 licenses/year
4,054 4,054 4,054 4,054 4,054 4,054 4,054
Local Government Act Cap 243 (1997), Sustainable environmental management charge system
220 DLGs, average UGX 0.5million, average 50 clients/year
1,486 1,486 1,486 1,486 1,486 1,486 1,486
Total - - 7,292 7,292 7,292 7,532 7,532 7,532 7,532
Disc. Benefits - - 6,026 5,479 4,980 4,677 4,252 3,865 3,514
Disc. net benefits -125 -386 4,218 3,835 3,486 3,274 2,976 2,706 2,460

National Biodiversity Finance Plan 45
ANNEX VI: Viability assessment for finance solution on model for biodiversity conservation for central forest reserves
Benefit and cost cycle for financing model for biodiversity conservation for central forest reserves
Description of cost and benefit categories
Amounts in UGX ’0002019/20 2020/21 2021/22 2022/23 2023/24 2024/25 2025/26 2026/27 2027/28
Enrichment planting and restoration per haBenefits
Carbon payments 439 439 439 439 439 439 439 439
Sub-total 439 439 439 439 439 439 439 439
Discounted benefits 395 356 321 289 260 235 211 190
Costs
Land rent 50 50 50 50 50 50 50 50 50
Field maintenance 1,120 1,120 180 180 180 180 180 180 180
sub-total 1,170 1,170 230 230 230 230 230 230 230
discounted costs 1,170 1,054 187 168 152 136 123 111 100
EcotourismBenefits
Nature walks 9,000 9,000 9,000 9,000 9,000 9,000 9,000 9,000
Bird watching Game viewing 9,000 9,000 9,000 9,000 9,000 9,000 9,000 9,000
Picnicking and parties 15,000 15,000 15,000 15,000 15,000 15,000 15,000 15,000
Sub-total 0 33,000 33,000 33,000 33,000 33,000 33,000 33,000 33,000
Disc. benefits - 29,730 26,784 24,129 21,738 19,584 17,643 15,895 14,320
Cash outflowConducting feasibility studies 8,000
Marketing costs 400 400 400 400 400 400 400 400 400
Establish of recreational facilities 36,600
Ecotourism activities 20,000
Recreation maintenance costs 12,000 12,000 12,000 12,000 12,000 12,000 12,000 12,000 12,000
Sub-total 77,000 12,400 12,400 12,400 12,400 12,400 12,400,000 12,400 12,400
Discounted costs 77,000 11,171 10,064 9,067 8,168 7,359 6,629,546 5,973 5,381
Implement collaborative forest management initiativesBenefits
Wood fuel - 30 clusters/week @ cluster @ 5000/50 ha
144 144 144 144 144 144 144 144
Honey production 0 hives @ha/ 10 kg/year/hive@ kg – 5000 500 500 500 500 500 500 500 500
Sub-total 0 644 644 644 644 644 644 644 644
Discounted benefits - 580 523 471 424 382 344 310 279
Costs
Agree on MOU 20
Establishment of buffer forest 1,120
Establish and facilitate forest stewardship committees 20 20 20 20 20 20 20 20 20
Annual operational costs 96 96 96 96 96 96 96 96 96
Sub-total 1,616 296 296 296 296 296 296 296 296
Discounted costs 1,616 267 240 216 195 176 158 143 128
Aggregate disc. benefits 0 30,705 27,662 24,921 22,451 20,226 18,222 16,416 14,789
Aggregate disc. costs 79,786 12,492 10,491 9,451 8,515 7,671 6,910 6,226 5,609

National Biodiversity Finance Plan 46
ANNEX VII: Viability assessment for finance solution on standardizing and regulate implementation of biodiversity offsets
Cost cycle for standardizing and regulate implementation of biodiversity offsets
Costs
Indicator rate $/ha
Number per year offset activities per year
Amount in $
2019/20 2020/21 2021/22 2022/23 2023/24 2024/25 2025/26 2026/27 2027/28
Review strategic environmental assessments (SEA
$150,000 3 450,000
Design of biodiversity offsets and the offsetting planning and recommend offset rates for established systems earmarked for strategic investments or use
40,000 4 160,000
Pilot national park and wildlife reserves, central forest reserves and wetland offsetting and guidelines for biodiversity offsetting
5,000 50 250,000 250,000 250,000 250,000 250,000 250,000 250,000 250,000 250,000
Total 860,000 250,000 250,000 250,000 250,000 250,000 250,000 250,000 250,000
Discounted total 860,000 225,225 202,906 182,799 164,683 148,363 133,660 120,415 108,482
Benefit cycle for standardizing and regulate implementation of biodiversity offsets
Description of benefits
Indicator rate $/ha
Number per year offset activities per year
Revenue saved for biodiversity banking (30%)
Amount in ‘000$
2019/20 2020/21 2021/22 2022/23 2023/24 2024/25 2025/26 2026/27 2027/28
National park and wildlife reserve offsets
16,647.44 10 49,942.32 50 50 100 150 200 250 300 350 400
Wetland offsets 28,649 25 214,868 215 215 430 645 859 1,074 1,289 1,504 1,719
Forest reserve offsets
13,457 15 60,556.50 61 61 121 182 242 303 363 424 484
Total 325 325 651 976 1,301 1,627 1,952 2,278 2,603
Discounted total 325 293 528 714 857 965 1,044 1,097 1,129

National Biodiversity Finance Plan 47
Annex VIII: The Technical Steering Committee for the BIOFIN project
No. Institution Name Designation Task Email Cellphone number
1National Environment Management Authority
Sabino Francis OgwalNatural Resource Manager- Biodiversity & Rangeland/National Project Coordinator
Chairperson [email protected]/[email protected] +256 772 517045
2United Nations Development Program
Daniel Mcmondo Omodo
Program Analyst – Energy and Environment
Deputy Chairperson
[email protected]+256 772 439928/772 289140
3National Environment Management Authority
Monique AkulloSenior Internal Monitoring and Evaluation officer & BIOFIN – Project Management Officer
Secretary [email protected]/[email protected]
+256 772 837935/754837935
4National Environment Management Authority
Moses MasigaBIOFIN - Biodiversity/ Environmental Economics National Expert
Member [email protected] +256 772 563919
5National Environment Management Authority
Fred Muwanika Roland BIOFIN - Private Finance /Business National Expert Member [email protected] +256 779 604453
6National Environment Management Authority
Francis Mwaura BIOFIN - Private Finance /Business National Expert Member [email protected] +254 734 513259
7 Ministry of Water and Environment Nathan Mununuzi Senior Environment Officer Member [email protected]
+256 759 644936/772 841 843
8 Ministry of Energy and Mineral Development
Godfrey NdawulaAssistant Commissioner New and Renewable Source of Energy
Member [email protected] +256 772 439144
8(a) Caroline Aguti Senior Environment Officer Member [email protected]/ [email protected] +256 772 619300
9Ministry of Local Government
Paul Bogere (RIP) Commissioner, Local Councils Development Member [email protected] +0392 943390
9(a) Atim Joel Senior Environment Inspector Member [email protected] + 256 772408873
10National Planning Authority
Aaron Werikhe Research officer Member [email protected]/[email protected] +256 774 693761
11 Uganda Wildlife Authority Aggrey Rwetsiba Senior Monitoring and
Research Coordinator Member [email protected] +256 772 499735
12Ministry of Finance, Planning and Economic Development
David OkwiiSenior Economist Member [email protected] +256 789 417282
12 (a)Ministry of Finance, Planning and Economic Development
Vivian Tumwebaze Senior Economist Member [email protected] +256 775 765775
12 (b)Ministry of Finance, Planning and Economic Development
Moses Ssonko Senior Economist Member [email protected] +256772 645293
13Ministry of Agriculture, Animal Industry and Fisheries
Moses Kasigwa Principal Economist Member [email protected] +256 773 402300

National Biodiversity Finance Plan 48
14Ministry of Wildlife, Tourism and Antiquities
Dr. Akankwasah Barirega
Ag. A/Commissioner Wildlife Conservation Member [email protected] +256 755079000
15 National Forestry Authority Denis Mutaryebwa Plant Development Specialist Member [email protected] +256 772 544033
15(a) National Forestry Authority Aldous Obedmoth Plant Development Specialist Member [email protected] +256 772656234
16 Uganda Bureau of Statistics Emmanuel Menyha Senior Statistician-
Environment Statistics Member [email protected]/[email protected]
+256 711706094/772 889554
17National Environment Management Authority
Fred Onyai Internal Monitoring and Evaluation Manager
Member [email protected] +256 772 517303
18National Environment Management Authority
Allan Kasagga Director Finance and Administration Member [email protected] +256 772 489997
19National Environment Management Authority
Martin Wamwaya Liaison Officer -ISO Member [email protected] +256 772 590522
20National Environment Management Authority
Eunice Asinguza Senior Legal Counsel Member [email protected] +256 782 301142
21National Environment Management Authority
Naomi Karekaho Corporate Communications Manager Member [email protected] +256 772 513337
22National Environment Management Authority
Bob Nuwagira Senior Information, Education & Communication officer Member [email protected] +256 782 940384
23National Environment Management Authority
George Lubega Natural Resources Manager (Aquatics) Member [email protected] +256 772 615222
24National Environment Management Authority
James Elungat Internal Audit Manager Member [email protected] +256 772 537494
25National Environment Management Authority
Dr. Evelyn Lutalo Senior District Support Officer Member [email protected] +256 772 652728
26National Environment Management Authority
Elizabeth Mutayanjulwa Environmental Education Materials Production officer
Member [email protected] +256 772 411245


National Biodiversity Finance Plan 50
National Environment Management AuthorityPlot, 17/19/21 Jinja Road, Kampala, UgandaP.O Box 22255 www.nema.go.ug
United Nations Development ProgrammePlot 11 Yusuf Lule, Kampala, UgandaP. O Box 7184www.undp.org