National Bank of Oman SAOG 1 2011.pdf · PROFIT BEFORE TAX 8,937 6,921 ... National Bank of Oman...
23
PO Box 751 PC 112 Ruwi Sultanate of Oman. National Bank of Oman SAOG INTERIM CONDENSED FINANCIAL STATEMENTS 31 March 2011 (UNAUDITED)
Transcript of National Bank of Oman SAOG 1 2011.pdf · PROFIT BEFORE TAX 8,937 6,921 ... National Bank of Oman...
PO Box 751 PC 112 Ruwi Sultanate of Oman.
National Bank of Oman SAOG
INTERIM CONDENSED FINANCIAL STATEMENTS
31 March 2011 (UNAUDITED)
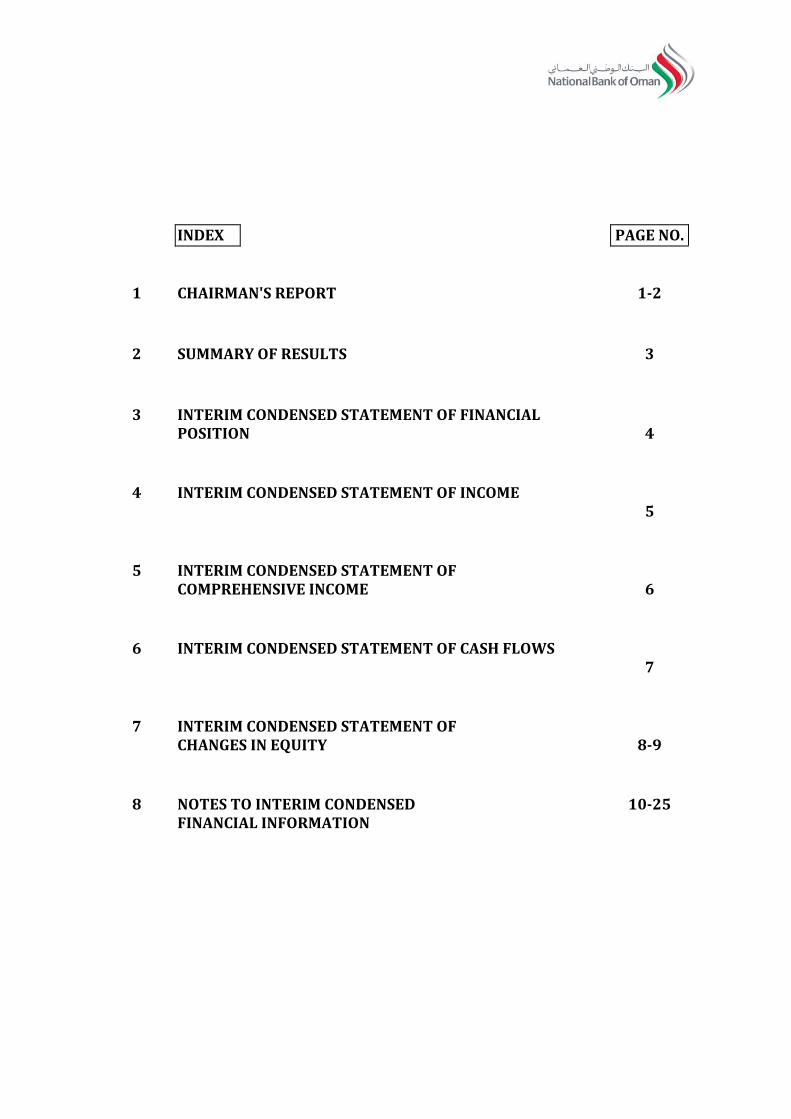
INDEX PAGE NO.
1 CHAIRMAN'S REPORT 1-2
2 SUMMARY OF RESULTS 3
3 INTERIM CONDENSED STATEMENT OF FINANCIAL POSITION
4
4 INTERIM CONDENSED STATEMENT OF INCOME 5
5 INTERIM CONDENSED STATEMENT OF COMPREHENSIVE INCOME
6
6 INTERIM CONDENSED STATEMENT OF CASH FLOWS 7
7 INTERIM CONDENSED STATEMENT OF CHANGES IN EQUITY
8-9
8 NOTES TO INTERIM CONDENSED FINANCIAL INFORMATION
10-25
SUMMARY OF RESULTS
Particulars 3 months 3 months
ended ended
31/03/2011 31/03/2010
(All RO ‘000 unless stated otherwise)
Loans and advances to customers (net) 1,414,831 1,380,101
Customers’ deposits 1,355,097 1,372,873
Other assets 59,079 40,781
Net interest income 13,381 13,678
Profit before tax 8,937 6,921
Earnings per share-annualized (RO) 0.029 0.025
Net assets per share (RO) 0.236 0.226
- 4 -
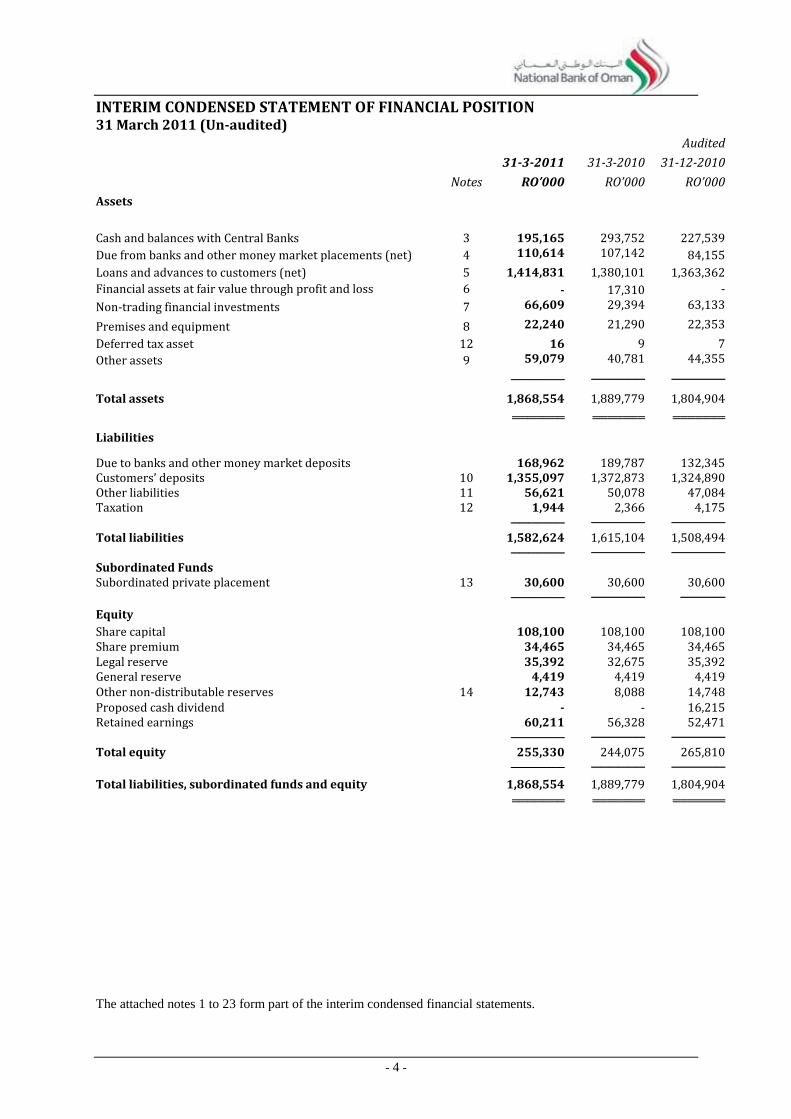
INTERIM CONDENSED STATEMENT OF FINANCIAL POSITION 31 March 2011 (Un-audited)
Audited
31-3-2011 31-3-2010 31-12-2010
Notes RO’000 RO’000 RO’000
Assets
Cash and balances with Central Banks 3 195,165 293,752 227,539
Due from banks and other money market placements (net) 4 110,614 107,142 84,155
Loans and advances to customers (net) 5 1,414,831 1,380,101 1,363,362
Financial assets at fair value through profit and loss 6 - 17,310 -
Non-trading financial investments 7 66,609 29,394 63,133
Premises and equipment 8 22,240 21,290 22,353
Deferred tax asset 12 16 9 7
Other assets 9 59,079 40,781 44,355
────── ────── ──────
Total assets
1,868,554 1,889,779 1,804,904
═══════ ═══════ ═══════
Liabilities
Due to banks and other money market deposits
168,962 189,787 132,345 Customers’ deposits 10 1,355,097 1,372,873 1,324,890 Other liabilities 11 56,621 50,078 47,084 Taxation 12 1,944 2,366 4,175
────── ────── ──────
Total liabilities
1,582,624 1,615,104 1,508,494
────── ────── ──────
Subordinated Funds
Subordinated private placement 13 30,600 30,600 30,600
────── ────── ─────
Equity
Share capital
108,100 108,100 108,100 Share premium
34,465 34,465 34,465
Legal reserve
35,392 32,675 35,392 General reserve
4,419 4,419 4,419
Other non-distributable reserves 14 12,743 8,088 14,748 Proposed cash dividend
- - 16,215
Retained earnings
60,211 56,328 52,471
────── ────── ──────
Total equity
255,330 244,075 265,810
────── ────── ──────
Total liabilities, subordinated funds and equity
1,868,554 1,889,779 1,804,904
═══════ ═══════ ═══════
The attached notes 1 to 23 form part of the interim condensed financial statements.
- 5 -
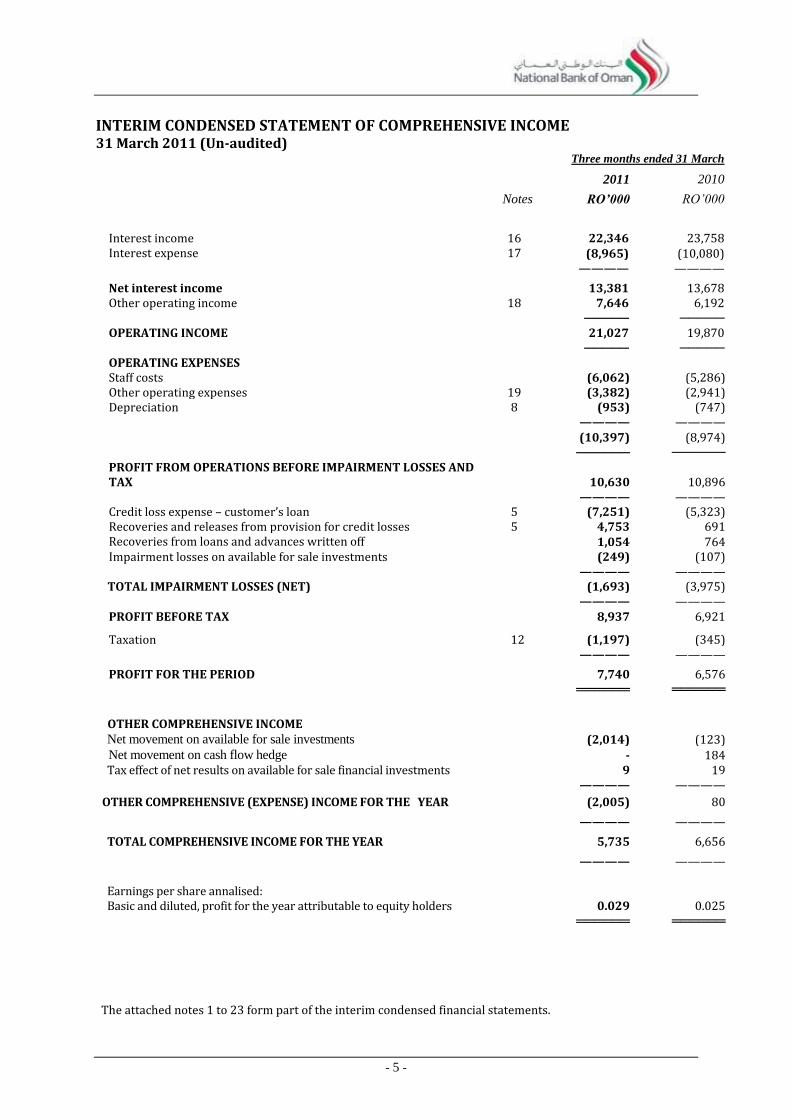
INTERIM CONDENSED STATEMENT OF COMPREHENSIVE INCOME 31 March 2011 (Un-audited)
Three months ended 31 March
2011 2010
Notes RO’000 RO’000
Interest income 16 22,346 23,758 Interest expense 17 (8,965) (10,080)
———— ————
Net interest income 13,381 13,678 Other operating income 18 7,646 6,192 ───── ───── OPERATING INCOME 21,027 19,870
───── ───── OPERATING EXPENSES Staff costs (6,062) (5,286) Other operating expenses 19 (3,382) (2,941) Depreciation 8 (953) (747) ———— ———— (10,397) (8,974) ────── ────── PROFIT FROM OPERATIONS BEFORE IMPAIRMENT LOSSES AND TAX
10,630 10,896
———— ———— Credit loss expense – customer’s loan 5 (7,251) (5,323) Recoveries and releases from provision for credit losses 5 4,753 691 Recoveries from loans and advances written off 1,054 764 Impairment losses on available for sale investments (249) (107)
———— ———— TOTAL IMPAIRMENT LOSSES (NET) (1,693) (3,975)
———— ———— PROFIT BEFORE TAX 8,937 6,921
Taxation 12 (1,197) (345)
———— ————
PROFIT FOR THE PERIOD 7,740 6,576 ══════ ══════
OTHER COMPREHENSIVE INCOME Net movement on available for sale investments (2,014) (123) Net movement on cash flow hedge - 184 Tax effect of net results on available for sale financial investments 9 19
———— ————
OTHER COMPREHENSIVE (EXPENSE) INCOME FOR THE YEAR (2,005) 80
———— ————
TOTAL COMPREHENSIVE INCOME FOR THE YEAR 5,735 6,656
———— ————
Earnings per share annalised: Basic and diluted, profit for the year attributable to equity holders
0.029
0.025
══════ ══════
The attached notes 1 to 23 form part of the interim condensed financial statements.
- 6 -
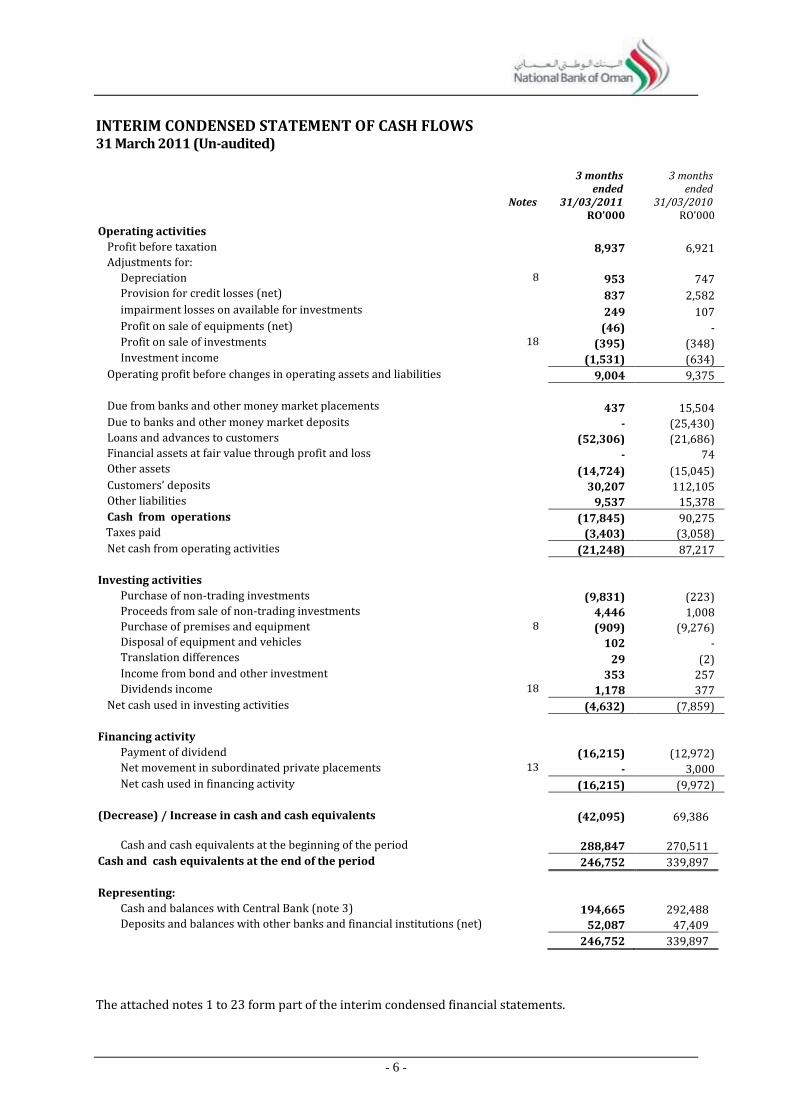
INTERIM CONDENSED STATEMENT OF CASH FLOWS 31 March 2011 (Un-audited)
Notes
3 months ended
31/03/2011
3 months ended
31/03/2010 RO’000 RO’000
Operating activities
Profit before taxation 8,937 6,921 Adjustments for:
Depreciation 8 953 747 Provision for credit losses (net) 837 2,582 impairment losses on available for investments 249 107 Profit on sale of equipments (net) (46) - Profit on sale of investments 18 (395) (348) Investment income (1,531) (634)
Operating profit before changes in operating assets and liabilities 9,004 9,375
Due from banks and other money market placements 437 15,504 Due to banks and other money market deposits - (25,430) Loans and advances to customers (52,306) (21,686) Financial assets at fair value through profit and loss - 74 Other assets (14,724) (15,045) Customers’ deposits 30,207 112,105 Other liabilities 9,537 15,378 Cash from operations (17,845) 90,275
Taxes paid (3,403) (3,058) Net cash from operating activities (21,248) 87,217
Investing activities
Purchase of non-trading investments (9,831) (223) Proceeds from sale of non-trading investments 4,446 1,008 Purchase of premises and equipment 8 (909) (9,276) Disposal of equipment and vehicles 102 - Translation differences 29 (2) Income from bond and other investment 353 257 Dividends income 18 1,178 377
Net cash used in investing activities (4,632) (7,859)
Financing activity
Payment of dividend (16,215) (12,972) Net movement in subordinated private placements 13 - 3,000 Net cash used in financing activity (16,215) (9,972)
(Decrease) / Increase in cash and cash equivalents (42,095) 69,386
Cash and cash equivalents at the beginning of the period 288,847 270,511 Cash and cash equivalents at the end of the period 246,752 339,897
Representing:
Cash and balances with Central Bank (note 3) 194,665 292,488 Deposits and balances with other banks and financial institutions (net) 52,087 47,409
246,752 339,897
The attached notes 1 to 23 form part of the interim condensed financial statements.
- 7 -
────────────────────────────────────────────────────────────────────────────────────────────────────────────────────────────────────────────────
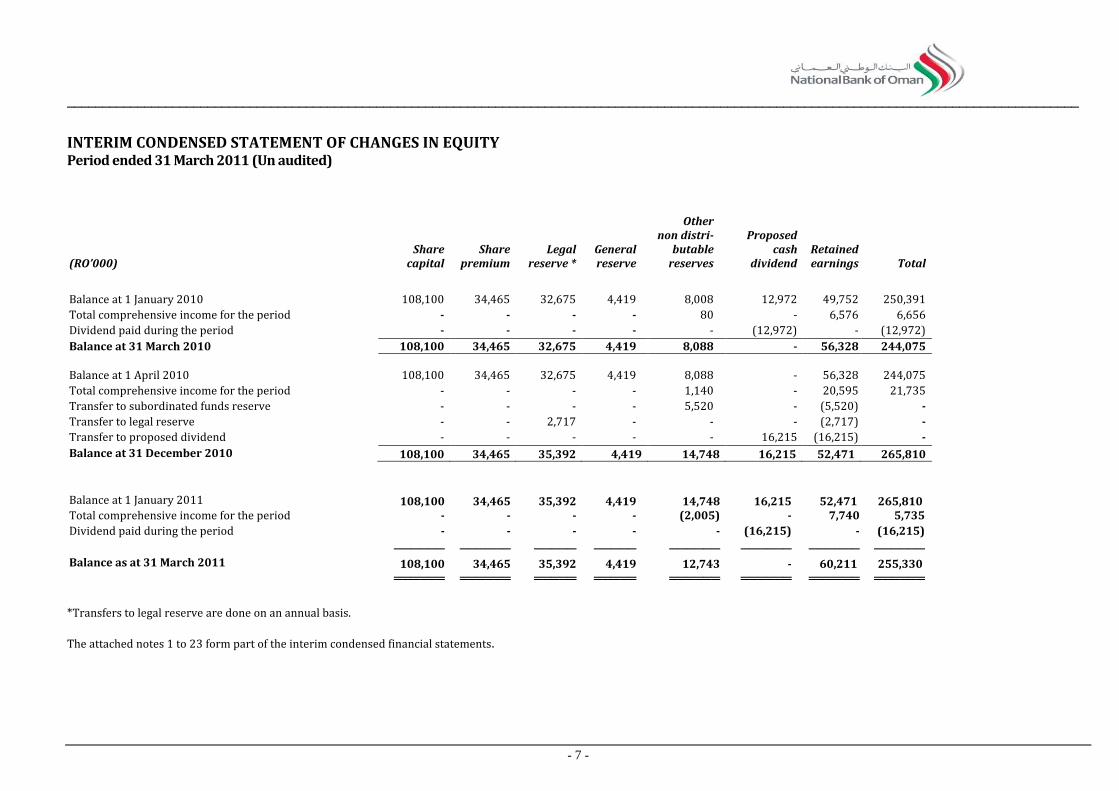
INTERIM CONDENSED STATEMENT OF CHANGES IN EQUITY Period ended 31 March 2011 (Un audited)
(RO’000) Share
capital Share
premium Legal
reserve *
General reserve
Other non distri-
butable reserves
Proposed cash
dividend Retained earnings Total
Balance at 1 January 2010 108,100 34,465 32,675 4,419 8,008 12,972 49,752 250,391
Total comprehensive income for the period - - - - 80 - 6,576 6,656
Dividend paid during the period - - - - - (12,972) - (12,972)
Balance at 31 March 2010 108,100 34,465 32,675 4,419 8,088 - 56,328 244,075
Balance at 1 April 2010 108,100 34,465 32,675 4,419 8,088 - 56,328 244,075
Total comprehensive income for the period - - - - 1,140 - 20,595 21,735
Transfer to subordinated funds reserve - - - - 5,520 - (5,520) -
Transfer to legal reserve - - 2,717 - - - (2,717) -
Transfer to proposed dividend - - - - - 16,215 (16,215) -
Balance at 31 December 2010 108,100 34,465 35,392 4,419 14,748 16,215 52,471 265,810
Balance at 1 January 2011 108,100 34,465 35,392 4,419 14,748 16,215 52,471 265,810 Total comprehensive income for the period - - - - (2,005) - 7,740 5,735
Dividend paid during the period - - - - - (16,215) - (16,215)
────── ────── ───── ───── ────── ────── ────── ────── Balance as at 31 March 2011 108,100 34,465 35,392 4,419 12,743 - 60,211 255,330 ══════ ══════ ═════ ═════ ══════ ══════ ══════ ══════
*Transfers to legal reserve are done on an annual basis.
The attached notes 1 to 23 form part of the interim condensed financial statements.
- 8-
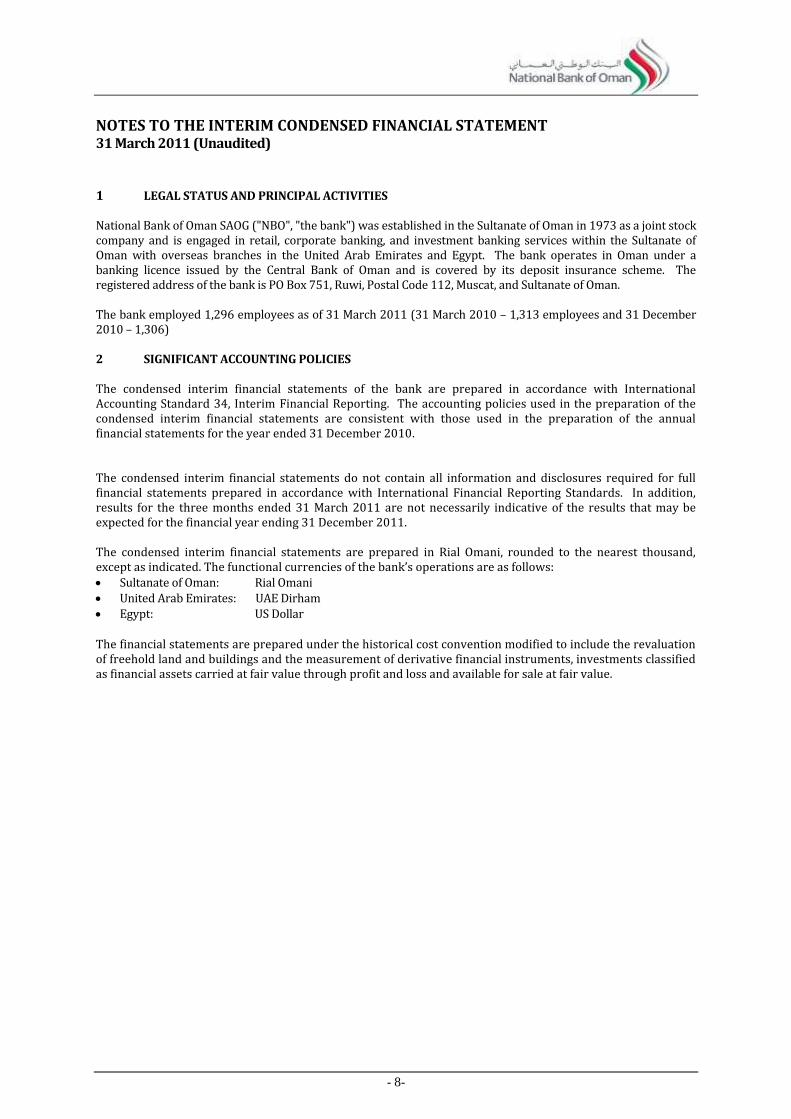
NOTES TO THE INTERIM CONDENSED FINANCIAL STATEMENT 31 March 2011 (Unaudited)
1 LEGAL STATUS AND PRINCIPAL ACTIVITIES National Bank of Oman SAOG ("NBO", "the bank") was established in the Sultanate of Oman in 1973 as a joint stock company and is engaged in retail, corporate banking, and investment banking services within the Sultanate of Oman with overseas branches in the United Arab Emirates and Egypt. The bank operates in Oman under a banking licence issued by the Central Bank of Oman and is covered by its deposit insurance scheme. The registered address of the bank is PO Box 751, Ruwi, Postal Code 112, Muscat, and Sultanate of Oman. The bank employed 1,296 employees as of 31 March 2011 (31 March 2010 – 1,313 employees and 31 December 2010 – 1,306) 2 SIGNIFICANT ACCOUNTING POLICIES The condensed interim financial statements of the bank are prepared in accordance with International Accounting Standard 34, Interim Financial Reporting. The accounting policies used in the preparation of the condensed interim financial statements are consistent with those used in the preparation of the annual financial statements for the year ended 31 December 2010. The condensed interim financial statements do not contain all information and disclosures required for full financial statements prepared in accordance with International Financial Reporting Standards. In addition, results for the three months ended 31 March 2011 are not necessarily indicative of the results that may be expected for the financial year ending 31 December 2011. The condensed interim financial statements are prepared in Rial Omani, rounded to the nearest thousand, except as indicated. The functional currencies of the bank’s operations are as follows: Sultanate of Oman: Rial Omani United Arab Emirates: UAE Dirham Egypt: US Dollar The financial statements are prepared under the historical cost convention modified to include the revaluation of freehold land and buildings and the measurement of derivative financial instruments, investments classified as financial assets carried at fair value through profit and loss and available for sale at fair value.
- 9-
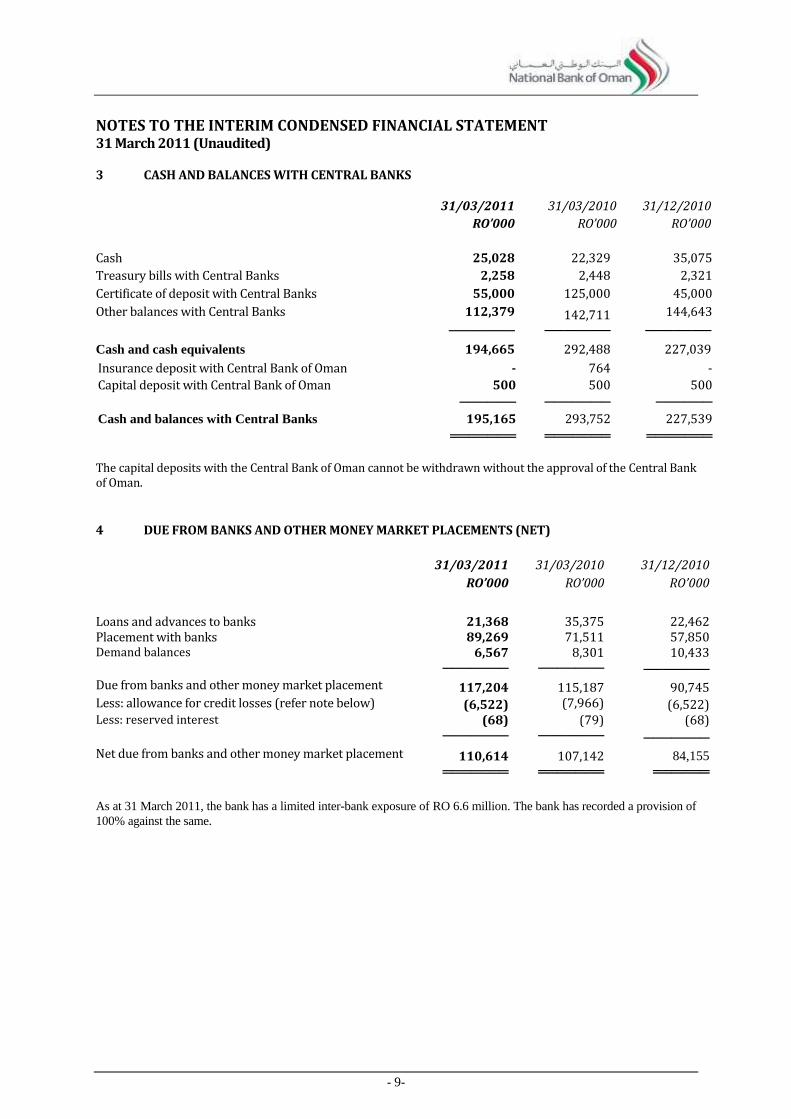
NOTES TO THE INTERIM CONDENSED FINANCIAL STATEMENT 31 March 2011 (Unaudited) 3 CASH AND BALANCES WITH CENTRAL BANKS
The capital deposits with the Central Bank of Oman cannot be withdrawn without the approval of the Central Bank of Oman.
4 DUE FROM BANKS AND OTHER MONEY MARKET PLACEMENTS (NET)
As at 31 March 2011, the bank has a limited inter-bank exposure of RO 6.6 million. The bank has recorded a provision of
100% against the same.
31/03/2011 31/03/2010 31/12/2010
RO’000 RO’000 RO’000
Cash 25,028 22,329 35,075
Treasury bills with Central Banks 2,258 2,448 2,321
Certificate of deposit with Central Banks 55,000 125,000 45,000
Other balances with Central Banks 112,379 142,711 144,643
─────── ─────── ───────
Cash and cash equivalents 194,665 292,488 227,039
Insurance deposit with Central Bank of Oman - 764 -
Capital deposit with Central Bank of Oman 500 500 500
────── ─────── ──────
Cash and balances with Central Banks 195,165 293,752 227,539
═══════ ═══════ ═══════
31/03/2011 31/03/2010 31/12/2010
RO’000 RO’000 RO’000
Loans and advances to banks 21,368 35,375 22,462 Placement with banks 89,269 71,511 57,850 Demand balances 6,567 8,301 10,433 ─────── ─────── ─────── Due from banks and other money market placement 117,204 115,187 90,745 Less: allowance for credit losses (refer note below) (6,522) (7,966) (6,522) Less: reserved interest (68) (79) (68) ─────── ─────── ─────── Net due from banks and other money market placement 110,614 107,142 84,155 ═══════ ═══════ ══════
- 10-
NOTES TO THE INTERIM CONDENSED FINANCIAL STATEMENT 31 March 2011 (Unaudited)
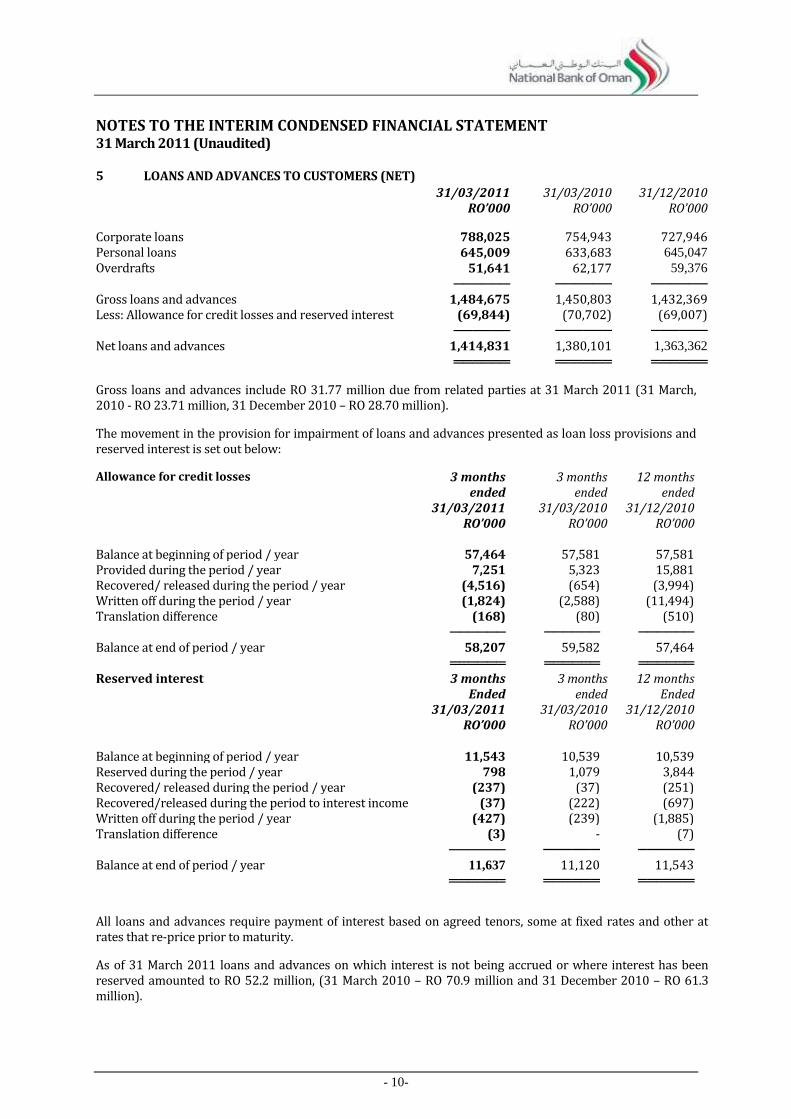
5 LOANS AND ADVANCES TO CUSTOMERS (NET)
31/03/2011 31/03/2010 31/12/2010 RO’000 RO’000 RO’000 Corporate loans 788,025 754,943 727,946 Personal loans 645,009 633,683 645,047 Overdrafts 51,641 62,177 59,376 ────── ────── ────── Gross loans and advances 1,484,675 1,450,803 1,432,369 Less: Allowance for credit losses and reserved interest (69,844) (70,702) (69,007) ────── ────── ────── Net loans and advances 1,414,831 1,380,101 1,363,362 ══════ ══════ ══════
Gross loans and advances include RO 31.77 million due from related parties at 31 March 2011 (31 March, 2010 - RO 23.71 million, 31 December 2010 – RO 28.70 million).
The movement in the provision for impairment of loans and advances presented as loan loss provisions and reserved interest is set out below:
Allowance for credit losses
3 months ended
3 months ended
12 months ended
31/03/2011 31/03/2010 31/12/2010 RO’000 RO’000 RO’000 Balance at beginning of period / year 57,464 57,581 57,581 Provided during the period / year 7,251 5,323 15,881 Recovered/ released during the period / year (4,516) (654) (3,994) Written off during the period / year (1,824) (2,588) (11,494) Translation difference (168) (80) (510) ────── ────── ────── Balance at end of period / year 58,207 59,582 57,464 ══════ ══════ ══════ Reserved interest
3 months Ended
3 months ended
12 months Ended
31/03/2011 31/03/2010 31/12/2010 RO’000 RO’000 RO’000 Balance at beginning of period / year 11,543 10,539 10,539 Reserved during the period / year 798 1,079 3,844 Recovered/ released during the period / year (237) (37) (251) Recovered/released during the period to interest income (37) (222) (697) Written off during the period / year (427) (239) (1,885) Translation difference (3) - (7) ────── ────── ────── Balance at end of period / year 11,637 11,120 11,543 ══════ ══════ ══════
All loans and advances require payment of interest based on agreed tenors, some at fixed rates and other at rates that re-price prior to maturity.
As of 31 March 2011 loans and advances on which interest is not being accrued or where interest has been reserved amounted to RO 52.2 million, (31 March 2010 – RO 70.9 million and 31 December 2010 – RO 61.3 million).
- 11-
NOTES TO THE INTERIM CONDENSED FINANCIAL STATEMENT 31 March 2011 (Unaudited)
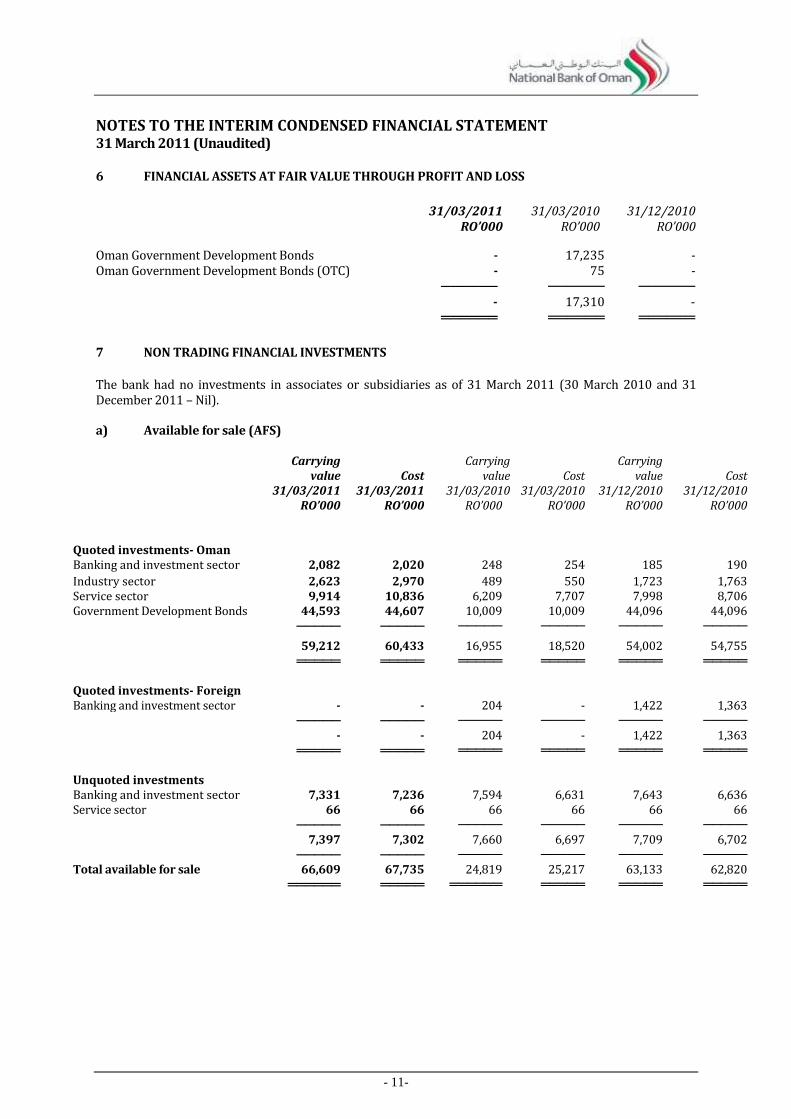
6 FINANCIAL ASSETS AT FAIR VALUE THROUGH PROFIT AND LOSS
31/03/2011 31/03/2010 31/12/2010 RO’000 RO’000 RO’000 Oman Government Development Bonds - 17,235 - Oman Government Development Bonds (OTC) - 75 - ────── ────── ────── - 17,310 - ══════ ══════ ══════
7 NON TRADING FINANCIAL INVESTMENTS
The bank had no investments in associates or subsidiaries as of 31 March 2011 (30 March 2010 and 31 December 2011 – Nil). a) Available for sale (AFS)
Carrying value
31/03/2011
Cost
31/03/2011
Carrying value
31/03/2010
Cost
31/03/2010
Carrying value
31/12/2010
Cost
31/12/2010 RO’000 RO’000 RO’000 RO’000 RO’000 RO’000 Quoted investments- Oman Banking and investment sector 2,082 2,020 248 254 185 190
Industry sector 2,623 2,970 489 550 1,723 1,763 Service sector 9,914 10,836 6,209 7,707 7,998 8,706 Government Development Bonds 44,593 44,607 10,009 10,009 44,096 44,096 ───── ───── ───── ───── ───── ─────
59,212 60,433 16,955 18,520 54,002 54,755 ═════ ═════ ═════ ═════ ═════ ═════ Quoted investments- Foreign Banking and investment sector - - 204 - 1,422 1,363 ───── ───── ───── ───── ───── ───── - - 204 - 1,422 1,363 ═════ ═════ ═════ ═════ ═════ ═════ Unquoted investments Banking and investment sector 7,331 7,236 7,594 6,631 7,643 6,636 Service sector 66 66 66 66 66 66 ───── ───── ───── ───── ───── ───── 7,397 7,302 7,660 6,697 7,709 6,702 ───── ───── ───── ───── ───── ───── Total available for sale 66,609 67,735 24,819 25,217 63,133 62,820 ══════ ═════ ══════ ═════ ═════ ═════
- 12-
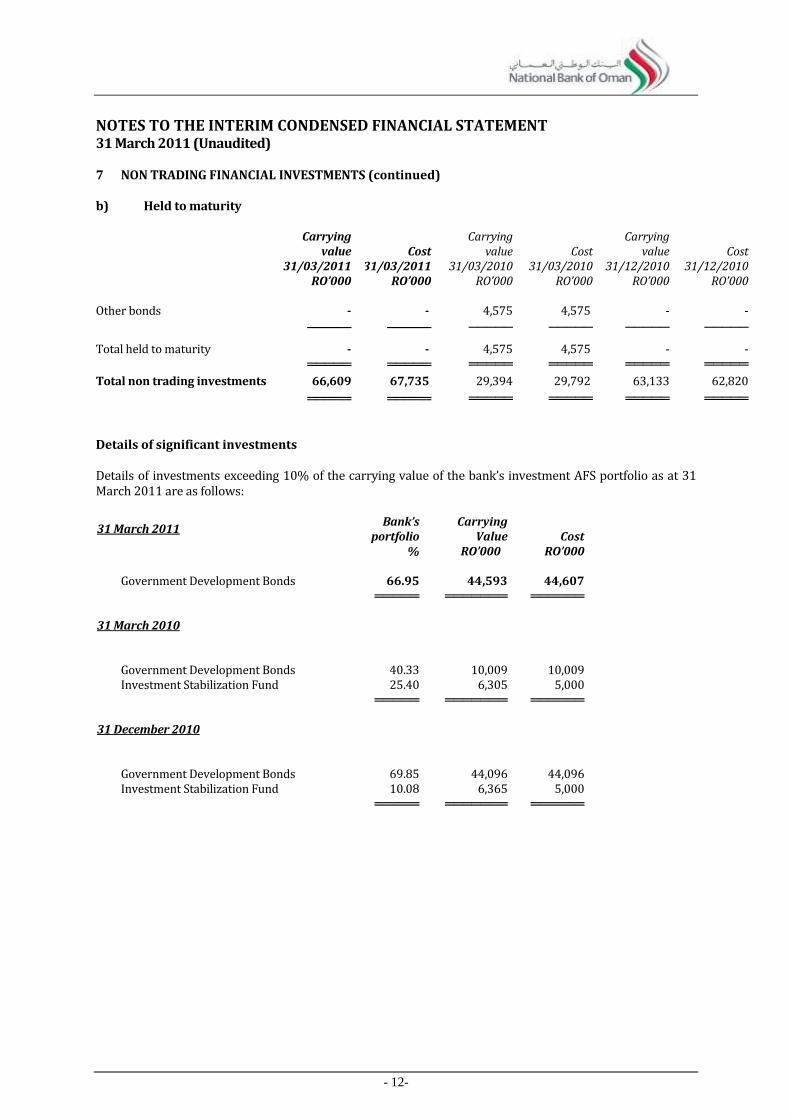
NOTES TO THE INTERIM CONDENSED FINANCIAL STATEMENT 31 March 2011 (Unaudited) 7 NON TRADING FINANCIAL INVESTMENTS (continued) b) Held to maturity Carrying
value 31/03/2011
Cost
31/03/2011
Carrying value
31/03/2010
Cost
31/03/2010
Carrying value
31/12/2010
Cost
31/12/2010 RO’000 RO’000 RO’000 RO’000 RO’000 RO’000 Other bonds - - 4,575 4,575 - -
───── ───── ───── ───── ───── ─────
Total held to maturity - - 4,575 4,575 - - ═════ ═════ ═════ ═════ ═════ ═════
Total non trading investments 66,609 67,735 29,394 29,792 63,133 62,820
═════ ═════ ═════ ═════ ═════ ═════
Details of significant investments Details of investments exceeding 10% of the carrying value of the bank’s investment AFS portfolio as at 31 March 2011 are as follows:
31 March 2011 Bank’s
portfolio Carrying
Value Cost % RO’000 RO’000
Government Development Bonds 66.95 44,593 44,607 ═════ ═══════ ══════ 31 March 2010
Government Development Bonds 40.33 10,009 10,009 Investment Stabilization Fund 25.40 6,305 5,000
═════ ═══════ ══════ 31 December 2010
Government Development Bonds 69.85 44,096 44,096 Investment Stabilization Fund 10.08 6,365 5,000 ═════ ═══════ ══════
- 13-
NOTES TO THE INTERIM CONDENSED FINANCIAL STATEMENT 31 March 2011 (Unaudited)
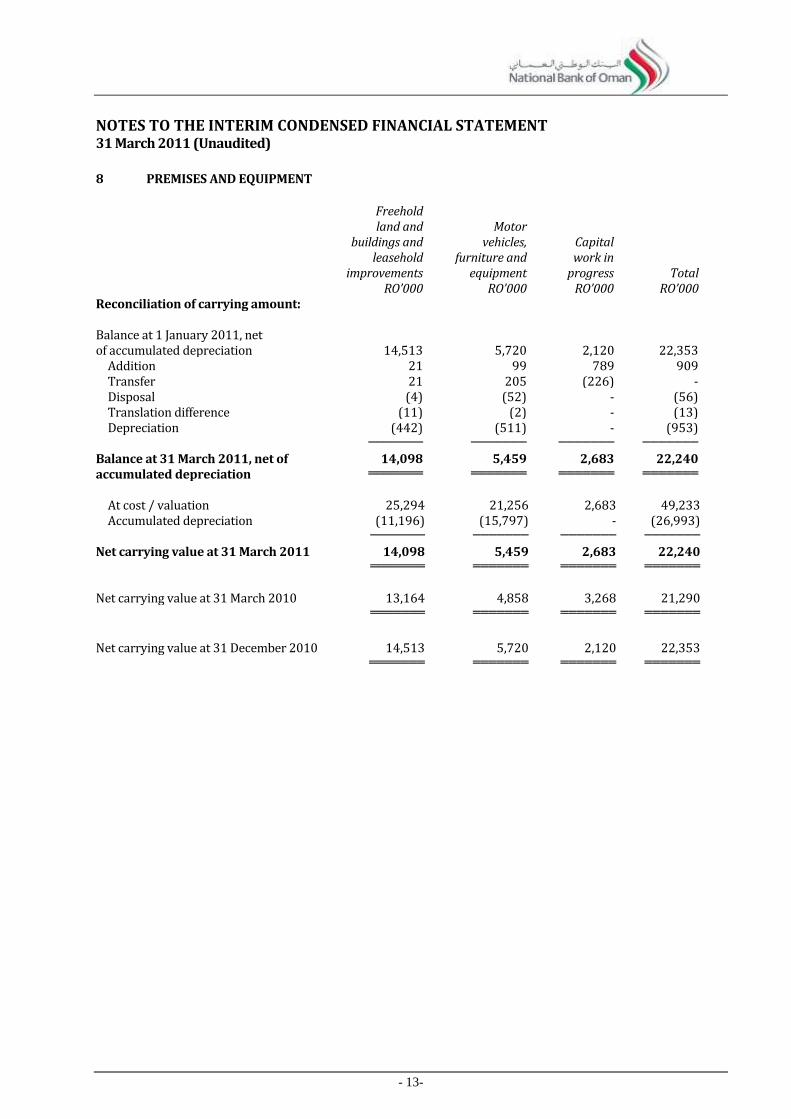
8 PREMISES AND EQUIPMENT
Freehold land and Motor buildings and vehicles, Capital leasehold furniture and work in improvements equipment progress Total RO’000 RO’000 RO’000 RO’000 Reconciliation of carrying amount: Balance at 1 January 2011, net of accumulated depreciation 14,513 5,720 2,120 22,353
Addition 21 99 789 909 Transfer 21 205 (226) - Disposal (4) (52) - (56) Translation difference (11) (2) - (13) Depreciation (442) (511) - (953)
─────── ─────── ─────── ───────
Balance at 31 March 2011, net of 14,098 5,459 2,683 22,240 accumulated depreciation ═══════ ═══════ ═══════ ═══════
At cost / valuation 25,294 21,256 2,683 49,233 Accumulated depreciation (11,196) (15,797) - (26,993)
─────── ─────── ─────── ───────
Net carrying value at 31 March 2011 14,098 5,459 2,683 22,240 ═══════ ═══════ ═══════ ═══════
Net carrying value at 31 March 2010 13,164 4,858 3,268 21,290 ═══════ ═══════ ═══════ ═══════
Net carrying value at 31 December 2010 14,513 5,720 2,120 22,353 ═══════ ═══════ ═══════ ═══════
- 14-
NOTES TO THE INTERIM CONDENSED FINANCIAL STATEMENT 31 March 2011 (Unaudited)
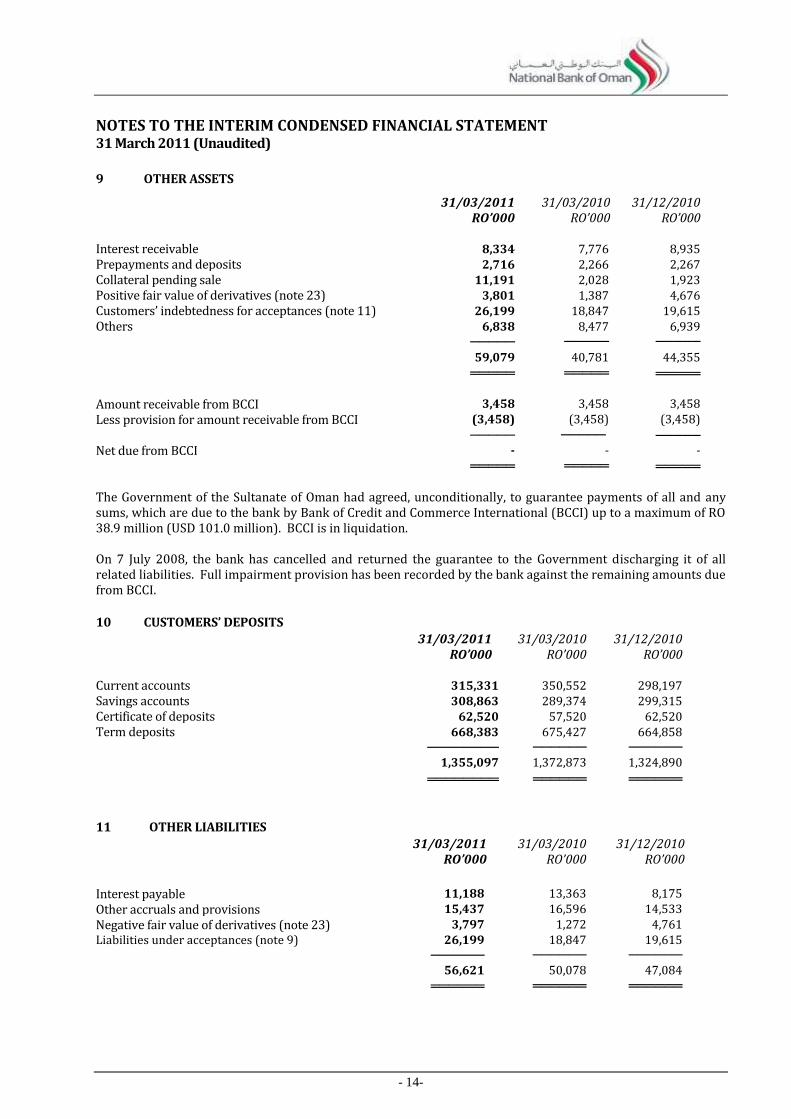
9 OTHER ASSETS
The Government of the Sultanate of Oman had agreed, unconditionally, to guarantee payments of all and any sums, which are due to the bank by Bank of Credit and Commerce International (BCCI) up to a maximum of RO 38.9 million (USD 101.0 million). BCCI is in liquidation. On 7 July 2008, the bank has cancelled and returned the guarantee to the Government discharging it of all related liabilities. Full impairment provision has been recorded by the bank against the remaining amounts due from BCCI.
10 CUSTOMERS’ DEPOSITS
31/03/2011 31/03/2010 31/12/2010 RO’000 RO’000 RO’000 Current accounts 315,331 350,552 298,197 Savings accounts 308,863 289,374 299,315 Certificate of deposits 62,520 57,520 62,520 Term deposits 668,383 675,427 664,858 ──────── ────── ──────
1,355,097 1,372,873 1,324,890
════════ ══════ ══════
11 OTHER LIABILITIES
31/03/2011 31/03/2010 31/12/2010 RO’000 RO’000 RO’000
Interest payable 11,188 13,363 8,175
Other accruals and provisions 15,437 16,596 14,533
Negative fair value of derivatives (note 23) 3,797 1,272 4,761 Liabilities under acceptances (note 9) 26,199 18,847 19,615 ────── ────── ──────
56,621 50,078 47,084
══════ ══════ ══════
31/03/2011 31/03/2010 31/12/2010 RO’000 RO’000 RO’000 Interest receivable 8,334 7,776 8,935 Prepayments and deposits 2,716 2,266 2,267 Collateral pending sale 11,191 2,028 1,923 Positive fair value of derivatives (note 23) 3,801 1,387 4,676 Customers’ indebtedness for acceptances (note 11) 26,199 18,847 19,615 Others 6,838 8,477 6,939
───── ───── ─────
59,079 40,781 44,355
═════ ═════ ═════
Amount receivable from BCCI 3,458 3,458 3,458
Less provision for amount receivable from BCCI (3,458) (3,458) (3,458)
───── ───── ───── Net due from BCCI - - -
═════ ═════ ═════
- 15-
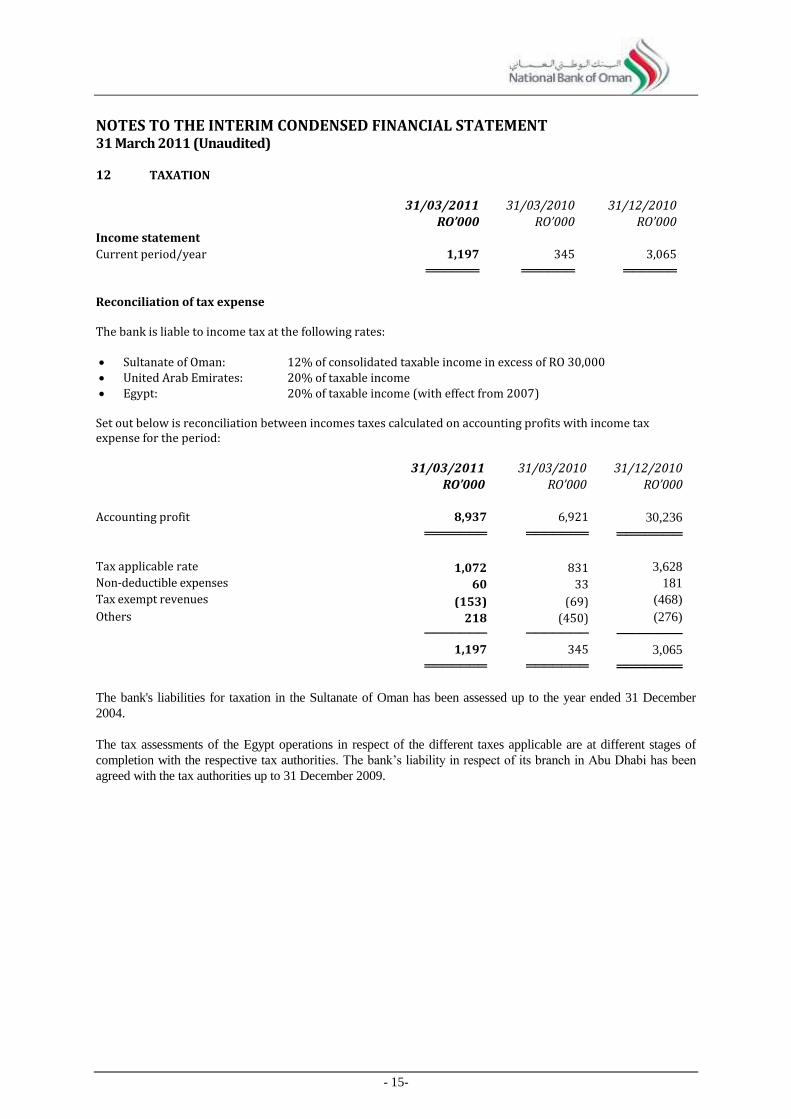
NOTES TO THE INTERIM CONDENSED FINANCIAL STATEMENT 31 March 2011 (Unaudited) 12 TAXATION
31/03/2011 31/03/2010 31/12/2010 RO’000 RO’000 RO’000
Income statement
Current period/year 1,197 345 3,065
══════ ══════ ══════
Reconciliation of tax expense The bank is liable to income tax at the following rates: Sultanate of Oman: 12% of consolidated taxable income in excess of RO 30,000 United Arab Emirates: 20% of taxable income Egypt: 20% of taxable income (with effect from 2007)
Set out below is reconciliation between incomes taxes calculated on accounting profits with income tax expense for the period: 31/03/2011 31/03/2010 31/12/2010 RO’000 RO’000 RO’000 Accounting profit 8,937 6,921 30,236
═══════ ═══════ ═══════
Tax applicable rate 1,072 831 3,628
Non-deductible expenses 60 33 181
Tax exempt revenues (153) (69) (468)
Others 218 (450) (276)
─────── ─────── ───────
1,197 345 3,065
═══════ ═══════ ═══════
The bank's liabilities for taxation in the Sultanate of Oman has been assessed up to the year ended 31 December
2004.
The tax assessments of the Egypt operations in respect of the different taxes applicable are at different stages of
completion with the respective tax authorities. The bank’s liability in respect of its branch in Abu Dhabi has been
agreed with the tax authorities up to 31 December 2009.
- 16-
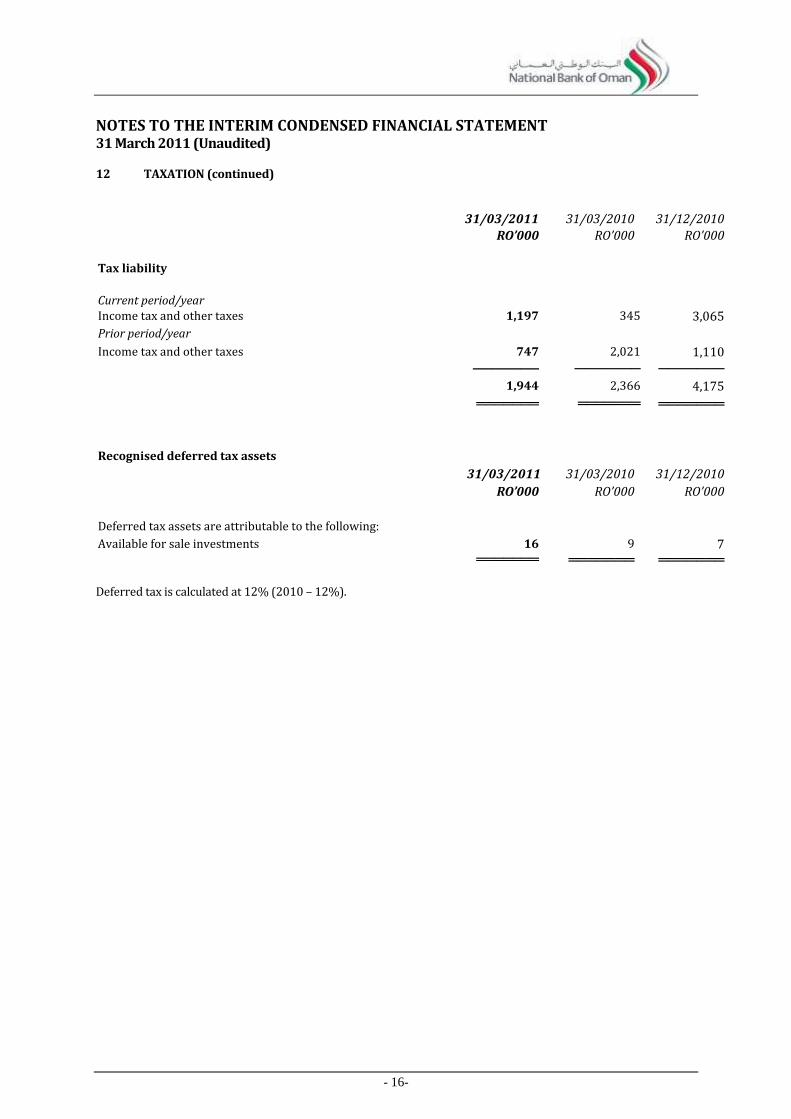
NOTES TO THE INTERIM CONDENSED FINANCIAL STATEMENT 31 March 2011 (Unaudited) 12 TAXATION (continued)
31/03/2011 31/03/2010 31/12/2010 RO’000 RO’000 RO’000
Tax liability
Current period/year Income tax and other taxes 1,197 345 3,065
Prior period/year
Income tax and other taxes 747 2,021 1,110 ─────── ─────── ───────
1,944 2,366 4,175
═══════ ═══════ ═══════
Recognised deferred tax assets
31/03/2011 31/03/2010 31/12/2010
RO’000 RO’000 RO’000
Deferred tax assets are attributable to the following:
Available for sale investments 16 9 7 ═══════ ═══════ ═══════
Deferred tax is calculated at 12% (2010 – 12%).
- 17-
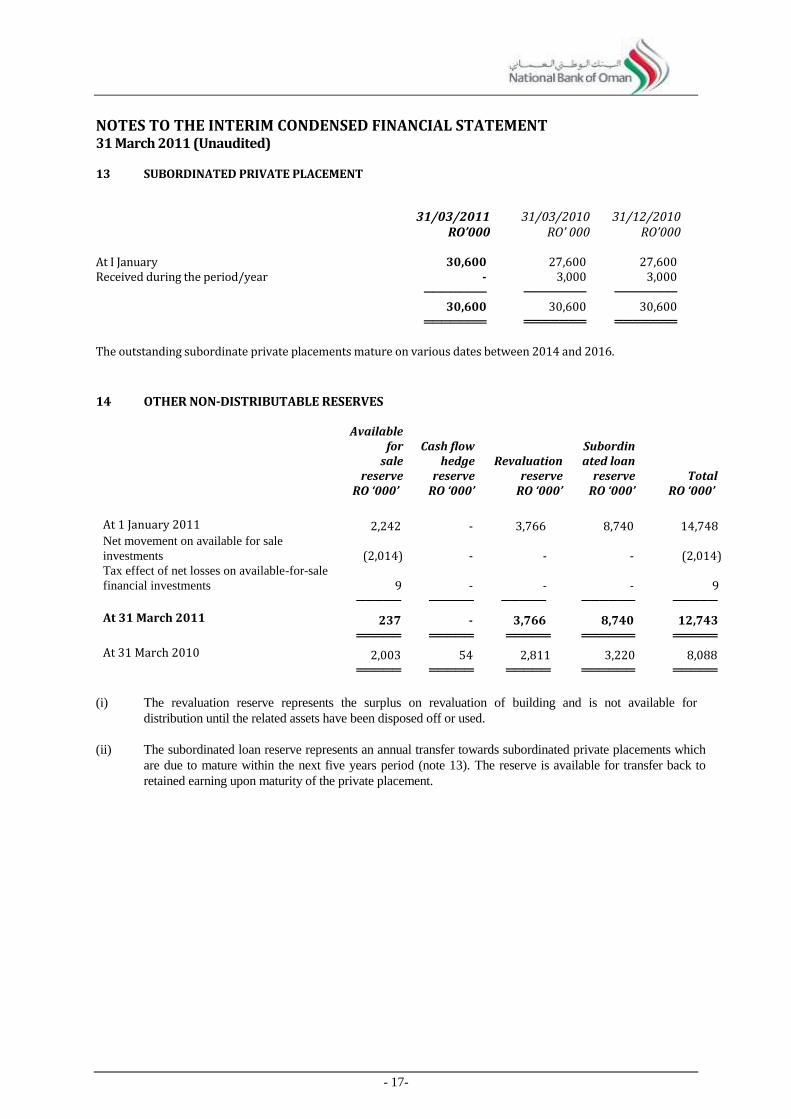
NOTES TO THE INTERIM CONDENSED FINANCIAL STATEMENT 31 March 2011 (Unaudited) 13 SUBORDINATED PRIVATE PLACEMENT
31/03/2011 31/03/2010 31/12/2010 RO’000 RO’ 000 RO’000
At I January 30,600 27,600 27,600 Received during the period/year - 3,000 3,000 ─────── ─────── ─────── 30,600 30,600 30,600 ═══════ ═══════ ═══════ The outstanding subordinate private placements mature on various dates between 2014 and 2016.
14 OTHER NON-DISTRIBUTABLE RESERVES
Available for
sale reserve
Cash flow hedge
reserve Revaluation
reserve
Subordinated loan
reserve Total RO ‘000’ RO ‘000’ RO ‘000’ RO ‘000’ RO ‘000’
At 1 January 2011 2,242 - 3,766 8,740 14,748 Net movement on available for sale
investments (2,014) - - - (2,014) Tax effect of net losses on available-for-sale
financial investments 9 - - - 9 ───── ───── ───── ────── ─────
At 31 March 2011 237 - 3,766 8,740 12,743 ═════ ═════ ═════ ══════ ═════
At 31 March 2010 2,003 54 2,811 3,220 8,088 ═════ ═════ ═════ ══════ ═════
(i) The revaluation reserve represents the surplus on revaluation of building and is not available for
distribution until the related assets have been disposed off or used.
(ii) The subordinated loan reserve represents an annual transfer towards subordinated private placements which
are due to mature within the next five years period (note 13). The reserve is available for transfer back to
retained earning upon maturity of the private placement.
- 18-
NOTES TO THE INTERIM CONDENSED FINANCIAL STATEMENT 31 March 2011 (Unaudited)
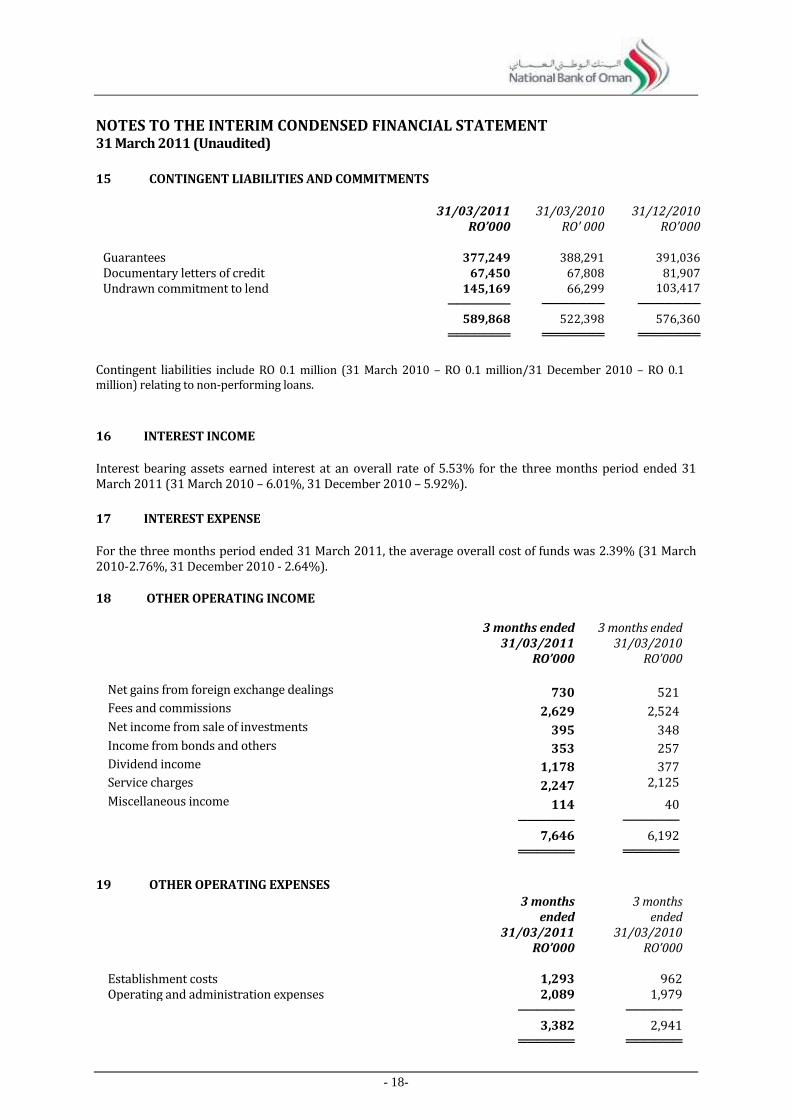
15 CONTINGENT LIABILITIES AND COMMITMENTS
31/03/2011 31/03/2010 31/12/2010 RO’000 RO’ 000 RO’000 Guarantees 377,249 388,291 391,036 Documentary letters of credit 67,450 67,808 81,907 Undrawn commitment to lend 145,169 66,299 103,417
─────── ─────── ───────
589,868 522,398 576,360
═══════ ═══════ ═══════
Contingent liabilities include RO 0.1 million (31 March 2010 – RO 0.1 million/31 December 2010 – RO 0.1 million) relating to non-performing loans.
16 INTEREST INCOME
Interest bearing assets earned interest at an overall rate of 5.53% for the three months period ended 31 March 2011 (31 March 2010 – 6.01%, 31 December 2010 – 5.92%).
17 INTEREST EXPENSE
For the three months period ended 31 March 2011, the average overall cost of funds was 2.39% (31 March 2010-2.76%, 31 December 2010 - 2.64%).
18 OTHER OPERATING INCOME
3 months ended 3 months ended 31/03/2011 31/03/2010 RO’000 RO’000
Net gains from foreign exchange dealings 730 521 Fees and commissions 2,629 2,524 Net income from sale of investments 395 348 Income from bonds and others 353 257 Dividend income 1,178 377 Service charges 2,247 2,125
1,980 Miscellaneous income 114 40 ────── ────── 7,646 6,192 ══════ ══════
19 OTHER OPERATING EXPENSES
3 months ended
3 months ended
31/03/2011 31/03/2010 RO’000 RO’000
Establishment costs 1,293 962 Operating and administration expenses 2,089 1,979
────── ────── 3,382 2,941 ══════ ══════
- 19-
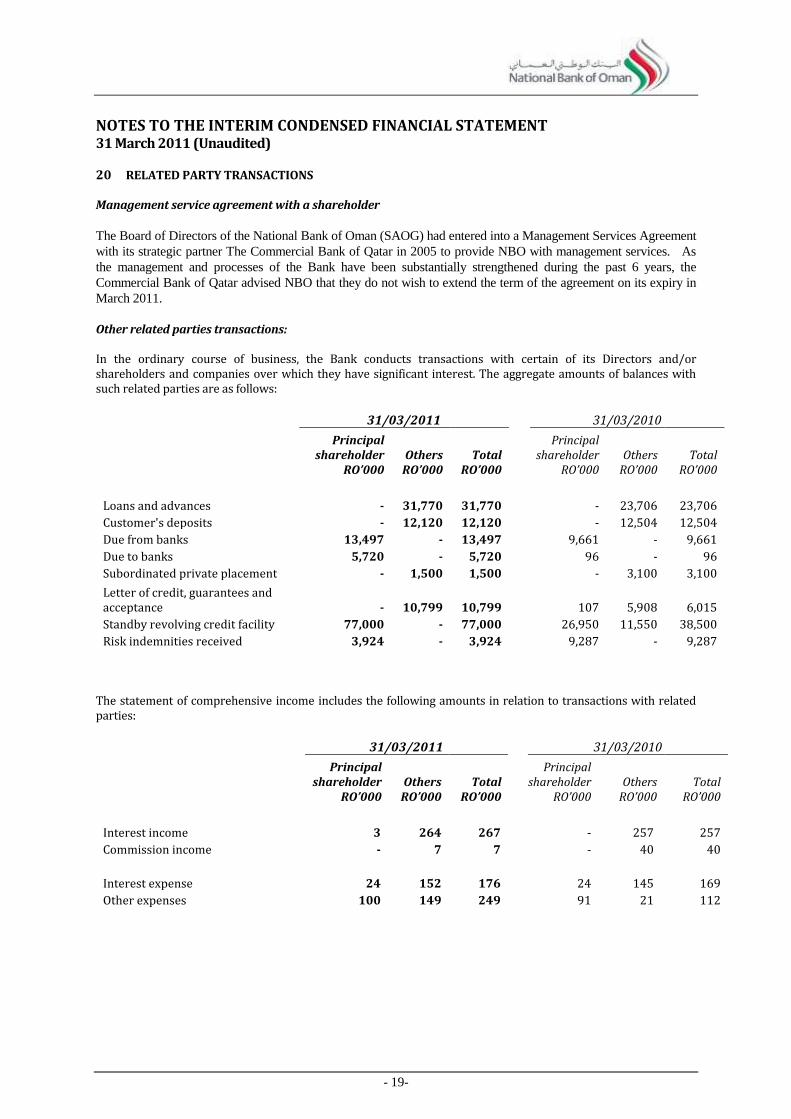
NOTES TO THE INTERIM CONDENSED FINANCIAL STATEMENT 31 March 2011 (Unaudited) 20 RELATED PARTY TRANSACTIONS Management service agreement with a shareholder
The Board of Directors of the National Bank of Oman (SAOG) had entered into a Management Services Agreement
with its strategic partner The Commercial Bank of Qatar in 2005 to provide NBO with management services. As
the management and processes of the Bank have been substantially strengthened during the past 6 years, the
Commercial Bank of Qatar advised NBO that they do not wish to extend the term of the agreement on its expiry in
March 2011.
Other related parties transactions: In the ordinary course of business, the Bank conducts transactions with certain of its Directors and/or shareholders and companies over which they have significant interest. The aggregate amounts of balances with such related parties are as follows:
31/03/2011 31/03/2010
Principal
shareholder Others Total Principal
shareholder Others Total
RO’000 RO’000 RO’000 RO’000 RO’000 RO’000
Loans and advances - 31,770 31,770 - 23,706 23,706
Customer's deposits - 12,120 12,120 - 12,504 12,504
Due from banks 13,497 - 13,497 9,661 - 9,661
Due to banks 5,720 - 5,720 96 - 96
Subordinated private placement - 1,500 1,500 - 3,100 3,100
Letter of credit, guarantees and acceptance - 10,799 10,799 107 5,908 6,015
Standby revolving credit facility 77,000 - 77,000 26,950 11,550 38,500
Risk indemnities received 3,924 - 3,924 9,287 - 9,287
The statement of comprehensive income includes the following amounts in relation to transactions with related
parties:
31/03/2011 31/03/2010
Principal
shareholder Others Total Principal
shareholder Others Total
RO’000 RO’000 RO’000 RO’000 RO’000 RO’000
Interest income 3 264 267 - 257 257
Commission income - 7 7 - 40 40
Interest expense 24 152 176 24 145 169
Other expenses 100 149 249 91 21 112
- 20-
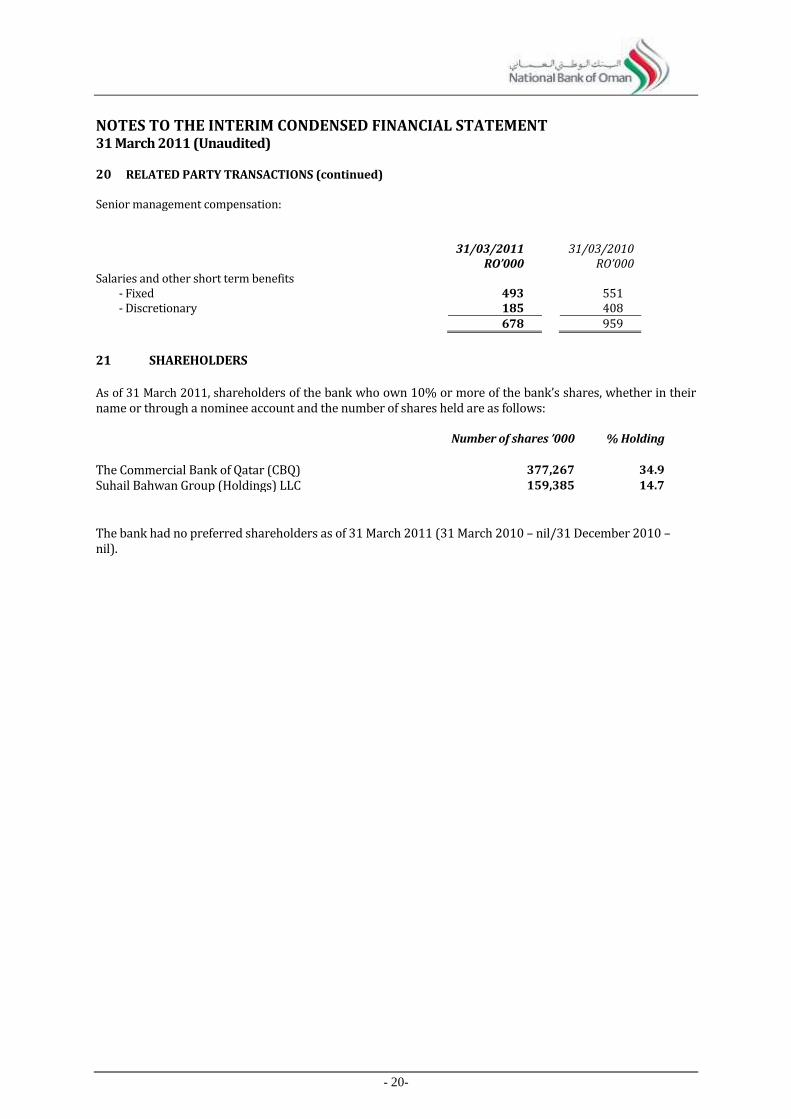
NOTES TO THE INTERIM CONDENSED FINANCIAL STATEMENT 31 March 2011 (Unaudited) 20 RELATED PARTY TRANSACTIONS (continued) Senior management compensation:
31/03/2011 RO’000
31/03/2010
RO’000
Salaries and other short term benefits - Fixed 493 551 - Discretionary 185 408 678 959
21 SHAREHOLDERS
As of 31 March 2011, shareholders of the bank who own 10% or more of the bank’s shares, whether in their name or through a nominee account and the number of shares held are as follows: Number of shares ’000 % Holding
The Commercial Bank of Qatar (CBQ) 377,267 34.9
Suhail Bahwan Group (Holdings) LLC 159,385 14.7
The bank had no preferred shareholders as of 31 March 2011 (31 March 2010 – nil/31 December 2010 – nil).
- 21-
NOTES TO THE INTERIM CONDENSED FINANCIAL STATEMENT 31 March 2011 (unaudited)
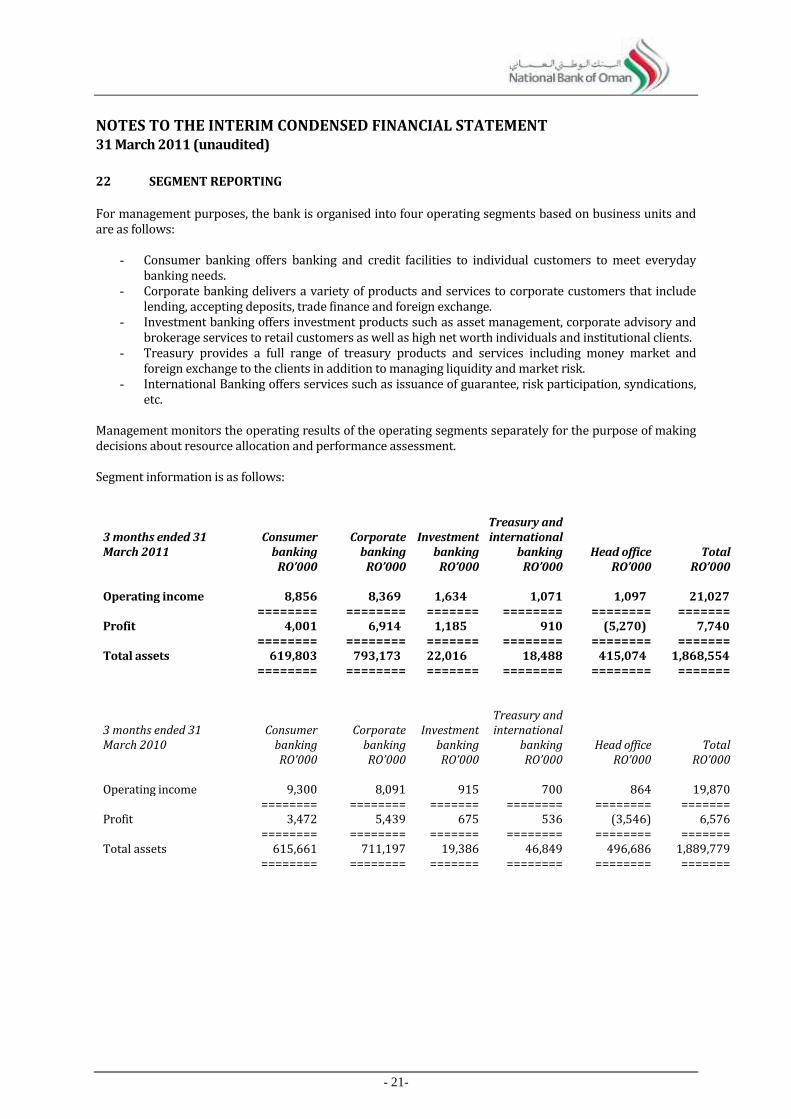
22 SEGMENT REPORTING
For management purposes, the bank is organised into four operating segments based on business units and are as follows:
- Consumer banking offers banking and credit facilities to individual customers to meet everyday banking needs.
- Corporate banking delivers a variety of products and services to corporate customers that include lending, accepting deposits, trade finance and foreign exchange.
- Investment banking offers investment products such as asset management, corporate advisory and brokerage services to retail customers as well as high net worth individuals and institutional clients.
- Treasury provides a full range of treasury products and services including money market and foreign exchange to the clients in addition to managing liquidity and market risk.
- International Banking offers services such as issuance of guarantee, risk participation, syndications, etc.
Management monitors the operating results of the operating segments separately for the purpose of making decisions about resource allocation and performance assessment. Segment information is as follows:
3 months ended 31 March 2011
Consumer banking
Corporate banking
Investment banking
Treasury and international
banking Head office Total RO’000 RO’000 RO’000 RO’000 RO’000 RO’000 Operating income 8,856 8,369 1,634 1,071 1,097 21,027 ======== ======== ======= ======== ======== ======= Profit 4,001 6,914 1,185 910 (5,270) 7,740 ======== ======== ======= ======== ======== ======= Total assets 619,803 793,173 22,016 18,488 415,074 1,868,554 ======== ======== ======= ======== ======== =======
3 months ended 31 March 2010
Consumer banking
Corporate banking
Investment banking
Treasury and international
banking Head office
Total RO’000 RO’000 RO’000 RO’000 RO’000 RO’000 Operating income 9,300 8,091 915 700 864 19,870 ======== ======== ======= ======== ======== ======= Profit 3,472 5,439 675 536 (3,546) 6,576 ======== ======== ======= ======== ======== ======= Total assets 615,661 711,197 19,386 46,849 496,686 1,889,779 ======== ======== ======= ======== ======== =======
- 22-
NOTES TO THE INTERIM CONDENSED FINANCIAL STATEMENT 31 March 2011 (Unaudited)
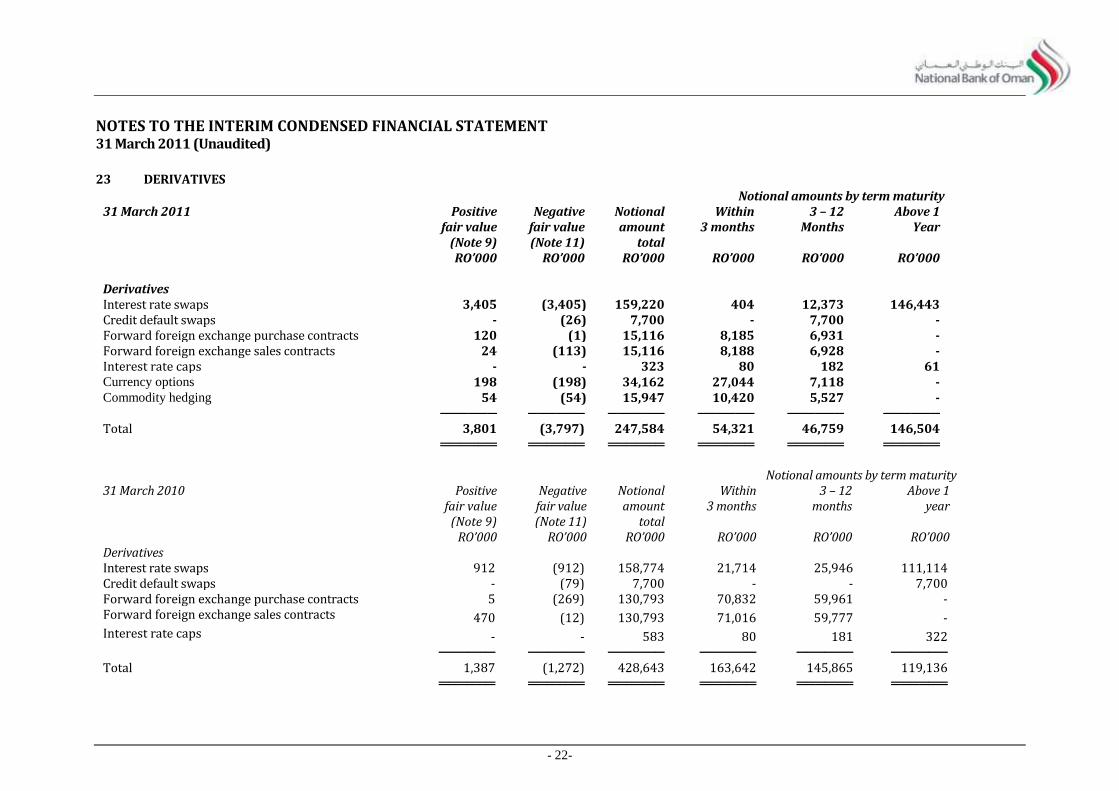
23 DERIVATIVES
Notional amounts by term maturity 31 March 2011 Positive
fair value (Note 9)
Negative fair value (Note 11)
Notional amount
total
Within 3 months
3 – 12 Months
Above 1 Year
RO’000 RO’000 RO’000 RO’000 RO’000 RO’000 Derivatives Interest rate swaps 3,405 (3,405) 159,220 404 12,373 146,443 Credit default swaps - (26) 7,700 - 7,700 - Forward foreign exchange purchase contracts 120 (1) 15,116 8,185 6,931 - Forward foreign exchange sales contracts 24 (113) 15,116 8,188 6,928 - Interest rate caps - - 323 80 182 61 Currency options 198 (198) 34,162 27,044 7,118 - Commodity hedging 54 (54) 15,947 10,420 5,527 - ────── ────── ────── ────── ────── ────── Total 3,801 (3,797) 247,584 54,321 46,759 146,504 ══════ ══════ ══════ ══════ ══════ ══════
Notional amounts by term maturity 31 March 2010 Positive
fair value (Note 9)
Negative fair value (Note 11)
Notional amount
total
Within 3 months
3 – 12 months
Above 1 year
RO’000 RO’000 RO’000 RO’000 RO’000 RO’000 Derivatives Interest rate swaps 912 (912) 158,774 21,714 25,946 111,114 Credit default swaps - (79) 7,700 - - 7,700 Forward foreign exchange purchase contracts 5 (269) 130,793 70,832 59,961 - Forward foreign exchange sales contracts 470 (12) 130,793 71,016 59,777 - Interest rate caps - - 583 80 181 322 ────── ────── ────── ────── ────── ────── Total 1,387 (1,272) 428,643 163,642 145,865 119,136 ══════ ══════ ══════ ══════ ══════ ══════
- 23-
NOTES TO THE INTERIM CONDENSED FINANCIAL STATEMENT 31 March 2011 (Unaudited)
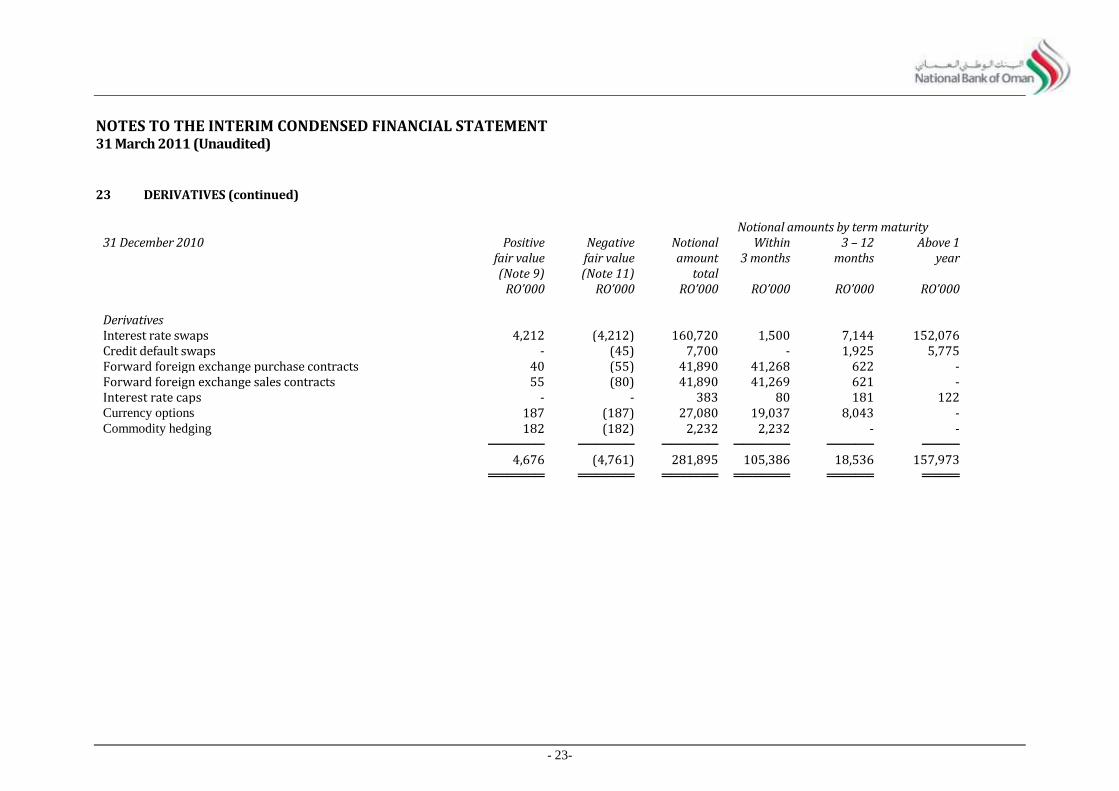
23 DERIVATIVES (continued)
Notional amounts by term maturity 31 December 2010 Positive
fair value Negative fair value
Notional amount
Within 3 months
3 – 12 months
Above 1 year
(Note 9) (Note 11) total RO’000 RO’000 RO’000 RO’000 RO’000 RO’000 Derivatives Interest rate swaps 4,212 (4,212) 160,720 1,500 7,144 152,076 Credit default swaps - (45) 7,700 - 1,925 5,775 Forward foreign exchange purchase contracts 40 (55) 41,890 41,268 622 - Forward foreign exchange sales contracts 55 (80) 41,890 41,269 621 - Interest rate caps - - 383 80 181 122 Currency options 187 (187) 27,080 19,037 8,043 - Commodity hedging 182 (182) 2,232 2,232 - - ────── ────── ────── ────── ───── ──── 4,676 (4,761) 281,895 105,386 18,536 157,973 ══════ ══════ ══════ ══════ ═════ ════