National Arthritis Month — May 2001 · 333 National Arthritis Month — May 2001 ... 25–34...
24
May 4, 2001 / Vol. 50 / No. 17 U.S. DEPARTMENT OF HEALTH & HUMAN SERVICES National Arthritis Month — May 2001 May is National Arthritis Month. Arthritis and other rheumatic conditions are the leading cause of disability in the United States, affecting approximately 43 million persons in 1997, and may affect 60 million by 2020 (1,2 ). Early symptom recognition is needed to achieve better control of arthritis. CDC, the Arthritis Foundation, and other organizations continue to implement the National Arthritis Action Plan: A Public Health Strategy (3 ) to promote progress toward reaching the arthritis-related national health objectives for 2010 (4 ). Additional information about arthritis, National Arthritis Month, Arthritis Action Day, the National Arthritis Action Plan, and local Arthritis Foundation programs and services is available from the Arthritis Foundation, telephone (800) 283-7800, or at http://www.arthritis.org.* References 1. CDC. Prevalence of disabilities and associated health conditions among adults—United States, 1999. MMWR 2001;50:120–5. 2. CDC. Arthritis prevalence and activity limitations—United States, 1990. MMWR 1994;43:433–8. 3. Arthritis Foundation, Association of State and Territorial Health Officials, and CDC. National arthritis action plan: a public health strategy. Atlanta, Georgia: Arthritis Foun- dation, 1999. 4. US Department of Health and Human Services. Healthy people 2010 (conference ed., 2 vols). Washington, DC: US Department of Health and Human Services, 2000. *References to sites of nonfederal organizations on the World-Wide Web are provided as a service to MMWR readers and do not constitute or imply endorsement of these organizations or their programs by CDC or the U.S. Department of Health and Human Services. CDC is not responsible for the content of pages found at these sites. 333 National Arthritis Month — May 2001 334 Prevalence of Arthritis — United States, 1997 337 Trends in Blood Lead Levels Among Children — Boston, Massachusetts, 1994–1999 340 National Estimates of Nonfatal Injuries Treated in Hospital Emergency Departments — United States, 2000
Transcript of National Arthritis Month — May 2001 · 333 National Arthritis Month — May 2001 ... 25–34...

May 4, 2001 / Vol. 50 / No. 17
U.S. DEPARTMENT OF HEALTH & HUMAN SERVICES
National Arthritis Month — May 2001
May is National Arthritis Month. Arthritis and other rheumatic conditions are theleading cause of disability in the United States, affecting approximately 43 millionpersons in 1997, and may affect 60 million by 2020 (1,2 ). Early symptom recognition isneeded to achieve better control of arthritis. CDC, the Arthritis Foundation, and otherorganizations continue to implement the National Arthritis Action Plan: A Public HealthStrategy (3 ) to promote progress toward reaching the arthritis-related national healthobjectives for 2010 (4 ).
Additional information about arthritis, National Arthritis Month, Arthritis ActionDay, the National Arthritis Action Plan, and local Arthritis Foundation programs andservices is available from the Arthritis Foundation, telephone (800) 283-7800, or athttp://www.arthritis.org.*References1. CDC. Prevalence of disabilities and associated health conditions among adults—United
States, 1999. MMWR 2001;50:120–5.2. CDC. Arthritis prevalence and activity limitations—United States, 1990. MMWR
1994;43:433–8.3. Arthritis Foundation, Association of State and Territorial Health Officials, and CDC.
National arthritis action plan: a public health strategy. Atlanta, Georgia: Arthritis Foun-dation, 1999.
4. US Department of Health and Human Services. Healthy people 2010 (conference ed.,2 vols). Washington, DC: US Department of Health and Human Services, 2000.
*References to sites of nonfederal organizations on the World-Wide Web are provided asa service to MMWR readers and do not constitute or imply endorsement of theseorganizations or their programs by CDC or the U.S. Department of Health and HumanServices. CDC is not responsible for the content of pages found at these sites.
333 National Arthritis Month — May 2001334 Prevalence of Arthritis —
United States, 1997337 Trends in Blood Lead Levels Among
Children — Boston, Massachusetts,1994–1999
340 National Estimates of Nonfatal InjuriesTreated in Hospital EmergencyDepartments — United States, 2000
334 MMWR May 4, 2001
Prevalence of Arthritis — United States, 1997
Arthritis and other rheumatic conditions (i.e., arthritis) are among the most prevalentdiseases in the United States (1 ) and the most frequent cause of disability (2 ). In 1985, anestimated 35 million persons were affected by arthritis (3 ); in 1990 (1 ), a study using abroader arthritis definition estimated that 38 million were affected. To better characterizethese conditions, CDC analyzed a variety of data for 1997 using common definitions fromthe International Classification of Diseases, Ninth Revision, Clinical Modification (ICD-9-CM). The findings of one such analysis in the National Health Interview Survey (NHIS)indicated that, in 1997, the prevalence of persons with arthritis had increased by approxi-mately 750,000 per year since 1990. Findings also support earlier projections that by2020, 60 million persons may be affected by arthritis and that the activities of 11.6 millionpersons may be limited by arthritis (1 ). More widespread implementation of existinginterventions may reduce the occurrence and progression of arthritis.
Prevalence rates were estimated from NHIS, a probability sample of the civilian,noninstitutionalized population in the United States (1 ). Data from the 1994–1995 NHIS,the most recent surveys using ICD-9 codes for health conditions, were used to estimatethe 1997 prevalence and physical activity limitations from arthritis. Estimates of arthritisprevalence rates were derived from a random sample of 36,057 (16.7%) of 218,646respondents who were asked about the presence during the 12 months preceding thesurvey of any of various musculoskeletal conditions and for details of these conditions.Each condition reported was assigned an ICD-9 code. Respondents with one or morecodes recommended by the National Arthritis Data Workgroup (NADW) to representarthritis* (1 ) were included in the analysis. Estimated rates of activity limitations attrib-uted to arthritis were based on responses from 218,646 respondents who were askedwhether they were limited in or prevented from working, housekeeping, or performingother activities as a result of a health condition(s) and, if so, did they attribute the limita-tion to arthritis.
To determine the number of persons affected or limited by arthritis, age- and sex-specific prevalence rates were calculated for the civilian, noninstitutionalized population,the referent population for NHIS, and were applied to the estimated 1997 U.S. population(4 ) by age and sex. Rates of disease burden for the total population were generated bytotaling the age- and sex-specific estimates; 95% confidence intervals were calculatedusing SUDAAN to account for NHIS’s complex survey design.
Results of these analyses indicated that an estimated 43 million persons had arthritisin 1997. All age groups were affected, including the working-age population, and ratesincreased with age. Females had higher arthritis rates than males overall and for eachage group (Table 1). An estimated eight million persons (3% of the U.S. population)reported arthritis as a major or contributing cause of activity limitations (Table 1). Ratesincreased with age and females had higher rates of activity limitations than males over-all and for each age group (Table 1).Reported by: Health Care and Aging Studies Br, Div of Adult and Community Health, NationalCenter for Chronic Disease Prevention and Health Promotion, CDC.
*Codes 95.6, 95.7, 98.5, 99.3, 136.1, 274, 277.2, 287.0, 344.6, 353.0, 354.0, 355.5, 357.1, 390, 391,437.4, 443, 446, 447.6, 696.0, 710–716, 719.0, 719.2–719.9, 720–721, 725–727, 728.0–728.3, 728.6–728.9, 729.0–729.1, and 729.4.

Vol. 50 / No. 17 MMWR 335
Arthritis — Continued
Editorial Note: The findings in this report indicate that from 1990 to 1997, the prevalenceof persons with arthritis and with activity limitations from arthritis increased substantially.Related analyses have documented 744,000 hospitalizations and 44 million ambulatory-care visits for arthritis in 1997 (5 ).
NADW’s definition of arthritis aims to include specific conditions that would be under-stood as arthritis (e.g., systemic lupus erythematosus, infectious arthritis, and carpaltunnel syndrome). Because many persons with arthritis may not consult a physician fortheir condition (6 ), NHIS self-reported data may provide a more accurate estimate of theprevalence and impact of arthritis than medical encounter-based data. In addition, thedata allow an understanding of the time trends in arthritis because the case definitionsand survey methods are the same as the 1990 estimates (1 ).
The findings in this study are subject to at least four limitations. First, the estimatesused self-reported data that were not confirmed by a physician. Second, to estimate thetotal burden of disease, the analysis used rates based on surveys of the civilian,noninstitutionalized population, which represents 98% of the total U.S. population butexcluded certain groups (e.g., the institutionalized elderly) that are likely to have different
TABLE 1. Estimated prevalence of self-reported arthritis and activity limitationsattributed to self-reported arthritis, by sex and age — United States, 1997
Persons with activityPersons with arthritis limitations caused by arthritis
Sex/Age No.* Rate† (95% CI§) No. Rate (95% CI)
Male¶ 16,367 12.5 (±1.3) 2,385 1.8 (±0.2)<24 400 0.8 (±0.2) 46 0.1 (±0.0)
25–34 1,080 5.5 (±1.0) 97 0.5 (±0.1)35–44 2,303 10.5 (±1.2) 289 1.3 (±0.2)45–54 3,190 19.4 (±1.9) 340 2.1 (±0.3)55–64 3,081 29.7 (±2.4) 537 5.2 (+0.6)65–74 3,684 44.5 (±3.0) 588 7.1 (±0.7)75–84 2,154 46.4 (±4.3) 371 8.0 (±1.0)
>85 477 42.1 (±8.7) 116 10.3 (±2.3)Female 26,777 19.5 (±1.5) 5,502 4.0 (±0.3)
<24 696 1.5 (±0.3) 69 0.2 (±0.0)25–34 1,708 8.6 (±1.0) 210 1.1 (±0.2)35–44 3,487 15.7 (±1.6) 482 2.2 (±0.2)45–54 4,761 27.7 (±2.1) 848 4.9 (±0.4)55–64 4,676 40.9 (±2.6) 1,076 9.4 (±0.6)65–74 5,348 52.2 (±2.6) 1,183 11.6 (±0.8)75–84 4,339 61.1 (±3.0) 1,074 15.1 (±1.0)
>85 1,762 63.3 (±5.9) 559 20.1 (±2.3)Total 43,147 16.1 (±1.4) 7,887 2.9 (±0.3)
* In thousands. To generate national estimates, 1994–1995 NHIS-estimated age- and sex-specific rates of the civilian, noninstitutionalized population were applied to the estimated1997 U.S. population of that age and sex.
† Per 100 persons.§ Confidence interval.¶ Male, female, and total population cases and rates estimated from totaling age- and sex-
specific cells. CIs estimated using age- and sex-specific rates to calculate lower and upperranges of age- and sex-specific cases, totaling, and then dividing by estimated population.
Source: 1994–1995 National Health Interview Survey.

336 MMWR May 4, 2001
Arthritis — Continued
rates. Third, data used intercensal projections for denominators; these projected de-nominators may be inaccurate. Finally, rate estimates were assumedunchanged from 1995 to 1997; however, this may be reasonable because age- and sex-specific prevalence rates were virtually unchanged from 1990 (1 ).
Further studies are needed to define the prevalence of specific types of arthritis, toprovide direct measures of arthritis prevalence, to determine the financial and societalimpact of arthritis, and to quantify the impact of arthritis at the state level and in health-care systems. Future analyses of NHIS data will need to accommodate the change fromICD-9–based code assignment of conditions to a symptom-based approach to the casedefinition of arthritis.
Interventions are available that may reduce the occurrence and progression ofarthritis. Measures to reduce obesity and avoid occupational and sports injuries can beexpected to reduce the risk for osteoarthritis of the knees (7 ). Other interventions includesupervised exercise programs, weight loss, and self-education courses such as theArthritis Self-Help Course, which has been shown to reduce pain and physician visits (8 ).Unless such interventions are implemented quickly and widely, national projections sug-gest that arthritis will become a larger public health problem (1 ). Health-care providers,policymakers, and the public health community need to plan for the impact of this growth.CDC funds 37 state health departments to develop or enhance prevention programs andto identify new approaches to improving the quality of life for persons affected by arthri-tis (9 ).References1. CDC. Arthritis prevalence and activity limitations—United States, 1990. MMWR 1994;43:433–8.2. CDC. Prevalence of disabilities and associated health conditions among adults—United
States, 1999. MMWR 2001;50:120–5.3. Lawrence RC, Hochberg MC, Kelsey JL, et al. Estimates of the prevalence of selected
arthritic and musculoskeletal diseases in the United States. J Rheumatol 1989;16:427–41.4. Population Division, US Census Bureau. Resident population estimates of the U.S. by age
and sex: April 1, 1990 to July 1, 1999. Available at http://www.census.gov/population/estimates/nation/intfile2-1.txt. Accessed November 29, 2000.
5. CDC. Impact of arthritis and other rheumatic conditions on the health-care system—UnitedStates, 1997. MMWR 1999;48:349–53.
6. Rao JK, Callahan LF, Helmick CG. Characteristics of persons with self-reported arthritis andother rheumatic conditions who do not see a doctor. J Rheumatol 1997;24:169–73.
7. Felson DT, Zhang Y, Anthony JM, Naimark A, Anderson JJ. Weight loss reduces the risk forsymptomatic knee osteoarthritis in women, the Framingham study. Ann Intern Med1992;116:535–9.
8. Lorig KR, Mazonson PD, Holman HR. Evidence suggesting that health education for self-management in patients with chronic arthritis has sustained health benefits while reduc-ing health care costs. Arthritis Rheum 1993;36:439–46.
9. Arthritis Foundation, Association of State and Territorial Health Officials, and CDC.National arthritis action plan: a public health strategy. Atlanta, Georgia: Arthritis Founda-tion, 1999.

Vol. 50 / No. 17 MMWR 337
Trends in Blood Lead Levels Among Children —Boston, Massachusetts, 1994–1999
Data from the National Health and Nutrition Examination Survey and national child-hood blood lead surveillance data from 19 states indicated that average blood lead levels(BLLs) in young children decreased during the late 1990s (1–3 ). The proportion of chil-dren tested who had BLLs >10 µg/dL declined from 10.5% in 1996 to 7.6% in 1998,although the proportion was higher in certain counties (3 ). To determine whether asimilar decline had occurred in Boston, Massachusetts, where a high proportion of chil-dren are tested each year, and whether any changes were similar in high- and low-riskneighborhoods, CDC, in collaboration with the Boston Childhood Lead Poisoning Preven-tion Program (BCLPPP) performed an analysis of BLLs among children aged 6–72 monthsin Boston during 1994–1999. The results indicate that BLLs in Boston declined during thisperiod, but because of the geographic variation in lead exposure, continued surveillancewill be necessary to eliminate childhood lead poisoning.
Private laboratories are mandated by Massachusetts law to report all blood lead testresults to the state laboratory. BCLPPP receives all blood lead test results for Bostonresidents from the state laboratory. Massachusetts lead screening regulations requirethat health-care providers screen children at age 9–12 months and annually up to age 48months. Children at high risk for lead poisoning are screened every 6 months during ages6 months–3 years and annually from ages 3–6 years. The proportion of children testedwho had BLLs >10 µg/dL and >20 µg/dL by fiscal year (FY) from July 1, 1993, throughJune 30, 1999, was computed. Children were counted once in each FY in which they hadat least one blood lead test, and the highest test result in a given FY was considered in theanalysis. Because sample contamination of a capillary test can result in a slight over-estimation of BLLs, only tests performed on venous samples with BLLs >10 µg/dL wereconsidered in the numerator, and tests using both venous and capillary samples wereused in the denominator (4,5 ). Massachusetts Institute for Social and EconomicResearch data were used to estimate the population of children aged <6 years for 1994and 1998 (4 ). U.S. census data from 1990 were used to characterize 16 Boston neighbor-hoods by ZIP code according to factors that may indicate risk for lead exposure (e.g.,percentage of pre-1950 housing, minority children, and children aged <6 years living inpoverty). Housing parcel information was obtained from tax assessor data.
The number of children aged 6–72 months screened annually in Boston declined 23%,from 35,304 (73.3% of the population aged <6 years) in 1994 to 27,233 (61.6% of popula-tion aged <6 years) in 1999 (Figure 1). However, screening among children aged 9–48months remained high (82% during FY 1999).
During 1994–1999, the overall prevalence of children with BLLs >10 µg/dL declined45%, from 9.3% (3265) to 5.1% (1398). The prevalence of children with BLLs >20 µg/dLdeclined 66%, from 1.5 % (545) to 0.5% (140) (Figure 1). Neighborhoods with prevalencerates in the upper tertile in 1994 had a higher percentage of children living in poverty,Spanish-speaking households, and vacant parcels than neighborhoods with lower preva-lence rates (Table 1). Overall, about two thirds of houses were built before 1950, and nosubstantial differences were found in the proportion of houses built before 1950 betweenthe highest and lowest risk neighborhoods. The prevalence of elevated BLLs declinedfrom 1994 to 1999 in all 16 neighborhoods, with the highest absolute average decline

338 MMWR May 4, 2001
Blood Lead Levels — Continued
(4.8%) in neighborhoods with the highest prevalence in 1994. In 1999, six high-risk neigh-borhoods accounted for 80% of children with elevated BLLs, approximately the same asin 1994 (83%).
The decline in prevalence of elevated BLLs during 1994–1999 was similar across agegroups: 51% among children aged <12 months, 42% among children aged 12–36 months,and 46% among children aged 36–72 months.Reported by: S Franco, MS, Childhood Lead Poisoning Prevention Program, Boston PublicHealth Commission, Boston, Massachusetts. Lead Poisoning Prevention Br, Div of Environ-mental Hazards and Health Effects, National Center for Environmental Health, CDC.
TABLE 1. Risk levels for elevated blood lead levels (BLLs) in 16 neighborhoods, byrisk factor — Boston, Massachusetts, 1994–1999
Average %
Absolute % children
change in children aged <6
Average average aged <6 years
prevalence prevalence years living Average %
Neighborhood of BLLs of BLLs with BLLs below Average % % Spanish-
prevalence >10 µg/dL >10 µg/dL >10 µg/dL poverty pre-1950 vacant % speaking
tertile* 1994 1999 1994–1999 1999 level housing parcels minorities households
High 11.0 6.2 4.8 79.8% 31.1% 67.6% 63.0% 21.0% 12.1%Medium 5.5 3.0 1.5 18.6% 24.8% 65.2% 25.0% 9.4% 8.4%Low 2.5 1.2 1.3 1.6% 22.5% 66.2% 12.0% 3.5% 4.4%* Neighborhood risk was based on the 1999 average prevalence of BLLs >10µg/dL in 16 neighborhoods.
FIGURE 1. Number of children tested for blood lead and prevalence of these childrenwith elevated blood lead levels (BLLs), by year — Boston, Massachusetts, 1994–1999
1994 1995 1996 1997 1998 1999
Year
0
5
10
15
20
25
30
35
40
Nu
mb
er (
Th
ou
san
ds)
0
2
4
6
8
10
12
14
16
18
20
Children TestedPrevalence of BLLs 10 g/dL > µPrevalence of BLLs 20 g/dL> µ
Prevalence

Vol. 50 / No. 17 MMWR 339
Blood Lead Levels — Continued
Editorial Note: The findings in this report indicate that the prevalence of elevated BLLsin Boston declined consistently during 1994–1999, similar to declines reported from 19states (3 ). Building of new houses and remodeling of older houses that removed leadpainted building components, such as windows, may have contributed to this decrease(6 ). In addition, under the Massachusetts Lead Law*, BCLPPP has required propertyowners to correct lead paint hazards in dwellings occupied by children aged <6 years.Since 1985, approximately 6800 de-leading code enforcement activities have occurredin Boston, and the law has encouraged many additional property owners to comply withde-leading activities (BCLPPP, unpublished data, 2000).
Although BLLs have declined in all Boston neighborhoods, levels remained higher in1999 in the areas with the highest levels in 1994. These high-risk neighborhoods arecharacterized by higher proportions of minority children, children living in poverty, andvacant properties; a high proportion of old housing, likely to have leaded paint, is found inall neighborhoods. Low socioeconomic status and associated deterioration of older hous-ing are major contributors to lead exposure in Boston (7 ).
The findings in this report are subject to at least four limitations. First, reporting ofblood lead test results varied among different laboratories; therefore, results may not beuniform. Second, children at high risk for blood lead poisoning also may have high screen-ing rates. Third, this analysis does not include lead exposure measures associated withthe children in the study; as a result, the prevalence rates in the population screened maynot be representative of all children in Boston. Finally, the use of older housing anddemographic information (i.e., census and tax assessor data) may not reflect changes insome Boston neighborhoods.
Approximately 1300 children in Boston are identified annually with BLLs >10 µg/dL,levels high enough to adversely affect cognitive development and behavior. One of thenational health objectives for 2010 is to eliminate childhood lead poisoning (8 ). Becauseof the substantial geographic variation in lead exposure, continued use of blood lead datafor surveillance purposes will be essential in Boston and other jurisdictions to focusresources on high-risk neighborhoods and to achieve the health objective.References1. CDC. Blood lead levels—United States, 1988–1991. MMWR 1994;43:545–8.2. CDC. Update: blood lead levels—United States, 1991–1994. MMWR 1997;46:141–6.3. CDC. Blood lead levels in young children—United States and selected states, 1996–1999.
MMWR 2000;49:1133–7.4. CDC. Preventing lead poisoning in young children. Atlanta, Georgia: US Department of
Health and Human Services, CDC, 1991.5. CDC. Screening young children for lead poisoning: guidance for state and public health
officials. Atlanta, Georgia: US Department of Health and Human Services, CDC, 1997.6. Public Health Service. Strategic plan for the elimination of childhood lead poisoning.
Washington, DC: US Department of Health and Human Services, Public Health Service,1991.
7. Clark CS, Bornschein RL, Succop P, Que Hee SS, Hammond PB, Peace B. Condition and typeof housing as an indicator of potential environmental lead exposure and pediatric bloodlead levels. Environ Res 1985;38:46–53.
8. US Department of Health and Human Services. Healthy people 2010 (conference ed, 2 vols).Washington, DC: US Department of Health and Human Services, 2000.
*105 Code of Massachusetts Regulations 460.700. .

340 MMWR May 4, 2001
National Estimates of Nonfatal Injuries Treated inHospital Emergency Departments — United States, 2000
On July 1, 2000, the Consumer Product Safety Commission’s (CPSC) National Elec-tronic Injury Surveillance System (NEISS) was expanded to collect data on all types andexternal causes of nonfatal injuries and poisonings treated in U.S. hospital emergencydepartments (EDs). This augmented system, called NEISS All Injury Program (NEISS-AIP), is a collaborative effort between CDC’s National Center for Injury Prevention andControl and CPSC. This report presents annualized national estimates using NEISS-AIPdata obtained during July 1–September 30, 2000, which indicate that approximately31,000,000 persons were treated for nonfatal injuries in EDs in 2000. Although most ofthe injuries were unintentional, an estimated 1,973,000 were violence-related. Data fromNEISS-AIP can be used for monitoring temporal trends in nonfatal injuries by mechanismand intent of injury.
NEISS-AIP data were collected from 66 of the 100 NEISS hospitals, which wereselected as a stratified probability sample of all hospitals in the United States and itsterritories with a minimum of six beds and a 24-hour ED (1,2 ). The 66 NEISS-AIP hospi-tals are a nationally representative sample of U.S. hospital EDs. NEISS-AIP hospitalsprovide data on approximately 600,000 injury- and consumer product-related ED caseseach year. Data from these cases are weighted by the inverse of the probability ofselection to provide national estimates (1 ). Annualized estimates were based on weighteddata for 126,547 nonfatal injury-related ED visits during July 1–September 30, 2000.Each sample was weighted by four and then these adjusted weights were added toprovide annualized estimates for the overall population and population subgroups (i.e.,age, sex, and race/ethnicity*). SUDAAN was used to account for the complex sampledesign (1 ).
Nonfatal injuries and poisonings were defined as bodily harm resulting from acuteexposure to an external force or substance (i.e., mechanical, thermal, electrical, chemi-cal, or radiant) and near drowning, including unintentional and violence-related causes.Cases were excluded if 1) the principal diagnosis was an illness, pain only, psychologicalharm (e.g., anxiety and depression) only, contact dermatitis associated with exposure toconsumer products (e.g., body lotions, detergents, and diapers) and plants (e.g., poisonivy), or unknown; or 2) the ED visit was for adverse effects of therapeutic drugs or ofsurgical and medical care (3 ).
All injuries were classified for intent of injury (i.e., unintentional, assault, self harm,and legal intervention) and mechanism of injury (i.e., fall, struck by/against, motor-vehicle-occupant–related incident, cut/pierce, and fire/burn) (4 ). Unintentional includedunintended injuries and injuries in which no indication of intent to harm was documentedin the ED record. Assault included suspected and confirmed injuries from interpersonalviolent events (e.g., injuries to victims, innocent bystanders, police, and perpetrators).Self harm included suspected and confirmed intentionally self-inflicted injuries. Legalintervention included injuries inflicted by police or other legal authorities (e.g., securityguards) while acting in the line of duty. The mechanism of injury represents the precipi-tating mechanism that initiated the chain of events leading to the injury, which is similar
*On the ED record, often only one entry is available for race or ethnicity. The classificationscheme for this report assumed that most white Hispanics probably were recorded on theED record as Hispanics and most black Hispanics probably were recorded as black.

Vol. 50 / No. 17 MMWR 341
to the underlying cause for injury-related death. Mechanisms of injury were classified bytrained coders into recommended major external cause-of-injury groupings (3,5 ) usingdefinitions consistent with International Classification of Diseases, Ninth Revision, Clini-cal Modifications (ICD-9-CM) external cause coding guidelines (6 ). Because of limitedresources, ICD-9-CM external cause-of-injury codes were not assigned.
During 2000, persons with nonfatal injuries were treated in EDs at an estimated rateof 11,188 per 100,000 population. The nonfatal injury rate was approximately 40% higherfor males than for females (Table 1). Males aged 15–19 years had the highest nonfatalinjury rate (20,528 per 100,000 population) (Table 1). Of the estimated 31,000,000 nonfa-tal injuries, 93.6% were unintentional and the remaining 6.4% were violence-related,including assaults (5.5%), intentional self harm (0.7%), and legal interventions (0.2%)(Table 2). Falls were the leading cause of unintentional nonfatal injuries, accounting for anestimated 7,021,000 (24.4%) of unintentional injury-related ED visits. An estimated3,299,000 persons were injured as an occupant in a motor vehicle (Table 2), of which95.2% were traffic-related. Injuries to motor-vehicle occupants were the leading cause ofunintentional nonfatal injury-related ED visits for females aged 15–24 years. The non-fatal injury rate for pedal cyclists was 2.9 times higher for males than for females (Table2). An estimated 389,000 persons were treated in EDs for dog bites (Table 2).
Of an estimated 1,973,000 violence-related nonfatal injuries, 66% were physicalassaults that included being hit with an object or by another person (Table 2). Sexualassault was the fourth leading cause of violence-related, nonfatal injury-related ED vis-its; the nonfatal rate of sexual assault for females was 4.8 times higher than that formales (Table 2). Approximately 150,000 persons were treated in EDs for poisoning-related suicide attempts and the rate of intentionally self-inflicted, nonfatal poisonings forfemales was 1.6 times that for males (Table 2).Reported by: Office of Statistics and Programming, National Center for Injury Prevention andControl, CDC.
Editorial Note: The findings in this report indicate that, in 2000, approximately 10% ofU.S. residents were treated for nonfatal injuries in EDs. On the basis of NEISS-AIP andNational Vital Statistics System data (7 ), for every injury-related death in the UnitedStates, approximately 200 persons were treated for nonfatal injuries in EDs. Most (93.6%)of these injuries were unintentional; however, approximately 2 million persons weretreated for violence-related injuries. NEISS-AIP will provide a national data source forfurther characterizing these injuries by unintentional and violence-related causes andhelping to identify those at risk.
NEISS-AIP will provide additional data on the characteristics and circumstances ofinjuries that are treated in EDs. In addition to age, race/ethnicity, sex, intent of injury, andmechanism of injury, data are being collected on principal diagnosis, primary body partaffected, locale where the injury occurred, work-relatedness, consumer products in-volved, and disposition at ED discharge. For transport-related injuries, data are beingcollected on traffic-relatedness and on motor-vehicle occupant status (e.g., driver, pas-senger, boarding, and alighting) at the time of the injury. For assaults, data are beingcollected on the relationship of the perpetrator to the injured person (e.g., spouse/part-ner, parent, other relative, friend, and stranger) and the context (e.g., altercation, rob-bery, sexual assault, drug-related, and gang-related). In addition, on the basis of informa-tion in the ED record, a brief narrative is being recorded that provides further detailsabout the circumstances of the incident.
Nonfatal Injuries — Continued

342 MMWR May 4, 2001
Annualized national estimates of NEISS-AIP data for July 1–September 30, 2000, arecomparable to estimates based on other surveys. Data for 1998 from the National Hos-pital Ambulatory Medical Care Survey (NHAMCS), which collects data on all types of EDvisits and focuses primarily on health-care utilization, identified an average annual esti-mate of 37,111,000 injury-related ED visits (8 ). NHAMCS used an injury definition similarto that of NEISS AIP. However, the NHAMCS estimate includes both initial ED visits andrevisits for the same injury; the NEISS-AIP estimate includes only initial ED visits. Datafrom a 3-month NEISS All Injury Pilot Study conducted during May 1–July 31, 1997, of anationally representative sample of 21 NEISS hospitals identified an annualized estimateof 29,060,000 injuries (9 ). The distributions of injuries by intent and mechanism of injurywere similar among all three data sources. For example, the percentage of injury-relatedED visits that were violence-related was 5.2% for NHAMCS, 5.6% for the NEISS All InjuryPilot Study, and 6.4% for NEISS-AIP. The percentage of violence-related cases for NEISS-AIP might be expected to be highest because data were obtained for ED visits duringJuly–September when assault rates are higher than during other months of the year(10 ).
The findings in this report are subject to at least three limitations. First, this systemprovides only national estimates and does not allow for estimates by region, state, orlocal jurisdiction. Second, data are based solely on information provided in the ED recordand are not linked to criminal justice, police reports, or other data sources to supplementor verify the cause and intent of injury. Finally, because the estimates were derived from3 months of data, they do not account for cause-specific seasonal differences in thenumber of injuries (10 ).
Hospital audits conducted by CPSC indicate that NEISS hospital coders identify ap-proximately 90% of all reportable product-related cases (A. McDonald, CPSC, personalcommunication, 2001). NEISS also has the capacity to conduct special studies to collectmore details about specific types and causes of injury, and in-depth follow-up interviewsfor case studies of injury circumstances and consumer product involvement.References
1. US Consumer Product Safety Commission. The NEISS sample: design and implementa-tion. In: Kessler E, Schroeder T, eds. Washington, DC: US Consumer Product SafetyCommission, 2000.
2. US Consumer Product Safety Commission. NEISS coding manual 2000. Washington, DC:US Consumer Product Safety Commission, 2000.
3. CDC. Recommended framework for presenting injury mortality data. MMWR 1997;46(no.RR-14).
4. CDC. A training module for coding mechanism and intent of injury for the NEISS All InjuryProgram. In: Annest JL, Pogostin CL, eds. Atlanta, Georgia: US Department of Health andHuman Services, CDC, National Center for Injury Prevention and Control, 2000.
5. Annest JL, Pogostin CL. CDC’s short version of the ICECI (International Classification ofExternal Causes of Injury): a pilot study. Report to the World Health Organization Collabo-rating Centers on the Classification of Disease. Atlanta, Georgia: US Department of Healthand Human Services, CDC, National Center for Injury Prevention and Control, 2000.
6. US Department of Health and Human Services. Generic ICD-9-CM. Hospital version 1999.Reno, Nevada: Channel Publishing LTD, 1998.
7. Murphy SL. Deaths: final data for 1998. Natl Vital Stat Rep 2000;48:1–105.8. McCaig LF. National Hospital Ambulatory Medical Care Survey: 1998 emergency depart-
ment summary. Advance data from vital and health statistics; no. 313. Hyattsville, Mary-land: US Department of Health and Human Services, CDC, National Center for HealthStatistics, 2000.
Nonfatal Injuries — Continued

Vo
l. 50
/N
o. 1
7M
MW
R3
43
No
nfatal In
juries —
Co
ntin
ued
TABLE 1. Estimated number of nonfatal injuries treated in hospital emergency departments, by sex, age, and race/ethnicity — United States, 2000
Male Female Both sexes*
Characteristic No. %† Rate§ (95% CI¶) No. % Rate (95% CI) No. % Rate (95% CI)
Age group (yrs)
0–4 1,509,016 8.6 15,582 (12,851–18,313) 1,076,466 8.2 11,671 ( 9,856– 13,485) 2,587,021 8.4 13,682 (11,425–15,940)5–9 1,444,411 8.2 14,162 (11,844–16,480) 966,869 7.3 9,966 ( 8,460– 11,472) 2,411,708 7.8 12,119 (10,222–14,015)
10–14 1,722,428 9.8 16,738 (14,268–19,209) 973,302 7.4 9,941 ( 8,521– 11,360) 2,696,014 8.8 13,425 (11,501–15,350)15–19 2,078,167 11.9 20,528 (17,772–23,284) 1,248,809 9.5 12,962 (11,044–14,879) 3,327,434 10.8 16,841 (14,565–19,117)20–24 1,880,497 10.7 20,451 (17,085–23,817) 1,190,749 9.0 13,281 (11,242–15,319) 3,071,245 10.0 16,911 (14,284–19,538)25–34 3,065,461 17.5 16,427 (14,233–18,622) 2,033,962 15.4 10,845 ( 9,500– 12,190) 5,099,967 16.6 13,630 (11,897–15,364)35–44 2,646,100 15.1 11,927 (10,420–13,433) 1,953,457 14.8 8,691 ( 7,679– 9,704) 4,600,868 15.0 10,302 ( 9,081– 11,522)45–54 1,508,207 8.6 8,318 ( 7,293– 9,343) 1,352,626 10.2 7,148 ( 6,323– 7,974) 2,861,165 9.3 7,722 ( 6,817– 8,626)55–64 728,385 4.2 6,353 ( 5,519– 7,187) 713,436 5.4 5,697 ( 4,938– 6,456) 1,441,821 4.7 6,011 ( 5,232– 6,790)65–74 449,200 2.6 5,426 ( 4,546– 6,305) 595,003 4.5 5,963 ( 5,060– 6,866) 1,044,627 3.4 5,722 ( 4,879– 6,564)75–84 347,636 2.0 7,084 ( 5,876– 8,292) 653,379 4.9 8,791 ( 7,252– 10,329) 1,001,015 3.3 8,112 ( 6,746– 9,478)
>85 153,255 0.9 12,615 ( 9,825–15,406) 443,077 3.4 14,415 (11,379–17,451) 596,565 1.9 13,911 (11,038–16,784)Unknown 4,389 0.0 — — 2,284 0.0 — — 7,135 0.0 — —
Race/Ethnicity**
White,non-Hispanic 9,852,505 56.2 — — 7,430,883 56.3 — — 17,285,964 56.2 — —
Black 2,548,498 14.5 — — 2,144,643 16.2 — — 4,693,939 15.3 — —Hispanic 1,361,627 7.8 — — 791,211 6.0 — — 2,152,838 7.0 — —Other,
non-Hispanic 500,451 2.9 — — 406,156 3.1 — — 907,035 3.0 — —Unknown 3,274,071 18.7 — — 2,430,525 18.4 — — 5,706,809 18.6 — —
Total 17,537,152 100.0 13,054 (11,453–14,656) 13,203,419 100.0 9,399 ( 8,321– 10,477) 30,746,586 100.0 11,188 ( 9,875– 12,501)
* Includes weighted data for persons of unknown sex.† Percentages may not total 100% because of rounding.§ Per 100,000 population.¶ Confidence interval.
** Black includes Hispanic and non-Hispanic; Hispanic excludes black Hispanic. Rates are not presented because of the relatively high percentage of unknowns.

34
4M
MW
RM
ay
4, 2
00
1
No
nfatal In
juries —
Co
ntin
ued
TABLE 2. Estimated number of nonfatal injuries treated in hospital emergency departments (EDs), by sex, intent, andmechanism of injury — United States, 2000
Male Female Both sexes**
Intent/Mechanism* No. %† Rate§ (95% CI¶) No. % Rate (95% CI) No. % Rate (95% CI)
UNINTENTIONALFall 3,323,673 19.0 2,474 ( 2,169– 2,779) 3,696,934 28.0 2,632 ( 2,320– 2,944) 7,021,456 22.8 2,555 ( 2,256– 2,854)Struck by/
against 3,590,362 20.5 2,673 ( 2,310– 3,036) 1,972,864 14.9 1,404 ( 1,235– 1,574) 5,565,289 18.1 2,025 ( 1,767– 2,283)Transport-related 2,964,384 16.9 2,207 ( 1,855– 2,558) 2,386,488 18.1 1,699 ( 1,399– 1,999) 5,352,798 17.4 1,948 ( 1,627– 2,269)
Motor-vehicleoccupant 1,561,790 8.9 1,163 ( 932– 1,393) 1,736,193 13.1 1,236 ( 980– 1,492) 3,298,869 10.7 1,200 ( 959– 1,441)
Motorcyclist 228,499 1.3 170 ( 128– 212) 37,638 0.3 27 ( 18– 36) 266,598 0.9 97 ( 73– 121)Pedal cyclist 708,774 4.0 528 ( 419– 636) 258,031 2.0 184 ( 150– 217) 967,382 3.1 352 ( 285– 419)Pedestrian 108,914 0.6 81 ( 61– 101) 67,306 0.5 48 ( 36– 59) 176,220 0.6 64 ( 49– 79)Other transport 356,409 2.0 265 ( 222– 309) 287,320 2.2 205 ( 169– 240) 643,729 2.1 234 ( 197– 271)
Overexertion 1,782,534 10.2 1,327 ( 1,122– 1,532) 1,461,168 11.1 1,040 ( 874– 1,206) 3,243,702 10.5 1,180 ( 999– 1,361)Cut/pierce/stab 1,585,313 9.0 1,180 ( 1,007– 1,353) 842,484 6.4 600 ( 514– 685) 2,428,021 7.9 884 ( 758– 1,009)Other bite/sting 760,423 4.3 566 ( 475– 657) 755,387 5.7 538 ( 457– 618) 1,515,810 4.9 552 ( 471– 632)Foreign body 480,180 2.7 357 ( 300– 415) 271,336 2.1 193 ( 163– 224) 751,516 2.4 273 ( 233– 314)Fire/burn 316,218 1.8 235 ( 200– 271) 246,804 1.9 176 ( 148– 203) 563,022 1.8 205 ( 175– 235)Dog bite 220,775 1.3 164 ( 134– 195) 167,949 1.3 120 ( 95– 144) 388,724 1.3 141 ( 115– 168)Machinery 279,570 1.6 208 ( 166– 250) 52,413 0.4 37 ( 27– 48) 331,983 1.1 121 ( 96– 145)Poisoning 164,480 0.9 122 ( 91– 154) 120,203 0.9 86 ( 66– 105) 284,683 0.9 104 ( 79– 128)Natural
environmental 62,650 0.4 47 ( 14– 79) 27,864 0.2 20 ( 9– 31) 90,514 0.3 33 ( 14– 52)Inhalation/
suffocation 14,663 0.1 11 ( 8– 14) 16,883 0.1 12 ( 7– 17) 31,546 0.1 11 ( 8– 15)BB/pellet gunshot 15,831 0.1 12 ( 8– 15) 2,787†† 0.0†† —†† —†† 18,651 0.1 7 ( 5– 9)Firearm gunshot 14,907 0.1 11 ( 6– 16) 1,919†† 0.0†† —†† —†† 16,827 0.1 6 ( 4– 9)Near drowning/
submersion 8,018 0.0 6 ( 3– 9) 2,275†† 0.0†† —†† —†† 10,293 0.0 4 ( 2– 6)Other specified 232,279 1.3 173 ( 141– 205) 169,729 1.3 121 ( 96– 146) 402,008 1.3 146 ( 119– 173)Unknown/
unspecified 534,055 3.0 398 ( 290– 505) 221,704 1.7 158 ( 118– 197) 756,251 2.5 275 ( 204– 346)Total 16,350,316 93.2 12,171 (10,666–13,676) 12,417,190 94.0 8,839 ( 7,814– 9,865) 28,773,094 93.6 10,470 ( 9,230– 11,710)

Vo
l. 50
/N
o. 1
7M
MW
R3
45
No
nfatal In
juries —
Co
ntin
ued
VIOLENCE-RELATEDAssault
Sexual assault 10,683 0.1 8 ( 4– 12) 53,797 0.4 38 ( 20– 57) 64,480 0.2 23 ( 12– 35)Other assault 1,027,264 5.9 765 ( 596– 933) 593,598 4.5 423 ( 322– 523) 1,621,290 5.3 590 ( 459– 721)Struckby/against 803,334 4.6 598 ( 478– 718) 503,887 3.8 359 ( 275– 443) 1,307,649 4.3 476 ( 377– 575)
Cut/pierce 93,975 0.5 70 ( 41– 99) 26,414 0.2 19 ( 9– 29) 120,388 0.4 44 ( 25– 63)Other bite/sting 30,221 0.2 22 ( 14– 31) 24,987 0.2 18 ( 12– 23) 55,209 0.2 20 ( 14– 26)Firearm gunshot 41,499 0.2 31 ( 12– 49) 4,133†† 0.0†† —†† —†† 45,632 0.1 17 ( 7– 27)Other specified 47,916 0.3 36 ( 27– 44) 30,896 0.2 22 ( 17– 27) 78,812 0.3 29 ( 23– 34)Unknown/unspecified 10,319 0.1 8 ( 4– 11) 3,281†† 0.0†† —†† —†† 13,600 0.0 5 ( 3– 7)
Total 1,037,947 5.9 773 ( 602– 943) 647,396 4.9 461 ( 349– 572) 1,685,770 5.5 613 ( 476– 751)
Self harm
Poisoning 57,065 0.3 42 ( 28– 57) 92,833 0.7 66 ( 42– 90) 149,898 0.5 55 ( 36– 73)Cut/pierce 28,845 0.2 21 ( 13– 30) 25,385 0.2 18 ( 11– 25) 54,231 0.2 20 ( 13– 27)Other specified 13,129 0.1 10 ( 6– 13) 7,464 0.1 5 ( 2– 8) 20,593 0.1 7 ( 5– 10)Unknown/unspecified 428†† 0.0†† —†† —†† 428†† 0.0†† —†† —†† 855†† 0.0†† —†† —††
Total 99,467 0.6 74 ( 51– 97) 126,110 1.0 90 ( 60– 120) 225,577 0.7 82 ( 56– 108)
Legal intervention 49,422 0.3 37 ( 24– 50) 12,723 0.1 9 ( 5– 13) 62,145 0.2 23 ( 15– 30)Total 1,186,836 6.8 883 ( 697– 1069) 786,228 6.0 560 ( 440– 680) 1,973,492 6.4 718 ( 568– 869)
TOTAL 17,537,152 100.0 13,054 (11,453–14,656) 13,203,419 100.0 9,399 ( 8,321– 10,477) 30,746,586 100.0 11,188 ( 9,875– 12,501)
* Unintentional includes unintended injuries and injuries in which no indication of intent to harm was documented in the ED record; assault includes suspected andconfirmed injuries from interpersonal violent events; self harm includes suspected and confirmed intentionally self-inflicted injuries; legal intervention includesinjuries inflicted by police or other legal authorities while acting in the line of duty.
† Percentages may not total 100% because of rounding.§ Per 100,000 population.¶ Confidence interval.
**Includes weighted data for persons of unknown sex.†† National estimate might be unstable because it is based on <20 cases or the coefficient of variation is >30%.

346 MMWR May 4, 2001
Nonfatal Injuries — Continued
9. Quinlan KP, Thompson MP, Annest JL, et al. Expanding the National Electronic InjurySurveillance System to monitor all nonfatal injuries treated in US hospital emergencydepartments. Annals Emerg Med 1999;34:637–45.
10. Gotsch KE, Annest JL, Mercy JA, Ryan GW. Surveillance for fatal and nonfatal firearm-related injuries—United States, 1993–1998. In: CDC surveillance summaries (March). MMWR2001;50(no. SS-2).
Vol. 50 / No. 17 MMWR 347
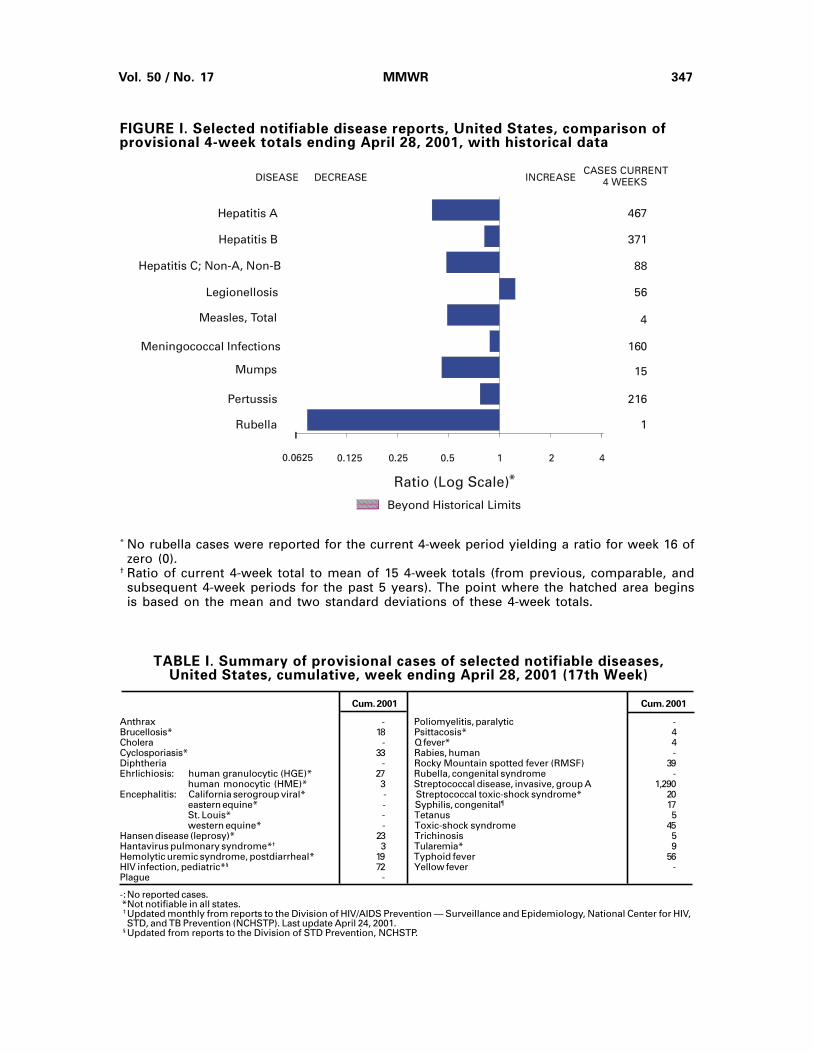
FIGURE I. Selected notifiable disease reports, United States, comparison ofprovisional 4-week totals ending April 28, 2001, with historical data
* No rubella cases were reported for the current 4-week period yielding a ratio for week 16 ofzero (0).
† Ratio of current 4-week total to mean of 15 4-week totals (from previous, comparable, andsubsequent 4-week periods for the past 5 years). The point where the hatched area beginsis based on the mean and two standard deviations of these 4-week totals.
TABLE I. Summary of provisional cases of selected notifiable diseases,United States, cumulative, week ending April 28, 2001 (17th Week)
Cum. 2001 Cum. 2001
Anthrax - Poliomyelitis, paralytic -Brucellosis* 18 Psittacosis* 4Cholera - Q fever* 4Cyclosporiasis* 33 Rabies, human -Diphtheria - Rocky Mountain spotted fever (RMSF) 39Ehrlichiosis: human granulocytic (HGE)* 27 Rubella, congenital syndrome -
human monocytic (HME)* 3 Streptococcal disease, invasive, group A 1,290Encephalitis: California serogroup viral* - Streptococcal toxic-shock syndrome* 20
eastern equine* - Syphilis, congenital¶ 17St. Louis* - Tetanus 5western equine* - Toxic-shock syndrome 45
Hansen disease (leprosy)* 23 Trichinosis 5Hantavirus pulmonary syndrome*† 3 Tularemia* 9Hemolytic uremic syndrome, postdiarrheal* 19 Typhoid fever 56HIV infection, pediatric*§ 72 Yellow fever -Plague -
-:No reported cases. *Not notifiable in all states. † Updated monthly from reports to the Division of HIV/AIDS Prevention — Surveillance and Epidemiology, National Center for HIV,
STD, and TB Prevention (NCHSTP). Last update April 24, 2001. § Updated from reports to the Division of STD Prevention, NCHSTP.
DISEASE DECREASE INCREASECASES CURRENT
4 WEEKS
Ratio (Log Scale)*
Beyond Historical Limits
4210.50.250.125
467
371
88
56
4
160
15
216
1
Hepatitis A
Hepatitis B
Hepatitis C; Non-A, Non-B
Legionellosis
Measles, Total
Mumps
Pertussis
Rubella
Meningococcal Infections
0.0625

348 MMWR May 4, 2001
TABLE II. Provisional cases of selected notifiable diseases, United States,weeks ending April 28, 2001, and April 29, 2000 (17th Week)
Cum. Cum. Cum. Cum. Cum. Cum. Cum. Cum. Cum. Cum.2001§ 2000 2001 2000 2001 2000 2001 2000 2001 2000
AIDS Chlamydia† Cryptosporidiosis NETSS PHLIS
Reporting Area
Escherichia coli O157:H7*
UNITED STATES 11,921 12,725 197,475 219,929 445 457 320 466 209 375
NEW ENGLAND 469 789 7,528 7,568 18 27 38 42 32 44Maine 14 14 393 398 2 4 5 3 4 3N.H. 13 11 359 352 - 1 7 4 6 4Vt. 10 1 194 189 6 8 2 1 - 2Mass. 271 526 3,328 3,274 5 7 17 20 15 16R.I. 40 33 945 770 3 2 1 - 2 -Conn. 121 204 2,309 2,585 2 5 6 14 5 19
MID. ATLANTIC 2,254 3,159 16,811 21,105 46 92 31 63 15 56Upstate N.Y. 97 157 N N 21 24 24 56 10 38N.Y. City 1,028 1,930 8,970 8,968 23 63 - 4 1 2N.J. 635 628 1,374 4,318 1 1 7 3 4 7Pa. 494 444 6,467 7,819 1 4 N N - 9
E.N. CENTRAL 926 1,259 27,689 38,276 137 95 66 88 26 29Ohio 167 172 2,898 10,074 35 17 22 17 10 9Ind. 85 97 4,873 4,226 17 5 12 10 2 10Ill. 433 803 7,366 10,602 - 15 9 29 7 -Mich. 189 141 9,675 7,981 36 12 14 12 - 5Wis. 52 46 2,877 5,393 49 46 9 20 7 5
W.N. CENTRAL 243 271 10,034 12,412 21 25 26 67 24 68Minn. 47 47 1,906 2,665 - 4 8 10 12 30Iowa 24 23 1,325 1,406 11 6 4 13 2 7Mo. 117 123 3,195 4,241 5 6 5 25 6 16N. Dak. 1 - 323 308 - 1 - 2 1 4S. Dak. - 3 611 583 2 3 3 2 1 2Nebr. 16 19 778 1,167 3 2 - 10 - 6Kans. 38 56 1,896 2,042 - 3 6 5 2 3
S. ATLANTIC 3,720 3,357 42,100 40,349 98 59 39 38 20 32Del. 72 63 987 989 1 1 - 1 - -Md. 436 388 4,043 3,919 20 4 2 6 - 1D.C. 297 264 1,206 1,062 7 - - - U UVa. 270 237 5,544 4,951 6 3 6 8 5 9W. Va. 28 19 755 682 - - 1 2 - 2N.C. 190 169 6,923 6,635 14 6 20 8 9 2S.C. 250 256 4,130 3,523 - - 2 2 2 1Ga. 392 355 8,214 8,027 30 32 2 3 2 8Fla. 1,785 1,606 10,298 10,561 20 13 6 8 2 9
E.S. CENTRAL 682 596 15,410 16,387 12 15 13 27 8 21Ky. 121 80 2,832 2,563 1 - 1 10 2 8Tenn. 220 259 4,756 4,665 2 2 7 10 5 11Ala. 174 163 4,183 5,234 4 7 5 1 - -Miss. 167 94 3,639 3,925 5 6 - 6 1 2
W.S. CENTRAL 1,296 1,097 31,021 32,949 7 20 21 29 23 42Ark. 81 68 2,639 1,901 2 1 1 4 - 3La. 331 213 5,624 6,027 3 2 - 2 9 8Okla. 67 67 3,205 2,930 2 1 7 4 6 3Tex. 817 749 19,553 22,091 - 16 13 19 8 28
MOUNTAIN 510 444 10,047 12,905 39 28 38 38 22 25Mont. 11 6 650 543 3 1 3 8 - -Idaho 7 9 554 632 5 3 5 4 - 3Wyo. 1 2 260 257 - 3 1 3 - 2Colo. 109 101 912 3,675 13 8 17 14 12 7N. Mex. 40 50 1,571 1,598 8 1 2 1 - 2Ariz. 202 141 4,153 4,140 1 3 6 6 5 8Utah 48 48 318 820 9 7 3 1 4 1Nev. 92 87 1,629 1,240 - 2 1 1 1 2
PACIFIC 1,821 1,753 36,835 37,978 67 96 48 74 39 58Wash. 201 196 4,484 4,261 N U 11 12 8 25Oreg. 69 47 481 2,287 2 2 6 12 6 13Calif. 1,526 1,456 29,998 29,726 65 94 27 43 23 14Alaska 9 5 799 826 - - - 1 - 1Hawaii 16 49 1,073 878 - - 4 6 2 5
Guam 9 13 - - - - N N U UP.R. 408 284 1,628 U - - - 1 U UV.I. 2 18 53 - - - - - U UAmer. Samoa - - U U U U U U U UC.N.M.I. - - U U U U U U U U
N: Not notifiable. U: Unavailable. -: No reported cases. C.N.M.I.: Commonwealth of Northern Mariana Islands.* Individual cases can be reported through both the National Electronic Telecommunications System for Surveillance (NETSS) and the Public
Health Laboratory Information System (PHLIS).† Chlamydia refers to genital infections caused by C. trachomatis. Totals reported to the Division of STD Prevention, NCHSTP.§ Updated monthly from reports to the Division of HIV/AIDS Prevention — Surveillance and Epidemiology, National Center for HIV, STD, and
TB Prevention. Last update April 24, 2001.
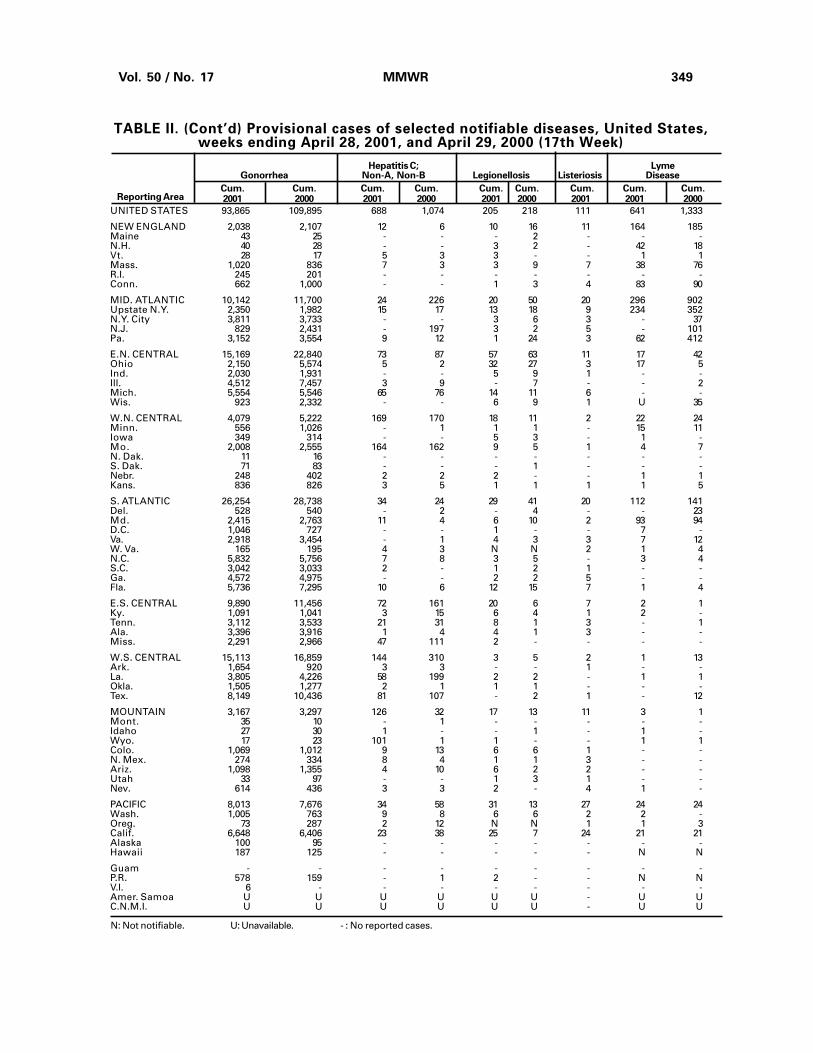
Vol. 50 / No. 17 MMWR 349
TABLE II. (Cont’d) Provisional cases of selected notifiable diseases, United States,weeks ending April 28, 2001, and April 29, 2000 (17th Week)
Reporting Area
N: Not notifiable. U: Unavailable. - : No reported cases.
Cum. Cum. Cum. Cum. Cum. Cum. Cum. Cum. Cum.2001 2000 2001 2000 2001 2000 2001 2001 2000
Hepatitis C; LymeGonorrhea Non-A, Non-B Legionellosis Listeriosis Disease
UNITED STATES 93,865 109,895 688 1,074 205 218 111 641 1,333
NEW ENGLAND 2,038 2,107 12 6 10 16 11 164 185Maine 43 25 - - - 2 - - -N.H. 40 28 - - 3 2 - 42 18Vt. 28 17 5 3 3 - - 1 1Mass. 1,020 836 7 3 3 9 7 38 76R.I. 245 201 - - - - - - -Conn. 662 1,000 - - 1 3 4 83 90
MID. ATLANTIC 10,142 11,700 24 226 20 50 20 296 902Upstate N.Y. 2,350 1,982 15 17 13 18 9 234 352N.Y. City 3,811 3,733 - - 3 6 3 - 37N.J. 829 2,431 - 197 3 2 5 - 101Pa. 3,152 3,554 9 12 1 24 3 62 412
E.N. CENTRAL 15,169 22,840 73 87 57 63 11 17 42Ohio 2,150 5,574 5 2 32 27 3 17 5Ind. 2,030 1,931 - - 5 9 1 - -Ill. 4,512 7,457 3 9 - 7 - - 2Mich. 5,554 5,546 65 76 14 11 6 - -Wis. 923 2,332 - - 6 9 1 U 35
W.N. CENTRAL 4,079 5,222 169 170 18 11 2 22 24Minn. 556 1,026 - 1 1 1 - 15 11Iowa 349 314 - - 5 3 - 1 -Mo. 2,008 2,555 164 162 9 5 1 4 7N. Dak. 11 16 - - - - - - -S. Dak. 71 83 - - - 1 - - -Nebr. 248 402 2 2 2 - - 1 1Kans. 836 826 3 5 1 1 1 1 5
S. ATLANTIC 26,254 28,738 34 24 29 41 20 112 141Del. 528 540 - 2 - 4 - - 23Md. 2,415 2,763 11 4 6 10 2 93 94D.C. 1,046 727 - - 1 - - 7 -Va. 2,918 3,454 - 1 4 3 3 7 12W. Va. 165 195 4 3 N N 2 1 4N.C. 5,832 5,756 7 8 3 5 - 3 4S.C. 3,042 3,033 2 - 1 2 1 - -Ga. 4,572 4,975 - - 2 2 5 - -Fla. 5,736 7,295 10 6 12 15 7 1 4
E.S. CENTRAL 9,890 11,456 72 161 20 6 7 2 1Ky. 1,091 1,041 3 15 6 4 1 2 -Tenn. 3,112 3,533 21 31 8 1 3 - 1Ala. 3,396 3,916 1 4 4 1 3 - -Miss. 2,291 2,966 47 111 2 - - - -
W.S. CENTRAL 15,113 16,859 144 310 3 5 2 1 13Ark. 1,654 920 3 3 - - 1 - -La. 3,805 4,226 58 199 2 2 - 1 1Okla. 1,505 1,277 2 1 1 1 - - -Tex. 8,149 10,436 81 107 - 2 1 - 12
MOUNTAIN 3,167 3,297 126 32 17 13 11 3 1Mont. 35 10 - 1 - - - - -Idaho 27 30 1 - - 1 - 1 -Wyo. 17 23 101 1 1 - - 1 1Colo. 1,069 1,012 9 13 6 6 1 - -N. Mex. 274 334 8 4 1 1 3 - -Ariz. 1,098 1,355 4 10 6 2 2 - -Utah 33 97 - - 1 3 1 - -Nev. 614 436 3 3 2 - 4 1 -
PACIFIC 8,013 7,676 34 58 31 13 27 24 24Wash. 1,005 763 9 8 6 6 2 2 -Oreg. 73 287 2 12 N N 1 1 3Calif. 6,648 6,406 23 38 25 7 24 21 21Alaska 100 95 - - - - - - -Hawaii 187 125 - - - - - N N
Guam - - - - - - - - -P.R. 578 159 - 1 2 - - N NV.I. 6 - - - - - - - -Amer. Samoa U U U U U U - U UC.N.M.I. U U U U U U - U U

350 MMWR May 4, 2001
Malaria Rabies, Animal NETSS PHLIS
Cum. Cum. Cum. Cum. Cum. Cum. Cum. Cum.2001 2000 2001 2000 2001 2000 2001 2000Reporting Area
Salmonellosis*
UNITED STATES 252 304 1,525 1,895 6,807 8,213 5,245 7,631
NEW ENGLAND 23 10 180 209 548 502 483 537Maine 2 1 26 51 73 38 36 25N.H. 2 - 5 3 42 25 34 37Vt. - 1 28 15 24 37 23 44Mass. 6 6 51 65 314 295 252 291R.I. 1 - 21 18 26 18 35 37Conn. 12 2 49 57 69 89 103 103
MID. ATLANTIC 43 59 231 305 599 1,203 798 1,400Upstate N.Y. 11 17 178 213 230 261 122 358N.Y. City 21 27 3 3 219 359 291 383N.J. 8 6 49 47 107 317 143 263Pa. 3 9 1 42 43 266 242 396
E.N. CENTRAL 27 39 9 15 1,008 1,223 749 695Ohio 5 3 1 2 392 272 274 246Ind. 8 2 1 - 93 123 75 144Ill. - 23 1 - 229 425 179 1Mich. 14 9 6 7 192 198 143 218Wis. - 2 - 6 102 205 78 86
W.N. CENTRAL 7 18 101 169 382 412 427 548Minn. 1 4 15 24 71 38 156 164Iowa 1 1 17 23 73 53 60 55Mo. 2 2 6 7 118 145 146 180N. Dak. - 2 17 39 1 14 12 21S. Dak. - - 13 40 27 21 12 29Nebr. 1 3 - - 32 62 - 41Kans. 2 6 33 36 60 79 41 58
S. ATLANTIC 68 67 656 655 1,795 1,330 1,106 1,153Del. 1 2 12 10 24 22 23 32Md. 29 27 92 137 188 191 170 206D.C. 4 - - - 23 - U UVa. 13 17 126 159 307 165 217 171W. Va. - - 46 38 16 38 18 29N.C. 1 7 189 162 325 207 175 170S.C. 3 - 40 43 216 118 208 95Ga. 3 1 77 67 237 216 249 339Fla. 14 13 74 39 459 373 46 111
E.S. CENTRAL 8 11 59 64 401 411 177 319Ky. 2 2 7 9 73 83 36 58Tenn. 3 2 43 40 112 101 98 139Ala. 3 6 9 15 155 129 31 104Miss. - 1 - - 61 98 12 18
W.S. CENTRAL 4 4 89 335 501 863 401 522Ark. 1 1 - - 79 78 29 50La. 1 3 - - 89 146 135 98Okla. 1 - 30 23 41 77 39 66Tex. 1 - 59 312 292 562 198 308
MOUNTAIN 19 16 81 58 533 745 406 664Mont. 2 1 13 16 19 23 - -Idaho 2 - - - 21 40 4 38Wyo. - - 16 22 25 15 13 14Colo. 9 8 - - 158 240 138 212N. Mex. 1 - 2 3 62 63 48 52Ariz. 1 2 50 16 160 195 127 183Utah 2 3 - 1 57 110 53 108Nev. 2 2 - - 31 59 23 57
PACIFIC 53 80 119 85 1,040 1,524 698 1,793Wash. 2 4 - - 107 98 144 185Oreg. 3 18 - - 28 101 71 130Calif. 45 56 87 75 796 1,250 401 1,406Alaska 1 - 32 10 14 19 - 18Hawaii 2 2 - - 95 56 82 54
Guam - - - - - - U UP.R. - 2 49 18 83 95 U UV.I. - - - - - - U UAmer. Samoa U U U U U U U UC.N.M.I. U U U U U U U U
N: Not notifiable. U: Unavailable. -: No reported cases.* Individual cases can be reported through both the National Electronic Telecommunications System for Surveillance (NETSS) and the Public
Health Laboratory Information System (PHLIS).
TABLE II. (Cont’d) Provisional cases of selected notifiable diseases, United States,weeks ending April 28, 2001, and April 29, 2000 (17th Week)

Vol. 50 / No. 17 MMWR 351
TABLE II. (Cont’d) Provisional cases of selected notifiable diseases, United States,weeks ending April 28, 2001, and April 29, 2000 (17th Week)
SyphilisNETSS PHLIS (Primary & Secondary) Tuberculosis
Cum. Cum. Cum. Cum. Cum. Cum. Cum. Cum.2001 2000 2001 2000 2001 2000 2001 2000Reporting Area
Shigellosis*
UNITED STATES 3,263 5,246 1,594 3,169 1,623 2,081 3,010 3,729
NEW ENGLAND 51 101 56 86 13 24 101 77Maine 1 2 1 - - - 5 3N.H. 1 1 1 4 - - 6 2Vt. 2 1 1 - - - 1 1Mass. 35 71 35 54 9 20 57 64R.I. 4 7 5 9 1 1 10 7Conn. 8 19 13 19 3 3 22 -
MID. ATLANTIC 301 809 245 562 115 96 630 637Upstate N.Y. 129 276 6 135 4 4 75 68N.Y. City 102 412 125 282 79 45 338 374N.J. 40 69 49 70 14 18 149 159Pa. 30 52 65 75 18 29 68 36
E.N. CENTRAL 498 883 246 294 245 438 316 386Ohio 153 58 73 43 27 23 47 80Ind. 83 124 16 24 55 155 27 29Ill. 129 331 84 2 63 151 167 215Mich. 108 263 66 216 92 88 51 33Wis. 25 107 7 9 8 21 24 29
W.N. CENTRAL 348 331 308 269 16 31 135 166Minn. 105 43 173 83 7 3 71 54Iowa 74 61 64 64 - 8 9 13Mo. 79 181 55 99 6 15 37 63N. Dak. 9 1 1 1 - - - -S. Dak. 26 1 1 - - - 4 8Nebr. 24 22 - 11 - 2 14 6Kans. 31 22 14 11 3 3 - 22
S. ATLANTIC 541 591 163 173 647 679 552 603Del. 4 4 3 4 2 2 - 2Md. 38 33 13 10 78 107 57 72D.C. 19 - U U 13 18 15 -Va. 38 33 19 26 48 43 58 71W. Va. 4 2 6 2 - 1 9 14N.C. 130 37 54 18 157 180 79 98S.C. 33 9 20 10 93 70 24 26Ga. 68 66 44 65 83 120 121 156Fla. 207 407 4 38 173 138 189 164
E.S. CENTRAL 299 234 76 178 185 312 199 252Ky. 106 47 30 28 15 32 32 27Tenn. 33 118 23 138 106 198 43 93Ala. 82 12 17 9 30 42 91 87Miss. 78 57 6 3 34 40 33 45
W.S. CENTRAL 474 831 257 260 227 295 359 626Ark. 182 66 65 22 15 33 45 48La. 27 94 58 42 50 69 - 46Okla. 6 11 2 8 29 56 39 32Tex. 259 660 132 188 133 137 275 500
MOUNTAIN 217 311 140 187 59 67 84 146Mont. - 2 - - - - - 4Idaho 7 26 - 17 - - 4 2Wyo. - 1 - 2 - 1 - -Colo. 49 52 38 27 4 3 26 18N. Mex. 40 32 28 18 4 6 5 19Ariz. 92 119 53 56 42 55 25 57Utah 13 21 13 28 6 - 5 8Nev. 16 58 8 39 3 2 19 38
PACIFIC 534 1,155 103 1,160 116 139 634 836Wash. 56 208 62 241 21 20 55 63Oreg. 8 89 30 52 1 3 - 22Calif. 455 840 - 856 91 116 512 689Alaska 2 6 - 3 - - 14 25Hawaii 13 12 11 8 3 - 53 37
Guam - - U U - - - -P.R. 7 14 U U 115 59 38 50V.I. - - U U - - - -Amer. Samoa U U U U U U U UC.N.M.I. U U U U U U U UN: Not notifiable. U: Unavailable. -: No reported cases.*Individual cases can be reported through both the National Electronic Telecommunications System for Surveillance (NETSS) and the PublicHealth Laboratory Information System (PHLIS).

352 MMWR May 4, 2001
TABLE III. Provisional cases of selected notifiable diseases preventableby vaccination, United States, weeks ending April 28, 2001,
and April 29, 2000 (17th Week)
A B Indigenous Imported* Total
Cum. Cum. Cum. Cum. Cum. Cum. Cum. Cum. Cum. Cum.2001† 2000 2001 2000 2001 2000 2001 2001 2001 2001 2001 2000Reporting Area
Hepatitis (Viral), By TypeH. influenzae,Invasive
UNITED STATES 493 457 2,842 4,106 1,881 1,947 - 20 - 16 36 25
NEW ENGLAND 16 37 136 104 31 33 - 3 - 1 4 -Maine 1 1 3 6 3 2 - - - - - -N.H. - 6 5 8 7 6 - - - - - -Vt. - 3 2 3 1 3 - 1 - - 1 -Mass. 15 21 42 42 2 1 - 2 - 1 3 -R.I. - 1 6 6 6 6 - - - - - -Conn. - 5 78 39 12 15 - - - - - -
MID. ATLANTIC 58 67 246 288 253 326 - 1 - 5 6 8Upstate N.Y. 22 27 79 77 43 36 - - - 4 4 -N.Y. City 21 23 106 151 147 184 - - - - - 8N.J. 14 13 46 - 44 14 - - - 1 1 -Pa. 1 4 15 60 19 92 - 1 - - 1 -
E.N. CENTRAL 59 75 326 585 235 223 - - - 7 7 3Ohio 27 24 90 115 42 36 - - - 2 2 2Ind. 16 8 29 15 6 15 - - - 2 2 -Ill. 9 28 87 228 20 27 - - - 3 3 -Mich. 3 4 115 176 167 136 - - - - - 1Wis. 4 11 5 51 - 9 - - - - - -
W.N. CENTRAL 19 15 143 288 63 82 - 4 - - 4 -Minn. 8 7 9 36 7 7 - 2 - - 2 -Iowa 1 - 15 32 7 14 - - - - - -Mo. 8 7 42 162 35 42 - 2 - - 2 -N. Dak. - 1 - - - - - - - - - -S. Dak. - - 1 - 1 - - - - - - -Nebr. 2 - 18 13 6 14 U - U - - -Kans. - - 58 45 7 5 - - - - - -
S. ATLANTIC 166 110 598 414 420 320 - 3 - 1 4 -Del. - - - 6 - 4 - - - - - -Md. 43 28 87 49 51 45 - 2 - 1 3 -D.C. - - 15 - 3 - - - - - - -Va. 9 21 45 50 43 50 - - - - - -W. Va. 4 3 2 34 7 2 - - - - - -N.C. 22 8 38 77 85 92 - - - - - -S.C. 4 5 21 14 5 2 - - - - - -Ga. 40 31 214 52 108 45 - 1 - - 1 -Fla. 44 14 176 132 118 80 - - - - - -
E.S. CENTRAL 33 19 96 180 110 144 - - - - - -Ky. 1 9 12 19 14 28 - - - - - -Tenn. 14 7 44 60 41 62 - - - - - -Ala. 17 3 36 23 34 11 - - - - - -Miss. 1 - 4 78 21 43 - - - - - -
W.S. CENTRAL 15 27 369 781 222 215 - 1 - - 1 -Ark. - - 18 59 32 31 - - - - - -La. 2 10 31 31 15 54 - - - - - -Okla. 13 17 56 117 25 30 - - - - - -Tex. - - 264 574 150 100 - 1 - - 1 -
MOUNTAIN 85 53 288 302 195 160 - - - 1 1 8Mont. - - 4 1 1 3 - - - - - -Idaho 1 2 27 12 4 4 - - - 1 1 -Wyo. 4 - 15 3 16 - - - - - - -Colo. 18 11 31 59 40 32 - - - - - 3N. Mex. 12 11 8 33 44 51 - - - - - -Ariz. 40 23 146 153 66 52 - - - - - -Utah 3 4 24 18 9 4 - - - - - 3Nev. 7 2 33 23 15 14 - - - - - 2
PACIFIC 42 54 640 1,164 352 444 - 8 - 1 9 6Wash. 1 3 24 93 31 17 - - - - - 3Oreg. 3 16 20 81 10 35 - 1 - - 1 -Calif. 23 20 584 979 300 384 - 7 - 1 8 3Alaska 1 1 11 4 4 2 - - - - - -Hawaii 14 14 1 7 7 6 - - - - - -
Guam - - - - - - - - - - - -P.R. - 2 33 113 18 80 - - - - - -V.I. - - - - - - U - U - - -Amer. Samoa U U U U U U U U U U U UC.N.M.I. U U U U U U U U U U U U
Measles (Rubeola)
N: Not notifiable. U: Unavailable. - : No reported cases.*For imported measles, cases include only those resulting from importation from other countries.† Of 107 cases among children aged <5 years, serotype was reported for 52, and of those, eight were type b.

Vol. 50 / No. 17 MMWR 353
MeningococcalDisease Mumps Pertussis Rubella
Cum. Cum. Cum. Cum. Cum. Cum. Cum. Cum.2001 2000 2001 2001 2000 2001 2001 2000 2001 2001 2000Reporting Area
TABLE III. (Cont’d) Provisional cases of selected notifiable diseases preventableby vaccination, United States, weeks ending April 28, 2001,
and April 29, 2000 (17th Week)
UNITED STATES 936 889 4 58 149 45 1,535 1,688 1 4 37
NEW ENGLAND 62 52 - - 2 - 224 436 - - 6Maine 1 3 - - - - - 9 - - -N.H. 5 3 - - - - 16 52 - - 1Vt. 4 2 - - - - 22 82 - - -Mass. 36 34 - - - - 178 272 - - 4R.I. 1 3 - - 1 - 1 6 - - -Conn. 15 7 - - 1 - 7 15 - - 1
MID. ATLANTIC 71 84 - 1 11 1 90 158 - 1 6Upstate N.Y. 29 17 - - 5 1 74 72 - 1 2N.Y. City 18 24 - 1 3 - 6 31 - - 4N.J. 22 20 - - - - 2 - - - -Pa. 2 23 - - 3 - 8 55 - - -
E.N. CENTRAL 112 155 1 7 19 8 174 219 - 1 -Ohio 43 27 - 1 6 4 116 131 - - -Ind. 14 18 1 1 - 4 11 12 - - -Ill. 20 44 - 5 4 - 14 19 - 1 -Mich. 23 49 - - 8 - 15 14 - - -Wis. 12 17 - - 1 - 18 43 - - -
W.N. CENTRAL 62 53 - 5 7 - 74 58 1 1 1Minn. 7 3 - 1 - - 17 31 - - -Iowa 16 12 - - 4 - 9 8 1 1 -Mo. 23 28 - - 1 - 33 8 - - -N. Dak. 3 1 - - - - - 1 - - -S. Dak. 2 4 - - - - 3 1 - - -Nebr. 2 3 U - 1 U 2 2 U - 1Kans. 9 2 - 4 1 - 10 7 - - -
S. ATLANTIC 179 128 - 6 19 5 71 116 - 1 9Del. - - - - - - - 1 - - -Md. 24 12 - 3 5 - 11 35 - - -D.C. - - - - - - 1 - - - -Va. 20 23 - 2 4 - 8 10 - - -W. Va. 4 3 - - - - 1 - - - -N.C. 40 24 - - 3 1 25 29 - - 6S.C. 18 10 - 1 6 1 14 15 - - 2Ga. 24 22 - - - - 2 13 - 1 -Fla. 49 34 - - 1 3 9 13 - - 1
E.S. CENTRAL 67 57 1 1 4 3 37 39 - - 4Ky. 13 12 1 1 - 1 11 25 - - 1Tenn. 23 24 - - 2 - 16 5 - - -Ala. 27 16 - - 1 2 7 8 - - 3Miss. 4 5 - - 1 - 3 1 - - -
W.S. CENTRAL 139 102 - 6 15 7 33 60 - - 4Ark. 10 5 - 1 1 - 3 6 - - -La. 46 32 - 2 3 - 1 4 - - 1Okla. 14 17 - - - - 1 - - - -Tex. 69 48 - 3 11 7 28 50 - - 3
MOUNTAIN 51 52 1 6 9 20 713 287 - - -Mont. - 1 - - 1 - 5 6 - - -Idaho 4 6 - - - 1 160 35 - - -Wyo. 1 - - 1 - - 1 - - - -Colo. 20 14 - 2 1 - 135 173 - - -N. Mex. 8 7 - 2 1 - 42 41 - - -Ariz. 9 16 - - - 17 354 23 - - -Utah 5 6 - - 4 2 11 6 - - -Nev. 4 2 1 1 2 - 5 3 - - -
PACIFIC 193 206 1 26 63 1 119 315 - - 7Wash. 34 15 - - 1 1 30 89 - - 6Oreg. 12 25 N N N - 6 26 - - -Calif. 139 158 1 17 55 - 75 178 - - 1Alaska 1 3 - 1 2 - - 4 - - -Hawaii 7 5 - 8 5 - 8 18 - - -
Guam - - - - - - - - - - -P.R. 1 4 - - - - - - - - -V.I. - - U - - U - - U - -Amer. Samoa U U U U U U U U U U UC.N.M.I. U U U U U U U U U U UN: Not notifiable. U: Unavailable. - : No reported cases.

354 MMWR May 4, 2001
TABLE IV. Deaths in 122 U.S. cities,* week endingApril 28, 2001 (17th Week)
�65 45-64 25-44 1-24 <1Reporting Area
All Causes, By Age (Years)
AllAges
P&I†
Total������65 45-64 25-44 1-24 <1
Reporting Area
All Causes, By Age (Years)
AllAges
P&I†
Total
NEW ENGLAND 567 414 94 43 5 11 53Boston, Mass. 140 100 21 10 3 6 15Bridgeport, Conn. 47 34 10 3 - - 3Cambridge, Mass. 22 19 3 - - - 4Fall River, Mass. 27 21 4 2 - - 3Hartford, Conn. 86 54 20 10 1 1 3Lowell, Mass. 24 18 5 1 - - 5Lynn, Mass. 22 18 4 - - - 3New Bedford, Mass. 33 31 1 1 - - 2New Haven, Conn. 43 34 6 3 - - 3Providence, R.I. U U U U U U USomerville, Mass. 9 7 1 1 - - -Springfield, Mass. 31 23 3 4 - 1 5Waterbury, Conn. 31 24 2 2 - 3 2Worcester, Mass. 52 31 14 6 1 - 5
MID. ATLANTIC 2,253 1,577 438 151 42 44 120Albany, N.Y. 60 40 12 3 1 4 7Allentown, Pa. 19 16 1 2 - - 2Buffalo, N.Y. 89 67 14 6 - 2 9Camden, N.J. 31 18 8 4 - 1 1Elizabeth, N.J. 35 24 8 2 - 1 -Erie, Pa.§ 57 42 10 2 2 1 4Jersey City, N.J. 43 34 6 2 1 - -New York City, N.Y. 1,241 848 262 91 19 20 50Newark, N.J. U U U U U U UPaterson, N.J. 30 18 7 4 1 - 1Philadelphia, Pa. 258 171 47 23 9 8 10Pittsburgh, Pa.§ 58 45 11 - 1 1 4Reading, Pa. 30 28 1 1 - - 6Rochester, N.Y. 141 101 25 4 6 5 10Schenectady, N.Y. 20 17 1 1 1 - -Scranton, Pa.§ 27 23 3 1 - - 3Syracuse, N.Y. 77 60 13 2 1 1 10Trenton, N.J. 20 13 5 2 - - 1Utica, N.Y. 17 12 4 1 - - 2Yonkers, N.Y. U U U U U U U
E.N. CENTRAL 1,605 1,137 312 87 33 36 111Akron, Ohio 61 48 12 - - 1 2Canton, Ohio 54 41 11 2 - - 4Chicago, Ill. U U U U U U UCincinnati, Ohio 110 70 17 7 7 9 6Cleveland, Ohio 129 75 32 15 3 4 13Columbus, Ohio 212 156 32 13 5 6 14Dayton, Ohio 114 84 22 7 1 - 13Detroit, Mich. 170 108 45 9 4 4 9Evansville, Ind. 50 40 8 2 - - 2Fort Wayne, Ind. 67 53 6 5 2 1 10Gary, Ind. 14 9 3 1 - 1 -Grand Rapids, Mich. 55 45 7 2 1 - 4Indianapolis, Ind. 180 130 34 6 6 4 10Lansing, Mich. 43 34 8 1 - - 4Milwaukee, Wis. 117 77 32 6 - 2 14Peoria, Ill. 54 37 10 5 1 1 2Rockford, Ill. 43 29 11 2 1 - -South Bend, Ind. 61 44 12 1 2 2 3Toledo, Ohio U U U U U U UYoungstown, Ohio 71 57 10 3 - 1 1
W.N. CENTRAL 725 527 126 38 17 17 52Des Moines, Iowa 55 40 9 3 2 1 8Duluth, Minn. 45 36 8 1 - - 3Kansas City, Kans. 31 20 6 3 1 1 2Kansas City, Mo. 97 62 20 6 4 5 8Lincoln, Nebr. 33 25 5 2 1 - 1Minneapolis, Minn. 155 125 23 6 1 - 8Omaha, Nebr. 74 60 9 4 - 1 5St. Louis, Mo. 79 49 21 4 3 2 -St. Paul, Minn. 87 65 14 3 2 3 11Wichita, Kans. 69 45 11 6 3 4 6
S. ATLANTIC 1,414 887 290 132 64 41 87Atlanta, Ga. 219 125 47 25 16 6 -Baltimore, Md. 151 88 38 20 2 3 13Charlotte, N.C. 106 65 20 10 6 5 6Jacksonville, Fla. 180 121 38 9 4 8 12Miami, Fla. 109 52 13 20 13 11 9Norfolk, Va. 52 34 11 2 4 1 1Richmond, Va. 63 35 12 10 5 1 11Savannah, Ga. 54 37 10 4 1 2 5St. Petersburg, Fla. 61 47 10 3 1 - 6Tampa, Fla. 202 144 38 10 7 3 17Washington, D.C. 199 128 46 19 5 1 7Wilmington, Del. 18 11 7 - - - -
E.S. CENTRAL 756 535 136 57 15 13 69Birmingham, Ala. 161 116 28 9 4 4 18Chattanooga, Tenn. 75 57 13 3 - 2 5Knoxville, Tenn. 91 56 20 11 2 2 7Lexington, Ky. 83 63 13 5 - 2 7Memphis, Tenn. 188 130 35 14 7 2 18Mobile, Ala. 108 71 22 13 1 1 7Montgomery, Ala. 50 42 5 2 1 - 7Nashville, Tenn. U U U U U U U
W.S. CENTRAL 1,601 1,043 334 130 63 31 110Austin, Tex. 110 82 14 9 3 2 4Baton Rouge, La. 92 53 25 7 5 2 3Corpus Christi, Tex. 75 58 10 3 3 1 10Dallas, Tex. 224 143 43 24 6 8 18El Paso, Tex. 87 59 22 3 1 2 4Ft. Worth, Tex. 148 93 33 11 8 3 3Houston, Tex. 373 226 77 34 26 10 28Little Rock, Ark. 75 48 20 3 2 2 5New Orleans, La. 69 31 22 9 6 1 11San Antonio, Tex. 173 122 35 13 3 - 14Shreveport, La. 50 36 10 4 - - 4Tulsa, Okla. 125 92 23 10 - - 6
MOUNTAIN 1,000 714 167 76 26 17 80Albuquerque, N.M. 101 81 12 4 3 1 11Boise, Idaho 42 29 8 1 3 1 3Colo. Springs, Colo. 47 33 8 5 1 - 9Denver, Colo. 111 74 20 10 2 5 9Las Vegas, Nev. 214 158 34 16 5 1 10Ogden, Utah 35 26 6 2 1 - 5Phoenix, Ariz. 170 110 33 16 6 5 10Pueblo, Colo. 27 20 3 3 1 - 5Salt Lake City, Utah 110 77 18 8 4 3 9Tucson, Ariz. 143 106 25 11 - 1 9
PACIFIC 1,325 950 246 81 25 20 102Berkeley, Calif. 19 13 5 1 - - 3Fresno, Calif. 120 85 22 9 2 2 4Glendale, Calif. U U U U U U UHonolulu, Hawaii 62 48 8 2 2 2 3Long Beach, Calif. 82 53 19 5 3 2 8Los Angeles, Calif. U U U U U U UPasadena, Calif. 32 24 8 - - - 3Portland, Oreg. 160 121 25 10 4 - 10Sacramento, Calif. 178 127 34 10 5 2 17San Diego, Calif. 165 119 22 18 2 3 14San Francisco, Calif. U U U U U U USan Jose, Calif. 202 148 34 11 4 5 16Santa Cruz, Calif. 29 21 7 1 - - 5Seattle, Wash. 130 87 36 4 1 2 6Spokane, Wash. 59 44 10 3 - 2 8Tacoma, Wash. 87 60 16 7 2 - 5
TOTAL 11,246¶ 7,784 2,143 795 290 230 784
U: Unavailable. -:No reported cases.*Mortality data in this table are voluntarily reported from 122 cities in the United States, most of which have populations of �100,000. A deathis reported by the place of its occurrence and by the week that the death certificate was filed. Fetal deaths are not included.
†Pneumonia and influenza.§Because of changes in reporting methods in this Pennsylvania city, these numbers are partial counts for the current week. Complete countswill be available in 4 to 6 weeks.
¶Total includes unknown ages.

Vol. 50 / No. 17 MMWR 355
Contributors to the Production of the MMWR (Weekly)
Weekly Notifiable Disease Morbidity Data and 122 Cities Mortality Data
Samuel L. Groseclose, D.V.M., M.P.H.
State Support Team CDC Operations TeamRobert Fagan Carol M. KnowlesJose Aponte Deborah A. AdamsGerald Jones Willie J. AndersonDavid Nitschke Patsy A. HallScott Noldy Mechele HesterCarol A. Worsham Felicia J. Perry
Pearl Sharp
Informatics
T. Demetri Vacalis, Ph.D.
Michele D. Renshaw Erica R. Shaver

The Morbidity and Mortality Weekly Report (MMWR) Series is prepared by the Centers for Disease Control andPrevention (CDC) and is available free of charge in electronic format and on a paid subscription basis for papercopy. To receive an electronic copy on Friday of each week, send an e-mail message to [email protected] body content should read SUBscribe mmwr-toc. Electronic copy also is available from CDC’s World-Wide Webserver at http://www.cdc.gov/mmwr or from CDC’s file transfer protocol server at ftp://ftp.cdc.gov/pub/Publi-cations/mmwr. To subscribe for paper copy, contact Superintendent of Documents, U.S. Government PrintingOffice, Washington, DC 20402; telephone (202) 512-1800.
Data in the weekly MMWR are provisional, based on weekly reports to CDC by state health departments. Thereporting week concludes at close of business on Friday; compiled data on a national basis are officially releasedto the public on the following Friday. Address inquiries about the MMWR Series, including material to beconsidered for publication, to: Editor, MMWR Series, Mailstop C-08, CDC, 1600 Clifton Rd., N.E., Atlanta, GA30333; telephone (888) 232-3228.
All material in the MMWR Series is in the public domain and may be used and reprinted without permission;citation as to source, however, is appreciated.
IU.S. Government Printing Office: 2001-633-173/48228 Region IV
Director, Centers for DiseaseControl and Prevention
Jeffrey P. Koplan, M.D., M.P.H.
Deputy Director for Science andPublic Health, Centers for DiseaseControl and Prevention
David W. Fleming, M.D.
Director,Epidemiology Program Office
Stephen B. Thacker, M.D., M.Sc.
Editor, MMWR SeriesJohn W. Ward, M.D.
Acting Managing Editor, MMWR(Weekly)
Teresa F. Rutledge
Writers-Editors, MMWR (Weekly)Jill CraneDavid C. Johnson
Desktop PublishingLynda G. CupellMorie M. Higgins
356 MMWR May 4, 2001