National Analytical Study on Housing...interior regions of the country. Thirdly, though the...
85
1 National Analytical Study on Housing RAXEN Focal Point for Portugal Númena Research Centre on Human and Social Sciences October 2003
Transcript of National Analytical Study on Housing...interior regions of the country. Thirdly, though the...
1
National Analytical Study
on Housing
RAXEN Focal Point for Portugal
Númena Research Centre on Human and Social Sciences
October 2003

DISCLAIMER: This study has been compiled by the National Focal Point of the Racism andXenophobia Network operated by the European Monitoring Centre on Racism and Xenophobia(EUMC). The opinions expressed by the author/s do not necessarily reflect the opinion or position ofthe EUMC. No mention of any authority, organisation, company or individual shall imply anyapproval as to their standing and capability on the part of the EUMC. This study is provided by theNational Focal Point as information guide only, and in particular does not constitute legal advice.
2

3
1. EXECUTIVE SUMMARY This reports provides an overview on the topics of housing and spatial segregation by
taking a general viewpoint on the meagre literature available and on the almost non-
existent data concerning housing discrimination. We start by tacking into account the
data on re-housing programmes, especially the PER (Special Re-housing Programme),
stressing the legal regime that supports this programme. We show some numbers that
put into perspective the kind of spatial distribution characteristic of ethnic and migrant
minorities. However, this is focused for the most part on the two biggest urbanised
areas, that is, Lisbon and Porto, where the PER was promoted.
We then move forward to a collection of academic studies in this area. We should notice
that a recent interest on this subject has prompted the production of several works.
Despite this growing attention on housing allocation the majority of such works are still
on the making; being so results can only be expected at a greater length of time.
Discrimination in the housing sector has been viewed solely on its spatial aspects. The
use of this kind of conceptual and theoretical narrowing has hindered the possibility of
grasping a real depiction of ethnic minorities access to the housing market.
Ethnic minorities tend to cluster on the lower strata of social stratification. Regarding
housing this implies that for a long time ethnic minorities, especially those coming
from African Countries Having Portuguese as their Official Language (PALOP) were
cast out from the regular housing market1. An hiatus between the arrival of large
contingents of people from abroad and the implementation in Lisbon and Porto of the
first large scope re-housing programmes led to the proliferation of slums at the outskirts
of Lisbon. Slums clearance was one of the objectives of PER and this not only had
altered radically the urban landscape but also the relation between a big proportion of
the so called Luso-Africans2 and the housing market. The proliferation of slums
intensified the visibility of ethnic segregation. Ethnic minorities, mainly black, had to
1 By this we mean processes of house acquisition where all the required legal formalities are complied with. 2 See for instance Machado, F.L. (2002) Contrastes e Continuidades- Migração, Etnicidade e
Integração dos Guineenss em Portugal [Contrasts and Continuities- Migration, Ethnicty and Integration of Guineese in Portugal] Oeiras: Celta

4
face an expensive housing market which -by force of conjuncture-, cast them away from
private housing. Some researchers, as Prof. Maria João Freitas, from the Centre for
Social Ecology(NESO) of the National Laboratory of Civil Engineering(LNEC) hold
the opinion that the failure of the Portuguese housing market in satisfying the demand,
together with the scarcity of the supply in social housing by the state when compared to
that demand, ended by affecting the most ill-favoured segments of the population. In
this respect, and according to this specialist, ethnic minorities were affected on account
of their poor socio-economic situation3.
Another level would be the one of direct discrimination and to this researchers have not
paid much attention so far. No studies were ever conducted in Portugal on housing
renting or selling refusal on account of ethnicity. However, we are led to believe that
discrimination does happen in the housing sector. Judging by the information collected
from associations working in the field of racism and immigration people from an ethnic
minority background complaint of suffering discrimination in the housing market. More
substantiated data will be need to ground these otherwise speculative assumptions.
Nevertheless, three main conclusions can be drawn from the data analised in this report.
Firstly, in general, minorities living in Portugal have worse housing conditions than the
Portuguese majority (especially in the Lisbon and Porto’s areas). Secondly, Roma are
the ethnic group which evinces the worse housing conditions. Simultaneously, they are
those that bear the biggest stigma and also the main target of outcries especially in the
interior regions of the country. Thirdly, though the re-housing process started in the
beginning of the nineties counteracted the housing shortage, many problems that were
characteristic of the slums and shantytowns in towns’ peripheries were simply
transferred to the new environments. Fourthly, Africans and Roma according to
associations, are those that complaint the most about being discriminated in renting and
buying a house; also the complaints received by the Commission for Equality and
Against Racial Discrimination point in the same direction.
3 These opinions were stated in an interview with the NFP

5
TABLE OF CONTENTS
1. EXECUTIVE SUMMARY ........................................................................................ 3
2. GLOSSARY/DEFINITION OF TERMS AND CONCEPTS USED..................... 7
3. INTRODUCTION .................................................................................................... 10
4. LEGISLATION AND POLICIES CONCERNING THE HOUSING SECTOR OF RELEVANCE FOR MIGRANTS AND MINORITIES .................................... 13
4.1 ANTI-DISCRIMINATION LEGISLATION CONCERNING HOUSING................................ 13
5. DESCRIPTION AND ANALYSIS OF EXISTING DATA AND SOURCES IN THE HOUSING SECTOR .......................................................................................... 19
5.1 A BRIEF OVERVIEW OF THE MINORITIES’ SPATIAL DISTRIBUTION IN PORTUGAL..... 19 5.2 DATA ON HOUSING STANDARDS............................................................................ 26 5.3 SHANTYTOWNS AND RE-HOUSING ......................................................................... 29 5.4 IMMIGRANTS AND PORTUGUESE IN SHANTIES: A COMPARATIVE PERSPECTIVE ...... 34 5.5 IMMIGRANTS’ LIVING CONDITIONS ....................................................................... 35 5.6 THE SPECIFIC CASE OF ROMA................................................................................. 37
6. ANALYSIS OF DIRECT AND INDIRECT DISCRIMINATION...................... 39 6.1 MAIN VICTIMS OF DISCRIMINATION ....................................................................... 39 6.2 DATA ON RECORDED COMPLAINTS ABOUT RACIAL/ETHNICAL/RELIGIOUS/CULTURAL DISCRIMINATION.......................................................................................................... 40 6.3 DATA ON COURT CASES ......................................................................................... 44 6.4 INTER-ETHNIC RELATIONS IN CONTEXTS OF SPATIAL PROXIMITY: SOME CASE STUDIES RELATED TO RE-HOUSING PROGRAMMES........................................................ 46 6.5 EVALUATING THE EFFECTS OF GOVERNMENTAL INITIATIVES................................. 54 6.6 NON-EXISTING DATA AND INSUFFICIENCIES OF INFORMATION............................... 56
7. SPACIAL DISTRIBUTION AND SEGREGATION............................................ 60 7.1 SPATIAL SEGREGATION IN PORTUGAL.................................................................... 60 7.2 PATTERNS OF SPATIAL SEGREGATION IN THE LISBON METROPOLITAN AREA ....... 62
8. DATA ON NEW POLICIES AND LEGISLATION WITH RESPECT TO EQUAL TREATMENT AND ACCESS TO HOUSING AND TO INTEGRATION (OF IMMIGRANTS AND MINORITIES) ................................................................ 67
9. CONCLUSIONS....................................................................................................... 71
BIBLIOGRAPHY: ....................................................................................................... 75
HOUSING REPORT STATISTICAL ANNEX: ....................................................... 79
TABLE 1 - FOREIGN RESIDENTS WITH LEGAL STATUS BY DISTRICT (2001) ....................... 19 TABLE 2 - FOREIGNERS WITH RESIDENCE PERMIT COMPARING WITH THE TOTAL OF THE
POPULATION, BY COUNTRY REGIONS IN 2001........................................................... 20 TABLE 3 - DISTRIBUTION OF FOREIGN POPULATION WITH RESIDENCE PERMIT AND
PERMANENCE PERMIT BY NUT II............................................................................. 21 TABLE 4 - FOREIGN RESIDENTS BY DISTRICT (2001) **................................................... 22 TABLE 5 - CITIZENS LIVING IN PORTUGAL BY DISTRICT (2001) ....................................... 24

6
TABLE 6 - DISTRIBUTION OF CLASSIC AND NON-CLASSIC (SHANTIES) DWELLINGS AND FOREIGN POPULATION BY COUNTRY’S REGION, 2001............................................... 26
TABLE 7 - SHANTIES’ DISTRIBUTION BY REGION (1991 E 2001) ...................................... 28 TABLE 8 - SHANTY DWELLERS BY MUNICIPALITY AND NATIONALITY – LISBON
METROPOLIAN AREA............................................................................................... 30 TABLE 9 - % OF FOREIGN POPULATION LIVING IN SHANTIES IN THE LISBON
METROPOLITAN AREA IN RELATION TO THE TOTAL OF IMMIGRANTS BY NATIONALITY.% ...................................................................................................... 31
TABLE 10 - HOUSING CONDITIONS BY COMMUNITY, 1990 (PERCENTAGES).................... 32 TABLE 11 - INCOME ACCORDING TO EACH NATIONALITY ................................................ 33 TABLE 13 - SEGREGATION INDEX FOR THE MAIN FOREIGN COMMUNITIES IN THE LISBON METROPOLITAN REGION ................................................................................................. 63 TABLE 14 - SEGREGATION INDEXES IN SELECTED EUROPEAN CITIES ............................... 64 TABLE 15 - EVOLUTION OF THE FOREIGN POPULATION WITH RESIDENCE PERMIT IN
PORTUGAL............................................................................................................... 79 TABLE 16 - PORTUGUESE NATIONALITY GRANTS BY WAY OF MARRIAGE AND
NATURALIZATION .................................................................................................... 80 TABLE 17 - NATURALIZATIONS IN PORTUGAL ................................................................. 81 TABLE 18 - DISTRICTS OF RESIDENCY OF IMMIGRANT POPULATION* ............................. 82 TABLE 19 - RESIDENT EMPLOYED POPULATION ACCORDING TO PROFESSIONAL GROUPS
AND REGION OF THE COUNTRY IN 2001.................................................................... 82 TABLE 20 - BENEFICIARIES OF THE DOLE AND OF THE MINIMUM GUARANTEED INCOME
ACCORDING TO THEIR NATIONALITIES IN 2002 ........................................................ 83
GRAPHIC 1- IMMIGRANTS’ LODGINGS (%) ...................................................................... 36 GRAPHIC 2- IMMIGRANTS’ CONDITIONS OF LIVING ......................................................... 37

7
2. GLOSSARY/DEFINITION OF TERMS AND CONCEPTS USED
Immigrants:
Although there is no legal definition of the concept of immigrant, it is usually associated
with non-nationals residing on national territory. In Portugal, immigration is a relatively
recent phenomenon and it is linked with immigrant workers. Law 34/2003 who
regulates the entry, permanence and expulsion of foreigners from the Portuguese
territory does not use the designation “Immigrant” but that of “Foreign Resident”, who
is defined as any foreigner entitled with a valid permit for residence in Portugal. The
annex to the same law-decree defines foreign in the second article as “everybody who
doesn’t prove to hold Portuguese nationality”. “ Thus official statistics concern
“Foreigners” and not “Immigrants”. Consequently second and third generation
immigrants are also not considered in official statistics and documents. Therefore the
word “foreigner” is in most cases more accurate since official statistics group together
both foreign nationals who were born in Portugal and those who immigrated.
Nonetheless we use the word immigrant to designate those that unequivocally
immigrated to Portugal as, for example, the beneficiaries of the latest extraordinary
legalization.
Minorities
The concept of ethnic minorities was used for the first time in the XII Constitutional
Government Programme (1996/2000). However, this concept is not defined in the
Portuguese legal code, since the need to lend it a determinate legal meaning has not so
far been felt. Hence, its sociological definition was tacitly adopted. Nevertheless, this is
far from being clear when it comes to apply it to Portugal.
According to Prof. Beatriz Rocha Trindade, in Portugal only the Roma community can
be considered a national ethnic minority, inasmuch as “the concept of ethnic minorities
is necessarily tied to a situation extending from generation to generation – i.e., it is
necessarily tied to the preservation of codes regarding a specific culture. Such is the

8
case with the Roma community, which constitute a well-defined ethnic minority,
although they are seldom viewed as such”4
1st, 2nd and 3rd generation immigrants:
In Portugal, the first generation of immigrants is for the most part associated with
individuals originating from PALOP (African Countries Having Portuguese as their
Official Language), who, in the wake of their countries’ independence, chose Portugal
as their destination. However, since the end of the nineties a new wave of immigrants,
coming from Eastern European countries, especially Ukraine, has been entering
Portugal, and now they constitute the largest group of foreigners living in national
territory.
The second and third generation immigrants are their descendants, many of which are
Portuguese nationals as a result of their progenitors having benefited from the provision
implemented by Decree-Law no. 308-A/75, dated June 24th, which regulated the
mechanisms for the preservation and acquisition of Portuguese nationality, and of their
inclusion in the disposition that grants nationality by birth to children of foreigners born
on national territory, as laid down in Law no.37/81, dated August 12th.
Exiles/Asylum seekers:
The Portuguese legal framework does not define the concept of exile or asylum seeker.
However, this concept can be discerned through the interpretation of article 1, based on
art. 1 no.2 of the Geneva Convention. Law no. 15/98, dated March 26th – Asylum Law
[available at http://www.gddc.pt/legislacao-lingua-estrangeira/english/lei-asilo.html] –
stipulates three distinct situations whereby individuals are entitled to protection: the
refugee status (art. 1 to 6), residence permit for humanitarian reasons (art.8) and
temporary protection (art. 9).
4 Maria Beatriz Rocha Trindade, “Minorias, Polissemia do Conceito e Diversidade de Manifestação”, in Emigração-Imigração em Portugal. Actas do Colóquio Internacional sobre Emigração e Imigração em Portugal nos Séculos XIX e XX [Emmigration- Immigration in Portugal. Minutes of the International Meeting on Emigration and Immigration in Portugal in the 19th and 20th centuries], Lisbon, Ed. Fragmentos, 1993, p.428.

9
Refugees:
In Portugal, there is no legal distinction between the concepts of exile (asylum seeker)
and refugee.
Definitions of discrimination and anti-discrimination in housing/accommodation in use in this report We understand racial discrimination in the housing sector by any form of inequality of
treatment among individuals based on race, colour, nationality or ethnic origin (Council
directive 2000/43/CE) in buying or renting a lodgement.
In the same vein, the Portuguese law against racial discrimination, Law 134/99, in its
art. 4, defines discriminatory practice in the following way: “All actions or omissions
which violate the principle of equality of any person, be they based on race, colour,
nationality or ethnic origin, shall be considered discriminatory practice, specifically:
c) the refusal or constraint on the selling, letting or sub-letting of
property;
e) the refusal to allow right of entry to places which are either
public or open to the public;
j) the adoption of any practice or measure on part of any body, civil servant or agent directly or indirectly associated with the State, Autonomous Regions or local government that hinders or restricts the practice or exercise of any right.

10
3. INTRODUCTION
Never as before has Portuguese society given such an attention to immigrants and ethnic
minorities as in the last two years. News about immigrants fill the news in the press and
on the TV, the real consequences of immigration to the Portuguese economy are
discussed at the political level, public forums are promoted to discuss the subject. One
of the reasons for this interest is the promotion of a new immigration law, law-decree
34/2003, approved in the beginning of 2003. This, together with a number of public
initiatives regarding immigrants, such as the creation of an Immigration Monitoring
Centre5 and of a national network of support to immigrants, has prompted the public
debate. It could be said also that the country is finally gaining consciousness of the fact
that it has become a destiny of immigration, having until now viewed himself as a
country of emigration. The public interest has been accompanied by an increase in
academic research on a variety of topics such as work, media, demography and
perceptions and attitudes of the Portuguese and immigrants towards each other.
At the same time the composition of the migratory fluxes into Portugal has gone
through significant changes in the last years. If immigrants in the eighties and
throughout the nineties were mainly from the African Countries Having Portuguese as
their Official Language (currently designated as PALOP), since the end of the nineties
immigrants entering the country have come mainly from Eastern European countries.
One can say that they constitute , in both cultural and legal terms, a new immigration.
One of the main differences in relation to previous migratory fluxes is that Eastern
Europeans show a much greater degree of territorial dispersion throughout the
Portuguese territory, contrary to the previous pattern in the settlement of immigrants,
mainly Africans, that concentrated mostly in the Lisbon Metropolitan Area.
In this context the subject of housing has been associated to immigrants mainly in two
ways: Africans are associated to the great shantytowns in the outskirts of Lisbon and
with derelict neighbourhoods; Eastern European immigrants are reported also to live in
difficult conditions, albeit from a different kind. Reports are usual of Eastern European
citizens living in garages or even at their workplace. Sometimes the conditions are even
more precarious and both media and associations of defence of human rights have
denounced situations where several immigrants live in containers with no conditions,
5 http://www.oi.acime.gov.pt

11
namely with no amenities or hygiene. Unfortunately no thorough research was yet made
on the subject and thus we still lack an adequate picture of the phenomenon. Its
contours may be even more preoccupying. In an interview conducted by the NFP with
one Portuguese Human Rights association, Olho Vivo, it was stressed the fact that ever
more complaints of Eastern Europeans living in the streets have been received.
As to shanty dwellers, throughout the nineties many of them benefited from state
promoted Re-housing programmes. These programmes allowed many immigrants and
ethnic minorities an improvement in their conditions of living. Furthermore, the
obligation to survey the populations to be re-housed led to the set up of databases that
allow us to identify the nationalities of the beneficiaries. But the re-housing processes
prompted also other studies made before the re-housed populations. These studies were
mainly undertaken by research teams, focused many times on the subject of immigrants
and ethnic minorities. They point generally to an improvement in the lodging conditions
of these populations, but not to significant advances in socio-economic integration, due
to the difficulty to break with cycles of exclusion that preceded their re-housing6. One
of those factors of exclusion was the negative image associated with shantytowns,
which was many times carried with to the new re-housing neighbourhoods. The answer
from the surrounding population was often the public rejection of the re-housing
processes. These public manifestations took sometimes a racist tone, since they were
targeted directly to the ethnic background of the former shanty dwellers. At the same
time they could claim that they were protesting not on account of racism but from fear
of insecurity, since the shanties were publicly associated with violence and drug
trafficking. This bad image was acknowledged by the inhabitants in re-housing
neighbourhoods themselves when inquired about the subject.
If the data and studies that resulted from the re-housing programmes provide us with
important information on the housing standards of immigrants and ethnic minorities the
same cannot be said as to another important topic of this report, racial discrimination in
housing. Law 134/99, which creates a committee for receiving complaints of racial
discrimination- the Commission for Equality and Against Racial Discrimination- and
direct those complaints to the governmental bodies responsible for the instruction of the
6 Living in shanties was the joint result of various processes of segregation, chiefly among them the difficult economic situations faced by these immigrants together with a housing market incapable of coping with the raise in the demand for low price habitation on the part of the immigrants.
12
cases forbids discrimination on account of race in a number of areas, including
housing.. So far, three complaints were received by the Commission, concerning
housing or related matters, a not very significant number. Can we then affirm that there
is no discrimination in the housing market in Portugal? Are the phenomena of rejection
of re-housed ethnic minority populations exceptions that occur only when entire
neighbourhoods are moved to new sites? It is difficult to give a definite answer to this
question since racial discrimination in housing has been a fairly neglected research
subject in Portugal. Additionally, news on these phenomena in the media are not often
found. It would be, however, too hasty to just dismiss racial discrimination in housing in
Portugal as simply non-existent. Complaints have reached immigrant associations and
human rights associations, but these have poor recording systems, and their aim is often
helping immigrants and not keeping databases, as we are frequently told. Most of the
complaints concern real estate brokers who refuse to sell houses to individuals with
minority ethnic belonging, especially Africans and Roma. The same happens with
landlords who refuse Black or Roma tenants. Associations also refer the difficulty
immigrants have in getting loans from Banks. For a more thorough knowledge of the
subject, research made according to scientific criteria is needed.
In Portugal the category of ethnic minority does not exist in official statistics, and ethnic
minorities are not recognised as such by law. Portugal’s main official statistics
producer, the National Statistics Institute, doesn’t take into account ethnic belonging in
the census.. Immigrant is a category that is also absent from official statistics, who
divide residents by their nationality. We can say that the Portuguese political culture is
imbued in the universalist tradition, less prone thus to the recognizance of cultural
difference. Therefore positive action directed to ethnic minorities are rare in the
Portuguese political universe. We can see this in the absence of measures directed
specifically to ethnic minorities housing conditions. In the same vein, measures aimed
at the promotion of the ethnicization of certain urban spaces are not a common practice,
though they may be emerging in Lisbon associated with some economic activities. In
sum, immigrants and ethnic minorities benefited from the re-housing programmes
promoted by the Portuguese state, but these programmes were directed to shanty
dwellers in general, not specifically to ethnic minorities or to immigrants.

13
4. LEGISLATION AND POLICIES CONCERNING THE HOUSING SECTOR OF RELEVANCE FOR MIGRANTS AND MINORITIES 4.1 Anti-discrimination legislation concerning housing
In Portugal, discriminatory acts based on racist convictions and attitudes are punishable
through a fairly wide set of legal norms expressed in penal, civil and administrative
laws. These discriminatory acts may manifest themselves in a number of ways, they
may be undertaken either directly or indirectly and result from a range of diverse
factors. Furthermore, the existent legal norms stipulate sanctions applicable to the
different forms and degrees of discrimination.
It is worth noting that the fight against discrimination is already manifest in the
Constitution of the Portuguese Republic (CPR), which, grounded on the principle of
human dignity, establishes a range of fundamental rights, liberties and guarantees that
must be applied in conformity with the Principle of Equality, according to which all
citizens are equal before the law (art. 13 C.P.R.7).
According to the constitutional principle of equal rights to national and foreign citizens
(art. 15 CPR), the rights, liberties and guarantees laid down in the Constitution should
be granted to all foreign citizens legally residing on national territory. In some cases,
this principle is valid even for foreign citizens in irregular situation, given the universal
scope of Human Rights.
Art. 15 of the CPR establishes as a general principle the equitability of rights and duties
between, on the one hand, Portuguese citizens, and, on the other, foreigners and
stateless persons, whether they are settled or merely are in Portugal at the moment.
Furthermore, art. 26, no.1 of the CPR dictates that “Everyone is recognised as having
the right to his or her personal identity, personality development, civil capacity,
citizenship, good name and reputation, image, the right to speak out and the right to the
7 Art. 13 of the Constitution of the Portuguese Republic: “1. All citizens have the same social rank and are equal before the law.
2. No one shall be privileged or favoured, or discriminated against, or deprived of any right or exempted from any duty, by reason of his or her ancestry, sex, race, language, territory of origin, religion, political or ideological convictions, education, economic situation or social circumstances.

14
protection of the privacy of his or her personal and family life and to legal protection
against any form of discrimination”.
As it was referred above the legal framework provides for sanctions in cases of housing
discrimination. Law no. 134/99, dated August 28th, based on the Constitutional
Principle of Equality, forbids discrimination in the exercise of rights on grounds of race,
colour, nationality or ethnic origin. According to art. 4 of this law a list of
discriminatory practices are regarded as misdemeanours and punishable with fines and
other adequate sanctions8.
In the same way, the Commission for Equality and Against Racial Discrimination,
created by Law 134/99, has the task of receiving complaints of racial discrimination in
all areas, including housing. The received complaints are directed by the commission to
the competent government bodies which, in the case of housing discrimination are the
Minister of Public Works, Transports and Housing and the Minister of Cities and
Territory Planning.
4.2 Re-housing programmes The main areas where immigrants have been settling inwere almost exclusively, and
until recently, the Portuguese seacoast, namely the metropolitan areas of Lisbon and
Porto. One of the effects of this urban growth was the development of an illegal
housing market for populations of low income, many of them immigrants and ethnic
minorities. One of the most visible expressions in the Lisbon area of that inordinate
growth and of that parallel market was the emergence of the so-called shantytowns,
large conglomerates of precarious habitations. In Porto the process was somewhat
different. Land speculation led to an overpopulation of some urban quarters which
came to be known as “islands”.
The structure of the housing market played an important role on the process of
integration of immigrants in the urban landscape. In fact, the exiguous rent market that
immigrants had to face at the moment of arrival narrowed their chances of having a
lodging. Thus, the existent housing market was not able to cope with the new demand.
On the other hand, the lack of regulation of urban areas until late (the first Municipal
Plans where enforced in the eighties) allowed for clandestine housing building,
8 A list of these practices related to the housing sector is presented in page 11.

15
particularly shanties, that grew in unplanned urban zones and that subsequently were the
main targets of the Special Re-Housing Programme (PER).
During twenty years the housing supply was reduced to the market offer because of the
congealment of rents and of the adopted strategy by central powers of transferring the
ownership of its property. Backing these strategies was the almost insignificant building
effort by local and cooperative sectors. Meanwhile, the pressure exerted by the demand
was growing on account of people that were looking to improve their living standards
and of internal or external migrant influxes.
Therefore, the supply profile was not adjusted to a growing demand both in quantity and
in quality, reduced as it was to the selling market, thus casting aside all those that didn’t
have purchase power. It was in such an unbalanced market structure that the mismatch
between demand and supply began to be unsustainable. State intervention was thus
thought to be the appropriate strategy to meet the demand and to make viable the
housing market9.
State intervention in housing was not an entirely new procedure. In the period of Estado
Novo – the right-wing dictatorship under the heading of Salazar and then Caetano – the
state assumed an interventionist role in the housing sector through Integrated Housing
Plans that were latter abandoned in the eighties with the cutting off of “Fundo de
Fomento Habitacional” (Housing Fostering Funds) and with the implementation of
IGAPHE (Institute for the Management and Transferring of State Housing Property).
Yet, in the aftermath of the de-colonization process more than 500.000 people arrived at
Portugal. A strong strain was exerted on the housing market, especially in the Lisbon
Metropolitan Area (LMA) where 50% of them ended by staying. This kind of housing
demand dynamited public promotion and, inversely, pushed clandestine building10.
The option that was chosen by the state authorities was therefore to assume a regulatory
function, withdrawing from direct intervention in the market, and purposively acting
through legislation. The enacting of PER in 1993 through Decree-law 163/93 was a first
step towards this direction that would be strengthened by PER-families in 1996. Though
we can find, by the end of the seventies, attempts to finance the social housing sector in
such initiatives as promoting the cooperative movement, throughout the eighties we can
9 Freiras, M.J. (2003) Citizenship and Housing – Searching the complexity of relational generative processes; Phd available only in Portuguese at http://www-ext.lnec.pt/LNEC/DED/NESO/pdf/MJFreitas_Tese_Doutoramento.pdf 10 Fonseca, L. (1990) Territory and Population: from the country to its Metropolitan Area. Memories of the Geographic Studies Scentre, nº14, Lisbon.

16
verify an inverse trend. State policies were directed to endorse general supply and
demand within the market fostering bank credit to housing purchase and making
available govern-subsidized loans. Nevertheless, this kind of policies still left aside
large fringes of the population, especially those that in any case couldn’t reach the high
prices practiced in a housing market that had the higher relative costs in Europe11.
The solution for those who couldn’t afford a house in the formal market was many
times clandestine housing. It must be added that living in shanties or islands is only the
most visible aspect of situations of social exclusion in which these populations, many of
them of minority ethnic background, live. The public programmes of housing promotion
developed by the Portuguese state, like by many others, in order to eliminate such
clusters of exclusion, aimed at giving an opportunity to groups with poor capacities of
residential choice to improve their housing conditions, promoting in this way a greater
equality of inter-group conditions. Such initiatives have been growing in the last
decade, namely under the Special Re-housing programme (PER). It must be said that
these programmes were not specifically directed to ethnic minorities but to the dwellers
of the aforementioned shantytowns, but many of those who lived in shanties where
either immigrants from Africa, or Portuguese citizens of African origin, or Roma
communities as will be shown in the following chapters. Though there are several
initiatives in place, specially carried out by Municipalities (see chapter on
countervailing discrimination) there is no specific programme targeting ethnic and
immigrant minorities in what concerns housing.
Portugal signed the Human Rights Declaration in 1955 recognizing housing rights as a
fundamental component for a higher standard of living and individual well being. The
right to housing for “everyone” is stated on the 1976 Constitution. According to art. 65
of the Constitution – Housing and Urbanism, “Everyone has the right either for himself
or for his family to have a lodging with an adequate size and respecting the conditions
of public health, comfort and family privacy.”
Though this article, apart some modifications, has been kept unchanged since its
enactment, the access to public lodging was, notwithstanding, restricted to Portuguese
citizens, for legal reasons, until late. Decree 797/76 (from 1976) explicitly established
that the access to social lodging was exclusive for Portuguese. Albeit reasons directly
11 Fonseca, L. (1990) Territory and Population: from the country to its Metropolitan Area. Memories of the Geographic Studies Scentre, nº14, Lisbon.

17
connected to the conjuncture could be invoked, this was extended beyond its causes. In
fact, natives from the former colonies were considered part of the Imperial Portugal, and
not immigrants. As a consequence, the public re-housing of populations coming from
Africa was targeted to national citizens. However, by the time the re-housing
programmes were put forward by the Municipalities, this provision was rendered non-
effective. For instance, in the Oeiras Municipality, in 1993, 29% of those covered by the
re-housing programme and 34% of those that were expecting to be on that programme
were foreigners; in Lisbon, foreigners covered by the re-housing were 5% of the total in
1987. In fact this was a pattern followed by most Municipalities where foreigners
inhabited in the Metropolitan areas (see bellow an in-depth exposition of these
numbers). Additionally, since 1996 immigrants in a legal situation are entitled to benefit
from the re-housing programmes in the same way as Portuguese citizens.
The two main programmes in the ambit of re-housing were, as we pointed out, PER
(Special Re-housing Programme)12 and PER-Famílias (Special Re-housing Programme
– Families)13. These were focused in the Lisbon and Porto Metropolitan Areas in order
to eradicate vast shantytowns that had been progressively growing in the eighties14.
Since these were the most needful areas in housing terms they were elected as priority
intervention areas. The surveys conducted by both municipalities allows us to see that
immigrants from the PALOP countries were over-represented in the population that
needed re-housing. The relative weight of Africans in the population that needed to be
Re-housed was much higher than the proportion of Africans in the total population
living in the Lisbon Metropolitan Area. Additionally, we must stress that we have a
considerable number of Portuguese citizens who have African background. According
to some authors this re-housing programme contributed to the reduction of residential
segregation levels of ethnic minorities – specially the poor – due to the assemblage of
ethnic minorities and autochthonous population15.
One of the positive effects of the implementation of these programmes from the point of
view of data collection for the present report was, on a first phase of the application of
the re-housing programmes, the obligation to make an exhaustive survey of the shanties
12 http://www.oim.pt/body_dl163_.html 13 http://www.oim.pt/body_dl79_96.html 14 Decree-law 163/93, that created the Special Re-housing Programme at the Lisbon and Oporto Metropolitan Areas, foresaw the endowment of financial
resources either for the acquisition of housing or for the construction of social housing. The funding was obtained through IGHAPE, which participated in 50% of
the expected expenditure, either for acquisition or for construction.
15 Fonseca, M.L. et all (2002) Immigrants in Lisbon – Routes of integration. CEG, Lisbon University, Studies for Urban and Regional Planning, nº56 pp. 91-92.

18
that existed in the municipalities where the programme was to be implemented. This
survey comprised the characterization of the families to be re-lodged, contemplated on
article 4 of the same decree-law16.
After this first Programme another one, the PER – Famílias (decree-law º 76/96 of the
20th July) was launched in order to regulate the participation and financing in the
support to the acquisition or rehabilitation of houses by the families covered by
PER17.However, findings show that not all intended results were attained through the
process of relocation. Social problems that were pervasive in slums were transferred to
the new neighbourhoods.
16 see chapter on Data analysis.

19
5. DESCRIPTION AND ANALYSIS OF EXISTING DATA AND SOURCES IN THE HOUSING SECTOR 5.1 A brief overview of the foreigners spatial distribution in Portugal. Since cities are the places where social and economic resources are concentrated, and
where several social and interest groups are found in interaction18, it is not surprising
that immigrants, not only in Portugal but also in other host societies, concentrate mainly
in urban centres19.
And, in fact, when we analyse the distribution of resident foreigners in Portugal by
district we notice their concentration in seaboard towns, mainly Lisbon (54.1%), Faro
(13%), Setúbal (10.3%) and Oporto (5.8%) (See table below).
Table 1 - Foreign residents with legal status by district (2001) Districts N(1999) % N (2001) %
Lisbon 105362 55,2 121039 54,1 Faro 24947 13,1 29275 13 Setúbal 17963 9,4 23191 10,3 Oporto 11408 6,0 13125 5,8 Aveiro 7209 3,8 8207 3,7 Coimbra 4708 2,5 6008 2,7 Braga 3088 1,6 3618 1,6 Leiria 2499 1,3 2998 1,3 Madeira 2385 1,2 2836 1,3 Azores 2528 1,3 2605 1,2 Santarém 1453 0,8 1805 0,8 Viseu 1315 0,7 1606 0,7 Viana do Castelo 1341 0,7 1602 0,7 Beja 933 0,5 1159 0,5 Évora 888 0,5 1061 0,5 Guarda 693 0,4 847 0,4 Portalegre 590 0,3 768 0,3 Castelo Branco 575 0,3 719 0,3 Vila Real 682 0,4 713 0,3 Bragança 329 0,2 420 0,2
Total 190 896 100 223602 100 Source: National statistical Institute, Demographic Statistics, 1999 Reference: Border and Alien service, Ministry of Internal Affairs
18 Arnaud, L. e Pinson, G. (2002), Shaping the identity and mobilising the «ethnic capital» in three European cities, paper prepared for the Second EuroConference Urbanism and Globalization, “The European City in Transition”, Weimar, 8th e 9th November. 19 OECD (1998), Immigrants, Integration and cities. Exploring the links, Paris: Organisation for
economic co-operation e development.

20
This has been a virtually constant pattern of the settlement of immigrant communities in
Portugal. Three types of factors explain this stable pattern in the geographical
distribution of immigrants: on the one side, the existence of informal migratory
networks, structured since the middle of the 70´s20; on the other side, the concentration
of job opportunities for immigrants in the great metropolitan areas of the country; and,
finally the increase in population due to natural growth.
On the other hand, spatial concentration of immigrants and ethnic minorities has been
giving visibility to the migratory phenomenon. The concentration of foreigners in
certain zones of Portugal, taking into consideration its relative weight in the total of the
resident population makes this even more apparent. As we can see by the table bellow
foreign population weights 2,2% in the total of the resident population; yet it is in the
Algarve region (7,4%) and Lisbon and Tagus Valley (5,4%) that we can find the highest
rates of residence.
Table 2 - Foreigners with residence permit comparing with the total of the population, by country regions in 2001
Regions
Total of the resident
population Foreigners with residence permit
% of foreigners in relation with the total
population North 3687293 18595 0,5 Centre 2348397 20385 0,9 Lisbon and Tagus Valley 2661850 144230 5,4 Alentejo 776585 4793 0,6 Algarve 395218 29275 7,4 Azores 241763 2605 1,1 Madeira 245011 2836 1,2 Portugal 10356117 223602 2,2
Source: Census 2001 - National statistical Institute, Demographic Statistics,
and Border and Alien service’ statistical Report - Ministry of Internal Affairs
In fact, in 2001 the pattern of settlement of the communities of resident immigrants was
the same, namely concerning the districts of Lisbon, Faro, Setúbal and Porto, which still
have a larger number of resident foreigners. Lisbon continues to be the destination of
the majority of the 223,602 of the resident foreigners, with 54.1% of the total number
and if we consider the Lisbon region (Lisbon and Setúbal districts) the number of
immigrants amounts to almost 65% of the total immigrant population with a residence
20 As we will see bellow, the settlement of Cape-Verdians was earlier, having occurred since the sixties (Saint-Maurice, 1997).

21
permit, and over 80% of Africans are concentrated in this region. The fact that it is the
district with the highest concentration of service industries and jobs, apart from being
the “door” into the country, explain this hypertrophy. In fact, the attractive force of this
zone has been so emphasised that Rocha Trindade21 supports that, regarding ethnicity,
the Lisbon Metropolitan Area is the most heterogeneous area in the country.
On the other hand, taking into account that the first migratory fluxes to Portugal settled,
in their great majority, in municipalities of the Lisbon Metropolitan Area, they
developed networks of solidarity and welcoming who led, by its turn, to the arrival of
new immigrant fluxes to those areas22. Thus, the residential concentration seems more
like a result of the options taken by the immigrants at the moment of their arrival (since
they opt to stay close to the population of origin) then of strategies of spatial segregation
of the Portuguese society.23
Nevertheless, this pattern of concentration, relatively stable, suffered quick changes
from the end of the nineties onward, with the arrival of a new migratory flux, composed
mainly of Eastern Europeans24.
Table 3 - Distribution of foreign population with residence permit and permanence permit by NUT II
Residence Permit (2000)*
Permanence Permit
(2001)**
Regions N % N % North 21966 10,6 21017 17,6 Centre 14081 6,8 14139 11,9 Lisbon and Tagus Valley 137202 65,9 56873 47,7 Alentejo 2718 1,3 6225 5,2 Algarve 27109 13,0 16982 14,2 Madeira 2538 1,2 2498 2,1 Azores 2584 1,2 1447 1,2 Total 208198 100 119181 100
21 Rocha Trindade, M. B. (1995), Sociologia das Migrações [Sociology of Migrations], Lisboa: Universidade Aberta. 22 Malheiros(1996) op. cit. and Saint-Maurice, A. (1997) Identidades Reconstruídas: Cabo-Verdianos em Portugal [Reconstructed Identities: Cape-Verdians in Portugal], Oeiras: Celta Additionally, 17,8% of the “retornados” (people that returned from Africa after the decolonisation) from the ex-colonies, from the seventies onward, have settled down in Lisbon Metropolitan Area (Rocha Trindade, 1995:203). 23 Notwithstanding, as we will see bellow, the existence of media reports and complaints about situations of segregation and discrimination in the access to housing in certain areas of Portugal (felt mainly by Roma). 24 Pires, R. P. (2002), Mudanças da imigração. Uma análise das estatísticas sobre a população estrangeira em Portugal, 1998-2001 [Changes in immigration: an analysis of the statistics on the foreign population in Portugal, 1998-2001], in Sociologia, Problemas e Práticas, nº39, pp. 151-166.

22
Source: Malheiros, 2002:78
* Stock acumulated until 31/12/200
** Permits issued between January and December 2001
As can be seen in table 3, there is a clear difference in the spatial distribution between
the population who held a residence permit in 2000, and the ones who were granted a
permanence permit in the 2001 extraordinary legalization, most of them from the former
soviet bloc. A greater spatial distribution is verified for the latter, with the decrease in
the levels of concentration of foreigners in the region of Lisbon and Tagus Valley, and
its respective increase in the other regions (with the exception of Azores).
On the other hand it becomes clear that the geographic concentration changes according
to the different immigrant origins (see below).
Table 4 - Foreign Residents by district (2001) ** Districts
of Total of foreign
population*(a)
Africa Europe America Asia
residency N. % N. % N. % N. % N. %
Lisbon 121039 54,1 71755 67,1 26384 39,4 16372 41,8 6145 63,9
Faro 29275 13,1 7650 7,2 17787 26,6 2655 6,8 971 10,1
Setúbal 23191 10,4 17846 16,7 3020 4,5 1659 4,2 609 6,3
Oporto 13125 5,9 2726 2,5 5358 8,0 4251 10,8 764 7,9
Aveiro 8207 3,7 1353 1,3 1709 2,6 4913 12,5 215 2,2
Coimbra 6008 2,7 1514 1,4 2690 4,0 1574 4,0 197 2,0
Braga 3618 1,6 742 0,7 1361 2,0 1350 3,4 157 1,6
Leiria 2998 1,3 737 0,7 1249 1,9 898 2,3 101 1,0
Madeira 2836 1,3 273 0,3 1578 2,4 910 2,3 50 0,5
Azores 2605 1,2 335 0,3 673 1,0 1553 4,0 36 0,4
Santarém 1805 0,8 581 0,5 733 1,1 392 1,0 89 0,9
Viseu 1606 0,7 242 0,2 474 0,7 830 2,1 54 0,6
Viana do Castelo
1602 0,7 154 0,1 925 1,4 472 1,2 51 0,5
Beja 1159 0,5 111 0,1 927 1,4 103 0,3 15 0,2
Évora 1061 0,5 241 0,2 617 0,9 158 0,4 40 0,4
Guarda 847 0,4 143 0,1 288 0,4 388 1,0 27 0,3
Portalegre 768 0,3 157 0,1 494 0,7 90 0,2 25 0,3
Castelo Branco
719 0,3 146 0,1 321 0,5 213 0,5 36 0,4
Vila Real 713 0,3 159 0,1 208 0,3 325 0,8 21 0,2
Bragança 420 0,2 113 0,1 177 0,3 108 0,3 20 0,2
Total 223602 100 106978 100 66973 100,0 39214 100,0 9623 100,0 Source: Demographic Statistics 2001, INE, 2002.
www.idict.gov.pt/docum_igt/acime

23
(a) The total foreign population only refers to the following continents: Africa, Europe,
America and Asia. The reason for this choice derives from the fact that these are the categories
shown in demographic statistics.
** Marked bolt are the most significant occurrences, i.e., the districts where the majority of
foreigners are concentrated.
The African population is mainly concentrated around Lisbon and Setúbal (over 80%
are concentrated in this region), being the population who is less dispersed in the
country. This tendency results from the history of the presence of Africans in Portugal
(one of the most long-standing) and of their situation in the labour market. These
immigrants have been coming to Portugal since the end of the sixties, especially the
Cape-Verdeans, to satisfy the regional non-qualified workforce needs in industry and
construction works. These workforce needs arose from the high numbers of Portuguese
emigration as well as from the mobilization of large amounts of young people to the
colonial war.25
Taking into account that since early this population consists mainly of labour migrants,
it has concentrated in the regions where the workforce demand for construction and
public works is located, that is, they have settled since the beginning in the Lisbon
Metropolitan Areas, and in lesser proportion in Algarve and Porto.
The Asian population, by its turn, can be seen mainly in Lisbon, Faro and Porto. People
from the Americas are more widely scattered throughout the country, as can be seen in
the table nº 4, and that can be partly explained by the large dissemination of Brazilians
all over the country.
The majority of the foreigners from Europe live in Lisbon, but a significant number live
in Faro. A slight difference can also be found in the demand for Alentejo districts (e.g.
Évora and Beja), in comparison with other foreign populations, resulting from the
interest of a number of foreigners, mainly from Northern Europe, in Agricultural
investment.
25 It is impossible to calculate with precision the number of immigrants that came to Portugal until the middle of the seventies, because in that period the workers from the Portuguese colonies (e.g. Cape-verdeans, Angolans, Mozambicans, Guineas) were not considered foreigners, but Portuguese circulating in the portuguese territory (França, 1992:76).

24
Table 5 - Foreigners living in Portugal holding a permanence permit by district (2001)
Eastern Europe PALOP Others
TOTAL Ukraine Moldava Romania Russia C. Verde Angola G. Bissau Brazil China Pakistan India
Districts of residency
N % N % N % N % N % N % N % N % N % N % N % N % Aveiro 6.319 4,5 3.635 7,1 235 2,4 115 1,4 784 14,3 43 0,6 54 0,8 43 1,0 506 2,0 86 2,6 6 0,2 23 0,8 Beja 1.800 1,3 756 1,5 120 1,2 179 2,1 54 1,0 30 0,5 23 0,4 54 1,3 295 1,1 28 0,8 76 2,7 33 1,2 Braga 6.032 4,3 3.455 6,8 160 1,7 305 3,6 397 7,3 14 0,2 99 1,5 48 1,2 664 2,6 99 3,0 88 3,1 33 1,2 Bragança 360 0,3 177 0,3 7 0,1 8 0,1 22 0,4 0,0 7 0,1 5 0,1 53 0,2 18 0,5 3 0,1 8 0,3 Castelo Branco 1.537 1,1 915 1,8 54 0,6 91 1,1 61 1,1 16 0,2 13 0,2 7 0,2 159 0,6 42 1,3 10 0,3 10 0,3 Coimbra 4.851 3,4 2.242 4,4 178 1,9 277 3,3 223 4,1 34 0,5 109 1,7 288 7,0 412 1,6 49 1,5 87 3,0 87 3,0 Évora 4.509 3,2 1.570 3,1 342 3,6 421 5,0 117 2,1 110 1,7 110 1,7 167 4,0 723 2,8 50 1,5 195 6,8 195 6,8 Faro 18.853 13,3 7.435 14,6 2.510 26,1 2.019 23,9 860 15,7 456 6,9 266 4,1 467 11,3 2.451 9,4 320 9,7 116 4,1 116 4,1 Guarda 1.000 0,7 530 1,0 27 0,3 25 0,3 33 0,6 0,0 7 0,1 4 0,1 135 0,5 16 0,5 33 1,2 33 1,2 Leiria 8.667 6,1 5.734 11,3 653 6,8 98 1,2 389 7,1 153 2,3 113 1,8 49 1,2 827 3,2 103 3,1 41 1,4 41 1,4 Lisboa 48.421 34,2 9.563 18,8 2.683 27,9 2.913 34,5 989 18,1 4.523 68,2 4.284 66,4 2.199 53,3 12.715 49,0 1.138 34,3 1.188 41,5 1.188 41,5 Portalegre 1.747 1,2 400 0,8 130 1,4 225 2,7 18 0,3 42 0,6 52 0,8 40 1,0 346 1,3 42 1,3 75 2,6 75 2,6 Porto 12.980 9,2 5.510 10,8 440 4,6 318 3,8 726 13,3 119 1,8 357 5,5 128 3,1 1.933 7,5 851 25,7 194 6,8 194 6,8 Santarém 5.808 4,1 3.465 6,8 496 5,2 358 4,2 197 3,6 44 0,7 111 1,7 111 2,7 502 1,9 87 2,6 113 3,9 113 3,9 Setúbal 13.714 9,7 2.563 5,0 1.301 13,5 951 11,3 329 6,0 1.028 15,5 767 11,9 455 11,0 3.639 14,0 316 9,5 600 21,0 600 21,0 Viana do Castelo 984 0,7 557 1,1 42 0,4 30 0,4 84 1,5 4 0,1 9 0,1 4 0,1 89 0,3 25 0,8 16 0,6 16 0,6 Vila Real 717 0,5 482 0,9 22 0,2 3 0,0 54 1,0 2 0,0 10 0,2 2 0,0 50 0,2 24 0,7 7 0,2 7 0,2
Viseu 3.337 2,4 1.909 3,8 203 2,1 96 1,1 136 2,5 17 0,3 63 1,0 54 1,3 441 1,7 21 0,6 14 0,5 14 0,5
Total 141.636 100 50.898 100 9.603 100 8.432 100 5.473 100 6.635 100 6.454 100 4.125 100 25.940 100 3.315 100 2.862 100 2.786 97,3
Source: Report on the Evolution of the Migratory Phenomenon, March 2002, IGT, ACIME, SEF;

25
But it is the immigrants from Eastern Europe that show the widest territorial dispersion,
apart from the fact that they have settled in districts where a tradition of immigration did
not exist (note the figures for Santarém, Braga and Aveiro) and they have also been
responsible for the dramatic increase in immigration in certain areas of the country. (see
table n. 4).In fact, the new immigration goes against the tendency shown by earlier
migratory flows to settle on the seaboard. According to General Labour Inspectorate
[IGT] data, the highest increase in immigrant population has happened in districts of the
interior and the community with the widest geographic dispersal is the Ukrainian,
immediately followed by the Moldavians. For the former, the population distribution is:
Lisbon (9,563), Faro (7,435), Leiria (5,734) and Aveiro (3,635), which immediately
shows an absolutely unique distribution pattern when compared to other migratory
flows, who used to be concentrated mainly in the greater Lisbon. The fact that the
increase in the percentage of immigrants is bigger in interior districts, as opposed to a
tradition of immigrants settling by the west seacoast and in large cities, is an important
fact in counteracting desertification. That is the case of Portalegre (+ 346.9%), Évora (+
416%), Beja (+ 277.7%), Castelo Branco (+ 284.3%), Viseu (+ 247.3%), Guarda (+
243.8%), Vila Real (+ 209.2%), Bragança (+ 232.5%). The district with the highest
increase was Santarém (+ 606.9%).26 (see in annex)
Several factors have contributed to this change in the territorial pattern. On the one
hand, the types of immigration themselves, which, contrary to previous flows, are the
result of direct contracts and, therefore, do not depend on the previous creation of a
community network that would support immigrants; on the other hand, the professional
profiles themselves which, as a result of higher qualifications, give these immigrants
greater flexibility in their job integration, that is, a greater capacity to respond to labour
demands. Notwithstanding, data on these communities (regarding housing) is even
scarcer than for the rest. Their national dispersion and newness makes difficult the
collection of data. The only existing sources are news from the media that often account
for the living conditions of these communities.
By its turn, the difficulty in collecting non-aggregated statistical information is a limit to
the analysis of both the spatial distribution of immigrants in Portugal, and of their
26 Relatório sobre a Evolução do Fenómeno Migratório [Report on the Migratory Phenomenon], March, 2002, IGT, ACIME, SEF; www.idict.gov.pt/docum_igt/acime

26
housing conditions. Official data give us the presence of foreigners in the different
districts but their degree of spatial concentration is not specified, that is, the district may
have different levels of population density inside it , depending of the municipality or
even the neighbourhood27.
Regarding the numbers of total immigrant and ethnic minority population inhabiting
shantytowns we should be careful. The fact that official Portuguese statistics are usually
not up-to-date is one of its chronic features. The shortcomings are bigger in regard to
immigrants’ statistics; thus numbers differ between the National Statistics Institute
(INE) and those conveyed by Municipalities. Therefore, we should look, at a more
concrete level, to some of the Municipalities that comprise the biggest number of
rundown neighbourhoods in which ethnic and immigrant presence is more relevant.
The utilization of case studies becomes indispensable to give a more approximate image
of the concentration of foreign population in certain places or neighbourhoods, and in
this way of the occurrence of cases of spatial segregation.
5.2 Data on Housing Standards
It is in the municipalities of the Lisbon Metropolitan Area (e.g. Amadora, Almada,
Loures, Oeiras, Cascais) where a greater concentration of populations of foreign origin
exists, a trend verified since 196028.
It is also in this metropolitan region that we find the majority of the resident population
living in illegal shantytowns29. Looking at the table below it becomes apparent that it is
precisely in zones where the foreign population is concentrated that a bigger incidence
of shanties is verified.
Table 6 - Distribution of classic and non-classic (shanties) dwellings and foreign population by country’s region, 2001
Foreign population Shanties Classic dwellings Geographic zone 2001 % 2001 % 2001 % North 18595 8,3 1747 15,1 1182065 33,3 Centre 20385 9,1 1320 11,4 827768 23,3 Lisbon and Tagus Valley 144230 64,5 6810 59,0 970762 27,3
27 For instance, for the Lisbon Metropolitan Area, despite of being the zone displaying the biggest concentration of foreigners in Portugal, its spatial distribution is not homogeneous. Population lives mostly along the public transport lines (Fonseca et al 2002:16). 28 Malheiros, 1996:93 29 Fonseca et al 2002:36

27
Alentejo 4793 2,1 757 6,6 285913 8,1 Algarve 29275 13,1 551 4,8 144040 4,1 Azores 2605 1,2 159 1,4 69142 1,9 Madeira 2836 1,3 196 1,7 71539 2,0 Portugal 223602 100 11540 100 3551229 100
Source: Censos 2001 - National statistical Institute, Demographic Statistics,
and Border and Alien service’ statistical Report - Ministry of Internal Affairs
The demographic pressure that existed in Lisbon since 1950, with the arrival of national
migratory fluxes and, particularly, from 1975 onwards, of influxes of foreigners,
engendered an increase in housing demand that, as we already referred, was not met by
the private market nor by the central and local re-housing programmes30.Furthermore,
as Rocha Trindade argued,31 the difficulties that foreign citizens endured in order to
have access to subsidised loans to acquire their own dwelling led to an increase of
clandestine and derelict neighbourhoods at the outskirts of the main urban centres in the
country, which are devoid of hygiene, security and healthfulness.
A study carried out by Bruto da Costa and Manuel Pimenta32 for the Lisbon
Municipality, surveyed 130 derelict neighbourhoods in the Great Lisbon counting
approximately 50.000 persons, where poverty and social exclusion mixed with spatial
concentration and ethnic segregation. It was in order to fight this state of affairs that the
Portuguese Government, in conjunction with local municipalities, carried through the
abovementioned special programme in social housing (the Special Re-housing
Programme – PER) for the eradication of shanties in the Lisbon and Oporto
Metropolitan Areas.
And in fact data from 2001 (see table bellow) show a decrease in the number of people
living in shanties, specially in Oeiras and Lisbon.
30 Fonseca et al. 2002:34 31 Rocha Trindade, M. B. (1995) op. cit. p. 204 32 Bruto da Costa, A. e Pimenta, M. (1991), Minorias Étnicas Pobres em Lisboa: Resultados
preliminares de um inquérito aplicado a famílias residentes em bairros degradados, [Poor Ethnic Minorities in Lisbon: Preliminary results of an inquiry applied to families living in derelict neighbourhoods] Lisboa: Centro de Reflexão Cristã / Câmara Municipal de Lisboa.

28
Table 7 - Shanties’ distribution by region (1991 e 2001)
Shanties Rate of Change
1991 % 2001 % North 1957 12,2 1747 15,1 -10,7 Centre 1086 6,7 1320 11,4 21,5 Lisbon and Tagus Valley 11948 74,2 6810 59,0 -43,0 Alentejo 264 1,6 757 6,6 186,7 Algarve 352 2,2 551 4,8 56,5 Azores 270 1,7 159 1,4 -41,1 Madeira 228 1,4 196 1,7 -14,0 Portugal 16105 100 11540 100 -28,3
Source: 2001 Census - National statistical Institute, Demographic Statistics,
and Border and Alien service’ statistical Report - Ministry of Internal Affairs
Being as it may, mass media warn to the fact that several persons, especially foreigners,
stood at the margin of these processes. Furthermore, only the individuals that were
registered in the 1993 survey, made in the ambit of the re-housing program, were
entitled to benefit from PER, leaving thus many immigrants today living in Portugal
outside the measure.
On the other hand, as Fonseca33 argues re-housing policies don’t seem to have dwindled
the social and economic segregation level. Actually, re-housing in the same zones where
the population lived in shanties doesn’t preclude the negative image of those spaces.
We should stress, however, that when we are referring to immigrants’ residential
segregation or concentration either in derelict urban areas or in social housing, we are
mainly referring to non-European immigrants34. Rather, it seams that a racial hierarchy
is in place resulting from the economic and social structural position in the Portuguese
society.
33 Fonseca (2002) p. 39 34 The Chinese case is perhaps an exception. There is no knowledge of their presence in shanties, derelict areas or in social housing.

29
5.3 Shantytowns and Re-housing If based on 1997 data, when a characterization of the Re-Housing Special Program was
elaborated for the Lisbon Metropolitan Area, we find out that, although the majority of
the persons that lived in shanties at that time, mainly at Lisbon suburbs, had Portuguese
background, we can find a significant concentration of people with origin in the
PALOP– (African Countries having Portuguese as their Official Language) - Angola,
Mozambique, Cape Verde, Guinea, Sao Tome.
In fact, shantytown’s residents in the Lisbon Metropolitan Area were in its majority
Portuguese (79%), followed by people born in the PALOP (20,1%). Foreign residents
from other nationalities, namely from the EU (European Community) and Brazil are not
in a very significant number. However, it’s necessary to take into consideration that
many immigrants from the PALOP have now Portuguese nationality, which may, in this
particular case, make it impossible to untangle the real ethnic origin of these
populations.
According to data collected from a 1999 Report elaborated by the CET [Territorial
Studies Centre] in cooperation with the GES35 [Social Ecology Group]36 there was a
total population of 115641 residents living in precarious conditions of lodging,
integrating 34498 families, in the Lisbon Metropolitan Area; Oporto Metropolitan Area
registered a total of 39776 residents living also in precarious conditions, which
composed about 14269 families37.
As to the nationality of the population surveyed by Municipality, some differences can
be noticed. Regarding the Lisbon Metropolitan Area, some Municipalities present a a
share of people with Portuguese origin above 90, showing a very small presence of
immigrant population.
Yet, other Municipalities present significant percentages of resident foreign population,
such as: Seixal, with 44% of its population surveyed by the PER being of foreign origin;
Almada, with 36%; Cascais, with 33%; Loures, with 33%; Amadora with 30%; Sintra
with 24% and finally Oeiras, with 23%38. There is an almost geometrical distribution of
the Municipalities that lodge large percentages of foreigners, and it is possible to
35 Organization NFPPT0060 36 INH – Instituto Nacional de Habitação (1999) “ Diagnóstico sobre Implementação do Programa PER nos Municípios das Áreas Metropolitanas de Lisboa e Porto”, Lisboa. 37 These data report to the Municipality Census done in 1993. 38 All these municipalities are in the Outskirts of Lisbon. Both Almada and Seixal, are in the south bank of the Tagus River, unlike the others.
30
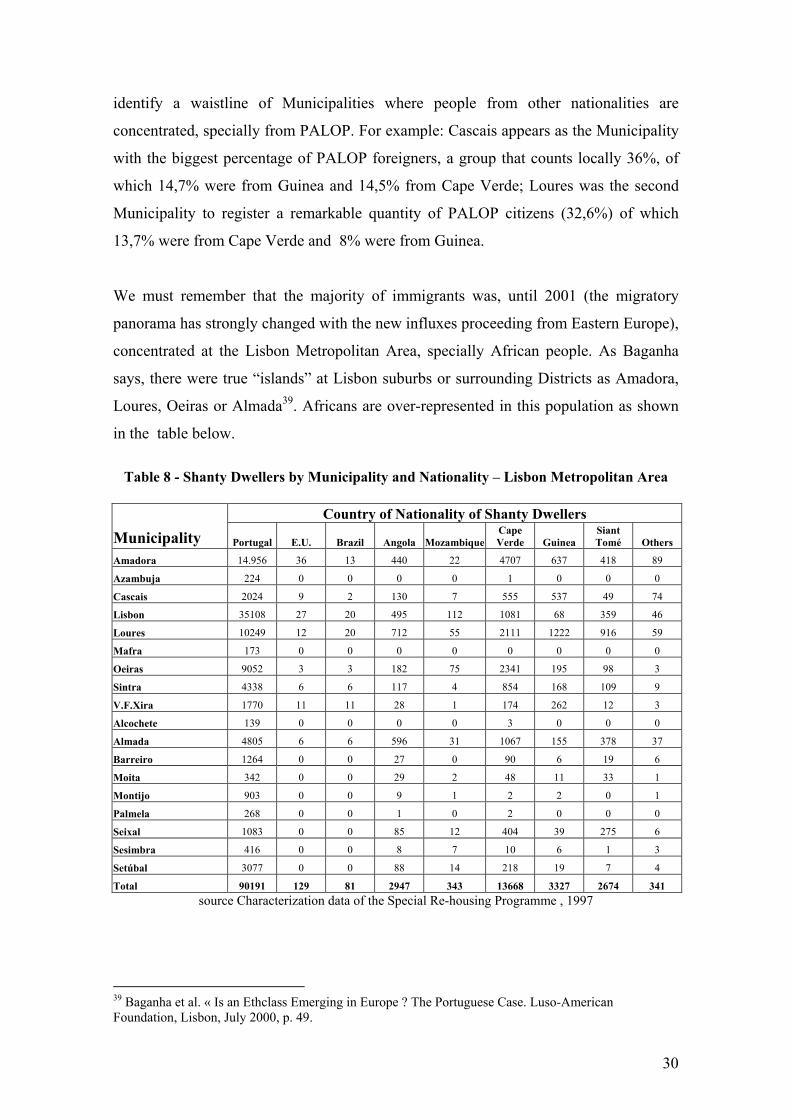
identify a waistline of Municipalities where people from other nationalities are
concentrated, specially from PALOP. For example: Cascais appears as the Municipality
with the biggest percentage of PALOP foreigners, a group that counts locally 36%, of
which 14,7% were from Guinea and 14,5% from Cape Verde; Loures was the second
Municipality to register a remarkable quantity of PALOP citizens (32,6%) of which
13,7% were from Cape Verde and 8% were from Guinea.
We must remember that the majority of immigrants was, until 2001 (the migratory
panorama has strongly changed with the new influxes proceeding from Eastern Europe),
concentrated at the Lisbon Metropolitan Area, specially African people. As Baganha
says, there were true “islands” at Lisbon suburbs or surrounding Districts as Amadora,
Loures, Oeiras or Almada39. Africans are over-represented in this population as shown
in the table below.
Table 8 - Shanty Dwellers by Municipality and Nationality – Lisbon Metropolitan Area
Country of Nationality of Shanty Dwellers
Municipality Portugal E.U. Brazil Angola MozambiqueCape Verde Guinea
Siant Tomé Others
Amadora 14.956 36 13 440 22 4707 637 418 89
Azambuja 224 0 0 0 0 1 0 0 0
Cascais 2024 9 2 130 7 555 537 49 74
Lisbon 35108 27 20 495 112 1081 68 359 46
Loures 10249 12 20 712 55 2111 1222 916 59
Mafra 173 0 0 0 0 0 0 0 0
Oeiras 9052 3 3 182 75 2341 195 98 3
Sintra 4338 6 6 117 4 854 168 109 9
V.F.Xira 1770 11 11 28 1 174 262 12 3
Alcochete 139 0 0 0 0 3 0 0 0
Almada 4805 6 6 596 31 1067 155 378 37
Barreiro 1264 0 0 27 0 90 6 19 6
Moita 342 0 0 29 2 48 11 33 1
Montijo 903 0 0 9 1 2 2 0 1
Palmela 268 0 0 1 0 2 0 0 0
Seixal 1083 0 0 85 12 404 39 275 6
Sesimbra 416 0 0 8 7 10 6 1 3
Setúbal 3077 0 0 88 14 218 19 7 4
Total 90191 129 81 2947 343 13668 3327 2674 341 source Characterization data of the Special Re-housing Programme , 1997
39 Baganha et al. « Is an Ethclass Emerging in Europe ? The Portuguese Case. Luso-American Foundation, Lisbon, July 2000, p. 49.

31
Also among the immigrant populations different settling patterns of the degraded areas
are noticed.
By looking at the above Table we can verify that Cape Verdean population (data are
referred to 97, but in the meantime the re-lodging process was being carried out) were
the greatest group living in neighbourhoods with precarious conditions in the Lisbon
Metropolitan Area (13668 individuals). Next appears Guinea population (3327
individuals) and Angola population (2947 individuals).
In fact, when we compare with the total figures for the immigrant population, broken
down by nationality, in the same year, we conclude that a most remarkable disparity is
verified between the number of PALOP immigrants living in shanties, and those of
other origins, such as Brazil or Europe. Of the total Cape Verdean immigrants living in
Portugal in 1997 those that lived in shanties were 34%. For Brazil the proportion was
only of 0,04%. For Sao Tome, its population being one of the least significant in the
total of migratory fluxes, we find a total of 62% living in conditions of precariousness (
see table 9). Considering the total number of PALOP residents (and only in the Lisbon
area), 30% of them was living in shanties. It means 13% of the total number of
immigrants in 1997.
In short, considering that immigrant population is mainly concentrated in the Lisbon
Metropolitan Area and pointing out that this population is on its majority from African
origin, we can affirm with some certainty that a particular incidence of Africans was
registered at the more degraded neighbourhoods. Not talking directly about racial
segregation, these figures point nonetheless to an accentuated spatial segregation.
There’s no doubt that the social and economical precariousness which was affecting
PALOP immigrants has strongly contributed to this outcome.
Table 9 - % of foreign population living in Shanties in the Lisbon Metropolitan Area in
relation to the total of immigrants by nationality.%
Nationality Absolute Numbers*% total
population ** % of foreign population
living in shanties** Angola 16296 0,17 0,18 Cape Verde 39789 0,42 0,34 Guinea 12785 0,13 0,26 SaintTomé 4304 0,04 0,62 Mozambique 4426 0,05 0,08 PALOP 77600 0,44 0,30 Brazil 19990 0,21 0,004 Europe 49747 0,53 0,003

32
T. Imigrants 175263 1,87 T.Population 9382200 100 *source: Demographical Statistics, 1997 **source Characterization data of the Special Re-housing Programme , 1997
The existing house amenities are another of the possible indicators of living conditions.
Also according to Baganha, in 1991 almost 14% of foreign residents in Portugal were
living in houses with few or any sanitary conditions. Here also, underlines the author,
the percentage of PALOP immigrants (22%) is highly superior to the remaining
immigrant population. Cape Verdeans appear as the most representative (31%) while
there are only 11% registered for Europe and for Brazilians this figure stands at a mere
7% (see table below). But if we look at the specific lodging conditions we can verify
that, notwithstanding the concentration in certain degraded areas which affects PALOP
populations, Roma are, however, the group which presented more needs referring to
housing conditions. As a matter of fact, at the beginning of the 90’s, almost 80% of the
Portuguese Roma population hadn’t tap water; in the same way 76% of them had no
bathing conditions and about 60% of the houses had not any kind of sanitary equipment.
Table 10 - Housing Conditions by Community, 1990 (Percentages)
Nationality Without water Without electricity Without bath Without sanitation Cape Verde 33,2 15 41,6 9,5Angola 33,6 17,3 36,1 9,3Mozambique 23,2 5,9 29 5,8S. Tome 46,4 26 47,4 13,4Guinea 22 11,1 18,1 7,9India 34,8 19,7 38,6 5,3Roma 68,8 44,6 75,9 60,7Total 35,4 18,4 39,8 14source: Costa et. al., 1991 in Baganha et. al, 2000
Referring to income levels, we find out that these were generally low, so it can be
concluded that economic precariousness is a permanent factor at degraded housing
contexts. In the group of Municipalities integrating the Lisbon Metropolitan Area,
62,6% of the surveyed population was declaring monthly incomes inferior to 25.000
esc. (125 €), 16,4% declared having an income between 125 and 250 €, while 14,1%
were situated at the 255 to 369 € rank and about 7% declared having incomes between
379 and 1000 €. The same low levels detected for LMA (Lisbon Metropolitan Area) are
equally found at the ones surveyed in Porto Metropolitan Area. 36% of the inhabitants

33
declared having incomes inferior to 125 €., 23,5% affirm having incomes between 125
€ and 250 €, and 17,2% were placed at the 255 € to 369 € rank, remaining 7% at the 379
€ to 1000 € rank.
By observing the income according to each nationality it is not so linear as we might
guess at start40.
Table 11 - Income according to each nationality
Municipality
Angola Brazil U.E. Cape Verde Guinea Mozambique Portugal
Saint Tomé Others
Amadora 135,5 137,5 68,5 130,5 224 134 103,5 112,5 39,5 Azambuja 290 138 Cascais 94,5 150 159,5 274 114,5 106 151 42,5 Lisbon 125 124 85 179,5 168 118,5 134,5 134,5 116,5 Loures 173 38 23,5 159,5 200 116,5 94 136 44 Mafra 175 Oeiras 104,5 82,5 12 178 212 118 109,5 154,5 292 Sintra 70 57 39 158 163,5 225 87,5 99,5 47 V.F.Xira 97,5 171,5 104,5 238 81 196,5 Alcochete 319 118 Almada 157 83,5 194 222 215 128,5 123 140,5 165,5 Barreiro 98,5 159 41 80 183 Moita 52,5 215 164,5 112,5 76,5 149 300 Montijo 132 25 242,5 291,5 120 Palmela 137,5 58 Seixal 108 155 189 93,5 31 112,5 83,5 Sesimbra 77,5 100 85,5 104 125 Setúbal 86,5 138,5 119 63 96 131 207 Total 136,5 75,5 67,5 159 206,5 121,5 113,5 130,5 70,5
source Characterization data of the Special Re-housing Programme , 1997
Of the foreign residents surveyed by PER Brazilians and people born in the European
Community are those which, in average, present smaller incomes; 75,5 € (Brazil) and
67,5 € esc. (EU). Although all the groups were showing low incomes Guinea people and
Angola people are the groups that present higher income average in the total of Lisbon
Metropolitan Area Municipalities.
40 Note that there are no published data about incomes per each nationality for Porto Metropolitan Area; but the fact that nearly all of its inhabitants is of Portuguese nationality doesn’t leave much room for comparison.

34
5.4 Immigrants and Portuguese in Shanties: a comparative perspective
A comparison is needed as to the housing conditions of immigrants vis-a-vis
Portuguese. As abovementioned, the population living in shanties, in spite the
representations conveyed in the media, was composed mainly of Portuguese. But even
in shanties a comparison would be interesting among Portuguese and foreign
immigrants. Unfortunately there is no updated data that would allow us such a
comparison as to the present situation. Therefore, we have to go back until the
beginning of the nineties to have such a comparison, which was made in 1994 for the
derelict neighbourhoods in the Lisbon area41. The basis for this analysis were two
surveys: one focusing in the national population comprising 475 cases; the other
focused on ethnic minorities with migrant background and comprised 1061 families
from an estimated total of 50000; from this Roma were withdrawn on account of not
being immigrants and the final survey stood at 949 families. The former was conducted
in 1989 and the latter in 1990. Both surveys were applied in the Lisbon Region.
Following these procedures a set of indicators was obtained that allows comparing the
lodging conditions of immigrants and nationals living in derelict quarters in the Lisbon
area and its outskirts42.
Some conclusions might be summed up. First, nationals are more likely to live in re-
housing neighbourhoods, in classic lodgements, than immigrants are. The majority of
immigrants at that time lived in shantytowns. Additionally, the density in-housing is
bigger among immigrants than among nationals. For instance, 56% of the lodgements
with only one division were inhabited by families with three or more individuals; 55%
of all the dwellings with two divisions were inhabited by families with four or more
elements; and finally, 34% of all the dwellings with three divisions were occupied by
families with six or more elements.
Regarding nationals that live in derelict neighbourhoods the values found are
considerably lower. As such, 39% of all the dwellings with one division are inhabited
by families with three or more individuals; 35% of those that have two divisions are
41 Cardoso, A. and Perista, H. (1994) A cidade esquecida- pobreza em bairros degradados de Lisboa [The forgotten city- poverty in derelict quarters in Lisbon] in Sociologia Problemas e Práticas Nº 15, pp 99-111 Centro de Investigação e Estudos de Sociologia- ISCTE [Center of Research and Studies in Sociology] 42 The immigrants survey encompasses the following groups: Capeverdians, Angolans, Mozambicans, Santomese, Guineans, Indians and Timorese.

35
occupied by families with 4 or more individuals; and regarding those that have three
divisions, 22% are inhabited by families with six or more individuals.
Despite the fact that density in-housing is generally high in derelict neighbourhoods, it
is even higher among immigrant families.
The same can be verified regarding amenities. The study reckons that, regarding this
aspect, immigrant families also fare worst than nationals. In fact, it’s among immigrants
that the shortages in electricity and water were felt the most.
Also regarding housing equipments immigrant families bear more shortages than
nationals’ families. Data shows that 67% of immigrant families don’t have gas-water
heater and 72% don’t have a phone.
Curiously, and regarding perceptions of the neighbourhood the study came up with the
conclusion that 69% of the immigrant population and 60% of the national population
enjoy living in their neighbourhood. Notwithstanding, there was a clear
acknowledgement amidst nationals that their neighbourhood faces a set of lacks on
account of which they show their discontent.
5.5 Immigrants’ Living Conditions Until now we have been analysing data collected by surveys demanded by the Special
Re-Housing Programme. This information only covers shanty dwellers and not the
immigrant population as a whole, who doesn’t live all in shanties. Therefore we don’t
have an accurate image of the living conditions of immigrants. An important association
of defence of human rights, OhoVivo43 made a nationwide study on immigrants
focusing the conditions in which they were lodged. The study was conducted among
700 immigrants in the districts of Beja, Braga, Lisbon, Oporto and Setúbal in October
2000.44
We can see the results of the inquiry summarized in the graphics below. One of the
most noticeable results of the inquiry is the little percentage of immigrants who own the
dwelling in which they live. Several factors concur to this aspect. One of them may be
the weak economic power of immigrants, who in their great majority hold low-skilled
jobs in the less attractive segments of the labour market with low payment and in
precarious conditions. Another reason may be the difficulty in getting a bank loan in
order to buy a house. African resident immigrants often complain about the extreme 43 Organization NFPPT0015 of the Mapping Exercise 44 Publication PUB/PT0079 of the Mapping Exercise

36
difficulty in getting a loan45. For those who have not the resident status but instead hold
permanence permit obtaining a loan is almost impossible. Therefore most of the
immigrants either live in rented houses (43,9%) or in rented rooms (23,6%). A worrying
fact is that 10,1% of the immigrants live in the workplace and 8,6% in Shanties. This is
a further sign of the difficult economic situations in which they live in.
Graphic 1- Immigrants’ Lodgings (%)
2,8
1,2
0,5
10,1
8,6
4,2
23,6
43,9
7,9
Didn´t answer
Other
Institutions of Social Help
In the Workplace
Shanties
Boardinh-house
Rented Room
Rented Home
Own House
Source: Imigrantes, Direitos Iguais [Immigrants –Equal Rights], Brochure Published
by the Association Olho Vivo, 2003
As to the persons with which immigrants live it is remarkable that only 8,7% live with
the spouse and 5,7% with spouse and sons. In contrast 29,2% live with friends and
16,7% with other immigrants. Once more this may derive from their weak purchase
power and therefore of the necessity to share the expenses associated with the dwelling.
It may be also on account of the fact that, when arriving at Portugal, most immigrants
resort to established networks of solidarity in order to find a place to live.
45 Interview with a member of Association Olho Vivo.

37
Graphic 2- Immigrants’ Conditions of Living
3
0,7
10,7
16,7
29,2
10,7
5,7
8,7
14,8
Didn´t Answer
Others
With work colleagues
With other immigrants
With friends
With other relatives
With the Consort and Sons
With the Consort
Alone
Source: Immigrantes, Direitos Iguais, [Immigrants –Equal Rights]Brochure Published
by the Association Olho Vivo, 2003
5.6 The specific case of Roma
There are no official statistics on Roma due to the fact that individuals are not
categorized by ethnic background. However, SOS Racism46 launched a questionnaire to
all Portuguese Municipalities where data concerning the Roma community was asked
for. The answers don’t give a definite picture of the Roma community but allow a clear
perspective on their ways of living47. This study was also based in work on the
distribution of Roma throughout the national territory undertaken by the Roma
Pastoral48.
From the results we can conclude that Roma live in areas with higher population
density, particularly Lisbon (2332), Loures (1028) and Amadora (948); these
Municipalities are also those where the presence of immigrants is higher. Map 1 in the
annex shows the Roma population distribution in the Lisbon Area.
Other data available is on housing precariousness and its distribution throughout the
national territory ,with the exception of the Lisbon Area. Map 2 in the annex shows that
there is a concentration of this kind of situations in the north seaside, but also through
all the country. This points to the fact that these situations are widespread and not
confined to specific regions.
46 Association NFP/PT/0002 of the Mapping Exercise 47 Publication PUB/PT/0081 of the Mapping Exercise 48 Association NFP/PT/0021 of the Mapping Exercise

38
According to this data we can conclude that Roma are particularly concentrated in the
seaside regions that have higher population density and in its outskirts. The total
number of Roma surveyed by this research was of 21,831 people. Therefore, and
following this data, while the total of Roma living in the Lisbon Region amounts to
6043 this corresponds to 29% of the national Roma population.
The authors reached the conclusion that 31% of the Roma all over the country live in
conditions of housing precariousness. Comparing by districts, in Castelo Branco 87% of
the Roma population live in conditions of precariousness, in Viana do Castelo
approximately 94% of the Roma were found living in such conditions, finally in Évora
the situation presents itself particularly serious with almost all Roma living in
conditions of precariousness (see annex, graphic 1).

39
6. ANALYSIS OF DIRECT AND INDIRECT DISCRIMINATION
6.1 Main victims of discrimination
As we previously mentioned, one of the most important sources of information for
complaints on racism and xenophobia are anti-racist associations and immigrant
associations. Immigrants often search these associations for help or to participate some
complaint on discrimination, rather then to the police or state authorities. One of the
reasons for that fact is that many immigrants are in an irregular situation, other may be
that these associations, by publicly defending the rights of immigrants, end up by
gaining their confidence. Many times immigrants themselves work in these associations
and are in a better position to gain the confidence of other immigrants, especially if
these don’t speak Portuguese. Contacted by the NFP, three of the major associations
working directly with immigrants and ethnic minorities, Olho Vivo, SOS Racismo and
Solidariedade Imigrante, all agreed that immigrants suffer from discrimination in the
housing market, both in renting and in buying houses. Olho Vivo stated that it was
particularly difficult for Africans to get someone that is willing to rent them a house.
Eastern Europeans, though they have occasional trouble in renting a house, face a lesser
degree of difficulty than Africans. One of the reasons may be plain racism, since
Eastern Europeans are white and Africans are black. It is impossible, in the absence of
serious scientific research on the subject to give even an approximate answer to the
question of differential treatment to different groups. Another reason may be the
different images the media convey of the different immigrant groups. Usually news and
media pieces on Eastern European immigrants tend to convey a highly favourable image
of these immigrants. A further difficulty is that in most cases the proprietor demands a
Portuguese guarantor in order to rent the house to an immigrant, making it difficult to
the immigrant to resort to their most immediate relations. This difficulty is felt also by
any immigrant who wants to buy a house and needs to get a loan from a bank, since
usually the banks also demand a guarantor that is Portuguese, and thus many times not
accepting those that were the most natural guarantors of the immigrants, their close
relatives, most of the times their parents. In fact, getting a loan to buy a house is even
more difficult than renting a house. All associations agree that of all immigrants, only

40
those that hold a residence permit can hope to obtain a bank loan, thus leaving aside
about 170.000 immigrants who hold permanence permit. But even for those holding a
residence permit a bank loan is not easy to obtain. One of the reasons being the
aforementioned need to present a warrantor of Portuguese nationality, sometimes
extending that demand to the domain of Portuguese language.
6.2 Data on recorded complaints about racial/ethnical/religious/cultural discrimination From 2000 to 2003 the Commission for Equality and Against Racial Discrimination
only registered three complaints that can be considered of racial discrimination with
regard to housing. In February 2001 the Association of Angolan Residents in Portugal
lodged a complaint accusing a real estate broker (Tourism and Real Estate Society) of
refusing to rent a house on grounds of racial discrimination (the person allegedly
discriminated was black). A joint dispatch of the Minister of Presidency and of the
Minister of Public Works, Transports and Housing and of the Minister of Cities and
Territorial Ordering is awaited, who will probably consider the IMOPPI (Institute of the
Markets of Public Works, Private and Real Estate) competent for the instruction. At the
time of reporting this decision is in conflict of competences regarding the decision.
A second case that reached the Commission denounced the refusal of hotel services to
two Ukrainian citizens (the hotel is located at the North of Portugal). The complaint was
brought by the employer of these two Ukrainian immigrants to SOS Racism. According
to the complainer the hotel manager refused to register the two Ukrainians stating that “
this hotel does not serve for this type of people” and subsequently banishing them from
the hotel. The employer lodged a complaint to the High Commissioner for Immigration
and Ethnic Minorities49 that was sent to the Commission for Equality and Against
Racial Discrimination. This complaint was appreciated by the General Inspection of
Tourism and the process is currently in the instruction phase.
A black woman lodged a complaint to the High Commissioner complaining of being
victim of discrimination by the other neighbours. According to this the other neighbours
abusively charged the woman of making noise in her flat; yet the woman argued that the
charge had no other reason than the colour of her skin. This process was filed since the
woman didn’t show up and failed to present witnesses of the occurrence.
49 Organization NFP/PT/0098

41
Taking into account that from 33 complaints registered by the Commission for Equality
and Against Racial Discrimination only three can be said to concern the housing sector,
the number is not very expressive.
On the other hand, there are other complaints besides those brought to the Commission
for Equality and Against Racial Discrimination. Associations that fight against racism
receive them also. SOS Racism gets several complaints during its usual activity,
evidence pointing to Roma as being the main victims. Nevertheless, there are also cases
of discrimination against African or Eastern European. Unfortunately, like most NGO’s
working directly in the field, this association doesn’t keep organized records of the
complaints that reach them. Notwithstanding, several cases that were brought to the fore
by SOS racism were made public through the media, namely through the press.
Hostile reactions from local populations regarding Roma integration have also been
known to happen. Sometimes they don’t reach the official channels nor the associations.
Though media are not the most reliable of sources they can’t be overlooked either by its
impact or by its capacity to reflect (sometimes a biased reflection) the public domain.
Surveying the main media in Portugal it is possible to gather various accounts of racial
discrimination regarding access to housing. Again, Roma community appears as the
most significant target of such actions and, therefore, of the attention of the media.
Sometimes local authorities themselves are behind such attempts as in the case of the
local authority of Arcozelo, in Ponte de Lima, that made a straightforward claim against
the lodging of Roma families in the new social dwellings that have been built in that
locality (“The local authority of Arcozelo doesn’t want Gypsies” in Público, July 27
2002)
On the other side, there are several accounts concerning local populations that refused
to have Roma people living in the neighbourhood:
for instance, through a sort of collective outcry the Inhabitants of Oliveira do Douro [a
village in the North of Portugal] refused to live side by side with Roma families which
was reported by the newspapers, the news having as title a quotation by one of the
locals:“Why don’t they build a village for themselves?”50
Indeed,newspapers are responsible for the bulk of information on housing
discrimination events. For instance, in Borba (a village in the South of Portugal)
inhabitants that live in the premises of a Roma camp, at the village entry, complaint 50 in Jornal de Notícias, June 4 2001
42
about the behaviour of their neighbours, which, they assure, sometimes cause
disturbance. Afterwards the local inhabitants asked for the removal of all the tents to
another place. The Roma community diverged, reassuring that they are peaceful. The
Municipalities acknowledged, however, the urge to find a new space.51 Another
example is the dwellers protest against the intent of the Barreiro Municipality
[Municipality of the Lisbon Metropolitan Area] to give houses to un-sheltered Roma52
or the fact that some dwellers of a building in Damaia [a neighbourhood in Lisbon]
contested the decision of the Municipality of lodging «at a distance of less than five
meters» of the building in which they live, housing containers which were prepared to
temporarily re-house five Roma families.53 The proliferation of this type of images
conveyed by the media may have an indirect effect in the engendering and
strengthening of a kind of “mental segregation”, that may lead to an increase of
stereotypes towards neighbourhoods where the majority is of Roma origin, identifying
them as dangerous spaces. Minorities are usually linked, by the host society, to local
criminality. 54
However, as Esteves suggests, the feeling of insecurity is in fact the result of other
factors such as low habitation standards, the residents’ socio-economic characteristics
and its surrounding areas55. Notwithstanding, associations that support immigrants have
been exposing what they consider to be the discrimination of neighbourhoods where
population with ethnic minority background is concentrated. According to the
association “Olho Vivo” some re-housing processes have had the unintended
consequence of reinforcing minorities ghettos. Moreover, the representatives of this
association stated that re-housed people are thrown to the periphery, marginalized from
the mainstream society, and that the specific structures built to this neighbourhoods are
not at all in line with the rest of the urban design, constituting a further factor of
discrimination for the population who live there.
51 “Borba wants to cast away the Roma Community”, in Diário de Notícias, April 14 2002. 52 “Houses were granted to Roma families”, in Jornal de Notícias, May 8 2002. 53 (“Damaia’s dwellers contest re-housing”, in Público, July 3 2002). 54 Esteves, A. (1998), A criminalidade na cidade de Lisboa. Uma geografia da insegurança [Criminality
in the city of Lisbon. A geography of insecurity], Lisboa: Edições Colibri. ; Marques, M. et al. (2001), Realojamento no concelho de Oeiras. Um estudo sociológico [Re-housing in the Oeiras municipality. A sociological study], Caderno Técnico de Habitação nº1, Oeiras: Direcção Municipal de Planeamento, Urbanismo e Habitação.
55 Esteves (1998) op. cit. pag. 165
43
On the other hand, some case studies point to the fact that neighbourhood relations in
neighbourhoods with ethnic heterogeneity can be problematic56. Displays of strangeness
(regarding cultural background – e.g. spoken tongue and ways of living generally
considered) are fuelled by feelings of suspicion and insecurity often by the majority
population towards ethnic minorities, leading these minorities apart from the majority.
Another type of events are those related to direct discrimination in the housing market.
These are surely much more difficult to pin-point due to its invisibility. As was
mentioned above there is no study on this topic and therefore there is no measure or
perception of the weight of racial discrimination in having access to a house. Once
again anti-racist associations are the main source for this kind of complaints. Some
examples were reported to the NFP by the association SOS Racism.
A Roma couple, with the support of the Association SOS Racism, intends to lodge a
complaint of racial discrimination against a Construction Work Corporation and a real
state promoter allegedly after having been denied the chance of buying a lodging in one
of its buildings. This was also made known by the newspaper A Capital, July 4th 2003,
in a article with the title “Private Condominium with its doors closed to Roma family”.
Another complaint that reached SOS Racism concerns the refusal to sell a house. A
Roma family was prevented of buying a house, after dealing with the real estate
company, by the refusal of its constructor that stated that “he wont sell to Roma
people”.
Concluding, it is apparent from the complaints brought before associations that Roma
are the community which endures more discrimination regarding housing and
placement. Negative reactions can be identified country wide without any specificity
besides that of steering local population in protest, sometimes with the support of local
authorities. In sum, we can distinguish, creating a provisory typology, three categories
for framing differences in housing discrimination. We find direct discrimination of the
type displayed by real estate or housing constructors; local populations movements
either against the placing of Roma families or striving to cast out these families from
their neighbourhoods and villages; and political actions taken by local politicians taking
advantage of negative feelings endorsed by local populations towards Roma.
56 Marques et. al. (2001) op. cit. pag. 115

44
It is difficult to quantify any of these categories. The numbers are not too expressive
and sources don’t fit one another rendering difficult the finding of a pattern or having a
correct depiction of the state of affairs. The majority of the information points to Roma
as the main victims. Additionally, Roma are the community with a more negative
evaluation in various surveys conducted at the Municipal level, such as Amadora or
Oeiras. But this doesn’t mean that black minorities or even Eastern European ones rest
untouched by prejudice and intolerance. Word of mouth information about
discrimination in the housing market towards these two groups sometimes comes up.
This, of course, is not a reliable source; hence, to have a more objective view, studies on
this would be needed that still don’t exist in Portugal.
6.3 Data on court cases
As we already referred the Commission for Equality and against racial discrimination is
the body responsible for collecting complaints of racial discrimination in Portugal but
as we saw the number of received complaints on housing, is, however, insignificant
from a statistical viewpoint. We must note, on the other hand, that for a case to reach the
commission the victim must send it to the commission. The fact is that some victims
prefer not to do so and go directly to court, and so there may be cases of racial and
ethnic discrimination that have not reached the commission, making it impossible to
track them. Information on these cases is available only in courts, and a search in every
court of the country is almost an impossible endeavour. Moreover, there is only one
case until now judged under the anti-discrimination law (Law 134/99), and it doesn’t
concern housing. Notwithstanding, other cases were brought before the courts, albeit
not falling under law 134/99.
Nevertheless, other data point to the existence of racial discrimination in this sector.
Among this, in the year 1996, the demolition of Roma dwellings in Vila Verde (a
village in the north of Portugal) as a result of pressure exerted on the mayor by local
inhabitants, who then ordered the demolition of those dwellings should be noted.57
Those implicated were accused in court of “terrorist association” by the High
Commissioner and by the Governor of the district of Braga. After these events the
Roma families had to be relocated in another nearby village (Cervães). The Governor of
Braga, Pedro Bacelar de Vasconcelos, who tried to lead the process, was then coerced 57 Ombudsman recommendation No. 72/A/96 that was issued before the courts had came to a decision.

45
by the mob. The people of Cervães justified their acts by associating Roma to drug
traffic. Following these events, the Governor of Braga accused some people of
Francelos of aggression. The accused were later absolved by the court of Braga and no
practice with racist intent were proved (Collective Common Process nº181/99 of the
2nd Criminal Court).
Another case that was labelled as racist and xenophobic, especially by the media, was
the outburst of intolerance by the local population of Francelos, a village in the north of
Portugal, in 1997. Similar to the aforementioned events, the case of Francelos also
involved the Roma Community. The inhabitants of Francelos accused the Roma
families living in the village of being drug dealers. Blaming the authorities for being
ineffective concerning the fight against the “drug traffic,” the local inhabitants decided
to organize “vigilante groups”. Two parallel events occurred: on one hand, these
“vigilante groups” started to attack the drug addicts that used to buy drugs at the Roma’
campsites; on the other hand, they began to appeal to the local population with the aim
of taking the matter into their own hands and force out the Roma families. These groups
led several demonstrations, and slandering messages against Roma were publicized by
them. “The organized militias of Francelos” – as they called themselves – started to do
justice themselves in view of the local authorities’ apathy. This case was brought before
the Courts and several members both from the militias and others that took part in the
demonstrations against the Roma were incriminated. The Court charged these groups
with terrorist association and aggression, but only indicted them for the crime of
aggression and kidnapping. Those indicted were punished with up to five years’
imprisonment. Nevertheless, no charges were pressed based on the anti-discrimination
law or in the basis of racial intent, even after the population had publicly slandered the
Roma families that lived nearby.
Another case, was detected by the Administrative Court of First Instance of Porto that
examined the regulations of the municipality of Vila do Conde which required all Roma
with no official residence to report their arrival in the area of the municipality, and to
leave it within eight days. This measure gave rise to strong indignation in the press and
sharp reactions of disapproval on the part of the Ombudsman. Following these
reactions, the municipality adopted new regulations, revoking the old ones, stressing
that the new text was aimed at everyone, whether or not they were Roma, who put up
any clandestine form of housing, stating that such housing should be destroyed. The
Public Ministry contested this act, which continued to be illegal because in reality it was

46
aimed at the Roma, and in this sense violated the principle of equality. The Court did
not refer to the problem of the Roma as such, but to the question of the invalidity of the
administrative act. It decided, however, that the essential problem was that of the
persons affected by the act, the order to destroy houses and the impossibility of
rebuilding them in any other place in the area of the municipality. The key point of the
decision was that the act, too general and abstract, could therefore not have force of law
because it was impossible to identify the persons at whom it was directed; hence, the act
was null and void.
6.4 Inter-ethnic relations in contexts of spatial proximity: some case studies related to re-housing programmes Some research has been made as to the spatial segregation of immigrants and ethnic
minorities, as well as to interethnic relations arising from spatial co-existence, mainly in
studies that have accompanied re-housing processes. Since many of the re-housed
individuals where either immigrants or ethnic minorities (especially Roma or Africans)
some reports have focused on the specific question of inter-ethnic relations or on the
contribution of re-housing programmes for the integration of immigrants and ethnic
minorities.
That is the case of a study58 conducted by the Centre for Social Ecology (NESO) of the
National Laboratory of Civil Engineering (LNEC)59, requested by the National Housing
Institute of the Ministry of Social Equipment60. The relation between housing and the
processes of social integration of Ethnic Minorities from PALOP (African Countries
Having Portuguese as their Official Language) and Roma population residing in the
Metropolitan Areas of Lisbon and Porto is the main theme of this research61 which was
directed by a researcher of NESO62.The request for this study was based on the
58 Mapping Exercise Publication NFP/PT/0074 59 Mapping Exercise organization NFPPT0060 60 Mapping Exercise organization NFP/PT/0115 61 Ministério do Equipamento Social- Laboratório Nacional de Engenharia Civil- Grupo de Ecologia Social [Ministry of Social Equipment- National Laboratory of Civil Engineering- Center of Social Ecology] (2001), Habitat e Minorias: Limites e Potencialidades da Promoção Pública de Habitação em Processos de Integração socio-urbanística. Relatório Final. [Habitat and Minorities: Limits and Potencialities of the Public Promotion of Housing in processes of socio-urban integration. Final Report] Trabalho executado para o Instituto Nacional de Habitação [Work executed for the National Housing Institute] 62 The population target of the study was divided into four groups of analysis, taking into account ethnic belonging, the type of housing and the geographical area of residence: Africans in Lisbon residing in degraded areas; Africans in Lisbon living in re-housing neighborhoods; re-housed Roma in Lisbon; re-housed Roma in Oporto.

47
necessity of providing municipalities with research that helps them dealing with
Population of African and Roma origin in need of public support for the resolution of
their housing problems. The Portuguese state, as we said above, has developed a public
program of housing promotion, the Special Re-housing program (PER), in order to
eliminate shantytowns, giving an opportunity to groups with poor capacities of
residential choice to improve their housing conditions. A special attention was given to
the way minority members perceive themselves, how they evaluate their residential
situation, how they perceive the majority “other” (in these case Portuguese whites) and
how they suppose that that other perceives them and the territories they inhabit.We must
pay attention to the fact that, as we already said, shanties are not exclusively occupied
by immigrants and ethnic minorities nor do these comprise the greater part of those
inhabiting in the run-down areas of the Portuguese cities. Furthermore shantytowns are
seldom spaces of ethnic homogeneity63.
As to inter-ethnic relations among the re-housed population, if we consider the total
population it is not a very relevant dimension, but it is if we consider solely Roma re-
housed in Lisbon. This population manifests their dislike with the multi-ethnic character
of their neighbourhood but also with the fact that they have to live with other families of
Roma origin. In this respect it should be pointed out that half the Roma population
states that, if they could, they would choose as neighbours non-Roma white Portuguese.
Only 26% of individuals claim to prefer to co-habit with members of the same ethnic
background. 22% of Roma said that if they could they would avoid living with other
Roma, and 30% of them states that Africans are to avoid as neighbours. The same
percentage of Africans, 30%, point individuals of Roma ethnic background as persons
to avoid as neighbours. 44% are indifferent as to the ethnic origin of neighbours64.
Two trends seem to emerge from this data, namely that inter-ethnic co-habitation is a
problem to the Roma communities covered by these study, and that ethnic rejection is
pointed to individuals with the same ethnic background and of African origin, but not to
Portuguese whites.
63 Though shanties constitute undoubtedly spaces of social and urban exclusion the authors of this report find the designation of ghetto not adequate. First, because that designation relates to a reality that is specific of the American society and second because, as it was defined by American sociology, and as it as also penetrated in the public imaginary both in America and Europe, ghetto refers to ethnically homogeneous urban spaces, and this is not the case of Portuguese shantytowns, one of whose essential traits is their ethnic and cultural heterogeneity. 64 Op. cit. pp. 27-28

48
Another important aspect is that of inter-ethnic relations between the re-housed
population and the population of the neighbourhoods surrounding the re-housing site.
Although, as we said above, it is not correct to call Portuguese shanties ghettos,
nevertheless some characteristics of the ghetto do verify for Portuguese shantytowns,
namely their isolation in relation to their urban environment and to the society in
general, marked by the scarcity and even non-existence of contacts and interaction with
what surrounds them, either the more immediate urban context or society in general.
The degree and intensity of contacts between residents in shanties and the exterior are
weak or solely of a functional nature. These territories are seldom perceived from the
exterior as places to avoid. This closing to the exterior can sometimes constitute a
defensive strategy, namely in what concerns immigrants, absorbing in a way the impact
of arriving at a strange land, and for the undocumented it can provide a safety net from
the implications that their illegal situation can bring them. Closed spaces can also
prompt the emergence and development of clusters of irregular economic activities. The
authors note that there is a continuity of some of the specific traits of Shanties into the
social housing neighbourhoods, namely socio-spatial closure. This is what Peter
Sommerville65 calls the encapsulating of a community in relation to its environment,
marked by the absence, voluntary or involuntary, of relations between a group and
society in general. Ethnicity and Nationality may be at the base of such closure, and so
can social class and even residence in a determinate neighbourhood. Reinforcing the
processes of encapsulating can be the phenomenon that is usually called NIMBY (not in
my backyard), that is, the rejection of processes of urban intervention, namely the
construction of collective equipment with the aim of re-housing populations, by groups
in the locality where the intervention is to be made. The rejection is usually made out of
fear of the consequences that the incoming of new population will bring. This fear is
often associated to highly negative social representations of the neighbourhood from
where the new population proceeds, and to a homogeneous negative perception of that
population.
All the neighbourhoods covered by this study have, according to the authors, and based
on the statements from the re-housed population, negative public images more or less
embedded in the social imaginary of the populations. This negative image comes from
the simple fact of being re-housing neighbourhoods, with population coming from
65 Somerville, P. (1999) Community Development: A Rational Choice Approach, Presented at ENHR conference in Lisbon, Portugal; cited in Ministério do Equipamento Social (2001) op. cit.

49
shanties, and the fact that the latter where perceived by society as dangerous spaces.
Reinforcing this aspect is the occurrence of violence, and the presence of marginality
and delinquency, which tends to be amplified. The interviews show that the residents
have a clear perception of the negative image affecting their neighbourhood66. When
asked about the reasons for the bad image of the neighbourhood, the respondents
usually point the residents themselves, their attitudes and behaviour, but also the mass
media that, according to them, contribute to the crystallization of a negative image of
those spaces before the population at large. Furthermore, Africans point to the fact that
outsiders tend to homogenize the population who lives in the neighbourhood.
In some cases, like Vale do Forno and Quinta da Fonte in the Lisbon Metropolitan
Area, the re-housing was made with little care and in a hurried way, responding to the
momentary need to re-locate some populations. In the case of Vale do Forno the land
was necessary for the realization of public works and thus the population was re-located
to an derelict army headquarter. Both neighbourhoods are in a peripheral situation with
poor accessibilities to the centre, thus in a situation of socio-spatial isolation who, for
most of the dwellers meant that they where being relegated to the periphery. The case of
Vale do Forno is the most significant of the two. To the fact that it is an headquarter
with only one way out and surrounded by a high wall, it must be added the fact the
population is constituted only by Roma, what in fact configures a ghetto as it was
previously defined.
Another revealing aspect observed by the researchers, mainly in the re-housing
neighbourhoods, is the lack of practices of sociability among residents in the
neighbourhoods. Young people may constitute an exception to this, confirmed by the
results from the inquiry by interview regarding the occupation of free time. According
to the findings, most of the respondents claim to spend their free time outside the
neighbourhood. We must also note that either Roma or Africans socialize mostly with
members of their respective ethnic group.
Connected also to the special re-housing program but with a narrower territorial scope
than the previous study is the work Re-housing in the Oeiras municipality67, a
sociological study68. This report originated in a demand of the Oeiras Municipality69,
66 Ministério do Equipamento Social, pp. 26-27 67 Mapping Exercise Publication PUB/PT/0076 68 Marques et. al.(1999) Realojamento e Integração Social: A população do Vale de Algés perante uma operação de requalificação. Vols. II and III- Exploration of results. Lisbon: Edições Colibri/Socinova 69 Mapping Exercise Organisation NFP/PT/0116

50
located in the outskirts of Lisbon, to the Centre of Applied Sociology of the New
University of Lisbon70. The main objective of the study was to access the effects of a re-
housing process in the integration of the populations targeted by that re-housing in nine
neighbourhoods in the municipality. The fieldwork took place between July 1997 and
August 1998 and the observation included 816 questionnaires and 208 semi-directive
interviews.
This study is all the more important for the purposes of the present report since a large
percentage of the population in the studied neighbourhoods holds a minority ethnic
background (44%) and the research focused also on the inter-ethnic relations in the
neighbourhood as well as on the representations of the Africans in Portugal. Of all those
who were inquired for this study 32,6% came from a PALOP country. When we cross
the provenience with the age of the inquired we can verify that most of the youth
population was born in the Lisbon Metropolitan Area, and that the adults and the aged
were born in other regions of Portugal or in one of the PALOP71. Thus, a great part of
the youngsters with a minority ethnic belonging, are second-generation immigrants72.
One of the aims of the study was the characterization of attitudes by the surrounding
population toward ethnic minorities, measured through several indicators, namely the
relevance of the racial attribute, the evaluation of immigrants in the labour market and
the evaluation of the introduction of the mother tongue in Portuguese schools.
When the inquired are questioned about the relevance of the racial and ethnic attribute
on personal relations, 87,3% do not consider it an important attribute in relations,
whereas 12,7% consider it to be a relevant factor. The age of the inquired does seem to
have importance as to the judgement on the relevance of racial and ethnic attributes,
with adults and aged giving it a greater importance than youngsters do. Another
indicator utilized to determine the position of the individuals as to the ethnic factor is to
choose the most important element of social distinction: socio-economic stratification,
individual characteristics (effort, orientation to work) or racial segmentation. This last
appears as the least important among the forms of distinction.
70 Mapping Exercise Organisation NFP/PT/0117 71 From the total of individuals from a ethnic minority, 35% were born in Portugal and 64% born in a PALOP Among those who were born in PALOP Cape Verdians constitute the largest group (55,2%), followed by Angolans (18%), Mozambicans (13,3%), Santomese (7,1%) and Guineas (6,4%). This concept is usually used as a category to refer to the descendents of immigrants, youngsters and children, who are still at school, about to enter or recently entered in the labor market.. To call this youngsters immigrants is wrong since they do not have a migrant trajectory and most of them doesn’t even know their fathers’ country of origin.

51
When we look at the question of the relation between immigrants and the labour market
we conclude that about 40,8% of the respondents agrees with the existence of a causal
relation between labour shortages and the insertion of immigrants in the labour market,
which makes up an expressive number. There is a statistical relation between the
evaluation of the presence of immigrants in the labour market and ethnic belonging: the
respondents belonging to the ethnic majority are more prone to hold immigrants
responsible for situations of unemployment then are the respondents of minority
background.
By its turn, the analysis of inter-ethnic relations in re-housing neighbourhoods discloses
“the existence of signs of racial intolerance, reciprocal stigmatisation, insecurity and
competition for power, rooted in “culturalist” references and group identity
discourses73” thus legitimating segregation. There is a marked preference for ethnic
homogeneity, but ethnic prejudice is not, by itself, an obstacle to living side by side.
The case of Timorese and Roma was specifically considered in the research on account
of the importance of the presence of the former in some neighbourhoods (Laveiras) and
of the animosity towards the latter frequently shown in the interviews. The cohabitation
with the Timorese population points to a positive representation by the locals.
Nevertheless, the perception of the inhabitants of the Laveiras neighbourhood is that the
existence of many Timorese bestows a negative image upon their neighbourhood. The
same can be verified for Africans, that is, they are considered elements proper to the
stigmatisation of the neighbourhood. As to the Roma dwellers, their image in the
neighbourhood is not as positive as the one of the Timorese. Cultural reasons and a
deficient adaptation of the members of this ethnic group to the new residential context
are the main reasons to be stressed.
It is important to refer that one of the indicators used in this work is the condition of the
inquired in relation to housing, that is, if they own the dwelling in which they inhabit or
if they are tenants. This analysis changes in function of the antiquity of the
neighbourhood, i.e., there is a tendency, in older neighbourhoods, to have a greater
percentage of owners, which is in accordance with the policy of the local authorities of
selling, as soon as possible, the house to their dwellers74.A statistical correlation was
found between the condition of the inquired in relation to housing, their ethnic
belonging and the neighbourhood where they reside. In the neighbourhoods in which
73 Pág. 120 74 Pág. 37

52
the condition before housing is characterized by a majority of tenants, the condition of
owner appears connected mainly to inquirers belonging to the ethnic majority, the
access to the ownership of the dwelling being much smaller for ethnic minorities. In
neighbourhoods where respondents are largely proprietors, the percentage of
respondents of minority ascendancy in this condition is also smaller. These data point to
a greater difficulty by ethnic minorities in getting a house of their own.
Another study of this kind was promoted by the Amadora Town Hall, one of the
municipalities of the Lisbon Metropolitan Area where a greater number of ethnic
minorities exist, most of them of African origin. Like the previous reports a special
focus is given on interethnic relations, namely on the representations of ethnic
minorities held by members of the ethnic majority75. The empirical research was
divided into two distinct fieldworks: one directed to the ethnic majority, made by
phone; another, made in presence, to the dwellers in the neighbourhoods targeted by this
study76.
One of the guiding concepts used by the team that conducted this work to characterize
the target population was the Territorial/Ethnic Origin (TEO) of the inquired. In what
concerns this aspect the great majority of the respondents are from Cape-Verde (64,2%).
11,6% are from Guinea-Bissau, 11,3% from Angola, 5,2% from St. Tomé and 4% from
Mozambique. As we can see the population studied is almost composed exclusively of
individuals of African origin. The exceptions are 4% of Eastern European immigrants
and 1,5% of Roma. 91,6% of the population covered are first generation immigrants,
that is, individuals who were not born in Portugal.
From the phone inquiry made to ethnic majority individuals on the subject of inter-
ethnic relations, some interesting results are worth mention : the African community is
that with which the majority entertains most relations, either at the level of work or
neighbouring. It is also the community who holds a better image. 56% of the inquired
see the African as more hard working than the Portuguese and 76,3% claim never to
have had problems with Africans. Those who find Africans troublesome connect them
75 Costa, F. M. ET. Al. (2002) As populaces do Concelho da Amadora: relações inter-étnicas e representações [The populations of the Amadora Municipality: inter-ethnic relations and represenatations], Amadora: Amadora Town Hall 76 The neighbourhoods were Cova da Moura, 6 de Maio, Azinhaga dos Besouros, Estrada Militar, Estrela de África, Fontaínhas e Santa Filomena. The study was made before a pre-defined sample of 400 individuals, stratified in function of gender , age distribution (23-34 years, 35-55 years and more than 56 years) and place of residence. In the end 402 inquiries were analysed. A set of semi-directive interviews were conducted, in order to analyse some realities in-depth. The fieldwork took place between the 5th and the 12th of June 2001.

53
with crime and conflict. But it is the community whom the respondents evaluate more
positively in their contribution to the development of the country. Eastern Europeans
come in second place after the Africans, being perceived as the most hard-working.
Brazilians come in third in what concerns positive relations, being considered the nicest
and most sociable, but at the same time being perceived as less prone to work, but also
not inclined to conflicts and crime. Indians are seen as the community who contributes
less to the development of the country. However, they are also the least associated to
drug traffic and consumption and to derelict neighbourhoods. Overall is the community
on which fewer judgements are made, either positive or negative, on account of
indifference or lack of knowledge by the great majority of the local population. The
most rejected community are Roma, considered as the ones who contributes less to the
development of the country and as the laziest. However, they are also considered the
least likely competitors with the Portuguese for jobs.
The inquired from the ethnic majority were also asked as to whom the main targets of
their solidarity were, among the different ethnic groups. The majority of the respondents
stated that they would help their like above all others, and after them the Brazilians,
followed by Eastern Europeans and Africans ex-equo, then the Indians, and Roma in the
last place.
As to equal opportunities for immigrants and ethnic minorities, the inquired have
different degrees of acceptance for the different types of equality: from equal access to
health (the most accepted) to equal access to jobs (the one who gets less acceptance).
This means that tolerance towards foreigners and ethnic minorities diminishes wherever
personal interest is involved and the perception of the threat of competition is bigger.
One other important aspect covered by this report has to do with the perception of the
neighbourhood held by the immigrants and ethnic minorities living there. This
perception is not the same for every neighbourhood or for every minority group.
Africans in general show some degree of satisfaction with their neighbourhood-
especially Cape Verdeans but also the other African communities. Eastern Europeans,
by its turn, show a very negative evaluation of their neighbourhoods. The different
evaluations of the different groups can be a reflection of the different conditions in
which those communities live.
The assessment of the consequences of living in the neighbourhoods in which they live
is also different. If 30,7% of the interviewed believes that living where they live is a
factor of segregation, 32,9% considers that it has no influence whatsoever in the general

54
acceptance of the communities. In the same way 22,5% believes that the fact of living in
the neighbourhood has a negative effect on their job opportunities, while 18,6% holds
the opinion that the fact of living where they live does not lower their probabilities of
getting a job.
Among the different groups, Roma, Guineas and Mozambican are the ones who have a
stronger perception of the stigmatising effects of the neighbourhood. By its turn, the
Angolan and Santomese community believe that living in those neighbourhoods has not
serious consequences on the general appreciation of the population on them.
The analysis of the practices of sociability inside each neighbourhood and among
different communities reveals that most of the inquired show an open attitude, with race
and ethnic origin not being a relevant attribute for someone to entertain relations with
another.
6.5 Evaluating the effects of governmental initiatives
The Special Re-housing Program (PER) was the most prominent aspect of state
intervention in social housing in the last years. The report made on the population with
minority ethnic background by the Centre for Social Ecology of the National
Laboratory of Civil Engineering77, mentioned above in this chapter, comprised an
evaluation on the contribution of the PER in ending with processes of social exclusion
of which inhabiting in shanties is just the most visible aspect78. One of the assumptions
both of the researchers and the decision makers that ordered the study is that the
housing dimension can prevent, and even contribute to invert, trajectories of social
mismatch. Therefore one of the main aspects focused is a weighing of the gains and
losses between the shanties and the re-housing neighbourhoods, and one of the guiding
questions of the study is: is there continuity between the two spaces in what concerns
certain dynamics that eventually hinder the integration of ethnic minorities living in
situations of poverty? In what measure can these initiatives stop vicious cycles of social
77 Ministério do Equipamento Social- Laboratório Nacional de Engenharia Civil- Grupo de Ecologia Social [Ministry of Social Equipment- National Laboratory of Civil Engineering- Center of Social Ecology] (2001), Habitat e Minorias: Limites e Potencialidades da Promoção Pública de Habitação em Processos de Integração socio-urbanística. Relatório Final. [Habitat and Minorities: Limits and Potencialities of the Public Promotion of Housing in processes of socio-urban integration. Final Report] Trabalho executado para o Instituto Nacional de Habitação [Work executed for the National Housing Institute] 78 Ministério do Equipamento Social Op. Cit.

55
exclusion?Or instead, do they constitute solely an opportunity to improve the housing
conditions of the beneficiaries?
The authors suspect that many times re-housing programs are an improvement in the
housing conditions of the beneficiary populations, but do not constitute significant steps
in the processes of integration. This may be on account of the already mentioned
continuity of specific traits of Shanties into the social housing neighbourhoods, namely
its social isolation in relation to the environing community and the bad images of the
shanties that accompany the population to the new neighbourhoods, prompting the
rejection by the population that lives nearby the re-housing site. The authors assume
that precariousness in housing constitutes only the most visible aspect of a social
exclusion present in other domains such as the social, the economic and the politic, and
that these factors, at the root of processes of social exclusion, are not toss away as a
result of re-housing projects.
As to the judgements of the population re-housed, the four groups into which the
population target of the study was divided held different opinions about the re-housing
neighbourhood into which they were moved. Re-housed Africans in Lisbon is the group
who, in comparison with the others, is more satisfied with the house/neighbourhood.
The public spaces are perceived in a negative way, but the residential mobility is
considered positive in what concerns housing conditions. Re-housed Roma in Lisbon
reveal the greater dissatisfaction as to their present residential condition. The main focus
of negative judgment is the neighbourhood itself, to whom they claim to prefer their
previous place of residence. Re-housed Roma in Porto show levels of satisfaction in-
between the two previous groups. Despite the negative evaluation of the place of
residence, they say that they are presently better lodged in comparison with the past.
Like the other groups the neighbourhood is what displeases them the most. Africans
residing in degraded neighbourhoods (a.k.a. shanties) demonstrate an attitude towards
the place where they live that is, above all, one of conformity. The degree of expressed
disgust varies with the investment made in the house.
Most of the residents in social housing point to the non-existence of an effort of
conservation, leading to the deterioration of buildings and equipment. Re-housed Roma
in Lisbon point also to the small dimension of the house when compared to family size
and to poor conditions of living. The dissatisfaction with the neighbourhood comes
from the degradation of public spaces, which the inhabitants attribute to the authorities
and with the lack of roads and public transportation connecting the neighbourhood to

56
the centre of the city (this is mostly pointed by Roma). It comes from other socio-
environmental factors such as marginality and ethnic co-existence. The most referred
marginal practices are drug trafficking and consumption and burglary.
6.6 Non-existing data and insufficiencies of information One of the major problems with racism, xenophobia or discrimination in the Housing
sector in 2002 is the scarcity of data on direct racial and ethnic discrimination in
housing. The effective fight against racism and xenophobia presupposes first and
foremost knowledge of that reality that we don’t have at this moment, as well as of its
immediate and structural causes. The lack is a double one: of official statistics and
academic studies. In what concerns the latter, more studies are needed specifically on
the treatment of immigrants and ethnic minorities in the housing market in Portugal.
This lack of studies is, by its turn, related to the scarcity of official data on immigrants
and their housing insertion. The situation regarding ethnic minorities is even worse.
General data on Portuguese population, collected by the National Statistics Institute
(INE) and data on immigrants collected by the Borders and Aliens Service (SEF) (the
government body who controls the entry, permanence and leaving of foreigners in
Portugal) doesn’t consider ethnic background categories. This lack of studies on ethnic
minorities prevents us from acknowledging a possible situation of inequality in the
access to houses, a problem that may be affecting citizens that although having acquired
Portuguese citizenship, are of a ethnic minority background, like second and third
generation immigrants (as we have already said the Portuguese law and thus the
Portuguese statistics do not acknowledge such a concept, and we use it here in its
current meaning, i.e., to designate individuals who, having born in Portugal, are sons or
grandsons of immigrants)79.
An important progress in the availability of data concerning racial and xenophobic
discrimination was expected with the creation of the Commission for Equality and
Against Racial discrimination, one of whose aims is to receive complaints of racism as
well as to gather information on discriminatory acts. But this is not what happened, at
79 Data on Nationality hinders the identification of those immigrants that have acquired Portuguese nationality, as well as those of African origin that are considered Portuguese citizens since they came to Portugal after the decolonisation.

57
least not so far. As the second ECRI report on Portugal refers, “there are still problems
in the application of the anti-racism and discrimination laws, as the application falls
short of the protection provided by the legislation in force.80” The regular functioning in
the receiving of complaints and the gathering of information are of the utmost
importance, since empirical data concerning racial or ethnic discrimination on
employment, education or housing are still almost non-existent. Several factors can
account for this state of affairs: firstly, an almost complete absence of academic
research on these fields (especially in what regards a sector approach); secondly, the
lack of articulation between the various organisations (anti-racist organizations,
immigrant associations, social partners and governmental organizations) in the field
that, if changed, could function towards a more swift system of collecting data. Thirdly,
and most important, there are no statistical data on racial or ethnic groups in Portugal by
Constitutional imposition; therefore, following the Portuguese Constitution, we cannot
statistically classify individuals by ethnic belonging.
Therefore, the main sources on general information on foreigners are the Borders and
Aliens Service81 (SEF) 82 and the National Statistics Institute (INE) 83. The former is the
state police responsible for controlling the entry and exit of foreigners in Portugal,
keeping a database for statistical purposes, but housing data are outside of its scope. The
latter is the state body who is the main producer of official statistics at the national
level84. Its main data sources on foreigners are the SEF and the general survey on the
population promoted every ten years. The last one took place in 2001 and the data is
still being published. As we said above, in official statistics there are no such categories
as immigrants and ethnic minorities, only non-nationals. But even considering only the
nationality, there are serious lacks as to the published data on Housing for foreigners.
One of the most important is the lack of published updated figures on the distribution of
the foreign population by type of lodging. Another important gap (at least as to the
information that is made public) is that concerning levels of education by nationality
80 European Commission Against Racism and Intolerance, Second Report on Portugal, http://www.coe.int/t/E/human_rights/ecri/1-ECRI/2-Country-by-country_approach/Portugal 81 http://www.sef.pt contains a number of important statistics on the immigrant population. The English version is not yet available. 82 Mapping Exercise Organization NFP/PT/0096 83 Mapping Exercise Organization NFP/PT/0093 84 http://www.ine.pt An version of the site in English in available. Access to the tables of statistics is restricted to registered users. Registration for downloading information implies payment but if the end is solely to see or print the tables registering is free.

58
and place of residence. This could constitute some evidence, even if indirect, on spatial
segregation, and on the constitution of clusters of population marked by inequalities of
opportunities regarding economic and social success. The same happens with data on
employment and unemployment. Since 1998 we don’t have the stock of active foreign
population, due to the adoption by INE of the new 1994 National Professional Code,
and the delay in translating data prior to 1998 to the new code. Therefore what we have
each year is the number of actives who demanded resident status, and their respective
professional situation. Not having the stock of foreign actives prevents us from having
the updated rate of unemployment for foreigners. Therefore it is impossible to cross
information on the distribution, throughout the national territory, of foreigners with their
unemployment and then compare it with the same data for nationals. This would be a
very useful indicator of the possible inequality of chances for immigrants.
Other important source of data on immigration is the one that concerns the foreign
population holding a permanence permit. Data from INE concerns mostly foreigners
holding a residence permit. The permanence permit, introduced much latter, but already
dropped, was the legal instrument that allowed the legalization of thousands of
immigrants during the 2001 extraordinary legalization. The process involved the
presentation of a valid work contract before the General Inspection of Work (IGT)85
who then issued the permit, valid for a year and renewable. This process enabled IGT to
constitute a database on those who demanded a permanence permit, that comprised the
place of residence of the immigrants, but not the type of dwellings where they inhabit or
any information on their living conditions.
In fact, the lack of information on the housing conditions of Eastern European
immigrants is a serious gap, since they constitute one of the largest communities living
in Portugal today. Media reports and of organizations working directly with immigrants
give accounts of very hard situations endured by these immigrants. Information about
individuals living in garages or in the place of work, sometimes several of them, and
without any amenities or comfort are frequent in the papers and on the television. Those
who can afford a house usually have to share it with several other immigrants, and there
are also many of them living in cheap boarding houses and subletting rooms. News
about homeless Eastern European immigrants are also getting more frequent. An
association set up to provide help to the homeless, Cais, called the attention for the
85 Mapping Exercise Organisation NFP/PT/0095

59
rising number of homeless immigrants. Association Olho Vivo also stated that it has
been receiving ever more complaints about immigrants who cannot find a lodgement in
Portugal. The precariousness of their work conditions, of which long periods of
unemployment are the consequence, can be at the roots of the harshness these
immigrants experience in their lives. However, no reliable data exists, and more
research is needed on this subject.
The absence of direct data on discrimination has lead us to other sources who could in
some way depict the situation of immigrants and ethnic minorities in what concerns
housing. The Re-housing programmes promoted by the state in the nineties are in this
aspect of great importance, since they prompted not only the survey of the populations
to be re-housed, many of them immigrants and ethnic minorities, but also studies made
after the re-housing and some times considering explicitly the question of immigrant ant
ethnic minority populations. These works were already treated at length. But it must be
said that the main survey to the population living in shanties was conducted in 1993 and
since then no updating of these numbers has been done while it is visible that the
number of shanties has been informally growing at a steady pace. On the other hand,
PER was to be implemented in three years, and by now we have reached the tenth year
of its implementation, meaning that in the meantime, with the arrival of more migrant
families the capacity to re-house was greatly curtailed. A further problem may yet
derive from the demographical dynamics of the re-housed families, especially in what
concerns some ethnic groups in which the tradition is one of large families with many
children. It is the case of Roma and some African communities, a tendency amplified by
the lack of family planning This means that cycles of social exclusion of which these
populations were the victims were not broken with re-housing since the cultural and
economic processes at the root of exclusion do not disappear in their neighbourhoods.
Therefore, as the re-housed families grow new housing problems will arise from the
needs of the new generations of ethnic minorities with no purchase power to meet the
demands of the housing market.

60
7. SPACIAL DISTRIBUTION AND SEGREGATION
7.1 Spatial segregation in Portugal Spatial segregation regarding migrants and ethnic minorities hasn’t been a main concern
amidst the scientific community. At the local authorities level something similar
happened. Though there are several records on housing conditions and their spatial
distribution these tend to obscure the ethnic belonging of the inhabitants. We should
stress, though, that this is not specific of the housing sector. Instead, problems with
ethnic and national classifications are pervasive in almost all spheres of social life of
which we have records, either within public or private institutions.
Therefore, studies on ethnic spatial segregation are scarce; and studies in housing
discrimination are even scarcer. This is an important distinction that we need to have in
mind: ethnic segregation refers to a pattern of spatial distribution specific to the
capitalist city; whilst housing discrimination is the behaviour that characterizes
prejudice perceptions supported either by market agents – individuals and corporations
– or by public services. Though patterns of segregation may be the effect of prejudiced
behaviour the two concepts shouldn’t be mixed. This holds true, especially, in what
concerns sources for data collection. The latter tackles with data that we must search
mainly in complaints and plaintiffs testimonies, the former focus on urban organization,
urban policies, and market distribution. This doesn’t amount solely to an analytical
distinction; rather it requires different sources of information.
Regarding housing discrimination no scientific study was ever made in Portugal; not
even at the local level. There are no general accounts either of the numbers of victims of
racial discrimination or of the processes behind housing market that might built
discrimination based on race or nationality. Frequently, it comes to our knowledge that
someone was discriminated when trying to buy or to rent an house; but this usually
stays at the level of word of mouth. Associations that fight against racism and
immigrant associations are also possible sources, and they do receive complaints of
racial discrimination, as was described in the previous chapter. However, these are for
the most part scattered through various organizations, they are difficult to put in social
and economic context, and therefore they don’t allow us to extract any patterned
information. Sporadically, some cases burst into the media and drive some public

61
discussion, mainly when the targeted group are the Roma. Re-housing problems are
frequently on the origin of such stirring. But it is difficult to understand, in face of the
lack of data, the effective weight of housing discrimination – conversely, it would be
hasty to say it doesn’t happen.
Patterns of spatial exclusion are more evident than discrimination per se. In this case we
have to consider two main aspects: 1) the importance of re-housing programs, not only
in the relocation of people – many of them from ethnic belonging – but foremost in the
insertion of a vast fringe of immigrant and ethnic populations on the formal housing
market. As was already described in this report, during the 80’s a large belt of shanties
was consolidated around the main cities of the Lisbon Metropolitan Area (LMA). These
were for the most part occupied by immigrants from PALOP (Portuguese Speaking
African Countries) that came to Portugal after the decolonisation. As networks of
recruitment were constructed between countries of origin and the host localities a
growing pattern of ethnic spatialization has been consolidating . naturally. The re-
housing of many of these populations, as we said, kept the ethnic concentration and the
image of dangerous neighbourhoods was displaced from slums to social housing
concentrations 2)we should also pay attention to new forms of ethnic zoning through the
gradual occupation of the inner city – specially the more degraded neighbourhoods –
that have been occupied by recent immigrants’ fluxes. Chinese and Indians are the most
prominent groups in these spaces. A tiny Chinatown was promoted by local authorities
and ethnic commerce tend to cluster on some delimited city spaces.
Facing the absence of studies that deal directly with the issue we had to search to works
not dealing directly with racial discrimination or segregation but that tackle with those
issues in an indirect way. We can say that 1990 was the year that prompted several
academic and non-academic works in the scientific analysis of the social dimension of
housing. A conference organised under the auspices of the National Engineering
Laboratory gave public knowledge of various works – some finished others still on the
making – that analysed the urban environment, its spatial distribution and life styles. A
simultaneous movement of urban rehabilitation may have thrust such intensification on
the demand for knowledge on urban living conditions. Thus, it was not surprising that
the bulk of the research was focused in neglected or old urban living spaces where the
presence of ethnic minorities and immigrants could be significantly verified. This work
was the result of some previous investigation, which signalled a starting point for
gathering and analysing data on this specific social reality.

62
Curiously, ethnic segregation was not one of the main focused issues. Despite the
straight link that was (and still is) currently identified by the media between shanties
and ethnic belonging the fact remains that the majority of its population was from
Portuguese origin. Nevertheless, a caveat is in order here. Since many of the
“retornados” (people that came from Africa after de de-colonisation process) were of
Portuguese nationality there is a high probability that Luso-african are enmeshed in this
number thus hindering the correct proportion of people of minority ethnic background
living in slums. Additionally, it was not one of the main concerns – either on the part of
public authorities or on the academic side – to highlight ethnic segregation; this is
backed, for instance, by the following sentence copied from the “PER Characterisation
Programme of LMA”: “the nationality evinced in the numbers shows (...) that 79% of
those inquired were of Portuguese nationality, despite the fact that a significant number
were from those countries [African countries]. But this analysis has as object nationality
and not the skin’s colour” (p.28)
This excerpt condensates in few sentences the public attitude before ethnic and racial
segregation: nationality is the paramount issue, not race or ethnicity. Bearing this in
mind, distinction is blurred and the most salient category is poverty instead of racial and
ethnic exclusion.
In substantive terms work carried out in this field don’t amount to much. In effect, we
can find more theoretical or methodological works than empirical data collection works.
Some exceptions do occur, specially when thinking on spatial segregation measuring.
7.2 Patterns of Spatial Segregation in the Lisbon Metropolitan Area
According to some authors social ethnic segregation is believed to be a reality. In effect,
analysing the segregation indexes for the main national groups living in the Lisbon
Metropolitan Region some patterns can be underlined86. The main conclusion to be
drawn is that segregation levels are higher for EU groups (see table bellow). In 2001 the
86 Malheiros, J. (1998) Segregação socioétnica na região metropolitana de Lisboa [Social Ethnic Segregation in the Lisbon Metropolitan Region] in Sociedade e Território 30 Following the author the segregation index was calculated according to the following: SI=1/2 ∑ ⎜xi-yi ⎜*100 where x corresponds to the relationship between an immigrant group in the i region and the global population of that group in the whole area of study; y corresponds to the relationship between the population of all the other groups in the region i and the population of all the other groups in the whole area of study; and n is the number of spatial units considered (i=1untill n). This segregation index ranges between 0 (perfect distribution – social and/ or ethnic mix) and 100 (extreme segregation) (p.132)

63
Spanish scored 35,5 in this index, the Germans 31,8 and the English showed the highest
segregation index scoring 37,9. Conversely, the total African population evinced a score
of 25,6 and Brazilians scored 17,687.
Table 12 - Segregation Index for the main foreign Communities in the Lisbon
Metropolitan Region
Segregation Indexes Nationality 1981 1991 2001
Portuguese Nationals 14,2 17,4 15,8 EEC (12) 27,8 30,5 32,8 Germans 25,2 27,1 31,8 Spanish 33,7 36,6 35,5 French 15,4 19,5 25,6 U.K. Citizens 40,9 41,2 37,9 African nationals (total) 18,1 21,4 25,6 Cape Verdeans 25,2 27,5 24,4 Guinea-Bissau Nationals 16,1 31 34,7 Angolans 11,1 14,5 26,6 Santomese 37,6 30,2 36,4 Mozambicans 11,8 22,5 15,5 Brazilians 18,8 24,2 17,6 USA and Canada citizens 30,2 29,3 23,7
Source:Fonseca et al. (2002) Immigrants in Lisbon. Routes of Integration
Does this mean that EU citizens are the most ill-favored of the majority of the foreigner
citizens? It does not. If it were so these results would be particularly misleading. Rather,
when we take into account patterns of segregation we must bear in mind that some are
the result of active trends and others are the result of passive trends. Therefore, the U.K.
citizens as well as the Germans belong to the group of wealthier people living in the
most well-off areas at the periphery of Lisbon. Instead, Angolans, Santomese, Guineas,
display a different pattern of residential distribution and are for the most part located in
less valued areas. This is demonstrated by the data on PER, where we find that African
people are over-represented in the surveyed shanties compared to EU citizens. We can
easily verify that the proportion of African people living in shanties in relation to the
total foreign population is much higher than the same indicator for EU citizens. Thus,
despite what might seem to be, at a first glance, a non-differentiated pattern of
segregation a hidden variable must be taken into account, that is social class.
Regretfully there are no data on social class and residential distribution – the interplay
87 Mapping Exercise Publication PUB/PT/0068

64
of this two variables would surely strengthen the information and give us a more clear
depiction of the state of affairs about housing.
Notwithstanding, comparing some European cities regarding various significant
minorities we can find “lower proportions of foreigners and ethnic minorities in
Southern European metropolises and lower levels of segregation in these cities”88,
Lisbon being a case in point. As we can see by the table bellow, whereas Southern
European cities have segregation indexes, for the most part, under 30, Northern cities
like Manchester and Rotterdam show values above 50.
Table 13 - Segregation indexes in selected European cities
Metropolis Indexes % in total population
Barcelona EU Foreigners 35 0,52 Moroccans 56,8 0,23 Peruvians 22,9 0,2 Filipinos 65,4 0,13 Lisbon EEC+North 37,1 0,44 American Foreigners - - Cape Verdeans 43,3 0,56 Brazilians 30,7 0,18 Africans (total) 34,8 1,1 Madrid Eu+North 33,1 0,53 American Foreigners Latin-Americans 20,2 0,65 Peruvians 22,1 0,19 Moroccans 27,3 0,26 Brussels EU Foreigners 18,7 14,69 Turks 59 2,22 Moroccans 42,6 7,77 Asians+Africans 30,6 12,85 Manchester white 45,7 87,4 Black Caribbean 50,7 2,9 Indian 51 5,4 Rotterdam Dutch 32,7 61,15
88 Malheiros, J. (2002) “Ethni-cities: Residential Patterns in the Northern European and Mediterranean
Metropolises – Implications for Policy Design.” in International Journal of Population Geography, vol.8
pp. 107-134.

65
Surinamese 29,9 7,33 Cape Verdeans 47 2,09 Turks 51,9 5,67 Moroccans 47,2 3,71 Source: adapted from Malheiros 2002 (see annex)
The author concludes that these numbers follow the “tradition of more reduced levels of
spatial segregation which, in the past, were associated with the social dimension”;
evidence points to the reiteration of this trend but as to ethnic dimension, as it is shown
by the case of Lisbon. Thus “ social segregation has become socio-ethnic segregation in
the metropolises of the South”89.
However, unlike some North European cities we can hardly find the urban space clearly
divided along ethnic lines; rather, it would be preferable to see it as a lighter segregated
city model90. Be as it may, as the author stresses, we can verify a gradual move from
this lighter model to a more fragmented one which the increasing in immigrant influxes
might help to prompt. The combination of large numbers of immigrants or individuals
with minority ethnic background with social exclusion conditions may point in this
direction.
Overall, and following these authors, we can draw some conclusions:
i) the dual spatial distribution (e.g. the areas where non-EU citizens are over
represented are clearly separated from those where “white” people live) is much
weaker in the Southern cities, specially in Lisbon and Porto.
Nevertheless, we can find either in Lisbon or in other cities with immigrant
presence like Setubal – a pattern of ethnicization of several peripheral quarters.
ii) the pattern of sub-urbanisation of the non-EU citizens is higher than in the North
European cities.
Additionally, like in other global cities, we have been witnessing to the placement of
international highly qualified professionals, earning wages above the average, in the
most central, attractive zones and with the highest symbolic value of the Lisbon 89 op. cit. p.119 90 Barata Salgueiro, T. et al (1997) Internacionalização, Reestruturação Económica e Produção de Novas Marginalidades na Região de Lisboa [Internationalization, Economic Re-structuration and the Production of New marginalities in the Lisbon Region], Lisbon, DGOTDU Project Report

66
Metropolitan Region, whereas immigrants that are less qualified and with low skill jobs
tend to cluster in least attractive areas in the periphery of Lisbon and other major cities.
Nevertheless this is not a clear-cut distinction since the inner city has also been slowly
occupied by some ethnic groups such as Chinese and Indians. In this cases the urban
distribution present some features of an ethnic enclave91 and this pattern is mostly
explained by the increasing number of degraded buildings with many vacant places and
low rent dwellings.
91 see Oliveira, C. (2002), “Chinese in Portugal. An immigration cartography”, in Fonseca et al. (eds.), Immigration and place in mediterranean metropolises, Metropolis Portugal, Lisboa: FLAD, pp.229-254.

67
8. Data on new policies and legislation with respect to equal treatment and access to housing and to integration (of immigrants and minorities)
The Special Re-housing Programme as a social housing subsidizing programme, was
launched in 1993, with the aim of eradicating all shanties in the Lisbon and Porto
metropolitan areas. The fact that it was exclusively targeted to put an end to shanties is
enunciated in Decree-law 163/93, which states that its goal is to countervail “the open
wounds in the social tissue” and thus equating the housing problem with shantytowns
stating that “the social problem of housing demands that Municipalities clearly assume
the responsibility for the removal of all shanties”. Thus, contrary to other European
Countries (e.g. Sweden, Netherlands, Germany) the social housing supply is strictly
directed to ill-favoured people and was put in place to face occasional situations –
shanties increasing being one of them. Therefore, PER has been functioning with a very
specific schedule, one that will not have any continuity once its deadline is met with.
Rather, the problem of clandestine building will, perhaps, remain without an envisaged
solution. Some numbers can illustrate this state of affairs: the number of shanties in
Portugal was 12.000 in 2002 and that of shanty-like constructions 18.000. Only in the
Lisbon area, according to the 2001 Census, 9403 shanties remain and in the Setúbal
area, 2557 shanties still resisted. But this problem is pervasive in almost all
Municipalities in the Lisbon Metropolitan Areas.
Of the 120.000 people living in shanties in the LMA surveyed in 1993 – with the
beginning of PER -, only half of them were re-housed. In Loures – a Municipality at the
outskirts of Lisbon – of the more than 3.000 people surveyed in the same year,
approximately 56% are still waiting to be removed; and in Sintra, another Municipality
where the presence of minorities has been growing, of a total of 1591 dwellings 36% of
surveyed people are yet to be re-located. In Amadora, almost all people entitled to be
covered by the programme (3369 families) are still waiting to be re-housed. In other
cases, truly run-down areas that were left out of the PER will remain so. Thus, it all
points to the incapacity to supersede this problem, all the more so since Portugal has to
face the challenge posed by an increase of the number of foreigners and immigrants.

68
Notwithstanding, the Special Re-housing Programme, through the engagement of the
surveyed populations, empowered several of the immigrant associations that work at the
local and neighbourhood level. It is possible to pin-point various associations working
in partnership with Municipalities and also with Urban Management Public
Corporations92. Though these actions were carried out mainly at the level of
sensitisation and training – hygiene courses and information about the new lodgements
were the core actions – they ended by strengthening the position of local associations
and dwellers vis a vis Municipalities and Central Administration.
Although immigrants in a regular situation were able to benefit from PER the same
didn’t happen with other state policies of intervention in the housing market. That was
the case with the government-subsidized loan granted to young people, and from which
only national citizens could benefit. These subsidized loans came to an end in 2002. No
special measures destined to help immigrants and ethnic minorities in the housing
market, such as subsidized bank loans or allowances were ever taken with a view of
specifically helping immigrants and ethnic minorities. The same can be said about the
promotion of diversity in housing areas, which, taken as an objective in itself, is not a
common practice in Portugal. As we referred, the re-housing program, according to
some authors, had the effect of reducing spatial urban segregation, with ethnic
minorities living side by side with white Portuguese. But the spatial distribution of
populations in the urban tissue according to ethnic belonging was never an explicit
objective of urban state planning. Neither was the creation of areas occupied by ethnic
enclaves, thus promoting ethnic business, as was the case in the Netherlands. We can
say, in fact, that positive discrimination is strange to Portuguese political culture.
As we said in chapter 6, in 2000 the association SOS Racism launched a survey to all
Municipalities in Portugal on the integration of Roma. The aim of this survey was
knowing the concrete measures promoted by this authorities regarding the integration of
Roma, covering all measures directed to the Roma community as well as those which
the target was the overall population. The association got 95 responses from a total of
307 Municipalities93.
92 see templates NFPPT0001, NFPPT0002, NFPPT0006, NFPPT0010, NFPPT0011, NFPPT0013, NFPPT0016, NFPPT0020, NFPPT0021, NFPPT0024, NFPPT0025, NFPPT0026, NFPPT0028, NFPPT0030, NFPPT0032, NFPPT0035, NFPPT0036, NFPPT0039, NFPPT0040, NFPPT0041, NFPPT0055. 93 Mapping Exercise Publication NFP/PT/0002

69
According to the authors, the survey allows for two types of conclusions: a) the majority
of the measures promoted in view of a betterment in the integration of Roma gave
priority to initiatives targeting exclusively this community and seldom to initiatives
engaging the rest of the population; b) the bulk of measures prompted by local
authorities are specially focused in the fields of housing, education and social support;
mainly in the perspective of reducing poverty and fighting exclusion.
The first implies that measures are not directed to the prevention of ethnic conflict and
to the promotion of interculturality; the second implies that these initiatives are seldom
planned having in view specifically the Roma community; rather, they are destined to
all people that is vulnerable to social exclusion.
The solution of housing difficulties is the main drive for the implementation of these
measures by Municipalities. From those interviewed, around 50% have undertaken or
are about to undertake the re-housing of Roma, removing them from previous degraded
quarters. Another frequent measure is the recovering of dwellings through the supplying
of building materials or basic amenities in Roma neighbourhoods.
The Municipalities’ intervention in the housing field is generally done under re-housing
protocols celebrated with state institutions, but can also be framed by programmes
against poverty and exclusion.
Some examples can be listed:
a) the Municipality of Loures94 (in the Lisbon Metropolitan Area) is carrying
through the project “Apelarte” destined to the inhabitants of a re-housing
neighbourhood, specially to youngsters. This intervention is guided by the
principles of interculturality shown by various socio-cultural activities such
as dance, gastronomy, visual arts, etc. This project is developed in close
connection with schools.
b) since the end of 1999, the Municipality of Moura (a city at the South of
Portugal) has been carrying out the project “New Routes” the target being
Roma that live in shanty towns. This project is divided in three phases: first,
the introduction of cultural mediators among the Roma population aiming to
create awareness on health matters; second, the building of social equipment
and services, specially for children; and finally, the promotion of initiatives
94 Mapping Exercise Organisation NFP/PT/0119

70
linked with education and professional training. This project also entails
meetings with the rest of the population which objective is to discuss and
alert to racism and social exclusion .
c) the Municipality of Oliveira do Bairro (North of Portugal) is currently
developing a project directed to the ill-favoured people with a special
branch concerning Roma. From its multiple activities we should stress those
focused on Roma women either in professional training courses or in health
and family planning. On the other hand, Roma children are engaged in
cognitive games in order to develop their learning capacities. This courses
also included the learning of the basic rules of hygiene in the new housing
environment.
d) Concerning the Roma community and its degree of acceptance there are not
many initiatives which implicate the non-Roma population; however, two of
them, though unusual, are worth to be mentioned: Municipality of Aveiro
promoted a public display for the supporting of integration of three Roma
families and the Municipality of Pombal promoted an informative action
regarding the merchant activity that Roma, usually, hold.
In sum, from the range of activities towards Roma integration we should underline a
general concern with the degraded living conditions which the majority of this
community endure. Hence, the initiatives that are put in place sought, above all, to find
adequate solutions to the housing problem and enhance the educational level both
understood as crucial areas to a progressive insertion in the mainstream society.
Notwithstanding, the majority of the initiatives are directed to the generality of less
favoured people and seldom specifically to the Roma community. This shows, once
more, that minorities problems are usually dealt as poverty obstacles and, therefore,
insertion in the mainstream society is thought to be a matter of improving living
standards. This is, however, rarely the case as the re-housing programmes bluntly show.

71
9. CONCLUSIONS
It is difficult to take any conclusion on racial and ethnic discrimination with regard to
housing at the present in Portugal. The absence of data, mainly juridical data and
academic research, makes it difficult to make any judgement on the situation concerning
racism in the housing market. How many cases exist that reach the courts? What are the
main causes and its effects? Who are the main perpetrators? If we don't know the
phenomenon it is also very difficult to prevent and combat it. But even if we had a
thorough knowledge of the juridical reality on discrimination we would still be lacking
the knowledge of the phenomenon at large. Scientific research on the subject is also
needed and has been lacking in Portugal. The scarcity of knowledge on racial and ethnic
discrimination has probably contributed to a reduced public awareness on the subject,
which is reflected in the absence of measures to combat discrimination in the housing
market. But, at the same time, immigrants and ethnic minorities, chiefly among them
Roma and Portuguese of African origin, have benefited from measures promoted by the
state to improve the conditions in which populations living in degraded neighbourhoods
lived, namely the re-housing programmes started in the beginning of the nineties, and
still running nowadays. As we pointed out throughout this report, these measures were
not specifically destined to immigrants and ethnic minorities, but to shantytown
dwellers, who were in their majority Portuguese. But since a considerable number of
these Portuguese citizens were of Roma or African origin, and if furthermore we add the
immigrants who benefited from the re-housing programmes, we can see that ethnic
minorities were major beneficiaries. This is a clear sign that some spatial segregation
did exist, and that ethnic minorities were victims of that segregation, but not
exclusively. What happens is that they were over-represented among the excluded
populations living in shanties.
But did the improvement in the habitation of these populations meant a significant step
in escaping social exclusion, of which living in shanties was a clear sign? A thorough
evaluation must yet be made, but some claims have been made by researchers working
in the field, as well as by part of the population re-housed, that re-housing programmes
failed in their most ambitious claim, that of promoting the socio-economic inclusion of
the populations heretofore living in social exclusion. One of the reasons for the

72
continuity of exclusion may be the negative images associated to the populations that
lived in shanties, that carried that bad image with them to their new neighbourhoods,
causing the rejection of the surrounding populations, who associate them with crime and
violence. Sometimes these phenomena of rejection are the manifestation of racial
stereotypes, as happens with Roma, frequently rejected by the neighbouring population.
Cases such as those make us think that discrimination towards some ethnic groups does
exist in Portugal, and that more is needed to combat and prevent that discrimination.
Maybe the time has come to start tackling the issue of racial and ethnic discrimination
in specific areas, among them housing.
As we said above one of the shortcomings facing researchers with the task of studying
racial discrimination in the housing sector in Portugal, is the double lack of both data on
discrimination and scientific research on the same subject. As we also referred we tend
to believe that this is less a sign that such discrimination is non-existent than that we
have yet to find appropriate channels for them to manifest. There is already a special
body that receives complaints of racial discrimination, the Commission for Equality and
Against Racial Discrimination, but we have reasons to believe that many cases of
housing discrimination don’t reach the records. Indeed, according to agents working in
the field, discriminating customers with a minority ethnic background in the business of
renting or selling a house is common practice in the market, the victims being mainly
citizens of African origin. Many times these victims do not file a complaint because
they find little use in it, since they don’t believe much will happen to the perpetrator.
And in fact proving discrimination is a difficult thing since it is seldom invocated as a
reason for not renting or selling the house. But we have reasons to believe that even
when the evidences of discrimination are strong the victims usually do not file an
official complaint. Such evidence can be, for example, a request, made after the refusal
of the agent to sell or rent the house to a black person, by a white person faking to be
interested in the dwelling. One of the ways to encourage the complaints of racial
discrimination would be to launch a public campaign telling people what to do in case
they find themselves discriminated in buying or renting a house. One of the main
aspects of such a campaign would be to inform the public where they should go on such
occasions. People generally are not aware of the existence of the Commission for
Equality and Against Racial Discrimination where they can direct to in case of
discrimination on ethnic or racial grounds. Such a campaign would have the effect not
73
only of raising the complaints, thus filing the gap between the number of recorded cases
and the number of cases that really took place, but also, by raising the awareness to such
problems, of probably reducing discrimination itself.
It is common knowledge that solving a problem involves knowing it. Though we have
clear signs, both from anti-racist associations and from agents working in the housing
sector that discrimination of ethnic minorities occurs frequently, we are very far from
knowing the contours of the phenomena. Racial discrimination in general has not been
so far a major concern of social scientific academic research in Portugal. Besides some
theoretical considerations, the major study so far concerned racism in general, in its
origin and in the different guises it can take. The study of ethnic or racial
discrimination, either blatant or subtle, either direct or institutional, in several areas and
based on empirical research, remains to be made. One such area is housing. It is an area
where the limits between direct and indirect racism are difficult to trace. The
discrimination perpetrated by housing agents reflects many times an option taken by the
proprietors of the house who explicitly say they don’t want the house rented to blacks or
to Roma. It is many times the case that these owners will say that they are not being
racists since they do not believe Africans or Roma to be in any way inferiors to white
persons, they simply stick to widely held societal representations of these populations as
less liable to keep to their contractual obligations, and so the proprietors of the house
would not simply want to take risks. But, notwithstanding the beliefs of whoever denies
to a Roma or an African the right to buy or rent a house, the fact remains that people get
differential treatment on account of a different skin colour or ethnic origin.
Immigrants and ethnic minorities may face other disadvantages, concerning their
housing situation, other than racial discrimination. The many times difficult economic
situation in which they live is a serious obstacle to obtain a dwelling with the minimum
of conditions for a decent living. It can be said, of course, that this is a problem that
affects not only immigrants, but that in moments of downturn of the economic
conjuncture such as these, all population is affected. But immigrants are doubly so,
since most of them hold precarious jobs in the most precarious sectors of the economy,
like construction works, and additionally a considerable number of them are
undocumented, which means that they are not eligible for systems of state social
protection. They can at best rely on the good will of some institutions, whose means are

74
very limited. As we said above, according to media and NGO’s the number of homeless
among immigrants, specially among Eastern Europeans, keeps rising. It would be
important to make a survey or an academic research on the conditions of living of these
immigrants, both those who are in a regular situation and the undocumented.
Policies of the host society can have an active stance in the reconfiguration of the image
of certain derelict neighbourhoods, as well as on the integration of the populations
living there. A good example of that was the successful project developed in the Hague,
in Holland. That project- City Mondial- was awarded the 2000 “Eurocities Award on
Innovative Urban Strategies”. A network of partners (tourism organizations, religious
associations, Chambers of commerce, Institute of small and medium enterprises, local
political parties and the media) with the financial support of the European Union and of
the Town Hall , developed a number of measures which improved the entrepreneurial
activities of the different ethnic minorities residing in certain neighbourhoods of the city
(especially in degraded and segregated zones). The objective was to stimulate
entrepreneurial initiatives as a way of integrating its inhabitants, creating job
opportunities, and making derelict neighbourhoods attractive sites for dwelling and
investment.
But it is clear that the success of this project was also based on the tourist demand for
some products deemed exotic95. Thus, though this example can stand as a suggestion for
a good practice, its implementation in other residential contexts and in other societies
will rely heavily on the market conditions, on the contexts of reception (foremost the
engagement of the privileged institutional actors) and in the motivation of the
populations living in the neighbourhood themselves.
95 Santokhi, S. (2002), "Neighbourhood Transformation and Economic Activities. Aspects of Urban economic activities in segregated areas in The Hague", paper presented in the Workshop «Communication across cultures in Multicultural Cities», promoted by the Institute of Higher European Studies, The Hague, The Netherlands, between 7 and 8 November 2002.

75
Bibliography: AML (Lisbon Metropolitan Area) Metropolitan Council (1997) “ Characterisation of
the Special Re-location Programme in the Lisbon Metropolitan Area”.
Arnaud, L. e Pinson, G. (2002), Shaping the identity and mobilising the «ethnic capital»
in three European cities, paper prepared for the Second EuroConference Urbanism
and Globalization, “The European City in Transition”, Weimar, 8 e 9 de
Novembro.
Baganha, M. et al. (2000), Is na Ethclass emerging in Europe? The Portuguese case,
Lisboa: FLAD.
Barata Salgueiro, T. et al (1997) Internacionalização, Reestruturação Económica e
Produção de Novas Marginalidades na Região de Lisboa [Internationalization,
Economic Re-structuration and the Production of New marginalities in the Lisbon
Region], Lisbon, DGOTDU Project Report
Bruto da Costa, A. e Pimenta, M. (1991), Minorias Étnicas Pobres em Lisboa:
Resultados preliminares de um inquérito aplicado a famílias residentes em
bairros degradados, [Poor Ethnic Minorities in Lisbon: Preliminary results of an
inquiry applied to families living in derelict neighbourhoods] Lisboa: Centro de
Reflexão Cristã / Câmara Municipal de Lisboa.
Costa, F. M. et. al. (2002) As populaces do Concelho da Amadora: relações inter-
étnicas e representações [The populations of the Amadora Municipality: inter-
ethnic relations and representations], Amadora: Amadora Town Hall
Cardoso, A. and Perista, H. (1994) A cidade esquecida- pobreza em bairros degradados
de Lisboa [The forgotten city- poverty in derelict quarters in Lisbon] in Sociologia
Problemas e Práticas Nº 15, pp 99-111 Centro de Investigação e Estudos de
Sociologia- ISCTE [Center of Research and Studies in Sociology]
Esteves, A. (1998), A criminalidade na cidade de Lisboa. Uma geografia da
insegurança [Criminality in the city of Lisbon. A geography of insecurity],
Lisboa: Edições Colibri.
Fainstein, Susan S. and Campbell, S., (eds.) (1996) Readings in Urban Theory, Oxford:
Blackwell Publishers
Fonseca, L. et. al. (2002), Immigrants in Lisbon. Routes of integration, Centro de
Estudos Geográficos, Estudos para o planeamento Regional e Urbano Nº56,
Lisboa: Universidade de Lisboa.

76
França, L. (coord.),(1992), A Comunidade Caboverdiana em Portugal [The Cape
Verdean Community in Portugal], Lisboa: IED.
Machado, F.L. (2002) Contrastes e Continuidades- Migração, Etnicidade e Integração
dos Guineenss em Portugal [Contrasts and Continuities- Migration, Ethnicty and
Integration of Guineese in Portugal] Oeiras: Celta
Malheiros, J.M. (1996), Imigrantes na região de Lisboa. Os anos da mudança
[Immigrants in the Lisbon Region. The years of change], Lisboa: Edições Colibri.
Malheiros, J. (1998) Segregação socioétnica na região metropolitana de Lisboa [Social
Ethnic Segregation in the Lisbon Metropolitan Region] in Sociedade e Território
30
Malheiros, J. (2002), “«Nova» imigração e desenvolvimento regional: situação actual e
oportunidades para as regiões portuguesas” [New immigration and regional
development: present situation and opportunities for the Portuguese regions], in
Imigração e Mercado de Trabalho [Immigration and Labour Markets], Cadernos
Sociedade e Trabalho II, Lisboa: MSST/DEPP, pp.69-87.
Malheiros, J. (2002a) “Ethni-cities: Residential Patterns in the Northern European and
Mediterranean Metropolises – Implications for Policy Design.” in International
Journal of Population Geography, vol.8 pp. 107-134
Marques, M. et al. (2001), Realojamento no concelho de Oeiras. Um estudo sociológico
[Re-housing in the Oeiras municipality. A sociological study], Caderno Técnico
de Habitação nº1, Oeiras: Direcção Municipal de Planeamento, Urbanismo e
Habitação.
Ministério do Equipamento Social- Laboratório Nacional de Engenharia Civil- Grupo
de Ecologia Social [Ministry of Social Equipment- National Laboratory of Civil
Engineering- Center of Social Ecology] (2001), Habitat e Minorias: Limites e
Potencialidades da Promoção Pública de Habitação em Processos de Integração
socio-urbanística. Relatório Final. [Habitat and Minorities: Limits and
Potencialities of the Public Promotion of Housing in processes of socio-urban
integration. Final Report] Trabalho executado para o Instituto Nacional de
Habitação [Work executed for the National Housing Institute]
OECD (1998), Immigrants, Integration and cities. Exploring the links, Paris:
Organisation for economic co-operation e development.

77
Oliveira, C. e A. Inácio (1999), Nacionalizações em Portugal (1985-1996)
[Nationalizations in Portugal (1985-1996)], Working Paper Series #11, Lisboa:
SociNova.
Oliveira, C. (2002), “Chinese in Portugal. An immigration cartography”, in Fonseca et
al. (eds.), Immigration and place in mediterranean metropolises, Metropolis
Portugal, Lisboa: FLAD, pp.229-254.
Pires, R. P. et al. (1987), Retornados. Um Estudo Sociográfico [Retornados. A
sociographical study]; caderno 14, Lisboa: Instituto de Estudos para o
Desenvolvimento.
Pires, R. P. (2002), Mudanças da imigração. Uma análise das estatísticas sobre a
população estrangeira em Portugal, 1998-2001 [Changes in immigration: an
analysis of the statistics on the foreign population in Portugal, 1998-2001], in
Sociologia, Problemas e Práticas, nº39, pp. 151-166.
Relatório sobre Oportunidades de Trabalho em Portugal em 2002[Portuguese Work
Opportunities Report 2002]
Rocha Trindade, M. B. (1995), Sociologia das Migrações [Sociology of Migrations],
Lisboa: Universidade Aberta.
Rosa et al. (2000), Imigrantes Internacionais: dos factos ao Conceito [International
Immigrants: from the facts to the concept], SociNova Working Papers # 17,
Lisboa: FCSH – UNL
Saint-Maurice, A. (1997) Identidades Reconstruídas: Cabo-Verdianos em Portugal,
Oeiras: Celta
Saint-Maurice, A. e R.P. Pires (1989), “Descolonização e migrações. Os imigrantes dos
PALOP em Portugal”, in Revista Internacional de Estudos Africanos nº10 e 11,
pp.203-226.
Santokhi, S. (2002), "Neighbourhood Transformation and Economic Activities.
Aspects of Urban economic activities in segregated areas in The Hague", paper
presented in the Workshop «Communication across cultures in Multicultural
Cities», promoted by the Institute of Higher European Studies, The Hague, The
Netherlands, between 7 and 8 November 2002.
Waldinger, R., et al. (1990), Ethnic entrepreneurs. Immigrant business in industrial
societies, Sage Publications.

78
Zukin, S., (1995) Whose Culture? Whose City in Fainstein, Susan S. and Campbell, S.,
(eds.) (1996) Readings in Urban Theory, Oxford: Blackwell Publishers Originally
Published in Zukin, S. (1995) The Culture of Cities, Oxford: Blackwell Publishers

79
HOUSING REPORT STATISTICAL ANNEX: In Portugal, the phenomenon of immigration is relatively new. Notwithstanding, ways
of dealing adequately with the issue have been sought.
The Activities Report by ACIME (High-Commissioner on Immigration and Ethnic
Minorities), bearing the title “Integração de Imigrantes e Minorias Étnicas” [Integration
of Immigrants and Ethnic Minorities] – which covers the period between 1996 and 1999
– states that the Government acknowledges the new challenges facing Portugal today, as
a country of immigration, and adds that the later call for measures aiming at the
integration of immigrants and ethnic minorities in Portuguese society, so as to avoid
situations of discrimination related with racism and xenophobia. Refugees/Asylum Seekers in Portugal: In Portugal, the number of asylum applications
is extremely low, especially when compared with the number of economic immigrants
or with the number of asylum applications in other European countries.
Between 1993 and 2001, 112 asylum applications were accepted under the Geneva
convention, which, when measured against the total number of applications submitted
throughout the same period, rates at 2.7%96. With regard to residence permits for
humanitarian reasons, 161 applications were accepted between 1998 and 2001, which
corresponds to a 16% acceptance rate. Immigrants: We should stress that the terminology in use to define immigrants and
migration is far from being clear. In fact, what we can find in official statistics is the
category of legal non-nationals having foreign nationality.
Table 14 - Evolution of the foreign population with residence permit in Portugal
Year Number of foreigners with residence permit Rate of Change (5 years)
1980 50750
1985 79594 56,8%
1990 107767 35,4%
1995 168316 56,2%
2000 207607 23,3% Source: Statistical Report of the Borders and Aliens Services( http://www.sef.pt/estatisticas.htm)
96 Bárbara Mesquita, “Asilo e Imigração Económica ou a Fronteira Indefinida” in A Imigração em Portugal, SOS Racismo, Lisbon, November 2002.

80
Thus we face the problem of mistaking immigrants with foreigners, whereas there
are, actually, immigrants with Portuguese nationality, but that were born abroad, and
those that are natural of the host country and have foreign nationality. This confusion is
patent in the media, in the political discourse and even in scientific research (Rosa et al.,
2000:2)
The coming back of Portuguese emigrants specially during the seventies and the
eighties makes this problem obvious taking into account that half a million people with
Portuguese nationality returned, having diluted themselves in the mainstream society,
hence they are not seen as immigrants (Pires et al. 1987, Ferrão 1996).
Moreover, there are foreigners to whom it was granted the Portuguese nationality
through marriage – after three years of being married to a Portuguese citizen – or
through naturalization – after six to ten years (respectively to a citizen from the PALOP
and from other countries) having a valid residence permit in Portugal (Oliveira e Inácio,
1999). The majority of foreigners to whom the naturalization was granted between 1985
and 1996 are from African countries (48%) followed by Asians (33,6%). Naturalization
by ways of marriage was predominantly granted to Asians (42,5%) followed by
Africans (29,8%).
Table 15 - Portuguese nationality grants by way of marriage and naturalization
Between 1985 and 1996, according to Law nº37/81 Nationalizations 1985 1986 1987 1988 1989 1990 1991 1992 1993 1994 1995 1996 Total Marriage 833 459 51 840 1375 781 1078 1628 1062 1623 1134 974 11838 Naturalizations 42 17 25 21 37 65 61 78 115 81 87 124 753
Total 875 476 76 861 1412 846 1139 1706 1177 1704 1221 1098 12591 Source: Oliveira e Inácio, 1999
Nevertheless, the statistical significance is not very meaningful. The
naturalizations’ weight never went over 0,8%, during these years, when compared with
the total of foreign resident population (only in 1998, accordingly with data from SEF,
reached 2,9%). Notwithstanding this weak significance, Portuguese nationality granting
was the reason why 53% (1997 data) of the foreign residents had ceased their residence
permit (Rosa et. al. 2000).
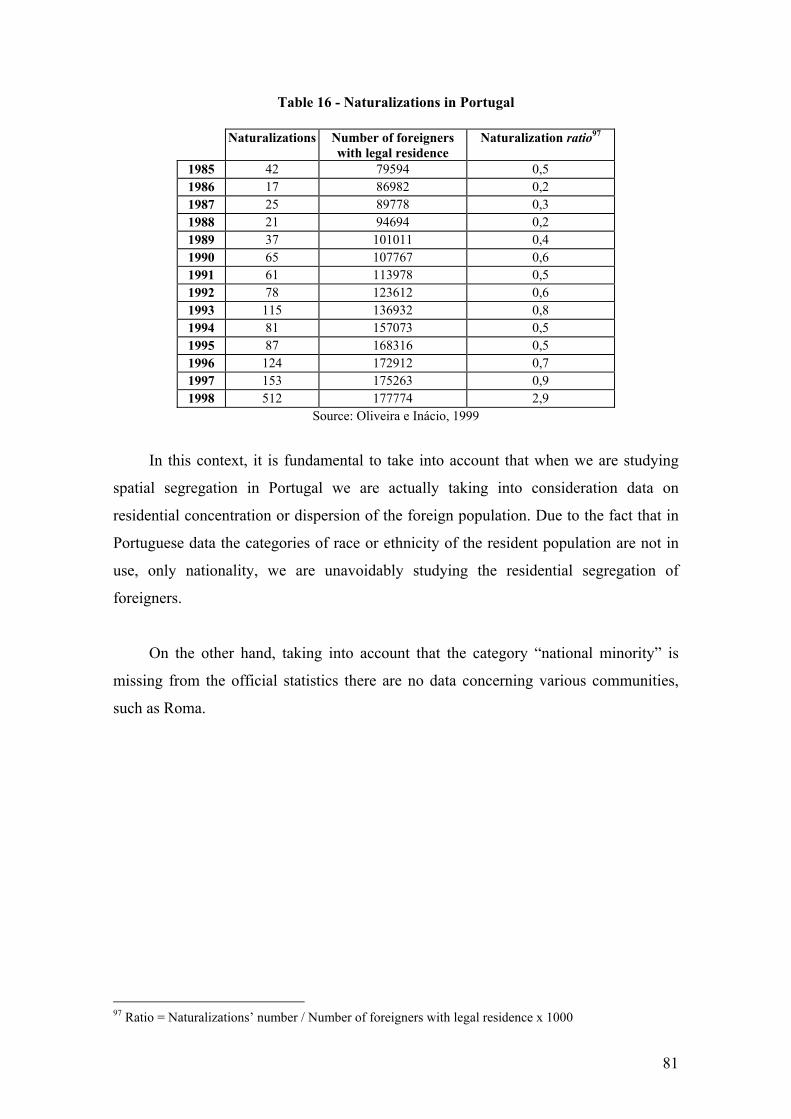
81
Table 16 - Naturalizations in Portugal
Naturalizations Number of foreigners with legal residence
Naturalization ratio97
1985 42 79594 0,5 1986 17 86982 0,2 1987 25 89778 0,3 1988 21 94694 0,2 1989 37 101011 0,4 1990 65 107767 0,6 1991 61 113978 0,5 1992 78 123612 0,6 1993 115 136932 0,8 1994 81 157073 0,5 1995 87 168316 0,5 1996 124 172912 0,7 1997 153 175263 0,9 1998 512 177774 2,9
Source: Oliveira e Inácio, 1999
In this context, it is fundamental to take into account that when we are studying
spatial segregation in Portugal we are actually taking into consideration data on
residential concentration or dispersion of the foreign population. Due to the fact that in
Portuguese data the categories of race or ethnicity of the resident population are not in
use, only nationality, we are unavoidably studying the residential segregation of
foreigners.
On the other hand, taking into account that the category “national minority” is
missing from the official statistics there are no data concerning various communities,
such as Roma.
97 Ratio = Naturalizations’ number / Number of foreigners with legal residence x 1000

82
Table 17 - Districts of Residency of Immigrant Population*
Ukraine Moldava Romania Russian Lithuania Total of lineDistricts of residency
N. % N. % N. % N. % N. % N %
Aveiro 3635 7,1 235 2,4 115 1,4 784 14,3 43 4,8 4812 6,4
Beja 756 1,5 120 1,2 179 2,1 54 1,0 4 0,4 1113 1,5
Braga 3455 6,8 160 1,7 305 3,6 397 7,3 130 14,6 4447 5,9
Bragança 177 0,3 7 0,1 8 0,1 22 0,4 4 0,4 218 0,3
Castelo Branco
915 1,8 54 0,6 91 1,1 61 1,1 22 2,5 1143 1,5
Coimbra 2242 4,4 178 1,9 277 3,3 223 4,1 122 13,7 3042 4,0
Évora 1570 3,1 342 3,6 421 5,0 117 2,1 45 5,0 2495 3,3
Faro 7435 14,6 2510 26,1 2019 23,9 860 15,7 76 8,5 12900 17,1
Guarda 530 1,0 27 0,3 25 0,3 33 0,6 38 4,3 653 0,9
Leiria 5734 11,3 653 6,8 98 1,2 389 7,1 19 2,1 6893 9,2
Lisbon 9563 18,8 2683 27,9 2913 34,5 989 18,1 76 8,5 16224 21,5
Portalegre 400 0,8 130 1,4 225 2,7 18 0,3 18 2,0 791 1,1
Oporto 5510 10,8 444 4,6 318 3,8 726 13,3 194 21,7 7192 9,6
Santarém 3465 6,8 496 5,2 358 4,2 197 3,6 37 4,1 4553 6,0
Setúbal 2563 5,0 1301 13,5 951 11,3 329 6,0 27 3,0 5171 6,9
Viana do Castelo
557 1,1 42 0,4 30 0,4 84 1,5 10 1,1 723 1,0
Vila Real 482 0,9 22 0,2 3 0,0 54 1,0 5 0,6 566 0,8
Viseu 1909 3,8 203 2,1 96 1,1 136 2,5 23 2,6 2367 3,1
Total 50898 9607 8432 5473 893 75303 Source: Report on the Evolution of the Migratory Phenomenon, March 2002, IGT, ACIME, SEF; www.idict.gov.pt/docum_igt/acime * Marked as yellow are the most significant occurrences, i.e., the districts where the majority of foreigners are concentrated.
Table 18 - Resident employed population according to professional groups and region of
the country in 2001
Professional Groups * Portugal North Centre
Lisbon and Tagus Valley Alentejo Algarve Azores Madeira
Group 1 N 325268 117265 69372 96862 19221 13872 3908 4768 % 7,0 7,1 6,9 7,5 5,9 7,7 4,1 4,5
Group 2 N 395477 116771 77054 154726 21053 11858 6739 7276 % 8,5 7,1 7,7 12,0 6,5 6,6 7,1 6,9
Group 3 N 442797 136596 82773 166599 25101 14819 8289 8620 % 9,5 8,2 8,2 13,0 7,8 8,2 8,8 8,2
Group 4 N 511589 154320 93693 191191 31555 20115 9640 11075 % 11,0 9,3 9,3 14,9 9,8 11,2 10,2 10,5

83
Group 5 N 658221 201015 136239 202157 49330 37714 13000 18766 % 14,2 12,1 13,5 15,7 15,3 20,9 13,7 17,8
Group 6 N 188054 68409 59444 11632 19859 10015 9502 9193 % 4,0 4,1 5,9 0,9 6,1 5,6 10,0 8,7
Group 7 N 1001568 459441 226002 186213 59937 32293 18367 19315 % 21,5 27,7 22,5 14,5 18,5 17,9 19,4 18,3
Group 8 N 398048 178899 102047 69921 27265 8471 5325 6120 % 8,6 10,8 10,1 5,4 8,4 4,7 5,6 5,8
Group 9 N 697514 217948 152269 191102 66807 30691 18892 19805 % 15,0 13,2 15,1 14,9 20,7 17,0 19,9 18,8
Total N 4650947 1656103 1006373 1284673 323167 180395 94728 105508 % 100 100 100 100 100 100 100 100
Source: General Survey 2001, National Statistics Institute.
* Legend: Professional groups according to the National Professional Code of 1994
Group 1: Public Administration Officers and Corporate Managers
Group 2: Specialists on Scientific and Intellectual Professions
Group 3: Intermediate professions and technicians
Group 4: Staff and Similars
Group 5: Service workers and Sellers
Group 6: Farmers and Qualified Workers on Agriculture and Fishing
Group 7: Workers, Artisans and similars
Grupo 8: Machine Fitting Operators and assembly line workers
Grupo 9: Non-skilled workers A great vulnerability to unemployment can be verified among some nationalities, as
well as a greater dependence on the dole and on the Minimum Guaranteed income.
Most foreign unemployed are from the PALOP, who are also the main beneficiaries of
the dole (see table bellow).
Table 19 - Beneficiaries of the dole and of the minimum guaranteed income according to their nationalities in 2002
Origens Dole* Minimum Guaranteed
Income ** N % N %
Africa 5516 33,8 5367 43,6 PALOP 5238 32,1 5248 42,7 América 1768 10,8 463 3,8 Brazil 1389 8,5 271 2,2 Oceania 36 0,2 - - Asia 125 0,8 129 1,0 Europe 2260 13,8 821 6,7 Total Foreigners 16332 100 12299 100 Portugueses 318048 - 302373 -
* Source: Institute of Informatic and Statistics of Solidarity of the Ministry of Work and Solidarity
** Data refering solely to the Continent.. Source: Institute of Solidarity and Social Security

84
Map 1 Distribution of Roma population in Lisbon Map 2 National Distribution of the Roma population in precarious housing conditions

85
Graphic 3 - Number of Roma that live in precarious housing