National Action Plan for Energy Efficiency
216
A PLAN DEVELOPED BY MORE THAN 50 LEADING ORGANIZATIONS IN PURSUIT OF ENERGY SAVINGS AND ENVIRONMENTAL BENEFITS THROUGH ELECTRIC AND NATURAL GAS ENERGY EFFICIENCY JULY 2006
Transcript of National Action Plan for Energy Efficiency
A PLAN DEVELOPED BY MORE THAN 50 LEADING
ORGANIZATIONS IN PURSUIT OF ENERGY SAVINGS
A N D E N V I R O N M E N TA L B E N E F I T S T H R O U G H
ELECTRIC AND NATURAL GAS ENERGY EFFICIENCY
JULY 2006
The goal is to create a sustainable
aggressive national commitment
to energy efficiency through gas and
electric utilities utility regulators
and partner organizations
Improving energy efficiency in our homes businesses schools governments and
industriesmdashwhich consume more than 70 percent of the natural gas and electricity used
in the countrymdashis one of the most constructive cost-effective ways to address the
challenges of high energy prices energy security and independence air pollution and
global climate change
The US Department of Energy and US Environmental Protection Agency facilitate the
work of the Leadership Group and the National Action Plan for Energy Efficiency
Acknowledgements
The National Action Plan for Energy Efficiency Report discusses policy planning and program issues based on a formal work plan developed during the December 2005 and March 2006 Leadership Group meetings The Leadership Group is led by co-chairs Diane Munns (Member of the Iowa Utilities Board and President of the National Association of Regulatory Utility Commissioners) and Jim Rogers (President and Chief Executive Officer of Duke Energy) A full list of Leadership Group members is provided in both the Executive Summary (Table ES-1) and Chapter 1 (Table 1-2) of this report Rich Scheer of Energetics Inc facilitated the Leadership Group discussions during both Leadership Group meetings
Expert consultants funded by the US Department of Energy (DOE) and the US Environmental Protection Agency (EPA) drafted many chapters of the Action Plan Report These consultants included
bull Regulatory Assistance Project Chapter 2 and Appendix A
bull Energy and Environmental Economics Inc Chapters 3 through 5 Energy Efficiency Benefits Calculator and Appendix B
bull KEMA Chapter 6
In addition Rich Sedano of the Regulatory Assistance Project and Alison Silverstein of Alison Silverstein Consulting provided their expertise during review and editing of the overall report
DOE and EPA facilitated the work of the Leadership Group and this report including Larry Mansueti with DOErsquos Office of Electricity Delivery and Energy Reliability Mark Ginsberg with DOErsquos Office of Energy Efficiency and Renewable Energy and Kathleen Hogan Stacy Angel Maureen McNamara Katrina Pielli and Tom Kerr with EPArsquos Climate Protection Partnership Division
Eastern Research Group Inc provided technical review copyediting graphics and production services
To create a sustainable aggressive national commitment to energy efficiency i
List of Figures
Figure ES-1 National Action Plan for Energy Efficiency RecommendationsES-2
Figure ES-2 National Action Plan for Energy Efficiency Recommendations amp OptionsES-8
Figure 1-1 Energy Efficiency Spending Has Declined 1-5
Figure 1-2 Energy Efficiency Has Been a Resource in the Pacific Northwest for the Past Two Decades 1-7
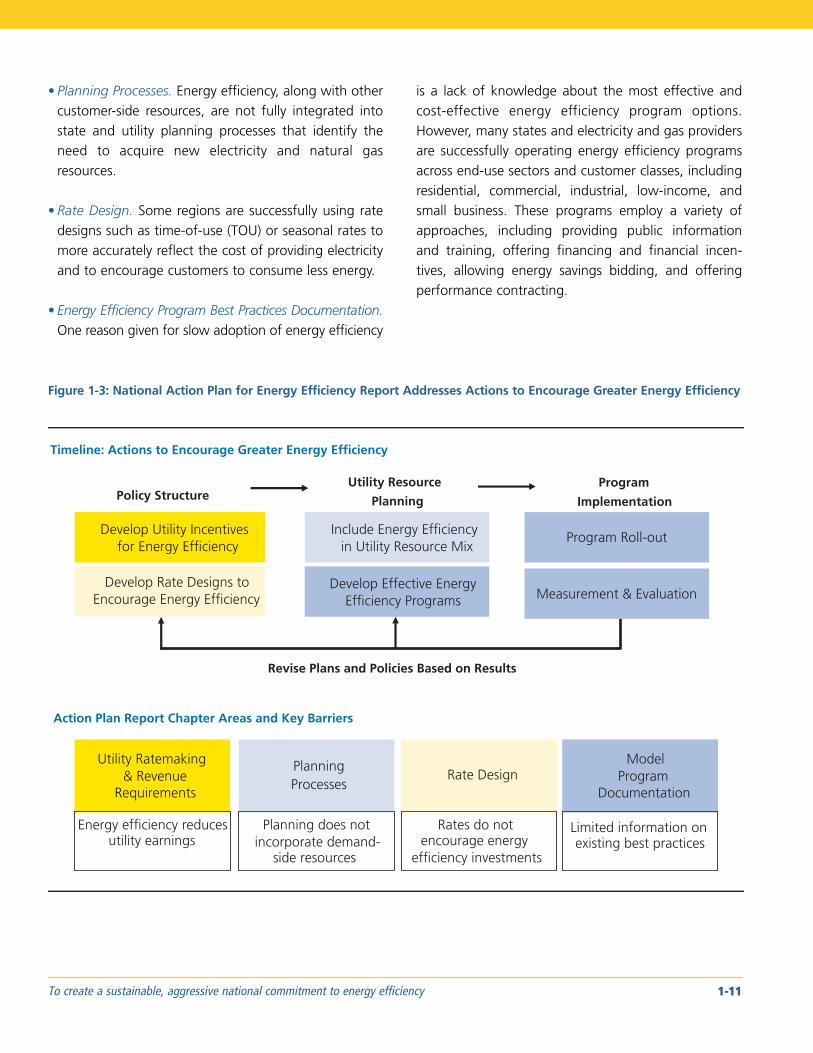
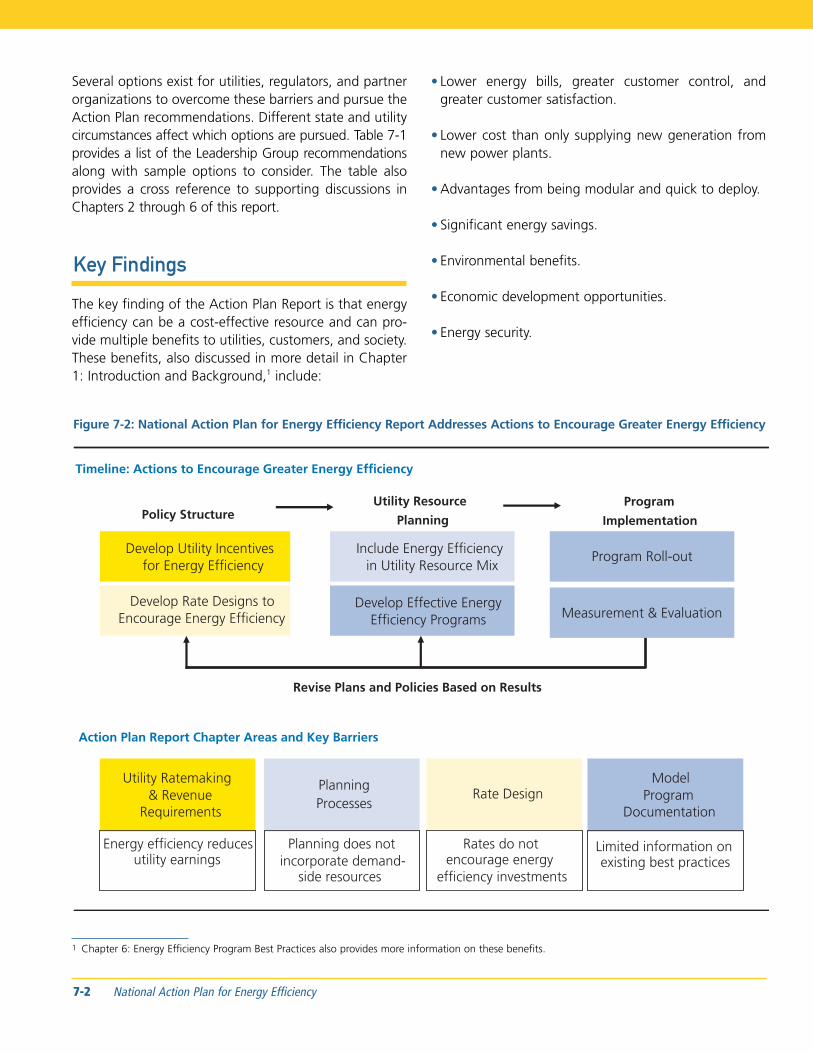
Figure 1-3 National Action Plan for Energy Efficiency Report Addresses Actions to Encourage Greater Energy Efficiency 1-11
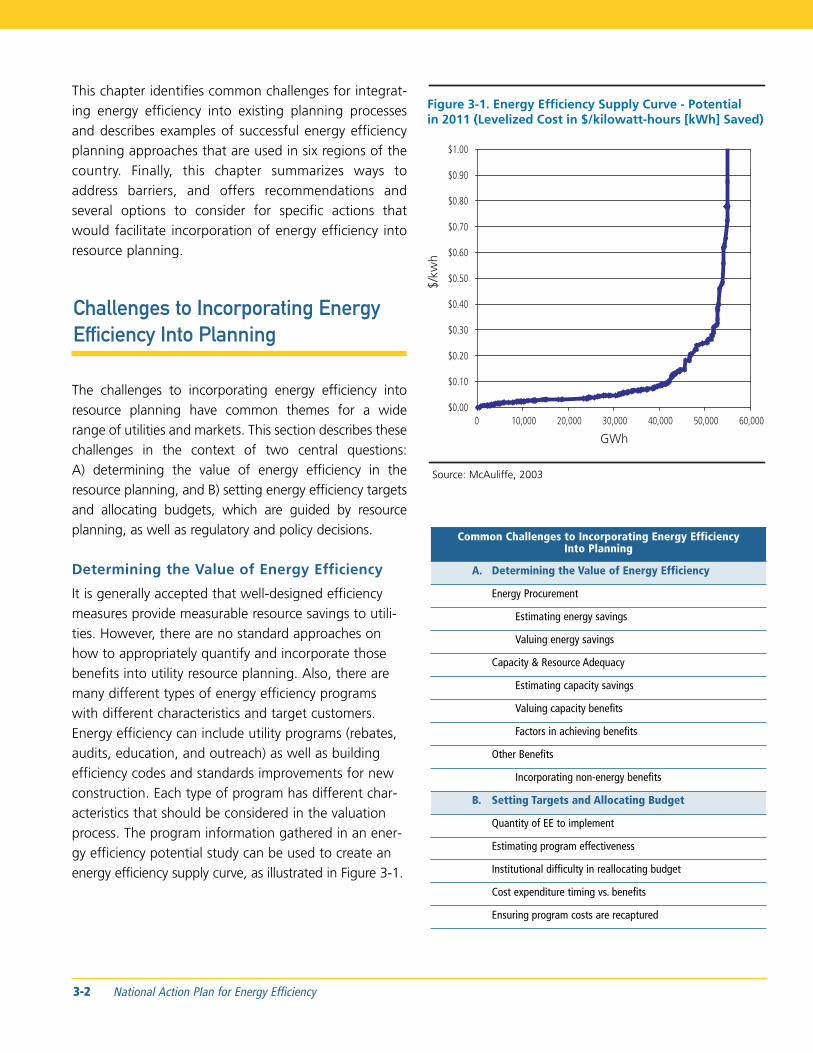
Figure 3-1 Energy-Efficiency Supply Curve ndash Potential in 2011 3-2
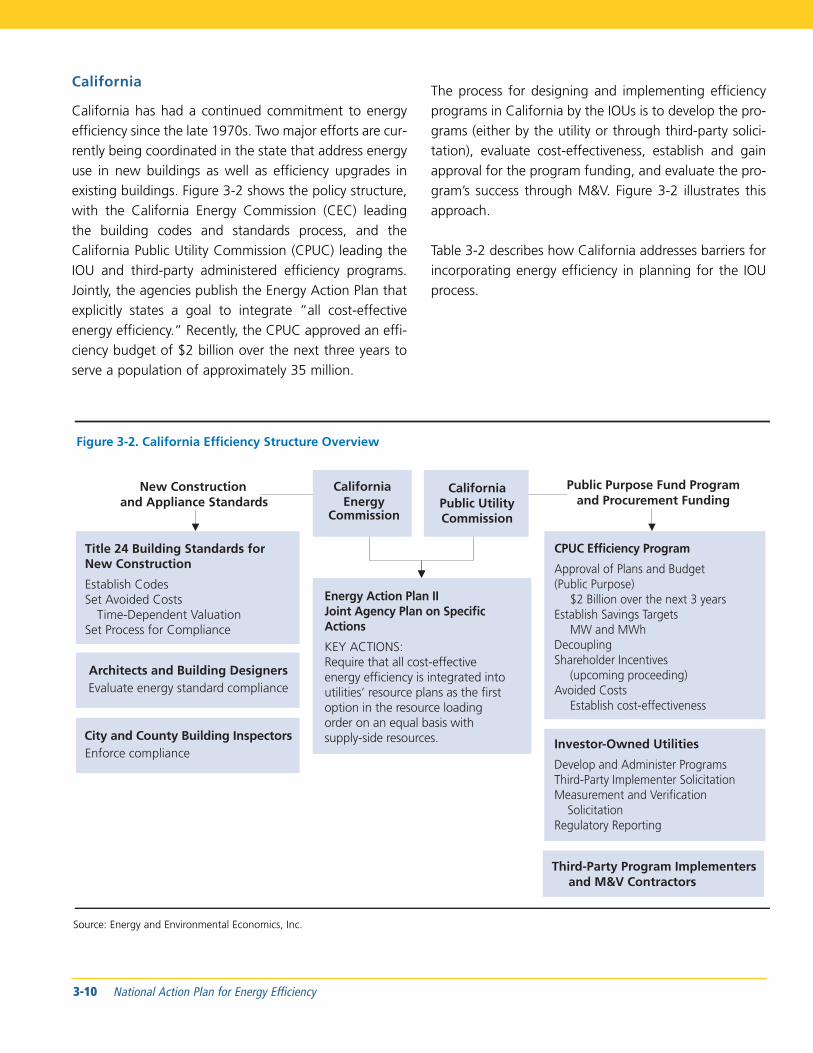
Figure 3-2 California Efficiency Structure Overview3-10
Figure 3-3 California Investor-Owned Utility Process 3-11
Figure 3-4 BPA Transmission Planning Process 3-12
Figure 3-5 New York Efficiency Structure Overview3-13
Figure 4-1 Comparison of Deferral Length with Low- and High-Growth 4-10
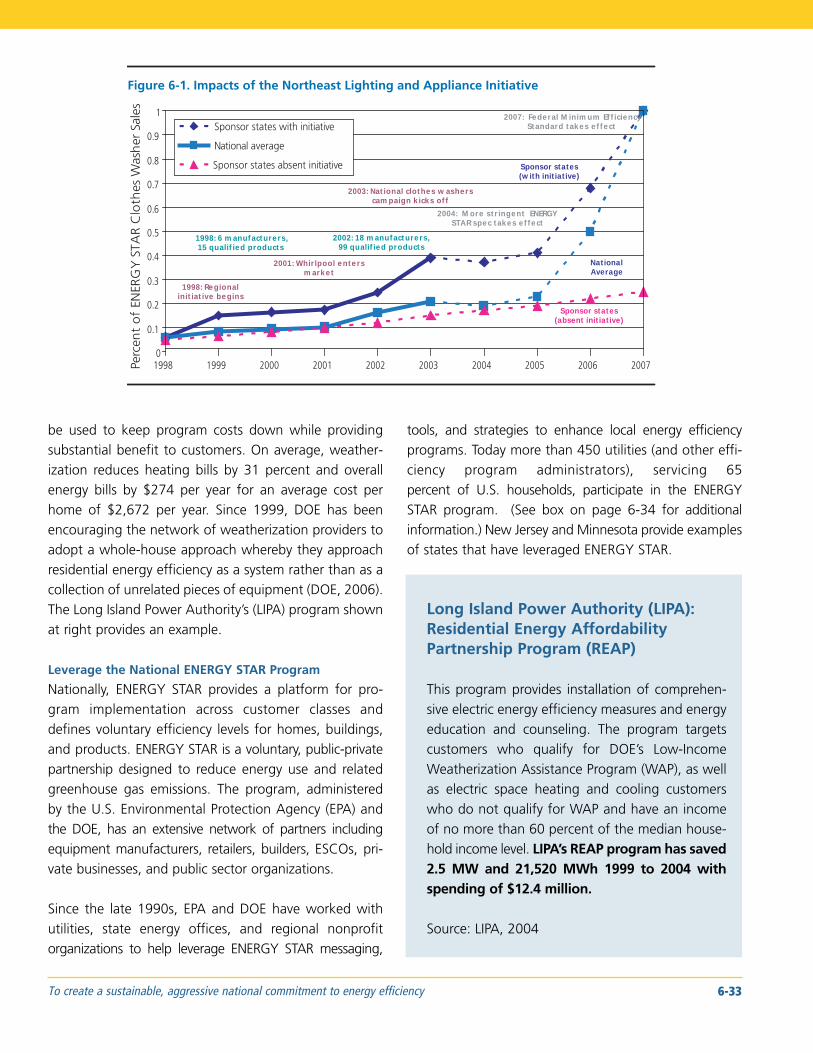
Figure 6-1 Impacts of the Northeast Lighting and Appliance Initiative 6-33
Figure 7-1 National Action Plan for Energy Efficiency Recommendations 7-1
Figure 7-2 National Action Plan for Energy Efficiency Report Addresses Actions to Encourage Greater Energy Efficiency 7-2
National Action Plan for Energy Efficiency ii
List of Tables
Table ES-1 Members of the National Action Plan for Energy Efficiency ES-10
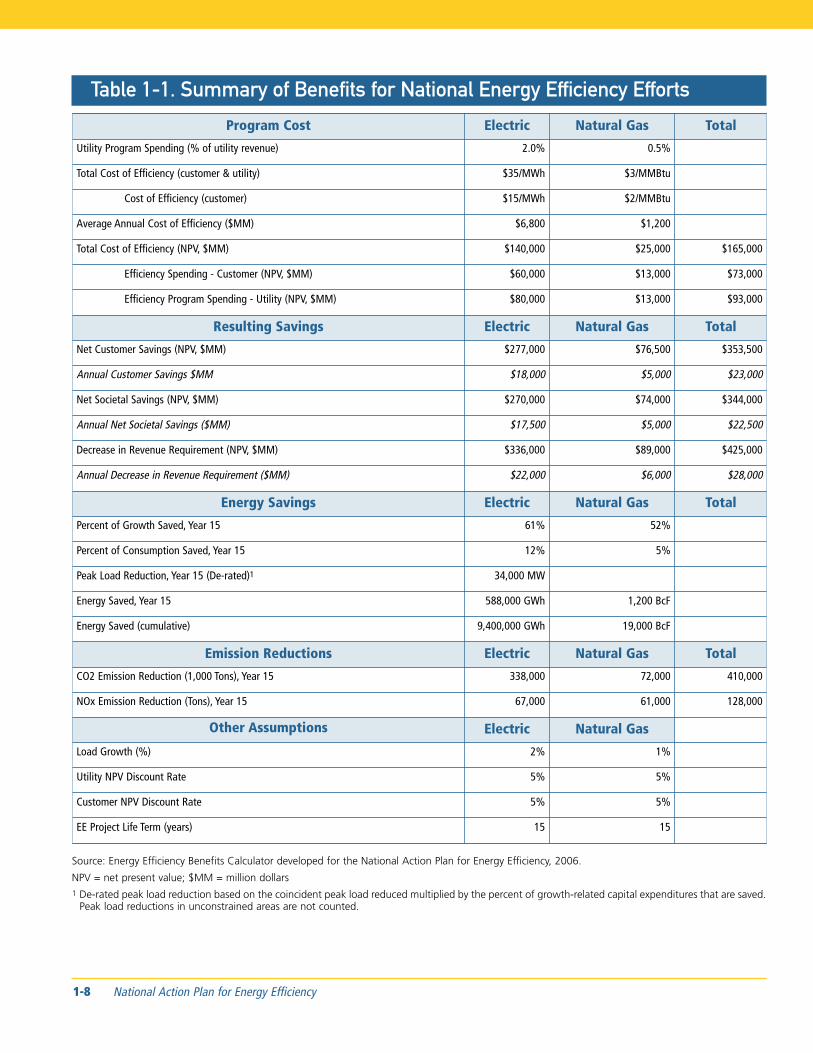
Table 1-1 Summary of Benefits for National Energy Efficiency Efforts 1-8
Table 1-2 Members of the National Action Plan for Energy Efficiency 1-16
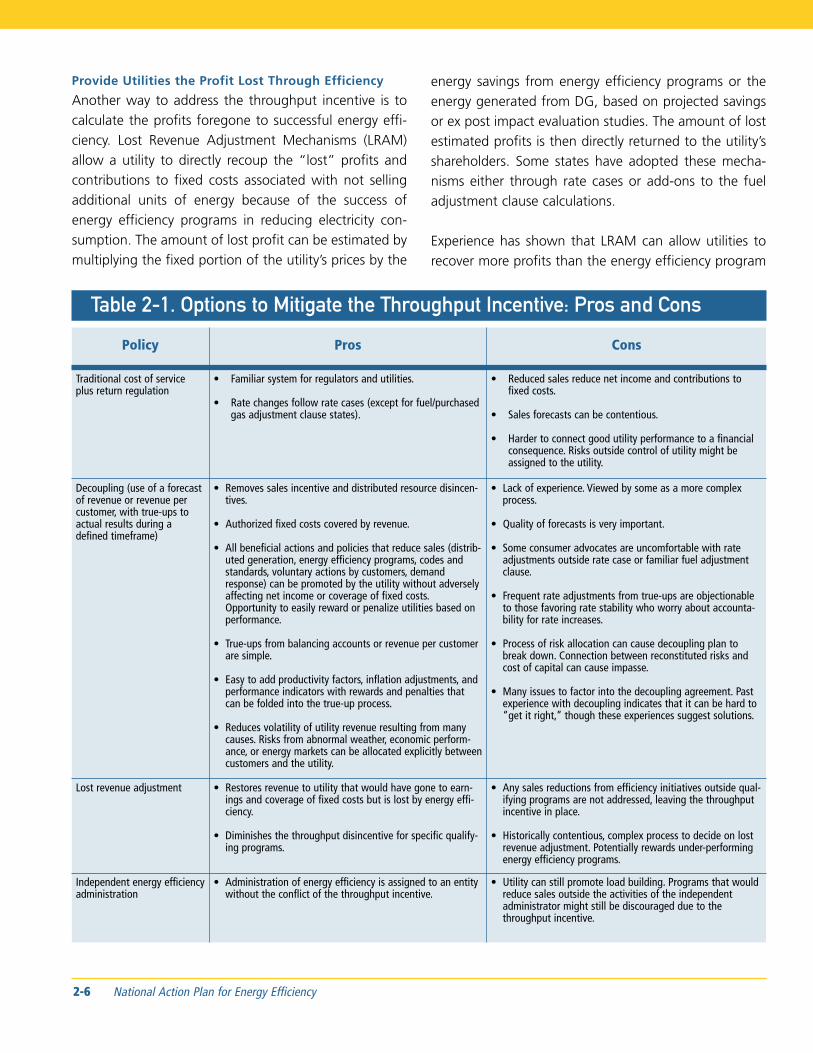
Table 2-1 Options to Mitigate the Throughput Incentive Pros and Cons 2-6
Table 2-2 Examples of Decoupling2-12
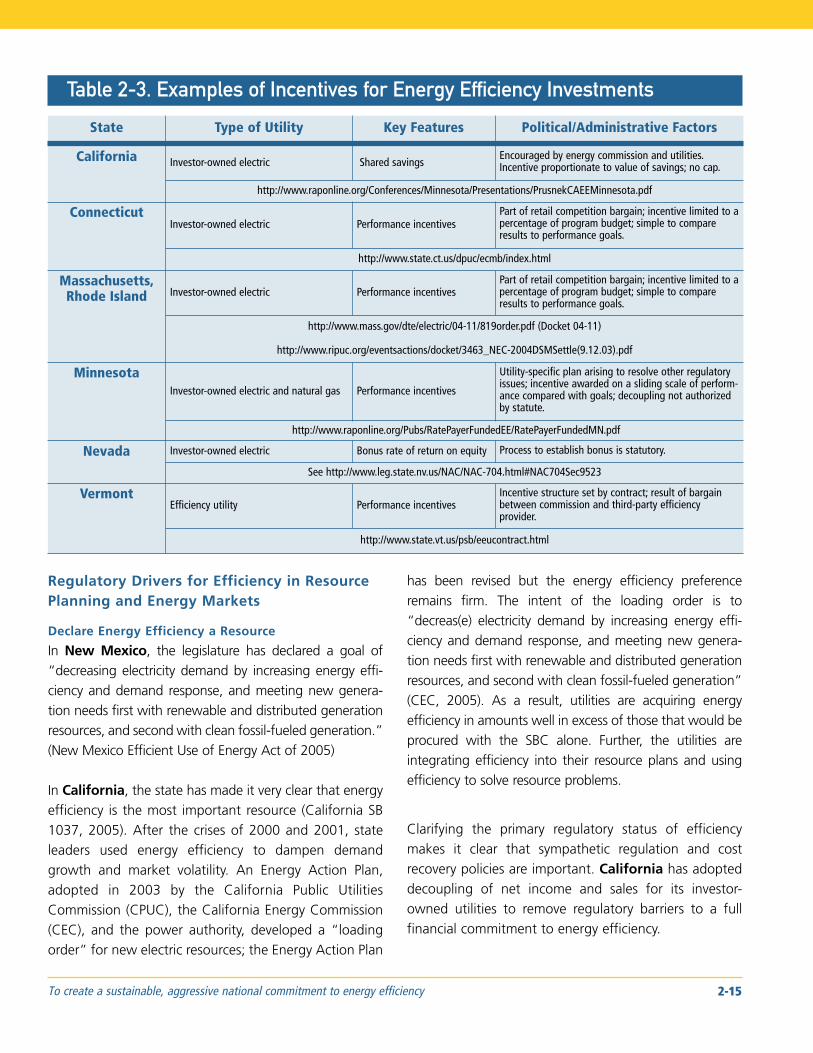
Table 2-3 Examples of Incentives for Energy Efficiency Investments 2-15
Table 3-1 Levelized Costs and Benefits From Four Regions 3-9
Table 3-2 Incorporation of Energy Efficiency in Californiarsquos Investor-Owned Utilitiesrsquo Planning Processes3-11
Table 3-3 Incorporation of Energy Efficiency in BPArsquos Planning Processes3-13
Table 3-4 Incorporation of Energy Efficiency in NYSERDArsquos Planning Processes 3-14
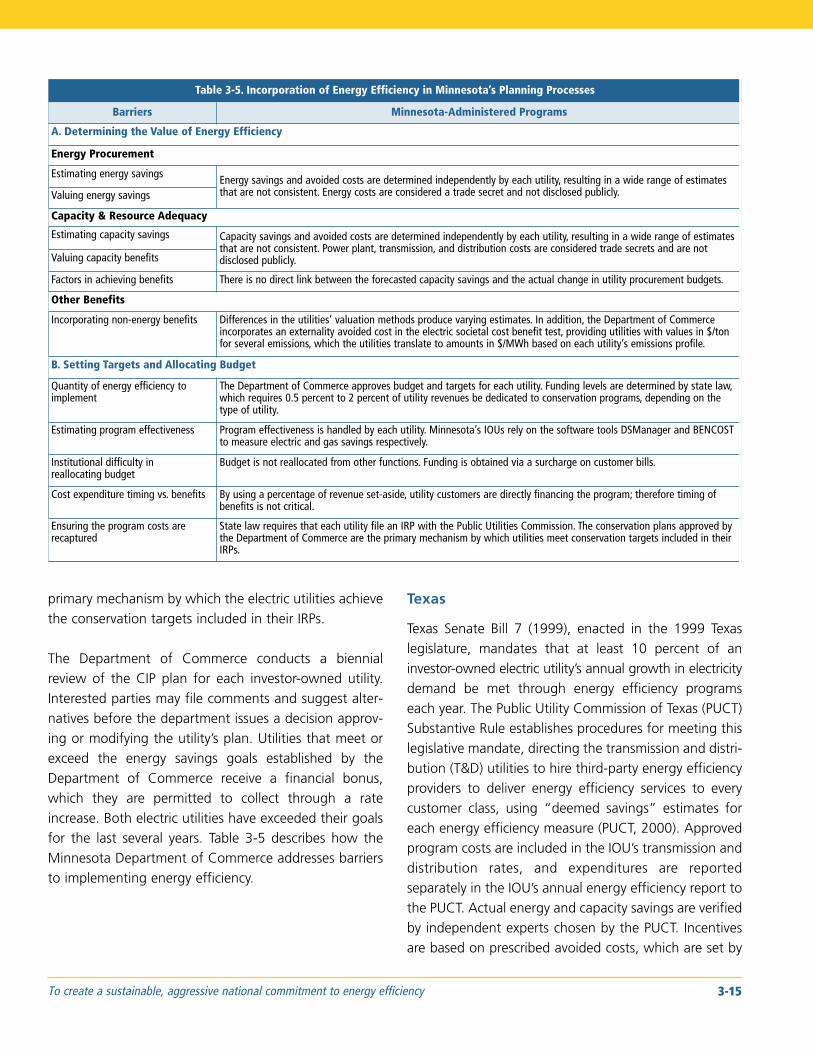
Table 3-5 Incorporation of Energy Efficiency in Minnesotarsquos Planning Processes 3-15
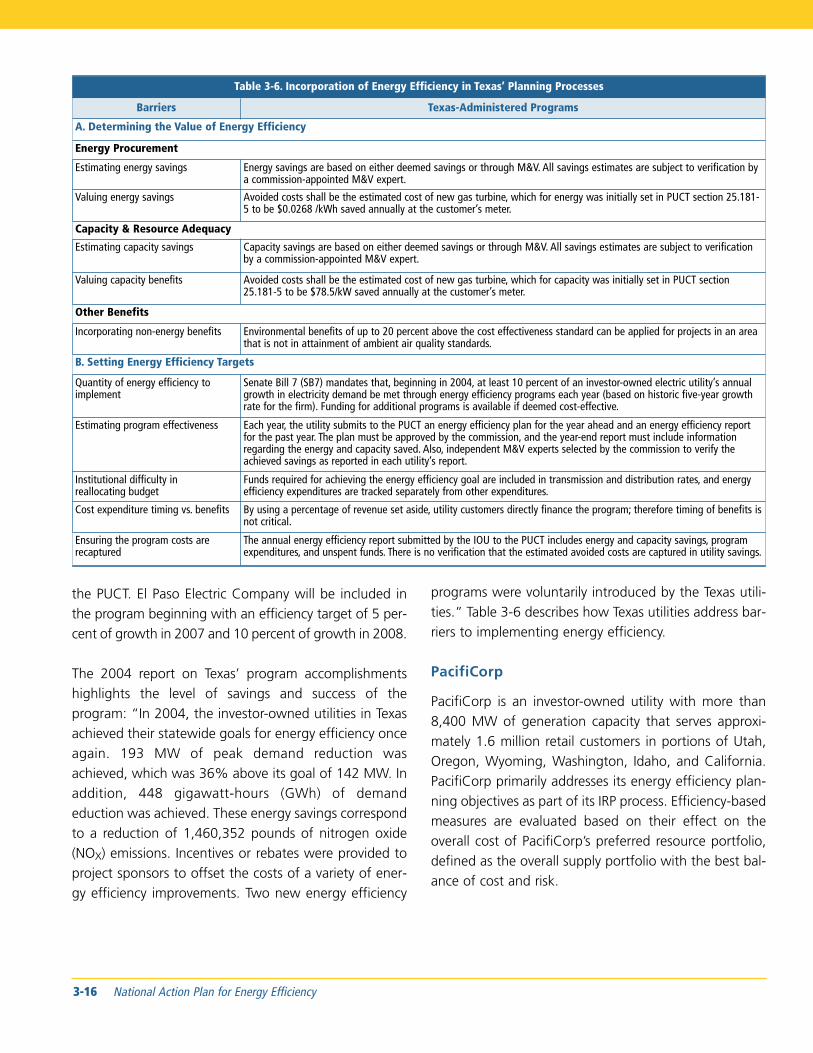
Table 3-6 Incorporation of Energy Efficiency in Texasrsquo Planning Processes 3-16
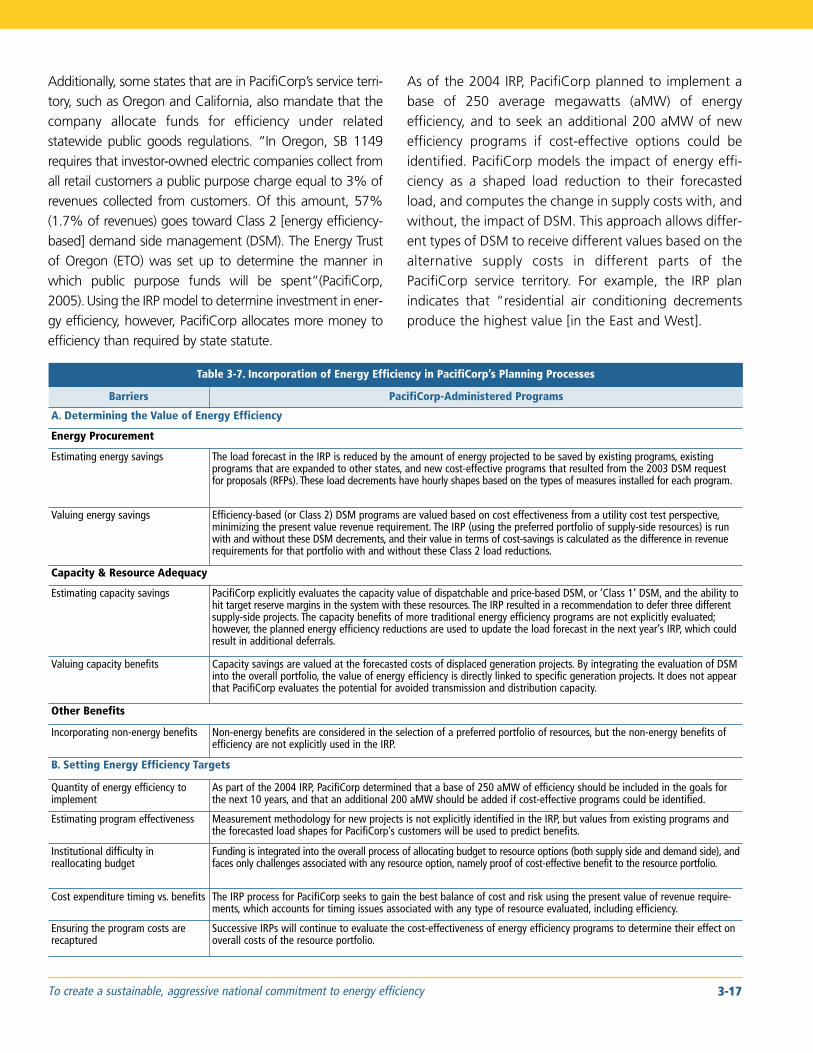
Table 3-7 Incorporation of Energy Efficiency in PacifiCorprsquos Planning Processes 3-17
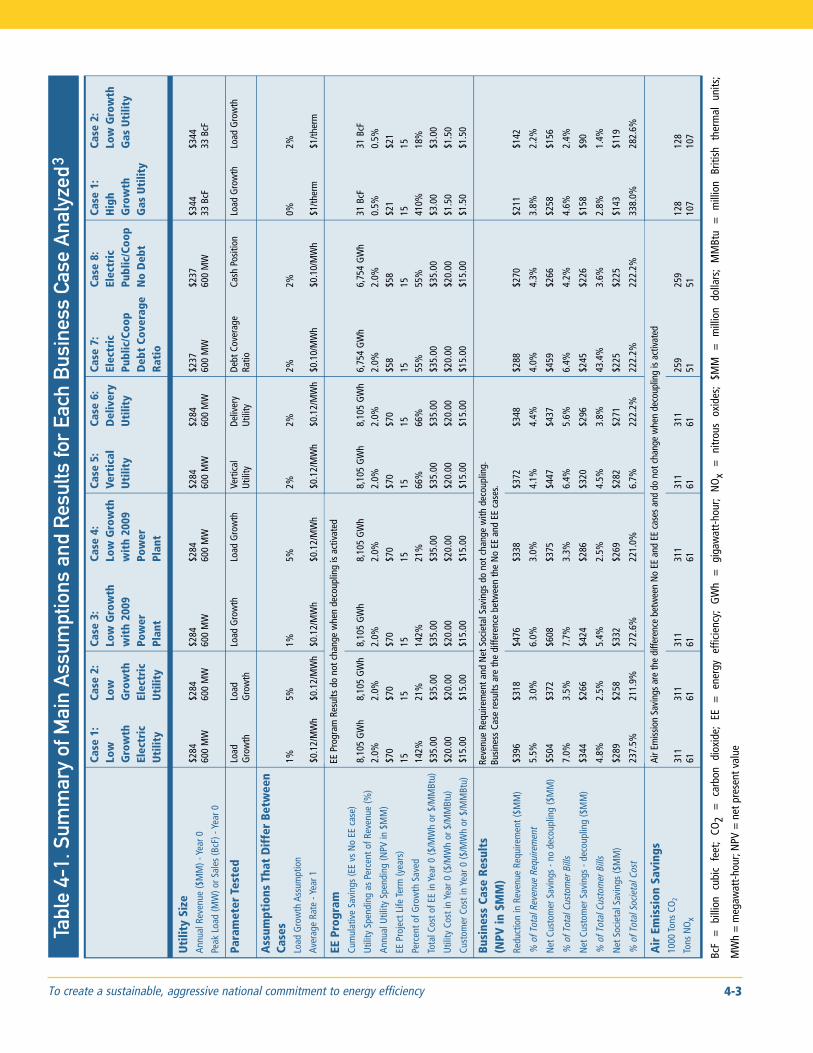
Table 4-1 Summary of Main Assumptions and Results for Each Business Case Analyzed4-3
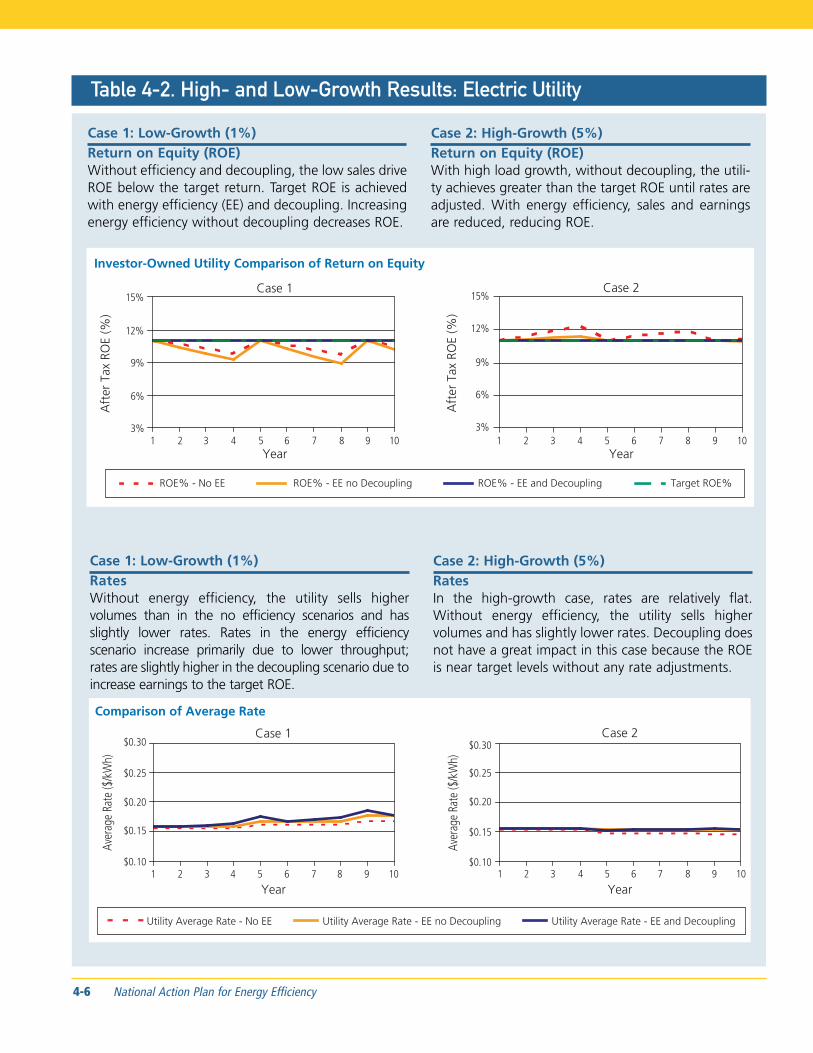
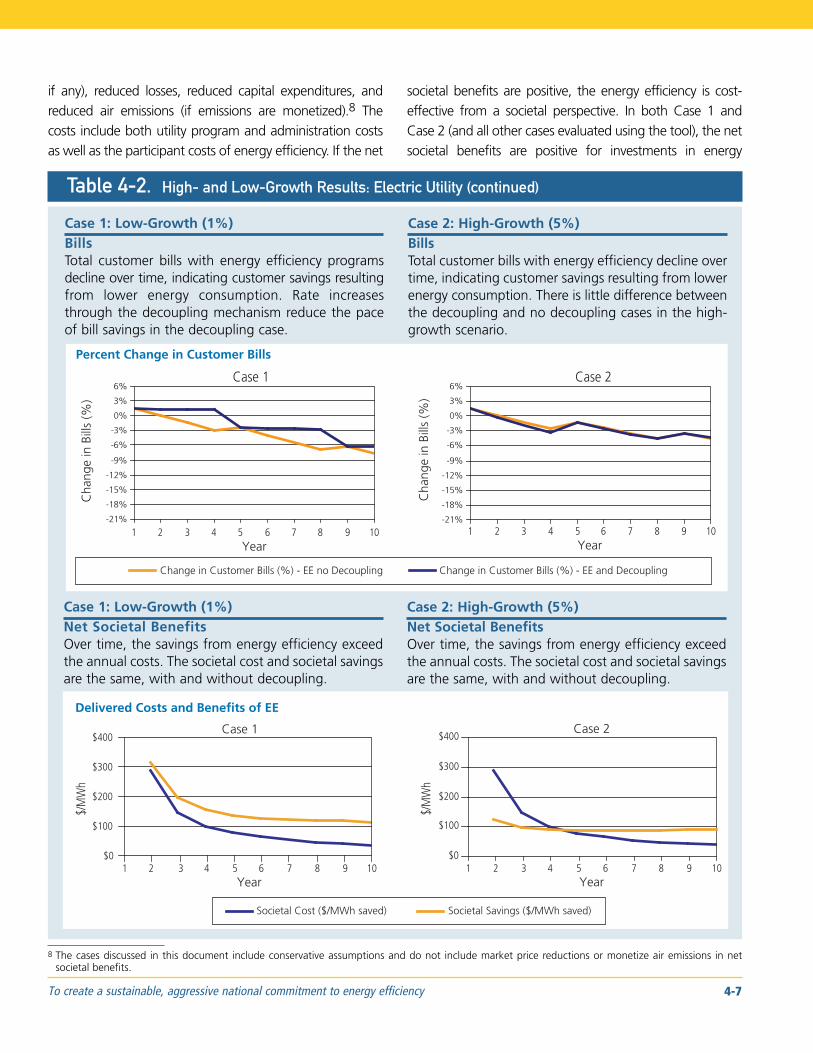
Table 4-2 High- and Low-Growth Results Electric Utility 4-6
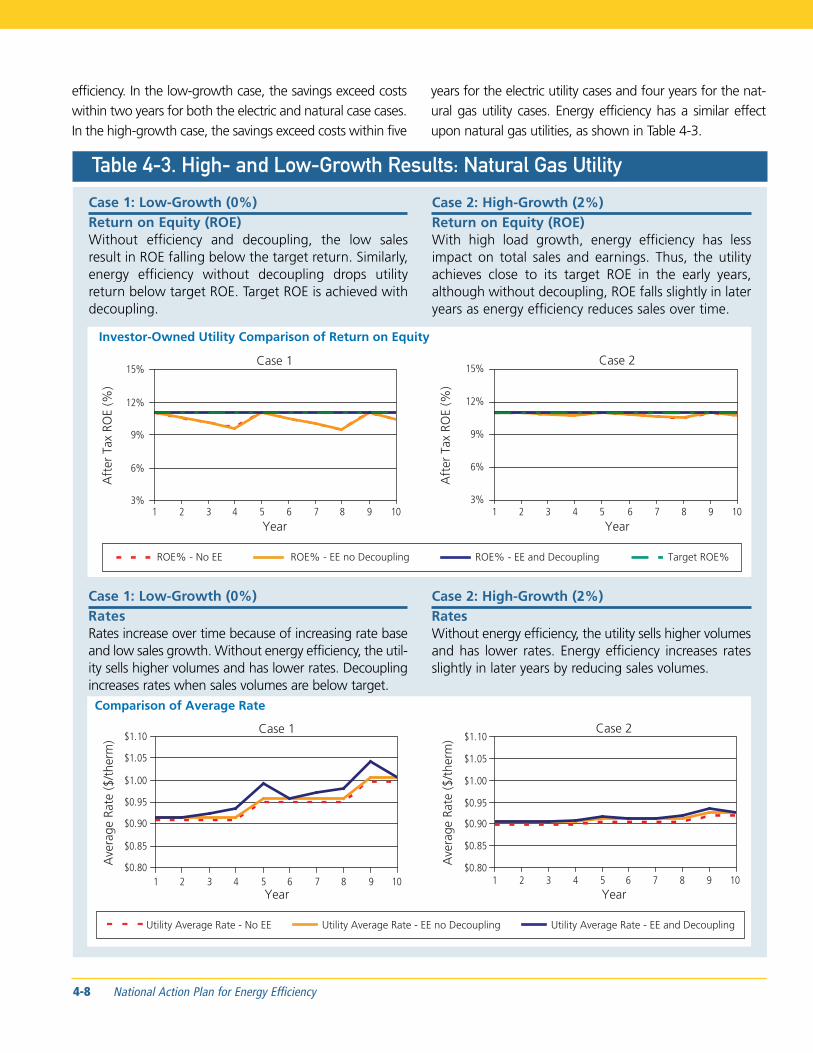
Table 4-3 High- and Low-Growth Results Natural Gas Utility 4-8
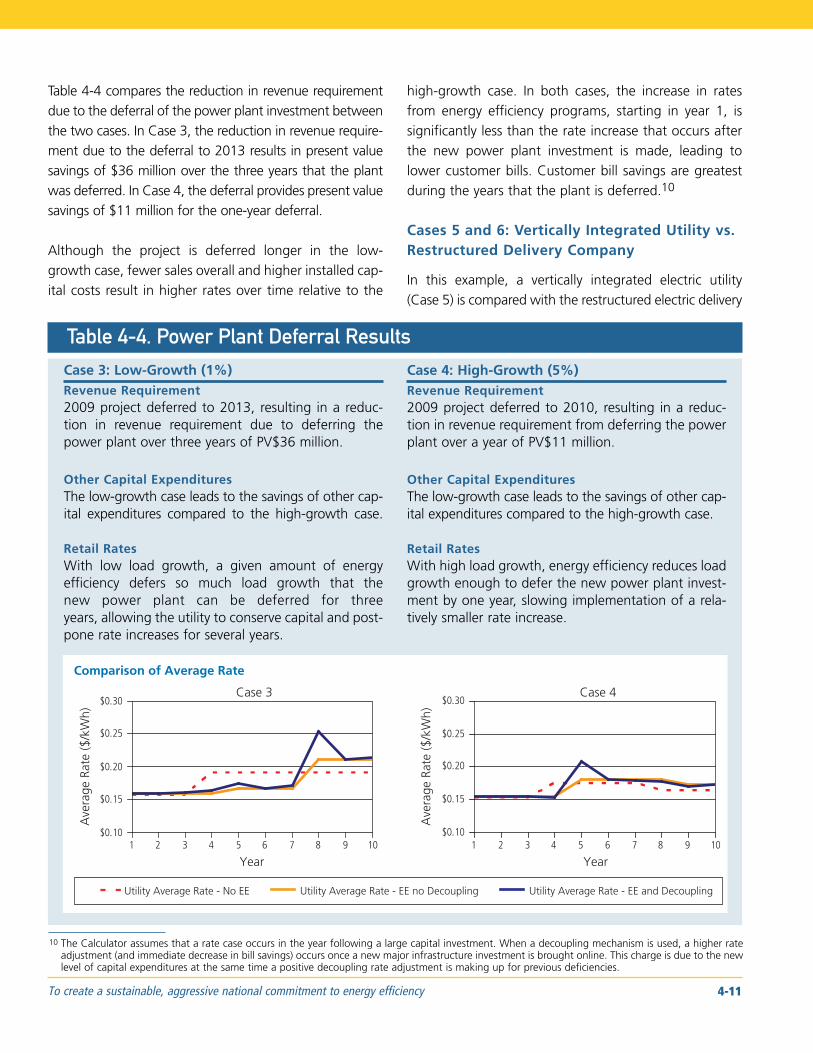
Table 4-4 Power Plant Deferral Results 4-11
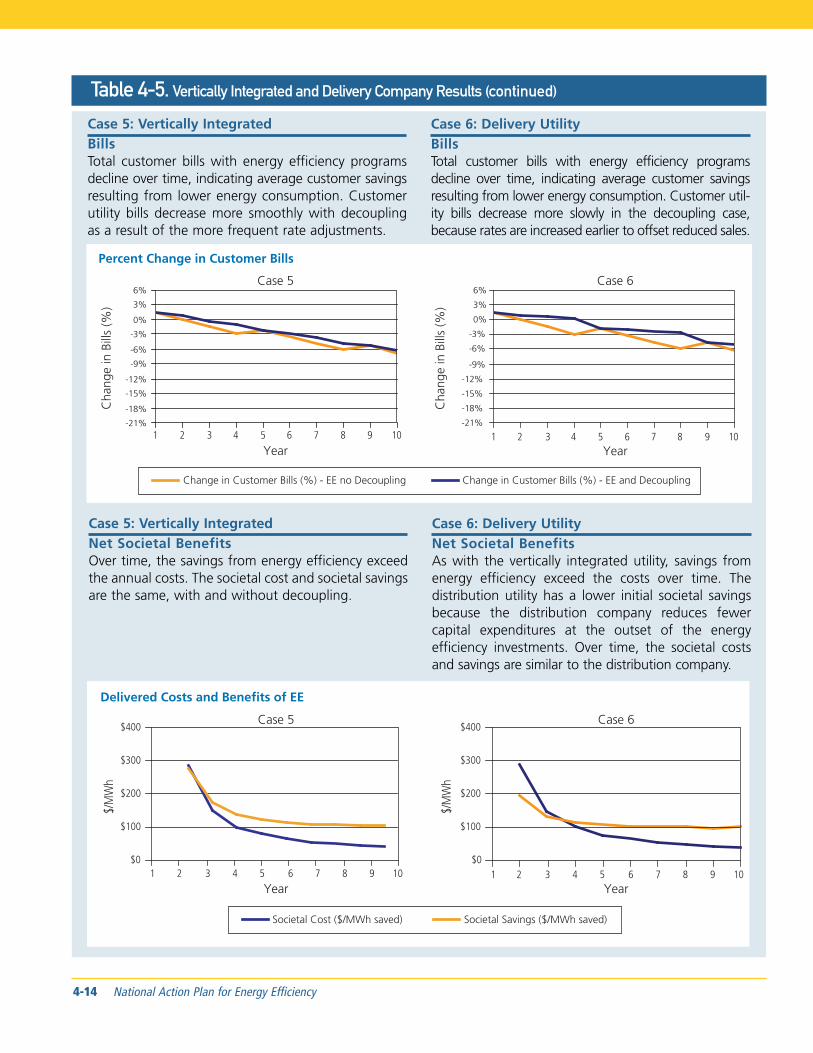
Table 4-5 Vertically Integrated and Delivery Company Results 4-13
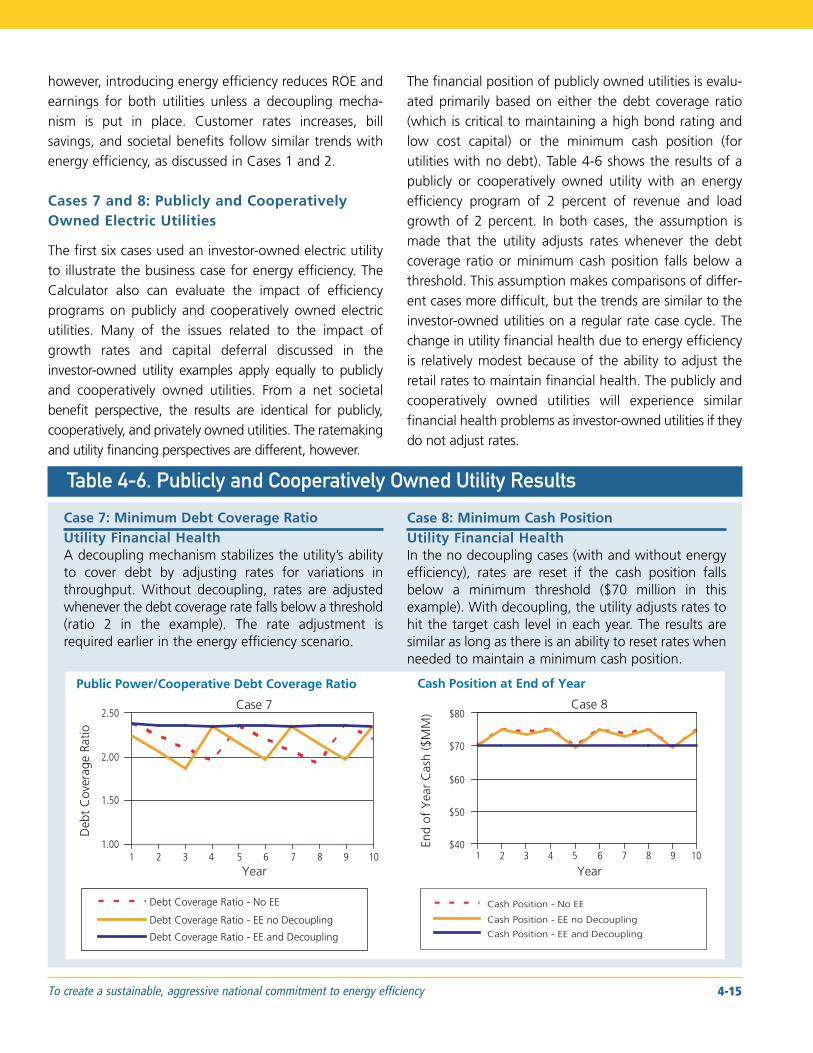
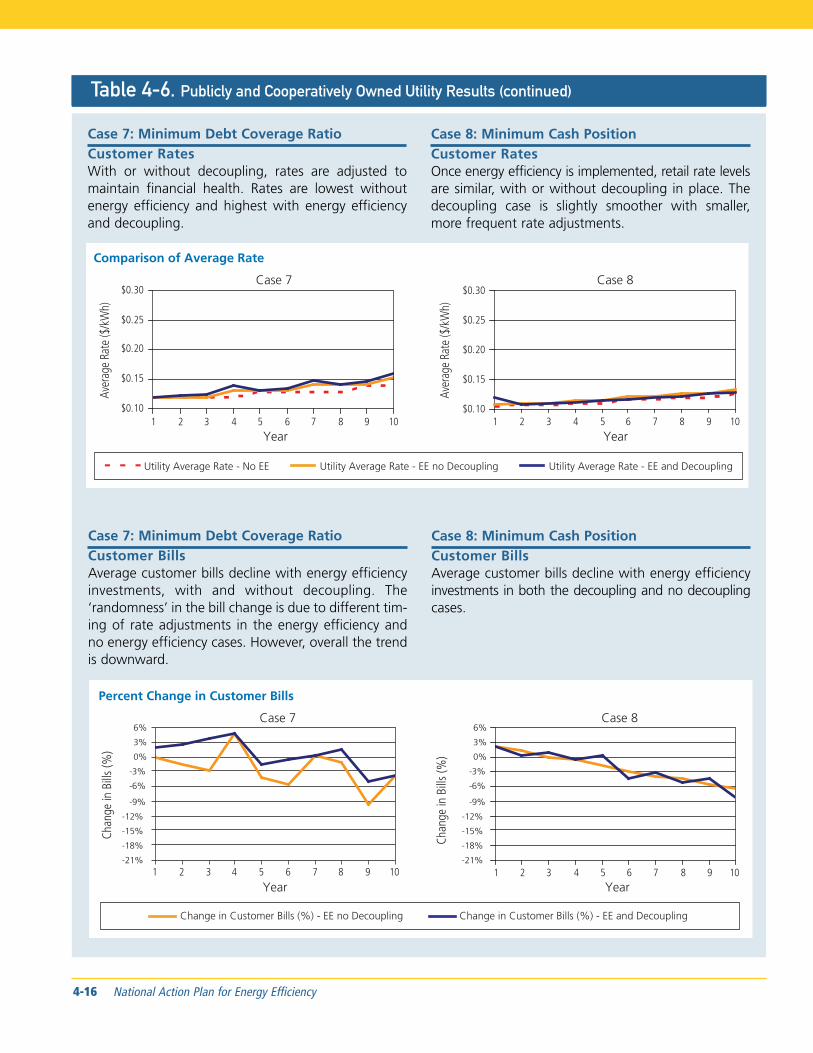
Table 4-6 Publicly- and Cooperatively-Owned Utility Results 4-15
Table 5-1 Partial List of Utilities With Inclining Tier Residential Rates 5-6
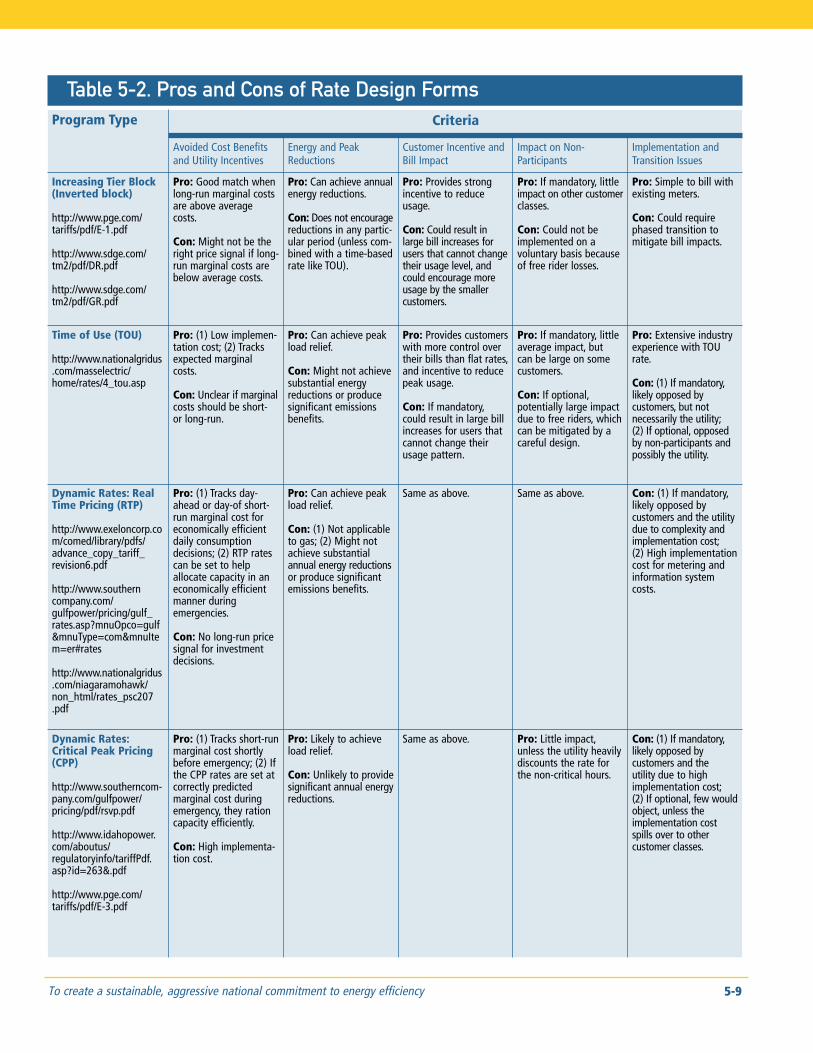
Table 5-2 Pros and Cons of Rate Design Forms 5-9
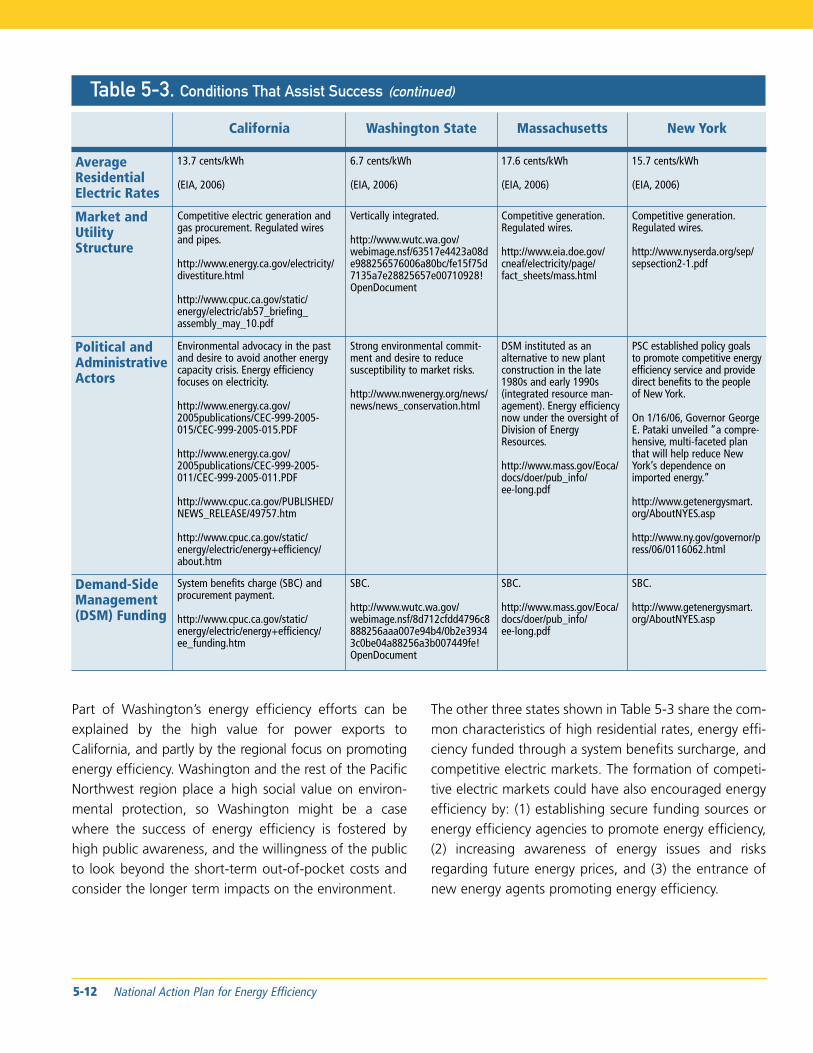
Table 5-3 Conditions That Assist Success 5-11
Table 6-1 Overview of Energy Efficiency Programs 6-4
Table 6-2 Efficiency Measures of Natural Gas Savings Programs 6-6
Table 6-3 Efficiency Measures of Electric and Combination Programs 6-8
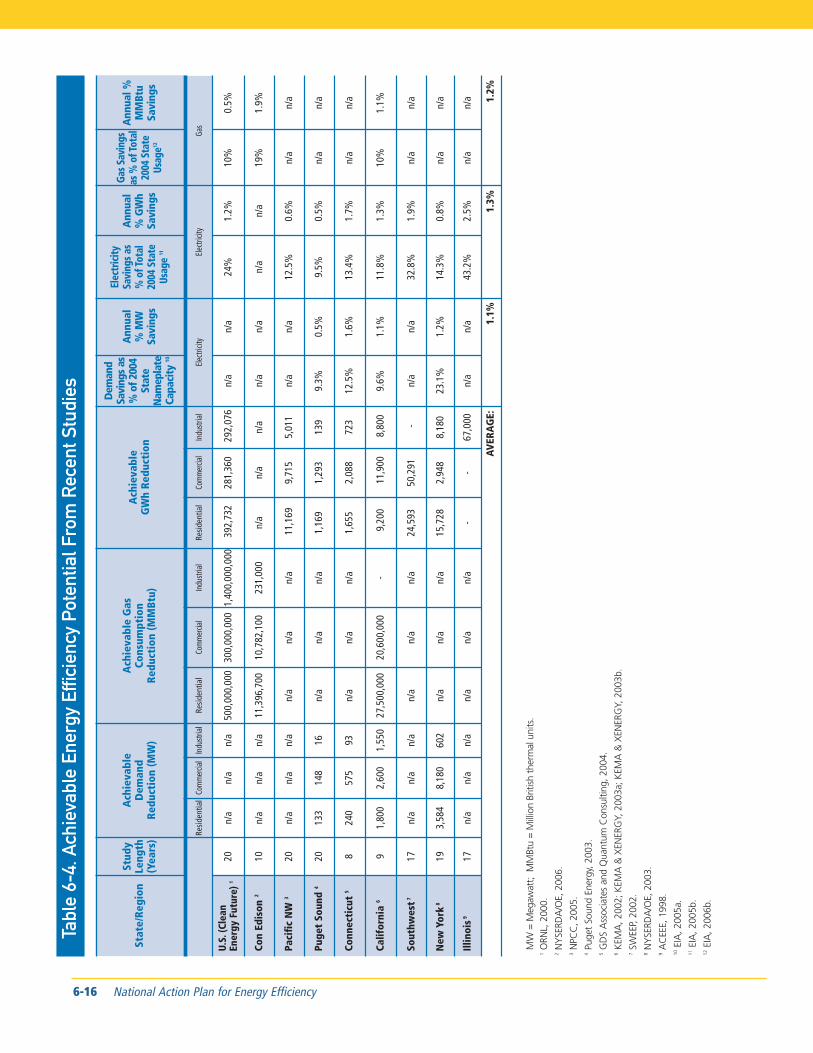
Table 6-4 Achievable Energy Efficiency Potential From Recent Studies 6-16
Table 6-5 NYSERDA 2004 Portfolio 6-20
To create a sustainable aggressive national commitment to energy efficiency iii
List of Tables (continued)
Table 6-6 Nevada Resource Planning Programs 6-21
Table 6-7 Overview of Cost-Effectiveness Tests 6-23
Table 6-8 Research amp Development (RampD) Activities of Select Organizations 6-25
Table 6-9 Emerging Technologies for Programs 6-27
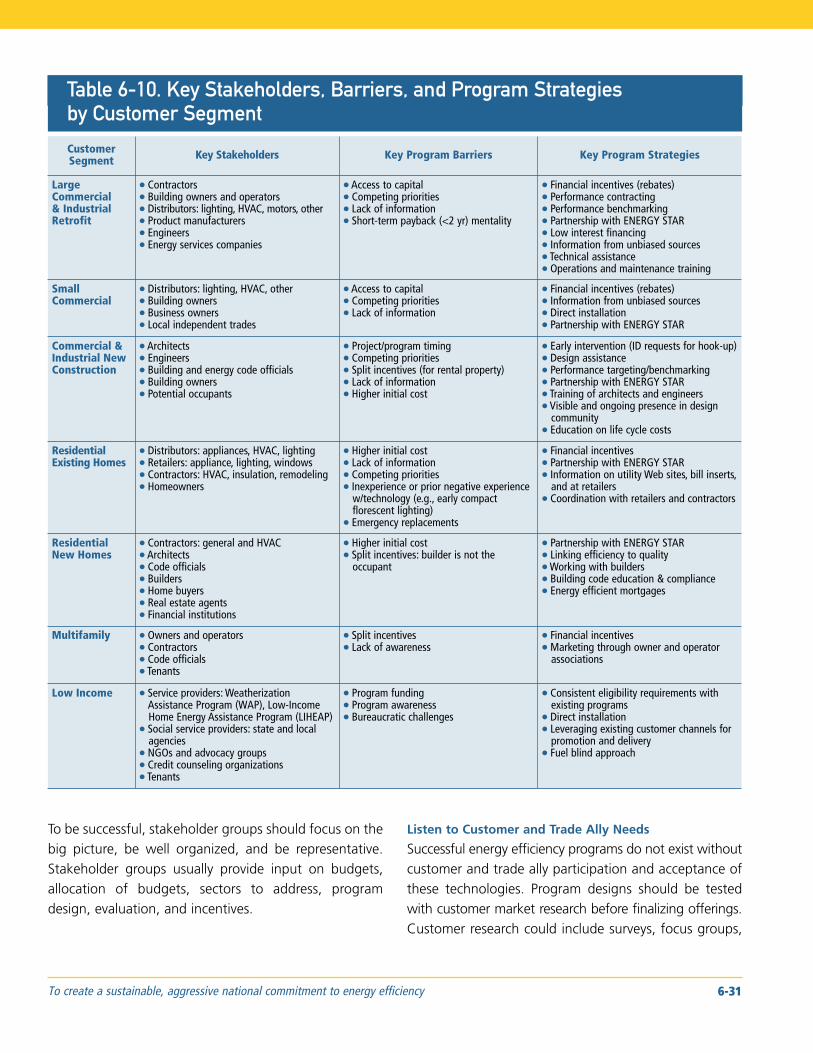
Table 6-10 Key Stakeholders Barriers and Program Strategies by Customer Segment6-31
Table 6-11 Types of Financial Incentives 6-40
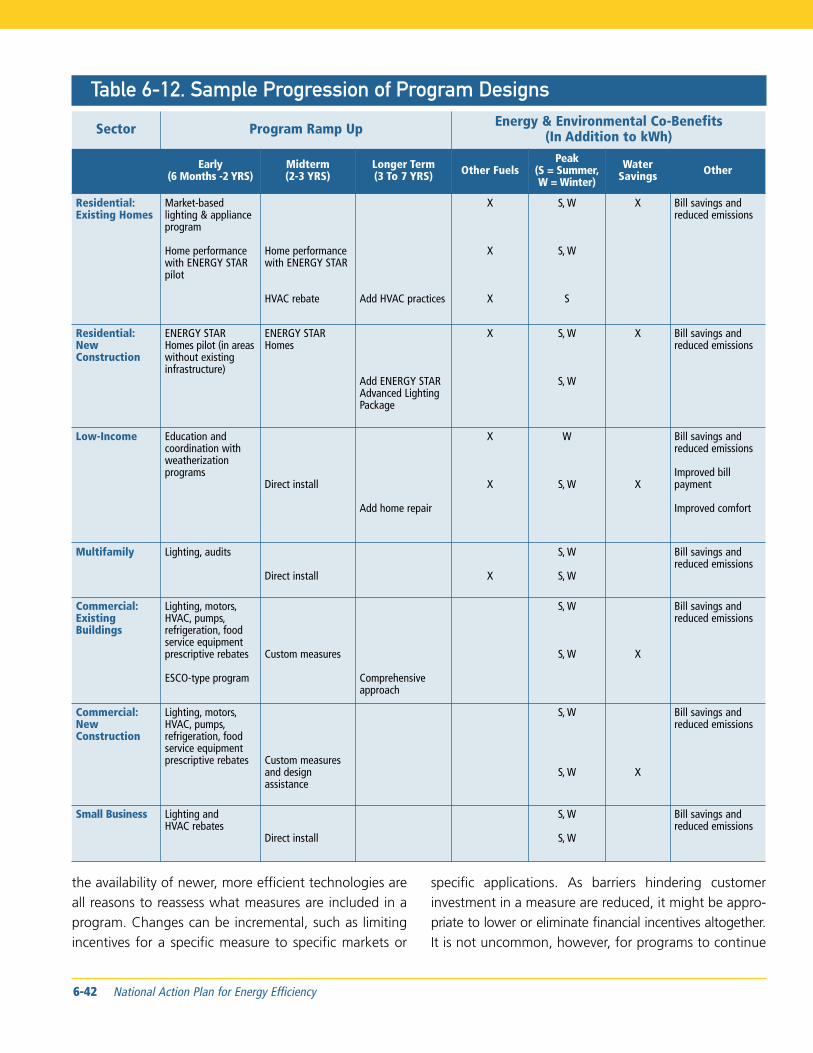
Table 6-12 Sample Progression of Program Designs6-42
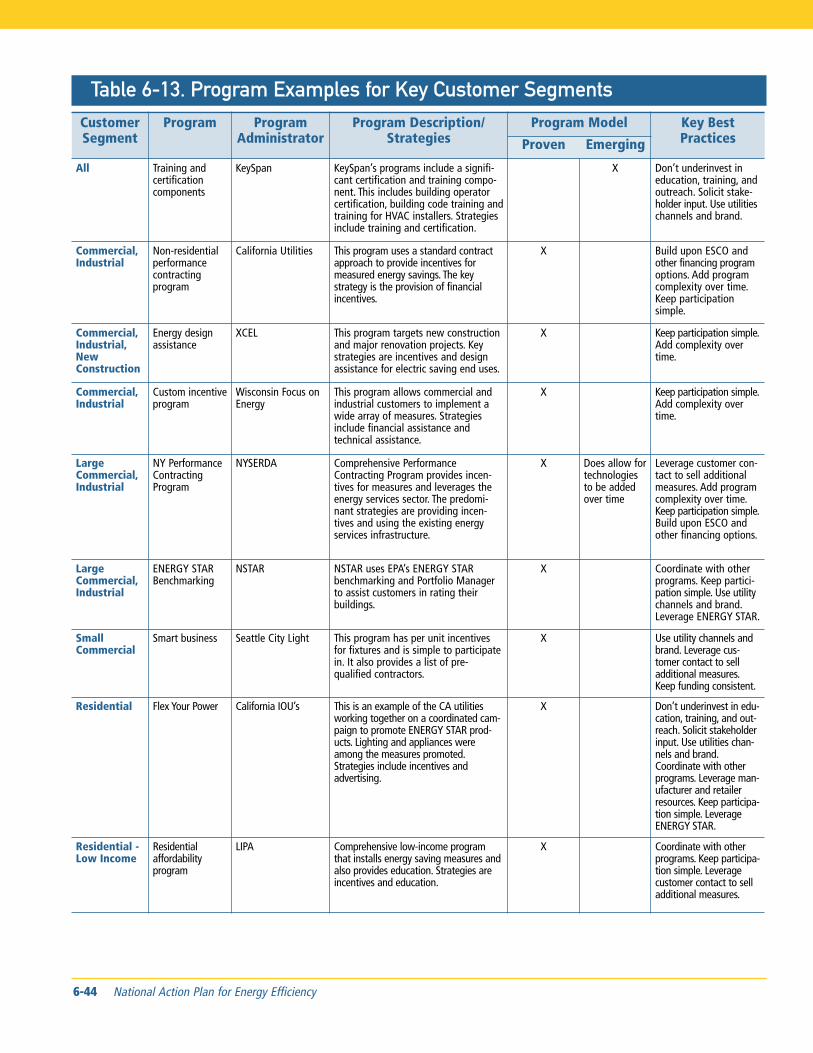
Table 6-13 Program Examples for Key Customer Segments 6-44
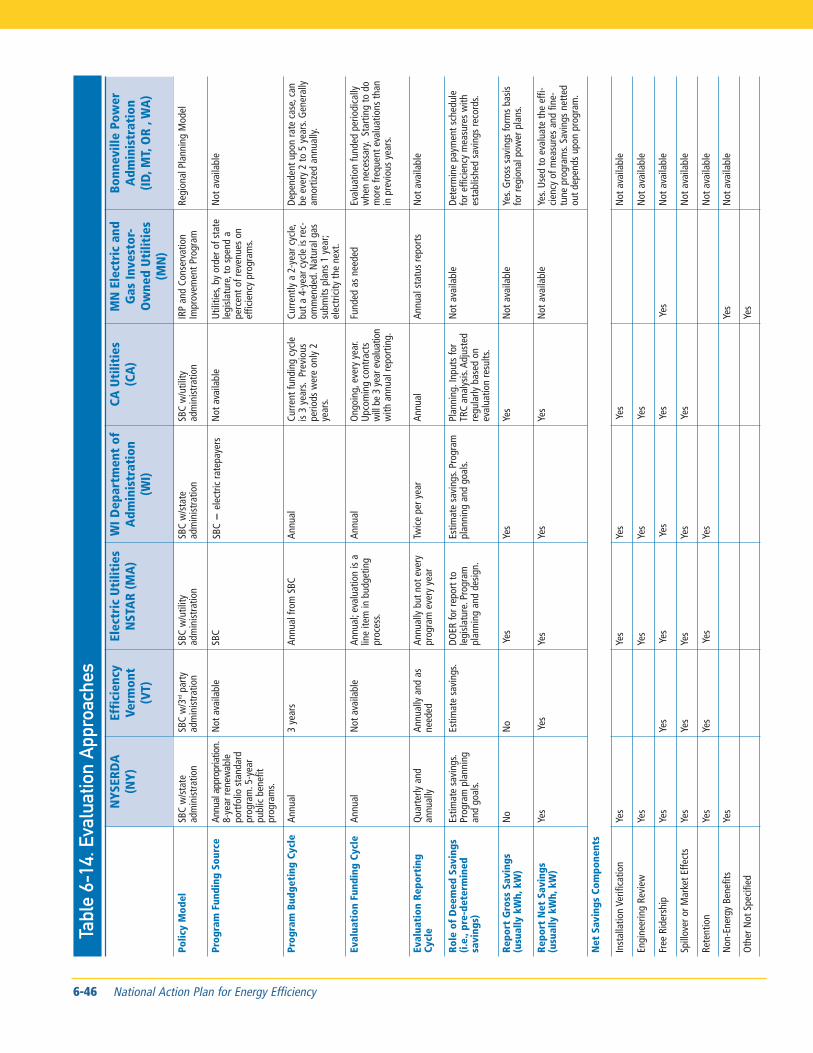
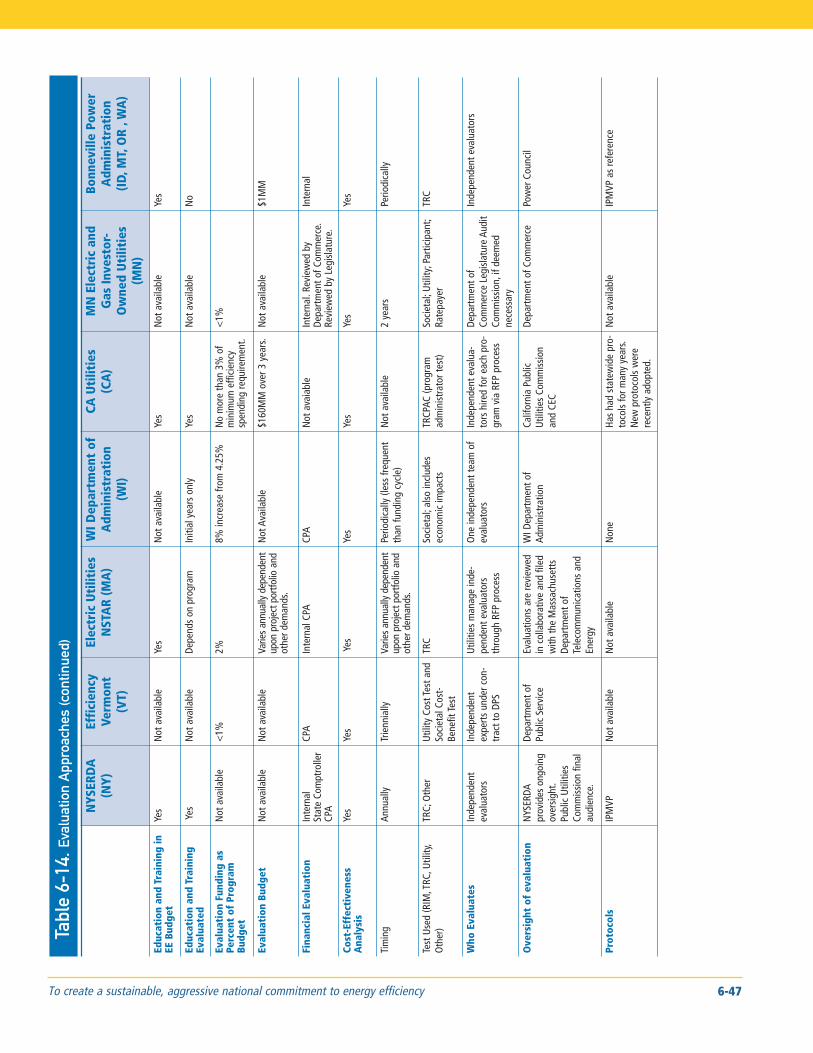
Table 6-14 Evaluation Approaches6-46
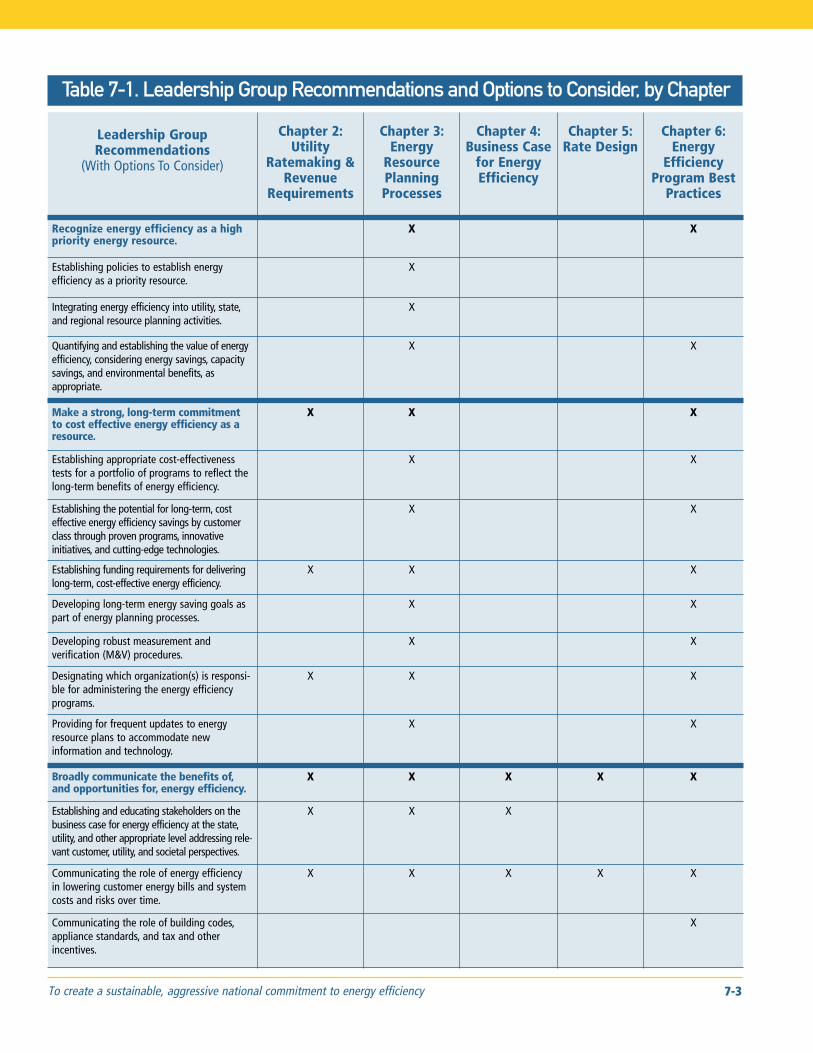
Table 7-1 Leadership Group Recommendations and Options to Consider by Chapter 7-3
iv National Action Plan for Energy Efficiency
List of Acronyms
A
aMW average megawatts
B
Bcf billion cubic feet
BOMA Building Owners amp Managers Association
BPA Bonneville Power Administration
C
CI commercial and industrial
CEC California Energy Commission
CO2 carbon dioxide
CPP critical peak pricing
CPUC California Public Utility Commission
D
DEER Database for Energy Efficiency Resources
DOE US Department of Energy
DSM demand-side management
E
EE energy efficiency
EEPS energy efficiency portfolio standard
EERS energy efficiency resource standard
EPA US Environmental Protection Agency
EPRI Electric Power Research Institute
ESCO energy services company
ETO Energy Trust of Oregon
F
FERC Federal Energy Regulatory Commission
G
GWh gigawatt-hour (1000000 kWh)
H
HERS Home Energy Rating System
HVAC heating ventilation and air conditioning
I
IOU investor-owned utility
IPMVP International Performance Measurement and Verification Protocol
IRP integrated resource plan
ISO independent system operator
ISO-NE ISO New England
K
kWh kilowatt-hour (3412 British thermal units)
L
LIHEAP Low-Income Home Energy Assistance
Program
LIPA Long Island Power Authority
To create a sustainable aggressive national commitment to energy efficiency v
List of Acronyms (continued)
M
MampV measurement and verification
Mcf one thousand cubic feet
MMBtu million British thermal units
MW megawatt (1000000 watts)
MWh megawatt-hour (1000 kWh)
N
NEEP Northeast Energy Efficiency Partnerships
NERC North American Electric Reliability Council
NOX nitrogen oxides
NPV net present value
NSPC Non-Residential Standard Performance Contract
NWPCC Northwest Power and Conservation Council
NYSERDA New York State Energy Research and Development Authority
P
PBL Power Business Line
PGampE Pacific Gas amp Electric
PIER Public Interest Energy Research
PSE Puget Sound Energy
PUCT Public Utility Commission of Texas
PURPA Public Utility Regulatory Policies Act
R
RampD research and development
RARP Residential Appliance Recycling Program
REAP Residential Energy Affordability Partnership Program
RFP request for proposals
RGGI Regional Greenhouse Gas Initiative
RIM rate impact measure
ROE return on equity
RPC revenue per customer
RTO regional transmission organization
RTP real-time pricing
S
SBC system benefits charge
SCE Southern California Edison
SMUD Sacramento Municipal Utility District
SO2 sulfur dioxide
T
TOU time of use
TRC total resource cost
V
VOLL value of lost load
VOS value of service
W
WAP Weatherization Assistance Program
vi National Action Plan for Energy Efficiency
Table of Contents
Acknowledgements i
List of Figuresii
List of Tablesiii
List of Acronyms v
Executive SummaryES-1
Chapter 1 Introduction and Background1-1
Chapter 2 Utility Ratemaking amp Revenue Requirements2-1
Chapter 3 Energy Resource Planning Processes 3-1
Chapter 4 Business Case for Energy Efficiency 4-1
Chapter 5 Rate Design5-1
Chapter 6 Energy Efficiency Program Best Practices 6-1
Chapter 7 Report Summary 7-1
Appendix A Additional Guidance on Removing the Throughput Incentive A-1
Appendix B Business Case DetailsB-1
To create a sustainable aggressive national commitment to energy efficiency vii
Executive Summary
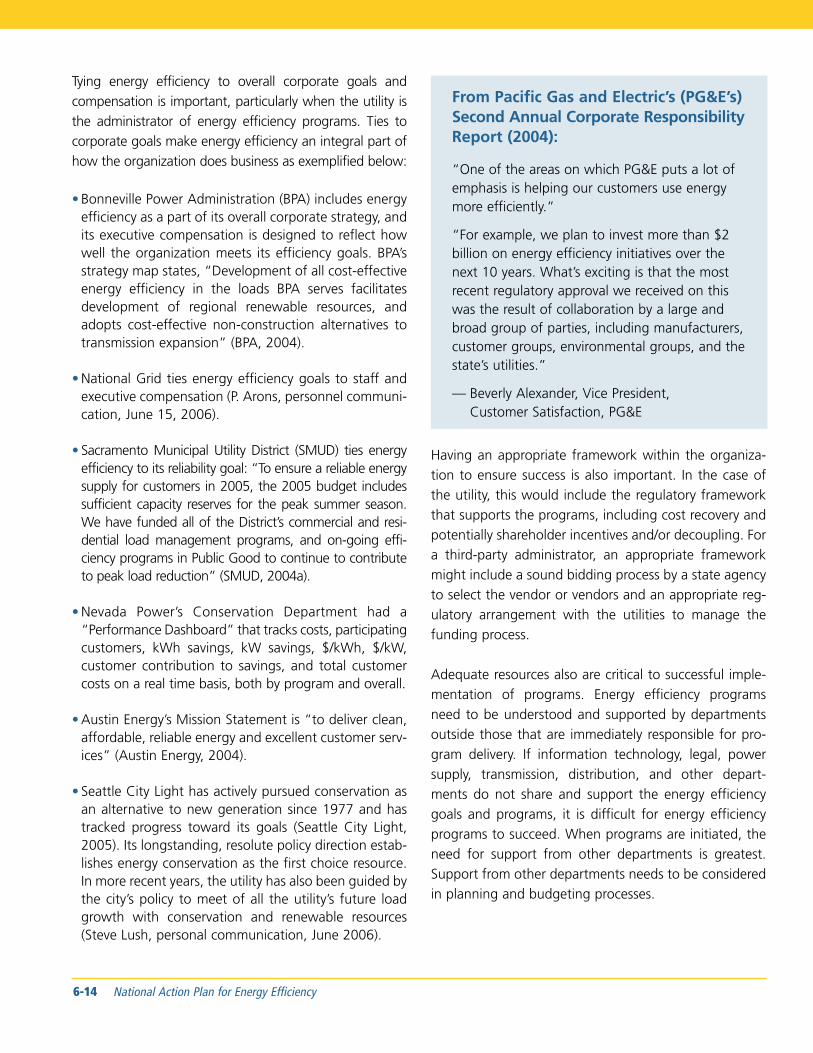
This National Action Plan for Energy Efficiency (Action Plan) presents policy recommendations for creating a sustainable aggressive national commitment to energy efficiency through gas and electric utilities utility regulators and partner organizations Such a commitment could save Americans many billions of dollars on energy bills over the next 10 to 15 years contribute to energy security and improve our environment The Action Plan was developed by more than 50 leading organizations representing key stakeholder perspectives These organizations pledge to take specific actions to make the Action Plan a reality
A National Action Plan
for Energy Efficiency
We currently face a set of serious challenges with regard to the US energy system Energy demand continues to grow despite historically high energy prices and mountshying concerns over energy security and independence as well as air pollution and global climate change The decishysions we make now regarding our energy supply and demand can either help us deal with these challenges more effectively or complicate our ability to secure a more stable economical energy future
Improving the energy efficiency1 of our homes businessshyes schools governments and industriesmdashwhich consume more than 70 percent of the natural gas and electricity used in the countrymdashis one of the most constructive cost-effective ways to address these chalshylenges2 Increased investment in energy efficiency in our homes buildings and industries can lower energy bills reduce demand for fossil fuels help stabilize energy prices enhance electric and natural gas system reliabilishyty and help reduce air pollutants and greenhouse gases
Despite these benefits and the success of energy effishyciency programs in some regions of the country energy efficiency remains critically underutilized in the nationrsquos energy portfolio3 Now we simultaneously face the chalshylenges of high prices the need for large investments in new energy infrastructure environmental concerns and
security issues It is time to take advantage of more than two decades of experience with successful energy effishyciency programs broaden and expand these efforts and capture the savings that energy efficiency offers Much more can be achieved in concert with ongoing efforts to advance building codes and appliance standards provide tax incentives for efficient products and buildings and promote savings opportunities through programs such as ENERGY STARreg Efficiency of new buildings and those already in place are both important Many homeowners businesses and others in buildings and facilities already standing todaymdashwhich will represent the vast majority of the nationrsquos buildings and facilities for years to comemdashcan realize significant savings from proven energy efficiency programs
Bringing more energy efficiency into the nationrsquos energy mix to slow demand growth in a wise cost-effective mannermdashone that balances energy efficiency with new generation and supply optionsmdashwill take concerted efforts by all energy market participants customers utilshyities regulators states consumer advocates energy service companies (ESCOs) and others It will require education on the opportunities review of existing polishycies identification of barriers and their solutions assessshyment of new technologies and modification and adopshytion of policies as appropriate Utilities4 regulators and partner organizations need to improve customer access to energy efficiency programs to help them control their own energy costs provide the funding necessary to
To create a sustainable aggressive national commitment to energy efficiency ES-1
deliver these programs and examine policies governing energy companies to ensure that these policies facilishytatemdashnot impedemdashcost-effective programs for energy efficiency Historically the regulatory structure has rewarded utilities for building infrastructure (eg power plants transmission lines pipelines) and selling energy while discouraging energy efficiency even when the energy-saving measures cost less than constructing new infrastructure5 And it has been difficult to establish the funding necessary to capture the potential benefits that cost-effective energy efficiency offers
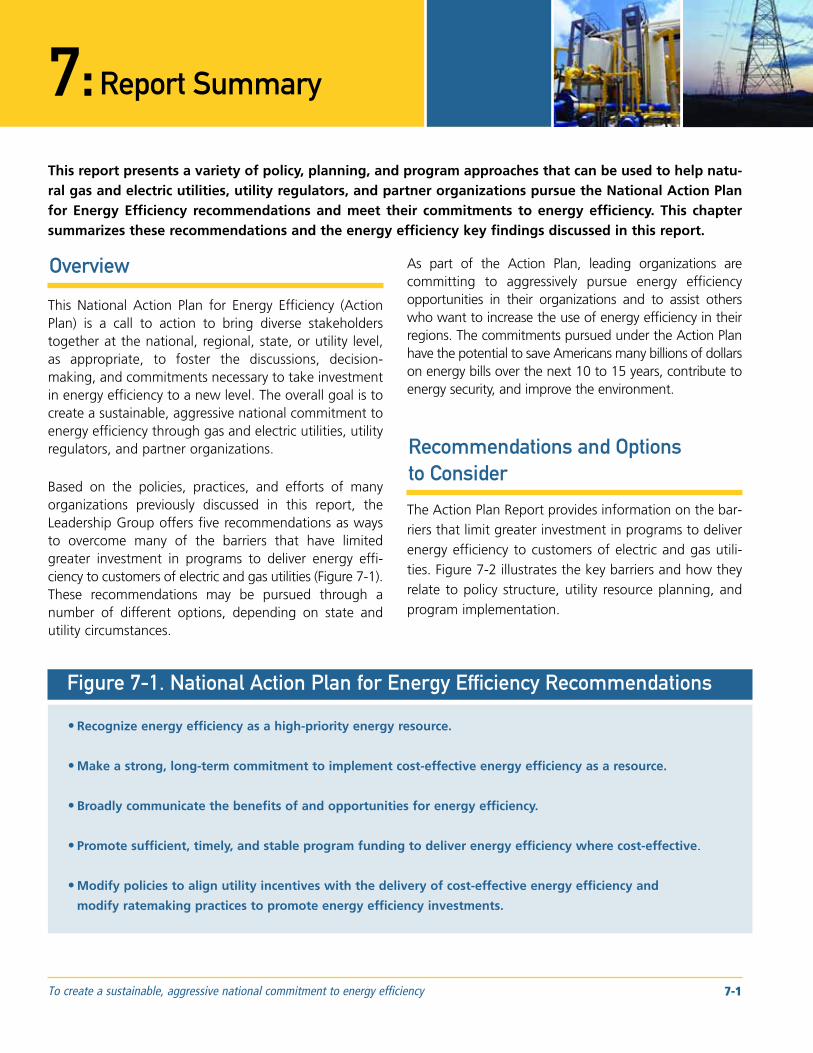
This National Action Plan for Energy Efficiency is a call to action to bring diverse stakeholders together at the national regional state or utility level as appropriate and foster the discussions decision-making and commitshyments necessary to take investment in energy efficiency to a new level The overall goal is to create a sustainable aggressive national commitment to energy efficiency through gas and electric utilities utility regulators and partner organizations
The Action Plan was developed by a Leadership Group composed of more than 50 leading organizations represhysenting diverse stakeholder perspectives Based upon the policies practices and efforts of many organizations across the country the Leadership Group offers five
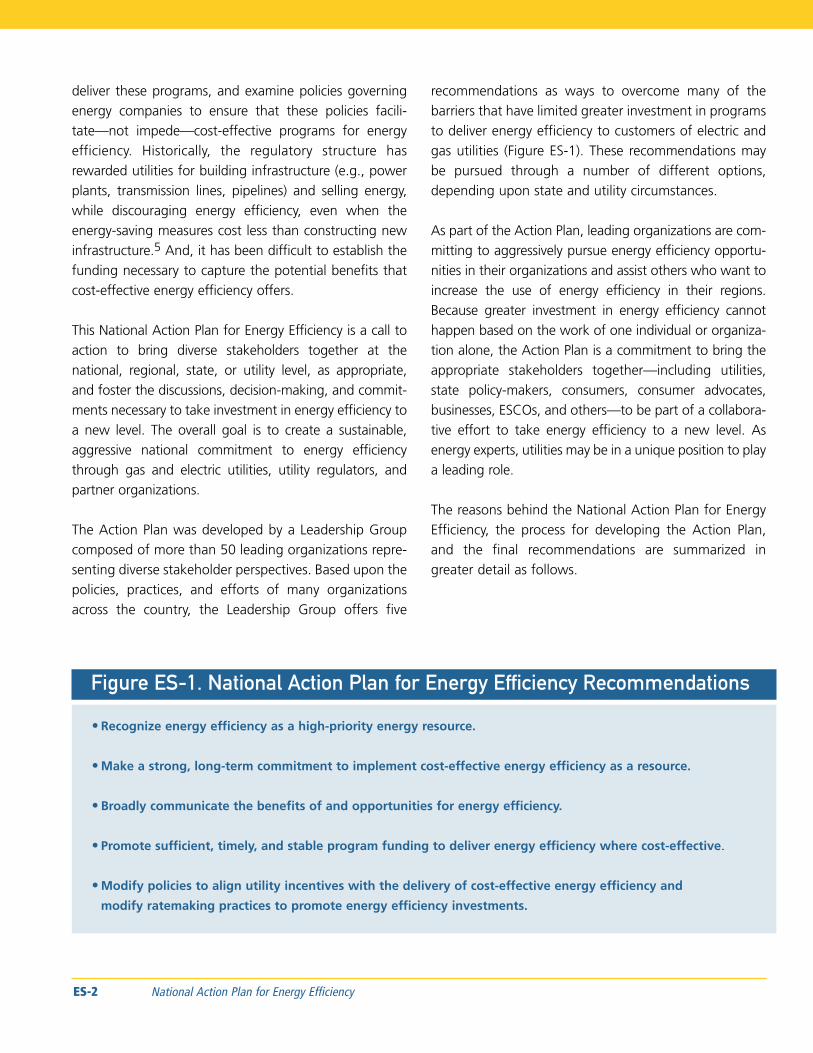
recommendations as ways to overcome many of the barriers that have limited greater investment in programs to deliver energy efficiency to customers of electric and gas utilities (Figure ES-1) These recommendations may be pursued through a number of different options depending upon state and utility circumstances
As part of the Action Plan leading organizations are comshymitting to aggressively pursue energy efficiency opportushynities in their organizations and assist others who want to increase the use of energy efficiency in their regions Because greater investment in energy efficiency cannot happen based on the work of one individual or organizashytion alone the Action Plan is a commitment to bring the appropriate stakeholders togethermdashincluding utilities state policy-makers consumers consumer advocates businesses ESCOs and othersmdashto be part of a collaborashytive effort to take energy efficiency to a new level As energy experts utilities may be in a unique position to play a leading role
The reasons behind the National Action Plan for Energy Efficiency the process for developing the Action Plan and the final recommendations are summarized in greater detail as follows
Figure ES-1 National Action Plan for Energy Efficiency Recommendations
bull Recognize energy efficiency as a high-priority energy resource
bull Make a strong long-term commitment to implement cost-effective energy efficiency as a resource
bull Broadly communicate the benefits of and opportunities for energy efficiency
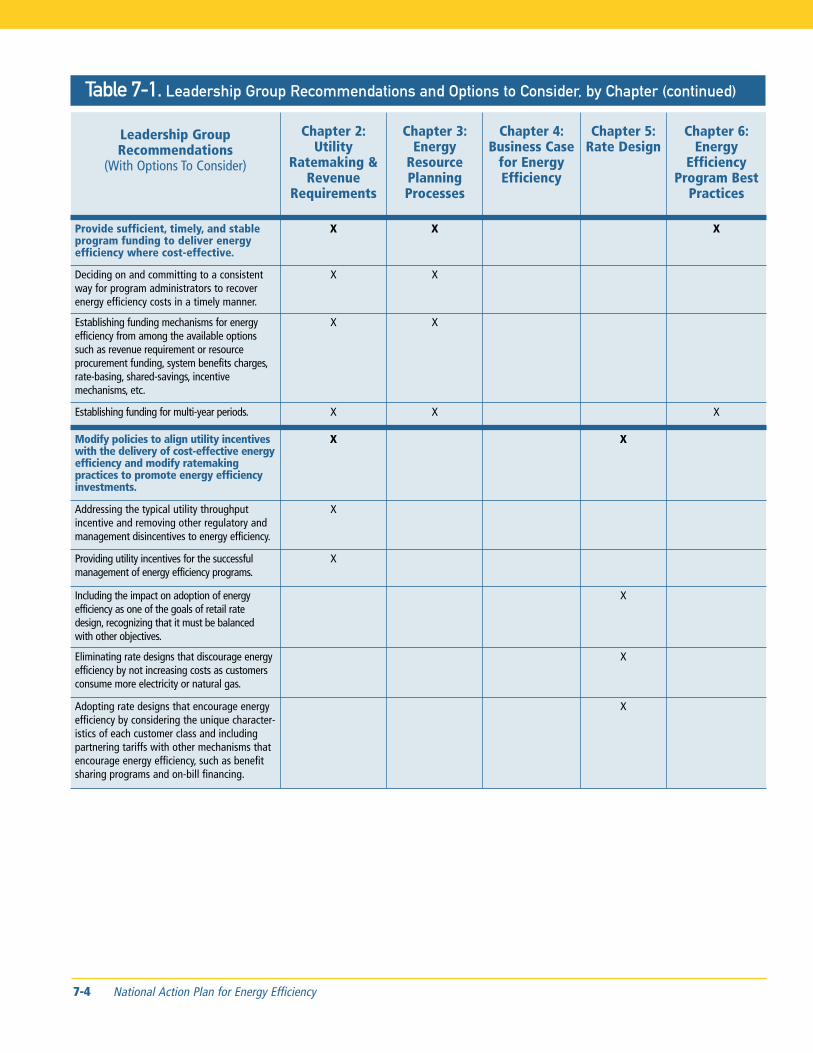
bull Promote sufficient timely and stable program funding to deliver energy efficiency where cost-effective
bull Modify policies to align utility incentives with the delivery of cost-effective energy efficiency and
modify ratemaking practices to promote energy efficiency investments
ES-2 National Action Plan for Energy Efficiency
The United States Faces Large and
Complex Energy Challenges
Our expanding economy growing population and rising standard of living all depend on energy services Current projections anticipate US energy demands to increase by more than one-third by 2030 with electricity demand alone rising by more than 40 percent (EIA 2006) At work and at home we continue to rely on more and more energy-consuming devices At the same time the country has entered a period of higher energy costs and limited supplies of natural gas heating oil and other fuels These issues present many challenges
Growing energy demand stresses current systems
drives up energy costs and requires new investments
Events such as the Northeast electricity blackout of August 2003 and Hurricanes Katrina and Rita in 2005 increased focus on energy reliability and its economic and human impacts Transmission and pipeline systems are becoming overburdened in places Overburdened systems limit the availability of low-cost electricity and fossil fuels raise energy prices in or near congested areas and potentially compromise energy system reliashybility High fuel prices also contribute to higher electricishyty prices In addition our demand for natural gas to heat our homes for industrial and business use and for power generation is straining the available gas supply in North America and putting upward pressure on natural gas prices Addressing these issues will require billions of dollars in investments in energy efficiency new power plants gas rigs transmission lines pipelines and other infrastructure notwithstanding the difficulty of building new energy infrastructure in dense urban and suburban areas In the absence of investments in new or expandshyed capacity existing facilities are being stretched to the point where system reliability is steadily eroding and the ability to import lower cost energy into high-growth load areas is inhibited potentially limiting economic expansion
High fuel prices increase financial burdens on houseshy
holds and businesses and slow our economy Many household budgets are being strained by higher energy
costs leaving less money available for other household purchases and needs This burden is particularly harmful for low-income households Higher energy bills for industry can reduce the nationrsquos economic competitiveshyness and place US jobs at risk
Growing energy demand challenges attainment of
clean air and other public health and environmental
goals Energy demand continues to grow at the same time that national and state regulations are being impleshymented to limit the emission of air pollutants such as sulshyfur dioxide (SO2) nitrogen oxides (NOx) and mercury to protect public health and the environment In addition emissions of greenhouse gases continue to increase
Uncertainties in future prices and regulations raise
questions about new investments New infrastructure is being planned in the face of uncertainties about future energy prices For example high natural gas prices and uncertainty about greenhouse gas and other environshymental regulations impede investment decisions on new energy supply options
Our energy system is vulnerable to disruptions in
energy supply and delivery Natural disasters such as the hurricanes of 2005 exposed the vulnerability of the US energy system to major disruptions which have sigshynificant impacts on energy prices and service reliability In response national security concerns suggest that we should use fossil fuel energy more efficiently increase supply diversity and decrease the vulnerability of domesshytic infrastructure to natural disasters
Energy Efficiency Can Be a Beneficial
Resource in Our Energy Systems
Greater investment in energy efficiency can help us tackshyle these challenges Energy efficiency is already a key component in the nationrsquos energy resource mix in many parts of the country Utilities states and others across the United States have decades of experience in delivershying energy efficiency to their customers These programs can provide valuable models upon which more states
To create a sustainable aggressive national commitment to energy efficiency ES-3
Benefits of Energy Efficiency
Lower energy bills greater customer control and
greater customer satisfaction Well-designed energy efficiency programs can provide opportunities for cusshytomers of all types to adopt energy savings measures that can improve their comfort and level of service while reducing their energy bills6 These programs can help customers make sound energy use decisions increase control over their energy bills and empower them to manage their energy usage Customers are experiencing savings of 5 10 20 or 30 percent depending upon the customer program and average bill Offering these programs can also lead to greater customer satisfaction with the service provider
Lower cost than supplying new generation only
from new power plants In some states well-designed energy efficiency programs are saving enershygy at an average cost of about one-half of the typical cost of new power sources and about one-third of the cost of natural gas supply (EIA 2006)7 When inteshygrated into a long-term energy resource plan energy efficiency programs could help defer investments in new plants and lower the total cost of delivering electricity
Modular and quick to deploy Energy efficiency proshygrams can be ramped up over a period of one to three years to deliver sizable savings These programs can also be targeted to congested areas with high prices to bring relief where it might be difficult to deliver new supply in the near term
Significant energy savings Well-designed energy efficiency programs are delivering annual energy savshyings on the order of 1 percent of electricity and natushyral gas sales8 These programs are helping to offset 20 to 50 percent of expected growth in energy demand in some areas without compromising the end usersrsquo activities and economic well-being (Nadel et al 2004 EIA 2006)
Environmental benefits While reducing customersrsquo energy bills cost-effective energy efficiency offers environmental benefits related to reduced demand such as lower air pollution reduced greenhouse gas emissions lower water use and less environmental damage from fossil fuel extraction Energy efficiency can be an attractive option for utilities in advance of requirements to reduce greenhouse gas emissions
Economic development Greater investment in enershygy efficiency helps build jobs and improve state economies Energy efficiency users often redirect their bill savings toward other activities that increase local and national employment with a higher employment impact than if the money had been spent to purchase energy (Kushler et al 2005 NYSERDA 2004) Many energy efficiency programs create construction and installation jobs with multiplier impacts on employshyment and local economies Local investments in enershygy efficiency can offset imports from out-of-state improving the state balance of trade Lastly energy efficiency investments usually create long-lasting infrastructure changes to building equipment and appliance stocks creating long-term property improvements that deliver long-term economic value (Innovest 2002)
Energy security Energy efficiency reduces the level of US per capita energy consumption thus decreasing the vulnerability of the economy and individual conshysumers to energy price disruptions from natural disasshyters and attacks on domestic and international energy supplies and infrastructure In addition energy effishyciency can be used to reduce the overall system peak demand or the peak demand in targeted load areas with limited generating or transport capability Reducing peak demand improves system reliability and reduces the potential for unplanned brownshyouts or black-outs which can have large adverse economic consequences
ES-4 National Action Plan for Energy Efficiency
utilities and other organizations can build Experience shows that energy efficiency programs can lower customer energy bills cost less than and help defer new energy infrastructure provide energy savings to consumers improve the environment and spur local economic development (see box on Benefits of Energy Efficiency) Significant opportunities for energy efficiency are likely to continue to be available at low costs in the future State and regional studies have found that adoption of economically attractive but as yet untapped energy efficiency could yield more than 20 percent savings in total electricity demand nationwide by 2025 Depending on the underlying load growth these savings could help cut load growth by half or more comshypared to current forecasts (Nadel et al 2004 SWEEP 2002 NEEP 2005 NWPCC 2005 WGA 2006) Similarly savings from direct use of natural gas could provide a 50 percent or greater reduction in natural gas demand growth (Nadel et al 2004)
Capturing this energy efficiency resource would offer substantial economic and environmental benefits across the country Widespread application of energy efficiency programs that already exist in some regions could delivshyer a large part of these potential savings9 Extrapolating the results from existing programs to the entire country would yield annual energy bill savings of nearly $20 bilshylion with net societal benefits of more than $250 billion over the next 10 to 15 years This scenario could defer the need for 20000 megawatts (MW) or 40 new 500shyMW power plants as well as reduce US emissions from energy production and use by more than 200 million tons of carbon dioxide (CO2) 50000 tons of SO2 and 40000 tons of NOx annually10 These significant ecoshynomic and environmental benefits can be achieved relashytively quickly because energy efficiency programs can be developed and implemented within several years
Additional policies and programs are required to help capture these potential benefits and address our subshystantial underinvestment in energy efficiency as a nation An important indicator of this underinvestment is that the level of funding across the country for organized effishy
ciency programs is currently less than $2 billion per year while it would require about 4 times todayrsquos funding levshyels to achieve the economic and environment benefits presented above11 12
The current underinvestment in energy efficiency is due to a number of well-recognized barriers including some of the regulatory policies that govern electric and natushyral gas utilities These barriers include
bull Market barriers such as the well-known ldquosplitshyincentiverdquo barrier which limits home buildersrsquo and commercial developersrsquo motivation to invest in energy efficiency for new buildings because they do not pay the energy bill and the transaction cost barrier which chronically affects individual consumer and small business decision-making
bull Customer barriers such as lack of information on energy saving opportunities lack of awareness of how energy efficiency programs make investments easier and lack of funding to invest in energy efficiency
bull Public policy barriers which can present prohibitive disincentives for utility support and investment in energy efficiency in many cases
bull Utility state and regional planning barriers which do not allow energy efficiency to compete with supply-side resources in energy planning
bull Energy efficiency program barriers which limit investment due to lack of knowledge about the most effective and cost-effective energy efficiency program portfolios programs for overcoming common marketplace barriers to energy efficiency or available technologies
While a number of energy efficiency policies and programs contribute to addressing these barriers such as building codes appliance standards and state government leadshyership programs organized energy efficiency programs
To create a sustainable aggressive national commitment to energy efficiency ES-5
provide an important opportunity to deliver greater energy efficiency in the homes buildings and facilities that already exist today and that will consume the majorshyity of the energy used in these sectors for years to come
The Leadership Group and National
Action Plan for Energy Efficiency
Recognizing that energy efficiency remains a critically underutilized resource in the nationrsquos energy portfolio more than 50 leading electric and gas utilities state utilshyity commissioners state air and energy agencies energy service providers energy consumers and energy effishyciency and consumer advocates have formed a Leadership Group together with the US Department of Energy (DOE) and the US Environmental Protection Agency (EPA) to address the issue The goal of this group is to create a sustainable aggressive national comshymitment to energy efficiency through gas and electric utilities utility regulators and partner organizations The Leadership Group recognizes that utilities and regulators play critical roles in bringing energy efficiency programs to their communities and that success requires the joint efforts of customers utilities regulators states and other partner organizations
Under co-chairs Diane Munns (Member of the Iowa Utilities Board and President of the National Association of Regulatory Utility Commissioners) and Jim Rogers (President and Chief Executive Officer of Duke Energy) the Leadership Group members (see Table ES-1) have developed the National Action Plan for Energy Efficiency Report which
bull Identifies key barriers limiting greater investment in energy efficiency
bull Reviews sound business practices for removing these barriers and improving the acceptance and use of energy efficiency relative to energy supply options
bull Outlines recommendations and options for overcoming these barriers
The members of the Leadership Group have agreed to pursue these recommendations and consider these options through their own actions where appropriate and to support energy efficiency initiatives by other industry members and stakeholders
Recommendations
The National Action Plan for Energy Efficiency is a call to action to utilities state utility regulators consumer advoshycates consumers businesses other state officials and other stakeholders to create an aggressive sustainable national commitment to energy efficiency1 The Action Plan offers the following recommendations as ways to overcome barriers that have limited greater investment in energy efficiency for customers of electric and gas utilshyities in many parts of the country The following recomshymendations are based on the policies practices and efforts of leading organizations across the country For each recommendation a number of options are availshyable to be pursued based on regional state and utility circumstances (see also Figure ES-2)
Recognize energy efficiency as a high-priority energy
resource Energy efficiency has not been consistently viewed as a meaningful or dependable resource comshypared to new supply options regardless of its demonshystrated contributions to meeting load growth13
Recognizing energy efficiency as a high-priority energy resource is an important step in efforts to capture the benefits it offers and lower the overall cost of energy services to customers Based on jurisdictional objectives energy efficiency can be incorporated into resource plans to account for the long-term benefits from energy savshyings capacity savings potential reductions of air pollushytants and greenhouse gases as well as other benefits The explicit integration of energy efficiency resources into the formalized resource planning processes that exist at regional state and utility levels can help estabshylish the rationale for energy efficiency funding levels and for properly valuing and balancing the benefits In some jurisdictions these existing planning processes might need to be adapted or even created to meaningfully
ES-6 National Action Plan for Energy Efficiency
incorporate energy efficiency resources into resource planning Some states have recognized energy efficiency as the resource of first priority due to its broad benefits
Make a strong long-term commitment to implement
cost-effective energy efficiency as a resource Energy efficiency programs are most successful and provide the greatest benefits to stakeholders when appropriate polishycies are established and maintained over the long-term Confidence in long-term stability of the program will help maintain energy efficiency as a dependable resource compared to supply-side resources deferring or even avoiding the need for other infrastructure investshyments and maintain customer awareness and support Some steps might include assessing the long-term potential for cost-effective energy efficiency within a region (ie the energy efficiency that can be delivered cost-effectively through proven programs for each cusshytomer class within a planning horizon) examining the role for cutting-edge initiatives and technologies estabshylishing the cost of supply-side options versus energy effishyciency establishing robust measurement and verification (MampV) procedures and providing for routine updates to information on energy efficiency potential and key costs
Broadly communicate the benefits of and opportunishy
ties for energy efficiency Experience shows that enershygy efficiency programs help customers save money and contribute to lower cost energy systems But these benshyefits are not fully documented nor recognized by cusshytomers utilities regulators or policy-makers More effort is needed to establish the business case for enershygy efficiency for all decision-makers and to show how a well-designed approach to energy efficiency can benefit customers utilities and society by (1) reducing cusshytomersrsquo bills over time (2) fostering financially healthy utilities (eg return on equity earnings per share and debt coverage ratios unaffected) and (3) contributing to positive societal net benefits overall Effort is also necesshysary to educate key stakeholders that although energy efficiency can be an important low-cost resource to inteshygrate into the energy mix it does require funding just as a new power plant requires funding Further education
is necessary on the impact that energy efficiency proshygrams can have in concert with other energy efficiency policies such as building codes appliance standards and tax incentives
Promote sufficient timely and stable program fundshy
ing to deliver energy efficiency where cost-effective
Energy efficiency programs require consistent and long-term funding to effectively compete with energy supply options Efforts are necessary to establish this consistent long-term funding A variety of mechanisms have been and can be used based on state utility and other stakeshyholder interests It is important to ensure that the effishyciency programsrsquo providers have sufficient long-term funding to recover program costs and implement the energy efficiency measures that have been demonstratshyed to be available and cost effective A number of states are now linking program funding to the achievement of energy savings
Modify policies to align utility incentives with the
delivery of cost-effective energy efficiency and modify
ratemaking practices to promote energy efficiency
investments Successful energy efficiency programs would be promoted by aligning utility incentives in a manner that encourages the delivery of energy efficienshycy as part of a balanced portfolio of supply demand and transmission investments Historically regulatory policies governing utilities have more commonly compensated utilities for building infrastructure (eg power plants transmission lines pipelines) and selling energy while discouraging energy efficiency even when the energy-saving measures might cost less Within the existing regshyulatory processes utilities regulators and stakeholders have a number of opportunities to create the incentives for energy efficiency investments by utilities and cusshytomers A variety of mechanisms have already been used For example parties can decide to provide incenshytives for energy efficiency similar to utility incentives for new infrastructure investments provide rewards for prushydent management of energy efficiency programs and incorporate energy efficiency as an important area of consideration within rate design Rate design offers
To create a sustainable aggressive national commitment to energy efficiency ES-7
Figure ES-2 National Action Plan for Energy Efficiency Recommendations amp Options
Recognize energy efficiency as a high priority
energy resource
Options to consider bull Establishing policies to establish energy efficiency as
a priority resource bull Integrating energy efficiency into utility state and
regional resource planning activities bull Quantifying and establishing the value of energy
efficiency considering energy savings capacity savshyings and environmental benefits as appropriate
Make a strong long-term commitment to implement
cost-effective energy efficiency as a resource
Options to consider bull Establishing appropriate cost-effectiveness tests for
a portfolio of programs to reflect the long-term benefits of energy efficiency
bull Establishing the potential for long-term cost-effective energy efficiency savings by customer class through proven programs innovative initiatives and cutting-edge technologies
bull Establishing funding requirements for delivering long-term cost-effective energy efficiency
bull Developing long-term energy saving goals as part of energy planning processes
bull Developing robust measurement and verification (MampV) procedures
bull Designating which organization(s) is responsible for administering the energy efficiency programs
bull Providing for frequent updates to energy resource plans to accommodate new information and technology
Broadly communicate the benefits of and
opportunities for energy efficiency
Options to consider bull Establishing and educating stakeholders on the
business case for energy efficiency at the state utilshyity and other appropriate level addressing relevant customer utility and societal perspectives
bull Communicating the role of energy efficiency in
lowering customer energy bills and system costs and risks over time
bull Communicating the role of building codes applishyance standards and tax and other incentives
Provide sufficient timely and stable program funding
to deliver energy efficiency where cost-effective
Options to consider bull Deciding on and committing to a consistent
way for program administrators to recover energy efficiency costs in a timely manner
bull Establishing funding mechanisms for energy efficiency from among the available options such as revenue requirement or resource procurement funding system benefits charges rate-basing shared-savings incentive mechanisms etc
bull Establishing funding for multi-year periods
Modify policies to align utility incentives with the
delivery of cost-effective energy efficiency and
modify ratemaking practices to promote energy
efficiency investments
Options to consider bull Addressing the typical utility throughput incentive
and removing other regulatory and management disincentives to energy efficiency
bull Providing utility incentives for the successful management of energy efficiency programs
bull Including the impact on adoption of energy efficiency as one of the goals of retail rate design recognizing that it must be balanced with other objectives
bull Eliminating rate designs that discourage energy efficiency by not increasing costs as customers consume more electricity or natural gas
bull Adopting rate designs that encourage energy efficiency by considering the unique characteristics of each customer class and including partnering tariffs with other mechanisms that encourage energy efficiency such as benefit sharing programs and on-bill financing
ES-8 National Action Plan for Energy Efficiency
opportunities to encourage customers to invest in efficiency where they find it to be cost effective and participate in new programs that provide innovative technologies (eg smart meters) to help customers control their energy costs
National Action Plan for Energy
Efficiency Next Steps
In summer 2006 members of the Leadership Group of the National Action Plan on Energy Efficiency are announcing a number of specific activities and initiatives to formalize and reinforce their commitments to energy efficiency as a resource To assist the Leadership Group and others in making and fulfilling their commitments a number of tools and resources have been developed
National Action Plan for Energy Efficiency Report
This report details the key barriers to energy efficiency in resource planning utility incentive mechanisms rate design and the design and implementation of energy efficiency programs It also reviews and presents a varishyety of policy and program solutions that have been used to overcome these barriers as well as the pros and cons for many of these approaches
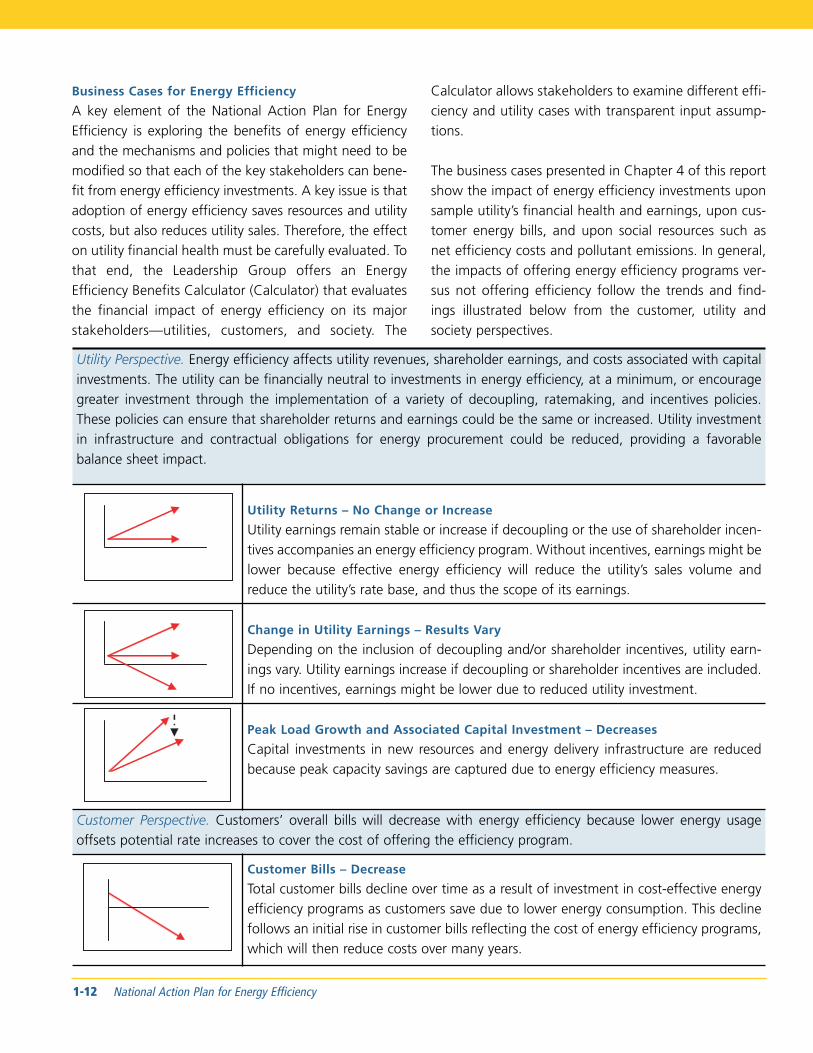
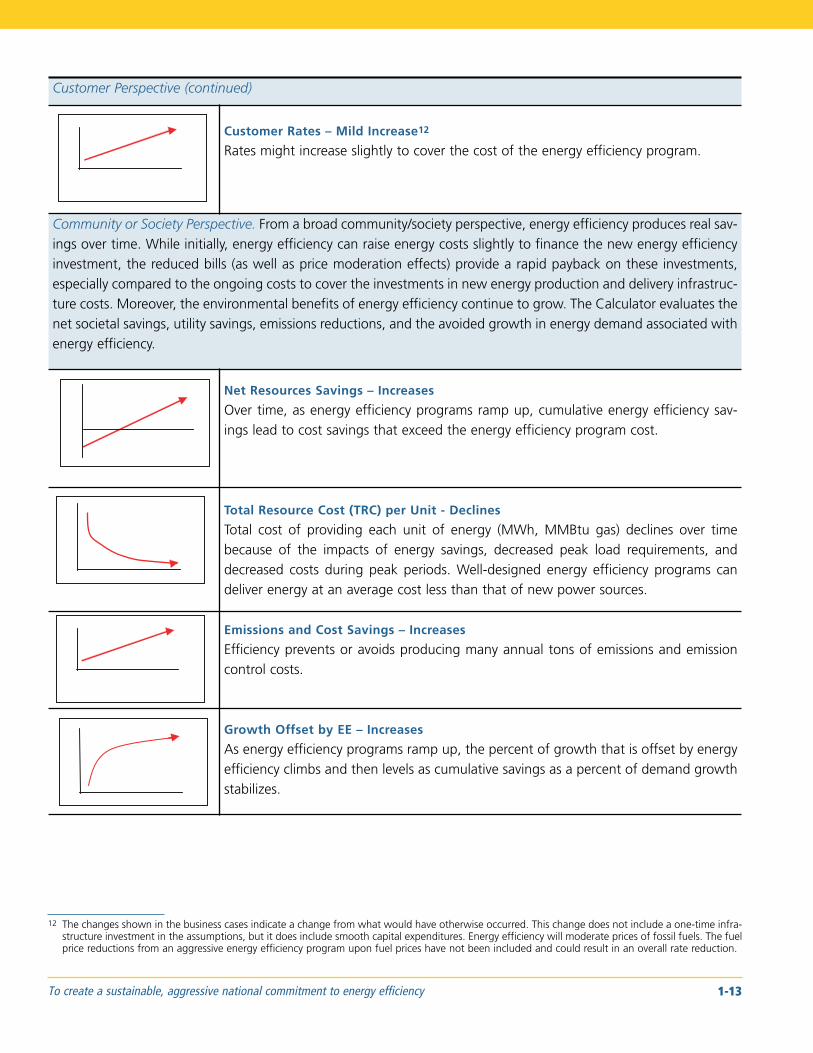
Energy Efficiency Benefits Calculator This calculator can be used to help educate stakeholders on the broad benefits of energy efficiency It provides a simplified framework to demonstrate the business case for energy efficiency from the perspective of the consumer the utilshyity and society It has been used to explore the benefits of energy efficiency program investments under a range of utility structures policy mechanisms and energy growth scenarios The calculator can be adapted and applied to other scenarios
Experts and Resource Materials on Energy Efficiency
A number of educational presentations on the potential for energy efficiency and various policies available for pursuing the recommendations of the Action Plan will be developed In addition lists of policy and program experts in energy efficiency and the various policies availshyable for pursuing the recommendations of the Action
Plan will be developed These lists will be drawn from utilities state utility regulators state energy offices third-party energy efficiency program administrators consumer advocacy organizations ESCOs and others These resources will be available in fall 2006
DOE and EPA are continuing to facilitate the work of the Leadership Group and the National Action Plan for Energy Efficiency During winter 2006ndash2007 the Leadership Group plans to report on its progress and identify next steps for the Action Plan
To create a sustainable aggressive national commitment to energy efficiency ES-9
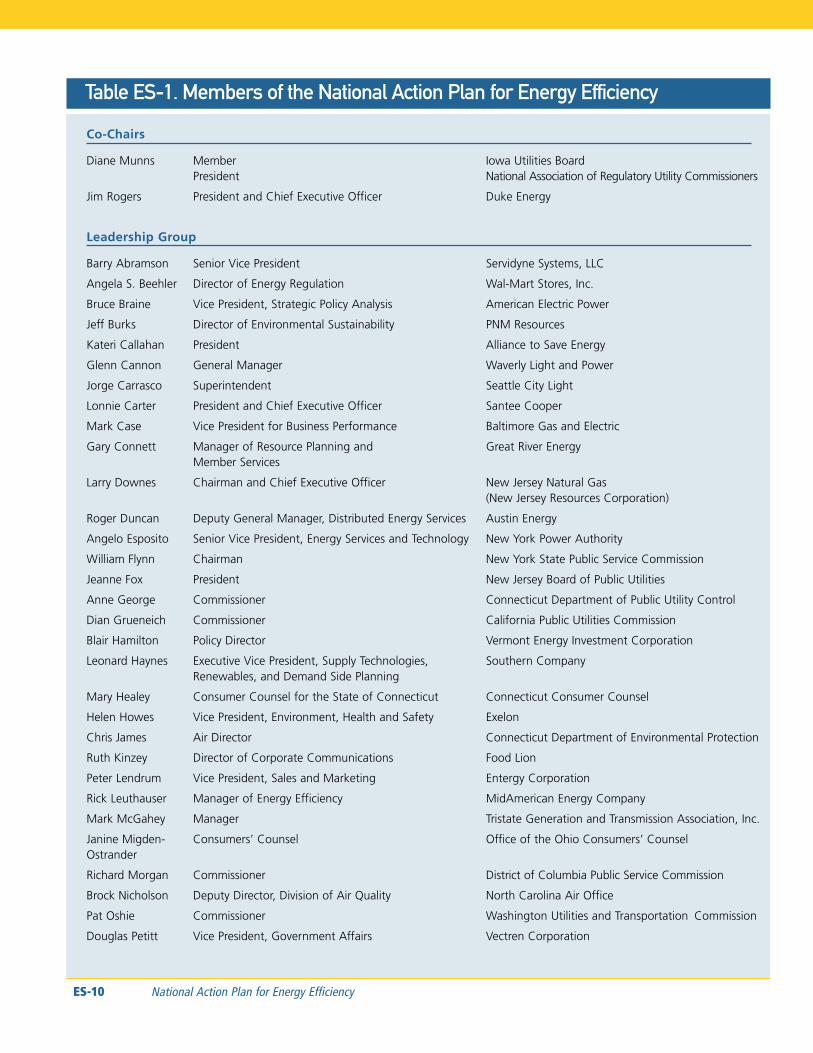
Table ES-1 Members of the National Action Plan for Energy Efficiency
Co-Chairs
Diane Munns Member Iowa Utilities Board President National Association of Regulatory Utility Commissioners
Jim Rogers President and Chief Executive Officer Duke Energy
Leadership Group
Barry Abramson Senior Vice President Servidyne Systems LLC
Angela S Beehler Director of Energy Regulation Wal-Mart Stores Inc
Bruce Braine Vice President Strategic Policy Analysis American Electric Power
Jeff Burks Director of Environmental Sustainability PNM Resources
Kateri Callahan President Alliance to Save Energy
Glenn Cannon General Manager Waverly Light and Power
Jorge Carrasco Superintendent Seattle City Light
Lonnie Carter President and Chief Executive Officer Santee Cooper
Mark Case Vice President for Business Performance Baltimore Gas and Electric
Gary Connett Manager of Resource Planning and Great River Energy Member Services
Larry Downes Chairman and Chief Executive Officer New Jersey Natural Gas (New Jersey Resources Corporation)
Roger Duncan Deputy General Manager Distributed Energy Services Austin Energy
Angelo Esposito Senior Vice President Energy Services and Technology New York Power Authority
William Flynn Chairman New York State Public Service Commission
Jeanne Fox President New Jersey Board of Public Utilities
Anne George Commissioner Connecticut Department of Public Utility Control
Dian Grueneich Commissioner California Public Utilities Commission
Blair Hamilton Policy Director Vermont Energy Investment Corporation
Leonard Haynes Executive Vice President Supply Technologies Southern Company Renewables and Demand Side Planning
Mary Healey Consumer Counsel for the State of Connecticut Connecticut Consumer Counsel
Helen Howes Vice President Environment Health and Safety Exelon
Chris James Air Director Connecticut Department of Environmental Protection
Ruth Kinzey Director of Corporate Communications Food Lion
Peter Lendrum Vice President Sales and Marketing Entergy Corporation
Rick Leuthauser Manager of Energy Efficiency MidAmerican Energy Company
Mark McGahey Manager Tristate Generation and Transmission Association Inc
Janine Migden- Consumersrsquo Counsel Office of the Ohio Consumersrsquo Counsel Ostrander
Richard Morgan Commissioner District of Columbia Public Service Commission
Brock Nicholson Deputy Director Division of Air Quality North Carolina Air Office
Pat Oshie Commissioner Washington Utilities and Transportation Commission
Douglas Petitt Vice President Government Affairs Vectren Corporation
ES-10 National Action Plan for Energy Efficiency
Bill Prindle Deputy Director American Council for an Energy-Efficient Economy
Phyllis Reha Commissioner Minnesota Public Utilities Commission
Roland Risser Director Customer Energy Efficiency Pacific Gas and Electric
Gene Rodrigues Director Energy Efficiency Southern California Edison
Art Rosenfeld Commissioner California Energy Commission
Jan Schori General Manager Sacramento Municipal Utility District
Larry Shirley Division Director North Carolina Energy Office
Michael Shore Senior Air Policy Analyst Environmental Defense
Gordon Slack Energy Business Director The Dow Chemical Company
Deb Sundin Director Business Product Marketing Xcel Energy
Dub Taylor Director Texas State Energy Conservation Office
Paul von Director Energy and Environmental Affairs Johnson Controls Paumgartten
Brenna Walraven Executive Director National Property Management USAA Realty Company
Devra Wang Director California Energy Program Natural Resources Defense Council
Steve Ward Public Advocate State of Maine
Mike Weedall Vice President Energy Efficiency Bonneville Power Administration
Tom Welch Vice President External Affairs PJM Interconnection
Jim West Manager of energy right amp Green Power Switch Tennessee Valley Authority
Henry Yoshimura Manager Demand Response ISO New England Inc
Observers
James W (Jay) Counsel Steel Manufacturers Association Brew
Roger Cooper Executive Vice President Policy and Planning American Gas Association
Dan Delurey Executive Director Demand Response Coordinating Committee
Roger Fragua Deputy Director Council of Energy Resource Tribes
Jeff Genzer General Counsel National Association of State Energy Officials
Donald Gilligan President National Association of Energy Service Companies
Chuck Gray Executive Director National Association of Regulatory Utility Commissioners
John Holt Senior Manager of Generation and Fuel National Rural Electric Cooperative Association
Joseph Mattingly Vice President Secretary and General Counsel Gas Appliance Manufacturers Association
Kenneth Mentzer President and Chief Executive Officer North American Insulation Manufacturers Association
Christina Mudd Executive Director National Council on Electricity Policy
Ellen Petrill Director PublicPrivate Partnerships Electric Power Research Institute
Alan Richardson President and Chief Executive Officer American Public Power Association
Steve Rosenstock Manager Energy Solutions Edison Electric Institute
Diane Shea Executive Director National Association of State Energy Officials
Rick Tempchin Director Retail Distribution Policy Edison Electric Institute
Mark Wolfe Executive Director Energy Programs Consortium
To create a sustainable aggressive national commitment to energy efficiency ES-11
Notes
1 Energy efficiency refers to using less energy to pro- See highlights of some of these programs in Chapter vide the same or improved level of service to the 6 Energy Efficiency Program Best Practices Tables energy consumer in an economically efficient way 6-1 and 6-2 The term energy efficiency as used here includes 10 These economic and environmental savings estishyusing less energy at any time including at times of mates are extrapolations of the results from region-peak demand through demand response and peak al program to a national scope Actual savings at the shaving efforts regional level vary based on a number of factors For
2 Addressing transportation-related energy use is also these estimates avoided capacity value is based on an important challenge as energy demand in this peak load reductions de-rated for reductions that do sector continues to increase and oil prices hit historshy not result in savings of capital investments ical highs However transportation issues are out- Emissions savings are based on a marginal on-peak side the scope of this effort which is focused only generation fuel of natural gas and marginal off-on electricity and natural gas systems peak fuel of coal with the on-peak period capacity
3 This effort is focused on energy efficiency for regushy requirement double that of the annual average lated energy forms Energy efficiency for unregulat- These assumptions vary by region based upon situashyed energy forms such as fuel oil for example is tion-specific variables Reductions in capped emisshyclosely related in terms of actions in buildings but is sions might reduce the cost of compliance quite different in terms of how policy can promote 11 This estimate of the funding required assumes 2 investments percent of revenues across electric utilities and 05
4 A utility is broadly defined as an organization that percent across gas utilities The estimate also delivers electric and gas utility services to end users assumes that energy efficiency is delivered at a total including but not limited to investor-owned pub- cost (utility and participant) of $004 per kWh and licly-owned cooperatively-owned and third-party $3 per million British thermal units (MMBtu) which energy efficiency utilities are higher than the costs of many of todayrsquos programs
5 Many energy efficiency programs have an average 12 This estimate is provided as an indicator of underinshylife cycle cost of $003kilowatt-hour (kWh) saved vestment and is not intended to establish a national which is 50 to 75 percent of the typical cost of new funding target Appropriate funding levels for pro-power sources (ACEEE 2004 EIA 2006) The cost grams should be established at the regional state of energy efficiency programs varies by program and or utility level In addition energy efficiency invest-can include higher cost programs and options with ments by customers businesses industry and govshylower costs to a utility such as modifying rate designs ernment also contribute to the larger economic and
6 See Chapter 6 Energy Efficiency Program Best environment benefits of energy efficiency Practices for more information on leading programs 13 One example of energy efficiencyrsquos ability to meet
7 Data refer to EIA 2006 new power costs and gas load growth is the Northwest Power Planning prices in 2015 compared to electric and gas pro- Councilrsquos Fifth Power Plan which uses energy con-gram costs based on leading energy efficiency proshy servation and efficiency to meet a targeted 700 MW grams many of which are discussed in Chapter 6 of forecasted capacity between 2005 and 2009 Energy Efficiency Program Best Practices (NWPCC 2005)
8 Based on leading energy efficiency programs many of which are discussed in Chapter 6 Energy Efficiency Program Best Practices
9 These estimates are based on assumptions of avershyage program spending levels by utilities or other program administrators with conservatively high numbers for the cost of energy efficiency programs
ES-12 National Action Plan for Energy Efficiency
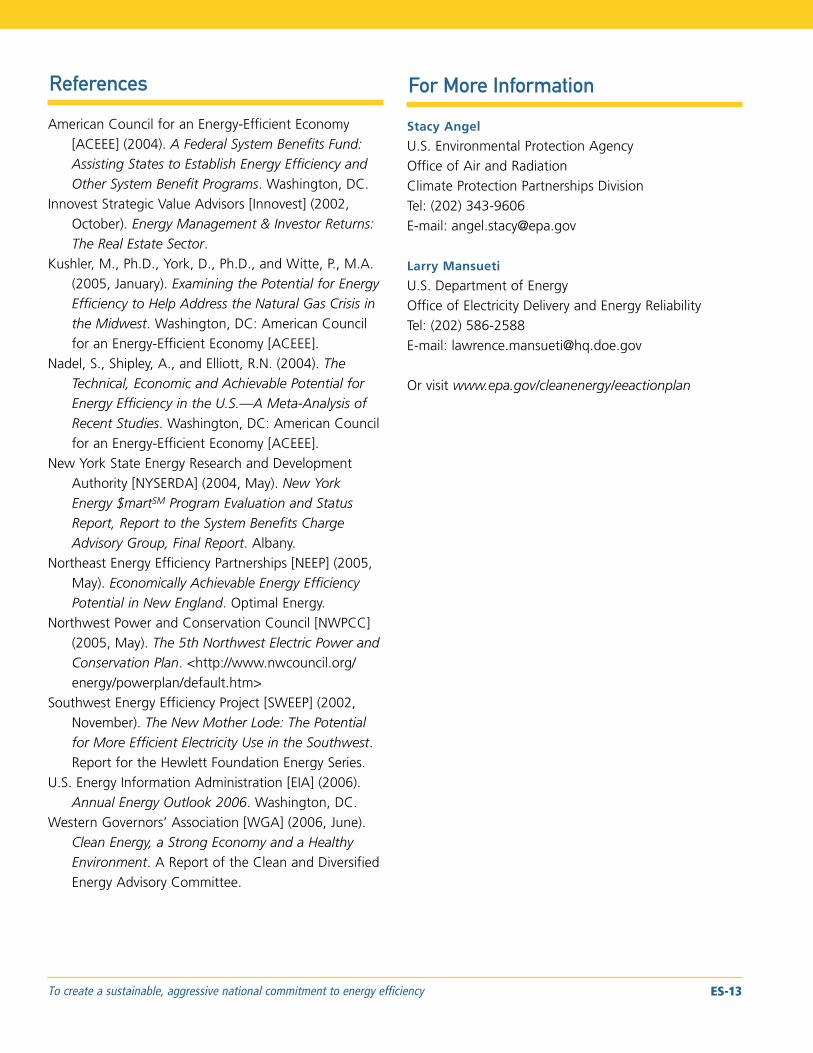
References For More Information
American Council for an Energy-Efficient Economy [ACEEE] (2004) A Federal System Benefits Fund Assisting States to Establish Energy Efficiency and Other System Benefit Programs Washington DC
Innovest Strategic Value Advisors [Innovest] (2002 October) Energy Management amp Investor Returns The Real Estate Sector
Kushler M PhD York D PhD and Witte P MA (2005 January) Examining the Potential for Energy Efficiency to Help Address the Natural Gas Crisis in the Midwest Washington DC American Council for an Energy-Efficient Economy [ACEEE]
Nadel S Shipley A and Elliott RN (2004) The Technical Economic and Achievable Potential for Energy Efficiency in the USmdashA Meta-Analysis of Recent Studies Washington DC American Council for an Energy-Efficient Economy [ACEEE]
New York State Energy Research and Development Authority [NYSERDA] (2004 May) New York Energy $martSM Program Evaluation and Status Report Report to the System Benefits Charge Advisory Group Final Report Albany
Northeast Energy Efficiency Partnerships [NEEP] (2005 May) Economically Achievable Energy Efficiency Potential in New England Optimal Energy
Northwest Power and Conservation Council [NWPCC] (2005 May) The 5th Northwest Electric Power and Conservation Plan lthttpwwwnwcouncilorg energypowerplandefaulthtmgt
Southwest Energy Efficiency Project [SWEEP] (2002 November) The New Mother Lode The Potential for More Efficient Electricity Use in the Southwest Report for the Hewlett Foundation Energy Series
US Energy Information Administration [EIA] (2006) Annual Energy Outlook 2006 Washington DC
Western Governorsrsquo Association [WGA] (2006 June) Clean Energy a Strong Economy and a Healthy Environment A Report of the Clean and Diversified Energy Advisory Committee
Stacy Angel
US Environmental Protection Agency Office of Air and Radiation Climate Protection Partnerships Division Tel (202) 343-9606 E-mail angelstacyepagov
Larry Mansueti
US Department of Energy Office of Electricity Delivery and Energy Reliability Tel (202) 586-2588 E-mail lawrencemansuetihqdoegov
Or visit wwwepagovcleanenergyeeactionplan
To create a sustainable aggressive national commitment to energy efficiency ES-13
1Introduction and Background
Overview
We currently face a number of challenges in securing affordable reliable secure and clean energy to meet our nationrsquos growing energy demand Demand is outshypacing supply costs are rising and concerns for the envishyronment are growing
Improving the energy efficiency1 of our homes businessshyes schools governments and industries ndash which conshysume more than 70 percent of the energy used in the countrymdashis one of the most constructive cost-effective ways to address these challenges Greater investment in energy efficiency programs across the country could help meet our growing electricity and natural gas demand save customers billions of dollars on their energy bills reduce emissions of air pollutants and greenhouse gases and contribute to a more secure reliable and low-cost energy system Despite this opportunity energy efficienshycy remains an under-utilized resource in the nationrsquos energy portfolio
There are many ways to increase investment in cost-effective energy efficiency including developing building codes and appliance standards implementing governshyment leadership efforts and educating the public through programs such as ENERGY STARreg2 Another important area is greater investment in organized enershygy efficiency programs that are managed by electric and natural gas providers states or third-party administrashytors Energy efficiency programs already contribute to the energy mix in many parts of the country and have delivered significant savings and other benefits Despite the benefits these programs face hurdles in many areas of the country Identifying and removing these barriers is a focus of this effort
October 2005 Excerpt from Letter From Co-Chairs to the National Action Plan for Energy Efficiency Leadership Group
Energy efficiency is a critically under-utilized resource in the nationrsquos energy portfolio Those states and utilities that have made significant investments in energy effishyciency have lowered the growth for energy demand and moderated their energy costs However many hurdles remain that block broader investments in cost-effective energy efficiency
That is why we have agreed to chair the Energy Efficiency Action Plan It is our hope that with the help of leading organizations like yours we will identify and overcome these hurdles
Through this Action Plan we intend to identify the major barriers currently limiting greater investment by utilities in energy efficiency We will develop a series of business cases that will demonstrate the value and contributions of energy efficiency and explain how to remove these barriers (including regulatory and market challenges) These business cases along with descriptions of leading energy efficiency programs will build upon practices already in place across the country
Diane Munns Jim Rogers PresidentNARUC President and CEO Member Iowa Utilities Board Duke Energy
To drive a sustainable aggressive national commitment to energy efficiency through gas and electric utilities utility regulators and partner organizations more than 50 leading organizations joined together to develop this National Action Plan for Energy Efficiency The Action Plan is co-chaired by Diane Munns Member of the Iowa
1 Energy efficiency refers to using less energy to provide the same or improved level of service to the energy consumer in an economically efficient way The term energy efficiency as used here includes using less energy at any time including at times of peak demand through demand response and peak shaving efforts
2 See EPA 2006 for a description of a broad set of policies being used at the state level to advance energy efficiency
To create a sustainable aggressive national commitment to energy efficiency 1-1
Utilities Board and President of the National Association of Regulatory Utility Commissioners and Jim Rogers President and Chief Executive Officer of Duke Energy The Leadership Group includes representatives from a broad set of stakeholders including electric and gas utilities state utility commissioners state air and energy agencies energy service providers energy consumers and energy efficiency and consumer advocates This effort is facilitated by the US Department of Energy (DOE) and the US Environmental Protection Agency (EPA) The National Action Plan for Energy Efficiency
bull Identifies key barriers limiting greater investment in energy efficiency
bull Reviews sound business practices for removing these barriers and improving the acceptance and use of enershygy efficiency relative to energy supply options and
bull Outlines recommendations and options for overcoming these barriers
In addition members of the Leadership Group are comshymitting to act within their own organizations and spheres of influence to increase attention and investshyment in energy efficiency Greater investment in energy efficiency cannot happen based on the work of one indishyvidual or organization alone The Leadership Group recognizes that the joint efforts of the customer utility regulator and partner organizations are needed to reinshyvigorate and increase the use of energy efficiency in America As energy experts utilities may be in a unique position to play a leadership role
The rest of this introduction chapter establishes why now is the time to increase our investment in energy effishyciency outlines the approach taken in the National Action Plan for Energy Efficiency and explains the strucshyture of this report
Why Focus on Energy Efficiency
Energy Challenges
We currently face multiple challenges in providing affordable clean and reliable energy in todayrsquos complex energy markets
bull Electricity demand continues to rise Given current energy consumption and demographic trends DOE projects that US energy consumption will increase by more than one-third by the year 2025 Electric power consumption is expected to increase by almost 40 percent and total fossil fuel use is projected to increase similarly (EIA 2005) At work and at home we continue to rely on more energy-consuming devices This growth in demand stresses current systems and requires substantial new investments in system expansions
bull High energy prices Our demand for natural gas to heat our homes for industrial and business uses and for power plants is straining the available gas supply in North America and putting upward pressure on natushyral gas prices Many household budgets are being strained by higher energy costs leaving less money available for other household purchases and needs this situation is particularly harmful for low-income households Consumers are looking for ways to manshyage their energy bills Higher energy bills for industry are reducing the nationrsquos economic competitiveness and placing US jobs at risk Higher energy prices also raise the financial risk associated with the developshyment of new natural gas-fired power plants which had been expected to make up more than 60 percent of capacity additions over the next 20 years (EIA 2005) Coal prices are also increasing and contributing to higher electricity costs
bull Energy system reliability Events such as the Northeast electricity blackout of August 2003 and Hurricanes Katrina and Rita in 2005 highlighted the vulnerability of our energy system to disruptions This led to an
1-2 National Action Plan for Energy Efficiency
increased focus on energy reliability and its economic and human impacts as well as national security conshycerns using fossil fuel more efficiently and increasing energy supply diversity
bull Transmission systems are overburdened in some places limiting the flow of economical generation and in some cases shrinking reserve margins of the electricity grid to inappropriately small levels This situation can cause reliability problems and high electricity prices in or near congested areas
bull Environmental concerns Energy demand continues to grow as national and state regulations are being impleshymented to significantly limit the emissions of air pollushytants such as sulfur dioxide (SO2) nitrogen oxides (NOx) and mercury to protect public health and the environshyment Many existing base load generation plants are aging and significant retrofits are needed to ensure old generating units meet these emissions regulations In addition emissions of greenhouse gases continue to increase
Addressing these issues will require billions of dollars in investments in new power plants gas rigs transmission lines pipelines and other infrastructure notwithstandshying the difficulty of building new energy infrastructure in dense urban and suburban locations even with current energy efficiency investment The decisions we make now regarding our energy supply and demand can either help us deal with these challenges more effectively or complicate our ability to secure a more stable economishycal energy future
Benefits of Energy Efficiency
Greater investment in energy efficiency can help us tackle these challenges Energy efficiency is already a key composhynent in the nationrsquos energy resource mix in many parts of
the country and experience shows that energy efficiency programs can lower customer energy bills cost less than and help defer new energy production provide environshymental benefits and spur local economic development Some of the major benefits of energy efficiency include
bull Lower energy bills greater customer control and greater customer satisfaction Well-designed programs can provide opportunities for all customer classes to adopt energy savings measures and reduce their enershygy bills3 These programs can help customers make sound energy use decisions increase control over their energy bills with savings of 5 to 30 percent and empower them to manage their energy usage Customers often express greater satisfaction with elecshytricity and natural gas providers where energy efficienshycy is offered
bull Lower cost than supplying new generation only from new power plants Well-designed energy efficiency programs are saving energy at an average cost of one-half of the typical cost of new power sources and about one-third of the cost of providing natural gas4
When integrated into a long-term energy resource plan energy efficiency could help defer investments in new plants and lower the total energy system cost
bull Modular and quick to deploy Energy efficiency proshygrams can be ramped up over a period of one to three years to deliver sizable savings These programs can also be targeted to congested areas with high prices to bring relief where it might be difficult to deliver new supply in the near term
bull Significant energy savings Well-designed energy effishyciency programs are delivering energy savings each year on the order of 1 percent of total electric and natshyural gas sales5 These programs are helping to offset 20 to 50 percent of expected growth in energy
3 See Chapter 6 Energy Efficiency Program Best Practices for more information on leading programs 4 Based on new power costs and gas prices in 2015 (EIA 2006) compared to electric and gas program costs based on leading energy programs many of
which are discussed in Chapter 6 Energy Efficiency Program Best Practices 5 Based on leading energy efficiency programs many of which are discussed in Chapter 6 Energy Efficiency Program Best Practices
To create a sustainable aggressive national commitment to energy efficiency 1-3
demand in some areas without compromising the end usersrsquo activities and economic well-being (Nadel et al 2004 EIA 2006)
bull Environmental benefits Cost-effective energy efficienshycy offers environmental benefits related to reduced demand such as reduced air pollution and greenhouse gas emissions lower water use and less environmental damage from fossil fuel extraction Energy efficiency is an attractive option for generation owners in advance of requirements to reduce greenhouse gas emissions
bull Economic development Greater investment in energy efficiency helps build jobs and improve state economies Energy efficiency users often redirect their bill savings toward other activities that increase local and national employment with a higher employment impact than if the money had been spent to purchase energy (York and Kushler 2005 NYSERDA 2004) Many energy effishyciency programs create construction and installation jobs with multiplier impacts on other employment and local economies (Sedano et al 2005) Local investshyments in energy efficiency can offset energy imports from out-of-state improving the state balance of trade Lastly energy efficiency investments usually create long-lasting infrastructure changes to building equipment and appliance stocks creating long-term property improvements that deliver long-term economic value (Innovest 2002)
bull Energy security Energy efficiency reduces the level of US per capita energy consumption thus decreasing the vulnerability of the economy and individual conshysumers to energy price disruptions from natural disasters and attacks upon domestic and international energy supplies and infrastructure
Decades of Experience With Energy
Efficiency
Utilities and their regulators began recognizing thepotential benefits of improving efficiency and reducingdemand in the 1970s and 1980s These ldquodemand-side
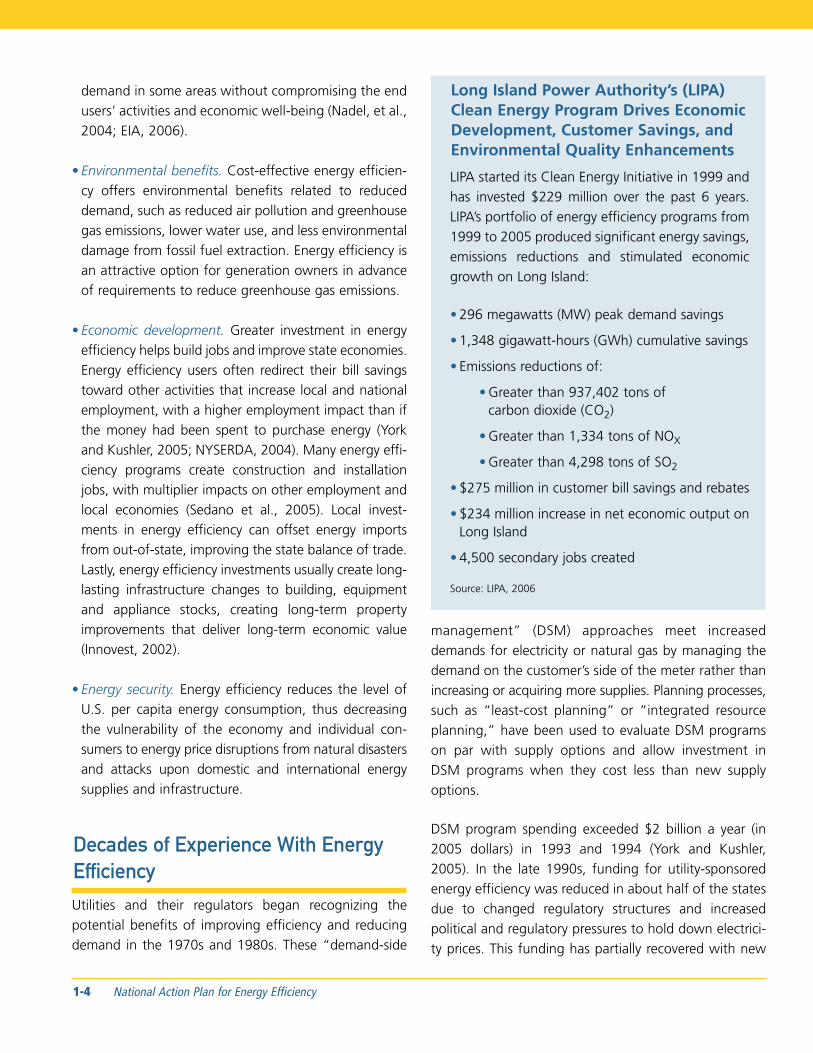
Long Island Power Authorityrsquos (LIPA) Clean Energy Program Drives Economic Development Customer Savings and Environmental Quality Enhancements
LIPA started its Clean Energy Initiative in 1999 and has invested $229 million over the past 6 years LIPArsquos portfolio of energy efficiency programs from 1999 to 2005 produced significant energy savings emissions reductions and stimulated economic growth on Long Island
bull 296 megawatts (MW) peak demand savings
bull 1348 gigawatt-hours (GWh) cumulative savings
bull Emissions reductions of
bull Greater than 937402 tons of carbon dioxide (CO2)
bull Greater than 1334 tons of NOX
bull Greater than 4298 tons of SO2
bull $275 million in customer bill savings and rebates
bull $234 million increase in net economic output on Long Island
bull 4500 secondary jobs created
Source LIPA 2006
managementrdquo (DSM) approaches meet increased demands for electricity or natural gas by managing the demand on the customerrsquos side of the meter rather than increasing or acquiring more supplies Planning processes such as ldquoleast-cost planningrdquo or ldquointegrated resource planningrdquo have been used to evaluate DSM programs on par with supply options and allow investment in DSM programs when they cost less than new supply options
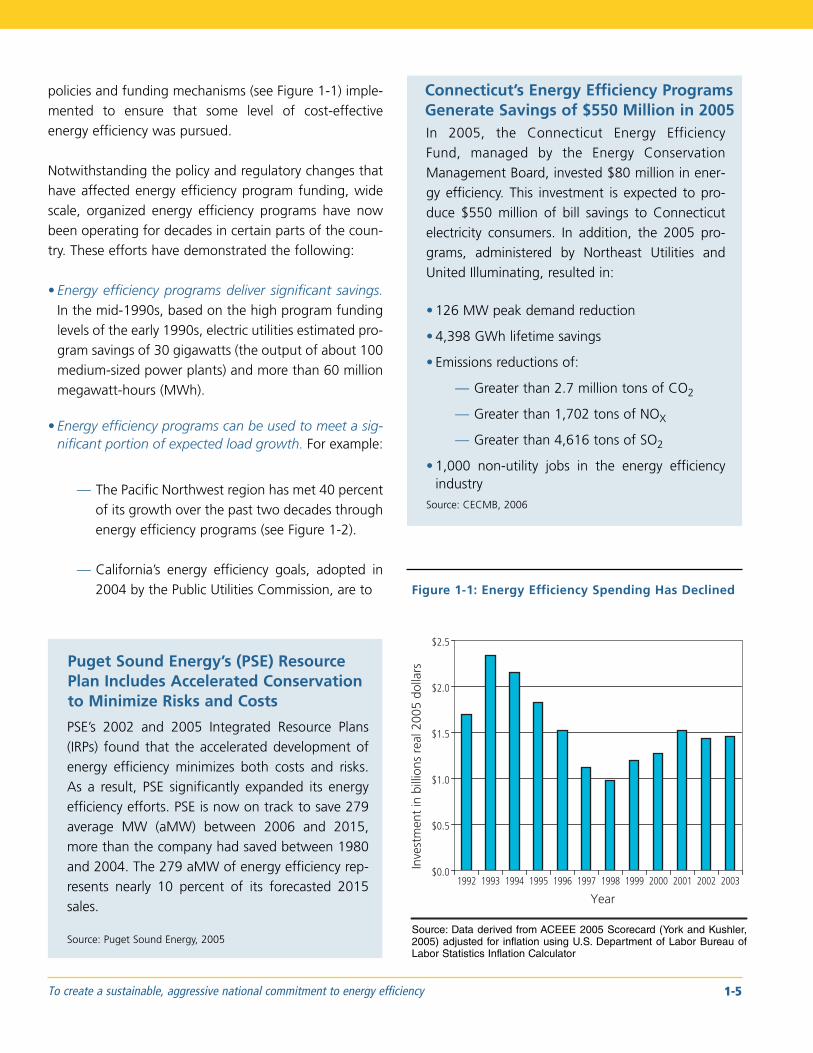
DSM program spending exceeded $2 billion a year (in 2005 dollars) in 1993 and 1994 (York and Kushler 2005) In the late 1990s funding for utility-sponsored energy efficiency was reduced in about half of the states due to changed regulatory structures and increased political and regulatory pressures to hold down electricishyty prices This funding has partially recovered with new
1-4 National Action Plan for Energy Efficiency
policies and funding mechanisms (see Figure 1-1) impleshymented to ensure that some level of cost-effective energy efficiency was pursued
Notwithstanding the policy and regulatory changes that have affected energy efficiency program funding wide scale organized energy efficiency programs have now been operating for decades in certain parts of the counshytry These efforts have demonstrated the following
bull Energy efficiency programs deliver significant savings In the mid-1990s based on the high program funding levels of the early 1990s electric utilities estimated proshygram savings of 30 gigawatts (the output of about 100 medium-sized power plants) and more than 60 million megawatt-hours (MWh)
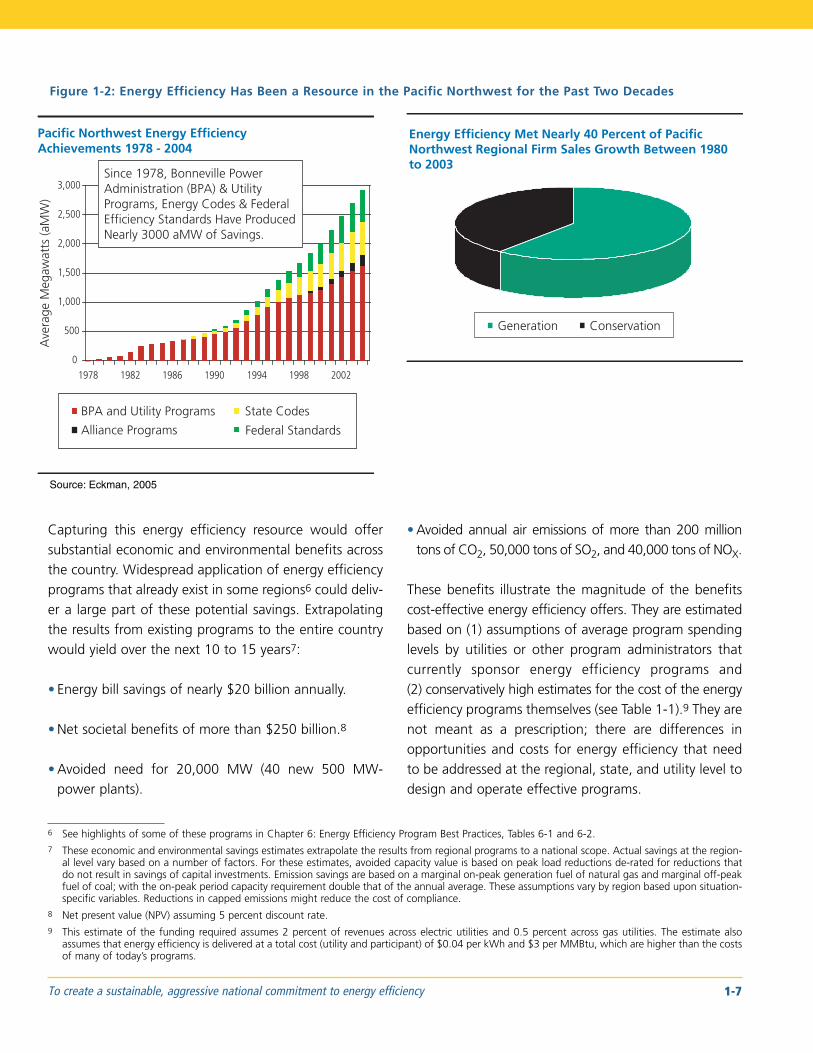
bull Energy efficiency programs can be used to meet a sigshynificant portion of expected load growth For example
mdash The Pacific Northwest region has met 40 percent of its growth over the past two decades through energy efficiency programs (see Figure 1-2)
mdash Californiarsquos energy efficiency goals adopted in 2004 by the Public Utilities Commission are to
Connecticutrsquos Energy Efficiency Programs Generate Savings of $550 Million in 2005 In 2005 the Connecticut Energy Efficiency Fund managed by the Energy Conservation Management Board invested $80 million in enershygy efficiency This investment is expected to proshyduce $550 million of bill savings to Connecticut electricity consumers In addition the 2005 proshygrams administered by Northeast Utilities and United Illuminating resulted in
bull 126 MW peak demand reduction
bull 4398 GWh lifetime savings
bull Emissions reductions of
mdash Greater than 27 million tons of CO2
mdash Greater than 1702 tons of NOX
mdash Greater than 4616 tons of SO2
bull 1000 non-utility jobs in the energy efficiency industry
Source CECMB 2006
Figure 1-1 Energy Efficiency Spending Has Declined
$25
Puget Sound Energyrsquos (PSE) Resource Plan Includes Accelerated Conservation to Minimize Risks and Costs
PSErsquos 2002 and 2005 Integrated Resource Plans (IRPs) found that the accelerated development of energy efficiency minimizes both costs and risks As a result PSE significantly expanded its energy efficiency efforts PSE is now on track to save 279 average MW (aMW) between 2006 and 2015more than the company had saved between 1980and 2004 The 279 aMW of energy efficiency repshyresents nearly 10 percent of its forecasted 2015
Inve
stm
ent
in b
illio
ns r
eal 2
005
dolla
rs
$00 1992 1993 1994 1995 1996 1997 1998 1999 2000 2001 2002 2003
$20
$15
$10
$05
Year sales
Source Data derived from ACEEE 2005 Scorecard (York and Kushler Source Puget Sound Energy 2005 2005) adjusted for inflation using US Department of Labor Bureau of
Labor Statistics Inflation Calculator
To create a sustainable aggressive national commitment to energy efficiency 1-5
use energy efficiency to displace more than half of future electricity load growth and avoid the need to build three large (500 MW) power plants
bull Energy efficiency is being delivered cost-competitively with new supply Programs across the country are demonstrating that energy efficiency can be delivered at a cost of 2 to 4 cents per kilowatt-hour (kWh) and a cost of $130 to $200 per lifetime million British thershymal units (MMBtu) saved
bull Energy efficiency can be targeted to reduce peak demand A variety of programs address the peak demand of different customer classes lowering the strain on existing supply assets (eg pipeline capacity transmission and distribution capacity and power plant capability) allowing energy delivery companies to betshyter utilize existing assets and deferring new capital investments
bull Proven cost-effective program models are available to build upon These program models are available for almost every customer class both gas and electric
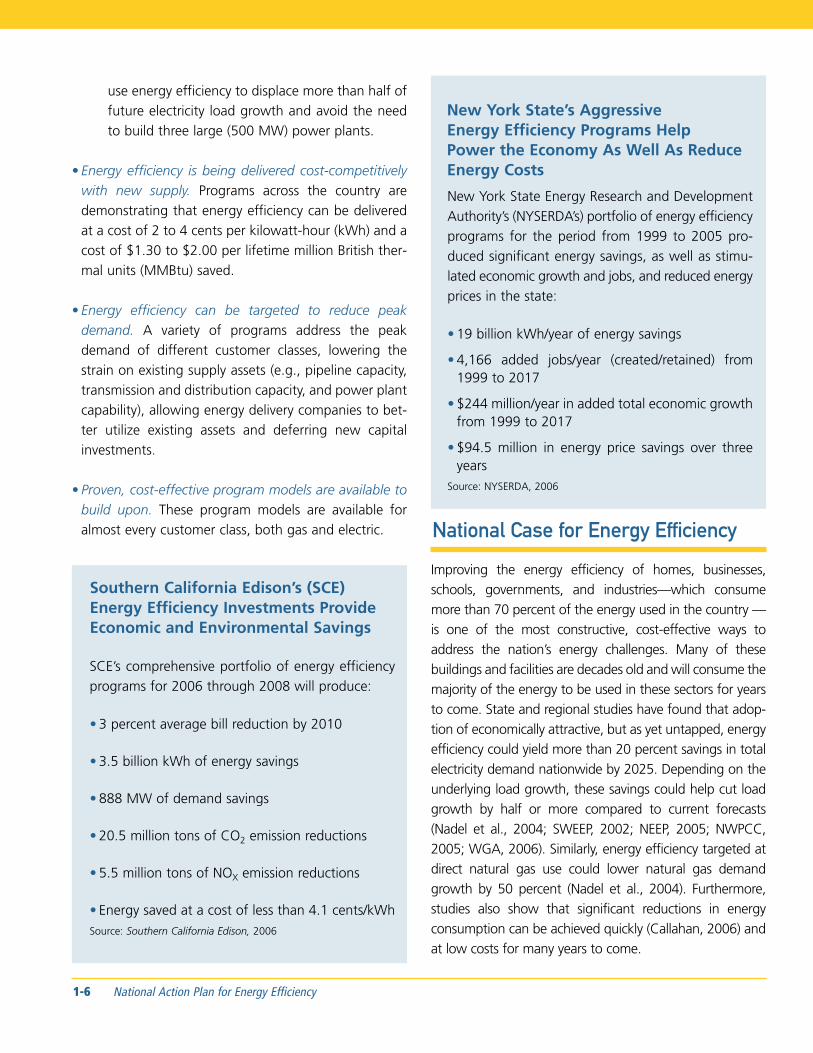
Southern California Edisonrsquos (SCE) Energy Efficiency Investments Provide Economic and Environmental Savings
SCErsquos comprehensive portfolio of energy efficiency programs for 2006 through 2008 will produce
bull 3 percent average bill reduction by 2010
bull 35 billion kWh of energy savings
bull 888 MW of demand savings
bull 205 million tons of CO2 emission reductions
bull 55 million tons of NOX emission reductions
bull Energy saved at a cost of less than 41 centskWh Source Southern California Edison 2006
New York Statersquos Aggressive Energy Efficiency Programs Help Power the Economy As Well As Reduce Energy Costs
New York State Energy Research and Development Authorityrsquos (NYSERDArsquos) portfolio of energy efficiency programs for the period from 1999 to 2005 proshyduced significant energy savings as well as stimushylated economic growth and jobs and reduced energy prices in the state
bull 19 billion kWhyear of energy savings
bull 4166 added jobsyear (createdretained) from 1999 to 2017
bull $244 millionyear in added total economic growth from 1999 to 2017
bull $945 million in energy price savings over three years
Source NYSERDA 2006
National Case for Energy Efficiency
Improving the energy efficiency of homes businesses schools governments and industriesmdashwhich consume more than 70 percent of the energy used in the country mdash is one of the most constructive cost-effective ways to address the nationrsquos energy challenges Many of these buildings and facilities are decades old and will consume the majority of the energy to be used in these sectors for years to come State and regional studies have found that adopshytion of economically attractive but as yet untapped energy efficiency could yield more than 20 percent savings in total electricity demand nationwide by 2025 Depending on the underlying load growth these savings could help cut load growth by half or more compared to current forecasts (Nadel et al 2004 SWEEP 2002 NEEP 2005 NWPCC 2005 WGA 2006) Similarly energy efficiency targeted at direct natural gas use could lower natural gas demand growth by 50 percent (Nadel et al 2004) Furthermore studies also show that significant reductions in energy consumption can be achieved quickly (Callahan 2006) and at low costs for many years to come
1-6 National Action Plan for Energy Efficiency
0
500
Figure 1-2 Energy Efficiency Has Been a Resource in the Pacific Northwest for the Past Two Decades
Pacific Northwest Energy Efficiency Energy Efficiency Met Nearly 40 Percent of Pacific Achievements 1978 - 2004 Northwest Regional Firm Sales Growth Between 1980
to 2003 Since 1978 Bonneville Power
3000 Administration (BPA) amp Utility Programs Energy Codes amp Federal
2500 Efficiency Standards Have Produced Nearly 3000 aMW of Savings
2000
1500
1000
Generation Conservation
Ave
rage
Meg
awat
ts (a
MW
)
1978 1982 1986 1990 1994 1998 2002
BPA and Utility Programs
Alliance Programs
State Codes
Federal Standards
Source Eckman 2005
Capturing this energy efficiency resource would offer bull Avoided annual air emissions of more than 200 million substantial economic and environmental benefits across tons of CO2 50000 tons of SO2 and 40000 tons of NOX the country Widespread application of energy efficiency programs that already exist in some regions6 could deliv- These benefits illustrate the magnitude of the benefits er a large part of these potential savings Extrapolating cost-effective energy efficiency offers They are estimated the results from existing programs to the entire country based on (1) assumptions of average program spending would yield over the next 10 to 15 years7 levels by utilities or other program administrators that
currently sponsor energy efficiency programs and bull Energy bill savings of nearly $20 billion annually (2) conservatively high estimates for the cost of the energy
efficiency programs themselves (see Table 1-1)9 They are bull Net societal benefits of more than $250 billion8 not meant as a prescription there are differences in
opportunities and costs for energy efficiency that need bull Avoided need for 20000 MW (40 new 500 MW- to be addressed at the regional state and utility level to
power plants) design and operate effective programs
6 See highlights of some of these programs in Chapter 6 Energy Efficiency Program Best Practices Tables 6-1 and 6-2 7 These economic and environmental savings estimates extrapolate the results from regional programs to a national scope Actual savings at the regionshy
al level vary based on a number of factors For these estimates avoided capacity value is based on peak load reductions de-rated for reductions that do not result in savings of capital investments Emission savings are based on a marginal on-peak generation fuel of natural gas and marginal off-peak fuel of coal with the on-peak period capacity requirement double that of the annual average These assumptions vary by region based upon situation-specific variables Reductions in capped emissions might reduce the cost of compliance
8 Net present value (NPV) assuming 5 percent discount rate 9 This estimate of the funding required assumes 2 percent of revenues across electric utilities and 05 percent across gas utilities The estimate also
assumes that energy efficiency is delivered at a total cost (utility and participant) of $004 per kWh and $3 per MMBtu which are higher than the costs of many of todayrsquos programs
To create a sustainable aggressive national commitment to energy efficiency 1-7
Table 1-1 Summary of Benefits for National Energy Efficiency Efforts
Program Cost Electric Natural Gas Total
Utility Program Spending ( of utility revenue) 20 05
Total Cost of Efficiency (customer amp utility) $35MWh $3MMBtu
Cost of Efficiency (customer) $15MWh $2MMBtu
Average Annual Cost of Efficiency ($MM) $6800 $1200
Total Cost of Efficiency (NPV $MM) $140000 $25000 $165000
Efficiency Spending - Customer (NPV $MM) $60000 $13000 $73000
Efficiency Program Spending - Utility (NPV $MM) $80000 $13000 $93000
Resulting Savings Electric Natural Gas Total
Net Customer Savings (NPV $MM) $277000 $76500 $353500
Annual Customer Savings $MM $18000 $5000 $23000
Net Societal Savings (NPV $MM) $270000 $74000 $344000
Annual Net Societal Savings ($MM) $17500 $5000 $22500
Decrease in Revenue Requirement (NPV $MM) $336000 $89000 $425000
Annual Decrease in Revenue Requirement ($MM) $22000 $6000 $28000
Energy Savings Electric Natural Gas Total
Percent of Growth Saved Year 15 61 52
Percent of Consumption Saved Year 15 12 5
Peak Load Reduction Year 15 (De-rated)1 34000 MW
Energy Saved Year 15 588000 GWh 1200 BcF
Energy Saved (cumulative) 9400000 GWh 19000 BcF
Emission Reductions Electric Natural Gas Total
CO2 Emission Reduction (1000 Tons) Year 15 338000 72000 410000
NOx Emission Reduction (Tons) Year 15 67000 61000 128000
Other Assumptions Electric Natural Gas
Load Growth () 2 1
Utility NPV Discount Rate 5 5
Customer NPV Discount Rate 5 5
EE Project Life Term (years) 15 15
Source Energy Efficiency Benefits Calculator developed for the National Action Plan for Energy Efficiency 2006
NPV = net present value $MM = million dollars1 De-rated peak load reduction based on the coincident peak load reduced multiplied by the percent of growth-related capital expenditures that are saved
Peak load reductions in unconstrained areas are not counted
1-8 National Action Plan for Energy Efficiency
As a nation we are passing up these savings by subshystantially underinvesting in energy efficiency One indishycator of this underinvestment is the level of energy efficiency program funding across the country Based on the effectiveness of current energy efficiency proshygrams operated in certain parts of the country the funding necessary to yield the economic and environshymental benefits presented above is approximately four times the funding levels for organized efficiency proshygrams today (less than $2 billion per year) Again this is one indicator of underinvestment and not meant to be a national funding target Appropriate funding levels need to be established at the regional state or utility level based on the cost-effective potential for energy efficiency as well as other factors
The current underinvestment in energy efficiency is due to a number of well-recognized barriers Some key barshyriers arise from choices concerning regulation of electric and natural gas utilities These barriers include
bull Market barriers such as the well-known ldquosplit-incenshytiverdquo barrier which limits home buildersrsquo and commershycial developersrsquo motivation to invest in new building energy efficiency because they do not pay the energy bill and the transaction cost barrier which chronically affects individual consumer and small business decision-making
bull Customer barriers such as lack of information on enershygy saving opportunities lack of awareness of how energy efficiency programs make investments easier through low-interest loans rebates etc lack of time and attention to implementing efficiency measures and lack of availability of necessary funding to invest in energy efficiency
bull Public policy barriers which often discourage efficienshycy investments by electric and natural gas utilities transmission and distribution companies power proshyducers and retail electric providers Historically these organizations have been rewarded more for building infrastructure (eg power plants transmission lines pipelines) and increasing energy sales than for helping their customers use energy wisely even when the energy-saving measures might cost less10
bull Utility state and region planning barriers which do not allow energy efficiency to compete with supply-side resources in energy planning
bull Energy efficiency program barriers which limit investshyment due to lack of knowledge about the most effecshytive and cost-effective energy efficiency program portfolios programs for overcoming common market barriers to energy efficiency or available technologies
While a number of energy efficiency policies and proshygrams contribute to addressing these barriers such as building codes appliance standards and state governshyment leadership programs energy efficiency programs organized through electricity and gas providers also encourage greater energy efficiency in the homes buildings and facilities that exist today that will conshysume the majority of the energy used in these sectors for years to come
10 Many energy efficiency programs have an average lifecycle cost of $003kWh saved which is 50-75 of the typical cost of new power sources (ACEEE 2004 EIA 2006)
To create a sustainable aggressive national commitment to energy efficiency 1-9
The National Action Plan for Energy
Efficiency
To drive a sustainable aggressive national commitment to energy efficiency through gas and electric utilities utility regulators and partner organizations more than 50 leading organizations joined together to develop this National Action Plan for Energy Efficiency The Leadership Group members (Table 1-2) have developed this National Action Plan for Energy Efficiency Report which
bull Reviews the barriers limiting greater investment in energy efficiency by gas and electric utilities and partshyner organizations
bull Presents sound business strategies that are available to overcome these barriers
bull Documents a set of business cases showing the impacts on key stakeholders as utilities under different circumstances increase energy efficiency programs
bull Presents best practices for energy efficiency program design and operation
bull Presents policy recommendations and options for spurring greater investment in energy efficiency by utilshyities and energy consumers
The report chapters address four main policy and proshygram areas (see Figure 1-3)
bull Utility Ratemaking and Revenue Requirements Lost sales from the expanded use of energy efficiency have a negative effect on the financial performance of elecshytric and natural gas utilities particularly those that are investor-owned under conventional regulation Cost-recovery strategies have been designed and impleshymented to successfully ldquodecouplerdquo utility financial health from electricity sales volumes to remove finanshycial disincentives to energy efficiency and incentives have been developed and implemented to make enershygy efficiency investments as financially rewarding as capital investments
The goal of the National Action Plan for Energy Efficiency is to create a sustainshyable aggressive national commitment to energy efficiency through gas and electric utilities utility regulators and partner organizations
The Leadership Group bull Recognizes that utilities and regulators have critishy
cal roles in creating and delivering energy efficienshycy programs to their communities
bull Recognizes that success requires the joint efforts of the customer utility regulator and partner organizations
bull Will work across their spheres of influence to remove barriers to energy efficiency
bull Commits to take action within their own organishyzation to increase attention and investment in energy efficiency
Leadership Group Recommendations bull Recognize energy efficiency as a high-priority
energy resource
bull Make a strong long-term commitment to impleshyment cost-effective energy efficiency as a resource
bull Broadly communicate the benefits of and opporshytunities for energy efficiency
bull Promote sufficient timely and stable program funding to deliver energy efficiency where cost-effective
bull Modify policies to align utility incentives with the delivery of cost-effective energy efficiency and modify ratemaking practices to promote energy efficiency investments
1-10 National Action Plan for Energy Efficiency
bull Planning Processes Energy efficiency along with other customer-side resources are not fully integrated into state and utility planning processes that identify the need to acquire new electricity and natural gas resources
bull Rate Design Some regions are successfully using rate designs such as time-of-use (TOU) or seasonal rates to more accurately reflect the cost of providing electricity and to encourage customers to consume less energy
bull Energy Efficiency Program Best Practices Documentation One reason given for slow adoption of energy efficiency
is a lack of knowledge about the most effective and cost-effective energy efficiency program options However many states and electricity and gas providers are successfully operating energy efficiency programs across end-use sectors and customer classes including residential commercial industrial low-income and small business These programs employ a variety of approaches including providing public information and training offering financing and financial incenshytives allowing energy savings bidding and offering performance contracting
Figure 1-3 National Action Plan for Energy Efficiency Report Addresses Actions to Encourage Greater Energy Efficiency
Timeline Actions to Encourage Greater Energy Efficiency
Utility Resource Program Policy Structure Planning Implementation
Develop Utility Incentives for Energy Efficiency
Develop Rate Designs to Encourage Energy Efficiency
Include Energy Efficiency in Utility Resource Mix
Measurement amp Evaluation
Program Roll-out
Develop Effective Energy Efficiency Programs
Revise Plans and Policies Based on Results
Action Plan Report Chapter Areas and Key Barriers
Utility Ratemaking amp Revenue
Requirements
Energy efficiency reduces utility earnings
Planning Processes
Planning does not incorporate demand-
side resources
Rate Design
Rates do not encourage energy
efficiency investments
Model Program
Documentation
Limited information on existing best practices
To create a sustainable aggressive national commitment to energy efficiency 1-11
Business Cases for Energy Efficiency
A key element of the National Action Plan for Energy Efficiency is exploring the benefits of energy efficiency and the mechanisms and policies that might need to be modified so that each of the key stakeholders can beneshyfit from energy efficiency investments A key issue is that adoption of energy efficiency saves resources and utility costs but also reduces utility sales Therefore the effect on utility financial health must be carefully evaluated To that end the Leadership Group offers an Energy Efficiency Benefits Calculator (Calculator) that evaluates the financial impact of energy efficiency on its major stakeholdersmdashutilities customers and society The
Calculator allows stakeholders to examine different effishyciency and utility cases with transparent input assumpshytions
The business cases presented in Chapter 4 of this report show the impact of energy efficiency investments upon sample utilityrsquos financial health and earnings upon cusshytomer energy bills and upon social resources such as net efficiency costs and pollutant emissions In general the impacts of offering energy efficiency programs vershysus not offering efficiency follow the trends and findshyings illustrated below from the customer utility and society perspectives
Utility Perspective Energy efficiency affects utility revenues shareholder earnings and costs associated with capital investments The utility can be financially neutral to investments in energy efficiency at a minimum or encourage greater investment through the implementation of a variety of decoupling ratemaking and incentives policies These policies can ensure that shareholder returns and earnings could be the same or increased Utility investment in infrastructure and contractual obligations for energy procurement could be reduced providing a favorable balance sheet impact
Utility Returns ndash No Change or Increase
Utility earnings remain stable or increase if decoupling or the use of shareholder incenshytives accompanies an energy efficiency program Without incentives earnings might be lower because effective energy efficiency will reduce the utilityrsquos sales volume and reduce the utilityrsquos rate base and thus the scope of its earnings
Change in Utility Earnings ndash Results Vary
Depending on the inclusion of decoupling andor shareholder incentives utility earnshyings vary Utility earnings increase if decoupling or shareholder incentives are included If no incentives earnings might be lower due to reduced utility investment
Peak Load Growth and Associated Capital Investment ndash Decreases
Capital investments in new resources and energy delivery infrastructure are reduced because peak capacity savings are captured due to energy efficiency measures
Customer Perspective Customersrsquo overall bills will decrease with energy efficiency because lower energy usage offsets potential rate increases to cover the cost of offering the efficiency program
Customer Bills ndash Decrease
Total customer bills decline over time as a result of investment in cost-effective energy efficiency programs as customers save due to lower energy consumption This decline follows an initial rise in customer bills reflecting the cost of energy efficiency programs which will then reduce costs over many years
1-12 National Action Plan for Energy Efficiency
Customer Perspective (continued)
Customer Rates ndash Mild Increase12
Rates might increase slightly to cover the cost of the energy efficiency program
Community or Society Perspective From a broad communitysociety perspective energy efficiency produces real savshyings over time While initially energy efficiency can raise energy costs slightly to finance the new energy efficiency investment the reduced bills (as well as price moderation effects) provide a rapid payback on these investments especially compared to the ongoing costs to cover the investments in new energy production and delivery infrastrucshyture costs Moreover the environmental benefits of energy efficiency continue to grow The Calculator evaluates the net societal savings utility savings emissions reductions and the avoided growth in energy demand associated with energy efficiency
Net Resources Savings ndash Increases
Over time as energy efficiency programs ramp up cumulative energy efficiency savshyings lead to cost savings that exceed the energy efficiency program cost
Total Resource Cost (TRC) per Unit - Declines
Total cost of providing each unit of energy (MWh MMBtu gas) declines over time because of the impacts of energy savings decreased peak load requirements and decreased costs during peak periods Well-designed energy efficiency programs can deliver energy at an average cost less than that of new power sources
Emissions and Cost Savings ndash Increases
Efficiency prevents or avoids producing many annual tons of emissions and emission control costs
Growth Offset by EE ndash Increases
As energy efficiency programs ramp up the percent of growth that is offset by energy efficiency climbs and then levels as cumulative savings as a percent of demand growth stabilizes
12 The changes shown in the business cases indicate a change from what would have otherwise occurred This change does not include a one-time infrashystructure investment in the assumptions but it does include smooth capital expenditures Energy efficiency will moderate prices of fossil fuels The fuel price reductions from an aggressive energy efficiency program upon fuel prices have not been included and could result in an overall rate reduction
To create a sustainable aggressive national commitment to energy efficiency 1-13
About This Report
The National Action Plan for Energy Efficiency is strucshytured as follows
Chapter 2 Utility Ratemaking amp Revenue Requirements
bull Reviews mechanisms for removing disincentives for utilities to consider energy efficiency
bull Reviews the pros and cons for different strategies to reward utility energy efficiency performance including the use of energy efficiency targets shared savings approaches and shareholdercompany performance incentives
bull Reviews various funding options for energy efficiency programs
bull Presents recommendations and options for modifying policies to align utility incentives with the delivery of cost-effective energy efficiency and providing for suffishycient and stable program funding to deliver energy effishyciency where cost effective
Chapter 3 Energy Resource Planning Processes
bull Reviews state and regional planning approaches including Portfolio Management and Integrated Resource Planning which are being used to evaluate a broad array of supply and demand options on a level playing field in terms of their ability to meet projected energy demand
bull Reviews methods to quantify and simplify the value streams that arise from energy efficiency investmentsmdash including reliability enhancementcongestion relief peak demand reductions and greenhouse gas emissions reductionsmdashfor direct comparison to supply-side options
bull Presents recommendations and options for making a strong long-term commitment to cost-effective energy efficiency as a resource
Chapter 4 Business Case for Energy Efficiency
bull Outlines the business case approach used to examine the financial implications of enhanced energy efficienshycy investment on utilities consumers and society
bull Presents case studies for eight different electric and natural gas utility situations including different ownershyship structures gas and electric utilities and different demand growth rates
Chapter 5 Rate Design
bull Reviews a variety of rate design structures and their effect in promoting greater investment in energy effishyciency by the end-user
bull Presents recommended strategies that encourage greater use of energy efficiency through rate design
Chapter 6 Energy Efficiency Program Best Practices
bull Reviews and presents best practices for operating sucshycessful energy efficiency programs at a portfolio level addressing issues such as assessing energy efficiency potential screening energy efficiency programs for cost-effectiveness and developing a portfolio of approaches
bull Provides best practices for successful energy efficiency programs across end-use sectors customer classes and a broad set of approaches
bull Documents the political and administrative factors that lead to program success
Chapter 7 Report Summary
bull Summarizes the policy and program recommendations and options
1-14 National Action Plan for Energy Efficiency
For More Information
Visit the National Action Plan for Energy Efficiency Web site wwwepagovcleanenergyeeactionplanhtm or contact
Stacy Angel
US Environmental Protection Agency Office of Air and Radiation Climate Protection Partnerships Division AngelStacyepagov
Larry Mansueti
US Department of Energy Office of Electricity Delivery and Energy Reliability LawrenceMansuetihqdoegov
To create a sustainable aggressive national commitment to energy efficiency 1-15
Table 1-2 Members of the National Action Plan for Energy Efficiency
Co-Chairs
Diane Munns Member Iowa Utilities Board President National Association of Regulatory Utility Commissioners
Jim Rogers President and Chief Executive Officer Duke Energy
Leadership Group
Barry Abramson Senior Vice President Servidyne Systems LLC
Angela S Beehler Director of Energy Regulation Wal-Mart Stores Inc
Bruce Braine Vice President Strategic Policy Analysis American Electric Power
Jeff Burks Director of Environmental Sustainability PNM Resources
Kateri Callahan President Alliance to Save Energy
Glenn Cannon General Manager Waverly Light and Power
Jorge Carrasco Superintendent Seattle City Light
Lonnie Carter President and Chief Executive Officer Santee Cooper
Mark Case Vice President for Business Performance Baltimore Gas and Electric
Gary Connett Manager of Resource Planning and Great River Energy Member Services
Larry Downes Chairman and Chief Executive Officer New Jersey Natural Gas (New Jersey Resources Corporation)
Roger Duncan Deputy General Manager Distributed Energy Services Austin Energy
Angelo Esposito Senior Vice President Energy Services and Technology New York Power Authority
William Flynn Chairman New York State Public Service Commission
Jeanne Fox President New Jersey Board of Public Utilities
Anne George Commissioner Connecticut Department of Public Utility Control
Dian Grueneich Commissioner California Public Utilities Commission
Blair Hamilton Policy Director Vermont Energy Investment Corporation
Leonard Haynes Executive Vice President Supply Technologies Southern Company Renewables and Demand Side Planning
Mary Healey Consumer Counsel for the State of Connecticut Connecticut Consumer Counsel
Helen Howes Vice President Environment Health and Safety Exelon
Chris James Air Director Connecticut Department of Environmental Protection
Ruth Kinzey Director of Corporate Communications Food Lion
Peter Lendrum Vice President Sales and Marketing Entergy Corporation
Rick Leuthauser Manager of Energy Efficiency MidAmerican Energy Company
Mark McGahey Manager Tristate Generation and Transmission Association Inc
Janine Migden- Consumersrsquo Counsel Office of the Ohio Consumersrsquo Counsel Ostrander
Richard Morgan Commissioner District of Columbia Public Service Commission
Brock Nicholson Deputy Director Division of Air Quality North Carolina Air Office
Pat Oshie Commissioner Washington Utilities and Transportation Commission
Douglas Petitt Vice President Government Affairs Vectren Corporation
1-16 National Action Plan for Energy Efficiency
Bill Prindle Deputy Director American Council for an Energy-Efficient Economy
Phyllis Reha Commissioner Minnesota Public Utilities Commission
Roland Risser Director Customer Energy Efficiency Pacific Gas and Electric
Gene Rodrigues Director Energy Efficiency Southern California Edison
Art Rosenfeld Commissioner California Energy Commission
Jan Schori General Manager Sacramento Municipal Utility District
Larry Shirley Division Director North Carolina Energy Office
Michael Shore Senior Air Policy Analyst Environmental Defense
Gordon Slack Energy Business Director The Dow Chemical Company
Deb Sundin Director Business Product Marketing Xcel Energy
Dub Taylor Director Texas State Energy Conservation Office
Paul von Director Energy and Environmental Affairs Johnson Controls Paumgartten
Brenna Walraven Executive Director National Property Management USAA Realty Company
Devra Wang Director California Energy Program Natural Resources Defense Council
Steve Ward Public Advocate State of Maine
Mike Weedall Vice President Energy Efficiency Bonneville Power Administration
Tom Welch Vice President External Affairs PJM Interconnection
Jim West Manager of energy right amp Green Power Switch Tennessee Valley Authority
Henry Yoshimura Manager Demand Response ISO New England Inc
Observers
James W (Jay) Counsel Steel Manufacturers Association Brew
Roger Cooper Executive Vice President Policy and Planning American Gas Association
Dan Delurey Executive Director Demand Response Coordinating Committee
Roger Fragua Deputy Director Council of Energy Resource Tribes
Jeff Genzer General Counsel National Association of State Energy Officials
Donald Gilligan President National Association of Energy Service Companies
Chuck Gray Executive Director National Association of Regulatory Utility Commissioners
John Holt Senior Manager of Generation and Fuel National Rural Electric Cooperative Association
Joseph Mattingly Vice President Secretary and General Counsel Gas Appliance Manufacturers Association
Kenneth Mentzer President and Chief Executive Officer North American Insulation Manufacturers Association
Christina Mudd Executive Director National Council on Electricity Policy
Ellen Petrill Director PublicPrivate Partnerships Electric Power Research Institute
Alan Richardson President and Chief Executive Officer American Public Power Association
Steve Rosenstock Manager Energy Solutions Edison Electric Institute
Diane Shea Executive Director National Association of State Energy Officials
Rick Tempchin Director Retail Distribution Policy Edison Electric Institute
Mark Wolfe Executive Director Energy Programs Consortium
To create a sustainable aggressive national commitment to energy efficiency 1-17
References
American Council for an Energy-Efficient Economy [ACEEE] (2004) A Federal System Benefits Fund Assisting States to Establish Energy Efficiency and Other System Benefit Programs Washington DC
Callahan K Alliance to Save Energy (2006 January 17) Energy Efficiency As a Cornerstone of National Energy Policy Presented to United States Energy Association Washington DC
Connecticut Energy Conservation Management Board [CECMB] (2006 March) Energy Efficiency Investing in Connecticutrsquos Future Report of The Energy Conservation Management Board Year 2005 Programs and Operations lthttpwwwdpucstatectusElectricnsfcafda4284 95eb61485256e97005e054b5abe828f8be753568 525713900520270$FILEFINAL20ECMB20200 520Reportpdfgt
Eckman T (2005 September 26) The Northwest Forecast Energy Efficiency Dominates Resource Development Paper presented at the ACEEE Energy Efficiency As a Resource Conference lthttpwwwnwcouncilorgenergypresentdefaulthtmgt
Innovest Strategic Value Advisors [Innovest] (2002 October) Energy Management amp Investor Returns The Real Estate Sector
Long Island Power Authority [LIPA] (2006) Clean Energy Initiative Annual Report 2005
Nadel S Shipley A and Elliott RN (2004) The Technical Economic and Achievable Potential for Energy Efficiency in the USmdashA Meta-Analysis of Recent Studies Washington DC American Council for an Energy-Efficient Economy [ACEEE]
New York State Energy Research and Development Authority [NYSERDA] (2006 May) New York Energy $martSM Program Evaluation and Status Report Report to the System Benefits Charge Advisory Group Draft Report
New York State Energy Research and Development Authority [NYSERDA] (2004 May) New York Energy $martSM Program Evaluation and Status Report Report to the System Benefits Charge Advisory Group Final Report Albany
Northeast Energy Efficiency Partnerships [NEEP] (2005 May) Economically Achievable Energy Efficiency Potential in New England Optimal Energy
Northwest Power and Conservation Council [NWPCC] (2005 May) The 5th Northwest Electric Power and Conservation Plan lthttpwwwnwcouncilorg energy powerplandefaulthtmgt
Puget Sound Energy (2005 April) Least Cost Plan lthttpwwwpsecomenergyEnvironment electricSupplyResPlanningaspxgt
Sedano R Murray C and Steinhurst W R (2005 May) Electric Energy Efficiency and Renewable Energy in New England An Assessment of Existing Policies and Prospects for the Future Montpelier VT The Regulatory Assistance Project
Southern California Edison (2006 January 6) Advice Letter (1955-e) to the California Energy Commission
Southwest Energy Efficiency Project [SWEEP] (2002 November) The New Mother Lode The Potential for More Efficient Electricity Use in the Southwest Report for the Hewlett Foundation Energy Series
US Energy Information Administration [EIA] (2006) Annual Energy Outlook 2006 Washington DC)
US Energy Information Administration [EIA] (2005 January) Annual Energy Outlook 2005 Washington DC) lthttpwwweiadoegovoiaf archiveaeo05indexhtmlgt
US Environmental Protection Agency [EPA] (2006) Clean Energy-Environment Guide to Action Policies Best Practices and Action Steps for States Washington DC
Western Governorsrsquo Association [WGA] (2006 June) Clean Energy a Strong Economy and a Healthy Environment A Report of the Clean and Diversified Energy Advisory Committee
York D and Kushler M (2005 October) ACEEErsquos 3rd
National Scorecard on Utility and Public Benefits Energy Efficiency Programs A National Review and Update of State Level Activity httpwwwaceeeorgpubsu054pdf
1-18 National Action Plan for Energy Efficiency
2Utility Ratemaking amp Revenue Requirements
While some utilities manage aggressive energy efficiency programs as a strategy to diversify their portfolio lower costs and meet customer demand many still face important financial disincentives to implementing such programs Regulators working with utilities and other stakeholders as well as boards working with publicly owned utilities can establish or reinforce several policies to help address these disincentives includshying overcoming the throughput incentive ensuring program cost recovery and defining shareholder performance incentives
Overview
The practice of utility regulation is in part a choice about how utilities make money and manage risk These regulatory choices can guide utilities toward or away from investing in energy efficiency demand response and distributed generation (DG) Traditional ratemaking approaches have strongly linked a utilityrsquos financial health to the volume of electricity or gas sold via the ratemaking structure creating a disincentive to investshyment in cost-effective demand-side resources that reduce sales The ratemaking structure and process establishes the rates that generate the revenues that gas and electric utilities both public and private can recover based on the just and reasonable costs they incur to operate the system and to procure and deliver energy resources to serve their customers
Alternate financial incentive structures can be designed to encourage utilities to actively promote implementashytion of energy efficiency when it is cost effective to do so Aligning utility and public interest aims by disconshynecting profits and fixed cost recovery from sales volshyumes ensuring program cost recovery and rewarding shareholders can ldquolevel the playing fieldrdquo to allow for a fair economically based comparison between supply-and demand-side resource alternatives and can yield a lower cost cleaner and reliable energy system
This chapter explores the utility regulatory approaches that limit greater deployment of energy efficiency as a resource in US electricity and natural gas systems Generally it is within the power of utility commissions and utilities to remove these barriers1 Eliminating the throughput incentive is one way to remove a disincentive to invest in efficiency Offering shareholder incentives will further encourage utility investment Other disincen-
Leadership Group Recommendations
Applicable to Utility Ratemaking and
Revenue Requirements
bull Modify policies to align utility incentives with the delivshyery of cost-effective energy efficiency and modify ratemaking practices to promote energy efficiency investments
bull Make a strong long-term commitment to implement cost-effective energy efficiency as a resource
bull Broadly communicate the benefits of and opportunities for energy efficiency
bull Provide sufficient timely and stable program funding to deliver energy efficiency where cost-effective
A more detailed list of options specific to the objective of promoting energy efficiency in ratemaking and revenue requirements is provided at the end of this chapter
1 In some cases state law limits the latitude of a commission to grant ratemaking or earnings flexibility Removing barriers to energy efficiency in these states faces the added challenge of amending statutes
To create a sustainable aggressive national commitment to energy efficiency 2-1
tives for energy efficiency include a short-term resource acquisition horizon and wholesale market rules that do not capture the system value of energy efficiency After an introduction to these barriers and solutions this chapter will report on successful efforts in states to implement these solutions The chapter closes with a set of recommendations for pursuing the removal of these barriers
This chapter refers to utilities as integrated energy comshypanies selling electricity as well as delivering it Many of these concepts however also apply to states that removed retail electricity sales responsibilities from utilishytiesmdashturning the utility into an electric transmission and distribution company without a retail sales function
Barriers and Solutions to Effective
Energy Efficiency Deployment
Common disincentives for utilities to invest more in cost-effective energy efficiency programs include the ldquothroughput incentiverdquo the lack of a mechanism for utilities to recover the costs of and provide funding for energy efficiency programs and a lack of shareholder and other performance incentives to compete with those for investments in new generation
Traditional Regulation Motivates Utilities to Sell More The Throughput Incentive
Rates change with each major ldquorate caserdquo the traditionshyal and dominant form of state-level utility ratemaking2
Between rate cases utilities have a financial incentive to increase retail sales of electricity (relative to forecast or historic levels which set ldquobaserdquo rates) and to maximize the ldquothroughputrdquo of electricity across their wires This incentive exists because there is often a significant increshymental profit margin on incremental sales When rates
are reset the throughput incentive resumes with the new base In jurisdictions where prices are capped for an extended time the utility might be particularly anxious to grow sales to add revenue to cover cost increases that might occur during the freeze
With traditional ratemaking there are few mechanisms to prevent ldquoover-recoveryrdquo of costs which occurs if sales are higher than projected and no way to prevent ldquounder-recoveryrdquo which can happen if forecast sales are too optimistic (such as when weather or regional ecoshynomic conditions deviate from forecasted or ldquonormalrdquo conditions)3
This dynamic creates an automatic disincentive for utilishyties to promote energy efficiency because those actions will reduce the utilityrsquos net incomemdasheven if energy effishyciency is clearly established and agreed-upon as a less expensive means to meet customer needs as a least-cost resource and is valuable to the utility for risk manageshyment congestion reduction and other reasons (EPA 2006) The effect of this disincentive is exacerbated in the case of distribution-only utilities because the revshyenue impact of electricity sales reduction is disproporshytionately larger for utilities without generation resources While some states have ordered utilities to implement energy efficiency others have questioned the practicality of asking a utility to implement cost-effective energy efficiency when their financial self-interest is to have greater sales
Several options exist to help remove this financial barrier to greater investment in energy efficiency
Decouple Sales from Profits and Fixed Cost Recovery
Utilities can be regulated or managed in a manner that allows them to receive their revenue requirement with less linkage to sales volume The point is to regulate utilities such that reductions in sales from consumer-funded energy
2 Public power utilities and cooperative utilities have their own processes to adjust rates that do not require state involvement 3 Over-recovery means that more money is collected from consumers in rates than is needed to pay for allowed costs including return on investment This
happens because average rates tend to collect more for sales in excess of projected demand than the marginal cost to produce and deliver the electricshyity for those increased sales Likewise under-recovery happens if sales are less than the amount used to set rates (Moskovitz 2000)
2-2 National Action Plan for Energy Efficiency
Utility and Industry Structure and Energy Efficiency
Publicly and Cooperatively Owned Utilities
Compared With Investor-Owned Utilities
The throughput incentive affects municipal and coopshyerative utilities in a distinctive way Public power and co-ops and their lenders are concerned with ensuring that income covers debt costs while they are not conshycerned about ldquoprofitsrdquo Available low-cost financing for co-ops sometimes comes with restrictions that limit its use to power lines and generation further diminishing interest in energy efficiency investments
Natural Gas vs Electric Utilities
Natural gas and electric utilities both experience the throughput incentive under traditional ratemaking Natural gas utilities operate in a more competitive environment than do electric utilities because of the non-regulated alternative fuels but this situation can cut either way for energy efficiency For some gas utilshyities energy efficiency is an important customer servshyice tool while in other cases it is just seen as an imposed cost that competitors do not have Natural gas companies in the United States also generally see a decline in sales due to state-of-the-art efficiencies in gas end uses a phenomenon not seen by electric companies Yet cost-effective efficiency opportunities for local gas distribution companies remain available
efficiency building codes appliance standards and distribshyuted generation are welcomed and not discouraged
For example if utility revenues were connected to the number of customers instead of sales the utility would experience different incentives and might behave quite difshyferently Under this approach at the conclusion of a conshyventional revenue requirement proceeding a utilityrsquos revshyenues per customer could be fixed An automatic adjustshyment to the revenue requirement would occur to account for new or departing customers (a more reliable driver of
Restructured vs Traditional Markets
The transition to retail electric competition threw open for reconsideration all assumptions about utility strucshyture The effects on energy efficiency have been strongly positive and negative The throughput incenshytive is stronger for distribution-only companies with no generation and transmission rate base Price caps which typically are imposed in a transition to retail competition diminish utility incentive to reduce sales because added revenue helps cope with new costs Price caps also discourage utilities from adding near-term costs that can produce a long-term benefit such as energy efficiency As a result energy efficiency is often disconnected from utility planning On the other hand several states have provided stable funding for energy efficiency as part of the restructuring process
High-Cost vs Low-Cost States
Energy efficiency has been more popular in high-cost states Low-cost states tend to see energy efficiency as more expensive than their supplies from hydroelectric and coal sources though there are exceptions where efficiency is seen as a low-cost incremental resource and a way to meet environmental goals Looking forshyward all states face similar higher cost options for new generation suggesting that the current resource mix will be less important than future resource options in considering the value of new energy efficiency investments
costs than sales) An alternative to the revenue per cusshytomer approach is to use a simple escalation formula to forecast the fixed cost revenue requirement over time
Under this type of rate structure a utility that is more effishycient and reduces its costs over time through energy effishyciency will be able to increase profits Furthermore if sales are reduced by any means (eg efficiency weather or ecoshynomic swings) revenues and profits will not be affected
To create a sustainable aggressive national commitment to energy efficiency 2-3
This approach eliminates the throughput disincentive and does not require a commission resolution of the amount of lost revenues associated with energy efficiency (see Table 2-1) A critical element of revenue decoupling is a true-up of actual results to forecasted results Rates would vary up or down reflecting a balancing account for total authorized revenue requirements and actual revshyenues from electricity or gas consumed by customers The true-up is fundamental to accomplish decoupling profits and fixed cost revenues from sales volumes Annual adjustments have been typical and can be modeled in the Energy Efficiency Benefits Calculator (see Chapter 4 Business Case for Energy Efficiency) but a quarterly or monthly adjustment might be preferred The plan may also include a deadband meaning that modest deviashytions from the forecast would produce no change in rates while larger deviations will result in a rate change The plan might also share some of the deviations between customers and the utility The magnitude of rate changes at any one time can be capped if the utility and regulators agree to defer the balance of exceptional changes to be resolved later Prudence reviews should be unaffected by a decoupling plan A decoupling plan would typically last a few years and could be changed to reflect new circumstances and lessons learned Decoupling has the potential to lower the risk of the utilshyity and this feature should lead to consumer benefits through an overall lower cost of capital to the utility4
Decoupling through a revenue per customer cap is presently more prevalent in natural gas companies but can be a sound tool for electric companies also Rate design need not be affected by decoupling (see Chapter 5 Rate Design for rate design initiatives that promote energy efficiency) and a shift of revenues from the varishyable portion of rates to the fixed portion does not address the throughput incentive The initial revenue requirement would be determined in a routine rate case the revenue per customer calculation would flow from
the same billing determinants used to set rates Service performance measures can be added to assure that cost reductions result from efficiency rather than service reductions Some state laws limit the use of balancing accounts and true-ups so legislative action would be necessary to enable decoupling in those states
A decoupling system can be simple or complex dependshying on the needs of regulators the utility or other parshyties and the value of a broad stakeholder process leading up to a decoupling system (Kantor 2006) As the text box addressing lessons learned suggests it is important to establish the priorities that the system is being creatshyed to address so it can be as simple as possible while avoiding unintended consequences Additionally it is important to evaluate any decoupling system to ensure it is performing as expected5
Shifting More Utility Fixed Costs Into Fixed Customer
Charges
Traditionally rates recover a portion of the utilityrsquos fixed costs through volumetric rates which helps service remain affordable To better assure recovery of capital asset costs with reduced dependence on sales state utilshyity commissions could reduce variable rates and increase the fixed rate component often referred to as the fixed charge or customer charge This option might be particshyularly relevant in retail competition states because wires-only electric utilities have relatively high proportions of fixed costs This shift is attractive to some natural gas systems experiencing sales volume attrition due to improved furnace efficiency and other trends This shift reduces the throughput incentive for distribution compashynies and is an alternative to decoupling There are some limiting concerns including the effect a reduction in the variable charge might have on consumption and conshysumers motivation to practice energy efficiency and the potential for high using consumers to benefit from the change while low-using customers pay more
4 The lowering of a gas utilityrsquos cost of capital because of the reduced risk introduced by a revenue decoupling mechanism was recently affirmed by Barone (2006)
5 Two recent papers discuss decoupling in some detail Costello 2006 and NERA 2006
2-4 National Action Plan for Energy Efficiency
The First Wave of Decoupling and Lessons Learned
In the early 1990s several state commissions and utilshyities responded to the throughput incentive by creatshying decoupling systems In all cases decoupling was discontinued by the end of the decade The reasons for discontinuation provide guidance to those considshyering decoupling today and indicate that the initial idea was good but that the execution left important issues unaddressed
In the case of California decoupling was functioning well using forecasted revenues and true-ups to actushyals but the move to retail competition precipitated its end in 1996 (CPUC 1996) Following the energy crishysis of 2000-2001 California recognized the imporshytance of long-term energy efficiency investments and reinstated mechanisms to eliminate the throughput incentive
Puget Sound Energy in Washington adopted a decoushypling plan in 1990 There were several problems The split between variable power costs (recovered via a true-up based on actual experience) and fixed costs (recovered based on a revenue-per-customer calculashytion) was wrong While customer numbers (and revenue) were increasing new investments in transshymission were not needed so the fixed cost part of the plan over-recovered Meanwhile new generation from independent generators was too expensive and this added power cost (minus a prudence disalshylowance which further complicated the scene) was passed to ratepayers Unlike the current California decoupling method there was no reasonable forecast over time for power costs Risk of power cost increasshyes was insufficiently shared The results were a big rate increase and anger among customers In retrospect risk allocation and the split of fixed and variable costs were incompatible to the events that followed and offer a useful lesson to future attempts The true-up
process and the weather normalization process worked well The power costs that ignited the controshyversy over the decoupling plan would have been recoverable in rates under the traditional system A recent effort to restore decoupling with Puget foundered over a dispute about whether the allowed return on equity during a prior rate case should be changed if decoupling was reinstated (Jim Lazar pershysonal communication October 21 2005)
Central Maine Power also adopted a decoupling plan at the beginning of the 1990s The plan was ill-equipped however to account for an ensuing steep economic downturn that reduced sales by several pershycentage points Unfortunately this effect far outshyweighed any benefits from energy efficiency The true-ups called for in the plan were onerous due to the dip in sales and authorities decided to delay them in hopes that the economy would turn around When that did not happen the rate change was quite large and was attributed to the decoupling plan even though most of the rate increase was due to reduced sales and would have occurred anyway A lesson from this experience is to not let the period between true-ups go on too long and to consider more carefully what happens if market prices the economy the weather or other significant drivers are well outside expected ranges
In both the Puget and Central Maine cases responsibilshyity for large rate increases was misassigned to the decoupling plan when high power costs from indeshypendent power producers (Puget) or general economic conditions (Central Maine) were primarily responsible That said serious but correctable flaws in the decoushypling plans left consumers exposed to more risk than was necessary
To create a sustainable aggressive national commitment to energy efficiency 2-5
Provide Utilities the Profit Lost Through Efficiency
Another way to address the throughput incentive is to calculate the profits foregone to successful energy effishyciency Lost Revenue Adjustment Mechanisms (LRAM) allow a utility to directly recoup the ldquolostrdquo profits and contributions to fixed costs associated with not selling additional units of energy because of the success of energy efficiency programs in reducing electricity conshysumption The amount of lost profit can be estimated by multiplying the fixed portion of the utilityrsquos prices by the
energy savings from energy efficiency programs or the energy generated from DG based on projected savings or ex post impact evaluation studies The amount of lost estimated profits is then directly returned to the utilityrsquos shareholders Some states have adopted these mechashynisms either through rate cases or add-ons to the fuel adjustment clause calculations
Experience has shown that LRAM can allow utilities to recover more profits than the energy efficiency program
Table 2-1 Options to Mitigate the Throughput Incentive Pros and Cons
Policy Pros Cons
Traditional cost of service plus return regulation
bull Familiar system for regulators and utilities
bull Rate changes follow rate cases (except for fuelpurchased gas adjustment clause states)
bull Reduced sales reduce net income and contributions to fixed costs
bull Sales forecasts can be contentious
bull Harder to connect good utility performance to a financial consequence Risks outside control of utility might be assigned to the utility
Decoupling (use of a forecast of revenue or revenue per customer with true-ups to actual results during a defined timeframe)
bull Removes sales incentive and distributed resource disincenshytives
bull Authorized fixed costs covered by revenue
bull All beneficial actions and policies that reduce sales (distribshyuted generation energy efficiency programs codes and standards voluntary actions by customers demand response) can be promoted by the utility without adversely affecting net income or coverage of fixed costs Opportunity to easily reward or penalize utilities based on performance
bull True-ups from balancing accounts or revenue per customer are simple
bull Easy to add productivity factors inflation adjustments and performance indicators with rewards and penalties that can be folded into the true-up process
bull Reduces volatility of utility revenue resulting from many causes Risks from abnormal weather economic performshyance or energy markets can be allocated explicitly between customers and the utility
bull Lack of experience Viewed by some as a more complex process
bull Quality of forecasts is very important
bull Some consumer advocates are uncomfortable with rate adjustments outside rate case or familiar fuel adjustment clause
bull Frequent rate adjustments from true-ups are objectionable to those favoring rate stability who worry about accountashybility for rate increases
bull Process of risk allocation can cause decoupling plan to break down Connection between reconstituted risks and cost of capital can cause impasse
bull Many issues to factor into the decoupling agreement Past experience with decoupling indicates that it can be hard to ldquoget it rightrdquo though these experiences suggest solutions
Lost revenue adjustment bull Restores revenue to utility that would have gone to earnshyings and coverage of fixed costs but is lost by energy effishyciency
bull Diminishes the throughput disincentive for specific qualifyshying programs
bull Any sales reductions from efficiency initiatives outside qualshyifying programs are not addressed leaving the throughput incentive in place
bull Historically contentious complex process to decide on lost revenue adjustment Potentially rewards under-performing energy efficiency programs
Independent energy efficiency administration
bull Administration of energy efficiency is assigned to an entity without the conflict of the throughput incentive
bull Utility can still promote load building Programs that would reduce sales outside the activities of the independent administrator might still be discouraged due to the throughput incentive
2-6 National Action Plan for Energy Efficiency
actually saved because the lost profit is based on projectshyed rather than actual energy savings Resolving LRAM in rate cases has been contentious in some states Furthermore because utilities still earn increased profits on additional sales this approach still discourages utilishyties from implementing additional energy efficiency or supporting independent energy efficiency activities A comparison of decoupling and the LRAM approach is provided in Table 2-1
A variation is to roughly estimate the amount of lost profshyits and make a specified portion (50 to 100 percent) availshyable to the utility to collect based on its performance at achieving certain program goals This approach is simpler and more constructive than a commission docket to calshyculate lost revenue It provides a visible way for the utilishyty to earn back lost profits with program performance and achievements consistent with the public interest This system translates well into employee merit pay systems and the goals can fit nicely into management objectives reported to shareholders a utilityrsquos board of directors or Governors Public interest groups appreciate the connecshytion to performance
Non-Utility Administration
Several states such as Oregon Vermont and New York have elected to relieve utilities from the task of managshying energy efficiency programs In some cases state govshyernment has taken on this responsibility and in others a third party was created or hired for this purpose The utility still has the throughput incentive so while effishyciency administration might be without conflict the utilshyity may still engage in load-building efforts contrary to the messages from the efficiency programs Addressing the throughput incentive remains desirable even where non-utility administration is in place Non-utility energy efficiency administration can apply to either electricity or natural gas Where non-utility energy efficiency adminisshytration is in place cooperation with the utility remains important to ensure that the customer receives good service (Harrington 2003)
Wholesale Power Markets and the Throughput
Incentive
In recent years wholesale electric power prices have increased driven by increases in commodity fuel costs In many parts of the country these increases have created a situation in which utilities with generation or firm power contracts that cost less than clearing prices might make a profit if they can sell excess energy into the wholesale market Some have questioned whether or not the situation of utilities seeing wholesale profits from reduced retail sales diminishes or removes the throughshyput incentive
Empirically these conditions do not appear to have moved utilities to accelerate energy efficiency program deployment In states in which generation is divested from the local utility the companies serving retail cusshytomers see no change to the throughput incentive There is little to suggest how these market conditions will persist or change In the absence of a more definishytive course change evidence suggests that the recent trend should not dissuade policymakers and market parshyticipants from addressing the throughput incentive
Recovering Costs Providing Funding for Energy Efficiency Programs
Removing the throughput incentive is a necessary step in addressing the barriers many utilities face to investing more in energy efficiency It is unlikely to be sufficient by itself in promoting greater investment however because under traditional ratemaking utilities might be unable to cover the costs of running energy efficiency programs6 To ensure funds are available for energy efficiency policy-makers can utilize and establish the following mechanisms with cooperation from stakeholders
Revenue Requirement or Procurement Funding
Policy-makers and regulators can set clear expectations that utilities should consider energy efficiency as a resource in their resource planning processes and it should spend money to procure that resource as it would
6 See Chapter 3 Energy Resource Planning Processes for discussion of utility resource planning budgets being used to fund energy efficiency
To create a sustainable aggressive national commitment to energy efficiency 2-7
for other resources This spending would be part of the utility revenue requirement and would likely appear as part of the resource procurement spending for all resources needed to meet consumer demand in all hours In retail competition states the default service provider the distribution company or a third party can handle the responsibility of acquiring efficiency resources
Spending Budgets
To reduce regulatory disputes and create an atmosphere of stability among utility managers trade allies and cusshytomers the legislature or regulator can determine a budget level for energy efficiency spendingmdashgenerally a percentage of utility revenue This budget level would be set to achieve some amount of the potentially available cost-effective program opportunities The spending budget allows administrator staff trade allies and conshysumers to count on a baseline level of effort and reduces the likelihood of spending disruptions that erode cusshytomer expectations and destroy hard-to-replace market infrastructure needed to deliver energy efficiency Unfortunately spending budgets are sometimes treated as a maximum spending level even if more cost-effective efficiency can be gained Alternatively a spending budgshyet can be treated as a minimum if policymakers also declare efficiency to be a resource In that event addishytional cost-effective investments would be recovered as part of the utility revenue requirement
Savings Target
An alternative to minimum spending levels is a minishymum energy savings target This alternative could be policy-driven (designed for consistency to obtain a cershytain percentage of existing sales or forecasted growth or as an Energy Efficiency Portfolio Standard [EEPS]) or resource-driven (changing as system needs dictate) Efficiency budgets can be devised annually to achieve the targets The use of savings targets does not address how money is collected from customers or how proshygram administration is organized For more information on how investments are selected see Chapter 3 Energy Resource Planning Processes
Clear Reliable and Timely Energy Efficiency Cost
Recovery System
Utilities value a clear and timely path to cost recovery and a well-functioning regulatory process should provide that Such a process contributes to a stable regulatory atmosphere that supports energy efficiency programs Cost recovery can be linked to program performance (as discussed in the next section) so that utilities would be responsible for prudent spending of efficiency funds
The energy efficiency program cost recovery issue is elimshyinated from the utility perspective if a non-utility adminshyistrative structure is used however this approach does not eliminate the throughput incentive Furthermore funding still needs to be established for the non-utility administrator
Tariff Rider for Energy Efficiency
A tariff rider for energy efficiency allows for a periodic rate adjustment to account for the difference between planned costs (included in rates) and actual costs
System Benefits Charge
In implementing retail competition several states added a separate charge to customer bills to collect funds for energy efficiency programs several other states have adopted this idea as well A system benefits charge (SBC) is designed to provide a stable stream of funds for public purposes like energy efficiency SBCs do have disadvantages If the funds enter the purview of state government they can be vulnerable to decisions to use the funds for general government purposes Also the charge appears to be an add-on to bills which can irrishytate some consumers This distinct funding stream can lead to a disconnection in resource planning between energy efficiency and other resources Regulators and utilities might need to take steps to ensure a comprehenshysive planning process when dealing with this type of funding7
7 This device might also pool funds for other public benefit purposes such as renewable energy system deployment and bill assistance for low-income consumers
2-8 National Action Plan for Energy Efficiency
Providing Incentives for Energy Efficiency Investment
Some suggest that if energy efficiency is a cost-effective resource utilities should invest in it for that reason with no reason for added incentives Others say that for effective results incentives should be considered because utilities are not rewarded financially for energy efficiency resources as they are for supply-side resources This section reviews options for utility incentives to promote energy efficiency
When utilities invest in hard assets they depreciate these costs over the useful lives of the assets Consumers pay a return on investment for the un-depreciated balance of costs not yet recovered which spreads the rate effect of the asset over time Utilities often do not have any opportunity to earn a return on energy efficiency spending as they do with hard assets This lack of opportunity for profit can introduce a bias against efficiency investment Incentives for energy efficiency should be linked to achieving performance objectives to avoid unnecessary expenditures and be evaluated by regulators based on their ability to produce cost-effective program performshyance Performance objectives can also form the basis of penalties for inferior program performance Financial incentives for utilities should represent revenues above those that would normally be recovered in a revenue requirement from a rate case
Energy Efficiency Costs Capitalize or Expense
In most jurisdictions energy efficiency costs are expensed which means all costs incurred for energy effishyciency are placed into rates during the year of the expense When a utility introduces an energy efficiency program or makes a significant increase or decrease in energy efficiency spending rates must change to collect all annual costs An increase in rates might be opposed by consumer advocates and other stakeholders especially if parties disagree on whether the energy efficiency programs are cost-effective
To moderate the rate effect of efficiency regulators could capitalize efficiency costs at least in part8
Capitalizing helps the utility by allowing for cost recovshyery over time but can cost consumers more than expensshying in the long run Some efficiency programs can meet short term rate-oriented cost-effectiveness tests if costs are capitalized However if the choice is made to capitalshyize the regulator still has to decide the appropriate amortization period for program costs balancing conshycern for immediate rate impacts and long term costs9
Capitalizing energy efficiency investments may be limitshyed by the magnitude of ldquoregulatory assetsrdquo that is appropriate for a utility Bond ratings might decline if the utility asset account has too many assets that are not backed by physical capital The limit on capitalized effishyciency investment varies depending on the rest of the utility balance sheet
Some argue that capitalizing energy efficiency is too costly and that rate effects from expensing are modest Others note that in some places capitalizing energy efficiency is the only way to deal with transitional rate effects and can provide a match over time between the costs and benefits of the efficiency investments (Arthur Rosenfeld personal communication February 20 2006)
In some cases it might be appropriate to consider encouraging unregulated utility affiliates to invest in and benefit from energy efficiency and other distributed resources
Bonus Return Shared Savings
To encourage energy efficiency investments over supply investments regulators can authorize a return on investshyment that is slightly higher (eg 5 percent) for energy efficiency investments or offer a bonus return on equity investment for superior performance Another approach is to share a percentage of the energy savings value pershyhaps 5 to 20 percent with the utility A shared savings system has the virtue of linking the magnitude of the
8 Capitalizing energy efficiency also reinforces the idea of efficiency as a substitute to supply and transmission 9 Iowa and Vermont initially capitalized energy efficiency spending but transitioned to expense in the late 1990s
To create a sustainable aggressive national commitment to energy efficiency 2-9
reward with the level of program performance A variashytion is to hold back some of the funds allocated to enershygy efficiency for award to shareholders for achieving energy efficiency targets Where this incentive is used the holdback can run between 3 and 8 percent of the program budget Some of these funds can be channeled to employees to reward their efforts (Arthur Rosenfeld personal communication February 20 2006 Plunkett 2005)
Bonus returns shared savings and other incentives can raise the total cost of energy efficiency However if the incentives are well-designed and effective they will encourage the utility to become proficient at achieving energy efficiency savings The utility might be motivated to provide greater savings for consumers through more cost-effective energy efficiency
Energy Efficiency Lowers Risk
Energy efficiency can help the financial ratings of utilities if it reduces the risks associated with regulatory uncershytainty long-term investments in gas supply and transport and electric power and transmission and the risks associshyated with fossil fuel market prices that are subject to volatility and unpredicted price increases By controlling usage and demand utilities can also control the need for new infrastructure and exposure to commodity markets providing risk management benefits To the extent that a return on efficiency investments is likely and the chance of a disallowance of associated costs is minimized investors will be satisfied Decoupling tends to stabilize actual utility revenues providing a better match to actual cost which should further benefit utility bond ratings
Reversing a Short-Term Resource Acquisition Focus Focus on Bills Not Just Rates
Policy-makers tend to focus on electric rates because they can be easily compared across states They become a measure for business-friendliness and companies conshysider rate levels in manufacturing siting and expansion decisions But rates are not the only measure of service A short-term focus on low rates can lead to costly missed
investment opportunities and higher overall costs of electricity service over the long run
Over the long term energy efficiency benefits can extend to all consumers Eventually reduced capital commitments and lower energy costs resulting from cost-effective energy efficiency programs benefit all consumers and lower overall costs to the economy freeshying customer income for more productive purposes like private investment savings and consumption Improved rate stability and risk management from limitshyed sales growth tends to improve the reputation of the utility Incentives and removing the throughput incenshytive make it easier for utilities to embrace stable or declining sales
A commitment to energy efficiency means accepting a new cost in rates over the short-term to gain greater sysshytem benefits and lower long-term costs as is the case with other utility investments State and local political support with a measure of public education might be needed to maintain stable programs in the face of pershysistent immediate pressure to lower rates
Related Issues With Wholesale Markets and Long-Term Planning
Regulatory factors can hinder greater investment in cost-effective energy efficiency programs These factors include the demand-side of the wholesale market not reacting to supply events like shortages or wholesale price spikes and for the electric sector a short-term generation planning horizon especially in retail compeshytition states In addition transmission system planning by regional transmission organizations (RTOs) and utilishyties tends to focus on wires and supply solutions not demand resources like efficiency The value of sustained usage reductions through energy efficiency demand response and distributed generation is not generally conshysidered nor compensated for in wholesale tariffs These are regulatory choices and are discussed further in Chapter 3 Energy Resource Planning Processes10
10 Planning and rate design implications are more thoroughly discussed in Chapters 3 Energy Resource Planning Processes and Chapter 5 Rate Design
2-10 National Action Plan for Energy Efficiency
Energy Efficiency Makes Wholesale Energy Markets
Work Better
In the wholesale market venue the value of energy effishyciency would be revealed by a planning process that treats customer load as a manageable resource like supshyply and transmission with investment in demand-side solutions in a way that is equivalent to (not necessarily the same as) supply and transmission solutions Demand response and efficiency can be called forth that specifishycally reduces demand at peak times or in other strategic ways or that reduces demand year-round
Declare Energy Efficiency a Resource
To underscore the importance of energy efficiency states can declare in statute or regulatory policy that energy efficiency is a resource and that utilities should factor energy efficiency into resource planning and acquisition States concerned with risks on the supply side can also go one step further and designate that energy efficiency is the preferred resource
Link Energy and Environmental Regulation
Environmental policy-makers have observed that energy efficiency is an effective and comparatively inexpensive way to meet tightening environmental limits to electric power generation yet this attribute rarely factors into decisions by utility regulators about deployment of enershygy efficiency This issue is discussed further in Chapter 3 Energy Resource Planning Processes
State and Regional Examples of
Successful Solutions to Energy
Efficiency Deployment
Numerous states have previously addressed or are curshyrently exploring energy efficiency electric and gas incenshytive mechanisms Experiments in incentive regulation occurred through the mid-1990s but generally were overtaken by events leading to various forms of restrucshyturing States are expressing renewed interest in incenshytive regulation due to escalating energy costs and a recognition that barriers to energy efficiency still exist Many state experiences are highlighted in the following text and Table 2-2
Addressing the Throughput Disincentive
Direction Through Legislation
New Mexico offers a bold statutory statement directing regulation to remove barriers to energy efficiency ldquoIt serves the public interest to support public utility investshyments in cost-effective energy efficiency and load manshyagement by removing any regulatory disincentives that might exist and allowing recovery of costs for reasonable and prudently incurred expenses of energy efficiency and load management programsrdquo (New Mexico Efficient Use of Energy Act of 2005)
Decoupling Net Income From Sales
California adopted decoupling for its investor-owned companies as it restored utility responsibility for acquirshying all cost-effective resources The state has also required these companies to pursue all cost-effective energy efficiency at or near the highest levels in the United States A balancing account collects forecasted revenues and rates are reset periodically to adjust for the difference between actual revenues and forecasts Because some utility cost changes are factored into most decoupling systems rate cases can become less frequent because revenues and costs track more closely over time11
11 See for example orders in California PUC docket A02-12-027 httpwwwcpuccagovproceedingsA0212027htm Oregon had used this method successfully for PacifiCorp but when the utility was acquired by Scottish Power the utility elected to return to the more familiar regulatory form
To create a sustainable aggressive national commitment to energy efficiency 2-11
Maryland and Oregon have decoupling mechanisms in place for natural gas In Maryland Baltimore Gas and Electric has operated with decoupling for more than seven years and Washington Gas recently adopted decoupling indicating that regulators view decoupling as a success12 In Oregon Northwest Natural Gas has a similar decoupling mechanism in place13
The inherently cooperative nature of decoupling is demonstrated by utilities and public interest advocates agreeing on a system that addresses public and private interests In all these instances no rate design shift was needed to implement decouplingmdashthe change is invisible
to customers A new proposal for New Jersey Natural Gas would adopt a system similar to those in use in Oregon and Maryland
See Table 2-2 for additional examples of decoupling
Reducing Cost Recovery Through Volumetric Charges
After New York moved to retail competition and sepashyrated energy commodity sales from the electricity delivshyery utility the distribution utilitiesrsquo rates were modified to increase fixed cost recovery through per-customer charges and to decrease the magnitude of variable volshyumetric rates Removing fixed generation costs as these
Table 2-2 Examples of Decoupling
State Type of Utility Key Features Related Rate Design Shifts
PoliticalAdministrative Factors
California
Investor-owned electric and gas Balancing account to collect forecasted revenue annual true-up
No Driven by commission outcome of energy crisis consensus oriented
httpwwwepagovcleanrgypdfkeystonePrusnekPresentationpdf
httpwwwcpuccagovPublishedFinal_decision15019htm
Maryland
Investor-owned gas only Revenue per customer cap monthly true-up No Revenue stability primary motive of
utility frequent true-ups
httpwwwenergeticscommadripdfstimmerman_101105pdf
httpwwwbgecomvcmfilesBGEFilesRates20and20TariffsGas20Service20TariffBrdr_3doc
Investor-owned gas only at presshyent investor-owned electric in the past
Revenue per customers cap annual true-up No Revenue stability primary motive of
utility renewed in 2005
Oregon httpwwwraponlineorgPubsGeneralOregonPaperpdf
httpwwwadvisorinsightcompubindexes600_minwn_irhtm
httpwwwnwnaturalcomCMS300uploadedFiles24190aipdf
httpappspucstateorusorders2002ords02-633pdf
New Jersey Investor-owned gas (proposed) Revenue per customer No
Explicit intent of utility to promote energy efficiency and stabilize fixed cost recovery
httpwww2njresourcescomnewstransnewsrptaspYear=2005 (see 120505)
Vermont Investor-owned electric (proposed)
Forecast revenue cap and costs balancing account and true-ups
No Legislative change promoted utility proposal small utility looking for stability
httpwwwgreenmountainpowerbizatyourservice2006ratefilingshtml
12 BGampErsquos ldquoMonthly Rate Adjustmentrdquo tariff rider is downloadable at httpwwwbgecomportalsitebgemenuitem6b0b25553d65180159c031e0da 6176a0
13 The full agreement can be found in Appendix A of Order 02-634 available at httpappspucstateorusorders2002ords02-634pdf See also Hansen and Braithwait (2005) for an independent assessment of the Northwest Natural Gas decoupling plan prepared for the commission
2-12 National Action Plan for Energy Efficiency
assets were divested dampened the effects on conshysumers In combination with tracking and deferral mechshyanisms to protect the utility from unanticipated costs and savings the utilities have little incentive to increase electric sales
Using a Lost Revenue Adjustment
Minnesota provided Xcel Energy with lost revenue adjustments for energy efficiency through 1999 and then moved to a performance-based incentive Iowa currently provides utilities with lost revenue adjustments for energy efficiency Connecticut allows lost revenue recovery for all electric energy efficiency Massachusetts allows lost revenue recovery for all gas energy efficiency requiring the accumulated lost revenues to be recovered within three years to prevent large accumulated balshyances Oregon allows lost revenue recovery for utility efficiency programs Lost revenue adjustments have been removed in many states because of their cost to consumers New Jersey is in the midst of a transition to a state-run administrator and provides lost revenue for utility-run programs in the meantime
Non-Utility Administration
Several states have taken over the administration of energy efficiency including Wisconsin (Focus on Energy) Maine (Efficiency Maine) New Jersey and Ohio In other states a third party has been set up to administer programs including Vermont (Efficiency Vermont) and Oregon (Energy Trust of Oregon) The New York State Energy Research and Development Authority (NYSERDA) a public authority fits into both categories There is no retail competition in Vermont or Wisconsin this change was based entirely on an expecshytation of effectiveness Oregon combines natural gas and electric efficiency programs but only for the larger companies in each sector Statewide branding of energy efficiency programs is a dividend of non-utility adminisshytration Connecticut introduced an aspect of non-utility administration by vesting its Energy Conservation Management Board a state board including state offishycials utility managers and others with responsibility to approve energy efficiency plans and budgets
Recovering Costs Providing Funding for Energy Efficiency Programs
Revenue Requirement
When energy efficiency programs first began they were funded as part of a utility revenue requirement In many states like Iowa this practice has continued uninterrupted In California retail competition interrupted this method of acquiring energy efficiency but since 2003 California is again funding energy efficiency along with other resources through the revenue requirement a practice known there as ldquoprocurement fundingrdquo California also funds energy efficiency through SBC funding
Capitalizing Energy Efficiency Costs
Oregon allows capitalization of costs and the small electrics do so Washington Vermont and Iowa capitalshyized energy efficiency costs when programs began in the 1980s to moderate rate effects Vermont for example amortized program costs over five years In the late 1990s however as program spending declined these states ended the practice of capitalizing energy efficienshycy costs electing to expense all costs Currently Vermont stakeholders are discussing how to further increase efficiency spending beyond the amount collected by the SBC and they are reconsidering moderating new rate effects through capitalizing costs
Spending Budgets Tariff Riders
and System Benefits Charges
Several states have specified percentages of net utility revenue or a specific charge per energy unit to be spent for energy efficiency resources Massachusetts for example specifies 25 mills per kilowatt-hour (kWh) (while spending for natural gas energy efficiency is determined case by case) In Minnesota there is a separate percentage designated for electric (15 percent of gross operating revenues) and for natural gas (05 percent) utilities Vermont adopted a statewide SBC for its vertically inteshygrated electric sector while its gas energy efficiency costs remain embedded in the utility revenue requirement Strong statutory protections guard funds from government appropriation Wisconsin requires a charge but leaves the commission to determine the appropriate level for each
To create a sustainable aggressive national commitment to energy efficiency 2-13
utility There is a history of SBC funds being used for genshyeral government within the state 2005 legislation apparently intended to make funding more secure (Wisconsin Act 141 of 2005)
The New York commission chose to establish an annual spending budget for its statewide effort (exclusive of the public authorities and utilities) increasing it to $150 milshylion in 2001 and to $175 million in 2006 Washington tariffs include a rider that allows adjustment of rates to recover energy efficiency costs that diverge from amounts included in rates with annual true-ups
Providing Incentives for Energy Efficiency Investment
Performance Incentives
In Connecticut the two electric utilities managing energy efficiency programs are eligible for ldquoperformance management feesrdquo tied to performance goals approved by the regulators including lifetime energy savings demand savings and other measures Incentives are available for a range of outcomes from 70 to 130 percent of pre-determined goals In 2004 the two utilities collectively reached 130 percent of their energy savings goals and 124 percent of their demand savings goals They received performance management fees totaling $527 million The 2006 joint budget anticipates $29 million in performance incentives
In 1999 the Minnesota Commission adopted performshyance incentives for the electric and natural gas investor-owned utilities that began at 90 percent of performance targets and are awarded for up to 150 percent of target levels Performance targets for Minnesota utilities spendshying more than the minimum spending requirement are adjusted to the minimum spending level for purposes of calculating the performance incentive
Rhode Island and Massachusetts offer similarly strucshytured incentives Rhode Island sets aside roughly 5 pershycent of the efficiency budget for performance incentives This amount is less than the amount that would probashy
bly be justified if a lost revenue adjustment were used A collaborative group of stakeholders recommends pershyformance indicators and levels to qualify for incentives In Massachusetts utilities achieving performance tarshygets earn 5 percent on money spent for efficiency (in addition to being able to expense efficiency costs)
Efficiency Vermont operates under a contract with the Vermont Public Service Board The original contract called for roughly 3 percent of the budget for efficiency programs to be held back and paid if Efficiency Vermont meets a variety of performance objectives
Shared Savings
Before retail competition California used a shared savshyings approach in which the utilities received revenue equal to a portion of the savings value produced by the energy efficiency programs A similar mechanism might be reinstated in 2006 (Arthur Rosenfeld personal communication February 20 2006)
Bonus Rate of Return
Nevada allows a bonus rate of return for demand-side management that is 5 percent higher than authorized rates of return for supply investments Regulations specify programs that qualify and the process to account for qualifying investments (Nevada Regulation of Public Utilities Generally 2004)
Lower Risk of Disallowance Through Multi-
Stakeholder Collaborative
California Rhode Island and other states employ stakeholder collaboratives to resolve important program and administrative issues and to provide settlements to the regulator
See Table 2-3 for additional examples of incentives for energy efficiency investments
2-14 National Action Plan for Energy Efficiency
Table 2-3 Examples of Incentives for Energy Efficiency Investments
State Type of Utility Key Features PoliticalAdministrative Factors
California Investor-owned electric Shared savings Encouraged by energy commission and utilities Incentive proportionate to value of savings no cap
httpwwwraponlineorgConferencesMinnesotaPresentationsPrusnekCAEEMinnesotapdf
Connecticut Investor-owned electric Performance incentives
Part of retail competition bargain incentive limited to a percentage of program budget simple to compare results to performance goals
httpwwwstatectusdpucecmbindexhtml
Massachusetts Rhode Island Investor-owned electric Performance incentives
Part of retail competition bargain incentive limited to a percentage of program budget simple to compare results to performance goals
httpwwwmassgovdteelectric04-11819orderpdf (Docket 04-11)
httpwwwripucorgeventsactionsdocket3463_NEC-2004DSMSettle(91203)pdf
Minnesota Investor-owned electric and natural gas Performance incentives
Utility-specific plan arising to resolve other regulatory issues incentive awarded on a sliding scale of performshyance compared with goals decoupling not authorized by statute
httpwwwraponlineorgPubsRatePayerFundedEERatePayerFundedMNpdf
Nevada Investor-owned electric Bonus rate of return on equity Process to establish bonus is statutory
See httpwwwlegstatenvusNACNAC-704htmlNAC704Sec9523
Vermont Efficiency utility Performance incentives
Incentive structure set by contract result of bargain between commission and third-party efficiency provider
httpwwwstatevtuspsbeeucontracthtml
Regulatory Drivers for Efficiency in Resource Planning and Energy Markets
Declare Energy Efficiency a Resource
In New Mexico the legislature has declared a goal of ldquodecreasing electricity demand by increasing energy effishyciency and demand response and meeting new generashytion needs first with renewable and distributed generation resources and second with clean fossil-fueled generationrdquo (New Mexico Efficient Use of Energy Act of 2005)
In California the state has made it very clear that energy efficiency is the most important resource (California SB 1037 2005) After the crises of 2000 and 2001 state leaders used energy efficiency to dampen demand growth and market volatility An Energy Action Plan adopted in 2003 by the California Public Utilities Commission (CPUC) the California Energy Commission (CEC) and the power authority developed a ldquoloading orderrdquo for new electric resources the Energy Action Plan
has been revised but the energy efficiency preference remains firm The intent of the loading order is to ldquodecreas(e) electricity demand by increasing energy effishyciency and demand response and meeting new generashytion needs first with renewable and distributed generation resources and second with clean fossil-fueled generationrdquo (CEC 2005) As a result utilities are acquiring energy efficiency in amounts well in excess of those that would be procured with the SBC alone Further the utilities are integrating efficiency into their resource plans and using efficiency to solve resource problems
Clarifying the primary regulatory status of efficiency makes it clear that sympathetic regulation and cost recovery policies are important California has adopted decoupling of net income and sales for its investor-owned utilities to remove regulatory barriers to a full financial commitment to energy efficiency
To create a sustainable aggressive national commitment to energy efficiency 2-15
One device for implementing this policy is an energy effishyciency supply curve The CEC created such a curve based on an assessment of energy efficiency potential to provide guidance as it reintroduced energy efficiency procurement expectations for the utilities in 2003 Furthermore the CPUC cooperated with the CEC to set energy savings targets for each of the California investor-owned utilities based on an assessment of cost-effectiveness potential
A different approach to declaring energy efficiency a resource is to establish a portfolio or performance stanshydard for energy efficiency In 2005 Pennsylvania and Connecticut included energy efficiency in their resource portfolio standards Requiring all retail sellers to acquire sufficient certificates of energy savings will allocate revshyenue to efficiency providers in an economically efficient way (Pennsylvania Alternative Energy Portfolio Standards Act of 2004 Connecticut Act Concerning Energy Independence of 2005)
As an outcome of its electric restructuring law Texas is using energy efficiency as a resource to reduce demand Texasrsquo spending for energy efficiency is intended to proshyduce savings to meet 10 of forecasted electric demand growth Performance is exceeding this level
Consider Energy Efficiency As a System Reliability
Solution
In New England Independent System Operator New England (ISO-NE) faced a reliability problem in southwest Connecticut A transmission line to solve the problem was under development but would not be ready in time New central station generation could not be sited in this congested area Because the marketplace was not providshying a solution ISO-NE issued a Request for Proposal (RFP) for any resources that would address the reliability probshylem and be committed for four years One energy efficienshycy bid was selectedmdasha commercial office building lighting project worth roughly 5 megawatts (MW) Conditions of the award were very strict about availability of the capacity savings This project will help to demonstrate how energy efficiency does deliver capacity While ISO-NE deemed the RFP an emergency step that it would not undertake routinely this process demonstrates that energy
efficiency can be important to meeting reliability goals and can be paid for through federal jurisdictional tariffs
Other states including Indiana Vermont and Minnesota direct that energy efficiency be considered as an alternative when utilities are proposing a power line project (Indiana Resource Assessment 1995 Vermont Section 248 Minnesota Certificate of need for large energy facility 2005)
Key Findings
This chapter reviews opportunities to make energy effishyciency an attractive business prospect by modifying elecshytric and gas utility regulation and by the way that utilities collect revenue and make a profit Key findings of this chapter indicate
bull There are real financial disincentives that hinder all utilshyities in their pursuit of energy efficiency as a resource even when it is cost-effective and would lead to a lower cost energy system Regulation which is a key source of these disincentives can be modified to remove these barriers
bull Many states have experience in addressing financial disincentives in the following areas
mdash Overcoming the throughput incentive
mdash Providing reliable means for utilities to recover energy efficiency costs
mdash Providing a return on investment for efficiency programs that is competitive with the return utilities earn on new generation
mdash Addressing the risk of program costs being disallowed and other risks
mdash Recognizing the full value of energy efficiency to the utility system
2-16 National Action Plan for Energy Efficiency
Recommendations and Options
The National Action Plan for Energy Efficiency Leadership Group offers the following recommendations as ways to overcome many of the barriers to energy efficiency in utilishyty ratemaking and revenue requirements and provides a number of options for consideration by utilities regulators and stakeholders (as presented in the Executive Summary)
Recommendation Modify policies to align utility
incentives with the delivery of cost-effective energy
efficiency and modify ratemaking practices to promote
energy efficiency investments Successful energy efficiency programs would be promoted by aligning utility incentives in a manner that encourages the delivery of energy efficiency as part of a balanced portfolio of supply demand and transmission investments Historically regshyulatory policies governing utilities have more commonly compensated utilities for building infrastructure (eg power plants transmission lines pipelines) and selling energy while discouraging energy efficiency even when the energy-saving measures might cost less Within the existing regulatory processes utilities regulators and stakeholders have a number of opportunities to create the incentives for energy efficiency investments by utilities and customers A variety of mechanisms have already been used For example parties can decide to provide incentives for energy efficiency similar to utility incentives for new infrastructure investments and provide rewards for prudent management of energy efficiency programs
Options to Consider
bull Addressing the typical utility throughput incentive and removing other regulatory and management disincentives to energy efficiency
bull Providing utility incentives for the successful manageshyment of energy efficiency programs
Recommendation Make a strong long-term commitshy
ment to implement cost-effective energy efficiency as
a resource Energy efficiency programs are most successful and provide the greatest benefits to stakeholders when appropriate policies are established and maintained over
the long-term Confidence in long-term stability of the proshygram will help maintain energy efficiency as a dependable resource compared to supply-side resources deferring or even avoiding the need for other infrastructure investshyments and maintain customer awareness and support
Options to Consider
bull Establishing funding requirements for delivering long-term cost-effective energy efficiency
bull Designating which organization(s) is responsible for administering the energy efficiency programs
Recommendation Broadly communicate the benefits
of and opportunities for energy efficiency
Experience shows that energy efficiency programs help customers save money and contribute to lower cost enershygy systems But these benefits are not fully documented nor recognized by customers utilities regulators or policy-makers More effort is needed to establish the business case for energy efficiency for all decision-makers and to show how a well-designed approach to energy efficiency can benefit customers utilities and society by (1) reducing customersrsquo bills over time (2) fostering financially healthy utilities (eg return on equity earnings per share and debt coverage ratios unaffected) and (3) contributing to posishytive societal net benefits overall Effort is also necessary to educate key stakeholders that although energy efficiency can be an important low-cost resource to integrate into the energy mix it does require funding just as a new power plant requires funding
Options to Consider
bull Establishing and educating stakeholders on the busishyness case for energy efficiency at the state utility other appropriate level addressing customer utility and societal perspectives
bull Communicating the role of energy efficiency in lowering customer energy bills and system costs and risks over time
To create a sustainable aggressive national commitment to energy efficiency 2-17
Recommendation Provide sufficient timely and stable
program funding to deliver energy efficiency where
cost-effective Energy efficiency programs require consisshytent and long-term funding to effectively compete with energy supply options Efforts are necessary to establish this consistent long-term funding A variety of mechashynisms have been and can be used based on state utility and other stakeholder interests It is important to ensure that the efficiency program providers have sufficient long-term funding to recover program costs and impleshyment the energy efficiency measures that have been demonstrated to be available and cost-effective A number of states are now linking program funding to the achievement of energy savings
Options to Consider
bull Deciding on and committing to a consistent way for program administrators to recover energy efficiency costs in a timely manner
bull Establishing funding mechanisms for energy efficiency from among the available options such as revenue requirement or resource procurement funding SBCs rate-basing shared-savings incentive mechanisms etc
bull Establishing funding for multi-year periods
2-18 National Action Plan for Energy Efficiency
References
Barone RJ (2006 May 23) Presentation to the Rethinking Natural Gas Utility Rate Design Conference Columbus Ohio
California Energy Commission [CEC] (2005 July) Implementing Californiarsquos Loading Order for Electricity Resources
California Public Utility Commission [CPUC] (1996 December 20) Opinion on Cost Recovery Plans CPUC D96-12-077
California SB 1037 California Statutes of 2005 Chapter 366 (2005) lthttpinfosencagovpubbillsensb_1001shy1050sb_1037_bill_20050929_chapteredhtmlgt
Connecticut An Act Concerning Energy Independence Public Act No 05-1 (House Bill No 7501) (2005) lthttpwwwcgactgovaspcgabillstatuscgabillstashytusaspselBillType=Billampbill_num=7501ampwhich_year =2005gt
Costello K (2006 April) Revenue Decoupling for Natural Gas Utilities National Regulatory Research Institute lthttpwwwnrriohioshystateeduNaturalGasrevenue-decoupling-for-natushyral-gas-utilitiesgt
Hansen DG and Braithwait SD (2005 March 31) A Review of Distribution Margin Normalization as Approved by the Oregon Public Utility Commission for Northwest Natural Madison Wisconsin Christensen Associates Consulting
Harrington C (2003 May) Who Should Deliver Ratepayer Funded Energy Efficiency Regulatory Assistance Project lthttpwwwraponlineorg showpdfaspPDF_URL=rdquoPubsRatePayerFundedEE RatePayerFundedEEPartIpdfrdquogt
Indiana Resource Assessment Indiana Administrative Code [IAC] 170 IAC 4-7-6 Resource assessment (1995) lthttpwwwingovlegislativeiac T01700A00040PDFgt
Kantor G (2006 June 20) Presentation to the 2006 Western Conference of Public Service Commissioners Jackson Wyoming
Minnesota Certificate of need for large energy facility Minnesota Statutes Chapter 216B243(3) (2005) lthttpwwwrevisorlegstatemnusstats 216B243htmlgt
Moskovitz D (2000) Profits and Progress Through Distributed Resource Regulatory Assistance Project lthttpwwwraponlineorgshowpdfaspPDF_URL= PubsGeneralProfitsandProgressdrpdfgt
Nevada Regulation of Public Utilities Generally Nevada Administrative Code 7049523 Costs of impleshymenting programs for conservation and demand management Accounting recovery (2004) lthttpwwwlegstatenvusNACNACshy704htmlNAC704Sec9523gt
NERA Economic Consulting (2006 April 20) Distributed Resources Incentives lthttpwwwenergeticscommadripdfsnera_0424 06pdfgt
New Mexico Efficient Use of Energy Act New Mexico Statutes Chapt 62-17-2 and Chapt 62-17-3 (2005)
Pennsylvania Alternative Energy Portfolio Standards Act Pennsylvania Act No 213 (SB 1030) (2004) lthttpwwwlegisstatepausWU01LIBIBT20030 SB1030P1973HTMgt
Plunkett J Horowitz P Slote S (2005) Rewarding Successful Efficiency Investment in Three Neighboring States The Sequel the Re-make and the Next Generation (In Vermont Massachusetts and Connecticut) A 2004 ACEEE Summer Study on Energy Efficiency in Buildings lthttpwwwaceeeorgconf04sspanel5htmgt
US Environmental Protection Agency [EPA] (2006) Clean Energy-Environment Guide to Action Policies Best Practices and Action Steps for States (Section 62) Washington DC
Vermont Section 248 30 Vermont Statutes Annotated sect 248 4 (A)(b) New gas and electric purchases investments and facilities certificate of public good lthttpwwwlegstatevtusstatutesfullsecshytioncfmTitle=30ampChapter=005ampSection=00248gt
2005 Wisconsin Act 141 (2005 Senate Bill 459) lthttpwwwlegisstatewius2005dataacts05Act 141pdfgt
To create a sustainable aggressive national commitment to energy efficiency 2-19
3Energy Resource Planning Processes
Including energy efficiency in the resource planning process is essential to realizing its full value and setshyting resource savings and funding targets accordingly Many utilities states and regions are estimating and verifying the wide range of benefits from energy efficiency and are successfully integrating energy efficiency into the resource planning process This chapter of the National Action Plan for Energy Efficiency Report discusses the barriers that obstruct incorporating energy efficiency in resource planning and presshyents six regional approaches to demonstrate how those barriers have been successfully overcome
Overview
Planning is a core function of all utilities large and small natural gas and electric public and private The decisions made in planning affect customer costs reliability of service risk management and the environment Many stakeholders are closely involved and participate in planshyning processes and related decisions Active participants often include utilities utility regulators city councils state and local policy-makers regional organizations environmental groups and customer groups Regional planning processes organized through regional transmisshysion organizations (RTOs) also occur with the collaborashytions of utilities and regional stakeholders
Different planning processes are employed within each utilshyity state and region Depending on a utilityrsquos purpose and context (eg electric or gas utility vertically integrated or restructured) different planning decisions must be made Local and regional needs also affect planning and resource requirements and the scope of planning processes Further the role of states and regions in planning affects decisions and prescribes goals for energy portfolios such as resource priority fuel diversity and emissions reduction
Through different types of planning processes utilities analyze how to meet customer demands for energy and capacity using supply-side resource procurement (includshying natural gas supply contracts and building new genershyation) transmission distribution and demand-side resources (including energy efficiency and demand response) Such planning often requires iteration and testshying to find the combination of resources that offer maxishymum value over a range of likely future scenarios for the
short- and long-term The value of each of these resources is determined at the utility local state and regional level based on area-specific needs and policy direction In order to fully integrate the value of all resources into planningmdash including energy efficiencymdashresource value and benefits must be determined early in the planning process and projected over the life of the resource plan
Planning processes focus on two general areas (1) energy-related planning such as electricity generation and wholesale energy procurement and (2) capacity-related planning such as construction of new pipelines power plants or electric transmission and distribution projects The value of energy efficiency can be integrated into resource planning decisions for both of these areas
Leadership Group Recommendations
Applicable to Energy Resource
Planning Processes
bull Recognize energy efficiency as a high-priority energy resource
bull Make a strong long-term commitment to implement cost-effective energy efficiency as a resource
bull Broadly communicate the benefits of and opportunishyties for energy efficiency
bull Provide sufficient timely and stable program funding to deliver energy efficiency where cost-effective
A more detailed list of options specific to the objective of promoting energy efficiency in resource planning processes is provided at the end of this chapter
To create a sustainable aggressive national commitment to energy efficiency 3-1
This chapter identifies common challenges for integratshying energy efficiency into existing planning processes and describes examples of successful energy efficiency planning approaches that are used in six regions of the country Finally this chapter summarizes ways to address barriers and offers recommendations and several options to consider for specific actions that would facilitate incorporation of energy efficiency into
Figure 3-1 Energy Efficiency Supply Curve - Potential in 2011 (Levelized Cost in $kilowatt-hours [kWh] Saved)
$100
$090
$080
$070
resource planning
$kw
h $060
$050
Challenges to Incorporating Energy
Efficiency Into Planning
The challenges to incorporating energy efficiency into resource planning have common themes for a wide range of utilities and markets This section describes these challenges in the context of two central questions A) determining the value of energy efficiency in the resource planning and B) setting energy efficiency targets and allocating budgets which are guided by resource planning as well as regulatory and policy decisions
Determining the Value of Energy Efficiency
It is generally accepted that well-designed efficiency measures provide measurable resource savings to utilishyties However there are no standard approaches on how to appropriately quantify and incorporate those benefits into utility resource planning Also there are many different types of energy efficiency programs with different characteristics and target customers Energy efficiency can include utility programs (rebates audits education and outreach) as well as building efficiency codes and standards improvements for new construction Each type of program has different charshyacteristics that should be considered in the valuation process The program information gathered in an enershygy efficiency potential study can be used to create an energy efficiency supply curve as illustrated in Figure 3-1
$040
$030
$020
$010
$000 0 10000 20000 30000 40000 50000 60000
GWh
Source McAuliffe 2003
Common Challenges to Incorporating Energy Efficiency Into Planning
A Determining the Value of Energy Efficiency
Energy Procurement
Estimating energy savings
Valuing energy savings
Capacity amp Resource Adequacy
Estimating capacity savings
Valuing capacity benefits
Factors in achieving benefits
Other Benefits
Incorporating non-energy benefits
B Setting Targets and Allocating Budget
Quantity of EE to implement
Estimating program effectiveness
Institutional difficulty in reallocating budget
Cost expenditure timing vs benefits
Ensuring program costs are recaptured
3-2 National Action Plan for Energy Efficiency
The analysis commonly used to value energy efficiency compares the costs of energy efficiency resources to the costs of the resources that are displaced by energy effishyciency The sidebar shows the categories of benefits for electric and gas utilities that are commonly evaluated The approach is to forecast expected future costs with and without energy efficiency resources and then estishymate the level of savings that energy efficiency will proshyvide This analysis can be conducted with varying levels of sophistication depending on the metrics used to comshypare alternative resource plans Typically the evaluation is made based on the expected cost difference however rdquoportfoliordquo approaches also evaluate differences in cost variance and reliability which can provide additional rationale for including energy efficiency as a resource
The resource benefits of energy efficiency fall into two general categories
(1) Energy-related benefits that affect the procurement of wholesale electric energy and natural gas and delivery losses
(2) Capacity-related benefits that affect wholesale elecshytric capacity purchases construction of new facilities and system reliability
The energy-related benefits of energy efficiency are relashytively easy to forecast Because utilities are constantly adjusting the amount of energy purchased short-term deviations in the amount of energy efficiency achieved can be accommodated The capacity-related benefits occur when construction of a facility needed to reliably serve customers can be delayed or avoided because the need has already been met Therefore achieving capacity benefits requires much more certainty in the future success of energy efficiency programs (particularly the measures targeting peak loads) and might be harder to achieve in practice However the ability to provide capacity benefits has been a focus in California the Pacific Northwest and other regions and it should become easier to assess capacity savings as more proshygrams gain experience and capacity savings are measshyured and verified Current methods for estimating energy benefits and capacity benefits are presented here
Estimating Energy Benefits
Estimating energy benefits requires established methods for estimating the quantity of energy savings and the benefits of these savings to the energy system
bull Estimating Quantity of Energy Savings Savings estishymates for a wide variety of efficiency measures have been well studied and documented Approaches to estimate the level of free-riders and program particishypants who would have implemented the energy effishyciency on their own have been established Similarly the expected useful lives of energy efficiency measures and their persistence are commonly evaluated and included in the analysis Detailed databases of efficiency measures have been developed for several regions including California and the Pacific Northwest However it is often necessary to investigate and valishydate the methods and assumptions behind those estishymates to build consensus around measured savings that all stakeholders find credible Savings estimates can be verified through measurements and load research Best practices for measurement and verificashytion (MampV) are discussed in more detail in Chapter 6 Energy Efficiency Program Best Practices
Benefits of Energy Efficiency in Resource Planning
Electricity Natural Gas
Energy-related benefits
Reduced wholesale energy purchases
Reduced wholesale natural gas purchases
Reduced line losses Reduced losses and unaccounted for gas
Reduced air emissions Reduced air emissions
Capacity-related benefits
Generation capacity resource adequacy regional markets
Production and liquified natural gas facilities
Operating reserves and other ancillary services
Pipeline capacity
Transmission and distribution capacity
Local storage and pressure
Other benefits Market price reductions (consumer surplus)
Lower portfolio risk
Localin-state jobs
Low-income assistance and others
To create a sustainable aggressive national commitment to energy efficiency 3-3
bull Quantifying Value of Energy Savings The most readily available benchmark for the value of energy savings is the prevailing price of wholesale electricity and natural gas Even for a vertically integrated utility with its own production energy efficiency might decrease the need to make market purchases or if the utility has excess energy energy efficiency can allow the utility to sell more into the market In cases when the market prices are not appropriate benchmarks (because of contract limitations on reselling energy or limited market access) contract prices or production costs can be used In addition the value of losses and other variable costs associated with energy delivery can be quantified and are well known
The challenge that remains is in forecasting future energy costs beyond the period when market data are available or contracts are in place Long-run forecasts vary in comshyplexity from a simple escalation rate to market-based approaches that forecast the cost of new resource addishytions to models that simulate the system of existing resources (including transmission constraints) and evalushyate the marginal cost of operating the system as new generation is added to meet the forecasted load growth Most utilities have an established approach to forecast long-term market prices and the same forecasting techshynique and assumptions should be used for energy effishyciency as are used to evaluate supply-side resource options In addition to a forecast of energy prices some regions include the change in market prices as a result of energy efficiency Estimating these effects requires modshyeling of complex interactions in the energy market Furthermore reduced market prices are not necessarily a gain from a societal perspective because the gains of consumers result in an equal loss to producers therefore whether to include these savings is a policy decision
Estimating Capacity Benefits
Estimating capacity benefits requires estimating the level of capacity savings and the associated benefits If energy efficiencyrsquos capacity benefits are not considered in the resource plan the utility will overinvest in capital assets
such as power plants and transmission and distribution and underinvest in energy efficiency
bull Estimating Capacity Savings In addition to energy savshyings electric efficiency reduces peak demand and the need for new investments in generation transmission and distribution infrastructure Natural gas efficiency can reduce the need for a new pipeline storage liquefied natural gas (LNG) facility or other investshyments necessary to maintain pressure during high-load periods Because of the storage and pressure variation possible in the natural gas system capacity-related costs are not as extreme in the natural gas system as they are for electricity In both cases estimating reducshytions of peak demand is more difficult for electricity than it is for natural gas and timing is far more critical For peak demand savings to actually be realized the targeted end-use load reductions must occur and the efficiency measure must provide savings coincident with the utilityrsquos peak demand Therefore different energy efficiency measures that reduce load at different times of day (eg commercial vs residential lighting) might have different capacity values Area- and time-specific marginal costing approaches have been develshyoped to look at the value of coincident peak load reductions which have significantly higher value during critical hours and in constrained areas of the system (see sidebar on page 3-5)
A critical component of the resource planning process whether focused on demand- or supply-side resources is accurate unbiased load forecasting Inaccurate load forecasts either cause excessive and expensive investshyment in resources if too aggressive or create costly shortages if too low Similarly tracking and validation of energy efficiency programs are important for increasing the accuracy of estimates of their effects in future resource plans
Estimating the capacity savings to apply to load growth forecasts requires estimating two key factors The first is determining the amount of capacity reduced by energy efficiency during critical or peak hours The
3-4 National Action Plan for Energy Efficiency
second factor is estimating the rdquoequivalent reliabilityrdquo of the load reduction This measure captures both the probability that the savings will actually occur and that the savings will occur during system-constrained hours Applying estimates of equivalent reliability to various types of resources allows comparison on an equal basis with traditional capacity investments This approach is similar in concept to the equivalent capacity factor used to compare renewable resources such as wind
and solar with traditional fossil-fueled generation In markets where capacity is purchased rdquocountingrdquo rules for different resource types determine the equivalent reliability The probability that savings will actually occur during peak periods is easier to estimate with some certainty for a large number of distributed effishyciency measures (eg air conditioners) as opposed to a limited number of large centralized measures (eg water treatment plants)
California Avoided Costs by Time and Location
California is a good example of the effect of area and time-differentiation for efficiency measures that have dramatically different impact profiles The average avoided cost for efficiency (including energy and capacity cost components) in California is $71megawatt-hour (MWh) Applying avoided costs for each of six time of use (TOU) periods (super-peak mid-peak and off-peak
for summer and winter seasons) increases the value of air conditioning to $104MWh or 45 percent and lowshyers the value of outdoor lighting to $57MWh or 20 pershycent Refrigeration with its consistent load profile throughout the day and year is unaffected Applying avoided costs by hour captures the extreme summer
peak prices and increases the value of air conditioning savings still further to $123MWh Incorporating hourly avoided costs increases the total benefits of air condishytioning load reduction by more than $50MWh This type of hourly analysis is currently being used in Californiarsquos avoided cost proceedings for energy efficiency
Avoided distribution capacity costs are also estimated by region in California The Greater San Francisco Bay Area region is shown above in detail In San Francisco and Oakland avoided capacity costs are low because those areas are experiencing little load growth and have little need for new distribution investment The Stockton area on the other hand is experiencing high growth and has significant new distribution infrastructure requirements
Comparison of Avoided Costs for Three Implementation Approaches
$shy
$20
$40
$60
$80
$100
$120
$140
Air Conditioning Outdoor Lighting Refrigeration
Wei
ghte
d A
vera
ge A
void
ed C
ost
($M
Wh)
Hourly TOU Average Annual Average
$8000
$4250
$500
$MW
Greater San Francisco Bay Area Avoided Distribution Costs
To create a sustainable aggressive national commitment to energy efficiency 3-5
bull Valuing Capacity Benefits The value of capacity beneshyfits lies in the savings of not having to build or purchase new infrastructure or make payments to capacity marshykets for system reliability Because reliability of the nationrsquos energy infrastructure is critical it is difficult to make the decision to defer these investments without some degree of certainty that the savings will be achieved Disregarding or undervaluing the transmisshysion and generation capacity value of energy efficiency can however lead to underinvestment in energy effishyciency Realizing energy efficiencyrsquos capacity savings requires close coordination between efficiency and resource planners1 to ensure that specific planned investments can actually be deferred as a result of energy efficiency programs In the long term lower load levels will naturally lead to lower levels of infrashystructure requirements without a change in existing planning processes
Targeted implementation of energy efficiency designed to defer or eliminate traditional reliability investments in the short term (whether generation transmission or disshytribution) requires that energy efficiency ramp up in time to provide sufficient peak load savings before the new infrastructure is needed States with existing efficiency programs can use previous experience to estimate future adoption rates In states that do not have previous expeshyrience with energy efficiency however the adoption rate of efficiency measures is difficult to estimate making it hard to precisely quantify the savings that will be achieved by a certain date Therefore if the infrastrucshyture project is critical for reliability it is difficult to rely on energy as an alternative The value of the targeted reductions and project deferrals can also be a challenge to quantify because of the uncertainty in the future investment needs and costs However there are examshyples of how to overcome this challenge such as the Bonneville Power Administration (BPA) transmission planning process (described later) Vermont Docket 7081 is another collaborative processmdashinitiated at the direcshy
tion of the legislaturemdashthat is working on a new transshymission planning process that will explicitly incorporate energy efficiency (Vermont Public Service Board 2005) Both BPA and Vermont Docket 7081 stress the need to start well in advance of the need for reductions to allow the energy efficiency program to be developed and valishydated In addition by starting early conventional altershynatives can serve as a back-stop if needed Starting early is also easier organizationally if alternatives are initiated before project proponents are vested in building new transmission lines
The deferral of capacity expenditures can produce the same reliability level for customers In cases when an energy efficiency program changes the expected reliability level (either higher or lower) the value to customers must be introduced as either a benefit or cost A typical approach is to use the customerrsquos Value of Lost Load (VOLL) as determined through Value of Service (VOS) studies and multiply by the expected change in customer outage hours However VOS studies based on customer surveys typically show wide-ranging results and are often difficult to substantiate
In regions with established capacity markets the valuashytion process is easier because the posted market prices are the value of capacity The approach to value these benefits is therefore similar to the market price forecasting approach described to value energy benefits Regional planning processes can also include energy efficiency in their resource planning Regional electricity planning processes primarily focus on developing adequate resources to meet regional reliability criteria as defined in each of the North American Electric Reliability Council (NERC) regions Establishing capacity and ancillary servshyice market rules that allow energy efficiency and customer load response to participate can bring energy efficiency into the planning process For example Independent System Operator New England (ISO-NE) Demand Resources Working Group will be including
1 The transmission planning process requires collaboration of regional stakeholders including transmission owners utilities and regulators Distribution planning departments of electric utilities typically make the decisions for distribution-level and local transmission facilities Planning and development of high-voltage transmission facilities on the bulk-supply system is done at the independent system operator (ISO)RTO and North American Electric Reliability Council (NERC) regional levels At a minimum transmission adequacy must uphold the established NERC reliability standards
3-6 National Action Plan for Energy Efficiency
energy efficiency and demand response as qualifying resources for the New England Forward Capacity Market Another example is PJM Interconnection (PJM) which has recently made its Economic Load Response Program a permanent feature of the PJM markets (in addition to the Emergency Load Response Program that was permanently established in 2002) and has recently opened its Synchronized and Non-Synchronized Reserve markets to demand response providers
Other Benefits
Energy efficiency provides several types of non-energy benefits not typically included in traditional resource planning These benefits include environmental improveshyment support for low-income customers economic development customer satisfaction and comfort and other potential factors such as reduced costs for bill colshylection and service shut-offs improvements in household safety and health and increased property values As an economic development tool energy efficiency attracts and retains businesses creates local jobs and helps busishyness competitiveness and area appeal
Environmental benefits predominantly air emissions reductions might or might not have specific economic value depending on the region and the pollutant The market price of energy will include the producerrsquos costs of obtaining required emission allowances (eg nitrogen oxides [NOX] sulfur dioxide [SO2]) and emission reducshytion equipment Emissions of carbon dioxide (CO2) also are affected by planning decisions of whether to consider the value of unregulated emissions The costs of CO2
were included in Californiarsquos assessment of energy effishyciency on the basis that these costs might become priced in the future and the expected value of future CO2 prices should be considered when making energy efficiency investments2 Even without regulatory policy guidance several utilities incorporate the estimated future costs of emissions such as CO2 into their resources planning process to control the financial risks associated with future regulatory changes3 For example Idaho Power
Company includes an estimated future cost of CO2 emisshysions in its resource planning and in determining the cost-effectiveness of efficiency programs
Many of these benefits do not accrue directly to the utility raising additional policy and budgeting issues regarding whether and how to incorporate those benefits for planning purposes Municipal utilities and governmental agencies have a stronger mandate to include a wider variety of non-energy benefits in energy efficiency planshyning than do investor-owned utilities (IOUs) Regulators of IOUs might also determine that these benefits should be considered Many of the benefits are difficult to quantify However non-energy benefits can also be conshysidered qualitatively when establishing the overall enershygy efficiency budget and in developing guidelines for targeting appropriate customers (eg low income or other groups)
Setting Energy Efficiency Targets and Allocating Budget
One of the biggest barriers to energy efficiency is develshyoping a budget to fund energy efficiency particularly at utilities or in states that havenrsquot had significant proshygrams historically This is a not strictly a resource planshyning issue but a regulatory policy and organizational issue as well The two main organizational approaches for funding energy efficiency are resource planning processes which establish the energy efficiency budget and targets within the planning process and public goods-funded charges which create a separate budget to support energy efficiency through a rate surcharge There are successful examples of both approaches as well as examples that use both mechanisms (California BPA PacifiCorp and Minnesota)
Setting targets for energy efficiency resource savings and budgets is a collaborative process between resource planning staff which evaluates cost-effectiveness and other key stakeholders Arguably all energy efficiency
2 California established a cost of $8ton of CO2 in 2004 escalating at 5 per year (CPUC 2005) 3 For further discussion see Bokenkamp et al 2005
To create a sustainable aggressive national commitment to energy efficiency 3-7
measures identified as cost effective in an integrated resource plan (IRP) should be implemented4 In practice a number of other factors must be considered For example the achievable level of savings and costs expertise and labor and ability to ramp up programs also affects the size scope and mix of energy efficiency programs All of these considerations plus the cost-effectiveness of enershygy efficiency should be taken into account when estabshylishing the funding levels for energy efficiency The fundshying process might also require an iterative process that describes the alternative plans to regulators and other stakeholders Some jurisdictions use a policy directive such as rdquoall cost-effective energy efficiencyrdquo (California) while others allocate a fixed budget amount (New York) specify a fixed percentage of utility revenue (Minnesota and Oregon) or a target load reduction amount (Texas)
Implementation of a target for electric and gas energy savings or Energy Efficiency Resources Standard (EERS) or Energy Efficiency Portfolio Standard (EEPS) such as the Energy Efficiency Goal adopted in Texas (PUCT Subst R sect25181) is an emerging policy tool adopted or being considered in a number of states (ACEEE 2006) Some states have adopted standards with flexibility for how utilities meet such targets such as savings by end users improvements in distribution system efficiency and market-based trading systems
Resource Planning Process
If energy efficiency is considered as a resource then the appropriate amount of energy efficient funding will be allocated through the utility planning process based on cost-effectiveness portfolio risk energy and capacity benefits and other criteria Many utilities find that a resource plan that includes energy efficiency yields a lower cost portfolio so overall procurement costs should decline more than the increase in energy efficiency program costs and the established revenue requirement of the utility will be sufficient to fund the entire supply and demand-side resource portfolio
A resource planning process that includes energy effishyciency must also include a mechanism to ensure cost-recovery of energy efficiency spending Most resource planning processes are collaborative forums to ensure that stakeholders understand and support the overall plan and its cost recovery mechanism In some cases utility costs might have to be shifted between utility functions (eg generation and transmission) to enable cost recovery for energy efficiency expenditures For example transmission owners might not see energy effishyciency as a non-wires solution to transmission system deficiencies because it is unclear to what extent energy efficiency costs can be collected in the Federal Energy Regulatory Commission (FERC) transmission tariff Therefore even if energy efficiency is less costly than the transmission upgrade it is unclear whether the transmisshysion upgrade budget can be shifted to energy efficiency and still collected in rates Another challenge for collecting efficiency funding in the transmission tariff is allocation of energy efficiency costs across multiple transmission owners particularly if energy efficiency costs are incurred by a single transmission owner while transmisshysion costs are shared among several owners
These examples demonstrate that in order to implement integrated resource planning the regulatory agency responsible for determining rates must allow rates designed to support transmission distribution or other functions to be used for efficiency The transmission companies in Connecticut have been allowed to include reliability-driven energy efficiency in tariffs although this is noted as an emergency situation not to be repeated as a normal course of business These interactions between regulatory policy and utility resource planning demonshystrate that utilities cannot be expected to act alone in increasing energy efficiency through their planning process
Public Purpose- or System Benefits Charge-Funded
Programs
One way to fund energy efficiency is to develop a separate funding mechanism collected in rates to support
4 Established cost-effectiveness tests such as the total resource cost (TRC) test are commonly used to determine the cost-effectiveness of energy efficiency programs Material from Chapter 6 Energy Efficiency Program Best Practices describes these tests in more detail
3-8 National Action Plan for Energy Efficiency
investment in energy efficiency In deregulated markets with unbundled rates this mechanism can appear as a separate customer charge often referred to as a system benefits charge (SBC) Establishing a public purpose charge has the advantage of ensuring policy-makers that there is an allocation of funding towards energy efficiency and can be necessary in deregulated markets where the delivery company cannot capture the savings of energy efficiency This approach separates the energy efficiency budget from the resource planning process however
Developing a new rate surcharge or expanding an existing surcharge also raises many of the questions addressed in Chapter 2 Utility Ratemaking amp Revenue Requirements For example are the customer segments paying into SBCs receiving a comparable level of energy efficiency assistance in return or are the increases a cross-subsidy Often industrial customers prefer to implement their own efficiency rather than contribute to a pool Also if the targets are used to set shareholder incentives the incentives should be appropriate for the aggressiveness of the program Additionally because the targeted budget allocation in public purpose-funded programs is often set independently of the utilityrsquos overall resource planning process (and is not frequently changed) utilities might not have funding available to procure all cost-effective savings derived from energy efficiency measures This type of scenario can result in potentially higher costs for customers than would occur if each cost-effective efficiency opportunity were pursued
Overcoming Challenges Alternative
Approaches
Successful incorporation of energy efficiency into the resource planning process requires utility executives resource planning staff regulators and other stakeholders to value energy efficiency as a resource and to be comshymitted to making it work within the utility or regional resource portfolio To illustrate approaches to overcoming these barriers we highlight several successful energy efficiency programs by California the New York State
Energy Research and Development Authority (NYSERshyDA) BPA Minnesota Texas and PacifiCorp The energy efficiency programs in these six regions demonstrate sevshyeral different ways to incorporate energy efficiency into planning processes in each example the economics generally work well for efficiency programs
The primary driver of energy efficiency in planning is the low levelized cost of energy savings Table 3-1 shows the reported levelized cost of electricity and natural gas effishyciency from three of the regions surveyed The reported utility cost of efficiency ranges between $001kilowattshyhour (kWh) and $003kWh for Pacific Gas amp Electric (PGampE) NYSERDA and the Northwest Power and Conservation Council (NWPCC) When including both utility program costs and customer costs the range is $003kWh to $005kWh The range of reported benefits for electric energy efficiency is from $006kWh to $008kWh For natural gas only PampGE reported specific natural gas efficiency measures these show similarly low levelized costs relative to benefits
Table 3-1 Levelized Costs and Benefits From Four Regions
Electric ($kWh) Natural Gas ($therm)
Utility Cost
Utility amp Customer
Cost
Benefit Utility Cost
Utility amp Customer
Cost
Benefit
PGampE 1 003 005 008 028 056 081
NYSERDA 2 001 003 006 NA NA NA
NWPCC 3 0024 NA 0060 NA NA NA
Texas 4 0025 NA 00606 NA NA NA
1 PGampE 2005 2 NYSERDA 2005 3 NWPCC 2005 4 Calculated based on Texas Utility Avoided Cost (PUCT Substantive Rule
sect2518 of 2000) $00268kWh for energy and $7850kW-year for capacity converted to $kWh based on assumption of 10-year measure life load factor of 264 percent which is calculated from Texasrsquo 2004 efficiency-based reductions of 193 MW of peak demand and 448 GWh of energy (Frontier Associates 2005)
5 Based on 2004 spending of $87 million 448 GWh annual Assumed life of 10 years (PUCT Substantive Rule sect25181 of 2000)
6 Based on Public Utility Commission of Texas (PUCT) Deemed Avoided Costs of $00268kWh for energy and $7850kW-year for capacity 448GWh and 193MW of peak load reduction
To create a sustainable aggressive national commitment to energy efficiency 3-9
California
California has had a continued commitment to energy efficiency since the late 1970s Two major efforts are curshyrently being coordinated in the state that address energy use in new buildings as well as efficiency upgrades in existing buildings Figure 3-2 shows the policy structure with the California Energy Commission (CEC) leading the building codes and standards process and the California Public Utility Commission (CPUC) leading the IOU and third-party administered efficiency programs Jointly the agencies publish the Energy Action Plan that explicitly states a goal to integrate rdquoall cost-effective energy efficiencyrdquo Recently the CPUC approved an effishyciency budget of $2 billion over the next three years to serve a population of approximately 35 million
The process for designing and implementing efficiency programs in California by the IOUs is to develop the proshygrams (either by the utility or through third-party solicishytation) evaluate cost-effectiveness establish and gain approval for the program funding and evaluate the proshygramrsquos success through MampV Figure 3-2 illustrates this approach
Table 3-2 describes how California addresses barriers for incorporating energy efficiency in planning for the IOU process
Source Energy and Environmental Economics Inc
3-10 National Action Plan for Energy Efficiency
Figure 3-3 California Investor-Owned Utility (IOU) Process
Resources and Ramp-up Limits
Rank and Estimate Potential for Cost Effective
Portfolios
Determine Target Energy Evaluate Program Funding Level
Efficiency Cost Effectiveness (through CPUC Programs
process)
CPUC Avoided Costs
Implement Approved
Programs to Approved Levels
Perform MampV and Adjust
Programs for Next Year
Source Energy and Environmental Economics Inc
Table 3-2 Incorporation of Energy Efficiency in Californiarsquos Investor-Owned Utilitiesrsquo Planning Processes
Barriers California CPUC-Administered Programs
A Determining the Value of Energy Efficiency
Energy Procurement
Estimated energy savings Customer adoption rates are forecast into the energy efficiency plans with monthly or quarterly reporting of program success for tracking
Valuing energy savings Energy savings are based on market prices of future electricity and natural gas adjusted by loss factors Emission savings are based on expected emission rates of marginal generating plants in each hour (electricity) or emissions for natural gas
Capacity amp Resource Adequacy
Estimating capacity savings Capacity savings are evaluated using the load research data for each measure
Valuing capacity benefits
Factors in achieving benefits
Each capacity-related value is estimated by climate zone of the state and incorporated into an rdquoall-inrdquo energy value Transmission and distribution capacity for electricity is allocated based on weather in each climate zone and by season for natural gas Californias energy market (currently) includes both energy and capacity so there is no explicit capacity value for electric generation
Capacity benefits are based on the best forecast of achieved savings There is no explicit link between forecasted benefits of energy efficiency and actual capacity savings
Other Benefits
Incorporating non-energy benefits Non-energy benefits are considered in the development of the portfolio of energy efficiency but not explicitly quantified in the avoided cost calculation
B Setting Targets and Allocating Budget
Quantity of energy efficiency to implement
Estimating program effectiveness
Institutional difficulty in reallocating budget
Cost expenditure timing vs benefits
Ensuring the program costs are recaptured
CPUC has approved budget and targets for the statersquos efficiency programs which are funded through both a public purpose charge and procurement funding
A portion of the public purpose funds are dedicated to evaluation measurement and verification with the goal of improving the understanding and quantification of savings and benefit estimates
By using public purpose funds budget doesnt have to be reallocated from other functions for energy efficiency
Capacity benefits are based on the best forecast of achieved savings
CPUC requires that the utilities integrate energy efficiency into their long-term procurement plans to address this issue
To create a sustainable aggressive national commitment to energy efficiency 3-11
Bonneville Power Administration Transmission Planning and Regional Roundtable
In the Northwest BPA has been leading an industry roundtable to work with distribution utilities local and state government environmental interests and other stakeholders to incorporate energy efficiency and other distributed energy resources (DER) into transmission planning DER includes energy efficiency as well as distrishybution generation and other nonwires solutions Figure 3-4 illustrates the analysis approach and data sources Within BPA the Transmission Business Line (TBL) works with the energy efficiency group in Power Business Line
(PBL) to develop an integrated transmission plan The process includes significant stakeholder contributions in both input data assumptions (led by NWPCC) and in reviewing the overall analysis at the roundtable5
Table 3-3 describes how BPA works with stakeholders to address barriers for incorporating energy efficiency in planning processes
Figure 3-4 BPA Transmission Planning Process
IOUs and Public Utilities
BPA Transmission Business Line Transmission
Planning
Regional Stakeholder Group BPA Roundtable Utilities interest groups other stakeholders discuss
issues and provide analysis review
Distributed resource analysis results
NWPCC Regional Planning Process
BPA PBL Efficiency Group Evaluate cost-effective DER based on transmission plan
and other forecasts
Load forecasts Publicly vetted energy
price forecasts conservation database
Transmission costs and
required DER load relief
Revise transmission plan as appropriate and fund transmission and
DER investments
Transmission plans
Group Data Decision
Source Energy and Environmental Economics Inc
5 NWPCC conducts regional energy efficiency planning More information can be found at lthttpwwwnwcouncilorggt
3-12 National Action Plan for Energy Efficiency
rsquoTable 3-3 Incorporation of Energy Efficiency in BPA s Planning Processes
Barriers BPA-Administered Programs
A Determining the Value of Energy Efficiency
Energy Procurement
Estimated energy savings The process uses the NWPCC database to define the measure impact and costs NWPCC maintains a publicly available regional efficiency database that is well regarded and has its own process for stakeholder collaboration Adoption rates are estimated based on a range of historical program success
Valuing energy savings Energy savings are valued based on the NWPCC long-run forecast of energy value for the region plus marginal losses
Capacity amp Resource Adequacy
Estimating capacity savings Capacity savings are based on expected NWPCC efficiency measure coincident peak impacts
Valuing capacity benefits The deferral value of transmission investments is used to evaluate the transmission capacity value which is the focus of these studies The approach is to calculate the difference in present value revenue requirement before and after the energy efficiency investment (Present Worth Method)
Factors in achieving benefits The BPA energy efficiency and transmission planning staff work together to ensure that the revised plan with Non-Construction Alternatives (NCAs) satisfies reliability criteria Ultimately the decision to defer transmission and rely on NCAs will be approved by transmission planning
Other Benefits
Incorporating non-energy benefits The analysis includes an evaluation of the environmental externalities but no other non-energy benefits
B Setting Targets and Allocating Budget
Quantity of energy efficiency to implement
The target for NCAs is established by the amount of load that must be reduced to defer the transmission line and maintain reliability This target is driven by the load growth forecasts of the utilities in the region
Estimating program effectiveness BPA has been doing demonstrations and pilots of high-potential NCAs to refine the estimates of program penetration cost necessary timeline for achieving load reductions customer acceptance and other factors The results of these pilots will help to refine the estimates used in planning studies
Institutional difficulty in reallocating budget
If NCAs have lower cost than transmission transmission capital budget will be reallocated to support NCA investments up to the transmission deferral value Additional costs of NCAs that are justified based on energy value are supported by other sources (BPA energy efficiency local utility programs and customers)
Cost expenditure timing vs benefits Both transmission and NCAs require upfront investments so there is no significant time lag between costs and benefits The transmission savings benefit is achieved concurrently with the decision to defer the transmission investment Energy benefits on the other hand occur over a longer timeframe and are funded like other energy efficiency programs
Ensuring the program costs are recaptured
By developing an internal planning process to reallocate budget it is easier to ensure that the savings occur
New York State Energy Research and Development Authority (NYSERDA)
In the mid-1990s New York restructured the electric utilshyities and moved responsibility for implementing energy efficiency programs to the NYSERDA The following figure shows an overview of the NYSERDA process The programs are funded through the SBC funds (approxishymately $175 million per year) and NYSERDA reports on the program impact and cost-effectiveness to the New York State Public Service Commission (NYS PSC) annually
Table 3-4 describes how NYSERDA addresses the barriers to implementing energy efficiency
Source Energy and Environmental Economics Inc
To create a sustainable aggressive national commitment to energy efficiency 3-13
rsquoTable 3-4 Incorporation of Energy Efficiency in NYSERDA s Planning Processes
Barriers NYSERDA-Administered Programs
A Determining the Value of Energy Efficiency
Energy Procurement
Estimating energy savings NYSERDA internally develops estimates of savings for individual energy efficiency programs and the portfolio in aggreshygate In addition NYSERDA accounts for free-riders and spillover effects (net to gross ratio) when estimating energy savings Savings estimates are verified and refined with an MampV program
Valuing energy savings A long-run forecast of electricity demand is developed using a production simulation model which is then calibrated to market prices An estimate of reduced market prices due to decreased demand is also included as a benefit
Capacity amp Resource Adequacy
Estimating capacity savings Similar to energy savings capacity savings are estimated for individual energy efficiency programs and the portfolio in aggregate Savings estimates are verified and refined with an MampV program
Valuing capacity benefits The value of generation capacity in New York is established by examining historical auction clearing prices in the NYISOrsquos unforced capacity market The baseline values are then escalated over time using a growth rate derived from NYSERDArsquos electric system modeling results These capacity costs are used to value those NYSERDA programs that effecshytively lower system peak demand
Factors in achieving benefits The capacity value is included as the best estimate of future capacity savings by New York utilities There is no direct link however between the forecasted savings and the actual change in utility procurement budgets
Other Benefits
Incorporating non-energy benefits The cost-effectiveness of NYSERDA programs is estimated using four scenarios of increasing NEB levels from (1) energy savings benefits (2) adding market price effects (3) adding non-energy benefits and (4) adding macro-economic effects of program spending
B Setting Energy Efficiency Targets
Quantity of energy efficiency to implement
The overall size of the NYSERDA program is determined by the aggregate funding level established by the NYS PSC NYSERDA with advice from the SBC Advisory Group recommends specific sub-program funding levels for approval by the staff at NYS PSC
Estimating program effectiveness NYSERDA prepares an annual report on program effectiveness including estimated and verified impacts and cost effecshytiveness which is then reviewed by the SBC Advisory Group and submitted to the NYS PSC
Institutional difficulty in reallocating budget
By establishing a separate state research and development authority to administer energy efficiency the institutional problems of determining and allocating budget towards energy efficiency are eliminated NYSERDA is supported primarily by SBCs collected by the utilities at the direction of NYS PSC
Cost expenditure timing vs benefits Similarly by funding the programs through an SBC the customers are directly financing the program thereby making the timing of benefits less important
Ensuring the program costs are recaptured
Forecasts of savings are based on the best estimate of future savings There is no direct link to ensure these savings actually occur
Minnesota
The Minnesota legislature passed the Conservation Improvement Program (CIP) in 1982 State law requires that (1) electric utilities that operate nuclear-power plants devote at least 2 percent of their gross operating revenue to CIP (2) other electric utilities devote at least 15 percent of their revenue and (3) natural gas utilities devote at least 05 percent Energy is supplied predomishynantly by two utilities Xcel which provides 49 percent of the electricity and 25 percent of the natural gas and CenterPoint Energy which provides 45 percent of the natural gas Facilities with a peak electrical demand of at least 20 megawatts (MW) are permitted to opt out of CIP and avoid paying the programrsquos rate adjustment in
their electric and natural gas bills (10 facilities have done so) While the Minnesota Department of Commerce oversees the CIP programs of all utilities in the state the department only has the authority to order changes in the programs of the IOUs
Utilities are required to file an IRP every 2 years using 5- 10- and 15-year planning horizons to determine the need for additional resources The statutory emphasis is on demand-side management (DSM) and renewable resources A utility must first show why these resources will not meet future needs before proposing traditional utility investments The plans are reviewed and approved by the Minnesota Public Utilities Commission CIP is the
3-14 National Action Plan for Energy Efficiency
Table 3-5 Incorporation of Energy Efficiency in Minnesotarsquos Planning Processes
Barriers Minnesota-Administered Programs
A Determining the Value of Energy Efficiency
Energy Procurement
Estimating energy savings Energy savings and avoided costs are determined independently by each utility resulting in a wide range of estimates that are not consistent Energy costs are considered a trade secret and not disclosed publicly Valuing energy savings
Capacity amp Resource Adequacy
Estimating capacity savings Capacity savings and avoided costs are determined independently by each utility resulting in a wide range of estimates that are not consistent Power plant transmission and distribution costs are considered trade secrets and are not disclosed publicly Valuing capacity benefits
Factors in achieving benefits There is no direct link between the forecasted capacity savings and the actual change in utility procurement budgets
Other Benefits
Incorporating non-energy benefits Differences in the utilitiesrsquo valuation methods produce varying estimates In addition the Department of Commerce incorporates an externality avoided cost in the electric societal cost benefit test providing utilities with values in $ton for several emissions which the utilities translate to amounts in $MWh based on each utilityrsquos emissions profile
B Setting Targets and Allocating Budget
Quantity of energy efficiency to implement
The Department of Commerce approves budget and targets for each utility Funding levels are determined by state law which requires 05 percent to 2 percent of utility revenues be dedicated to conservation programs depending on the type of utility
Estimating program effectiveness Program effectiveness is handled by each utility Minnesotarsquos IOUs rely on the software tools DSManager and BENCOST to measure electric and gas savings respectively
Institutional difficulty in reallocating budget
Budget is not reallocated from other functions Funding is obtained via a surcharge on customer bills
Cost expenditure timing vs benefits By using a percentage of revenue set-aside utility customers are directly financing the program therefore timing of benefits is not critical
Ensuring the program costs are recaptured
State law requires that each utility file an IRP with the Public Utilities Commission The conservation plans approved by the Department of Commerce are the primary mechanism by which utilities meet conservation targets included in their IRPs
primary mechanism by which the electric utilities achieve the conservation targets included in their IRPs
The Department of Commerce conducts a biennial review of the CIP plan for each investor-owned utility Interested parties may file comments and suggest altershynatives before the department issues a decision approvshying or modifying the utilityrsquos plan Utilities that meet or exceed the energy savings goals established by the Department of Commerce receive a financial bonus which they are permitted to collect through a rate increase Both electric utilities have exceeded their goals for the last several years Table 3-5 describes how the Minnesota Department of Commerce addresses barriers to implementing energy efficiency
Texas
Texas Senate Bill 7 (1999) enacted in the 1999 Texas legislature mandates that at least 10 percent of an investor-owned electric utilityrsquos annual growth in electricity demand be met through energy efficiency programs each year The Public Utility Commission of Texas (PUCT) Substantive Rule establishes procedures for meeting this legislative mandate directing the transmission and distrishybution (TampD) utilities to hire third-party energy efficiency providers to deliver energy efficiency services to every customer class using ldquodeemed savingsrdquo estimates for each energy efficiency measure (PUCT 2000) Approved program costs are included in the IOUrsquos transmission and distribution rates and expenditures are reported separately in the IOUrsquos annual energy efficiency report to the PUCT Actual energy and capacity savings are verified by independent experts chosen by the PUCT Incentives are based on prescribed avoided costs which are set by
To create a sustainable aggressive national commitment to energy efficiency 3-15
Table 3-6 Incorporation of Energy Efficiency in Texasrsquo Planning Processes
Barriers Texas-Administered Programs
A Determining the Value of Energy Efficiency
Energy Procurement
Estimating energy savings Energy savings are based on either deemed savings or through MampV All savings estimates are subject to verification by a commission-appointed MampV expert
Valuing energy savings Avoided costs shall be the estimated cost of new gas turbine which for energy was initially set in PUCT section 25181shy5 to be $00268 kWh saved annually at the customerrsquos meter
Capacity amp Resource Adequacy
Estimating capacity savings Capacity savings are based on either deemed savings or through MampV All savings estimates are subject to verification by a commission-appointed MampV expert
Valuing capacity benefits Avoided costs shall be the estimated cost of new gas turbine which for capacity was initially set in PUCT section 25181-5 to be $785kW saved annually at the customerrsquos meter
Other Benefits
Incorporating non-energy benefits Environmental benefits of up to 20 percent above the cost effectiveness standard can be applied for projects in an area that is not in attainment of ambient air quality standards
B Setting Energy Efficiency Targets
Quantity of energy efficiency to implement
Senate Bill 7 (SB7) mandates that beginning in 2004 at least 10 percent of an investor-owned electric utilityrsquos annual growth in electricity demand be met through energy efficiency programs each year (based on historic five-year growth rate for the firm) Funding for additional programs is available if deemed cost-effective
Estimating program effectiveness Each year the utility submits to the PUCT an energy efficiency plan for the year ahead and an energy efficiency report for the past year The plan must be approved by the commission and the year-end report must include information regarding the energy and capacity saved Also independent MampV experts selected by the commission to verify the achieved savings as reported in each utilityrsquos report
Institutional difficulty in reallocating budget
Funds required for achieving the energy efficiency goal are included in transmission and distribution rates and energy efficiency expenditures are tracked separately from other expenditures
Cost expenditure timing vs benefits By using a percentage of revenue set aside utility customers directly finance the program therefore timing of benefits is not critical
Ensuring the program costs are recaptured
The annual energy efficiency report submitted by the IOU to the PUCT includes energy and capacity savings program expenditures and unspent funds There is no verification that the estimated avoided costs are captured in utility savings
the PUCT El Paso Electric Company will be included in the program beginning with an efficiency target of 5 pershycent of growth in 2007 and 10 percent of growth in 2008
The 2004 report on Texasrsquo program accomplishments highlights the level of savings and success of the program ldquoIn 2004 the investor-owned utilities in Texas achieved their statewide goals for energy efficiency once again 193 MW of peak demand reduction was achieved which was 36 above its goal of 142 MW In addition 448 gigawatt-hours (GWh) of demand eduction was achieved These energy savings correspond to a reduction of 1460352 pounds of nitrogen oxide (NOX) emissions Incentives or rebates were provided to project sponsors to offset the costs of a variety of enershygy efficiency improvements Two new energy efficiency
programs were voluntarily introduced by the Texas utilishytiesrdquo Table 3-6 describes how Texas utilities address barshyriers to implementing energy efficiency
PacifiCorp
PacifiCorp is an investor-owned utility with more than 8400 MW of generation capacity that serves approxishymately 16 million retail customers in portions of Utah Oregon Wyoming Washington Idaho and California PacifiCorp primarily addresses its energy efficiency planshyning objectives as part of its IRP process Efficiency-based measures are evaluated based on their effect on the overall cost of PacifiCorprsquos preferred resource portfolio defined as the overall supply portfolio with the best balshyance of cost and risk
3-16 National Action Plan for Energy Efficiency
Additionally some states that are in PacifiCorprsquos service terrishytory such as Oregon and California also mandate that the company allocate funds for efficiency under related statewide public goods regulations ldquoIn Oregon SB 1149 requires that investor-owned electric companies collect from all retail customers a public purpose charge equal to 3 of revenues collected from customers Of this amount 57 (17 of revenues) goes toward Class 2 [energy efficiency-based] demand side management (DSM) The Energy Trust of Oregon (ETO) was set up to determine the manner in which public purpose funds will be spentrdquo(PacifiCorp 2005) Using the IRP model to determine investment in enershygy efficiency however PacifiCorp allocates more money to efficiency than required by state statute
As of the 2004 IRP PacifiCorp planned to implement a base of 250 average megawatts (aMW) of energy efficiency and to seek an additional 200 aMW of new efficiency programs if cost-effective options could be identified PacifiCorp models the impact of energy effishyciency as a shaped load reduction to their forecasted load and computes the change in supply costs with and without the impact of DSM This approach allows differshyent types of DSM to receive different values based on the alternative supply costs in different parts of the PacifiCorp service territory For example the IRP plan indicates that ldquoresidential air conditioning decrements produce the highest value [in the East and West]
Table 3-7 Incorporation of Energy Efficiency in PacifiCorprsquos Planning Processes
Barriers PacifiCorp-Administered Programs
A Determining the Value of Energy Efficiency
Energy Procurement
Estimating energy savings The load forecast in the IRP is reduced by the amount of energy projected to be saved by existing programs existing programs that are expanded to other states and new cost-effective programs that resulted from the 2003 DSM request for proposals (RFPs) These load decrements have hourly shapes based on the types of measures installed for each program
Valuing energy savings Efficiency-based (or Class 2) DSM programs are valued based on cost effectiveness from a utility cost test perspective minimizing the present value revenue requirement The IRP (using the preferred portfolio of supply-side resources) is run with and without these DSM decrements and their value in terms of cost-savings is calculated as the difference in revenue requirements for that portfolio with and without these Class 2 load reductions
Capacity amp Resource Adequacy
Estimating capacity savings
Valuing capacity benefits
PacifiCorp explicitly evaluates the capacity value of dispatchable and price-based DSM or lsquoClass 1rsquo DSM and the ability to hit target reserve margins in the system with these resources The IRP resulted in a recommendation to defer three different supply-side projects The capacity benefits of more traditional energy efficiency programs are not explicitly evaluated however the planned energy efficiency reductions are used to update the load forecast in the next yearrsquos IRP which could result in additional deferrals
Capacity savings are valued at the forecasted costs of displaced generation projects By integrating the evaluation of DSM into the overall portfolio the value of energy efficiency is directly linked to specific generation projects It does not appear that PacifiCorp evaluates the potential for avoided transmission and distribution capacity
Other Benefits
Incorporating non-energy benefits Non-energy benefits are considered in the selection of a preferred portfolio of resources but the non-energy benefits of efficiency are not explicitly used in the IRP
B Setting Energy Efficiency Targets
Quantity of energy efficiency to implement
Estimating program effectiveness
Institutional difficulty in reallocating budget
Cost expenditure timing vs benefits
Ensuring the program costs are recaptured
As part of the 2004 IRP PacifiCorp determined that a base of 250 aMW of efficiency should be included in the goals for the next 10 years and that an additional 200 aMW should be added if cost-effective programs could be identified
Measurement methodology for new projects is not explicitly identified in the IRP but values from existing programs and the forecasted load shapes for PacifiCorprsquos customers will be used to predict benefits
Funding is integrated into the overall process of allocating budget to resource options (both supply side and demand side) and faces only challenges associated with any resource option namely proof of cost-effective benefit to the resource portfolio
The IRP process for PacifiCorp seeks to gain the best balance of cost and risk using the present value of revenue requireshyments which accounts for timing issues associated with any type of resource evaluated including efficiency
Successive IRPs will continue to evaluate the cost-effectiveness of energy efficiency programs to determine their effect on overall costs of the resource portfolio
To create a sustainable aggressive national commitment to energy efficiency 3-17
Programs with this end use impact provide the most value to PacifiCorprsquos system because they reduce demand during the highest use hours of the year sumshymer heavy load hours The commercial lighting and sysshytem load shapes with the highest load factors provide the lowest avoided costsrdquo It does not appear that PacifiCorp recomputes the overall risk of its portfolio with increased energy efficiency Table 3-7 describes how PacifiCorp addresses barriers to implementing energy efficiency
Key Findings
This section describes the common themes in the approaches used to navigate and overcome the barriers to incorporating energy efficiency in the planning process While there are many approaches to solving each issue the following key findings stand out
bull Cost and Savings Data for Energy Efficiency Measures Are Readily Available Given the long history of energy efficiency programs in several regions existing resources to assist in the design and implementation of energy efficiency programs are widely available Both California and the Northwest maintain extensive pubshylicly available online databases of energy efficiency measures and impacts the Database for Energy Efficiency Resources (DEER) in California6 and NWPCC Database in the Northwest7 DEER includes both elecshytricity and natural gas measures while NWPCC contains only electricity measures These databases incorporate a number of factors affecting savings estimates including climate zones building type building vintage and cusshytomer usage patterns Energy efficiency and resource planning studies containing detailed information on efficiency measures are available for regions throughout the United States It is often possible to adjust existing data for use in a specific utility service area with relatively straightforward assumptions
bull Energy Capacity and Non-Energy Benefits Can Justify Robust Energy Efficiency Programs Energy savings alone are usually more than sufficient to justify and fund a wide range of efficiency measures for elecshytricity and natural gas However the capacity and non-energy benefits of energy efficiency are important factors to consider in assessing energy efficiency measures on an equal basis with traditional utility investments In practice policy budget expertise and human resources are the more limiting constraints to effectively incorporating energy efficiency into planning
mdash Estimating the quantity and value of energy savings is relatively straightforward Well-established methods for estimating the quantity and value of energy savings have been used in many regions and forums All of the regional examples for estimating energy and capacity savings for energy efficiency evaluate the savings for an individual measure using either measurements or engineering simulation and then aggregate these by the expected number of cusshytomers who will adopt the measure Both historical and forward market prices are readily available parshyticularly for natural gas where long-term forward markets are more developed
mdash Estimating capacity savings is more difficult but challenges are being overcome Capacity savings depend more heavily on regional weather conditions and timing of the peak loads and therefore are difficult to estimate Results from one region do not readily transfer to another Also publicly available market data for capacity are not as readily available as for energy even though the timing and location of the savings are critical Because potential capacity savings are larger for electricity energy efficiency than natural gas capturing capacity value is a larger issue for electric utilities Production simulation can explicitly evaluate the change in power plant investshyment and impact of such factors as re-dispatch due
to transmission constraints variation in load growth
6 The DEER Web site description and history can be found at httpwwwenergycagovdeer The DEER database of measures can be found at httpeegacpuccagovdeer
7 The NWPCC Web site comments and efficiency measure definition can be found at httpwwwnwcouncilorgcommentsdefaultasp
3-18 National Action Plan for Energy Efficiency
and other factors But these models are analytically complex and planning must be tightly integrated with other utility planning functions to accurately assess savings These challenges can and have been overcome in different ways in regions with a long track-record of energy efficiency programs (eg California BPA New York)
mdash Estimating non-energy benefits is an emerging approach in many jurisdictions Depending on the jurisdiction legislation and regulatory commission policies might expressly permit and even require the consideration of non-energy benefits in cost-effecshytiveness determinations However specific guidelines regarding the quantification and inclusion of non-energy benefits are still under discussion or in develshyopment in most jurisdictions The consideration of both non-energy and capacity benefits of energy efficiency programs is relatively new compared to the long history of valuing energy savings
bull A Clear Path to Funding Is Needed to Establish a Budget for Energy Efficiency Resources There are three main approaches to funding energy efficiency investments 1) utility resource planning processes 2) public purpose funding and 3) a combination of both In a utility resource planning process such as the BPA non-construction alternatives process efficiency options for meeting BPArsquos objectives are compared to potential supply-side investments on an equal basis when allocating the available budget In this type of resource planning process budget is allocated to effishyciency measures from each functional area according to the benefits provided by efficiency programs The advantage of this approach is that the budget for effishyciency is linked directly to the savings it can achieve however particularly in the case of capacity-related benefits which have critical timing and load reduction targets to maintain reliability it is a difficult process
The public purpose funding and SBC approaches in New York Minnesota and other states are an alternashytive to budget reallocation within the planning process In California funding from both planning processes and public purpose funding is used Public purpose funds do not have the same direct link to energy savshyings so programs might not capture all the savings attributed to the program Funding targets might be set before available efficiency options have been explored so if other cost-effective efficiency measures are later identified additional funding might not be available This situation can result in customer costs being higher than they would have been if all cost-effective efficiency savings opportunities had been supshyported Using public purpose funding significantly simshyplifies the planning process however and puts more control over the amount of energy efficiency in the control of regulators or utility boards As compared to resource planning far less time and effort are required on the part of regulators or legislators to direct a specific amount of funding to cost-effective efficiency programs
bull Integrate Energy Efficiency Early in the Resource Planning Process In order to capture the full value of deferring the need for new investments in capacity energy efficiency must be integrated early in the planshyning process This step will avoid sunk investment assoshyciated with longer lead-time projects Efficiency should also be planned to target investments far enough into the future so that energy efficiency programs have the opportunity to ramp up and provide sufficient load reduction This timeline will allow the utility to build expertise and establish a track record for energy effishyciency as well as be able to monitor peak load reducshytions Starting early also allows time to gain support of the traditional project proponents before they are vested in the outcome
To create a sustainable aggressive national commitment to energy efficiency 3-19
Recommendations and Options
The National Action Plan for Energy Efficiency Leadership Group offers the following recommendations as ways to overcome many of the barriers to energy efficiency in resource planning and provides a number of options for consideration for consideration by utilities regulators and stakeholders (as presented in the Executive Summary)
Recommendation Recognize energy efficiency as a high
priority energy resource Energy efficiency has not been consistently viewed as a meaningful or dependable resource compared to new supply options regardless of its demonstrated contributions to meeting load growth Recognizing energy efficiency as a high-priority energy resource is an important step in efforts to capture the benefits it offers and lower the overall cost of energy services to customers Based on jurisdictional objectives energy efficiency can be incorporated into resource plans to account for the long-term benefits from energy savings capacity savings potential reductions of air polshylutants and greenhouse gases as well as other benefits The explicit integration of energy efficiency resources into the formalized resource planning processes that exist at regional state and utility levels can help estabshylish the rationale for energy efficiency funding levels and for properly valuing and balancing the benefits In some jurisdictions these existing planning processes might need to be adapted or even created to meaningfully incorporate energy efficiency resources into resource planning Some states have recognized energy efficiency as the resource of first priority due to its broad benefits
Options to Consider
bull Establishing policies to establish energy efficiency as a priority resource
bull Integrating energy efficiency into utility state and regional resource planning activities
bull Quantifying and establishing the value of energy effishyciency considering energy savings capacity savings and environmental benefits as appropriate
Recommendation Make a strong long-term commitment
to implement cost-effective energy efficiency as a
resource Energy efficiency programs are most successshyful and provide the greatest benefits to stakeholders when appropriate policies are established and mainshytained over the long-term Confidence in long-term stashybility of the program will help maintain energy efficiency as a dependable resource compared to supply-side resources deferring or even avoiding the need for other infrastructure investments and maintain customer awareness and support Some steps might include assessing the long-term potential for cost-effective enershygy efficiency within a region (ie the energy efficiency that can be delivered cost-effectively through proven programs for each customer class within a planning horishyzon) examining the role for cutting-edge initiatives and technologies establishing the cost of supply-side options versus energy efficiency establishing robust MampV proceshydures and providing for routine updates to information on energy efficiency potential and key costs
Options to Consider
bull Establishing appropriate cost-effectiveness tests for a portfolio of programs to reflect the long-term benefits of energy efficiency
bull Establishing the potential for long-term cost-effective energy efficiency savings by customer class through proven programs innovative initiatives and cutting-edge technologies
bull Establishing funding requirements for delivering long-term cost-effective energy efficiency
bull Developing long-term energy saving goals as part of energy planning processes
bull Developing robust MampV procedures
bull Designating which organization(s) is responsible for administering the energy efficiency programs
bull Providing for frequent updates to energy resource plans to accommodate new information and technology
3-20 National Action Plan for Energy Efficiency
Recommendation Broadly communicate the benefits of
and opportunities for energy efficiency Experience shows that energy efficiency programs help customers save money and contribute to lower cost energy sysshytems But these benefits are not fully documented nor recognized by customers utilities regulators or policy-makers More effort is needed to establish the business case for energy efficiency for all decision-makers and to show how a well-designed approach to energy efficiency can benefit customers utilities and society by (1) reducing customersrsquo bills over time (2) fostering financially healthy utilities (eg return on equity earnings per share and debt coverage ratios unaffected) and (3) conshytributing to positive societal net benefits overall Effort is also necessary to educate key stakeholders that although energy efficiency can be an important low-cost resource to integrate into the energy mix it does require funding just as a new power plant requires funding
Options to Consider
bull Establishing and educating stakeholders on the business case for energy efficiency at the state utility and other appropriate level addressing customer utility and societal perspectives
bull Communicating the role of energy efficiency in lowering customer energy bills and system costs and risks over time
Recommendation Provide sufficient timely and stable
program funding to deliver energy efficiency where
cost-effective Energy efficiency programs require consisshytent and long-term funding to effectively compete with energy supply options Efforts are necessary to establish this consistent long-term funding A variety of mechashynisms has been and can be used based on state utility and other stakeholder interests It is important to ensure that the efficiency program providers have sufficient long-term funding to recover program costs and impleshyment the energy efficiency measures that have been demonstrated to be available and cost-effective A number of states are now linking program funding to the achievement of energy savings
Options to Consider
bull Deciding on and committing to a consistent way for program administrators to recover energy efficiency costs in a timely manner
bull Establishing funding mechanisms for energy efficiency from among the available options such as revenue requirements or resource procurement funding SBCs rate-basing shared-savings incentive mechanisms etc
bull Establishing funding for multi-year periods
To create a sustainable aggressive national commitment to energy efficiency 3-21
References
American Council for an Energy Efficient Economy [ACEEE] (2006 February) Energy Efficiency Resource Standards Experience and Recommendations lthttpaceeeorgpubseo63htmgt
Bokenkamp K LaFlash H Singh V and Wang D (2005 July) Hedging Carbon Risk Protecting Customers and Shareholders from the Financial Risk Associated with Carbon Dioxide Emissions The Electricity Journal 10(6)11ndash24
California Public Utilities Commission [CPUC] (2005 April 7) Interim Opinion On E3 Avoided Cost Methodology Order Instituting Rulemaking to Promote Consistency in Methodology and Input Assumptions in Commission Applications of Short-Run and Long-run Avoided Costs Including Pricing for Qualifying Facilities Rulemaking 04-04-025 (Filed April 22 2004) lthttpwwwethreecom CPUC45195pdfgt
Frontier Associates (2005 November 1) Energy Efficiency Accomplishments on the Texas Investor Owned Utilities (Calendar Year 2004)
McAluliffe P (2003 June 20) Presentation to the California Energy Commission
New York State Energy Research and Development Authority [NYSERDA] (2005 May) New York Energy $martSM Program Cost-Effectiveness Assessment Albany New York
Northwest Power and Conservation Council [NWPCC] (2005 May) The 5th Northwest Electric Power and Conservation Plan lthttpwwwnwcouncilorg energy powerplandefaulthtmgt
Pacific Gas amp Electric Company [PGampE] (2005 June) 2006-2008 Energy Efficiency Program Portfolio Volume I Prepared Testimony
PacifiCorp (2005 January) 2004 Integrated Resource Plan lthttpwwwpacificorpcomNavigation Navigation23807htmlgt
Public Utilities Commission of Texas [PUCT] (2000 March) Substantive Rule sect25181 Energy Efficiency Goal lthttpwwwpucstatetxusrules subruleselectric2518125181pdfgt
Texas Senate Bill 7 Section 39905 (1999) lthttpwwwcapitolstatetxus cgi-bintlotextframecmdLEG=76ampSESS= RampCHAMBER=SampBILLTYPE=BampBILLSUFFIX= 00007ampVERSION=5ampTYPE=Bgt
Vermont Public Service Board (2005 July 20) Docket 7081 Investigation into Least-Cost Integrated Resource Planning for Vermont Electric Power Company Incs Transmission System
3-22 National Action Plan for Energy Efficiency
4Business Case for Energy Efficiency
A well-designed approach to energy efficiency can benefit utilities customers and society by (1) fostering financially healthy utilities (2) reducing customersrsquo bills over time and (3) contributing to positive societal net benefits overall By establishing and communicating the business case for energy efficiency across utility customer and societal perspectives cost-effective energy efficiency can be better integrated into the energy mix as an important low-cost resource
Overview
Energy efficiency programs can save resources lower utility costs and reduce customer energy bills but they also can reduce utility sales Therefore the effect on utility financial health must be carefully evaluated and policies might need to be modified to keep utilities financially healthy (return on equity [ROE] earnings per share debt coverage ratios unaffected) as they pursue efficiency The extent of the potential economic and environmental benefits from energy efficiency the impact on a utilityrsquos financial results and the importance of modifying existshying policies to support greater investment in these energy efficiency programs depend on a number of market conshyditions that can vary from one region of the country to another
To explore the potential benefits from energy efficiency programs and the importance of modifying existing polishycies a number of business cases have been developed These business cases show the impact of energy efficiency investments on the utilityrsquos financial health and earnings customer energy bills and social resources such as net
Leadership Group Recommendation Applicable to the Business Case for Energy Efficiency
bull Broadly communicate the benefits of and opportunities for energy efficiency
A more detailed list of options specific to the objective of promoting the business case for energy efficiency is provided at the end of this chapter
Key Findings From the Eight Business Cases Examined
bull For both electric and gas utilities energy efficiency investments consistently lower costs over time for both utilities and customers while providing positive net benefits to society When enhanced by ratemaking policies to address utility financial barriers to energy efficiency such as decoupling the utilityrsquos revenues from sales volumes utility financial health can be maintained while comprehensive cost-effective energy efficiency programs are implemented
bull The costs of energy efficiency and reduced sales volume might initially raise gas or electricity bills due to slightly higher rates from efficiency investshyment and reduced sales However as the effishyciency gains help participating customers lower their energy consumption the decreased energy use offsets higher rates to drive their total energy bills down In the eight cases examined average customer bills were reduced by 2 percent to 9 percent over a ten year period compared to the no-efficiency scenario
bull Investment in cost-effective energy efficiency programs yield a net benefit to societymdashon the order of hundreds of millions of dollars in net present value (NPV) for the illustrative case studies (small- to medium-sized utilities)
To create a sustainable aggressive national commitment to energy efficiency 4-1
efficiency costs and pollutant emissions The business cases were developed using an Energy Efficiency Benefits Calculator (Calculator) that facilitates evaluation of the financial impact of energy efficiency on its major stakeshyholdersmdashutilities customers and society The Calculator allows users to examine efficiency investment scenarios across different types of utilities using transparent input assumptions (see Appendix B for detailed inputs and results)1 Policies evaluated with the Calculator are discussed in more detail in Chapter 2 Utility Ratemaking amp Revenue Requirements and Chapter 3 Energy Resource Planning Processes
Eight business cases are presented to illustrate the impact of comprehensive energy efficiency programs on utilities their customers and society The eight cases represent a range of utility types under different growth and investment situations Each case compares the consequences of three scenariosmdashno energy efficiency programs without a decoupling mechanism energy effishyciency without decoupling and energy efficiency with decoupling Energy efficiency spending was assumed to be equal to 2 percent of electricity revenue and 05 pershycent of natural gas revenue across cases regardless of the decoupling assumption these assumptions are similar to many of the programs being managed in regions of the country today2 In practice decoupling and shareshyholder incentives often lead to increased energy efficiency investments by utilities increasing customer and societal benefits
Business Cases Evaluated
Cases 1 and 2 Investor-Owned Electric and Natural Gas Utilitiesbull Case 1 Low-Growth bull Case 2 High-Growth
Cases 3 and 4 Electric Power Plant Deferral bull Case 3 Low-Growth bull Case 4 High-Growth
Cases 5 and 6 Investor-Owned Electric Utility Structurebull Case 5 Vertically Integrated Utility bull Case 6 Restructured Delivery-Only Utility
Cases 7 and 8 Publicly and CooperativelyOwned Electric Utilitiesbull Case 7 Minimum Debt Coverage Ratio bull Case 8 Minimum Cash Position
Table 4-1 provides a summary of main assumpshytions and results of the business cases
Table 4-1 summarizes assumptions about the utility size energy efficiency program and each business case All values shown compare the savings with and without energy efficiency over a 15-year horizon The present value calculations are computed over 30 years to account for the lifetime of the energy efficiency investshyments over 15 years
1 The Calculator was designed to assess a wide variety of utility types using easily obtainable input data It was not designed for applications requiring detailed data for specific applications such as rate setting comparing different types of energy efficiency policies cost-effectiveness testing energy efficiency resource planning and consumer behavior analysis
2 See Chapter 6 Energy Efficiency Program Best Practices for more information on existing programs 3 Cumulative and NPV business case results are calculated using a 5 percent discount rate over 30 years to include the project life term for energy effishy
ciency investments of 15 years All values are in nominal dollars with NPV reported in 2007 dollars (year 1 = 2007) Consistent rates are assumed in year 0 and then adjusted by the Calculator for case-specific assumptions Reductions in utility revenue requirement do not change with decoupling in the Calculator but might in practice if decoupling motivates the utility to deliver additional energy efficiency In these cases societal benefits conservativeshyly equals only the savings from reduced wholesale electricity purchases and capital expenditures minus utility and participant costs of energy efficiency Energy efficiency program costs given in $megawatt-hour (MWh) for electric utilities and $million British thermal units (MMBtu) for gas utilities
4-2 National Action Plan for Energy Efficiency
Tab
le 4
-1
Su
mm
ary
of
Ma
in A
ssu
mp
tio
ns a
nd
Re
su
lts f
or
Ea
ch B
usin
ess C
ase
An
aly
zed
3
To create a sustainable aggressive national commitment to energy efficiency
Case
1
Case
2
Low
Lo
w
Gro
wth
G
row
th
Elec
tric
El
ectr
ic
Uti
lity
Uti
lity
Case
3
Case
4
Low
Gro
wth
Lo
w G
row
th
wit
h 20
09
wit
h 20
09
Pow
er
Pow
er
Plan
t Pl
ant
Case
5
Case
6
Vert
ical
D
eliv
ery
Uti
lity
Uti
lity
Case
7
Case
8
Elec
tric
El
ectr
ic
Publ
icC
oop
Publ
icC
oop
Deb
t Co
vera
ge
No
Deb
t Ra
tio
Uti
lity
Size
Annu
al R
even
ue ($
MM
) - Y
ear 0
Peak
Loa
d (M
W) o
r Sal
es (B
cF) -
Yea
r 0
$284
$2
84
600
MW
60
0 M
W
$284
$2
84
600
MW
60
0 M
W
$284
$2
84
600
MW
60
0 M
W
$237
$2
37
600
MW
60
0 M
W
Para
met
er T
este
d Lo
ad
Load
G
row
th
Gro
wth
Lo
ad G
row
th
Load
Gro
wth
Ve
rtic
al
Deliv
ery
Util
ity
Util
ity
Debt
Cov
erag
e Ca
sh P
ositi
onRa
tio
Ass
umpt
ions
Tha
t D
iffe
r Be
twee
nCa
ses
Load
Gro
wth
Ass
umpt
ion
Aver
age
Rate
- Ye
ar 1
1
5
$01
2M
Wh
$01
2M
Wh
1
5
$01
2M
Wh
$01
2M
Wh
2
2
$01
2M
Wh
$01
2M
Wh
2
2
$01
0M
Wh
$01
0M
Wh
EE P
rogr
am
Cum
ulat
ive
Savi
ngs
(EE
vs N
o EE
cas
e)
Util
ity S
pend
ing
as P
erce
nt o
f Rev
enue
()
Annu
al U
tility
Spe
ndin
g (N
PV in
$M
M)
EE P
roje
ct L
ife Te
rm (y
ears
)
Perc
ent o
f Gro
wth
Sav
ed
Tota
l Cos
t of E
E in
Yea
r 0 ($
MW
h or
$M
MBt
u)
Util
ity C
ost i
n Ye
ar 0
($M
Wh
or $
MM
Btu)
Cust
omer
Cos
t in
Year
0 ($
MW
h or
$M
MBt
u)
810
5 G
Wh
810
5 G
Wh
20
2
0
$70
$70
15
15
142
21
$35
00
$35
00
$20
00
$20
00
$15
00
$15
00
810
5 G
Wh
810
5 G
Wh
20
2
0
$70
$70
15
15
142
21
$35
00
$35
00
$20
00
$20
00
$15
00
$15
00
810
5 G
Wh
810
5 G
Wh
20
2
0
$70
$70
15
15
66
66
$35
00
$35
00
$20
00
$20
00
$15
00
$15
00
675
4 G
Wh
675
4 G
Wh
20
2
0
$58
$58
15
15
55
55
$35
00
$35
00
$20
00
$20
00
$15
00
$15
00
Busi
ness
Cas
e Re
sult
s(N
PV in
$M
M)
Redu
ctio
n in
Rev
enue
Req
uire
men
t ($M
M)
o
f Tot
al R
even
ue R
equi
rem
ent
Net
Cus
tom
er S
avin
gs -
no d
ecou
plin
g ($
MM
)
o
f Tot
al C
usto
mer
Bill
s
Net
Cus
tom
er S
avin
gs -
deco
uplin
g ($
MM
)
o
f Tot
al C
usto
mer
Bill
s
Net
Soc
ieta
l Sav
ings
($M
M)
o
f Tot
al S
ocie
tal C
ost
$396
$3
18
55
3
0
$504
$3
72
70
3
5
$344
$2
66
48
2
5
$289
$2
58
237
5
211
9
$476
$3
38
60
3
0
$608
$3
75
77
3
3
$424
$2
86
54
2
5
$332
$2
69
272
6
221
0
$372
$3
48
41
4
4
$447
$4
37
64
5
6
$320
$2
96
45
3
8
$282
$2
71
67
22
22
$288
$2
70
40
4
3
$459
$2
66
64
4
2
$245
$2
26
434
36
$225
$2
25
222
2
222
2
Air
Em
issi
on S
avin
gs10
00 To
ns C
O2
Tons
NO
x 31
1 31
1 61
61
31
1 31
1 61
61
31
1 31
1 61
61
25
9 25
9 51
51
EE P
rogr
am R
esul
ts d
o no
t cha
nge
whe
n de
coup
ling
is a
ctiv
ated
Reve
nue
Requ
irem
ent a
nd N
et S
ocie
tal S
avin
gs d
o no
t cha
nge
with
dec
oupl
ing
Busi
ness
Cas
e re
sults
are
the
diffe
renc
e be
twee
n th
e N
o EE
and
EE
case
s
Air E
miss
ion
Savi
ngs
are
the
diffe
renc
e be
twee
n N
o EE
and
EE
case
s an
d do
not
cha
nge
whe
n de
coup
ling
is ac
tivat
ed
Case
1
Case
2
Hig
h Lo
w G
row
th
Gro
wth
G
as U
tilit
y G
as U
tilit
y
$344
$3
44
33 B
cF
33 B
cF
Load
Gro
wth
Lo
ad G
row
th
0
2
$1th
erm
$1
ther
m
31 B
cF
31 B
cF
05
0
5
$21
$21
15
15
410
18
$30
0 $3
00
$15
0 $1
50
$15
0 $1
50
$211
$1
42
38
2
2
$258
$1
56
46
2
4
$158
$9
0
28
1
4
$143
$1
19
338
0
282
6
128
128
107
107
BcF
=
billi
on
cubi
c fe
et
CO2
=
carb
on
diox
ide
EE
=
ener
gy
effic
ienc
y G
Wh
=
giga
wat
t-ho
ur
NO
x =
ni
trou
s ox
ides
$M
M
=
mill
ion
dolla
rs
MM
Btu
=
mill
ion
Briti
sh
ther
mal
un
its
MW
h =
meg
awat
t-ho
ur N
PV =
net
pre
sent
val
ue
4-3
While these eight business cases are not comprehensive they allow some generalizations about the likely financial implications of energy efficiency investments These genshyeralizations depend upon the three different perspecshytives analyzed
bull Utility Perspective The financial health of the utility is modestly impacted because the introduction of energy efficiency reduces sales If energy efficiency is accomshypanied with mechanisms to protect shareholdersmdash such as a decoupling mechanism to buffer revenues and profits from sales volumesmdashthe utilityrsquos financial situation can remain neutral to the efficiency investshyments4 This effect holds true for both public and investor-owned utilities
bull Customer Perspective Access to energy efficiency drives customer bills down over time Across the eight case studies energy bills are reduced by 2 percent to 9 percent over a 10 to 15-year period Even though the efficiency investment and decreased sales drives rates slightly higher this increase is more than offset in average customer bills due to a reduction in energy usage
bull Societal Perspective The monetary benefits from energy efficiency exceed costs and are supplemented by other benefits such as lower air emissions
Generalizations may also be made about the impact of policies to remove the throughput incentive such as decoupling mechanisms across these business cases5
These generalizations include
bull Utility Perspective Policies that remove the throughput incentive can provide utilities with financial protection from changes in throughput due to energy efficiency by smoothing the utilityrsquos financial performance while
lowering customer bills Generally the business case results show that a decoupling mechanism benefits utilities more if the energy savings from efficiency are a greater percent of load growth Also because small reductions in throughput have a greater effect on the financial condition of distribution utilities decoupling generally benefits distribution utilities more than vertishycally integrated utilities A utilityrsquos actual results will depend on the structure of its efficiency program as well as the specific decoupling and attrition mechanisms
bull Customer Perspective Decoupling generates more freshyquent but smaller rate adjustments over time because variations in throughput require periodic rate ldquotrueshyupsrdquo Decoupling leads to modestly higher rates earlier for customers when efficiency account for a high pershycent of load growth In all cases energy efficiency reduces average customer bills over time with and without decoupling
bull Societal Perspective The societal benefits of energy efficiency are tied to the amount of energy efficiency implemented Therefore to the extent that decoupling encourages investment in energy efficiency it is a positive from a societal perspective Decoupling itself does not change the societal benefits of energy efficiency
While these cases are a good starting point each utility will have some unique characteristics such as differences in fuel and other costs growth rates regulatory strucshyture and required capital expenditures These and other inputs can be customized in the Calculator so users can consider the possible impacts of energy efficiency on their unique situations The Calculator was developed to aid users in promoting the adoption of energy efficiency programs and the results are therefore geared for education and outreach purposes6
4 Though not modeled in these business case scenarios incentive mechanisms can also be used to let shareholders profit from achieving efficiency goals further protecting shareholders Such incentives can increase the utility and shareholder motivations for increased energy efficiency investment
5 The decoupling mechanism assumed by the Calculator is a ldquogenericrdquo balancing account that adjusts rates annually to account for reduced sales volumes thereby maintaining revenue at target projections Differences in utility incentives that alternative decoupling mechanisms provide are discussed in Chapter 2 Utility Ratemaking amp Revenue Requirements but are not modeled The decoupling mechanism does not protect the utility from cost variations
6 The Calculator was designed to assess a wide variety of utility types using easily obtainable input data It was not designed for applications requiring detailed data for specific applications such as rate setting comparing different types of energy efficiency policies cost effectiveness testing energy effishyciency resource planning and consumer behavior analysis
4-4 National Action Plan for Energy Efficiency
Business Case Results
The eight cases evaluated were designed to isolate the impact of energy efficiency investments and decoupling mechanisms in different utility contexts (eg low-growth and high-growth utilities vertically integrated and restructured utility or cash-only and debt-financed publicly and cooperatively owned utilities) For each case three energy efficiency scenarios are evaluated (no efficiency without decoupling efficiency withshyout decoupling and efficiency with decoupling) while holdshying all other utility conditions and assumptions constant The eight scenarios are divided into four sets of two cases each with contrasting assumptions
An explanation of the key results of the business cases is provided below with further details provided for each case in Appendix B
Cases 1 and 2 Low-Growth and High-Growth Utilities
In this first comparison the results of implementing energy efficiency on two investor-owned electric and natural gas distribution utilities are contrasted These utilities are spending the same percent of revenue on energy efficiency and vary only by load growth The low-growth electric utility (Case 1) has a 1 percent sales growth rate and the low-growth gas utility has a 0 pershycent sales growth rate while the high-growth electric utility (Case 2) has a 5 percent sales growth rate and the high-growth gas utility has a 2 percent sales growth rate Table 4-2 compares the results for electric utilities and Table 4-3 compares the results for the natural gas utilishyties In both cases (and all other cases examined) the Calculator assumes a lsquocurrent yearrsquo test year for rate-setting When rate adjustments are needed the rates are set based on the costs and sales in that same year Therefore differences between forecasted and actual growth rates do not affect the results
Both electric and natural gas utilities show similar trends With low load growth the same level of energy efficiency investment offsets a high percentage of load growth and
utility return on equity (ROE) falls below target until the next rate case unless decoupling is in place7 In contrast the high-growth utility has an ROE that exceeds the target rate of return until the rates are decreased to account for the increasing sales In both cases energy efficiency reduces the utility return from what it would have been absent energy efficiency Generally speaking energy efficiency investments that account for a higher percentage of load growth expose an electric or natural gas utility to a greater negative finanshycial effect unless decoupling is in place
These cases also look at the difference between the two utilities with and without a decoupling mechanism Both utilities earn their target ROE in rate case years with and without the energy efficiency in place (Note that in pracshytice decoupling does not guarantee achieving the target ROE) For the low-growth utility the decoupling mechashynism drives a rate adjustment to reach the target ROE and the utility has higher ROE than without decoupling (Case 1) In the high-growth case decoupling decreases ROE relative to the case without decoupling (Case 2) and prevents the utility from earning slightly above its target ROE from increased sales in between rate cases allowing customer rates to decline sooner in the high-growth electric case if decoupling is in place
In both electric and natural gas Case 1 and Case 2 average customer bills decline over time The average bill is lower beginning in year 3 in the electric utility with no decoupling comparison and in year 5 with decoupling A similar pattern is found for the gas utility example Average bills decrease more when the efficiency is a higher percent of load growth even though rates slightly increase due to efficiency investments and reduced sales The average customer bill declines more smoothly when a decoupling mechanism is used due to more frequent rate adjustments
For both electricity and natural gas energy efficiency the net societal benefit is computed as the difference of the total benefits of energy efficiency less the total costs From a socishyetal perspective the benefits include the value of reduced expenditure on energy (including market price reductionsmdash
7 In Cases 1 and 2 the electric utility invests 2 percent of revenue in energy efficiency and the gas utility invests 05 percent of revenue
To create a sustainable aggressive national commitment to energy efficiency 4-5
Table 4-2 High- and Low-Growth Results Electric Utility
Case 1 Low-Growth (1) Return on Equity (ROE) Without efficiency and decoupling the low sales drive ROE below the target return Target ROE is achieved with energy efficiency (EE) and decoupling Increasing energy efficiency without decoupling decreases ROE
Case 2 High-Growth (5) Return on Equity (ROE) With high load growth without decoupling the utilishyty achieves greater than the target ROE until rates are adjusted With energy efficiency sales and earnings are reduced reducing ROE
Investor-Owned Utility Comparison of Return on Equity
Year
Aft
er T
ax R
OE
()
ROE - No EE ROE - EE no Decoupling ROE - EE and Decoupling Target ROE
3
6
9
12
15
1 2 3 4 5 6 7 8 9 10 Year
Case 1 Case 2
Aft
er T
ax R
OE
()
3
6
9
12
15
1 2 3 4 5 6 7 8 9 10
Comparison of Average Rate
Aver
age
Rate
($k
Wh)
Utility Average Rate - No EE Utility Average Rate - EE no Decoupling Utility Average Rate - EE and Decoupling
$010
$015
$020
$025
$030
1 2 3 4 5 6 7 8 9 10
Aver
age
Rate
($k
Wh)
$010
$015
$020
$025
$030
1 2 3 4 5 6 7 8 9 10
Year Year
Case 1 Case 2
Case 1 Low-Growth (1) Rates Without energy efficiency the utility sells higher volumes than in the no efficiency scenarios and has slightly lower rates Rates in the energy efficiency scenario increase primarily due to lower throughput rates are slightly higher in the decoupling scenario due to increase earnings to the target ROE
Case 2 High-Growth (5) Rates In the high-growth case rates are relatively flat Without energy efficiency the utility sells higher volumes and has slightly lower rates Decoupling does not have a great impact in this case because the ROE is near target levels without any rate adjustments
4-6 National Action Plan for Energy Efficiency
if any) reduced losses reduced capital expenditures and societal benefits are positive the energy efficiency is cost-reduced air emissions (if emissions are monetized)8 The effective from a societal perspective In both Case 1 and costs include both utility program and administration costs Case 2 (and all other cases evaluated using the tool) the net as well as the participant costs of energy efficiency If the net societal benefits are positive for investments in energy
Table 4-2 High- and Low-Growth Results Electric Utility (continued)
Case 1 Low-Growth (1)Bills Total customer bills with energy efficiency programs decline over time indicating customer savings resulting from lower energy consumption Rate increases through the decoupling mechanism reduce the pace of bill savings in the decoupling case
Percent Change in Customer Bills
Case 1 6
Case 2 High-Growth (5)Bills Total customer bills with energy efficiency decline over time indicating customer savings resulting from lower energy consumption There is little difference between the decoupling and no decoupling cases in the high-growth scenario
Case 2 6
-18
1 2 3 4 5 6 7 8 9 10
Cha
nge
in B
ills
()
-18
-21 -21 1 2 3 4 5 6 7 8 9 10
Year Year
3 3
Cha
nge
in B
ills
()
0 0
-3 -3
-6 -6
-9 -9
-12 -12
-15 -15
Change in Customer Bills () - EE no Decoupling Change in Customer Bills () - EE and Decoupling
Case 1 Low-Growth (1)Net Societal Benefits Over time the savings from energy efficiency exceed the annual costs The societal cost and societal savings are the same with and without decoupling
Delivered Costs and Benefits of EE
Case 1 $400
$300
Case 2 High-Growth (5)Net Societal Benefits Over time the savings from energy efficiency exceed the annual costs The societal cost and societal savings are the same with and without decoupling
Case 2$400
$300
1 2 3 4 5 6 7 8 9 10
$100$100
1 2 3 4 5 6 7 8 9 10 $0$0
Year Year
$M
Wh
$M
Wh
$200 $200
Societal Cost ($MWh saved) Societal Savings ($MWh saved)
8 The cases discussed in this document include conservative assumptions and do not include market price reductions or monetize air emissions in net societal benefits
To create a sustainable aggressive national commitment to energy efficiency 4-7
efficiency In the low-growth case the savings exceed costs years for the electric utility cases and four years for the natshywithin two years for both the electric and natural case cases ural gas utility cases Energy efficiency has a similar effect In the high-growth case the savings exceed costs within five upon natural gas utilities as shown in Table 4-3
Table 4-3 High- and Low-Growth Results Natural Gas Utility
Case 1 Low-Growth (0) Return on Equity (ROE) Without efficiency and decoupling the low sales result in ROE falling below the target return Similarly energy efficiency without decoupling drops utility return below target ROE Target ROE is achieved with decoupling
Case 2 High-Growth (2) Return on Equity (ROE) With high load growth energy efficiency has less impact on total sales and earnings Thus the utility achieves close to its target ROE in the early years although without decoupling ROE falls slightly in later years as energy efficiency reduces sales over time
Investor-Owned Utility Comparison of Return on Equity
Aft
er T
ax R
OE
()
3
6
9
12
15
1 2 3 4 5 6 7 8 9 10
Aft
er T
ax R
OE
()
3
6
9
12
15
1 2 3 4 5 6 7 8 9 10 Year
ROE - No EE ROE - EE no Decoupling ROE - EE and Decoupling Target ROE
Year
Case 1 Case 2
Comparison of Average Rate
Ave
rage
Rat
e ($
the
rm)
$080
$085
$090
$095
$100
$105
$110
1 2 3 4 5 6 7 8 9 10 Year Year
Case 1 Case 2
Ave
rage
Rat
e ($
the
rm)
$080
$085
$090
$095
$100
$105
$110
1 2 3 4 5 6 7 8 9 10
Utility Average Rate - No EE Utility Average Rate - EE no Decoupling Utility Average Rate - EE and Decoupling
Case 1 Low-Growth (0) Rates Rates increase over time because of increasing rate base and low sales growth Without energy efficiency the utilshyity sells higher volumes and has lower rates Decoupling increases rates when sales volumes are below target
Case 2 High-Growth (2) Rates Without energy efficiency the utility sells higher volumes and has lower rates Energy efficiency increases rates slightly in later years by reducing sales volumes
4-8 National Action Plan for Energy Efficiency
Table 4-3 High- and Low-Growth Results Natural Gas Utility (continued)
Case 1 Low-Growth (0)Customer Bills Total customer bills with energy efficiency decline over time indicating customer savings resulting from lower energy consumption Customer utility bills initially increase slightly with decoupling as rates are increased to hold ROE at the target level and spending increases on efficiency
Percent Change in Customer Bills
Case 1 4
Case 2 High-Growth (2)Customer Bills Customer utility bills with energy efficiency reflect the more limited impact of efficiency programs on rate proshyfile Total customer bills decline over time indicating cusshytomer savings resulting from lower energy consumption
Case 24
-10 1 2 3 4 5 6 7 8 9 10 1 2 3 4 5 6 7 8 9 10
-10
Year Year
Cha
nge
in B
ills
() 22
Cha
nge
in B
ills
()
00
-2 -2
-4 -4
-6 -6
-8 -8
Change in Customer Bills () - EE no Decoupling Change in Customer Bills () - EE and Decoupling
Case 1 Low-Growth (0)Net Societal Benefits Over time the savings from energy efficiency exceed the annual costs The societal cost and societal savings are the same with and without decoupling
Delivered Costs and Benefits of EE
Case 1 $6
$5
Case 2 High-Growth (2)Net Societal Benefits Over time the savings from energy efficiency exceed the annual costs The societal cost and societal savings are the same with and without decoupling
Case 2 $6
$5
$1
1 32 5 76 94 8 10
$1
$0 $0 1 2 3 4 5 6 7 8 9 10
Year Year
$4 $4
$th
erm
$th
erm
$3 $3
$2 $2
Societal Cost ($therm saved) Societal Savings ($therm saved)
To create a sustainable aggressive national commitment to energy efficiency 4-9
Cases 3 and 4 Electric Power Plant Deferral
This case study examines an electric investor-owned utility with a large capital project (modeled here as a 500-MW combined-cycle power plant although the conclusions are similar for other large capital projects) planned for construction in 20099 Again the effect of a 1 percent growth rate (Case 3) is compared with a 5 percent growth rate (Case 4) with identical energy efficiency investments of 2 percent of electric utility revenues
Figure 4-1 shows the capital expenditure for the project with and without an aggressive energy efficiency plan and a summary of the net benefits from each perspecshytive The length of investment deferral is based on the percent of peak load reduced due to energy efficiency
investments The vertical axis shows how the expendishyture in nominal dollars starts at $500 million in 2009 or slightly higher (due to inflation) after deferral With Case 3 energy efficiency investments account for a higher percentage of peak load growth and can defer the projshyect until 2013 With higher growth and the same level of efficiency savings (Case 4) the same efficiency investshyment only defers the project until 2010
In Case 3 the energy efficiency program causes a greater reduction in revenue requirementmdasha 30-year reduction of $476 million rather than a Case 4 reduction of $338 millionmdashproviding benefits from a customer perspective From a societal perspective the low-growth case energy efficiency program yields higher net societal benefit as well $332 million versus $269 million
Figure 4-1 Comparison of Deferral Length with Low- and High-Growth
30-year savings impact from EE Low-Growth Utility High-Growth Utility Decrease in Revenue Requirement (net present value [NPV] million dollars [$MM]) $476 $338 Net Customer Savings ndash decoupling (NPV $MM) $319 $275 Net Societal Benefit (NPV $MM) $332 $269
Comparison of Investment Timing - Electric Utility
0
100
200
300
400
500
600
2007 2008 2009 2010 2011 2012 2013 2014 2015 2016
Year
Cap
ital E
xpen
ditu
re (
Nom
inal
$M
illion
s)
0
100
200
300
400
500
600
2007 2008 2009 2010 2011 2012 2013 2014 2015 2016
Year
Cap
ital E
xpen
ditu
re (
Nom
inal
$M
illion
s)
Without Energy Efficiency With Energy Efficiency
Case 3 Case 4
Case 3 Low-Growth Investment Timing Case 4 High-Growth Investment Timing
9 This illustration demonstrates how energy efficiency can be used including efforts to reduce peak capacity requirements to defer a single 500 MW combined cycle power plant Energy efficiency can also be used to defer other smaller investments
4-10 National Action Plan for Energy Efficiency
Table 4-4 compares the reduction in revenue requirement due to the deferral of the power plant investment between the two cases In Case 3 the reduction in revenue requireshyment due to the deferral to 2013 results in present value savings of $36 million over the three years that the plant was deferred In Case 4 the deferral provides present value savings of $11 million for the one-year deferral
Although the project is deferred longer in the low-growth case fewer sales overall and higher installed capshyital costs result in higher rates over time relative to the
high-growth case In both cases the increase in rates from energy efficiency programs starting in year 1 is significantly less than the rate increase that occurs after the new power plant investment is made leading to lower customer bills Customer bill savings are greatest during the years that the plant is deferred10
Cases 5 and 6 Vertically Integrated Utility vs Restructured Delivery Company
In this example a vertically integrated electric utility (Case 5) is compared with the restructured electric delivery
Table 4-4 Power Plant Deferral Results
Comparison of Average Rate
Year
Ave
rage
Rat
e ($
kW
h)
$010
$015
$020
$025
$030
1 2 3 4 5 6 7 8 9 10
Year
Ave
rage
Rat
e ($
kW
h)
$010
$015
$020
$025
$030
1 2 3 4 5 6 7 8 9 10
Case 3 Case 4
Utility Average Rate - No EE Utility Average Rate - EE no Decoupling Utility Average Rate - EE and Decoupling
Case 3 Low-Growth (1) Revenue Requirement 2009 project deferred to 2013 resulting in a reducshytion in revenue requirement due to deferring the power plant over three years of PV$36 million
Other Capital Expenditures The low-growth case leads to the savings of other capshyital expenditures compared to the high-growth case
Retail Rates With low load growth a given amount of energy efficiency defers so much load growth that the new power plant can be deferred for three years allowing the utility to conserve capital and postshypone rate increases for several years
Case 4 High-Growth (5) Revenue Requirement 2009 project deferred to 2010 resulting in a reducshytion in revenue requirement from deferring the power plant over a year of PV$11 million
Other Capital Expenditures The low-growth case leads to the savings of other capshyital expenditures compared to the high-growth case
Retail Rates With high load growth energy efficiency reduces load growth enough to defer the new power plant investshyment by one year slowing implementation of a relashytively smaller rate increase
10 The Calculator assumes that a rate case occurs in the year following a large capital investment When a decoupling mechanism is used a higher rate adjustment (and immediate decrease in bill savings) occurs once a new major infrastructure investment is brought online This charge is due to the new level of capital expenditures at the same time a positive decoupling rate adjustment is making up for previous deficiencies
To create a sustainable aggressive national commitment to energy efficiency 4-11
company (Case 6) both experiencing a 2 percent growth expenditures than a restructured delivery utility rate and investing 2 percent of revenue in energy effi- In general the financial impact of energy efficiency on ciency These cases assume that the vertically integrated delivery utilities is more pronounced than on vertically utility has more capital assets and larger annual capital integrated utilities with the same number of customers and
Table 4-4 Power Plant Deferral Results (continued)
Case 3 Low-Growth (1)Customer Bills Although rates rise with large capital expenditures bills continue to fall over time as energy efficiency drives customer volume down to offset the higher rates
Percent Change in Customer Bills
Case 3 6
Case 4 High-Growth (5)Customer Bills Although rates rise with large capital expenditures bills continue to fall over time as energy efficiency drives customer volume down to offset the higher rates
Case 4 6
Cha
nge
in B
ills
()
-21
3
0
-3
-6
-9
-12
-15
-18
3
Cha
nge
in B
ills
()
0
-3
-6
-9
-12
-15
-18
-21 1 2 3 4 5 6 7 8 9 10 1 2 3 4 5 6 7 8 9 10
Year Year
Change in Customer Bills () - EE no Decoupling Change in Customer Bills () - EE and Decoupling
Case 3 Low-Growth (1) Case 4 High-Growth (5) Load Impact Load Impact Energy efficiency significantly reduces load growth With high growth energy efficiency has a limited and reduces the need for new capital investment impact on peak load and defers a modest amount of
new capital investment
Comparison of Peak Load Growth
Case 3 Case 4 160 160
Peak
Loa
d
of F
irst Y
r
Peak
Loa
d
of F
irst Y
r
150
140
130
120
110
100
150
140
130
120
110
100
90 90 1 2 3 4 5 6 7 8 9 10 1 2 3 4 5 6 7 8 9 10
Year Year
Forecasted Growth - EE and Decoupling Forecasted Growth - No EE
4-12 National Action Plan for Energy Efficiency
sales Once divested of a generation plant the Table 4-5 summarizes the comparison of ROE rates bills distribution utility is a smaller company (in terms of total and societal benefits Without implementing energy effishyrate base and capitalization) and fluctuations in through- ciency both utilities are relatively financially healthy put and earnings have a relatively larger impact on return achieving near their target rate of return in each year
Table 4-5 Vertically Integrated and Delivery Company Results
Case 5 Vertically IntegratedReturn on Equity (ROE) Because the vertically integrated utility has a large rate base the impact of energy efficiency upon total earnings is limited and it has little impact upon ROE (with or withshyout decoupling)
Investor-Owned Utility Comparison of Return on Equity
Case 515
Case 6 Delivery UtilityReturn on Equity (ROE) With a smaller rate base and revenues only from kWh deliveries energy efficiency has a larger impact on a ROE without decoupling than a vertically integrated utility
Case 6 15
Aft
er T
ax R
OE
()
Aft
er T
ax R
OE
()
12
9
6
12
9
6
3 1 2 3 4 5 6 7 8 9 10
Year
Case 5 Vertically IntegratedRates Without energy efficiency the utility sells higher volumes and has lower rates Total retail rates including delivery and energy are similar for the vertically integrated and restructured utilities
Comparison of Average Rate
Case 5 $030
3 1 2 3 4 5 6 7 8 9 10
Year
ROE - No EE ROE - EE no Decoupling ROE - EE and Decoupling Target ROE
Case 6 Delivery Utility Rates Without energy efficiency the utility sells higher volumes and has lower rates Total retail rates including delivery and energy are similar for the vertically integrated and restructured utilities
Case 6 $030
Ave
rage
Rat
e ($
kW
h)
Ave
rage
Rat
e ($
kW
h)
$025
$020
$015
$025
$020
$015
$010 $010 1 2 3 4 5 6 7 8 9 10 1 2 3 4 5 6 7 8 9 10
Year Year
Utility Average Rate - No EE Utility Average Rate - EE no Decoupling Utility Average Rate - EE and Decoupling
To create a sustainable aggressive national commitment to energy efficiency 4-13
Table 4-5 Vertically Integrated and Delivery Company Results (continued)
Case 5 Vertically IntegratedBills Total customer bills with energy efficiency programs decline over time indicating average customer savings resulting from lower energy consumption Customer utility bills decrease more smoothly with decoupling as a result of the more frequent rate adjustments
Percent Change in Customer Bills
Case 5 6
Case 6 Delivery UtilityBills Total customer bills with energy efficiency programs decline over time indicating average customer savings resulting from lower energy consumption Customer utilshyity bills decrease more slowly in the decoupling case because rates are increased earlier to offset reduced sales
Case 6 6
Cha
nge
in B
ills
()
Cha
nge
in B
ills
() 3 3
0
-3
-6
-9
-12
-15
-18
0
-3
-6
-9
-12
-15
-18
-21 1 2 3 4 5 6 7 8 9 10 1 2 3 4 5 6 7 8 9 10
-21
Year Year
Change in Customer Bills () - EE no Decoupling Change in Customer Bills () - EE and Decoupling
Case 5 Vertically IntegratedNet Societal Benefits Over time the savings from energy efficiency exceed the annual costs The societal cost and societal savings are the same with and without decoupling
Delivered Costs and Benefits of EE
Case 5$400
$300
1 2 3 4 5 6 7 8 9 10
$M
Wh
$200
$100 $100
Case 6 Delivery UtilityNet Societal Benefits As with the vertically integrated utility savings from energy efficiency exceed the costs over time The distribution utility has a lower initial societal savings because the distribution company reduces fewer capital expenditures at the outset of the energy efficiency investments Over time the societal costs and savings are similar to the distribution company
Case 6$400
$300
1 2 3 4 5 6 7 8 9 10
$M
Wh
$200
$0 $0
Year Year
Societal Cost ($MWh saved) Societal Savings ($MWh saved)
4-14 National Action Plan for Energy Efficiency
however introducing energy efficiency reduces ROE and earnings for both utilities unless a decoupling mechashynism is put in place Customer rates increases bill savings and societal benefits follow similar trends with energy efficiency as discussed in Cases 1 and 2
Cases 7 and 8 Publicly and Cooperatively Owned Electric Utilities
The first six cases used an investor-owned electric utility to illustrate the business case for energy efficiency The Calculator also can evaluate the impact of efficiency programs on publicly and cooperatively owned electric utilities Many of the issues related to the impact of growth rates and capital deferral discussed in the investor-owned utility examples apply equally to publicly and cooperatively owned utilities From a net societal benefit perspective the results are identical for publicly cooperatively and privately owned utilities The ratemaking and utility financing perspectives are different however
The financial position of publicly owned utilities is evalushyated primarily based on either the debt coverage ratio (which is critical to maintaining a high bond rating and low cost capital) or the minimum cash position (for utilities with no debt) Table 4-6 shows the results of a publicly or cooperatively owned utility with an energy efficiency program of 2 percent of revenue and load growth of 2 percent In both cases the assumption is made that the utility adjusts rates whenever the debt coverage ratio or minimum cash position falls below a threshold This assumption makes comparisons of differshyent cases more difficult but the trends are similar to the investor-owned utilities on a regular rate case cycle The change in utility financial health due to energy efficiency is relatively modest because of the ability to adjust the retail rates to maintain financial health The publicly and cooperatively owned utilities will experience similar financial health problems as investor-owned utilities if they do not adjust rates
Table 4-6 Publicly and Cooperatively Owned Utility Results
Case 7 Minimum Debt Coverage Ratio Utility Financial Health A decoupling mechanism stabilizes the utilityrsquos ability to cover debt by adjusting rates for variations in throughput Without decoupling rates are adjusted whenever the debt coverage rate falls below a threshold (ratio 2 in the example) The rate adjustment is required earlier in the energy efficiency scenario
Case 8 Minimum Cash Position Utility Financial Health In the no decoupling cases (with and without energy efficiency) rates are reset if the cash position falls below a minimum threshold ($70 million in this example) With decoupling the utility adjusts rates to hit the target cash level in each year The results are similar as long as there is an ability to reset rates when needed to maintain a minimum cash position
Public PowerCooperative Debt Coverage Ratio
Year
Deb
t C
over
age
Ratio
Debt Coverage Ratio - No EE
Debt Coverage Ratio - EE no Decoupling
Debt Coverage Ratio - EE and Decoupling
100
150
200
250
1 3 5 7 92 4 6 8 10
Cash Position at End of Year
Year
End
of Y
ear
Cas
h ($
MM
)
$40
$50
$60
$70
$80
1 2 3 4 5 6 7 8 9 10
Cash Position - No EE
Cash Position - EE no Decoupling
Cash Position - EE and Decoupling
Case 7 Case 8
To create a sustainable aggressive national commitment to energy efficiency 4-15
4-16 National Action Plan for Energy Efficiency
Case 7 Minimum Debt Coverage Ratio Customer Rates With or without decoupling rates are adjusted to maintain financial health Rates are lowest without energy efficiency and highest with energy efficiency and decoupling
Case 8 Minimum Cash Position Customer Rates Once energy efficiency is implemented retail rate levels are similar with or without decoupling in place The decoupling case is slightly smoother with smaller more frequent rate adjustments
Comparison of Average Rate
Year
Aver
age
Rate
($k
Wh)
$010
$015
$020
$025
$030
1 2 3 4 5 6 7 8 9 10 Year
Aver
age
Rate
($k
Wh)
$010
$015
$020
$025
$030
1 2 3 4 5 6 7 8 9 10
Utility Average Rate - No EE Utility Average Rate - EE no Decoupling Utility Average Rate - EE and Decoupling
Case 7 Case 8
Table 4-6 Publicly and Cooperatively Owned Utility Results (continued)
Case 7 Minimum Debt Coverage Ratio Customer Bills Average customer bills decline with energy efficiency investments with and without decoupling The lsquorandomnessrsquo in the bill change is due to different timshying of rate adjustments in the energy efficiency and no energy efficiency cases However overall the trend is downward
Case 8 Minimum Cash Position Customer Bills Average customer bills decline with energy efficiency investments in both the decoupling and no decoupling cases
Percent Change in Customer Bills
Year 1 2 3 4 5 6 7 8 9 10
Year 1 2 3 4 5 6 7 8 9 10
Change in Customer Bills () - EE no Decoupling Change in Customer Bills () - EE and Decoupling
Case 7 Case 8
Chan
ge in
Bill
s (
)
Chan
ge in
Bill
s (
)
-21
-18
-15
-12
-9
-6
-3
0
3
6
-21
-18
-15
-12
-9
-6
-3
0
3
6
Key Findings
This chapter summarizes eight business cases for energy efficiency resulting from the Energy Efficiency Benefits Calculator This Calculator provides simplified results from a utility customer and societal perspective As stated on page 4-1 the key findings from the eight cases examined include
bull For both electric and gas utilities energy efficiency investments consistently lower costs over time for both utilities and customers while providing positive net benefits to society When enhanced by ratemaking policies to address utility financial barriers to energy efficiency such as decoupling the utilityrsquos revenues from sales volumes utility financial health can be maintained while comprehensive cost-effective energy efficiency programs are implemented
bull The costs of energy efficiency and reduced sales volume might initially raise gas or electricity bills due to slightly higher rates from efficiency investment and reduced sales However as the efficiency gains help participating customers lower their energy consumpshytion the decreased energy use offsets higher rates to drive their total energy bills down In the 8 cases examshyined average customer bills were reduced by 2 percent to 9 percent over a ten year period compared to the no-efficiency scenario
bull Investment in cost-effective energy efficiency programs yields a net benefit to societymdashon the order of hundreds of millions of dollars in NPV for the illustrative case studies (small- to medium-sized utilities)
Recommendations and Options
The National Action Plan for Energy Efficiency Leadership Group offers the following recommendation as a way to overcome many of the barriers to energy efficiency and provides the following options for consideration by utilishyties regulators and stakeholders (as presented in the Executive Summary)
Recommendation Broadly communicate the beneshyfits of and opportunities for energy efficiency Experience shows that energy efficiency programs help customers save money and contribute to lower cost energy systems But these impacts are not fully docushymented nor recognized by customers utilities regulators and policy-makers More effort is needed to establish the business case for energy efficiency for all decision-makers and to show how a well-designed approach to energy efficiency can benefit customers utilities and society by (1) reducing customers bills over time (2) fostering financially healthy utilities (return on equity [ROE] earnshyings per share debt coverage ratios unaffected) and (3) contributing to positive societal net benefits overall Effort is also necessary to educate key stakeholders that although energy efficiency can be an important low-cost resource to integrate into the energy mix it does require funding just as a new power plant requires funding
Options to Consider bull Establishing and educating stakeholders on the busishy
ness case for energy efficiency at the state utility and other appropriate level addressing relevant customer utility and societal perspectives
bull Communicating the role of energy efficiency in lowering customer energy bills and system costs and risks over time
Reference
National Action Plan for Energy Efficiency (2006) Energy Efficiency Benefits Calculator lthttpwwwepagovcleanenergyeeactionplanhtmgt
To create a sustainable aggressive national commitment to energy efficiency 4-17
5 Rate Design
Retail electricity and natural gas utility rate structures and price levels influence customer consumption and thus are an important tool for encouraging the adoption of energy-efficient technologies and practices The rate design process typically involves balancing multiple objectives among which energy efficiency is often overlooked Successful rate designs must balance the overall design goals of utilities customers regulators and other stakeholders including encouraging energy efficiency
Overview
Retail rate designs with clear and meaningful price signals coupled with good customer education can be powerful tools for encouraging energy efficiency At the same time rate design is a complex process that must take into account multiple objectives (Bonbright 1961 Philips 1988) The main priorities for rate design are recovery of utility revenue requirements and fair apporshytionment of costs among customers
Other important regulatory and legislative goals include
bull Stable revenues for the utility
bull Stable rates for customers
bull Social equity in the form of lifeline rates for essential needs of households (PURPA of 1978)
bull Simplicity of understanding for customers and ease of implementation for utilities
bull Economic efficiency to promote cost-effective load management
This chapter considers the additional goal of encouraging investment in energy efficiency While it is difficult to achieve every goal of rate design completely considerashytion of a rate designrsquos impact on adoption of energy effishyciency and any necessary trade-offs can be included as part of the ratemaking process
Using Rate Design to Promote Energy Efficiency
In developing tariffs to encourage energy efficiency the following questions arise (1) What are the key rate design issues and how do they affect rate designs for energy efficiency (2) What different rate design options are possible and what are their pros and cons (3) What other mechanisms can encourage efficiency that are not driven by tariff savings and (4) What are the most successful strategies for encouraging energy efficiency in different jurisdictions These questions are addressed throughout this chapter
Leadership Group Recommendations
Applicable to Rate Design
bull Modify ratemaking practices to promote energy efficiency investments
bull Broadly communicate the benefits of and opportunities for energy efficiency
A more detailed list of options specific to the objective of promoting energy efficiency in rate design is provided at the end of this chapter
Background Revenues and Rates
Utility rates are designed to collect a specific revenue requirement based on natural gas or electricity sales As rates are driven by sales and revenue requirements these three aspects of regulation are tightly linked (Revenue requirement issues are discussed in Chapter 2 Utility Ratemaking amp Revenue Requirements)
To create a sustainable aggressive national commitment to energy efficiency 5-1
Until the 1970s rate structures were based on the principle of average-cost pricing in which customer prices reflected the average costs to utilities of serving their customer class Because so many of a utilityrsquos costs were fixed the main goal of rate design up until the 1970s was to promote sales Higher sales allowed fixed costs to be spread over a larger base and helped push rates down keeping stakeholders content with average-cost based rates (Hyman et al 2000)
This dynamic began to change in many jurisdictions in the 1970s with rising oil prices and increased emphasis on conservation With the passage of the 1978 Public Utility Regulatory Policies Act (PURPA) declining block rates were replaced by flat rates or even inverted block rates as utilities began to look for ways to defer new plant investment and reduce the environmental impact of energy consumption
Key Rate Design Issues
Utilities and regulators must balance competing goals in designing rates Achieving this balance is essential for obtaining regulatory and customer acceptance The main rate design issues are described below
Provide Recovery of Revenue Requirements and Stable Utility Revenues
A primary function of rates is to let utilities collect their revenue requirements Utilities often favor rate forms that maximize stable revenues such as declining block rates The declining block rate has two or more tiers of usage with the highest rates in the first tier Tier 1 is typically a relatively low monthly usage level that most customers exceed This rate gives utilities a high degree of certainty regarding the number of kilowatt-hours
(kWh) or therms that will be billed in Tier 1 By designing Tier 1 rates to collect the utilityrsquos fixed costs the utility gains stability in the collection of those costs At the same time the lower Tier 2 rates encourage higher energy consumption rather than efficiency which is detrimental to energy efficiency impacts1 Because energy efficiency measures are most likely to change customer usage in Tier 2 customers will see smaller bill reductions under declining block rates than under flat rates Although many utilities have phased out declining block rates a number of utilities continue to offer them2
Another rate element that provides revenue stability but also detracts from the incentive to improve efficiency is collecting a portion of the revenue requirement through a customer charge that is independent of usage Because the majority of utility costs do not vary with changes in customer usage level in the short run the customer charge also has a strong theoretical basis This approach has mixed benefits for energy efficiency On one hand a larger customer charge means a smaller volumetric charge (per kWh or therm) which lowers the customer incentive for energy efficiency On the other hand a larger customer charge and lower volushymetric charge reduces the utilities profit from increased sales reducing the utility disincentive to promote energy efficiency
Rate forms like declining block rates and customer charges promote revenue stability for the utility but they create a barrier to customer adoption of energy efficiency because they reduce the savings that cusshytomers can realize from reducing usage In turn elecshytricity demand is more likely to increase which could lead to long-term higher rates and bills where new supply is more costly than energy efficiency To proshymote energy efficiency a key challenge is to provide a
1 Brown and Sibley (1986) opine that a declining block structure can promote economic efficiency if the lowest tier rate can be set above marginal cost while inducing additional consumption by some consumers A rising marginal cost environment suggests however that a declining block rate structure with rates below the increasing marginal costs is economically inefficient
2 A partial list of utilities with declining block residential rates includes Dominion Virginia Power VA Appalachian Power Co VA Indianapolis Power and Light Co IN Kentucky Power Co KY Cleveland Electric Illum Co OH Toledo Edison Co OH Rappahannock Electric Coop VA Lincoln Electric System NE Cuivre River Electric Coop Inc MO Otter Tail Power Co ND Wheeling Power Co WV Matanuska Electric Assn Inc AK Homer Electric Association Inc AK Lower Valley Energy NE
5-2 National Action Plan for Energy Efficiency
level of certainty to utilities for revenue collection without dampening customer incentive to use energy more efficiently
Fairly Apportion Costs Among Customers
Revenue allocation is the process that determines the share of the utilityrsquos total revenue requirement that will be recovered from each customer class In regulatory proceedings this process is often contentious as each customer class seeks to pay less This process makes it difficult for utilities to propose rate designs that shift revenues between different customer classes
In redesigning rates to encourage energy efficiency it is important to avoid unnecessarily or inadvertently shifting costs between customer classes Rate design changes should instead focus on providing a good price signal for customer consumption decisions
Promote Economic Efficiency for Cost-Effective Load Management
According to economic theory the most efficient outshycome occurs when prices are equal to marginal costs resulting in the maximum societal net benefit from consumption
Marginal Costs
Marginal costs are the changes in costs required to proshyduce one additional unit of energy In a period of rising marginal costs rates based on marginal costs more realshyistically reflect the cost of serving different customers and provide an incentive for more efficient use of resources (Bonbright 1961 Kahn 1970 Huntington 1975 Joskow 1976 Joskow 1979)
A utilitys marginal costs often include its costs of complyshying with local state and federal regulations (eg Clean Air Act) as well as any utility commission policies addressshying the environment (eg the use of the societal test for benefit-cost assessments) Rate design based on the utilitys marginal costs that promotes cost-effective energy
efficiency will further increase environmental protection by reducing energy consumption
Despite its theoretical attraction there are significant barshyriers to fully implementing marginal-cost pricing in elecshytricity especially at the retail level In contrast to other commodities the necessity for generation to match load at all times means that outputs and production costs are constantly changing and conveying these costs as real time ldquoprice signalsrdquo to customers especially residential customers can be complicated and add additional costs Currently about half of the nationrsquos electricity customers are served by organized real-time electricity markets which can help provide time-varying prices to customers by regional or local area
Notwithstanding the recent price volatility exacerbated by the 2005 hurricane season and current market condishytions wholesale natural gas prices are generally more stable than wholesale electricity prices largely because of the ability to store natural gas As a result marginal costs have been historically a less important issue for natural gas pricing
Short-Run Versus Long-Run Price Signals
There is a fundamental conflict between whether electricity and natural gas prices should reflect short-run or long-run marginal costs In simple terms short-run costs reflect the variable cost of production and delivery while long-run costs also include the cost of capital expansion For proshygrams such as real-time pricing in electricity short-run marginal costs are used for the price signals so they can induce efficient operating decisions on a daily or hourly basis
Rates that reflect long-run marginal costs will promote economically efficient investment decisions in energy efficiency because the long-run perspective is consistent with the long expected useful lives of most energy effishyciency measures and the potential for energy efficiency to defer costly capital investments For demand-response and other programs intended to alter consumption on a daily or hourly basis however rates based on short-run
To create a sustainable aggressive national commitment to energy efficiency 5-3
Applicability of Rate Design Issues
Implications for Clean Distributed Generation and
Demand Response The rate issues for energy effishyciency also apply to clean distributed generation and demand response with two exceptions Demand response is focused on reductions in usage that occur for only a limited number of hours in a year and occur at times that are not known far in advance (typically no more than one day notice and often no more than a few hours notice) Because of the limited hours of operation the revenue erosion from demand response is small compared to an energy efficiency measure In addition it could be argued that short-run rather than long-run costs are the appropriate cost metric to use in valuing and pricing demand response programs
Public Versus Private Utilities The rate issues are essentially the same for both public and private utilishyties Revenue stability might be a lesser concern for public utilities as they could approach their city leaders for rate changes Frequent visits to council chambers for rate changes might be frowned upon however so revenue stability will likely remain imporshytant to many public utilities as well
marginal cost might be more appropriate Therefore in developing retail rates the goals of short-run and long-run marginal based pricing must be balanced
Cost Causation
Using long-run marginal costs to design an energy-efficiency enhancing tariff can present another challenge mdashpotential inconsistency with the cost-causation princishyple that a tariff should reflect the utilitys various costs of serving a customer This potential inconsistency diminishes in the long run however because over the long run some costs that might be considered fixed in the near term (eg generation or transmission capacity new interstate pipeline capacity or storage) are actually varishyable Such costs can be reduced through sustained load
Gas Versus Electric As discussed above gas marginal costs are less volatile than electricity marginal costs so providing prices that reflect marginal costs is generally less of a concern for the gas utilities In addition the nature of gas service does not lend itself to complicated rate forms such as those seen for some electricity cusshytomers Nevertheless gas utilities could implement increasing tier block rates andor seasonally differenshytiated rates to stimulate energy efficiency
Restructured Versus Non-Restructured Markets
Restructuring has had a substantial impact on the funding administration and valuation of energy effishyciency programs It is no coincidence that areas with high retail electricity rates have been more apt to restructure their electricity markets The higher rates increase the appeal of energy efficiency measures and the entry of third-party energy service companies can increase customer interest and education regarding energy efficiency options In a retail competition envishyronment however there might be relatively little rate-making flexibility In several states restructuring has created transmission and distribution-only utilities so the regulatorrsquos ability to affect full electricity rates might be limited to distribution costs and rates for default service customers
reductions provided by energy efficiency investment induced by appropriately designed marginal cost-based rates Some costs of a utility do not vary with a cusshytomers kWh usage (eg hookup and local distribution) As a result a marginal cost-based rate design may necessarily include some fixed costs which can be collected via a volumetric adder or a relatively small customer charge However utilities that set usage rates near long-run marginal costs will encourage energy effishyciency and promote other social policy goals such as affordability for low-income and low-use customers whose bills might increase with larger fixed charges Hence a practical implementation of marginal-cost based ratemaking should balance the trade-offs and competing goals of rate design
5-4 National Action Plan for Energy Efficiency
Provide Stable Rates and Protect Low-Income Customers
Rate designs to promote energy efficiency must conshysider whether or not the change will lead to bill increases Mitigating large bill increases for individual customers is a fundamental goal of rate design and in some jurisdictions low-income customers are also afforded particular attention to ensure that they are not adversely affected by rate changes In some cases low-income customers are eligible for special rates or rate riders that protect them from large rate increases as exemplified by the lifeline rates provision in Section 114 of the 1978 PURPA Strategies to manage bill impacts include phasing-in rate changes to reduce the rate shock in any single year creating exemptions for certain at-risk customer groups and disaggregating customers into small customer groups to allow more targeted rate forms
Because of the concern over bill impacts new and innoshyvative rates are often offered as voluntary rates While improving acceptance voluntary rate structures generally attract a relatively small percentage of customers (less than 20 percent) unless marketed heavily by the utility Voluntary rates can lead to some ldquofree ridersrdquo meaning customers who achieve bill reductions without changing their consumption behavior and providing any real savshyings to the utility Rates to promote energy efficiency can be offered as voluntary but the low participation and free rider issues should be taken into account in their design to ensure that the benefits of the consumption changes they encourage are at least as great as the resulting bill decreases
Maintain Rate Simplicity
Economists and public policy analysts can become enamshyored with efficient pricing schemes but customers genshyerally prefer simple rate forms The challenge for promoting energy efficiency is balancing the desire for rates that provide the right signals to customers with the need to have rates that customers can understand and to which they can respond Rate designs that are too complicated for customers to understand will not be
effective at promoting efficient consumption decisions Particularly in the residential sector customers might pay more attention to the total bill than to the underlying rate design
Addressing the Issues
Alternative Approaches
The prior sections listed the issues that stakeholders must balance in designing new rates This section presents some traditional and non-traditional rate designs and discusses their merits for promoting energy efficiency The alternatives described below vary by meteringbilling requirement information complexity and ability to reflect marginal cost3
Rate Design Options
Inclining Tier Block
Inclining tier block rates also referred to as inverted block rates have per-unit prices that increase for each successive block of energy consumed Inclining tiered rates offer the advantages of being simple to understand and simple to meter and bill Inclining rates can also meet the policy goal of protecting small users which often include low-income customers In fact it was the desire to protect small users that prompted the initiation of increasing tiers in California Termed ldquolifeline ratesrdquo at the time the intention was to provide a small base level of electricity to all residential customers at a low rate and charge the higher rate only to usage above that base level The concept of lifeline rates continues in varshyious forms for numerous services such as water and sewer services and can be considered for delivery or commodity rates for electricity and natural gas However in many parts of the country low-income customers are not necessarily low-usage customers so a lifeline rate might not protect all low-income customers from energy bills
3 As part of its business model a utility may use innovative rate options for the purpose of product differentiation For example advanced metering that enables a design with continuously time-varying rates can apply to an end-use (eg air conditioning) that is the main contributor to the utilitys system peak Another example is the bundling of sale of electricity and consumer devices (eg a 10-year contract for a central air conditioner whose price includes operation cost)
To create a sustainable aggressive national commitment to energy efficiency 5-5
Tiered rates also provide a good fit for regions where the long-run marginal cost of energy exceeds the curshyrent average cost of energy For example regions with extensive hydroelectric resources might have low avershyage costs but their marginal cost might be set by much higher fossil plant costs or market prices (for purchase or export)
See Table 5-1 for additional utilities that offer inclining tier residential rates
Time of Use (TOU)
TOU rates establish varying charges by season or time of day Their designs can range from simple on- and off-peak rates that are constant year-round to more complishycated rates with seasonally differentiated prices for sevshyeral time-of-day periods (eg on- mid- and off-peak) TOU rates have support from many utilities because of the flexibility to reflect marginal costs by time of delivery
TOU rates are commonly offered as voluntary rates for residential electric customers4 and as mandatory rates for larger commercial and industrial customers Part of the reason for TOU rates being applied primarily to
larger users is the additional cost of TOU metering and billing as well as the assumed greater ability of larger customers to shift their loads
TOU rates are less applicable to gas rates because the natural storage capability of gas mains allows gas utilities to procure supplies on a daily rather than hourly basis Additionally seasonal variations are captured to a large extent in costs for gas procurement which are typically passed through to the customer An area with conshystrained seasonal gas transportation capacity however could merit a higher distribution cost during the conshystrained season Alternatively a utility could recover a higher share of its fixed costs during the high demand season because seasonal peak demand drives the sizing of the mains
As TOU rates are typically designed to be revenue-neutral with the status quo rates a high on-peak price will be accompanied by a low off-peak price Numerous studies in electricity have shown that while the high on-peak prices do cause a reduction in usage during that period the low off-peak prices lead to an increase in usage in the low-cost period There has also been an
Table 5-1 Partial List of Utilities With Inclining Tier Residential Rates
Utility Name State Tariff URL
Florida Power and Light FL httpwwwfplcomaccesscontentshow_to_read_your_billshtml
Consolidated Edison NY httpwwwconedcomdocumentselec201-210pdf
Pacific Gas amp Electric CA httpwwwpgecomresfinancial_assistancemedical_baseline_life_support
understandingindexhtmltopic4
Southern California Edison CA httpwwwscecomNRrdonlyres728FFC8C-91FD-4917-909Bshy
Arizona Public Service Co AZ httpswwwapscommy_accountRateComparerhtml
Sacramento Municipal Util Dist CA httpwwwsmudorgresidentialrateshtml
Indiana Michigan Power Co MI httpswwwindianamichiganpowercomglobalutilitiestariffs
MichiganMISTD1-31-06pdf
Modesto Irrigation District CA httpwwwmidorgservicestariffsratesums-d-residentialpdf
Turlock Irrigation District CA httpwwwtidorgPublisher_PDFsDEpdf
Granite State Electric Co NH httpwwwnationalgriduscomgranitestatehomerates4_dasp
Vermont Electric Cooperative Inc VT httpwwwvtcoopcomPageVieweraspxPageName=Rates20Summary
City of Boulder NV httpwwwbcnvorgutilitieshtmlelectricwaterandsewer
4 For a survey of optional rates with voluntary participation see Horowitz and Woo (2006)
5-6 National Action Plan for Energy Efficiency
ldquoincome effectrdquo observed where people buy more energy as their overall bill goes down due to switching conshysumption to lower price periods The net effect might not be a significant decrease in total electricity usage but TOU rates do encourage reduced usage when that reduction is the most valuable Another important conshysideration with TOU prices is the environmental impact Depending on generation mix and the diurnal emissions profile of the region shifting consumption from the on-peak period to off-peak period might provide environshymental net benefits
The Energy Policy Act of 2005 Section 1252 requires states and non-regulated utilities by August 8 2007 to consider adopting a standard requiring electric utilities to offer all of their customers a time-based rate schedule such as time-of-use pricing critical peak pricing real-time pricing or peak load reduction credits
Dynamic Rates
Under a dynamic rate structure the utility has the ability to change the cost or availability of power with limited or no notice Common forms of dynamic rates include the following
bull Real-time pricing (RTP) rates vary continuously over time in a way that directly reflects the wholesale price of electricity
bull Critical peak pricing (CPP) rates have higher rates during periods designated as critical peak periods by the utility Unlike TOU blocks the days in which critical peaks occur are not designated in the tariff but are designated on relatively short notice for a limited number of days during the year
bull Non-firm rates typically follow the pricing form of the otherwise applicable rates but offer discounts or incentive payments for customers to curtail usage during times of system need (Horowitz and Woo 2006) Such periods of system need are not designated in advance through the tariff and the customer might receive little notice before energy supply is interrupted In some
cases customers may be allowed to ldquobuy throughrdquo periods when their supply will be interrupted by paying a higher energy charge (a non-compliance penalty) In those cases the non-firm rate becomes functionally identical to CPP rates
Dynamic rates are generally used to 1) promote load shifting by large sophisticated users 2) give large users access to low ldquosurplus energyrdquo prices or 3) reduce peak loads on the utility system Therefore dynamic rates are complementary to energy efficiency but are more useful for achieving demand response during peak periods than reducing overall energy usage
Two-Part Rates
Two-part rates refer to designs wherein a base level of customer usage is priced at rates similar to the status quo (Part 1) and deviations from the base level of usage are billed at the alternative rates (Part 2) Two-part rates are common among RTP programs to minimize the free rider problem By implementing a two-part rate cusshytomers receive the real time price only for their change in usage relative to their base level of usage Without the two-part rate form most low load-factor customers on rates with demand charges would see large bill reducshytions for moving to an RTP rate
A two-part rate form however could also be combined with other rate forms that are more conducive to energy efficiency program adoption For example a two-part rate could be structured like an increasing tiered block rate with the Tier 1 allowance based on the customerrsquos historical usage This structure would address many of the rate design barriers such as revenue stability Of course there would be implementation issues such as determining what historical period is used to set Part 1 and how often that baseline is updated to reflect changes in usage Also new customers would need to be assigned an interim baseline
To create a sustainable aggressive national commitment to energy efficiency 5-7
Demand Charges
Demand charges bill customers based on their peak usage rather than their total usage during the month For electricshyity demand charges are based on usage during particular TOU periods (eg peak demand) or usage during any perishyod in the month (eg maximum demand) Demand charges can also use a percentage of the highest demand over the prior year or prior season as a minimum demand level used for billing For natural gas demand can be based on the highest monthly usage over the past year or season
For both gas and electricity utilities prefer demand charges over volumetric charges because they provide greater revenue certainty and encourage more consisshytent asset utilization In contrast to a demand charge a customer charge that covers more of a utilityrsquos fixed costs reduces profits from increased sales and the utility disincentive to promote energy efficiency
For energy efficiency programs demand charges could help promote reductions in usage for those end uses that cause the customerrsquos peak5 In general however volumetric rates are more favorable for energy efficiency promotion Increasing the demand charges would reduce the magnitude of the price signal that could be sent through a volumetric charge
Mechanisms Where Customer Benefits Are Not Driven by Tariff Savings
The rate design forms discussed above allow customers to benefit from energy efficiency through bill reductions however other types of programs provide incentives that are decoupled from the customerrsquos retail rate
Discount for Efficiency via Conservation Behavior
In some cases energy efficiency benefits are passed on to customers through mechanisms other than retail rates For example in California the ldquo2020rdquo program was impleshymented in 2001 giving customers a 20 percent rebate off their summer bills if they could reduce their electricity
consumption by 20 percent compared to the summer perishyod the prior year The programs success was likely due to a combination of aggressive customer education energy conservation behavior (reducing consumption through limshyiting usage of appliances and end-uses) and investment in energy efficiency Pacific Gas amp Electric (PGampE) has just implemented a similar program for natural gas wherein customers can receive a rebate of 20 percent of their last winterrsquos bill if they can reduce natural gas usage by 10 pershycent this winter season The 2020 program was popular and effective It was easy for customers to understand and there might be a psychological advantage to a program that gives you a rebate (a received reward) as opposed to one that just allows you to pay less than you otherwise would have (a lessened penalty) Applying this concept might require some adjustments to account for changes in weather or other factors
Benefit Sharing
There are two types of benefit sharing with customers6
Under the first type of shared savings a developer (utility or third party) installs an energy-saving device The cusshytomer shares the bill savings with the developer until the customerrsquos project load has been paid off In the second type of shared savings the utility is typically the developer and installs an energy efficiency or distributed generashytion device at the customer site The customer then pays an amount comparable to what the bill would have been without the device or measures installed less a portion of the savings of the device based on utility avoided costs This approach decouples the customer benefits from the utility rate but it can be complicated to detershymine what the consumption would have been without the device or energy efficiency
PacifiCorp in Oregon tackled this problem by offering a cash payment of 35 percent of the cost savings for residenshytial weatherization measures where the cost savings was based on the measurersquos expected annual kWh savings and a schedule of lifecycle savings per kWh (PacifiCorp 2002)
5 Horowitz and Woo (2006) show that demand charges can be used to differentiate service reliability thus implementing curtailable and interruptible service programs that are useful for meeting system resource adequacy
6 Note that benefit sharing is not the same as ldquoshared savingsrdquo used in the context of utility incentives for promoting energy efficiency programs
5-8 National Action Plan for Energy Efficiency
Table 5-2 Pros and Cons of Rate Design Forms
Program Type Criteria
Avoided Cost Benefits Energy and Peak Customer Incentive and Impact on Non- Implementation and and Utility Incentives Reductions Bill Impact Participants Transition Issues
Increasing Tier Block (Inverted block)
httpwwwpgecom tariffspdfE-1pdf
httpwwwsdgecom tm2pdfDRpdf
httpwwwsdgecom tm2pdfGRpdf
Pro Good match when long-run marginal costs are above average costs
Con Might not be the right price signal if long-run marginal costs are below average costs
Pro Can achieve annual energy reductions
Con Does not encourage reductions in any particshyular period (unless comshybined with a time-based rate like TOU)
Pro Provides strong incentive to reduce usage
Con Could result in large bill increases for users that cannot change their usage level and could encourage more usage by the smaller customers
Pro If mandatory little impact on other customer classes
Con Could not be implemented on a voluntary basis because of free rider losses
Pro Simple to bill with existing meters
Con Could require phased transition to mitigate bill impacts
Time of Use (TOU)
httpwwwnationalgridus commasselectric homerates4_touasp
Pro (1) Low implemenshytation cost (2) Tracks expected marginal costs
Con Unclear if marginal costs should be short-or long-run
Pro Can achieve peak load relief
Con Might not achieve substantial energy reductions or produce significant emissions benefits
Pro Provides customers with more control over their bills than flat rates and incentive to reduce peak usage
Con If mandatory could result in large bill increases for users that cannot change their usage pattern
Pro If mandatory little average impact but can be large on some customers
Con If optional potentially large impact due to free riders which can be mitigated by a careful design
Pro Extensive industry experience with TOU rate
Con (1) If mandatory likely opposed by customers but not necessarily the utility (2) If optional opposed by non-participants and possibly the utility
Dynamic Rates Real Time Pricing (RTP)
httpwwwexeloncorpco mcomedlibrarypdfs advance_copy_tariff_ revision6pdf
httpwwwsouthern companycom gulfpowerpricinggulf_ ratesaspmnuOpco=gulf ampmnuType=comampmnuIte m=errates
httpwwwnationalgridus comniagaramohawk non_htmlrates_psc207 pdf
Pro (1) Tracks day-ahead or day-of short-run marginal cost for economically efficient daily consumption decisions (2) RTP rates can be set to help allocate capacity in an economically efficient manner during emergencies
Con No long-run price signal for investment decisions
Pro Can achieve peak load relief
Con (1) Not applicable to gas (2) Might not achieve substantial annual energy reductions or produce significant emissions benefits
Same as above Same as above Con (1) If mandatory likely opposed by customers and the utility due to complexity and implementation cost (2) High implementation cost for metering and information system costs
Dynamic Rates Critical Peak Pricing (CPP)
httpwwwsoutherncomshypanycomgulfpower pricingpdfrsvppdf
httpwwwidahopower comaboutus regulatoryinfotariffPdf aspid=263amppdf
httpwwwpgecom tariffspdfE-3pdf
Pro (1) Tracks short-run marginal cost shortly before emergency (2) If the CPP rates are set at correctly predicted marginal cost during emergency they ration capacity efficiently
Con High implementashytion cost
Pro Likely to achieve load relief
Con Unlikely to provide significant annual energy reductions
Same as above Pro Little impact unless the utility heavily discounts the rate for the non-critical hours
Con (1) If mandatory likely opposed by customers and the utility due to high implementation cost (2) If optional few would object unless the implementation cost spills over to other customer classes
To create a sustainable aggressive national commitment to energy efficiency 5-9
Table 5-2 Pros and Cons of Rate Design Forms (continued)
Program Type Criteria
Avoided Cost Benefits Energy and Peak Customer Incentive and Impact on Implementation and and Utility Incentives Reductions Bill Impact Non-Participants Transition Issues
Dynamic Rates Nonfirm
httpwwwpacificorpcom Regulatory_Rule_Schedul eRegulatory_Rule_Sched ule2220pdf
Pro (1) Provides emergency load relief to support system reliability (2) Implements efficient rationing
Con (1) Does not track costs (2) Potentially high implementation cost
Pro (1) Can achieve load reductions to meet system needs (2) Applicable to both gas and electric service
Con Unlikely to encourage investment in energy efficiency measures
Pro Bill savings comshypensate customer for accepting lower reliability
Pro Little impact unless the utility offers a curtailable rate discount that exceeds the utilitys expected cost savings
Pro (1) If optional nonshyparticipants would not object unless discount is ldquoexcessiverdquo (2) If manshydatory different levels of reliability (at increasing cost) would need to be offered
Con Complicated notice and monitoring requirements
Two-Part Rates
httpwwwaepcustomer comtariffsMichiganpdf MISTD4-28-05pdf
Pro Allows rate to be set at utility avoided cost
Con Requires estabshylishing customer baseshyline which is subject to historical usage weather and other factors
Pro Can be used to encourage or discourage peak usage depending on characteristics of ldquopart twordquo rate form
Pro Provides incentives for changes in customerrsquos usage Therefore no change in usage results in the same bill
Pro Non-participants are held harmless
Pro Complexity can be controlled through design of ldquopart twordquo rate form
Con (1) Customers might not be accustomed to the concept (2) Difficult to implement for many smaller customers
Demand Charges
httpwwwscecomNR sc3tm2pdfce30-12pdf
Pro Reflects the cusshytomerrsquos usage of the utility infrastructure
Con Does not conshysider the duration of the usage (beyond 15 minutes or one hour for electric)
Pro Can achieve load reductions
Con Might not achieve substantial annual reductions
Pro Provides customers with incentive to reduce peak usage and flatten their usage profile
Con If mandatory could result in large bill increases for users who cannot change their usage pattern
Pro If mandatory little average impact but can be large on some cusshytomers
Con If optional potenshytially large impact due to free riders but this can be mitigated by a careful design
Con (1) If mandatory likely opposed by customers and the utility due to high implementashytion cost (2) If optional few would object unless the implementation cost spills over to other customer classes
Discount for Efficiency Benefit Sharing etc
httpwwwcpuccagov PUBLISHEDNEWS_ RELEASE51362htm
httpwwwpacificorp comRegulatory_Rule_ ScheduleRegulatory_Rule _Schedule7794pdf
Pro Incentive can be tied directly to avoided costs without the need to change overall rate design
Con Only a portion of the benefits are reflected in the incenshytive as rate savings will still be a factor for most options
Pro Utilities generally have control over what measures are eligible for an incentive so the mix of peak and energy savshyings can be determined during program design
Con Impacts might be smaller than those attainable through mandatory rate programs
Pro (1) Provides direct incentive for program participation plus ongoing bill reductions (for most options) (2) Does not require rate changes
Con Existing rate forms might impede adoption because of overly low bill savings
Pro Reflects the characteristics of the underlying rate form
Pro Implementation simplified by the ability to keep status quo rates
Con Places burden for action on the energy efficiency implementer whereas a mandatory rate change could encourage customers to seek out efficiency options
Energy Efficiency Customer Rebate Programs (eg 2020 program in California)
wwwscecomRebatesand Savings2020
wwwsdgecomtm2pdf 20-20-TOUpdf
wwwpgecomtariffspdf EZ-2020pdf
Pro Can avoid more drastic rationing mechanisms when resources are signifishycantly constrained
Con Customer discounts are not set based on utility cost savings and therefore these programs might over-reward cutomers who qualify
Pro (1) Links payment of incentive directly to metered energy savings (2) Easy to measure and verify
Con Focused on throughput and not capacity savings
Pro (1) Provides a clear incentive to customers to reduce their energy usage motivates customers and gets them thinking about their energy usage (2) Can provide significant bill savings (3) Doesnrsquot require customers to sign up for any program and can be offered to everyone
Con Shifts costs to nonshyparticipants to the extent that the rebate exceeds the change in utility cost
Pro Very successful during periods when public interest is served for short-term resource savings (eg energy crisis)
Con Implementation and effectiveness might be reduced after being in place for several years
5-10 National Action Plan for Energy Efficiency
On-Bill Financing
The primary function of on-bill financing is to remove the barrier presented by the high first-time costs of many enershygy efficiency measures On-bill financing allows the cusshytomer to pay for energy efficiency equipment over time and fund those payments through bill savings On-bill financing can also deliver financial benefits to the particishypants by providing them access to low financing costs offered by the utility An example of on-bill financing is the ldquoPay As You Saverdquo (PAYS) program which provides upfront funding in return for a monthly charge that is always less than the savings7
Pros and Cons of Various Designs Rate design involves tradeoffs among numerous goals Table 5-2 summarizes the pros and cons of the various rate design forms from various stakeholder perspectives considering implementation and transition issues In most cases design elements can be combined to mitigate
weaknesses of any single design element so the table should be viewed as a reference and starting point
Successful Strategies
Rate design is one of a number of factors that contribute to the success of energy efficiency programs Along with rate design it is important to educate customers about their rates so they understand the value of energy effishyciency investment decisions Table 5-3 shows examples of four states with successful energy efficiency programs and complementary rate design approaches Certainly one would expect higher rates to spur energy efficiency adoption and that appears to be the case for three of the four example states However Washington has an active and cost-effective energy efficiency program despite an average residential rate far below the national average of 103 cents per kWh (EIA 2006)
Table 5-3 Conditions That Assist Success
California Washington State Massachusetts New York
Rate Forms and Cost Structures
Increasing tier block rates for residenshytial (PGampE SCE and SDGampE) Increasing block rate for residential gas (SDGampE)
httpwwwpgecomtariffspdfE-1pdf
httpwwwscecomNRsc3tm2pdf ce12-12pdf
httpwwwsdgecomtm2pdfDRpdf
httpwwwsdgecomtm2pdfGRpdf
Increasing tier block rates for resishydential electric (PacifiCorp) Gas rates are flat volumetric (Puget Sound Electric [PSE]) High export value for electricity especially in the summer afternoon
httpwwwpacificorpcomRegulat ory_Rule_ScheduleRegulatory_ Rule_Schedule2205pdf
Flat electricity rates per kWh with voluntary TOU rates for distribution service (Massachusetts Electric)
httpwwwnationalgridus commasselectricnon_html rates_tariffpdf
Increasing tier rates for residential (Consolidated Edison)
httpwwwconedcom documentselec 201-210pdf
Resource and Load Characteristics
Summer electric peaks Marginal resources are fossil units High marshyginal cost for electricity especially in the summer afternoon Import transfer capability can be constrained Winter gas peaks although electric generashytion is flattening the difference
httpwwwethreecomCPUC E3_Avoided_Costs_Finalpdf
Winter peaking electric loads but summer export opportunities Heavily hydroelectric so resource availability can vary with precipitashytion Gas is winter peaking
httpwwwnwcouncilorgenergy powersupplyoutlookasp
httpwwwnwcouncilorgenergy powerplanplanDefaulthtm
httpwwwpsecomenergyEnviron mentsupplyPDFsII--Summary20 Charts20and20Graphspdf
Part of Indpendant System Operator New England (ISO-NE) which is summer peaking
httpwwwnepoolcom transceltreport20052005 _celt_reportpdf
High summer energy costs and capacity concerns in the summer for the New York City area
httpwwweiadoegov cneafelectricitypage fact_sheetsnewyorkhtml
7 See httpwwwpaysamericaorg
To create a sustainable aggressive national commitment to energy efficiency 5-11
Table 5-3 Conditions That Assist Success (continued)
California Washington State Massachusetts New York
Average Residential Electric Rates
137 centskWh
(EIA 2006)
67 centskWh
(EIA 2006)
176 centskWh
(EIA 2006)
157 centskWh
(EIA 2006)
Market and Utility Structure
Competitive electric generation and gas procurement Regulated wires and pipes
httpwwwenergycagovelectricity divestiturehtml
httpwwwcpuccagovstatic energyelectricab57_briefing_ assembly_may_10pdf
Vertically integrated
httpwwwwutcwagov webimagensf63517e4423a08d e988256576006a80bcfe15f75d 7135a7e28825657e00710928 OpenDocument
Competitive generation Regulated wires
httpwwweiadoegov cneafelectricitypage fact_sheetsmasshtml
Competitive generation Regulated wires
httpwwwnyserdaorgsep sepsection2-1pdf
Political and Administrative Actors
Environmental advocacy in the past and desire to avoid another energy capacity crisis Energy efficiency focuses on electricity
httpwwwenergycagov 2005publicationsCEC-999-2005shy015CEC-999-2005-015PDF
httpwwwenergycagov 2005publicationsCEC-999-2005shy011CEC-999-2005-011PDF
httpwwwcpuccagovPUBLISHED NEWS_RELEASE49757htm
httpwwwcpuccagovstatic energyelectricenergy+efficiency abouthtm
Strong environmental commitshyment and desire to reduce susceptibility to market risks
httpwwwnwenergyorgnews newsnews_conservationhtml
DSM instituted as an alternative to new plant construction in the late 1980s and early 1990s (integrated resource manshyagement) Energy efficiency now under the oversight of Division of Energy Resources
httpwwwmassgovEoca docsdoerpub_info ee-longpdf
PSC established policy goals to promote competitive energy efficiency service and provide direct benefits to the people of New York
On 11606 Governor George E Pataki unveiled ldquoa compreshyhensive multi-faceted plan that will help reduce New Yorkrsquos dependence on imported energyrdquo
httpwwwgetenergysmart orgAboutNYESasp
httpwwwnygovgovernorp ress060116062html
Demand-Side Management (DSM) Funding
System benefits charge (SBC) and procurement payment
httpwwwcpuccagovstatic energyelectricenergy+efficiency ee_fundinghtm
SBC
httpwwwwutcwagov webimagensf8d712cfdd4796c8 888256aaa007e94b40b2e3934 3c0be04a88256a3b007449fe OpenDocument
SBC
httpwwwmassgovEoca docsdoerpub_info ee-longpdf
SBC
httpwwwgetenergysmart orgAboutNYESasp
Part of Washingtonrsquos energy efficiency efforts can be explained by the high value for power exports to California and partly by the regional focus on promoting energy efficiency Washington and the rest of the Pacific Northwest region place a high social value on environshymental protection so Washington might be a case where the success of energy efficiency is fostered by high public awareness and the willingness of the public to look beyond the short-term out-of-pocket costs and consider the longer term impacts on the environment
The other three states shown in Table 5-3 share the comshymon characteristics of high residential rates energy effishyciency funded through a system benefits surcharge and competitive electric markets The formation of competishytive electric markets could have also encouraged energy efficiency by (1) establishing secure funding sources or energy efficiency agencies to promote energy efficiency (2) increasing awareness of energy issues and risks regarding future energy prices and (3) the entrance of new energy agents promoting energy efficiency
5-12 National Action Plan for Energy Efficiency
Key Findings mdash Large Commercial and Industrial Two-part rates These rates provide bill stability and can be established
This chapter summarizes the challenges and opportuni- so that the change in consumption through adoption ties for employing rate designs to encourage utility of energy efficiency is priced at marginal cost The promotion and customer adoption of energy efficiency complexity in establishing historical baseline quantities Key findings of this chapter include might limit the application of two-part rates to the
larger customers on the system bull Rate design is a complex process that balances
numerous regulatory and legislative goals It is impor- mdash All Customer Classes Seasonal price differentials tant to recognize the promotion of energy efficiency in Higher prices during the higher cost peak season the balancing of objectives encourage customer conservation during the peak
and can reduce peak load growth For example bull Rate design offers opportunities to encourage cus- higher winter rates can encourage the purchase of
tomers to invest in efficiency where they find it to be more efficient space heating equipment cost-effective and to participate in new programs that provide innovative technologies (eg smart meters) to bull Energy efficiency can be promoted through non-tariff help customers control their energy costs mechanisms that reach customers through their utility
bill Such mechanisms include bull Utility rates that are designed to promote sales or maxshy
imize stable revenues tend to lower the incentive for mdash Benefit Sharing Programs Benefit sharing programs customers to adopt energy efficiency can resolve situations where normal customer bill
savings are smaller than the cost of energy efficiency bull Rate forms like declining block rates or rates with large programs
fixed charges reduce the savings that customers can attain from adopting energy efficiency mdash On-Bill Financing Financing support can help cusshy
tomers overcome the upfront costs of efficiency bull Appropriate rate designs should consider the unique devices
characteristics of each customer class Some general rate design options by customer class are listed below mdash Energy Efficiency Rebate Programs Programs that
offer discounts to customers who reduce their mdash Residential Inclining tier block rates These rates energy consumption such as the 2020 rebate pro-
can be quickly implemented for all residential and gram in California offer clear incentives to cusshysmall commercial and industrial electric and gas tomers to focus on reducing their energy use customers At a minimum eliminate declining tier block rates As metering costs decline also explore bull More effort is needed to communicate the benefits dynamic rate options for residential customers and opportunities for energy efficiency to customers
regulators and utility decision-makers mdash Small Commercial Time of use rates While these
rates might not lead to much change in annual usage the price signals can encourage customers to consume less energy when energy is the most expensive to produce procure and deliver
To create a sustainable aggressive national commitment to energy efficiency 5-13
Recommendations and Options
The National Action Plan for Energy Efficiency Leadership Group offers the following recommendations as ways to overcome many of the barriers to energy efficiency in rate design and provides a number of options for conshysideration by utilities regulators and stakeholders (as presented in the Executive Summary)
Recommendation Modify ratemaking practices to
promote energy efficiency investments Rate design offers opportunities to encourage customers to invest in efficiency where they find it to be cost-effective and to participate in new programs that bring them innovative technologies (eg smart meters) to help them control their energy costs
Options to Consider
bull Including the impact on adoption of energy efficiency as one of the goals of retail rate design recognizing that it must be balanced with other objectives
bull Eliminating rate designs that discourage energy effishyciency by not increasing costs as customers consume more electricity or natural gas
bull Adopting rate designs that encourage energy efficiency considering the unique characteristics of each cusshytomer class and including partnering tariffs with other mechanisms that encourage energy efficiency such as benefit sharing programs and on-bill financing
Recommendation Broadly communicate the benefits
of and opportunities for energy efficiency Experience shows that energy efficiency programs help customers save money and contribute to lower cost energy sysshytems But these impacts are not fully documented nor recognized by customers utilities regulators and policy-makers More effort is needed to establish the business case for energy efficiency for all decision-makers and to show how a well-designed approach to energy efficienshycy can benefit customers utilities and society by (1) reducing customers bills over time (2) fostering finanshycially healthy utilities (return on equity [ROE] earnings per share debt coverage ratios unaffected) and (3) conshytributing to positive societal net benefits overall Effort is also necessary to educate key stakeholders that although energy efficiency can be an important low-cost resource to integrate into the energy mix it does require funding just as a new power plant requires funding Further education is necessary on the impact that energy efficiency programs can have in concert with other energy efficiency policies such as building codes appliance standards and tax incentives
Option to Consider
bull Communicating on the role of energy efficiency in lowering customer energy bills and system costs and risks over time
5-14 National Action Plan for Energy Efficiency
References
Baskette C Horii B Kollman E amp Price S (2006) Avoided Cost Estimation and Post-Reform Funding Allocation for Californias Energy Efficiency Programs Energy 316-7 1084-1099
Bonbright JC (1961) Principles of Public Utility Rates New York Columbia University Press
Brown SJ and Sibley DS (1986) The Theory of Public Utility Pricing New York Cambridge University Press
Horowitz I and Woo CK (2006) Designing Pareto-Superior Demand-Response Rate Options Energy 316-7 1040-1051
Huntington S (1975) The Rapid Emergence of Marginal Cost Pricing in the Regulation of Electric Utility Rate Structures Boston University Law Review 55 689-774
Hyman LS Hyman AS amp Hyman RC (2000) Americas Electric Utilities Past Present and Future 7th Edition Arlington VA Public Utilities Reports
Joskow PL (1976) Contributions to the Theory of Marginal Cost Pricing Bell Journal of Economics 7(1) 197-206
Joskow P (1979) Public Utility Regulatory Policy Act of 1978 Electric Utility Rate Reform Natural Resources Journal 19 787-809
Kahn A (1970) The Economics of Regulation New York John Wiley amp Sons
PacifiCorp (2002 September 30) Oregon Schedule 9mdash Residential Energy Efficiency Rider Optional Weatherization Services PUC OR No 35 Advice No 02-027 lthttpwwwpacificorpcomRegulatory_ Rule_ScheduleRegulatory_Rule_Schedule7794pdfgt
Phillips CF (1988) The Regulation of Public Utilities Theory and Practice Arlington VA Public Utilities Reports
Public Utility Regulatory Policies Act (PURPA) of 1978 Section 114
US Energy Information Administration [EIA] (2006) Average Retail Price of Electricity to Ultimate Customers by End-Use Sector by State Electric Power Monthly
To create a sustainable aggressive national commitment to energy efficiency 5-15
6Energy Efficiency Program Best Practices
Energy efficiency programs have been operating successfully in some parts of the country since the late 1980s From the experience of these successful programs a number of best practice strategies have evolved for making energy efficiency a resource developing a cost-effective portfolio of energy efficiency proshygrams for all customer classes designing and delivering energy efficiency programs that optimize budgets and ensuring that programs deliver results
Overview
Cost-effective energy efficiency programs have been delivered by large and small utilities and third-party proshygram administrators in some parts of the country since the late 1980s The rationale for utility investment in effishyciency programming is that within certain existing marshykets for energy-efficient products and services there are barriers that can be overcome to ensure that customers from all sectors of the economy choose more energy-efficient products and practices Successful programs have developed strategies to overcome these barriers in many cases partnering with industry and voluntary national and regional programs so that efficiency proshygram spending is used not only to acquire demand-side resources but also to accelerate market-based purchases by consumers
Leadership Group Recommendations
Applicable to Energy Efficiency
Program Best Practices
bull Recognize energy efficiency as a high priority energy resource
bull Make a strong long-term commitment to cost-effective energy efficiency as a resource
bull Broadly communicate the benefits of and opporshytunities for energy efficiency
bull Provide sufficient and stable program funding to deliver energy efficiency where cost-effective
A list of options for promoting best practice energy efficiency programs is provided at the end of this chapter
Challenges that limit greater utility investment in energy efficiency include the following
bull The majority of utilities recover fixed operating costs and earn profits based on the volume of energy they sell Strategies for overcoming this throughput disinshycentive to greater investment in energy efficiency are discussed in Chapter 2 Utility Ratemaking amp Revenue Requirements
bull Lack of standard approaches on how to quantify and incorporate the benefits of energy efficiency into resource planning efforts and institutional barriers at many utilities that stem from the historical business model of acquiring generation assets and building transmission and distribution systems Strategies for overcoming these challenges are addressed in Chapter 3 Incorporating Energy Efficiency in Resource Planning
bull Rate designs that are counterproductive to energy efficiency might limit greater efficiency investment by large customer groups where many of the most cost-effective opportunities for efficiency programshyming exist Strategies for encouraging rate designs that are compatible with energy efficiency are disshycussed in Chapter 5 Rate Design
bull Efficiency programs need to address multiple cusshytomer needs and stakeholder perspectives while simultaneously addressing multiple system needs in many cases while competing for internal resources This chapter focuses on strategies for making energy efficiency a resource developing a cost-effective portshyfolio of energy efficiency programs for all customer classes designing and delivering efficiency programs that optimize budgets and ensuring that those proshygrams deliver results are the focus of this chapter
To create a sustainable aggressive national commitment to energy efficiency 6-1
Programs that have been operating over the past decade and longer have a history of proven savings in megawatts (MW) megawatt-hours (MWh) and therms as well as on customer bills These programs show that energy efficiency can compare very favorably to supply-side options
This chapter summarizes key findings from a portfolioshylevel1 review of many of the energy efficiency programs that have been operating successfully for a number of years It provides an overview of best practices in the following areas
bull Political and human factors that have led to increased reliance on energy efficiency as a resource
bull Key considerations used in identifying target measures2 for energy efficiency programming in the near- and long-term
bull Program design and delivery strategies that can maxishymize program impacts and increase cost-effectiveness
bull The role of monitoring and evaluation in ensuring that program dollars are optimized and that energy efficiency investments deliver results
Background
Best practice strategies for program planning design and implementation and evaluation were derived from a review of energy efficiency programs at the portfolio level across a range of policy models (eg public benefit charge administration integrated resource planning) The box on page 6-3 describes the policy models and Table 6-1 provides additional details and examples of programs operating under various policy models This chapter is not intended as a comprehensive review of the energy efficiency programs operating around the country but does highlight key factors that can help improve and
accelerate energy efficiency program success Organizations reviewed for this effort have a sustained history of successful energy efficiency program impleshymentation (See Tables 6-2 and 6-3 for summaries of these programs) and share the following characteristics
bull Significant investment in energy efficiency as a resource within their policy context
bull Development of cost-effective programs that deliver results
bull Incorporation of program design strategies that work to remove near- and long-term market barriers to investshyment in energy efficiency
bull Willingness to devote the necessary resources to make programs successful
Most of the organizations reviewed also have conducted full-scale impact evaluations of their portfolio of energy efficiency investments within the last few years
The best practices gleaned from a review of these organshyizations can assist utilities their commissions state energy offices and other stakeholders in overcoming barriers to significant energy efficiency programming and begin tapping into energy efficiency as a valuable and clean resource to effectively meet future supply needs
1 For the purpose of this chapter portfolio refers to the collective set of energy efficiency programs offered by a utility or third-party energy efficiency program administrator
2 Measures refer to the specific technologies (eg efficient lighting fixture) and practices (eg duct sealing) that are used to achieve energy savings
6-2 National Action Plan for Energy Efficiency
Energy Efficiency Programs Are Delivered Within Many Policy Models
Systems Benefits Charge (SBC) Model
In this model funding for programs comes from an SBC that is either determined by legislation or a regulatory process The charge is usually a fixed amount per kilowatt-hour (kWh) or million British thermal units (MMBtu) and is set for a number of years Once funds are collected by the distribution or integrated utility programs can be administered by the utility a state agency or a third party If the utility implements the programs it usually receives current cost recovery and a shareholder incentive Regardless of administrative structure there is usually an opportunity for stakeshyholder input
This model provides stable program design In some cases funding has become vulnerable to raids by state agencies In areas aggressively pursuing energy efficiency as a resource limits to additional funding have created a ceiling on the resource While predomshyinantly used in the electric sector this model can and is being used to fund gas programs
Integrated Resource Plan (IRP) Model
In this model energy efficiency is part of the utilityrsquos IRP Energy efficiency along with other demand-side options is treated on an equivalent basis with supply Cost recovery can either be in base rates or through a separate charge The utility might receive a shareholdshyer incentive recovery of lost revenue (from reduced sales volume) or both Programs are driven more by the resource need than in the SBC models This genshyerally is an electric-only model The regional planning model used by the Pacific Northwest is a variation on this model
Request For Proposal (RFP) Model
In this case a utility or an independent system operashytor (ISO) puts out a competitive solicitation RFP to acquire energy efficiency from a third-party provider to meet demand particularly in areas where there are transmission and distribution bottlenecks or a genershyation need Most examples of this model to date have been electric only The focus of this type of program is typically on saving peak demand
Portfolio Standard
In this model the program adminstrator is subject to a portfolio standard expressed in terms of percentage of overall energy or demand This model can include gas as well as electric and can be used independentshyly or in conjunction with an SBC or IRP requirement
Municipal UtilityElectric Cooperative Model
In this model programs are administered by a municshyipal utility or electric cooperative If the utilitycoopershyative owns or is responsible for generation the energy efficiency resource can be part of an IRP Cost recovery is most likely in base rates This model can include gas as well as electric
To create a sustainable aggressive national commitment to energy efficiency 6-3
Table 6-1 Overview of Energy Efficiency Programs
Policy Model Examples
Funding Type
Shareholder Incentive1
Lead Administrator
Role in Resource
Acquisition
Scope of Programs
Political Context
SBC with utility implementation
California
Rhode Island
Connecticut
Massachusetts
Separate charge Usually Utility Depends on whether utility owns generation
Programs for all customer classes
Most programs of this type came out of a restructuring settlement in states where there was an existing infrastrucshyture at the utilities
SBC with state or third-party implementation
New York
Vermont
Wisconsin
Separate charge No State agency Third party
None or limited Programs for all customer classes
Most programs of this type came out of a restructuring settlement
IRP or gas planning model
Nevada
Arizona
Minnesota
Bonneville Power Administration (BPA) (regional planning model as well)
Vermont Gas
Keyspan
Varies in rates capitalized or separate charge
In some cases Utility Integrated Program type dictated by resource need
Part of IRP requirement may be combined with other models
RFP model for full-scale programs and congestion relief
Varies No Utility buys from third party
Integrated ndash can be TampD only
Program type dictated by resource need
Connecticut and Con Edison going out to bid to reduce congestion
Portfolio standard model (can be combined with SBC or IRP)
Nevada
California
Connecticut
Texas
Varies Varies Utility may implement programs or buy to meet standard
Standard portfolio Programs for all customer classes
Generally used in states with existing programs to increase program activity
Municipal utility amp electric cooperative
Sacramento Municipal Utility District (CA)
City of Austin (TX)
Great River Energy (MN)
In rates No Utility Depends on whether utility owns generation
Programs for all customer classes
Based on customer and resource needs can be similar to IRP model
1 A shareholder incentive is a financial incentive to a utility (above those that would normally be recovered in a rate case) for achieving set goals for energy efficiency program performance
6-4 National Action Plan for Energy Efficiency
Key Findings
Overviews of the energy efficiency programs reviewed for this chapter are provided in Table 6-2 and 6-3 Key findings drawn from these programs include
bull Energy efficiency resources are being acquired on avershyage at about one-half the cost of the typical new power sources and about one-third of the cost of natshyural gas supply in many casesmdashand contribute to an overall lower cost energy system for rate-payers (EIA 2006)
bull Many energy efficiency programs are being delivered at a total program cost of about $002 to $003 per lifeshytime kilowatt-hour (kWh) saved and $030 to $200 per lifetime million British thermal units (MMBtu) saved These costs are less than the avoided costs seen in most regions of the country Funding for the majority of programs reviewed ranges from about 1 to 3 pershycent of electric utility revenue and 05 to 1 percent of gas utility revenue
bull Even low energy cost states such as those in the Pacific Northwest have reason to invest in energy efficiency as energy efficiency provides a low-cost reliable resource that reduces customer utility bills Energy effishyciency also costs less than constructing new generashytion and provides a hedge against market fuel and environmental risks (Northwest Power and Conservation Council 2005)
bull Well-designed programs provide opportunities for cusshytomers of all types to adopt energy savings measures and reduce their energy bills These programs can help customers make sound energy use decisions increase control over their energy bills and empower them to manage their energy usage Customers can experience significant savings depending on their own habits and the program offered
bull Consistently funded well-designed efficiency programs are cutting electricity and natural gas loadmdashproviding annual savings for a given program year of 015 to 1
percent of energy sales These savings typically will accrue at this level for 10 to 15 years These programs are helping to offset 20 to 50 percent of expected energy growth in some regions without compromising end-user activity or economic well being
bull Research and development enables a continuing source of new technologies and methods for improving energy efficiency and helping customers control their energy bills
bull Many state and regional studies have found that purshysuing economically attractive but as yet untapped energy efficiency could yield more than 20 percent savshyings in total electricity demand nationwide by 2025 These savings could help cut load growth by half or more compared to current forecasts Savings in direct use of natural gas could similarly provide a 50 percent or greater reduction in natural gas demand growth Potential varies by customer segment but there are cost-effective opportunities for all customer classes
bull Energy efficiency programs are being operated successshyfully across many different contexts regulated and unregulated markets utility state or third-party administration investor-owned public and cooperashytives and gas and electric utilities
bull Energy efficiency resources are being acquired through a variety of mechanisms including system benefits charges (SBCs) energy efficiency portfolio standards (EEPSs) and resource planning (or cost of service) efforts
bull Cost-effective energy efficiency programs for electricity and natural gas can be specifically targeted to reduce peak load
bull Effective models are available for delivering gas and electric energy efficiency programs to all customer classes Models may vary based on whether a utility is in the inishytial stages of energy efficiency programming or has been implementing programs for a number of years
To create a sustainable aggressive national commitment to energy efficiency 6-5
Table 6-2 Efficiency Measures of Natural Gas Savings Programs
Program Administrator Keyspan
(MA)
Vermont Gas
(VT)
SoCal Gas
(CA)
Policy Model Gas Gas Gas
Period 2004 2004 2004
Program Funding
Average Annual Budget ($MM) 12 11 21
of Gas Revenue 100 160 053
Benefits
Annual MMBtu Saved 1 (000s MMBtu) 500 60 1200
Lifetime MMBtu Saved 2 (000s MMBtu) 6000 700 15200
Cost-Effectiveness
Cost of Energy Efficiency ($lifetime MMBtu) 2 2 1
Retail Gas Prices ($thousand cubic feet [Mcf]) 11 9 8
Cost of Energy Efficiency ( Avoided Energy Cost) 19 18 18
Total Avoided Cost (2005 $MMBtu) 3 12 11 7
1 SWEEP 2006 Southern California Gas Company 2004 2 Lifetime MMBtu calculated as 12 times annual MMBtu saved where not reported (not reported for Keyspan or Vermont Gas) 3 VT and MA avoided cost (therms) represents all residential (not wholesale) cost considerations (ICF Consulting 2005)
bull Energy efficiency programs projects and policies benshyefit from established and stable regulations clear goals and comprehensive evaluation
bull Energy efficiency programs benefit from committed program administrators and oversight authorities as well as strong stakeholder support
bull Most large-scale programs have improved productivity enabling job growth in the commercial and industrial sectors
bull Large-scale energy efficiency programs can reduce wholesale market prices
Lessons learned from the energy efficiency programs operated since inception of utility programs in the late 1980s are presented as follows and cover key aspects of energy efficiency program planning design implemenshytation and evaluation
Summary of Best Practices
In this chapter best practice strategies are organized and explained under four major groupings
bull Making Energy Efficiency a Resource
bull Developing an Energy Efficiency Plan
bull Designing and Delivering Energy Efficiency Programs
bull Ensuring Energy Efficiency Investments Deliver Results
For the most part the best practices are independent of the policy model in which the programs operate Where policy context is important it is discussed in relevant secshytions of this chapter
6-6 National Action Plan for Energy Efficiency
Making Energy Efficiency a Resource
Energy efficiency is a resource that can be acquired to help utilities meet current and future energy demand To realize this potential requires leadership at multiple levels organizational alignment and an understanding of the nature and extent of the energy efficiency resource
bull Leadership at multiple levels is needed to establish the business case for energy efficiency educate key stakeshyholders and enact policy changes that increase investshyment in energy efficiency as a resource Sustained leadership is needed from
mdash Key individuals in upper management at the utility who understand that energy efficiency is a resource alternative that can help manage risk minimize long-term costs and satisfy customers
mdash State agencies regulatory commissions local governshyments and associated legislative bodies andor consumer advocates that expect to see energy efficiency considered as part of comprehensive utility management
mdash Businesses that value energy efficiency as a way to improve operations manage energy costs and conshytribute to long-term energy price stability and availabilishyty as well as trade associations and businesses such as Energy Service Companies (ESCOs) that help members and customers achieve improved energy performance
mdash Public interest groups that understand that in order to achieve energy efficiency and environmental objectives they must help educate key stakeholders and find workable solutions to some of the financial challenges that limit acceptance and investment in energy efficiency by utilities3
bull Organizational alignment With policies in place to supshyport energy efficiency programming organizations need to institutionalize policies to ensure that energy efficiency goals are realized Factors contributing to success include
mdash Strong support from upper management and one or more internal champions
mdash A framework appropriate to the organization that supports large-scale implementation of energy effishyciency programs
mdash Clear well-communicated program goals that are tied to organizational goals and possibly compensation
mdash Adequate staff resources to get the job done
mdash A commitment to continually improve business processes
bull Understanding of the efficiency resource is necessary to create a credible business case for energy efficiency Best practices include the following
mdash Conduct a ldquopotential studyrdquo prior to starting programs to inform and shape program and portfolio design
mdash Outline what can be accomplished at what costs
mdash Review measures for all customer classes including those appropriate for hard-to-reach customers such as low income and very small business customers
Developing an Energy Efficiency Plan
An energy efficiency plan should reflect a long-term pershyspective that accounts for customer needs program cost-effectiveness the interaction of programs with other policies that increase energy efficiency the opporshytunities for new technology and the importance of addressing multiple system needs including peak load reduction and congestion relief Best practices include the following
bull Offer programs for all key customer classes
bull Align goals with funding
3 Public interest groups include environmental organizations such as the National Resources Defense Council (NRDC) Alliance to Save Energy (ASE) and American Council for an Energy Efficient Economy (ACEEE) and regional market transformation entities such as the Northeast Energy Efficiency Partnerships (NEEP) Southwest Energy Efficiency Project (SWEEP) and Midwest Energy Efficiency Alliance (MEEA)
To create a sustainable aggressive national commitment to energy efficiency 6-7
Table 6-3 Efficiency Measures of Electric and Combination Programs
NYSERDA (NY)
Efficiency Vermont
(VT)
MA Utilities (MA)
WI Department of
Administration12
CA Utilities (CA)
Policy Model SBC wState Admin SBC w3rd Party Admin SBC wUtility Admin SBC wState Admin SBC wUtility Admin amp Portfolio Standard
Period 2005 2004 2002 2005 2004
Program Funding
Spending on Electric Energy Efficiency ($MM) 1 138 14 123 63 317
Budget as of Electric Revenue 2 13 33 30 14 15
Avg Annual Budget Gas ($MM) NR 10 NA 3 11 NA NA
of Gas Revenue NR 10 NA NA NA NA
Benefits Annual MWh Saved MWh Sales 34 02 09 04 01 10 Lifetime MWh Saved 5 (000s MWh) 6216 700 3428 1170 22130 Annual MW Reduction 172 15 48 81 377 Lifetime MMBtu Saved 5 (000s MMBtu) 17124 470 850 11130 43410 Annual MMBtu Saved (000s MMBtu) 1427 40 70 930 3620
Non-Energy Benefits $79M bill reduction 37200 CCF of water
$21M bill reduction
2090 new jobs created
Value of non-energy benefits
Residential $6M CI $36M
NR
Avoided Emissions (tonsyr for 1 program year) (could include benefits from load response renewable and DG programs)
NOX 470
SO2 850
CO2 400000
Unspecified pollutants 460000 over
lifetime
NOX 135
SO2 395
CO2 161205
NOX 2167
SO2 4270
CO2 977836
(annual savings from 5program years)
NR
Cost-Effectiveness Cost of Energy Efficiency
$lifetime (kWh) 6 002 002 003 005 001 $lifetime (MMBtu) NA NA 032 NA NA
Retail Electricity Prices ($kWh) 013 011 011 007 013 Retail Gas Prices ($mcf) NA NA NR NA NA Avoided Costs (2005$) 78
Energy ($kWh) 003 007 007 002 to 006 13 006 Capacity ($kW)9 2820 362 664 On-Peak Energy ($kWh) 008 Off-Peak Energy ($kWh) 006
Cost of Energy Efficiency as Avoided Energy Cost 89 29 10 90 23
CI = Commercial and Industrial CO2 = Carbon Dioxide $MM = Million Dollars NA = Not Applicable NR = Not Reported NOX = Nitrogen Oxides SO2 = Sulfur Dioxide 1 NYSERDA 2005 spending derived from subtracting cumulative 2004 spending from cumulative 2005 spending includes demand response and
research and development (RampD) 2 ACEEE 2004 Seattle City Light 2005 3 Annual MWh Saved averaged over program periods for Wisconsin and California Utilities NYSERDA 2005 energy efficiency savings derived from
subtracting cumulative 2004 savings from 2005 cumulative reported savings 4 EIA 2006 Austin Energy 2004 Seattle City Light 2005 Total sales for California Utilities in 2003 and SMUD in 2004 were derived based on
growth in total California retail sales as reported by EIA 5 Lifetime MWh savings based on 12 years effective life of installed equipment where not reported for NYSERDA Wisconsin Nevada SMUD BPA
and Minnesota Lifetime MMBtu savings based on 12 years effective life of installed equipment
6-8 National Action Plan for Energy Efficiency
Table 6-3 Efficiency Measures of Electric and Combination Programs (continued)
Nevada CT Utilities (CT)
SMUD (CA)
Seattle City Light (WA) Austin Energy
Bonneville Power Administration (ID MT OR WA)
MN Electric and Gas Investor-Owned
Utilities (MN)
IRP with Portfolio Standard
SBC wUtility Admin amp Portfolio Standard
Municipal Utility Municipal Utility Municipal Utility Regional Planning IRP and Conservation
Improvement Program
2003 2005 2004 2004 2005 2004 2003
Program Funding
11 65 30 20 25 78 52
05 31 15 34 19 NR NR
NA NA NA NA NA NA $14
NA NA NA NA NA NA 050
Benefits 01 10 05 07 09 05 420 4400 630 1000 930 3080 3940 16 135 14 7 50 472 129
NA NA NA NA 10777 NA 22010 NA NA NA NA 1268 NA 1830
NR lifetime savings of $550M on bills NR
lifetime savings of $430M on bills
created
Potentially over 900 jobs created
Residential $6M CI $36M
NR NR
NR
NOX 334
SO2 123
CO2 198586
NOX 18
CO2 353100 (cummulative
annual savings for 13 years)
NOX 640
SO2 104
CO2 680000 over lifetime
NR NR
Cost-Effectiveness
003 001 003 002 003 003 001 NA NA NA NA 232 NA 006
009 010 010 006 012 Wholesaler - NA 006 NA NA NA NA NA NA 580
007 NR NR Wholesaler - NA NR 3606 2033
008 006
Not calculated 21 63 Not calculated Not calculated Not calculated
6 Calculated for all cases except SMUD SMUD data provided by J Parks Manager Energy Efficiency and Customer RampD Sacramento Municipal Utility District (personal communication May 19 2006)
7 Avoided cost reported as a consumption ($kWh) not a demand (kW) figure 8 Total NSTAR avoided cost for 2006 9 Avoided capacity reported by NYSERDA as the three-year averaged hourly wholesale bid price per MWh 10 NYSERDA does not separately track gas-related project budget revenue or benefits 11 NSTAR Gas only 12 Wisconsin has a portfolio that includes renewable distributed generation some comparisons might not be appropriate 13 Range based on credits given for renewable distributed generation
To create a sustainable aggressive national commitment to energy efficiency 6-9
bull Use cost-effectiveness tests that are consistent with long-term planning
bull Consider building codes and appliance standards when designing programs
bull Plan to incorporate new technologies
bull Consider efficiency investments to alleviate transmisshysion and distribution constraints
bull Create a roadmap of key program components milestones and explicit energy use reduction goals
Designing and Delivering Energy Efficiency Programs
Program administrators can reduce the time to market and implement programs and increase cost-effectiveness by leveraging the wealth of knowledge and experience gained by other program administrators throughout the nation and working with industry to deliver energy effishyciency to market Best practices include the following
bull Begin with the market in mind
mdash Conduct a market assessment
mdash Solicit stakeholder input
mdash Listen to customer and trade ally needs
mdash Use utility channels and brands
mdash Promote both energy and non-energy (eg improved comfort improved air quality) benefits of energy efficient products and practices to customers
mdash Coordinate with other utilities and third-party proshygram administrators
mdash Leverage the national ENERGY STAR program
mdash Keep participation simple
mdash Keep funding (and other program characteristics) as consistent as possible
mdash Invest in education training and outreach
mdash Leverage customer contact to sell additional efficienshycy and conservation
bull Leverage private sector expertise external funding and financing
mdash Leverage manufacturer and retailer resources through cooperative promotions
mdash Leverage state and federal tax credits and other tax incentives (eg accelerated depreciation first-year expensing sales tax holidays) where available
mdash Build on ESCO and other financing program options
mdash Consider outsourcing some programs to private and not-for-profit organizations that specialize in program design and implementation through a competitive bidding process
bull Start with demonstrated program modelsmdashbuild infrastructure for the future
mdash Start with successful program approaches from other utilities and program administrators and adapt them to local conditions to accelerate program design and effective implementation
mdash Determine the right incentives and if incentives are finanshycial make sure that they are set at appropriate levels
mdash Invest in educating and training the service industry (eg home performance contractors heating and coolshying technicians) to deliver increasingly sophisticated energy efficiency services
mdash Evolve to more comprehensive programs
6-10 National Action Plan for Energy Efficiency
mdash Change measures over time to adapt to changing markets and new technologies
mdash Pilot test new program concepts
Ensuring Energy Efficiency Investments Deliver Results
Program evaluation helps optimize program efficiency and ensure that energy efficiency programs deliver intended results Best practices include the following
bull Budget plan and initiate evaluation from the onset formalize and document evaluation plans and processes
bull Develop program and project tracking systems that support evaluation and program implementation needs
bull Conduct process evaluations to ensure that programs are working efficiently
bull Conduct impact evaluations to ensure that mid- and long-term goals are being met
bull Communicate evaluation results to key stakeholders Include case studies to make success more tangible
Making Energy Efficiency a Resource
Energy efficiency programs are being successfully operated across many different contexts including electric and gas utilities regulated and unregulated markets utility state and third-party administrators and investor-owned pubshylic and cooperatively owned utilities These programs are reducing annual energy use by 015 to 1 percent at spendshying levels between 1 and 3 percent of electric and 05 and 15 percent of gas revenuesmdashand are poised to deliver substantially greater reductions over time These organishyzations were able to make broader use of the energy efficiency resource in their portfolio by having
bull Leadership at multiple levels to enact policy change
bull Organizational alignment to ensure that efficiency goals are realized
bull A well-informed understanding of the efficiency resource including the potential for savings and the technologies for achieving them
Examples of leadership organizational alignment and the steps that organizations have taken to understand the nature and extent of the efficiency resource are provided in the next sections
Leadership
Many energy efficiency programs reviewed in this chapter began in the integrated resource plan (IRP) era of the electric utilities of the 1980s As restructuring started in the late 1990s some programs were suspended or halted In some cases (such as California New York Massachusetts Connecticut and Rhode Island) however settlement agreements were reached that allowed restructuring legislation to move forward if energy effishyciency programming was provided through the distribushytion utility or other third-party providers In many cases environmental advocates energy service providers and state agencies played active roles in the settlement process to ensure energy efficiency was part of the restructured electric utility industry Other states (such as Minnesota Wisconsin and Vermont) developed legislashytion to address the need for stable energy efficiency proshygramming without restructuring their state electricity markets In addition a few states (including California Minnesota New Jersey Oregon Vermont and Wisconsin) enacted regulatory requirements for utilities or other parties to provide gas energy efficiency proshygrams (Kushler et al 2003) Over the past few years the mountain states have steadily ramped up energy efficiency programs
In all cases to establish energy efficiency as a resource required leadership at multiple levels
bull Leadership is needed to establish the business case for energy efficiency educate key stakeholders and enact policy changes that increase investment in energy efficiency as a resource Sustained leadership is needed from
To create a sustainable aggressive national commitment to energy efficiency 6-11
mdash Key individuals in upper management at the utility who understand that energy efficiency is a resource alternative that can help manage risk minimize long-term costs and satisfy customers
mdash State agencies regulatory commissions local govshyernments and associated legislative bodies andor consumer advocates that expect to see energy efficienshycy considered as part of comprehensive utility manageshyment
mdash Businesses that value energy efficiency as a way to improve operations manage energy costs and conshytribute to long-term energy price stability and availshyability as well as trade associations and businesses such as ESCOs that help members and customers achieve improved energy performance
ndash Public interest groups that understand that in order to achieve energy efficiency and environmental objectives they must help educate key stakeholders and find workshyable solutions to some of the financial challenges that limit acceptance and investment in energy efficiency by utilities
The following are examples of how leadership has resulted in increased investment in energy efficiency
bull In Massachusetts energy efficiency was an early conshysideration as restructuring legislation was discussed The Massachusetts Department of Public Utilities issued an order in DPU 95-30 establishing principles to ldquoestablish the essential underpinnings of an electric industry structure and regulatory framework designed to minimize long-term costs to customers while mainshytaining safe and reliable electric service with minimum impact on the environmentrdquo Maintaining demand side management (DSM) programs was one of the major principles the department identified during the transition to a restructured electric industry The Conservation Law Foundation the Massachusetts Energy Efficiency Council the National Consumer Law Center the Division of Energy Resources the Union of Concerned Scientists and others took leadership roles in ensuring energy efficiency was part of a restructured industry (MDTE 1995)
bull Leadership at multiple levels led to significantly expanded programming of Nevadarsquos energy efficiency program from about $2 million in 2001 to an estimated $26 million to $33 million in 2006
ldquoThere are lsquochampionsrsquo for expanded energy efficiency efforts in Nevada either in the state energy office or in the consumer advocatersquos office Also there have been very supportive individuals in key positions within the Nevada utilities These individuals are committed to developing and implementing effective DSM programs along with a supportive policy frameworkrdquo (SWEEP 2006)
Public interest organizations including SWEEP also played an important role by promoting a supportive polshyicy framework (see box on page 6-13 ldquoCase Study Nevada Efficiency Program Expansionrdquo for additional information)
bull Fort Collins City Council (Colorado) provides an example of local leadership The council adopted the Electric Energy Supply Policy in March 2003 The Energy Policy includes specific goals for city-wide energy consumpshytion reduction (10 percent per capita reduction by 2012) and peak demand reduction (15 percent per capita by 2012) Fort Collins Utilities introduced a variety of new demand-side management (DSM) programs and services in the last several years in pursuit of the energy policy objectives
bull Governor Huntsmanrsquos comprehensive policy on energy efficiency for the state of Utah which was unveiled in April 2006 is one of the most recent examples of leadshyership The policy sets a goal of increasing the statersquos energy efficiency by 20 percent by the year 2015 One key strategy of the policy is to collaborate with utilities regulators and the private sector to expand energy efficiency programs working to identify and remove barriers and assisting the utilities in ensuring that efficiency programs are effective attainable and feasible to implement
6-12 National Action Plan for Energy Efficiency
Organizational Alignment
Once policies and processes are in place to spearhead increased investment in energy efficiency organizations often institutionalize these policies to ensure that goals are realized The most successful energy efficiency proshygrams by utilities or third-party program administrators share a number of attributes They include
bull Clear support from upper management and one or more internal champions
bull Clear well-communicated program goals that are tied to organizational goals and in some cases compensation
bull A framework appropriate to the organization that supshyports large-scale implementation of energy efficiency programs
bull Adequate staff resources to get the job done
bull Strong regulatory support and policies
bull A commitment to continually improve business processes
ldquoSupport of upper management is critical to program successrdquo (Komor 2005) In fact it can make or break a program If the CEO of a company or the lead of an agency is an internal champion for energy efficiency it will be truly a part of how a utility or agency does busishyness Internal champions below the CEO or agency level are critical as well These internal champions motivate their fellow employees and embody energy efficiency as part of the corporate culture
Case Study Nevada Efficiency Program Expansion
Nevada investor-owned utilities (IOUs) Nevada Power and Sierra Pacific Power Company phased-out DSM programs in the mid-1990s After 2001 when the legislature refined the statersquos retail electric restructuring law to permit only large customers (gt1 megawatt [MW]) to purchase power competitively utilities returned to a vertically integrated structure and DSM programs were restarted but with a budget of only about $2 million that year
As part of a 2001 IRP proceeding a collaborative process was established for developing and analyzing a wider range of DSM program options All parties reached an agreement to the IRP proceeding calling for $112 million per year in utility-funded DSM programs with an emphasis on peak load reduction but also significant energy savshyings New programs were launched in March 2003
In 2004 the Nevada public utilities commission also approved a new policy concerning DSM cost recovery allowing the utilities to earn their approved rate of return plus 5 percent (eg a 15 percent return if the approved rate is 10 percent) on the equity-portion of their DSM program funding This step gave the utilities a much greater financial incentive to expand their DSM programs
In June 2005 legislation enacted in Nevada added energy savings from DSM programs to the statersquos Renewable Portfolio Standard This innovative policy allows energy savings from utility DSM programs and efficiency measshyures acquired through contract to supply up to 25 percent of the requirements under the renamed clean energy portfolio standard The clean energy standard is equal to 6 percent of electricity supply in 2005 and 2006 and increases to 9 percent in 2007 and 2008 12 percent from 2009 to 2010 15 percent in 2011 and 2012 18 percent in 2013 and 2014 and 20 percent in 2015 and thereshyafter At least half of the energy savings credits must come from electricity savings in the residential sector
Within months of passage the utilities proposed a large expansion of DSM programs for 2006 In addition to the existing estimated funding of $26 million the Nevada utilshyities proposed adding another $75 million to 2006 DSM programs If funding is approved the Nevada utilities estishymate the 2006 programs alone will yield gross energy savshyings of 153 gigawatt-hoursyr and 63 MW (Larry Holmes personal communication February 28 2006)
Source Geller 2006
To create a sustainable aggressive national commitment to energy efficiency 6-13
Tying energy efficiency to overall corporate goals and compensation is important particularly when the utility is the administrator of energy efficiency programs Ties to corporate goals make energy efficiency an integral part of how the organization does business as exemplified below
bull Bonneville Power Administration (BPA) includes energy efficiency as a part of its overall corporate strategy and its executive compensation is designed to reflect how well the organization meets its efficiency goals BPArsquos strategy map states ldquoDevelopment of all cost-effective energy efficiency in the loads BPA serves facilitates development of regional renewable resources and adopts cost-effective non-construction alternatives to transmission expansionrdquo (BPA 2004)
bull National Grid ties energy efficiency goals to staff and executive compensation (P Arons personnel communishycation June 15 2006)
bull Sacramento Municipal Utility District (SMUD) ties energy efficiency to its reliability goal ldquoTo ensure a reliable energy supply for customers in 2005 the 2005 budget includes sufficient capacity reserves for the peak summer season We have funded all of the Districtrsquos commercial and resishydential load management programs and on-going effishyciency programs in Public Good to continue to contribute to peak load reductionrdquo (SMUD 2004a)
bull Nevada Powerrsquos Conservation Department had a ldquoPerformance Dashboardrdquo that tracks costs participating customers kWh savings kW savings $kWh $kW customer contribution to savings and total customer costs on a real time basis both by program and overall
bull Austin Energyrsquos Mission Statement is ldquoto deliver clean affordable reliable energy and excellent customer servshyicesrdquo (Austin Energy 2004)
bull Seattle City Light has actively pursued conservation as an alternative to new generation since 1977 and has tracked progress toward its goals (Seattle City Light 2005) Its longstanding resolute policy direction estabshylishes energy conservation as the first choice resource In more recent years the utility has also been guided by the cityrsquos policy to meet of all the utilityrsquos future load growth with conservation and renewable resources (Steve Lush personal communication June 2006)
From Pacific Gas and Electricrsquos (PGampErsquos) Second Annual Corporate Responsibility Report (2004)
ldquoOne of the areas on which PGampE puts a lot of emphasis is helping our customers use energy more efficientlyrdquo
ldquoFor example we plan to invest more than $2 billion on energy efficiency initiatives over the next 10 years Whatrsquos exciting is that the most recent regulatory approval we received on this was the result of collaboration by a large and broad group of parties including manufacturers customer groups environmental groups and the statersquos utilitiesrdquo
mdash Beverly Alexander Vice President Customer Satisfaction PGampE
Having an appropriate framework within the organizashytion to ensure success is also important In the case of the utility this would include the regulatory framework that supports the programs including cost recovery and potentially shareholder incentives andor decoupling For a third-party administrator an appropriate framework might include a sound bidding process by a state agency to select the vendor or vendors and an appropriate regshyulatory arrangement with the utilities to manage the funding process
Adequate resources also are critical to successful impleshymentation of programs Energy efficiency programs need to be understood and supported by departments outside those that are immediately responsible for proshygram delivery If information technology legal power supply transmission distribution and other departshyments do not share and support the energy efficiency goals and programs it is difficult for energy efficiency programs to succeed When programs are initiated the need for support from other departments is greatest Support from other departments needs to be considered in planning and budgeting processes
6-14 National Action Plan for Energy Efficiency
As noted in the Nevada case study having a shareholder incentive makes it easier for a utility to integrate effishyciency goals into its business because the incentive offshysets some of the concerns related to financial treatment of program expenses and potential lost revenue from decreased sales For third-party program administrators goals might be built into the contract that governs the overall implementation of the programs For example Efficiency Vermontrsquos contract with the Vermont Department of Public Service Board has specific pershyformance targets An added shareholder return will not motivate publicly and cooperatively owned utilities though they might appreciate reduced risks from exposhysure to wholesale markets and the value added in improved customer service SMUD for example cites conservation programs as a way to help customers lower their utility bills (SMUD 2004b) These compashynies like IOUs can link employee compensation to achieving energy efficiency targets
Business processes for delivering energy efficiency proshygrams and services to customers should be developed and treated like other business processes in an organizashytion and reviewed on a regular basis These processes should include documenting clear plans built on explicit assumptions ongoing monitoring of results and plan inputs (assumptions) and regular reassessment to improve performance (using improved performance itself as a metric)
Understanding the Efficiency Resource
Energy efficiency potential studies provide the initial jusshytification (the business case) for utilities embarking on or expanding energy efficiency programs by providing information on (1) the overall potential for energy effishyciency and (2) the technologies practices and sectors with the greatest or most cost-effective opportunities for achieving that potential Potential studies illuminate the nature of energy efficiency resource and can be used by legislators and regulators to inform efficiency policy and programs Potential studies can usually be completed in three to eight months depending on the level of detail availability of data and complexity They range in cost
from $100000 to $300000 (exclusive of primary data collection) Increasingly many existing studies can be drawn from to limit the extent and cost of such an effort
The majority of organizations reviewed in developing this chapter have conducted potential studies in the past five years In addition numerous other studies have been conshyducted in recent years by a variety of organizations intershyested in learning more about the efficiency resource in their state or region Table 6-4 summarizes key findings for achievable potential (ie what can realistically be achieved from programs within identified funding paramshyeters) by customer class from a selection of these studies It also illustrates that this potential is well represented across the residential commercial and industrial sectors The achievable estimates presented are for a future time period are based on realistic program scenarios and repshyresent potential program impacts above and beyond natshyurally occurring conservation Energy efficiency potential studies are based on currently available technologies New technologies such as those discussed in Table 6-9 will conshytinuously and significantly increase potential over time
The studies show that achievable potential for reducing overall energy consumption ranges from 7 to 32 percent for electricity and 5 to 19 percent for gas and that demand for electricity and gas can be reduced by about 05 to 2 percent per year For context national electricity consumption is projected to grow by 16 percent per year and gas consumption is growing 07 percent per year (EIA 2006a)
The box on page 6-17 ldquoOverview of a Well-Designed Potential Studyrdquo provides information on key elements of a potential study Related best practices for efficiency programs administrators include
bull Conducting a ldquopotential studyrdquo prior to starting programs
bull Outlining what can be accomplished at what cost
bull Reviewing measures appropriate to all customer classes including those appropriate for hard-to-reach customers such as low income and very small business customers
To create a sustainable aggressive national commitment to energy efficiency 6-15
6-16 National Action Plan for Energy Efficiency
Tab
le 6
-4
Ach
ieva
ble
En
erg
y E
ffici
en
cy P
ote
nti
al
Fro
m R
ece
nt
Stu
die
s
Stat
eRe
gion
St
udy
Leng
th(Y
ears
)
Ach
ieva
ble
Dem
and
Redu
ctio
n (M
W)
Ach
ieva
ble
Gas
Co
nsum
ptio
nRe
duct
ion
(MM
Btu)
Ach
ieva
ble
GW
h Re
duct
ion
Dem
and
Savi
ngs
a s
of 2
004
Stat
eN
amep
late
Capa
city
10
Ann
ual
M
WSa
ving
s
Elec
tric
itySa
ving
s as
o
f Tot
al20
04 S
tate
Usag
e 11
Ann
ual
G
Wh
Savi
ngs
Gas S
avin
gs
as
of T
otal
20
04 S
tate
Usag
e12
Ann
ual
MM
Btu
Savi
ngs
Resi
dent
ial
Com
mercia
l In
dust
rial
Resi
dent
ial
Com
mercia
l In
dust
rial
Resi
dent
ial
Com
mercia
l In
dust
rial
Elec
tricit
y El
ectricit
y Ga
s
US
(Cle
anEn
ergy
Fut
ure)
1 20
n
a n
a n
a 50
000
000
0 30
000
000
0 1
400
000
000
392
732
281
360
292
076
na
na
24
1
2
10
0
5
Con
Edis
on 2
10
na
na
na
113
967
00
10782
100
23
100
0 n
a n
a n
a n
a n
a n
a n
a 19
19
Paci
fic
NW
3 20
n
a n
a n
a n
a n
a n
a 11
169
9
715
501
1 n
a n
a 12
5
0
6
na
na
Puge
t So
und
4 20
13
3 148
16
na
na
na
116
9 1
293
139
93
0
5
95
0
5
na
na
Conn
ecti
cut
5 8
240
575
93
na
na
na
165
5 2
088
723
125
16
13
4
1
7
na
na
Calif
orni
a 6
9 180
0 2
600
155
0 27
500
000
20
600
000
-
920
0 11
900
880
0 9
6
11
11
8
1
3
10
1
1
Sout
hwes
t 7 17
n
a n
a n
a n
a n
a n
a 24
593
50
291
-
na
na
328
19
n
a n
a
New
Yor
k 8
19
358
4 8
180
602
na
na
na
157
28
2948
818
0 23
1
1
2
143
08
n
a n
a
Illin
ois 9
17
na
na
na
na
na
na
--
670
00
na
na
432
25
n
a n
a
AVER
AG
E
11
1
3
12
MW
= M
egaw
att
MM
Btu
= M
illio
n Br
itish
ther
mal
uni
ts
1 O
RNL
200
02 N
YSE
RDA
OE
200
63
NPC
C 2
005
4 Pu
get
Soun
d En
ergy
200
35 G
DS
Ass
ocia
tes
and
Qua
ntum
Con
sulti
ng 2
004
6 K
EMA
200
2 K
EMA
amp X
ENER
GY
200
3a K
EMA
amp X
ENER
GY
200
3b
7 SW
EEP
200
28 N
YSE
RDA
OE
200
39 A
CEE
E 1
998
10
EIA
200
5a
11 E
IA 2
005b
12
EIA
200
6b
Overview of a Well-Designed Potential Study
Well-designed potential studies assess the following types of potential
Technical potential assumes the complete penetration of all energy-conservation measures that are considered technically feasible from an engineering perspective
Economic potential refers to the technical potential of those measures that are cost-effective when compared to supply-side alternatives The economic potential is very large because it is summing up the potential in existing equipment without accounting for the time period during which the potential would be realized
Maximum achievable potential describes the economic potential that could be achieved over a given time period under the most aggressive program scenario
Achievable potential refers to energy saved as a result of specific program funding levels and incentives These savings are above and beyond those that would occur naturally in the absence of any market intervention
Naturally occurring potential refers to energy saved as a result of normal market forces that is in the absence of any utility or governmental intervention
The output of technical and economic potential is the size of the energy efficiency resource in MW MWh MMBtu and other resources The potential is built up from savings and cost data from hundreds of measures and is typically summarized by sector using detailed demographic inforshymation about the customer base and the base of applishyances building stock and other characteristics of the relevant service area
After technical and economic potential is calculated typishycally the next phase of a well-designed potential study is to create program scenarios to estimate actual savings that could be generated by programs or other forms of intervention such as changing building codes or appliance standards
Program scenarios developed to calculate achievable potential are based on modeling example programs and using market models to estimate the penetration of the program Program scenarios require making assumptions about rebate or incentive levels program staffing and marketing efforts
Scenarios can also be developed for different price assumptions and load growth scenarios as shown below in the figure of a sample benefitcost output from a potential study conducted for the state of California
Benefits and Costs of Electric Energy Efficiency Savings 2002-2011
$0
$5
$10
$15
$20
$25
Pres
ent V
alue
in $
Bill
ions
Total Benefits Non-Incentive Participant Costs
Program Incentives
Program Admin amp Marketing
Business-as-Usual Advanced Efficiency Max Efficiency
Net Benefits $55B
Net Benefits $119B
Net Benefits $86B
Source KEMA 2002
To create a sustainable aggressive national commitment to energy efficiency 6-17
bull Ensuring that potential state and federal codes and stanshydards are modeled and included in evaluation scenarios
bull Developing scenarios for relevant time periods
In addition an emerging best practice is to conduct uncertainty analysis on savings estimates as well as other variables such as cost
With study results in hand program administrators are well positioned to develop energy efficiency goals idenshytify program measures and strategies and determine funding requirements to deliver energy efficiency proshygrams to all customers Information from a detailed potential study can also be used as the basis for calculating program cost-effectiveness and determining measures for inclusion during the program planning and design phase Detailed potential studies can provide informashytion to help determine which technologies are replaced most frequently and are therefore candidates to deliver early returns (eg an efficient light bulb) and how long the savings from various technologies persist and thereshyfore will continue to deliver energy savings For example an energy efficient light bulb might last six years whereshyas an efficient residential boiler might last 20 years (Additional information on measure savings and lifeshytimes can be found in Resources and Expertise a forthshycoming product of the Action Plan Leadership Group)
Developing an Energy Efficiency Plan
The majority of organizations reviewed for this chapter are acquiring energy efficiency resources for about $003lifetime kWh for electric programs and about $130 to $200 per lifetime MMBtu for gas program (as shown previously in Tables 6-1 and 6-2) In many cases energy efficiency is being delivered at a cost that is subshystantially less than the cost of new supplymdashon the order of half the cost of new supply In addition in all cases where information is available the costs of saved energy are less than the avoided costs of energy These organishyzations operate in diverse locations under different administrative and regulatory structures They do howshy
ever share many similar best practices when it comes to program planning including one or more of the following
bull Provide programs for all key customer classes
bull Align goals with funding
bull Use cost-effectiveness tests that are consistent with long-term planning
bull Consider building codes and appliance standards when designing programs
bull Plan for developing and incorporating new technology
bull Consider efficiency investments to alleviate transmisshysion and distribution constraints
bull Create a roadmap that documents key program comshyponents milestones and explicit energy reduction goals
Provide Programs for All Customer Classes
One concern sometimes raised when funding energy efficiency programs is that all customers are required to contribute to energy efficiency programming though not all customers will take advantage of programs once they are available raising the issue that non-participants subsidize the efficiency upgrades of participants
While it is true that program participants receive the direct benefits that accrue from energy efficiency upgrades all customer classes benefit from well-managed energy efficiency programs regardless of whether or not they participate directly For example an evaluation of the New York State Energy Research and Development Authorityrsquos (NYSERDArsquos) program portfolio concluded that ldquototal cost savings for all customers including non participating customers [in the New York Energy $mart Programs] is estimated to be $196 million for program activities through year-end 2003 increasing to $420 to $435 million at full implementationrdquo (NYSERshyDA 2004)
6-18 National Action Plan for Energy Efficiency
In addition particularly for programs that aim to accelerate market adoption of energy efficiency products or services there is often program ldquospilloverrdquo to non-program participants For example an evaluation of National Gridrsquos Energy Initiative Design 2000plus and other small commercial and industrial programs found energy efficient measures were installed by non-participants due to program influences on design professionals and vendors The analysis indicated that ldquonon-participant spillover from the programs amounted to 12323174 kWh in the 2001 program year which is approximately 92 percent of the total savings produced in 2001 by the Design 2000plus and Energy Initiative programs combinedrdquo (National Grid 2002)
Furthermore energy efficiency programming can help contribute to an overall lower cost system for all cusshytomers over the longer term by helping avoid the need to purchase energy or the need to build new infrastrucshyture such as generation transmission and distribution lines For example
bull The Northwest Power Planning and Conservation Council found in its Portfolio Analysis that strategies that included more conservation had the least cost and the least risk (measured in dollars) relative to strategies that included less conservation The most aggressive conservation case had an expected system cost of $18 billion lower and a risk factor of $25 billion less than the strategy with the least conservation (NPPC 2005)
bull In its 2005 analysis of energy efficiency and renewable energy on natural gas consumption and price ACEEE states ldquoIt is important to note that while the direct benefits of energy efficiency investment flow to particshyipating customers the benefits of falling prices accrue to all customersrdquo Based on their national scenario of cost-effective energy efficiency opportunities ACEEE found that total costs for energy efficiency would be $8 billion and would result in consumer benefits of $32 billion in 2010 (Elliot amp Shipley 2005)
bull Through cost-effective energy efficiency investments in 2004 Vermonters reduced their annual electricity use by 58 million kWh These savings which are expected to continue each year for an average of 14 years met 44 percent of the growth in the states energy needs in 2004 while costing ratepayers just 28 cents per kWh That cost is only 37 percent of the cost of generating transmitting and distributing power to Vermonts homes and businesses (Efficiency Vermont 2004)
bull The Massachusetts Division of Energy noted that cumulative impact on demand from energy efficiency measures installed from 1998 to 2002 (excluding reductions from one-time interruptible programs) was significantmdashreducing demand by 264 megawatt (MW) During the summer of 2002 a reduction of this magnitude meant avoiding the need to purchase $194 million worth of electricity from the spot market (Massachusetts 2004)
Despite evidence that both program participants and non-participants can benefit from energy efficiency proshygramming it is a best practice to provide program opportunities for all customer classes and income levels This approach is a best practice because in most cases funding for efficiency programs comes from all customer classes and as mentioned above program participants will receive both the indirect benefits of system-wide savings and reliability enhancements and the direct benefits of program participation
All program portfolios reviewed for this chapter include programs for all customer classes Program administrators usually strive to align program funding with spending based on customer class contributions to funds It is not uncommon however to have limited cross-subsidization for (1) low-income agricultural and other hard-to-reach customers (2) situations where budgets limit achievable potential and the most cost-effective energy efficiency savings are not aligned with customer class contributions to energy efficiency funding and (3) situations where energy efficiency savings are targeted geographically based on system needsmdashfor example air conditioner
To create a sustainable aggressive national commitment to energy efficiency 6-19
turn-ins or greater new construction incentives that are targeted to curtail load growth in an area with a supply or transmission and distribution need For programs tarshygeting low-income or other hard-to-reach customers it is not uncommon for them to be implemented with a lower benefit-cost threshold as long as the overall energy efficiency program portfolio for each customer class (ie residential commercial and industrial) meets cost-effectiveness criteria
NYSERDAlsquos program portfolio is a good example of proshygrams for all customer classes and segments (see Table 6-5)
Table 6-5 NYSERDA 2004 Portfolio
Sector Program of Sector Budget
Residential Small Homes 23
Keep Cool 19
ENERGY STAR Products 20
Program Marketing 16
Multifamily 10
AwarenessOther 12
Low Income Assisted Multifamily 59
Assisted Home Performance 17
Direct Install 8
All Other 16
Business Performance Contracting 36
Peak Load Reduction 12
Efficient Products 9
New Construction 23
Technical Assistance 10
All Other 10
Nevada PowerSierra Pacific Power Companyrsquos portfolio provides another example with notable expansion of program investments in efficient air conditioning ENERGY STAR appliances refrigerator collection and renewable energy investments within a one-year timeframe (see Table 6-6)
Align Goals With Funding
Regardless of program administrative structure and policy context it is a best practice for organizations to align funding to explicit goals for energy efficiency over the near-term and long-term How quickly an organization is able to ramp up programs to capture achievable potenshytial can vary based on organizational history of running DSM programs and the sophistication of the marketshyplace in which a utility operates (eg whether there is a network of home energy raters ESCOs or certified heating ventilation and air conditioning [HVAC] contractors)
Utilities or third-party administrators should set long-term goals for energy efficiency designed to capture a significant percentage of the achievable potential energy savings identified through an energy efficiency potential study Setting long-term goals is a best practice for administrators of energy efficiency program portfolios regardless of policy models and whether they are an investor-owned or a municipal or cooperative utility or a third-party program administrator Examples of how long-term goals are set are provided as follows
bull In states where the utility is responsible for integrated resource planning (the IRP Model) energy efficiency must be incorporated into the IRP This process generally requires a long-term forecast of both spending and savshyings for energy efficiency at an aggregated level that is consistent with the time horizon of the IRPmdashgenerally at least 10 years Five- and ten-year goals can then be develshyoped based on the resource need In states without an SBC the budget for energy efficiency is usually a revenue requirement expense item but can be a capital investshyment or a combination of the two (As discussed in Chapter 2 Utility Ratemaking amp Revenue Requirements capitalizing efficiency program investments rather than expensing them can reduce short-term rate impacts)
bull Municipal or cooperative utilities that own generation typically set efficiency goals as part of a resource planshyning process The budget for energy efficiency is usually a revenue requirement expense item a capital expendishyture or a combination of the two
6-20 National Action Plan for Energy Efficiency
Table 6-6 Nevada Resource Planning Programs
2005 Budget 2006 Budget
Air Conditioning Load Management $3450000 $3600000
High-Efficiency Air Conditioning 2600000 15625000
Commercial Incentives 2300000 2800000
Low-Income Support 1361000 1216000
Energy Education 1205000 1243000
ENERGY STAR Appliances 1200000 2050000
School Support 850000 850000
Refrigerator Collection 700000 1915000
Commercial New Construction 600000 600000
Other ndash Miscellaneous amp Technology 225000 725000
Total Nevada Resource Planning Programs $14491000 $30624000
SolarGenerations 1780075 7220000
Company Renewable ndash PV 1000000 1750000
California Program 370000 563000
Sierra Natural Gas Programs mdash 820000
Total All Programs $17641075 $40977000
bull A resource portfolio standard is typically set at a pershycentage of overall energy or demand with program plans and budgets developed to achieve goals at the portfolio level The original standard can be developed based on achievable potential from a potential study or as a percentage of growth from a base year
bull In most SBC models the funding is determined by a small volumetric charge on each customerrsquos utility bill This charge is then used as a basis for determining the overall budget for energy efficiency programmingmdash contributions by each customer class are used to inform the proportion of funds that should be targeted to each customer class Annual goals are then based on these budgets and a given program portfolio Over time the goal of the program should be to capture a large pershycentage of achievable potential
bull In most gas programs funding can be treated as an expense in a capital budget or a combination (as is the case in some of the electric examples shown previshyously) Goals are based on the budget developed for the time period of the plan
Once actual program implementation starts program experience is usually the best basis for developing future budgets and goals for individual program years
Use Cost-Effectiveness Tests That Are Consistent With Long-Term Planning
All of the organizations reviewed for this chapter use cost-effectiveness tests to ensure that measures and proshygrams are consistent with valuing the benefits and costs of their efficiency investments relative to long-term
To create a sustainable aggressive national commitment to energy efficiency 6-21
supply options Most of the organizations reviewed use either the total resource cost (TRC) societal or program administrator test (utility test) to screen measures None of the organizations reviewed for this chapter used the rate impact measure (RIM) test as a primary decision-making test5 The key cost-effectiveness tests are described as follows per Swisher et al (1997) with key benefits and costs further illustrated in Table 6-7
bull Total Resource Cost (TRC) Test Compares the total costs and benefits of a program including costs and benefits to the utility and the participant and the avoided costs of energy supply
bull Societal Test Similar to the TRC Test but includes the effects of other societal benefits and costs such as envishyronmental impacts water savings and national security
bull UtilityProgram Administrator Test Assesses benefits and costs from the program administratorrsquos perspective (eg benefits of avoided fuel and operating capacity costs compared to rebates and administrative costs)
bull Participant Test Assesses benefits and costs from a parshyticipantrsquos perspective (eg the reduction in customersrsquo bills incentives paid by the utility and tax credits received as compared to out-of-pocket expenses such as costs of equipment purchase operation and mainshytenance)
bull Rate Impact Measure (RIM) Assesses the effect of changes in revenues and operating costs caused by a program on customersrsquo bills and rates
Another metric used for assessing cost-effectiveness is the cost of conserved energy which is calculated in cents per kWh or dollars per thousand cubic feet (Mcf) This measure does not depend on a future projection of energy prices and is easy to calculate however it does not fully capture the future market price of energy
An overall energy efficiency portfolio should pass the cost-effectiveness test(s) of the jurisdiction In an IRP sitshyuation energy efficiency resources are compared to new supply-side optionsndashessentially the program administrashytor or utility test In cases where utilities have divested generation a calculated avoided cost or a wholesale market price projection is used to represent the generashytion benefits Cost-effectiveness tests are appropriate to screen out poor program design and to identify proshygrams in markets that have been transformed and might need to be redesigned to continue Cost-effectiveness analysis is important but must be supplemented by other aspects of the planning process
If the TRC or societal tests are used ldquoother resource beneshyfitsrdquo can include environmental benefits water savings and other fuel savings Costs include all program costs (adminshyistrative marketing incentives and evaluation) as well as customer costs Future benefits from emissions trading (or other regulatory approaches that provide payment for emisshysion credits) could be treated as additional benefits in any of these models Other benefits of programs can include job impacts sales generated gross state product added impacts from wholesale price reductions and personal income (Wisconsin 2006 Massachusetts 2004)
Example of Other Benefits
The Massachusetts Division of Energy Resources estimates that its 2002 DSM programs produced 2093 jobs increased disposable income by $79 million and provided savings to all customers of $194 million due to lower wholesale energy clearshying prices (Massachusetts 2004)
At a minimum regulators require programs to be cost-effective at the sector level (residential commercial and industrial) and typically at the program level as well Many program administrators bundle measures under a single program umbrella when in reality measures are delivered to customers through different strategies and marketing channels This process allows program adminshy
5 The RIM test is viewed as less certain than the other tests because it is sensitive to the difference between long-term projections of marginal or market costs and long-term projections of rates (CEC 2001)
6-22 National Action Plan for Energy Efficiency
Table 6-7 Overview of Cost-Effectiveness Tests
Benefits Costs
Test Externalities Energy
Benefits G TampD
Demand Benefits G TampD
Non-Energy Benefits
Other Resource Benefits
Impact On
Rates
Program Implementation
Costs
Program Evaluation
Costs
Customer Costs
Total Resource Cost Test X X X X X X
Societal Test X X X X X X X X
Utility Test Administrator Test
X X X X
Rate Impact Test X X X X X
Participant Test X X X X
G TampD = Generation Transmission and Distribution
istrators to adjust to market realities during program implementation For example within a customer class or segment if a high-performing and well-subscribed proshygram or measure is out-performing a program or measshyure that is not meeting program targets the program administrator can redirect resources without seeking additional regulatory approval
Individual programs should be screened on a regular basis consistent with the regulatory schedulemdashtypically once a year Individual programs in some customer segments such as low income are not always required to be cost-effective as they provide other benefits to society that might not all be quantified in the cost-effectiveness tests The same is true of education-only programs that have hard-to-quantify benefits in terms of energy impacts (See section on conducting impact evaluations for information related to evaluating energy education programs)
Existing measures should be screened by the program administrator at least every two years and new measshyures should be screened annually to ensure they are pershyforming as anticipated Programs should be reevaluated and updated from time to time to reflect new methods
technologies and systems For example many programs today include measures such as T-5 lighting that did not exist five to ten years ago
Consider Building Codes and Appliance Standards When Designing Programs
Enacting state and federal codes and standards for new products and buildings is often a cost-effective opportunity for energy savings Changes to building codes and applishyance standards are often considered an intervention that could be deployed in a cost-effective way to achieve results Adoption of state codes and standards in many states requires an act of legislation beyond the scope of utility programming but utilities and other third-party program administrators can and do interact with state and federal codes and standards in several ways
bull In the case of building codes code compliance and actual building performance can lag behind enactment of legislation Some energy efficiency program adminshyistrators design programs with a central goal of improving code compliance Efficiency Vermontrsquos ENERGY STAR Homes program (described in the box on page 6-24) includes increasing compliance with Vermont Building Code as a specific program objective
To create a sustainable aggressive national commitment to energy efficiency 6-23
The California investor owned utilities also are working with the national ENERGY STAR program to ensure availability of ENERGY STARTitle 24 Building Code-compliant residential lighting fixtures and to ensure overall compliance with their new residential building code through their ENERGY STAR Homes program
bull Some efficiency programs fund activities to advance codes and standards For example the California IOUs are funding a long-term initiative to contribute expertise research analysis and other kinds of support to help the California Energy Commission (CEC) develop and adopt energy efficiency standards One rationale for utility investment in advancing codes and standards is that utilshyities can lock in a baseline of energy savings and free up program funds to work on efficiency opportunities that could not otherwise be realized In Californiarsquos case the IOUs also developed a method for estimating savings associated with their codes and standards work The method was accepted by the California Public Utilities Commission and is formalized in the California Energy Efficiency Evaluation Protocols Technical Methodological and Reporting Require-ments for Evaluation Professionals (CPUC 2006)
Regardless of whether they are a component of an energy efficiency program organizations have found that it is essential to coordinate across multiple states and regions
when pursuing state codes and standards to ensure that retailers and manufacturers can respond appropriately in delivering products to market
Program administrators must be aware of codes and standards Changes in codes and standards affect the baseline against which future program impacts are measured Codes and standards should be explicitly conshysidered in planning to prevent double counting The Northwest Power and Conservation Council (NWPCC) explicitly models both state codes and federal standards in its long-term plan (NWPCC 2005)
Plan for Developing and Incorporating New Technology
Many of the organizations reviewed have a history of providing programs that change over time to accommoshydate changes in the market and the introduction of new technologies The new technologies are covered using one or more of the following approaches
bull They are included in research and development (RampD) budgets that do not need to pass cost-effectiveness tests as they are by definition addressing new or experimental technologies Sometimes RampD funding
Efficiency Vermont ENERGY STAR Homes Program
In the residential new construction segment Efficiency Vermont partners with the national ENERGY STAR proshygram to deliver whole house performance to its cusshytomers and meet both resource acquisition and market transformation goals Specific objectives of Efficiency Vermontrsquos program are to
bull Increase market recognition of superior construction
bull Increase compliance with the Vermont Building Code
bull Increase penetration of cost-effective energy efficiency measures
bull Improve occupant comfort health and safety (including improved indoor air quality)
bull Institutionalize Home Energy Rating Systems (HERS)
Participating homebuilders agree to build to the proshygrams energy efficiency standards and allow homes to be inspected by an HERS rater The home must score 86+ on the HERS inspection and include four energy efficient light fixtures power-vented or sealed combustion equipment and an efficient mechanical ventilation system with automatic controls When a home passes builders receive a rebate check proshygram certificate an ENERGY STAR Homes certificate and gifts Efficiency Vermont ENERGY STAR Homes Program saved more than 700 MWh with program spending of $14 million in 2004
Source Efficiency Vermont 2005
6-24 National Action Plan for Energy Efficiency
comes from sources other than the utility or state agency Table 6-8 summarizes RampD activities of several organizations reviewed
bull They are included in pilot programs that are funded as part of an overall program portfolio and are not indishyvidually subject to cost-effectiveness tests
bull They are tested in limited quantities under existing proshygrams (such as commercial and industrial custom rebate programs)
Technology innovation in electricity use has been the corshynerstone of global economic progress for more than 50 years In the future advanced industrial processes heating and cooling and metering systems will play very imporshytant roles in supporting customersrsquo needs for efficient use of energy Continued development of new more efficient technologies is critical for future industrial and commercial processes Furthermore technology innovation
that targets improved energy efficiency and energy manshyagement will enable society to advance and sustain enershygy efficiency in the absence of government-sponsored or regulatory-mandated programs Robust and competitive consumer-driven markets are needed for energy efficient devices and energy efficiency service
The Electric Power Research Institute (EPRI)US Department of Energy (DOE) Gridwise collaborative and the Southern California Edison (SCE) Lighting Energy Efficiency Demand Response Program are two examples of research and development activities
bull The EPRI IntelliGrid Consortium is an industry-wide inishytiative and publicprivate partnership to develop the technical foundation and implementation tools to evolve the power delivery grid into an integrated energy and communications system on a continental scale A key development by this consortium is the IntelliGrid Architecture an open-standards-based architecture
Table 6-8 Research amp Development (RampD) Activities of Select Organizations
Program Administrator RampD Funding Mechanism(s) RampD as of Energy
Efficiency Budget Examples of RampD Technologies
Initiatives Funded
PGampE
CEC Public Interest Energy Research (PIER) performs research from California SBC funding (PGampE does not have access to their bills SBC funds) other corporate funds support the California Clean Energy Fund
1ab California Clean Energy Fund - New technologies and demonstration projects
NYSERDA SBC funding 13cd Product development demonstration and evaluation university research techshynology market opportunities studies
BPA In rates 6ef PNL DOE GridWise Collaborative Northwest Energy Efficiency Alliance university research
SCE
CEC Public Interest Energy Research (PIER) performs research from California SBC funding (SCE does not have access to their bills SBC funds) Procurement proceedings and other corporate funds support Emerging Technologies and Innovative Design for Energy Efficiency programs
5ghi Introduction of emerging technologies (second D of RDampD)
a [Numerator] $4 million in 2005 for Californial Clean Energy Fund (CCEF 2005) b [Denominator] $867 million to be spent 2006-2008 on energy efficiency projects not including evaluation measurement and validation (CPUC
2005) 13 of full budget used for single year budget ($289 million) c [Numerator] $17 million for annual energy efficiency RampD budget consists of residential ($8 M) industrial ($6 M) and transportation ($3 M)
(G Walmet NYSERDA personal communication May 23 2006) d [Denominator] $134 M for New York Energy $mart from 32004-32005 (NYSERDA 2005b) e [Numerator] BPA funded the Northwest Energy Efficiency Alliance with $10 million in 2003 [Denominator] The total BPA energy efficiency allocashy
tion was $138 million (Blumstein et al 2005) f [Note] BPA overall budgetting for energy efficiency increased in subsequent years (eg $170 million in 2004 with higher commitments going to an average of $245 million from 2006-2012) (Alliance to Save Energy 2004)
g Funding for the statewide Emerging Technologies program will increase in 2006 to $10 million [Numerator] out of a total budget of $581 million [Denominator] for utility energy-efficiency programs (Mills and Livingston 2005)
h [Note] Data from Mills and Livingston (2005) differs from $675 million 3-yr figure from CPUC (2005) i Additional 3 is spent on Innovative Design for Energy Efficiency (InDEE) (D Arambula SCE personal communication June 8 2006)
To create a sustainable aggressive national commitment to energy efficiency 6-25
for integrating the data communication networks and smart equipment on the grid and on consumer premshyises Another key development is the consumer portalmdash essentially a two-way communication link between utilities and their customers to facilitate information exchange (EPRI 2006) Several efficiency program adminshyistrators are pilot testing GridWiseIntelligrid as presented in the box below
bull The Lighting Energy Efficiency Demand Response Program is a program proposed by SCE It will use Westinghousersquos twondashway wireless dimmable energy effishyciency T-5 fluorescent lighting as a retrofit for existing T-12 lamps SCE will be able to dispatch these lighting systems using wireless technology The technology will be piloted in small commercial buildings the educational sector office buildings and industrial facilities and could give SCE the ability to reduce load by 50 percent on those installations This is an excellent example of combining energy efficiency and direct load control technologies
Both EPRI and ESource (a for-profit membership-based energy information service) are exploring opportunities to expand their efforts in these areas ESource is also
Pilot Tests of GridWiseIntelligrid
GridWise Pacific Northwest Demonstration Projects These projects are designed to demonstrate how advanced information-based technologies can be used to increase power grid efficiency flexibility and reliability while reducing the need to build additional transmission and distribution infrastructure These pilots are funded by DOErsquos Office of Electricity Delivery and Energy Reliability
Olympic Peninsula Distributed ResourcesDemonstrationThis project will integrate demand response and disshytributed resources to reduce congestion on the grid including demand response with automated control technology smart appliances a virtual real-time
considering developing a database of new energy efficiency and load response technologies Leveraging RampD resources through regional and national partnering efforts has been successful in the past with energy effishyciency technologies Examples include compact fluoresshycent lighting high-efficiency ballasts and new washing machine technologies Regional and national efforts send a consistent signal to manufacturers which can be critical to increasing RampD activities
Programs must be able to incorporate new technologies over time As new technologies are considered the proshygrams must develop strategies to overcome the barriers specific to these technologies to increase their acceptance Table 6-9 provides some examples of new technologies challenges and possible strategies for overcoming these challenges A cross-cutting challenge for many of these technologies is that average rate designs do not send a price signal during periods of peak demand A strategy for overcoming this barrier would be to investigate time-sensitive rates (see Chapter 5 Rate Design for additional information)
market Internet-based communications contract options for customers and the use of distributed generation
Grid-Friendly Appliance Demonstration In this project appliance controllers will be used in both clothes dryers and water heaters to detect flucshytuations in frequency that indicate there is stress in the grid and will respond by reducing the load on that appliance
These pilots include Pacific Northwest National Laboratory Bonneville Power Administration PacificCorp Portland General Electric Mason County PUD 3 Clallam County PUD and the city of Port Angeles
6-26 National Action Plan for Energy Efficiency
Table 6-9 Emerging Technologies for Programs
Technology Program Description Availability Key
Challenges Key
Strategies Examples
Smart Grid GridWise technologies
Smart grid technologies include both customer-side and grid-side technologies that allow for more efficient operation of the grid
Available in pilot situations
Cost
Customer Acceptance
Communication Protocols
Pilot programs
RampD programs
GridWise pilot in Pacific NW
Smart appliances Smart Homes
Homes with gateways that would allow for control of appliances and other end-uses via the Internet
Available Cost
Customer Acceptance
Communication Protocols
Pilot programs
Customer education
GridWise pilot in Pacific NW
Load control of AC via smart thermostat
AC controlled via smart thermostat
Communication can be via wireless power line carrier (PLC) or Internet
Widely available Cost
Customer acceptance
Used to control loads in congested situation
Pilot and full-scale programs
Customer education
Long Island Power Authority (LIPA) Austin Energy Utah Power and Light ISO New England
Dynamic pricingcritical peak pricing thermostat control with enhanced metering
Providing customers with either real time or critical peak pricing via a communication technology Communication can be via wireless PLC or Internet Customers can also be provided with educational materials
Available Cost
Customer acceptance
Split incentives in deregulated markets
Regulatory barriers
Pilot and full-scale Programs
Used in congested areas
Customer education
Georgia (large users) Niagara Mohawk California Peak Pricing Experiment Gulf Power
Control of lighting via wireless power line carrier or other communication technologies
Using direct control to control commercial lighting during high price periods
Recently available Cost
Customer acceptance
Contractor acceptance
RampD programs
Pilot programs
SCE pilot using wireless
NYSERDA pilot with power line carrier control
T-5s Relatively new lighting technology for certain applications
Widely available Cost
Customer acceptance
Contractor acceptance
Add to existing programs as a new measure
Included in most large-scale programs
New generation tankless water heaters
Tankless water heaters do not have storage tanks and do not have standby losses They can save energy relative to conventional water heaters in some applications Peak demand implications are not yet known
Widely available Cost
Customer acceptance
Contractor acceptance
Add to existing programs as a new measure
More common in the EU
Some load control technologies will require more than bull Interactive communications Interactive communica-RampD activities to become widespread To fully capture tions that allow for two-way flow of price information
and utilize some of these technologies the following and decisions would add new functionality to the
four building blocks are needed electricity system
To create a sustainable aggressive national commitment to energy efficiency 6-27
bull Innovative rates and regulation Regulations are needed to provide adequate incentives for energy efficiency investments to both suppliers and customers
bull Innovative markets Market design must ensure that energy efficiency and load response measures that are advanced by regulation become self-sustaining in the marketplace
bull Smart end-use devices Smart devices are needed to respond to price signals and facilitate the management of the energy use of individual and networked appliances
In addition the use of open architecture systems is the only long-term way to take existing non-communicating equipment into an energy-efficient future that can use two-way communications to monitor and diagnose appliances and equipment
Consider Efficiency Investments to Alleviate Transmission and Distribution Constraints
Energy efficiency has a history of providing value by reducshying generation investments It should also be considered with other demand-side resources such as demand response as a potential resource to defer or avoid investshyments in transmission and distribution systems Pacific Gas and Electricrsquos (PGampE) Model Energy Communities Project (the Delta Project) provides one of the first examples of this approach This project was conceived to test whether demand resources could be used as a least cost resource to defer the capital expansion of the transmission and distribushytion system in a constrained area In this case efforts were focused on the constrained area and customers were offered versions of existing programs and additional measshyures to achieve a significant reduction in the constrained area (PGampE 1993) A recently approved settlement at the Federal Energy Regulatory Commission (FERC) allows energy efficiency along with load response and distributed generashytion to participate in the Independent System Operator New England (ISO-NE) Forward Capacity Market (FERC 2006 FERC 2005) In addition Consolidated Edison has successshyfully used a Request For Proposals (RFP) approach to defer distribution upgrades in four substation areas with contracts
totaling 45 MW Con Ed is currently in a second round of solicitations for 150 MW (NAESCO 2005) Recent pilots using demand response energy efficiency and intelligent grid are proving promising as shown in the BPA example in the box on page 6-29
To evaluate strategies for deferring transmission and distribushytion investments the benefits and costs of energy efficiency and other demand resources are compared to the cost of deferring or avoiding a distribution or transmission upgrade (such as a substation upgrade) in a constrained area This cost balance is influenced by location-specific transmission and distribution costs which can vary greatly
Create a Roadmap of Key Program Components Milestones and Explicit Energy Use Reduction Goals
Decisions regarding the key considerations discussed throughout this section are used to inform the developshyment of an energy efficiency plan which serves as a roadmap with key program components milestones and explicit energy reduction goals
A well-designed plan includes many of the elements disshycussed in this section including
bull Budgets (see section titled ldquoLeverage Private-Sector Expertise External Funding and Financingrdquo for informashytion on the budgeting processes for the most common policy models)
mdash Overall
mdash By program
bull Kilowatt kWh and Mcf savings goals overall and by program
mdash Annual savings
mdash Lifetime savings
bull Benefits and costs overall and by program
bull Description of any shareholder incentive mechanisms
6-28 National Action Plan for Energy Efficiency
Bonneville Power Administration (BPA) Transmission Planning
BPA has embarked on a new era in transmission planning As plans take shape to address load growth constraints and congestion on the transmisshysion system BPA is considering measures other than building new lines while maintaining its commitshyment to provide reliable transmission service The agency along with others in the region is exploring ldquonon-wires solutionsrdquo as a way to defer large construction projects
BPA defines non-wires solutions as the broad array of alternatives including but not limited to demand response distributed generation conservation measshyures generation siting and pricing strategies that individually or in combination delay or eliminate the
For each program the plan should include the following
bull Program design description
bull Objectives
bull Target market
bull Eligible measures
bull Marketing plan
bull Implementation strategy
bull Incentive strategy
bull Evaluation plan
bull Benefitcost outputs
bull Metrics for program success
bull Milestones
The plan serves as a road-map for programs Most proshygram plans however are modified over time based on
need for upgrades to the transmission system The industry also refers to non-wires solutions as non-construction alternatives or options
BPA has reconfigured its transmission planning process to include an initial screening of projects to assess their potential for a non-wires solution BPA is now committed to using non-wires solutions screening criteria for all capital transmission projects greater than $2 million so that it becomes an institutionalshyized part of planning BPA is currently sponsoring a number of pilot projects to test technologies resolve institutional barriers and build confidence in using non-wires solution
changing conditions (eg utility supply or market changes) and program experience Changes from the original roadmap should be both documented and justified A plan that includes all of these elements is an appropriate startshying point for a regulatory filing A well-documented plan is also a good communications vehicle for informing and educating stakeholders The plan should also include a description of any pilot programs and RampD activities
Energy Efficiency Program Design
and Delivery
The organizations reviewed for this chapter have learned that program success is built over time by understanding the markets in which efficient products and services are delivered by addressing the wants and needs of their customers by establishing relationships with customers and suppliers and by designing and delivering programs accordingly
bull They have learned that it is essential to program sucshycess to coordinate with private market actors and other influential stakeholders to ensure that they are well informed about program offerings and share this information with their customersconstituents
To create a sustainable aggressive national commitment to energy efficiency 6-29
bull Many of the organizations reviewed go well beyond merely informing businesses and organizations by actually partnering with them in the design and delivery of one or more of their efficiency programs
bull Recognizing that markets are not defined by utility service territory many utilities and other third-party program administrators actively cooperate with one another and with national programs such as ENERGY STAR in the design and delivery of their programs
This section discusses key best practices that emerge from a decade or more of experience designing and implementing energy efficiency programs
Begin With the Market in Mind
Energy efficiency programs should complement rather than compete with private and other existing markets for energy efficient products and services The rationale for utility or third-party investment in efficiency programshyming is usually based on the concept that within these markets there are barriers that need to be overcome to ensure that an efficient product or service is chosen over a less efficient product or standard practice Barriers might include higher initial cost to the consumer lack of knowledge on the part of the supplier or the customer split incentives between the tenant who pays the utility bills and the landlord who owns the building lack of supply for a product or service or lack of time (eg to research efficient options seek multiple bidsmdashparticularly during emergency replacements)
Conduct a Market Assessment
Understanding how markets function is a key to successful program implementation regardless of whether a program is designed for resource acquisition market transformashytion or a hybrid approach A market assessment can be a valuable investment to inform program design and impleshymentation It helps establish who is part of the market (eg manufacturers distributors retailers consumers) what the key barriers are to greater energy efficiency from the producer or consumer perspectives who are the key trend-setters in the business and the key influencers in
consumer decision-making and what approaches might work best to overcome barriers to greater supply and investment in energy efficient options andor uptake of a program A critical part of completing a market assessment is a baseline measurement of the goods and services involved and the practices attitudes behaviors factors and conditions of the marketplace (Feldman 1994) In addition to informing program design and implementashytion the baseline assessment also helps inform program evaluation metrics and serves as a basis for which future program impacts are measured As such market assessshyments are usually conducted by independent third-party evaluation professionals The extent and needs of a market assessment can vary greatly For well-established program models market assessments are somewhat less involved and can rely on existing program experience and literature with the goal of understanding local differences and estabshylishing the local or regional baseline for the targeted energy efficiency product or service
Table 6-10 illustrates some of the key stakeholders barshyriers to energy efficiency and program strategies that are explored in a market assessment and are useful for considering when designing programs
Solicit Stakeholder Input
Convening stakeholder advisory groups from the onset as part of the design process is valuable for obtaining multiple perspectives on the need and nature of planned programs This process also serves to improve the proshygram design and provides a base of program support within the community
Once programs have been operational for a while stakeshyholder groups should be reconvened to provide program feedback Stakeholders that have had an ongoing relationshyship with one or more of the programs can provide insight on how the programs are operating and perceived in the community and can recommend program modifications They are also useful resources for tapping into extended networks beyond those easily accessible to the program providers For example contractors building owners and building operators can be helpful in providing access to their specific trade or business organizations
6-30 National Action Plan for Energy Efficiency
Table 6-10 Key Stakeholders Barriers and Program Strategies
by Customer Segment
Customer Segment Key Stakeholders Key Program Barriers Key Program Strategies
Large Commercial amp Industrial Retrofit
Contractors Building owners and operators Distributors lighting HVAC motors other Product manufacturers Engineers Energy services companies
Access to capital Competing priorities Lack of information Short-term payback (lt2 yr) mentality
Financial incentives (rebates) Performance contracting Performance benchmarking Partnership with ENERGY STAR Low interest financing Information from unbiased sources Technical assistance Operations and maintenance training
Small Commercial
Distributors lighting HVAC other Building owners Business owners Local independent trades
Access to capital Competing priorities Lack of information
Financial incentives (rebates) Information from unbiased sources Direct installation Partnership with ENERGY STAR
Commercial amp Industrial New Construction
Architects Engineers Building and energy code officials Building owners Potential occupants
Projectprogram timing Competing priorities Split incentives (for rental property) Lack of information Higher initial cost
Early intervention (ID requests for hook-up) Design assistance Performance targetingbenchmarking Partnership with ENERGY STAR Training of architects and engineers Visible and ongoing presence in design
community Education on life cycle costs
Residential Existing Homes
Distributors appliances HVAC lighting Retailers appliance lighting windows Contractors HVAC insulation remodeling Homeowners
Higher initial cost Lack of information Competing priorities Inexperience or prior negative experience
wtechnology (eg early compact florescent lighting)
Emergency replacements
Financial incentives Partnership with ENERGY STAR Information on utility Web sites bill inserts
and at retailers Coordination with retailers and contractors
Residential New Homes
Contractors general and HVAC Architects Code officials Builders Home buyers Real estate agents Financial institutions
Higher initial cost Split incentives builder is not the
occupant
Partnership with ENERGY STAR Linking efficiency to quality Working with builders Building code education amp compliance Energy efficient mortgages
Multifamily Owners and operators Contractors Code officials Tenants
Split incentives Lack of awareness
Financial incentives Marketing through owner and operator
associations
Low Income Service providers Weatherization Assistance Program (WAP) Low-Income Home Energy Assistance Program (LIHEAP)
Social service providers state and local agencies
NGOs and advocacy groups Credit counseling organizations Tenants
Program funding Program awareness Bureaucratic challenges
Consistent eligibility requirements with existing programs
Direct installation Leveraging existing customer channels for
promotion and delivery Fuel blind approach
To be successful stakeholder groups should focus on the big picture be well organized and be representative Stakeholder groups usually provide input on budgets allocation of budgets sectors to address program design evaluation and incentives
Listen to Customer and Trade Ally Needs
Successful energy efficiency programs do not exist without customer and trade ally participation and acceptance of these technologies Program designs should be tested with customer market research before finalizing offerings Customer research could include surveys focus groups
To create a sustainable aggressive national commitment to energy efficiency 6-31
Best Practice Solicit Stakeholder Input
Minnesotas Energy Efficiency Stakeholder Process exemplifies the best practice of engaging stakeshyholders in program design The Minnesota Public Utility Commission hosted a roundtable with the commission utilities and other stakeholders to review programs Rate implications and changes to the programs are worked out through this collaboshyrative and drive program design (MPUC 2005)
Successful stakeholder processes generally have the following attributes
bull Neutral facilitation of meetings
bull Clear objectives for the group overall and for each meeting
bull Explicit definition of stakeholder groups role in program planning (usually advisory only)
bull Explicit and fair processes for providing input
bull A timeline for the stakeholder process
forums and in-depth interviews Testing of incentive levels and existing market conditions by surveying trade allies is critical for good program design
Use Utility Channels and Brand
Utilities have existing channels for providing information and service offerings to their customers These include Web sites call centers bill stuffers targeted newsletters as well as public media Using these channels takes advantage of existing infrastructure and expertise and provides customers with energy information in the way that they are accustomed to obtaining it These methods reduce the time and expense of bringing information to customers In cases where efficiency programming is delivered by a third party gaining access to customer data and leveraging existing utility channels has been highly valuable for program design and implementation In cases such as Vermont (where the utilities are not responsible for running programs) it has been helpful to have linkages from the utility Web sites to Efficiency Vermontrsquos programs and to establish Efficiency Vermont
as a brand that the utilities leverage to deliver information about efficiency to their customers
Promote the Other Benefits of Energy Efficiency
and Energy Efficient Equipment
Most customers are interested in reducing energy conshysumption to save money Many however have other motivations for replacing equipment or renovating space that are consistent with energy efficiency improvements For example homeowners might replace their heating system to improve the comfort of their home A furnace with a variable speed drive fan will further increase comshyfort (while saving energy) by providing better distribution of both heating and cooling throughout the home and reducing fan motor noise It is a best practice for proshygram administrators to highlight these features where non-energy claims can be substantiated
Coordinate With Other Utilities and Third-Party
Program Administrators
Coordination with other utilities and third-party program administrators is also important Both program allies and customers prefer programs that are consistent across states and regions This approach reduces transaction costs for customers and trade allies and provides consisshytent messages that avoid confusing the market Some programs can be coordinated at the regional level by entities such as Northeast Energy Efficiency Partnership (NEEP) the Northwest Energy Efficiency Alliance and the Midwest Energy Efficiency Alliance Figure 6-1 illustrates the significant impact that initiative sponsors of the Northeast Lighting and Appliance Initiative (coordinated regionally by NEEP) have been able to have on the marshyket for energy-efficient clothes washers by working in coordination over a long time period NEEP estimates the program is saving an estimated 36 million kWh per year equivalent to the annual electricity needs of 5000 homes (NEEP undated)
Similarly low-income programs benefit from coordinashytion with and use of the same eligibility criteria as the federal Low-Income Home Energy Assistance Program (LIHEAP) or Weatherization Assistance Program (WAP) These programs have existing delivery channels that can
6-32 National Action Plan for Energy Efficiency
Figure 6-1 Impacts of the Northeast Lighting and Appliance Initiative
Perc
ent
of
ENER
GY
STA
R C
loth
es W
ash
er S
ales 1
09
08
07
06
05
04
03
02
01
0 1998 1999 2000 2001 2002 2003 2004 2005 2006 2007
Sponsor states with initiative Standard takes effect 2007 Federal Minimum Efficiency
National average
Sponsor states absent initiative Sponsor states (with initiative)
2003 National clothes washers campaign kicks off
2004 More stringent ENERGY STAR spec takes effect
1998 6 manufacturers 2002 18 manufacturers 15 qualified products 99 qualified products
National Average
2001 Whirlpool enters market
1998 Regional initiative begins
Sponsor states (absent initiative)
be used to keep program costs down while providing substantial benefit to customers On average weathershyization reduces heating bills by 31 percent and overall energy bills by $274 per year for an average cost per home of $2672 per year Since 1999 DOE has been encouraging the network of weatherization providers to adopt a whole-house approach whereby they approach residential energy efficiency as a system rather than as a collection of unrelated pieces of equipment (DOE 2006) The Long Island Power Authorityrsquos (LIPA) program shown at right provides an example
Leverage the National ENERGY STAR Program
Nationally ENERGY STAR provides a platform for proshygram implementation across customer classes and defines voluntary efficiency levels for homes buildings and products ENERGY STAR is a voluntary public-private partnership designed to reduce energy use and related greenhouse gas emissions The program administered by the US Environmental Protection Agency (EPA) and the DOE has an extensive network of partners including equipment manufacturers retailers builders ESCOs prishyvate businesses and public sector organizations
Since the late 1990s EPA and DOE have worked with utilities state energy offices and regional nonprofit organizations to help leverage ENERGY STAR messaging
tools and strategies to enhance local energy efficiency programs Today more than 450 utilities (and other effishyciency program administrators) servicing 65 percent of US households participate in the ENERGY STAR program (See box on page 6-34 for additional information) New Jersey and Minnesota provide examples of states that have leveraged ENERGY STAR
Long Island Power Authority (LIPA)Residential Energy AffordabilityPartnership Program (REAP)
This program provides installation of comprehenshysive electric energy efficiency measures and energy education and counseling The program targets customers who qualify for DOErsquos Low-Income Weatherization Assistance Program (WAP) as well as electric space heating and cooling customers who do not qualify for WAP and have an income of no more than 60 percent of the median houseshyhold income level LIPArsquos REAP program has saved 25 MW and 21520 MWh 1999 to 2004 with spending of $124 million
Source LIPA 2004
To create a sustainable aggressive national commitment to energy efficiency 6-33
bull New Jerseys Clean Energy Program The New Jersey Board of Public Utilities Office of Clean Energy has incorshyporated ENERGY STAR tools and strategies since the inception of its residential products and Warm Advantage (gas) programs Both programs encourage customers to purchase qualified lighting appliances windows proshygrammable thermostats furnaces and boilers The New
ENERGY STAR Program Investments
In support of the ENERGY STAR program EPA and DOE invest in a portfolio of energy efficiency efforts that utilities and third-party program administrators can leverage to further their local programs including
bull Education and Awareness Building ENERGY STAR sponsors broad-based public campaigns to educate consumers on the link between energy use and air emissions and to raise awareness about how products and services carrying the ENERGY STAR label can protect the environment while saving money
bull Establishing Performance Specifications and Performing Outreach on Efficient Products More than 40 product categories include ENERGY STAR-qualifying models which ENERGY STAR promotes through education campaigns information exchanges on utility-retailer program models and extensive online resources Online resources include qualifying product lists a store locator and information on product features
bull Establishing Energy Efficiency Delivery Models to Existing Homes ENERGY STAR assistance includes an emphasis on home diagnostics and evaluation improvements by trained techniciansbuilding proshyfessionals and sales training It features online consumer tools including the Home Energy Yardstick and Home Energy Advisor
Jersey Clean Energy Program also educates consumers retailers builders contractors and manufacturers about ENERGY STAR In 2005 New Jerseys Clean Energy Program saved an estimated 60 million kWh of elecshytricity 16 million therms of gas and 45000 tons of carbon dioxide (CO2)
bull Establishing Performance Specifications and Performing Outreach for New Homes ENERGY STAR offers builder recruitment materials sales toolkits consumer messaging and outreach that help support builder training consumer education and verification of home performance
bull Improving the Performance of New and Existing Commercial Buildings EPA has designed an Energy Performance Rating System to measure the energy performance at the whole-building level to help go beyond a component-by-component approach that misses impacts of design sizing installation controls operation and maintenance EPA uses this tool and other guidance to help building owners and utility programs maximize energy savings
Additional information on strategies tools and resources by customer segment is provided in the fact sheet ldquoENERGY STARmdashA Powerful Resource for Saving Energyrdquo which can be downloaded from wwwepagovcleanenergypdfnapee_energystarshyfactsheetpdf
6-34 National Action Plan for Energy Efficiency
bull Great River Energy Minnesota In 2005 Great River Energy emphasized cost-effective energy conservation by offering appliance rebates to cooperative members who purchase ENERGY STAR qualifying refrigerators clothes washers and dishwashers Great River provided its memshyber cooperatives with nearly $2 million for energy consershyvation rebates and grants including the ENERGY STAR rebates as a low-cost resource alternative to building new peaking generation In addition to several off-peak proshygrams Great River Energys residential DSMconservashytion program consists of
mdash Cycled air conditioning
mdash Interruptible commercial load responsemanagement
mdash Interruptible irrigation
mdash Air and ground source heat pumps
mdash ENERGY STAR high-efficiency air conditioning rebate
mdash ENERGY STAR appliance rebates
mdash ENERGY STAR compact fluorescent lamp rebate
mdash Low-income air conditioning tune-ups
mdash Residential and commercial energy audits
Keep Participation Simple
Successful programs keep participation simple for both customers and trade allies Onerous or confusing particshyipation rules procedures and paperwork can be a major deterrent to participation from trade allies and cusshytomers Applications and other forms should be clear and require the minimum information (equipment and customer) to confirm eligibility and track participation by customer for measurement and verification (MampV) purshyposes Given that most energy efficiency improvements are made at the time of either equipment failure or retrofit timing can be critical A program that potentialshyly delays equipment installation or requires customer or contractor time for participation will have fewer
A Seattle City Light Example of aSimple Program
Seattle City Lightrsquos $mart Business program offers a ldquoper-fixturerdquo rebate for specific fixtures in existing small businesses Customers can use their own licensed electrical contractor or select from a pre-approved contractor list Seattle City Light provides the rebate to either the installer or participating customer upon completion of the work Completed work is subject to onsite verification
Since 1986 Seattle City Lightrsquos $mart Business program has cumulative savings (for all measshyures) of 70382 MWh and 2124 MW
Source Seattle City Light 2005
participants (and less support from trade allies) Seattle City Lightrsquos program shown above has two paths for easy participation
Keep Funding (and Other Program Characteristics)
as Consistent as Possible
Over time both customers and trade allies become increasingly aware and comfortable with programs Disruptions to program funding frustrate trade allies who cannot stock appropriately or are uncomfortable making promises to customers regarding program offershyings for fear that efficiency program administrators will be unable to deliver on services or financial incentives
Invest in Education Training and Outreach
Some of the key barriers to investment in energy efficiency are informational Education outreach and training should be provided to trade allies as well as customers Some programs are information-only programs some programs have educational components integrated into the program design and budget and in some cases education is budgeted and delivered somewhat independently of specific programs In general standshyalone education programs do not comprise more than
To create a sustainable aggressive national commitment to energy efficiency 6-35
10 percent of the overall energy efficiency budget but information training and outreach might comprise a larger portion of some programs that are designed to affect long-term markets when such activities are tied to explicit uptake of efficiency measures and practices This approach might be particularly applicable in the early years of implementation when information and training are most critical for building supply and demand for products and services over the longer term KeySpan and Flex Your Power are examples of coordinating education training and outreach activities with programs
Leverage Customer Contact to Sell Additional Efficiency
and Conservation Measures
Program providers can take advantage of program contact with customers to provide information on other program
KeySpan Example
KeySpan uses training and certification as critical parts of its energy efficiency programs KeySpan provides building operator certification training provides training on the Massachusetts state building code and trains more than 1000 trade allies per year
Source Johnson 2006
California Flex Your Power Campaign
The California Flex Your Power Campaign was inishytiated in 2001 in the wake of Californiarsquos rolling black-outs While initially focused on immediate conservation measures the campaign has transishytioned to promoting energy efficiency and long-term behavior change The program coordinates with the national ENERGY STAR program as well as the California investor-owned utilities to ensure that consumers are aware of energy efficiency options and the incentives available to them through their utilities
offerings as well as on no or low-cost opportunities to reduce energy costs Information might include proper use or maintenance of newly purchased or installed equipment or general practices around the home or workplace for efficiency improvements Education is often included in low-income programs which generally include direct installation of equipment and thus already include in-home interaction between the program provider and customer The box below provides some additional considerations for low-income programs
Leverage Private-Sector Expertise External Funding
and Financing
Well-designed energy efficiency programs leverage external funding and financing to stretch available dollars and to take advantage of transactions as they occur in
Low-Income Programs
Most utilities offer energy efficiency programs targeted to low-income customers for multiple reasons
bull Low-income customers are less likely to take advantage of rebate and other programs because they are less likely to be purchasing appliances or making home improvements
bull The ldquoenergy burdenrdquo (percent of income spent on energy) is substantially higher for low-income customers making it more difficult to pay bills Programs that help reduce energy costs reduce the burden making it easier to maintain regular payments
bull Energy efficiency improvements often increase the comfort and safety of these homes
bull Utilities have the opportunity to leverage federal programs such as LIHEAP and WAP to provide comprehensive services to customers
bull Low-income customers often live in less efficient housing and have older less efficient appliances
bull Low-income customers often comprise a subshystantial percentage (up to one-third) of utility residential customers and represent a large potential for efficiency and demand reduction
bull Using efficiency education and incentives in conjunction with credit counseling can be very effective in this sector
6-36 National Action Plan for Energy Efficiency
the marketplace This approach offers greater financial incentives to the consumer without substantially increasshying program costs It also has some of the best practice attributes discussed previously including use of existing channels and infrastructure to reach customers The folshylowing are a few opportunities for leveraging external funding and financing
bull Leverage Manufacturer and Retailer Resources Through Cooperative Promotions For example for mass market lighting and appliance promotions many program administrators issue RFPs to retailers and manufacturers asking them to submit promotional ideas These RFPs usually require cost sharing or in-kind advertising and promotion as well as requirements that sales data be provided as a condition of the contract This approach allows competitors to differentiate themselves and market energy efficiency in a way that is compatible with their business model
bull Leverage State and Federal Tax Credits Where Available Many energy efficiency program administrators are now pointing consumers and businesses to the new federal tax credits and incorporating them in their proshygrams In addition program administrators can edushycate their customers on existing tax strategies such as accelerated depreciation and investment tax strategies to help them recoup the costs of their investments faster Some states offer additional tax credits andor offer sales tax ldquoholidaysrdquo where sales tax is waived at point of sale for a specified period of time ranging from one day to a year The North Carolina Solar Center maintains a database of efficiency incentives including state and local tax incentives at wwwdsireusaorg
bull Build on ESCO and Other Financing Program Options This is especially useful for large commercial and industrial projects
The NYSERDA and California programs presented at right and on the following page are both good examples of leveraging the energy services market and increasing ESCO presence in the state
New York Energy $mart Commercial Industrial Performance Program
The New York Energy $mart CommercialIndustrial Performance Program which is administered by NYSERDA is designed to promote energy savings and demand reduction through capital improveshyment projects and to support growth of the energy service industry in New York state Through the program ESCOs and other energy service providers receive cash incentives for completion of capital projects yielding verifiable energy and demand savings By providing $111 million in pershyformance-based financial incentives this nationally recognized program has leveraged more than $550 million in private capital investments MampV ensures that electrical energy savings are achieved Since January 1999 more than 860 projects were completed in New York with an estimatshyed savings of 790 million kWhyr
Sources Thorne-Amann and Mendelsohn 2005 AESP 2006
bull Leverage Organizations and Outside Education and Training Opportunities Many organizations provide education and training to their members sometimes on energy efficiency Working with these organizations provides access to their members and the opportunity to leverage funding or marketing opportunities provided by these organizations
In addition the energy efficiency contracting industry has matured to the level that many proven programs have been ldquocommoditizedrdquo A number of private firms and not-for-profit entities deliver energy efficiency proshygrams throughout the United States or in specific regions of the country ldquoThe energy efficiency industry is now a $5 billion to $25 billion industry (depending on how expansive onersquos definition) with a 30-year history of developing and implementing all types of programs for
To create a sustainable aggressive national commitment to energy efficiency 6-37
California Non-Residential Standard Performance Contract (NSPC) Program
The California NSPC program is targeted at cusshytomer efficiency projects and is managed on a statewide basis by PGampE SCE and San Diego Gas amp Electric Program administrators offer fixed-price incentives (by end use) to project sponsors for measured kilowatt-hour energy savings achieved by the installation of energy efficiency measures The fixed price per kWh performance measurement protocols payment terms and other operating rules of the program are specified in a standard contract This program has helped to stimulate the energy services market in the state In program year 2003 the California NSPC served 540 cusshytomers and saved 336 gigawatt-hours and 654 million therms
Source Quantum Consulting Inc 2004
utilities and projects for all types of customers across the countryrdquo (NAESCO 2005) These firms can quickly get a program up and running as they have the expertise processes and infrastructure to handle program activishyties New program administrators can contract with these organizations to deliver energy efficiency program design delivery andor implementation support in their service territory
Fort Collins Utilities was able to achieve early returns for its Lighting with a Twist program (discussed on page 6shy39) by hiring an experienced implementation contractor through a competitive solicitation process and negotiating cooperative marketing agreements with national retail chains and manufacturers as well as local hardware stores
The Building Owners amp Managers Association (BOMA) Energy Efficiency Program
The BOMA Foundation in partnership with the ENERGY STAR program has created an innovative operational excellence program to teach property owners and managers how to reduce energy conshysumption and costs with proven no- and low-cost strategies for optimizing equipment people and practices The BOMA Energy Efficiency Program consists of six Web-assisted audio seminars (as well as live offerings at the BOMA International Convention) The courses are taught primarily by real estate professionals who speak in business vernacular about the process of improving performance The courses are as follows
bull Introduction to Energy Performance
bull How to Benchmark Energy Performance
bull Energy-Efficient Audit Concepts amp Economic Benefits
bull No- and Low-Cost Operational Adjustments to Improve Energy Performance
bull Valuing Energy Enhancement Projects amp Financial Returns
bull Building an Energy Awareness Program
The commercial real estate industry spends approximately $24 billion annually on energy and contributes 18 percent of the US CO2 emissions According to EPA and ENERGY STAR Partner observations a 30 percent reduction is readily achievable simply by improving operating standards
6-38 National Action Plan for Energy Efficiency
Fort Collins Utilities Lighting With a Twist
Fort Collins Utilities estimates annual savings of 2023 MWh of electricity with significant winter peak demand savings of 1850 kW at a total resource cost of $0018kWh from its Lighting with a Twist program which uses ENERGY STAR as a platform The program was able to get off to quick and successful start by hiring an experienced implementation contractor and negotiating cooperative marketing agreements with retailers and manufacturersmdashfacilitating the sale of 78000 compact fluorescent light bulbs through six retail outlets from October to December 2005 (Fort Collins Utilities et al 2005)
Start Simply With Demonstrated Program Models Build Infrastructure for the Future
Utilities starting out or expanding programs should look to other programs in their region and throughout the country to leverage existing and emerging best programs After more than a decade of experience running energy efficiency programs many successful program models have emerged and are constantly being refined to achieve even more cost-effective results
While programs must be adapted to local realities utilities and state utility commissions can dramatically reduce their learning curve by taking advantage of the wealth of data and experience from other organizations around the country The energy efficiency and services community has numerous resources and venues for sharing information and formally recognizing best practice programs The Association of Energy Service Professionals (wwwaesporg) the Association of Energy Engineers (wwwaeecenterorg) and the American Council for an Energy Efficient Economy (wwwaceeeorg) are a few of these resources Opportunities for education and information sharing are also provided via national federal programs such as ENERGY STAR (wwwenergystargov) and the Federal Energy
Management Program (wwweereenergygovfemp) Additional resources will be provided in Energy Efficiency Best Practices Resources and Expertise (a forthcoming product of the Leadership Group) Leveraging these resources will reduce the time and expense of going to market with new efficiency programs This will also increase the quality and value of the programs implemented
Start With Demonstrated Program Approaches That Can
Easily Be Adapted to New Localities
Particularly for organizations that are new to energy effishyciency programming or have not had substantial energy efficiency programming for many years it is best to start with tried and true programs that can easily be transferred to new localities and be up and running quickly to achieve near term results ENERGY STAR lighting and appliance proshygrams that are coordinated and delivered through retail sales channels are a good example of this approach on the residential side On the commercial side prescriptive incenshytives for technologies such as lighting packaged unitary heating and cooling equipment commercial food service equipment and motors are good early targets While issues related to installation can emerge such as design issues for lighting and proper sizing issues for packaged unitary heatshying and cooling equipment these technologies can deliver savings independent from how well the buildingrsquos overall energy system is managed and controlled In the early phase of a program offering prescriptive rebates is simple and can garner supplier interest in programs but as programs progress rebates might need to be reduced or transitioned to other types of incentives (eg cooperative marketing approaches customer referrals) or to more comprehensive approaches to achieving energy savings If the utility or state is in a tight supply situation it might make sense to start with proven larger scale programs that address critical load growth drivers such as increased air conditioning load from both increased central air conditioning in new construction and increased use of room air conditioners
Determine the Right Incentives and Levels
There are many types of incentives that can be used to spur increased investment in energy-efficient products and services With the exception of education and
To create a sustainable aggressive national commitment to energy efficiency 6-39
Table 6-11 Types of Financial Incentives
Financial Incentives Description
Prescriptive Rebate Usually a predetermined incentive payment per item or per kW or kWh saved Can be provided to the customer or a trade ally
Custom Rebate A rebate that is customized by the type of measures installed Can be tied to a specific payback criteria or energy savings Typically given to the customer
Performance Contracting Incentive A program administrator provides an incentive to reduce the risk premium to the ESCO installing the measures
Low Interest Financing A reduced interest rate loan for efficiency projects Typically provided to the customer
Cooperative Advertising Involves providing co-funding for advertising or promoting a program or product Often involves a written agreement
Retailer Buy Down A payment to the retailer per item that reduces the price of the product
MW Auction A program administrator pays a third party per MW andor per MWh for savings
training programs most programs offer some type of financial incentive Table 6-11 shows some of the most commonly used financial incentives Getting incentives right and at the right levels ensures program success and efficient use of resources by ensuring that programs do not ldquooverpayrdquo to achieve results The market assessment and stakeholder input process can help inform initial incentives and levels Ongoing process and impact evaluation (discussed below) and reassessment of cost-effectiveness can help inform when incentives need to be changed reduced or eliminated
Invest in the Service Industry Infrastructure
Ultimately energy efficiency is implemented by peoplemdash home performance contractors plumbers electricians architects ESCOs product manufacturers and othersmdash who know how to plan for and deliver energy efficiency to market
While it is a best practice to incorporate whole house and building performance into programs these proshygrams cannot occur unless the program administrator has a skilled supportive community of energy service professionals to call upon to deliver these services to market In areas of the country lacking these talents development of these markets is a key goal and critical part of the program design
In many marketsmdasheven those with well established effishyciency programsmdashit is often this lack of infrastructure or supply of qualified workers that prevents wider deployshyment of otherwise cost-effective energy efficiency programs Energy efficiency program administrators often try to address this lack of infrastructure through various program strategies including pilot testing programs that foster demand for these services and help create the business case for private sector infrastructure development and vocational training and outreach to universities with incentives or business referrals to spur technician training and certification
Examples of programs that have leveraged the ESCO industry were provided previously One program with an explicit goal of encouraging technical training for the residential marketplace is Home Performance with ENERGY STAR which is an emerging program model being implemented in a number of states including Wisconsin New York and Texas (see box on page 6-41 for an example) The program can be applied in the gas or electric context and is effective at reducing peak load because the program captures improvements in heating and cooling performance
6-40 National Action Plan for Energy Efficiency
Austin Energy Home Performance with ENERGY STAR
In Texas Austin Energyrsquos Home Performance with ENERGY STAR program focuses on educating cusshytomers and providing advanced technical training for professional home performance contractors to identify energy efficiency opportunities with an emphasis on safety customer comfort and energy savings Participating Home Performance contracshytors are given the opportunity to receive technical accreditation through the Building Performance Institute
Qualified contractors perform a top-to-bottom energy inspection of the home and make cusshytomized recommendations for improvements These improvements might include measures such as air-sealing duct sealing adding insulation installing energy efficient lighting and installing new HVAC equipment or windows if needed In 2005 Austin Energy served more than 1400 homeowners with an average savings per cusshytomer of $290 per year Collectively Austin Energy customers saved an estimated $410000 and more than 3 MW through the Home Performance with ENERGY STAR program
Source Austin Energy 2006
Evolve to More Comprehensive Programs
A sample of how program approaches might evolve over time is presented in Table 6-12 As this table illustrates programs typically start with proven models and often simpler approaches such as providing prescriptive rebates for multiple technologies in commercialindustrial existing building programs In addition early program options are offered for all customer classes and all of the programs deliver capacity benefits in addition to energy efficiency Ultimately the initial approach taken by a program administrator will depend on how quickly the program needs to ramp up and on the availability of
service industry professionals who know how to plan for and deliver energy efficiency to market
As program administrators gain internal experience and a greater understanding of local market conditions and regulators and stakeholders gain greater confidence in the value of the energy efficiency programs being offered program administrators can add complexity to the programs provided and technologies addressed The early and simpler programs will help establish internal relationships (across utility or program provider departshyments) and external relationships (between program providers trade allies and other stakeholders) Both the program provider and trade allies will better understand roles and relationships and trade allies will develop familiarity with program processes and develop trust in the programs Additional complexity can include alternative financing approaches (eg performance contracting) the inclusion of custom measures bidding programs whole buildings and whole home approaches or addishytional cutting edge technologies In addition once programs are proven within one subsector they can often be offered with slight modification to other sectors for example some proven residential program offerings might be appropriate for multi-family or low-income cusshytomers and some large commercial and industrial offerings might be appropriate for smaller customers or multifamily applications Many of the current ENERGY STAR market-based lighting and appliance programs that exist in many parts of the country evolved from customer-based lighting rebates with some in-store promotion Many of the more complex commercial and industrial programs such at NSTAR and National Gridrsquos Energy Initiative program evolved from lighting HVAC and motor rebate programs
The Wisconsin and Xcel Energy programs discussed on page 6-43 are also good examples of programs that have become more complex over time
Change Measures Over Time
Program success changing market conditions changes in codes and changes in technology require reassessing the measures included in a program High saturations in the market lower incremental costs more rigid codes or
To create a sustainable aggressive national commitment to energy efficiency 6-41
Table 6-12 Sample Progression of Program Designs
Sector Program Ramp Up Energy amp Environmental Co-Benefits (In Addition to kWh)
Early (6 Months -2 YRS)
Midterm (2-3 YRS)
Longer Term (3 To 7 YRS) Other Fuels
Peak (S = Summer W = Winter)
Water Savings Other
Residential Existing Homes
Market-based lighting amp appliance program
Home performance with ENERGY STAR pilot
Home performance with ENERGY STAR
HVAC rebate Add HVAC practices
X
X
X
S W
S W
S
X Bill savings and reduced emissions
Residential New Construction
ENERGY STAR Homes pilot (in areas without existing infrastructure)
ENERGY STAR Homes
Add ENERGY STAR Advanced Lighting Package
X S W
S W
X Bill savings and reduced emissions
Low-Income Education and coordination with weatherization programs
Direct install
Add home repair
X
X
W
S W X
Bill savings and reduced emissions
Improved bill payment
Improved comfort
Multifamily Lighting audits
Direct install X
S W
S W
Bill savings and reduced emissions
Commercial Existing Buildings
Lighting motors HVAC pumps refrigeration food service equipment prescriptive rebates
ESCO-type program
Custom measures
Comprehensive approach
S W
S W X
Bill savings and reduced emissions
Commercial New Construction
Lighting motors HVAC pumps refrigeration food service equipment prescriptive rebates Custom measures
and design assistance
S W
S W X
Bill savings and reduced emissions
Small Business Lighting and HVAC rebates
Direct install
S W
S W
Bill savings and reduced emissions
the availability of newer more efficient technologies are specific applications As barriers hindering customer all reasons to reassess what measures are included in a investment in a measure are reduced it might be appro-program Changes can be incremental such as limiting priate to lower or eliminate financial incentives altogether incentives for a specific measure to specific markets or It is not uncommon however for programs to continue
6-42 National Action Plan for Energy Efficiency
Wisconsin Focus on Energy Comprehensive Commercial Retrofit Program
Wisconsin Focus on Energyrsquos Feasibility Study Grants and Custom Incentive Program encourages commershycial customers to implement comprehensive multi-measure retrofit projects resulting in the long-term in-depth energy savings Customers implementing multi-measure projects designed to improve the whole building might be eligible for an additional 30 percent payment as a comprehensive bonus incentive The Comprehensive Commercial Retrofit Program saved 70414701 kWh 164 MW and 2 million therms from 2001 through 2005
Sources Thorne-Amann and Mendelsohn 2005 Wisconsin 2006
Xcel Energy Design Assistance
Energy Design Assistance offered by Xcel targets new construction and major renovation projects The program goal is to improve the energy efficiency of new construction projects by encouraging the design team to implement an integrated package of energy efficient strategies The target markets for the proshygram are commercial customers and small business customers along with architectural and engineering firms The program targets primarily big box retail public government facilities grocery stores health-care education and institutional customers The program offers three levels of support depending on project size For projects greater than 50000 square feet the program offers custom consulting For projshyects between 24000 and 50000 square feet the program offers plan review Smaller projects get a standard offering The program covers multiple HVAC lighting and building envelope measures The program also addresses industrial process motors and variable speed drives Statewide the Energy Design Assistance program saved 543 GWh and 153 MW at a cost of $53 million in 2003
Source Minnesota Office of Legislative Auditor 2005 Quantum Consulting Inc 2004
monitoring product and measure uptake after programs have ceased or to support other activities such as conshytinued education to ensure that market share for products and services are not adversely affected once financial incentives are eliminated
Pilot New Program Concepts
New program ideas and delivery approaches should be inishytially offered on a pilot basis Pilot programs are often very limited in duration geographic area sector or technology depending upon what is being tested There should be a specific set of questions and objectives that the pilot proshygram is designed to address After the pilot period a quick assessment of the program should be conducted to detershymine successful aspects of the program and any problem areas for improvement which can then be addressed in a more full-scale program The NSTAR program shown below is a recent example of an emerging program type that was originally started as a pilot
Table 6-13 provides a summary of the examples proshyvided in this section
NSTAR Electricrsquos ENERGY STARBenchmarking Initiative
NSTAR is using the ENERGY STAR benchmarking and portfolio manager to help its commercial cusshytomers identify and prioritize energy efficiency upgrades NSTAR staff assist the customer in using the ENERGY STAR tools to rate their building relative to other buildings of the same type and identify energy efficiency upgrades Additional support is provided through walk-through energy audits and assistance in applying for NSTAR financial incentive programs to implement efficiency measures
Ongoing support is available as participants monitor the impact of the energy efficiency improvements on the buildingrsquos performance
To create a sustainable aggressive national commitment to energy efficiency 6-43
Table 6-13 Program Examples for Key Customer Segments
Customer Program Program Program Description Program Model Key Best Segment Administrator Strategies Practices Proven Emerging
All Training and certification components
KeySpan KeySpanrsquos programs include a signifishycant certification and training composhynent This includes building operator certification building code training and training for HVAC installers Strategies include training and certification
X Donrsquot underinvest in education training and outreach Solicit stakeshyholder input Use utilities channels and brand
Commercial Industrial
Non-residential performance contracting program
California Utilities This program uses a standard contract approach to provide incentives for measured energy savings The key strategy is the provision of financial incentives
X Build upon ESCO and other financing program options Add program complexity over time Keep participation simple
Commercial Industrial New Construction
Energy design assistance
XCEL This program targets new construction and major renovation projects Key strategies are incentives and design assistance for electric saving end uses
X Keep participation simple Add complexity over time
Commercial Industrial
Custom incentive program
Wisconsin Focus on Energy
This program allows commercial and industrial customers to implement a wide array of measures Strategies include financial assistance and technical assistance
X Keep participation simple Add complexity over time
Large Commercial Industrial
NY Performance Contracting Program
NYSERDA Comprehensive Performance Contracting Program provides incenshytives for measures and leverages the energy services sector The predomishynant strategies are providing incenshytives and using the existing energy services infrastructure
X Does allow for technologies to be added over time
Leverage customer conshytact to sell additional measures Add program complexity over time Keep participation simple Build upon ESCO and other financing options
Large Commercial Industrial
ENERGY STAR Benchmarking
NSTAR NSTAR uses EPArsquos ENERGY STAR benchmarking and Portfolio Manager to assist customers in rating their buildings
X Coordinate with other programs Keep particishypation simple Use utility channels and brand Leverage ENERGY STAR
Small Commercial
Smart business Seattle City Light This program has per unit incentives for fixtures and is simple to participate in It also provides a list of pre-qualified contractors
X Use utility channels and brand Leverage cusshytomer contact to sell additional measures Keep funding consistent
Residential Flex Your Power California IOUrsquos This is an example of the CA utilities working together on a coordinated camshypaign to promote ENERGY STAR prodshyucts Lighting and appliances were among the measures promoted Strategies include incentives and advertising
X Donrsquot underinvest in edushycation training and outshyreach Solicit stakeholder input Use utilities chanshynels and brand Coordinate with other programs Leverage manshyufacturer and retailer resources Keep participashytion simple Leverage ENERGY STAR
Residential shyLow Income
Residential affordability program
LIPA Comprehensive low-income program that installs energy saving measures and also provides education Strategies are incentives and education
X Coordinate with other programs Keep participashytion simple Leverage customer contact to sell additional measures
6-44 National Action Plan for Energy Efficiency
Table 6-13 Program Examples for Key Customer Segments (continued)
Customer Segment
Program Program Administrator
Program Description Strategies
Program Model Key Best Practices
Proven Emerging
Residential Existing Homes
Home Performance with ENERGY STAR
Austin Energy Whole house approach to existing homes Measures include air sealing insulation lighting duct-sealing and replacing HVAC
X Start with proven modshyels Use utilities channels and brand Coordinate with other programs
Residential New Construction
ENERGY STAR Homes
Efficiency Vermont Comprehensive new construction proshygram based on a HERS rating system Measures include HVAC insulation lighting windows and appliances
X Donrsquot underinvest in education training and outreach Solicit stakeshyholder input Leverage state and federal tax credits Leverage ENERGY STAR
Residential Existing Homes
Residential program
Great River Coop Provides rebates to qualifying applishyances and technologies Also provides training and education to customers and trade allies Is a true dual-fuel program
X Start with proven modshyels Use utilities chanshynels and brand Coordinate with other programs
Residential Existing Homes
New Jersey Clean Energy Program
New Jersey BPU Provides rebates to qualifying applishyances and technologies Also provides training and education to customers and trade allies Is a true dual-fuel program
X Start with proven modshyels Coordinate with other programs
Commercial Existing
Education and training
BOMA Designed to teach members how to reduce energy consumption and costs through no- and low-cost strategies
X Leverage organizations and outside education and training opportunishyties Leverage ENERGY STAR
Ensuring Energy Efficiency
Investments Deliver Results
Program evaluation informs ongoing decision-making improves program delivery verifies energy savings claims and justifies future investment in energy efficiency as a reliable energy resource Engaging in evaluation during the early stages of program development can save time and money by identifying program inefficiencies and sugshygesting how program funding can be optimized It also helps ensure that critical data are not lost
The majority of organizations reviewed for this paper have formal evaluation plans that address both program processes and impacts The evaluation plans in general are developed consistent with the evaluation budget cycle and allocate evaluation dollars to specific programs and activities Process and impact evaluations are performed for each program early in program cycles As programs and portfolios mature process evaluations are less frequent than impact evaluations Over the maturation
period impact evaluations tend to focus on larger programs (or program components) and address more complex impact issues
Most programs have an evaluation reporting cycle that is consistent with the program funding (or budgeting) cycle In general savings are reported individually by sector and totaled for the portfolio Organizations use evaluation results from both process and impact evaluations to improve programs moving forward and adjust their portshyfolio of energy efficiency offerings based on evaluation findings and other factors Several organizations have adopted the International Performance Measurement and Verification Protocol (IPMVP) to provide guidelines for evaluation approaches California has its own set of forshymal protocols that address specific program types Key methods used by organizations vary based on program type and can include billing analysis engineering analysis metering sales data tracking and market effects studies
Table 6-14 summarizes the evaluation practices of a subset of the organizations reviewed for this study
To create a sustainable aggressive national commitment to energy efficiency 6-45
6-46 National Action Plan for Energy Efficiency
Tabl
e 6-
14 E
valu
atio
n A
ppro
ache
s N
YSER
DA
(NY)
Ef
fici
ency
Verm
ont
(VT)
Elec
tric
Uti
litie
sN
STA
R (M
A)
WI D
epar
tmen
t of
Adm
inis
trat
ion
(WI)
CA U
tilit
ies
(CA
) M
N E
lect
ric
and
Gas
Inve
stor
-O
wne
d U
tilit
ies
(MN
)
Bonn
evill
e Po
wer
Adm
inis
trat
ion
(ID
MT
OR
WA
)
Polic
y M
odel
SB
C w
sta
tead
min
istr
atio
n SB
C w
3rd
part
yad
min
istr
atio
n SB
C w
util
ityad
min
istr
atio
n SB
C w
sta
tead
min
istr
atio
n SB
C w
util
ityad
min
istr
atio
n IR
P an
d Co
nser
vatio
nIm
prov
emen
t Pro
gram
Re
gion
al P
lann
ing
Mod
el
Prog
ram
Fun
ding
Sou
rce
Annu
al a
ppro
pria
tion
8-ye
ar re
new
able
port
folio
sta
ndar
dpr
ogra
m 5
-yea
rpu
blic
ben
efit
prog
ram
s
Not
ava
ilabl
e SB
C SB
C ndash
elec
tric
rate
paye
rs
Not
ava
ilabl
e U
tiliti
es b
y or
der o
f sta
tele
gisl
atur
e to
spe
nd a
perc
ent o
f rev
enue
s on
effic
ienc
y pr
ogra
ms
Not
ava
ilabl
e
Prog
ram
Bud
geti
ng C
ycle
An
nual
3
year
s An
nual
from
SBC
An
nual
Cu
rren
t fun
ding
cyc
leis
3 y
ears
Pr
evio
uspe
riods
wer
e on
ly 2
year
s
Curr
ently
a 2
-yea
r cyc
le
but a
4-y
ear c
ycle
is re
cshyom
men
ded
Nat
ural
gas
subm
its p
lans
1 y
ear
elec
tric
ity th
e ne
xt
Depe
nden
t upo
n ra
te c
ase
can
be e
very
2 to
5 y
ears
Gen
eral
lyam
ortiz
ed a
nnua
lly
Eval
uati
on F
undi
ng C
ycle
An
nual
N
ot a
vaila
ble
Annu
al e
valu
atio
n is
alin
e ite
m in
bud
getin
gpr
oces
s
Annu
al
Ong
oing
eve
ry y
ear
Upc
omin
g co
ntra
cts
will
be
3 ye
ar e
valu
atio
nw
ith a
nnua
l rep
ortin
g
Fund
ed a
s ne
eded
Ev
alua
tion
fund
ed p
erio
dica
llyw
hen
nece
ssar
y St
artin
g to
do
mor
e fre
quen
t eva
luat
ions
than
in p
revi
ous
year
s
Eval
uati
on R
epor
ting
Cycl
e Q
uart
erly
and
annu
ally
An
nual
ly a
nd a
sne
eded
An
nual
ly b
ut n
ot e
very
prog
ram
eve
ry y
ear
Twic
e pe
r yea
r An
nual
An
nual
sta
tus
repo
rts
Not
ava
ilabl
e
Role
of
Dee
med
Sav
ings
(ie
pre
-det
erm
ined
sa
ving
s)
Estim
ate
savi
ngs
Prog
ram
pla
nnin
gan
d go
als
Estim
ate
savi
ngs
DOER
for r
epor
t to
legi
slat
ure
Pro
gram
plan
ning
and
des
ign
Estim
ate
savi
ngs
Prog
ram
plan
ning
and
goa
ls
Plan
ning
Inp
uts
for
TRC
anal
ysis
Adj
uste
d re
gula
rly b
ased
on
eval
uatio
n re
sults
Not
ava
ilabl
e De
term
ine
paym
ent s
ched
ule
for e
ffici
ency
mea
sure
s w
ithes
tabl
ishe
d sa
ving
s re
cord
s
Repo
rt G
ross
Sav
ings
(usu
ally
kW
h k
W)
No
No
Yes
Yes
Yes
Not
ava
ilabl
e Ye
s G
ross
sav
ings
form
s ba
sis
for r
egio
nal p
ower
pla
ns
Repo
rt N
et S
avin
gs(u
sual
ly k
Wh
kW
) Ye
s Ye
s Ye
s Ye
s Ye
s N
ot a
vaila
ble
Yes
Use
d to
eva
luat
e th
e ef
fishyci
ency
of m
easu
res
and
fine-
tune
pro
gram
s Sa
ving
s ne
tted
out d
epen
ds u
pon
prog
ram
Net
Sav
ings
Com
pone
nts
Inst
alla
tion
Verif
icat
ion
Yes
Yes
Yes
Yes
Not
ava
ilabl
e
Engi
neer
ing
Revi
ew
Yes
Yes
Yes
Yes
Not
ava
ilabl
e
Free
Rid
ersh
ip
Yes
Yes
Yes
Yes
Yes
Yes
Not
ava
ilabl
e
Spill
over
or M
arke
t Effe
cts
Yes
Yes
Yes
Yes
Yes
Not
ava
ilabl
e
Rete
ntio
n Ye
s Ye
s Ye
s Ye
s N
ot a
vaila
ble
Non
-Ene
rgy
Bene
fits
Yes
Yes
Not
ava
ilabl
e
Oth
er N
ot S
peci
fied
Yes
Tabl
e 6-
14 E
valu
atio
n A
ppro
ache
s (c
ontin
ued)
NYS
ERD
A(N
Y)
Effi
cien
cyVe
rmon
t(V
T)
Elec
tric
Uti
litie
sN
STA
R (M
A)
WI D
epar
tmen
t of
Adm
inis
trat
ion
(WI)
CA U
tilit
ies
(CA
) M
N E
lect
ric
and
Gas
Inve
stor
-O
wne
d U
tilit
ies
(MN
)
Bonn
evill
e Po
wer
Adm
inis
trat
ion
(ID
MT
OR
WA
)
Educ
atio
n an
d Tr
aini
ng in
EE B
udge
t Ye
s N
ot a
vaila
ble
Yes
Not
ava
ilabl
e Ye
s N
ot a
vaila
ble
Yes
Educ
atio
n an
d Tr
aini
ngEv
alua
ted
Yes
Not
ava
ilabl
e De
pend
s on
pro
gram
In
itial
yea
rs o
nly
Yes
Not
ava
ilabl
e N
o
Eval
uati
on F
undi
ng a
sPe
rcen
t of
Pro
gram
Budg
et
Not
ava
ilabl
e lt
1
2
8 in
crea
se fr
om 4
25
N
o m
ore
than
3
of
min
imum
effi
cien
cysp
endi
ng re
quire
men
t
lt1
Eval
uati
on B
udge
t N
ot a
vaila
ble
Not
ava
ilabl
e Va
ries
annu
ally
dep
ende
ntup
on p
roje
ct p
ortfo
lio a
ndot
her d
eman
ds
Not
Ava
ilabl
e $1
60M
M o
ver 3
yea
rs
Not
ava
ilabl
e $1
MM
Fina
ncia
l Eva
luat
ion
Inte
rnal
Stat
e Co
mpt
rolle
rCP
A
CPA
Inte
rnal
CPA
CP
A N
ot a
vaia
ble
Inte
rnal
Rev
iew
ed b
yDe
part
men
t of C
omm
erce
Re
view
ed b
y Le
gisl
atur
e
Inte
rnal
Cost
-Eff
ecti
vene
ssA
naly
sis
Yes
Yes
Yes
Yes
Yes
Yes
Yes
Tim
ing
Annu
ally
Tr
ienn
ially
Va
ries
annu
ally
dep
ende
ntup
on p
roje
ct p
ortfo
lio a
ndot
her d
eman
ds
Perio
dica
lly (l
ess
frequ
ent
than
fund
ing
cycl
e)
Not
ava
ilabl
e 2
year
s Pe
riodi
cally
Test
Use
d (R
IM T
RC U
tility
O
ther
) TR
C O
ther
U
tility
Cos
t Tes
t and
Soci
etal
Cos
t-Be
nefit
Test
TRC
Soci
etal
als
o in
clud
es
econ
omic
impa
cts
TRCP
AC (p
rogr
amad
min
istr
ator
test
) So
ciet
al U
tility
Par
ticip
ant
Rate
paye
r TR
C
Who
Eva
luat
es
Inde
pend
ent
eval
uato
rs
Inde
pend
ent
expe
rts
unde
r con
shytr
act t
o DP
S
Util
ities
man
age
inde
shype
nden
t eva
luat
ors
thro
ugh
RFP
proc
ess
One
inde
pend
ent t
eam
of
eval
uato
rs
Inde
pend
ent e
valu
ashyto
rs h
ired
for e
ach
proshy
gram
via
RFP
pro
cess
Depa
rtm
ent o
fCo
mm
erce
Leg
isla
ture
Aud
itCo
mm
issi
on i
f dee
med
ne
cess
ary
Inde
pend
ent e
valu
ator
s
Ove
rsig
ht o
f ev
alua
tion
N
YSER
DA
prov
ides
ong
oing
over
sigh
tPu
blic
Util
ities
Com
mis
sion
fina
lau
dien
ce
Depa
rtm
ent o
fPu
blic
Ser
vice
Ev
alua
tions
are
revi
ewed
in c
olla
bora
tive
and
filed
with
the
Mas
sach
uset
tsDe
part
men
t of
Tele
com
mun
icat
ions
and
Ener
gy
WI D
epar
tmen
t of
Adm
inis
trat
ion
Calif
orni
a Pu
blic
Util
ities
Com
mis
sion
and
CEC
Depa
rtm
ent o
f Com
mer
ce
Pow
er C
ounc
il
Prot
ocol
s IP
MVP
N
ot a
vaila
ble
Not
ava
ilabl
e N
one
Has
had
stat
ewid
e pr
oshyto
cols
for m
any
year
sN
ew p
roto
cols
wer
ere
cent
ly a
dopt
ed
Not
ava
ilabl
e IP
MVP
as
refe
renc
e
To create a sustainable aggressive national commitment to energy efficiency 6-47
Best practices for program evaluation that emerge from review of these organizations include the following
bull Budget plan and initiate evaluation from the onset
bull Formalize and document evaluation plans
bull Develop program tracking systems that are compatible with needs identified in evaluation plans
bull Conduct process evaluations to ensure that programs are working efficiently
bull Conduct impact evaluations to ensure that mid- and long-term goals are being met
bull Communicate evaluation results
Budget Plan and Initiate Evaluation From the Onset
A well-designed evaluation plan addresses program process and impact issues Process evaluations address issues associated with program delivery such as marketing staffing paperwork flow and customer interactions to understand how they can be improved to better meet program objectives Impact evaluations are designed to determine the energy or peak savings from the program Sometimes evaluations address other program benefits such as non-energy benefits to consumers water savings economic impacts or emission reductions Market research is often included in evaluation budgets to assist in assessing program delivery options and for establishing baselines An evaluation budget of 3 to 6 percent of proshygram budget is a reasonable spending range Often evalshyuation spending is higher in the second or third year of
ldquoWe should measure the performance of DSM programs in much the same way and with the same competence and diligence that we monitor the performance of power plantsrdquo
mdashEric Hirst (1990) Independent Consultant and Former Corporate Fellow Oak Ridge National Laboratory
a program Certain evaluation activities such as estabshylishing baselines are critical to undertake from the onset to ensure that valuable data are not lost
Develop Program and Project Tracking Systems That Support Evaluation Needs
A well-designed tracking system should collect sufficiently detailed information needed for program evaluation and implementation Data collection can vary by program type technologies addressed and customer segment however all program tracking systems should include
bull Participating customer information At a minimum create an unique customer identifier that can be linked to the utilityrsquos Customer Information System (CIS) Other customer or site specific information might be valuable
bull Measure specific information Record equipment type equipment size or quantity efficiency level and estimated savings
bull Program tracking information Track rebates or other program services provided (for each participant) and key program dates
bull All program cost information Include internal staffing and marketing costs subcontractor and vendor costs and program incentives
Efficiency Vermontrsquos tracking system incorporates all of these features in a comprehensive easy-to-use relational database that includes all program contacts including program allies and customers tracks all project savings and costs shows the underlying engineering estimates for all measures and includes billing data from all of the Vermont utilities
6-48 National Action Plan for Energy Efficiency
Conduct Process Evaluations to Ensure Programs Are Working Efficiently
Process evaluations are a tool to improve the design and delivery of the program and are especially important for newer programs Often they can identify improvements to program delivery that reduce program costs expedite program delivery improve customer satisfaction and better focus program objectives Process evaluation can also address what technologies get rebates or determine rebate levels Process evaluations use a variety of qualitashytive and quantitative approaches including review of proshygram documents in-depth interviews focus groups and surveys Customer research in general such as regular customer and vendor surveys provides program adminshyistrators with continual feedback on how the program is working and being received by the market
Conduct Impact Evaluations to Ensure Goals Are Being Met
Impact evaluations measure the change in energy usage (kWh kW and therms) attributable to the program They use a variety of approaches to quantify energy savshyings including statistical comparisons engineering estishymation modeling metering and billing analysis The impact evaluation approach used is a function of the budget available the technology(ies) addressed the certainty of the original program estimates and the level of estimated savings The appliance recycling example shown at right is an example of how process and impact evaluations have improved a program over time
Measurement and Verification (MampV)
The term ldquomeasurement and verificationrdquo is often used in regard to evaluating energy efficiency programs Sometimes this term refers to ongoing MampV that is incorporated into program operations such as telephone confirmation of installations by third-party installers or measurement of savings for selected projects Other times it refers to external (program operations) evaluations to document savings
California Residential ApplianceRecycling Program (RARP)
The California RARP was initially designed to remove older inefficient second refrigerators from participant households As the program matured evaluations showed that the potential for removing old second refrigerators from households had decreased substantially as a result of the program The program now focuses on pick-up of older refrigerators that are being replaced to keep these refrigerators out of the secondary refrigerator market
Organizations are beginning to explore the use of the EPA Energy Performance Rating System to measure the energy performance at the whole-building level complement traditional MampV measures and go beyond component- by-component approaches that miss the interactive impacts of design sizing installation controls and operation and maintenance
While most energy professionals see inherent value in providing energy education and training (lack of inforshymation is often identified as a barrier to customer and market actor adoption of energy efficiency products and practices) few programs estimate savings directly as a result of education efforts Until 2004 California assigned a savings estimate to the Statewide Education and Training Services program based on expenditures
Capturing the energy impacts of energy education proshygrams has proven to be a challenge for evaluators for several reasons First education and training efforts are often integral to specific program offerings For example training of HVAC contractors on sizing air conditioners might be integrated into a residential appliance rebate program Second education and training are often a small part of a program in terms of budget and estimated savings Third impact evaluation efforts might be expensive compared to the education and training budget and anticipated savings Fourth education and training efforts are not always designed to achieve direct benefits They are often designed to inform participants or market actors of program opportunities simply to familiarize them with energy efficiency options Most evaluations of
To create a sustainable aggressive national commitment to energy efficiency 6-49
Best Practices in Evaluation
bull Incorporating an overall evaluation plan and budget into the program plan
bull Adopting a more in-depth evaluation plan each program year
bull Prioritizing evaluation resources where the risks are highest This includes focusing impact evaluation activities on the most uncertain outcomes and highest potential savings New and pilot programs have the most uncertain outcomes as do newer technologies
bull Allowing evaluation criteria to vary across some program types to allow for education outreach and innovation
bull Conducting ongoing verification as part of the program process
energy education and training initiatives have focused on process issues Recently there have been impact evalshyuations of training programs especially those designed to produce direct energy savings such as Building Operator Certification
In the future energy efficiency will be part of emissions trading initiatives (such as the Regional Greenhouse Gas Initiative [RGGI]) and is likely to be eligible for payments for reducing congestion and providing capacity value such as in the ISO-NE capacity market settlement These emerging opportunities will require that evaluation methods become more consistent across states and regions which might necessitate adopting consistent protocols for project-level verification for large projects and standardizing sampling approaches for residential measures such as compact fluoshyrescent lighting This is an emerging need and should be a future area of collaboration across states
Communicate Evaluation Results to Key Stakeholders
Communicating the evaluation results to program administrators and stakeholders is essential to enhancing program effectiveness Program administrators need to understand evaluation approaches findings and espeshycially recommendations to improve program processes
bull Establishing a program tracking system that includes necessary information for evaluation
bull Matching evaluation techniques to the situation in regards to the costs to evaluate the level of precision required and feasibility
bull Maintaining separate staff for evaluation and for program implementation Having outside review of evaluations (eg state utility commission) especially if conducted by internal utility staff
bull Evaluating regularly to refine programs as needed (changing market conditions often require program changes)
and increase (or maintain) program savings levels Stakeholders need to see that savings from energy effishyciency programs are realized and have been verified independently
Evaluation reports need to be geared toward the audishyences reviewing them Program staff and regulators often prefer reports that clearly describe methodologies limitations and findings on a detailed and program level Outside stakeholders are more likely to read shorter evalshyuation reports that highlight key findings at the cusshytomer segment or portfolio level These reports must be written in a less technical manner and highlight the impacts of the program beyond energy or demand savings For example summary reports of the Wisconsin Focus on Energy programs highlight energy demand and therm savings by sector but also discuss the environshymental benefits of the program and the impacts of energy savings on the Wisconsin economy Because the public benefits budget goes through the state legislature the summary reports include maps of Wisconsin showing where Focus on Energy projects were completed Examples of particularly successful investments with the customerrsquos permission should be part of the evaluation These case studies can be used to make the success more tangible to stakeholders
6-50 National Action Plan for Energy Efficiency
Recommendations and Options
The National Action Plan for Energy Efficiency Leadership Group offers the following recommendations as ways to promote best practice energy efficiency programs and provides a number of options for consideration by utilishyties regulators and stakeholders
Recommendation Recognize energy efficiency as a high-
priority energy resource Energy efficiency has not been consistently viewed as a meaningful or dependable resource compared to new supply options regardless of its demonstrated contributions to meeting load growth Recognizing energy efficiency as a high priority energy resource is an important step in efforts to capture the benefits it offers and lower the overall cost of energy services to customers Based on jurisdictional objectives energy efficiency can be incorporated into resource plans to account for the long-term benefits from energy savshyings capacity savings potential reductions of air pollushytants and greenhouse gases as well as other benefits The explicit integration of energy efficiency resources into the formalized resource planning processes that exist at regional state and utility levels can help estabshylish the rationale for energy efficiency funding levels and for properly valuing and balancing the benefits In some jurisdictions existing planning processes might need to be adapted or new planning processes might need to be created to meaningfully incorporate energy efficiency resources into resource planning Some states have recshyognized energy efficiency as the resource of first priority due to its broad benefits
Option to Consider
bull Quantifying and establishing the value of energy effishyciency considering energy savings capacity savings and environmental benefits as appropriate
Recommendation Make a strong long-term commitshy
ment to cost-effective energy efficiency as a resource
Energy efficiency programs are most successful and provide the greatest benefits to stakeholders when appropriate policies are established and maintained over the long-term Confidence in long-term stability of the program
will help maintain energy efficiency as a dependable resource compared to supply-side resources deferring or even avoiding the need for other infrastructure investshyments and maintains customer awareness and support Some steps might include assessing the long-term potential for cost-effective energy efficiency within a region (ie the energy efficiency that can be delivered cost-effectively through proven programs for each customer class within a planning horizon) examining the role for cutting-edge initiatives and technologies estabshylishing the cost of supply-side options versus energy efficiency establishing robust MampV procedures and providing for routine updates to information on energy efficiency potential and key costs
Options to Consider
bull Establishing appropriate cost-effectiveness tests for a portfolio of programs to reflect the long-term benefits of energy efficiency
bull Establishing the potential for long-term cost-effective energy efficiency savings by customer class through proven programs innovative initiatives and cutting-edge technologies
bull Establishing funding requirements for delivering long-term cost-effective energy efficiency
bull Developing long-term energy saving goals as part of energy planning processes
bull Developing robust MampV procedures
bull Designating which organization(s) is responsible for administering the energy efficiency programs
bull Providing for frequent updates to energy resource plans to accommodate new information and technology
Recommendation Broadly communicate the benefits of
and opportunities for energy efficiency Experience shows that energy efficiency programs help customers save money and contribute to lower cost energy systems But these impacts are not fully documented nor
To create a sustainable aggressive national commitment to energy efficiency 6-51
recognized by customers utilities regulators and policy-makers More effort is needed to establish the business case for energy efficiency for all decision-makers and to show how a well-designed approach to energy efficiency can benefit customers utilities and society by (1) reducing customers bills over time (2) fostering financially healthy utilities (return on equity [ROE] earnings per share debt coverage ratios) and (3) contributing to positive societal net benefits overall Effort is also necessary to educate key stakeholders that although energy efficiency can be an important low-cost resource to integrate into the energy mix it does require funding just as a new power plan requires funding Further education is necessary on the impact that energy efficiency programs can have in concert with other energy efficiency policies such as building codes appliance standards and tax incentives
Options to Consider
bull Communicating the role of energy efficiency in lowering customer energy bills and system costs and risks over time
bull Communicating the role of building codes appliance standards tax and other incentives
Recommendation Provide sufficient and stable program
funding to deliver energy efficiency where cost-
effective Energy efficiency programs require consistent and long-term funding to effectively compete with energy supply options Efforts are necessary to establish this consistent long-term funding A variety of mechanisms have been and can be used based on state utility and other stakeholder interests It is important to ensure that the efficiency programs providers have sufficient proshygram funding to recover energy efficiency program costs and implement the energy efficiency that has been demonstrated to be available and cost-effective A number of states are now linking program funding to the achievement of energy savings
Option to Consider bull Establishing funding for multi-year periods
References
Alliance to Save Energy (2004 December 1) Alliance to Save Energyrsquos 2004 lsquoStars of Energy Efficiencyrsquo Bank of America Marriott International BPASCE EEIrsquos Kuhn DOErsquos Garman Alliance Founder Sen Charles Percy lthttpwwwaseorgcontent newsdetail1919gt
American Council for an Energy Efficiency Economy [ACEEE] (1998) Energy Efficiency and Economic Development in IllinoismdashStatewide Savings 2015
Association of Energy Services Professionals [AESP] (2006 February 6) AESP Annual Awards Program Presentation
Austin Energy (2004) 2004 Annual Report lthttpwwwaustinenergycomAbout20Us NewsroomReportsannualReportpdfgt
Austin Energy (2006) 2006 ENERGY STAR Awards Application
Balzar B (2006 February 21) Recent History and Successes Energy Efficiency amp Conservation State of Nevada Presentation to the Arkansas Public Service Commission
Blumstein C Goldman C amp Barbose G (2005 May) Who should administer energy-efficiency programs Energy Policy 33(8)1053-1067
Bonnville Power Administration (2004 May 27) BPA Strategy Map lthttpwwwbpagovcorporate about_BPAStrategycfmgt
California Clean Energy Fund [CCEF] (2005) About UsmdashOverview lthttpwwwcalceforgaboutindexaspgt
California Energy Commission (2001 October) California Standard Practice Manual Economic Analysis of Demand Side Programs and Projects lthttpwwwenergycagovgreenbuildingdocuments background07-J_CPUC_STANDARD_PRACTICE _MANUALPDFgt
California Public Utilities Commission [CPUC] (2006 April) California Energy Efficiency Evaluation Protocols Technical Methodological and Reporting Requirements for Evaluation Professionals lthttpwwwcalmacorgpublicationsEvaluatorsProt ocols_Final_AdoptedviaRuling_06-19-2006pdfgt
6-52 National Action Plan for Energy Efficiency
California Public Utilities Commission [CPUC] (2005 August 17) Interim Opinion Energy Efficiency Portfolio Plans and Program Funding Levels For 2006ndash2008mdashPhase 1 Issues lthttpwwwcpuccagov publishedcomment_decision48667-03htmP292_ 37591gt
Efficiency Vermont (2004) Working Together for an Energy Efficient Vermont 2004 Annual Report lthttpwwwefficiencyvermontcompages CommonAboutUsAnnualReportgt
Electric Power Research Institute [EPRI] (2006) IntelliGrid lthttpwwwepricomIntelliGridgt
Elliot R N amp Shipley A M (2005 April) Impacts of Energy Efficiency and Renewable Energy on Natural Gas Markets Updated and Expanded Analysis American Council for an Energy Efficient Economy Report E052
Feldman S (1994) Market Transformation Hot Topic or Hot Air ACEEE Summer Study on Energy Efficiency in Buildings Washington DC American Council for an Energy Efficient Economy [ACEEE]
Fort Collins Utilities APT amp EFI (2005) 2005 ENERGY STAR Awards Application
GDS Associates amp Quantum Consulting (2004 June) Independent Assessment of Conservation and Energy Efficiency Potential for Connecticut and the Southwest Connecticut Region
Geller H (2006 May) Catching Up Progress with Utility Energy Efficiency Programs in the Southwest Southwest Energy Efficiency Project [SWEEP]
Hirst E (1990) Measuring Performance Key to Successful Utility Demand-Side Management Programs Oak Ridge National Laboratory [ORNL]
ICF Consulting (2005 September) Avoided Costs of Energy in New England Due to Energy Efficiency Programs Presented to AESC Study Group
Johnson B (2006 April 27) Market Transformation as a Tool to Meet Natural Gas Savings Targets KeySpan Energy Delivery AESP Brown Bag Session Presentation
KEMA (2004) New Jersey Energy Efficiency and Distributed Generation Market Assessment
KEMA (2002 September) Californiarsquos Secret Energy Surplus The Potential for Energy Efficiency
KEMA amp XENERGY (2003a April) California Residential Sector Energy Efficiency Potential Study
KEMA amp XENERGY (2003b March) California Statewide Commercial Sector Natural Gas Energy Efficiency Potential Study
Komor P (2005 March) Ten Key Lessons Learned from Successful Energy Efficiency Programs Platts
Kushler M York D amp Witte P (2004 April) Five Years In An Examination of the First Half-Decade of Public Benefits Energy Efficiency Policies Washington DC American Council for an Energy Efficient Economy [ACEEE] lthttpwwwaceeeorgpubsu042htmgt
Kushler M York D amp Witte P (2003 December) Responding to the Natural Gas Crisis Americarsquos Best Natural Gas Energy Efficiency Programs Washington DC American Council for an Energy Efficient Economy
Long Island Power Authority (2004) LIPA Clean EnergyInitiative Annual Report 2004 Uniondale NY
Massachusetts Department of Telecommunications andEnergy [MDTE] (1998) Investigation by the DTEupon its own motion commencing a Notice ofInquiryRulemaking pursuant to 220 CMR sectsect200 et seg establishing the procedures to be folshylowed in electric industry restructuring by electric companies subject to GL c 164 (DPUDTE 96shy100)
Massachusetts Department of Telecommunications and Energy [MDTE] (1995) Investigation by the Department of Public Utilities on its own motion into electric industry restructuring (DPU 95-30)
Massachusetts Office of Consumer Affairs and Business Regulation Division of Energy Resources [Massachusetts] (2004 Summer) 2002 Energy Efficiency Activities A Report by the Division of Energy Resources An Annual Report to the Great and General Court on the Status of Energy Efficiency Activities in Massachusetts lthttpwwwmassgovdoerpub_infoee02shylongpdfgt
To create a sustainable aggressive national commitment to energy efficiency 6-53
Mills E and Livingston J (2005 November 11) Energy Traversing The Valley Of Death Forbes lthttpwwwforbescom20051117utilitiesshyemerging-tech-cz_1117energy_programshtmlgt
Minnesota Public Utilities Commission [MPUC] (2005 December 6) Next Generation of Energy Efficiency Initiatives in Minnesota Presentation lthttpwwwraponlineorgConferencesMinnesota NextGenerationofEnergyEfficiencyNotespdfgt
Minnesota Office of Legislative Auditor (2005) Evaluation Report Energy Conservation Improvement Program
National Association of Energy Service Companies [NAESCO] (2005) Industry Information Is it DeJa Vu All Over Again The Resurgence of DSM Bidding Programs
National Grid (2002 July 2) 2001 Commercial and Industrial Free-Ridership and Spillover Study
New York State Energy Research and Development Authority [NYSERDA] amp Optimal Energy Inc [OE] (2006) Gas Energy Resource Development Potential in Consolidated Edison Service Area Service Area Savings 2016
New York State Energy Research and Development Authority [NYSERDA] (2005a May) Annual Report for 2004 ndash Evaluation and Status Report to the Systems Benefits Advisory Group lthttpwwwnyserdaorgEnergy_Information05sbc reportaspgt
New York State Energy Research and Development Authority [NYSERDA] (2005b) Making a Difference Through Education 2004ndash2005 Annual Report lthttpwwwnyserdaorgpublications04-05annual reportaspgt
New York State Energy Research and Development Authority [NYSERDA] (2004 May) Annual Report for 2003 ndash Evaluation and Status Report to the Systems Benefits Advisory Group lthttpwwwnyserdaorgEnergy_Information04sbc reportaspgt
New York State Energy Research and Development Authority [NYSERDA]Optimal Energy Inc (2003) Energy Efficiency and Renewable Energy Resource Development Potential in New York State
Northeast Energy Efficiency Project [NEEP] (undated) The Northeast Residential ENERGY STAR Products Initiative
Northwest Power and Conservation Council [NWPCC] (2005 May) The Fifth Northwest Electric Power and Conservation Plan
Oak Ridge National Laboratory [ORNL] (2000) Scenarios for a Clean Energy Future
Pacific Gas and Electric [PGampE] (1993 September) The Model Energy Communities Program (the Delta Project) Summary of Lessons Learned
Puget Sound Energy (2003) Least Cost Plan Advisory GroupConservation Resource Advisory Group Meeting
Quantum Consulting Inc (2004 December) National Energy Efficiency Best Practices Study lthttpwwweebestpracticescomgt
RLW Analytics Inc amp Shel Feldman Management Consulting (2001 June 7) The Remaining Electric Energy Efficiency Opportunities in Massachusetts Prepared for Program Administrators and Massachusetts Division of Energy Resources lthttpwwwmassgovdoerpub_infoe3opdfgt
Sacramento Municipal Utility District [SMUD] (2004a) Benefiting Society and the Environment SMUD Public Good Report 2004 lthttpwwwsmudorgaboutreportsreport_pdfs2 004_PublicGoodspdfgt
Sacramento Municipal Utility District [SMUD] (2004b November 3) 2005 Budget Letter to Board of Directors
Seattle City Light (2005) Energy Conservation Accomplishments 1977-2004 Evaluation Unit Conservation Resources Division lthttpwww seattlegovlightConservecv5_pubhtmgt
Southern California Gas Company (2004 May) Energy Efficiency Programs Annual Summary and Technical Appendix ndash 2003 Results lthttpwwwsocalgascomregulatoryefficiencyrep orts2003shtmlgt
Southwest Energy Efficiency Project [SWEEP] (2006 January) Natural Gas Demand-Side Management Programs A National Survey
6-54 National Action Plan for Energy Efficiency
Southwest Energy Efficiency Project [SWEEP] (2002 November) The New Mother Lode The Potential for More Efficient Electricity Use in the Southwest
Swisher J de Martino Jannuzzi G amp Redlinger R (1997 November) Tools and Methods for Integrated Resource Planning Improving Energy Efficiency and Protecting the Environment United Nations Environment Programme [UNEP] Collaborating Centre on Energy and Environment
Thorne-Amann J and Mendelsohn E (2005) Comprehensive Commercial Retrofit Programs A Review of Activity and Opportunities Report Number A052 American Council for an Energy Efficient Economy [ACEEE]
US Department of Energy [DOE] (2006) Weatherization Assistance Plan lthttpwwweere energygovweatherizationgt
US Energy Information Administration [EIA] (2006a) Annual Energy Outlook Washington DC
US Energy Information Administration [EIA] (2006b June) Natural Gas Consumption by End Use Natural Gas Navigator lthttptontoeiadoegovdnavngng_cons_sum_a_ EPG0_VC0_mmcf_ahtmgt
US Energy Information Administration [EIA] (2005a November) US Electric Power Industry Existing Net Summer Capacity by State Electric Power Annual lthttpwwweiadoegovcneaf electricityepaexisting_capacity_statexlsgt
US Energy Information Administration [EIA] (2005b December) Sales to Bundled and Unbundled Consumers by Sector Census Division and State Electricity Sales 2004mdashElectric Sales Revenue and Price lthttpwwweiadoegovcneafelectricity esrtable2xlsgt
US Energy Information Administration [EIA] (2004) Sales to Bundled and Unbundled Consumers lthttpwwweiadoegovcneafelectricityesr table2xlsgt
Wisconsin Department of Administration Division of Energy Focus Evaluation Team [Wisconsin] (2006 March 3) Semiannual Report (FY 06) Midyear Focus on Energy Public Benefits Evaluation
To create a sustainable aggressive national commitment to energy efficiency 6-55
7Report Summary
This report presents a variety of policy planning and program approaches that can be used to help natushyral gas and electric utilities utility regulators and partner organizations pursue the National Action Plan for Energy Efficiency recommendations and meet their commitments to energy efficiency This chapter summarizes these recommendations and the energy efficiency key findings discussed in this report
Overview
This National Action Plan for Energy Efficiency (Action Plan) is a call to action to bring diverse stakeholders together at the national regional state or utility level as appropriate to foster the discussions decision-making and commitments necessary to take investment in energy efficiency to a new level The overall goal is to create a sustainable aggressive national commitment to energy efficiency through gas and electric utilities utility regulators and partner organizations
Based on the policies practices and efforts of many organizations previously discussed in this report the Leadership Group offers five recommendations as ways to overcome many of the barriers that have limited greater investment in programs to deliver energy effishyciency to customers of electric and gas utilities (Figure 7-1) These recommendations may be pursued through a number of different options depending on state and utility circumstances
As part of the Action Plan leading organizations are committing to aggressively pursue energy efficiency opportunities in their organizations and to assist others who want to increase the use of energy efficiency in their regions The commitments pursued under the Action Plan have the potential to save Americans many billions of dollars on energy bills over the next 10 to 15 years contribute to energy security and improve the environment
Recommendations and Options
to Consider
The Action Plan Report provides information on the barshyriers that limit greater investment in programs to deliver energy efficiency to customers of electric and gas utilishyties Figure 7-2 illustrates the key barriers and how they relate to policy structure utility resource planning and program implementation
Figure 7-1 National Action Plan for Energy Efficiency Recommendations
bull Recognize energy efficiency as a high-priority energy resource
bull Make a strong long-term commitment to implement cost-effective energy efficiency as a resource
bull Broadly communicate the benefits of and opportunities for energy efficiency
bull Promote sufficient timely and stable program funding to deliver energy efficiency where cost-effective
bull Modify policies to align utility incentives with the delivery of cost-effective energy efficiency and
modify ratemaking practices to promote energy efficiency investments
To create a sustainable aggressive national commitment to energy efficiency 7-1
Several options exist for utilities regulators and partner organizations to overcome these barriers and pursue the Action Plan recommendations Different state and utility circumstances affect which options are pursued Table 7-1 provides a list of the Leadership Group recommendations along with sample options to consider The table also provides a cross reference to supporting discussions in Chapters 2 through 6 of this report
Key Findings
The key finding of the Action Plan Report is that energy efficiency can be a cost-effective resource and can proshyvide multiple benefits to utilities customers and society These benefits also discussed in more detail in Chapter 1 Introduction and Background1 include
bull Lower energy bills greater customer control and greater customer satisfaction
bull Lower cost than only supplying new generation from new power plants
bull Advantages from being modular and quick to deploy
bull Significant energy savings
bull Environmental benefits
bull Economic development opportunities
bull Energy security
Figure 7-2 National Action Plan for Energy Efficiency Report Addresses Actions to Encourage Greater Energy Efficiency
Timeline Actions to Encourage Greater Energy Efficiency
Utility Resource Program Policy Structure Planning Implementation
Develop Utility Incentives for Energy Efficiency
Develop Rate Designs to Encourage Energy Efficiency
Include Energy Efficiency in Utility Resource Mix
Measurement amp Evaluation
Program Roll-out
Develop Effective Energy Efficiency Programs
Revise Plans and Policies Based on Results
Action Plan Report Chapter Areas and Key Barriers
Utility Ratemaking amp Revenue
Requirements
Energy efficiency reduces utility earnings
Planning Processes
Planning does not incorporate demand-
side resources
Rate Design
Rates do not encourage energy
efficiency investments
Model Program
Documentation
Limited information on existing best practices
1 Chapter 6 Energy Efficiency Program Best Practices also provides more information on these benefits
7-2 National Action Plan for Energy Efficiency
Table 7-1 Leadership Group Recommendations and Options to Consider by Chapter
Leadership Group Recommendations
(With Options To Consider)
Chapter 2 Utility
Ratemaking amp Revenue
Requirements
Chapter 3 Energy
Resource Planning Processes
Chapter 4 Business Case
for Energy Efficiency
Chapter 5 Rate Design
Chapter 6 Energy
Efficiency Program Best
Practices
Recognize energy efficiency as a high priority energy resource
X X
Establishing policies to establish energy efficiency as a priority resource
X
Integrating energy efficiency into utility state and regional resource planning activities
X
Quantifying and establishing the value of energy efficiency considering energy savings capacity savings and environmental benefits as appropriate
X X
Make a strong long-term commitment to cost effective energy efficiency as a resource
X X X
Establishing appropriate cost-effectiveness tests for a portfolio of programs to reflect the long-term benefits of energy efficiency
X X
Establishing the potential for long-term cost effective energy efficiency savings by customer class through proven programs innovative initiatives and cutting-edge technologies
X X
Establishing funding requirements for delivering long-term cost-effective energy efficiency
X X X
Developing long-term energy saving goals as part of energy planning processes
X X
Developing robust measurement and verification (MampV) procedures
X X
Designating which organization(s) is responsishyble for administering the energy efficiency programs
X X X
Providing for frequent updates to energy resource plans to accommodate new information and technology
X X
Broadly communicate the benefits of and opportunities for energy efficiency
X X X X X
Establishing and educating stakeholders on the business case for energy efficiency at the state utility and other appropriate level addressing releshyvant customer utility and societal perspectives
X X X
Communicating the role of energy efficiency in lowering customer energy bills and system costs and risks over time
X X X X X
Communicating the role of building codes appliance standards and tax and other incentives
X
To create a sustainable aggressive national commitment to energy efficiency 7-3
Table 7-1 Leadership Group Recommendations and Options to Consider by Chapter (continued)
Leadership Group Recommendations
(With Options To Consider)
Chapter 2 Utility
Ratemaking amp Revenue
Requirements
Chapter 3 Energy
Resource Planning Processes
Chapter 4 Business Case
for Energy Efficiency
Chapter 5 Rate Design
Chapter 6 Energy
Efficiency Program Best
Practices
Provide sufficient timely and stable program funding to deliver energy efficiency where cost-effective
X X X
Deciding on and committing to a consistent way for program administrators to recover energy efficiency costs in a timely manner
X X
Establishing funding mechanisms for energy efficiency from among the available options such as revenue requirement or resource procurement funding system benefits charges rate-basing shared-savings incentive mechanisms etc
X X
Establishing funding for multi-year periods X X X
Modify policies to align utility incentives with the delivery of cost-effective energy efficiency and modify ratemaking practices to promote energy efficiency investments
X X
Addressing the typical utility throughput incentive and removing other regulatory and management disincentives to energy efficiency
X
Providing utility incentives for the successful management of energy efficiency programs
X
Including the impact on adoption of energy efficiency as one of the goals of retail rate design recognizing that it must be balanced with other objectives
X
Eliminating rate designs that discourage energy efficiency by not increasing costs as customers consume more electricity or natural gas
X
Adopting rate designs that encourage energy efficiency by considering the unique charactershyistics of each customer class and including partnering tariffs with other mechanisms that encourage energy efficiency such as benefit sharing programs and on-bill financing
X
7-4 National Action Plan for Energy Efficiency
As discussed in Chapter 2 Utility Ratemaking amp Revenue Requirements financial disincentives exist that hinder utilities from pursuing energy efficiency even when cost-effective Many states have experience in addressing utility financial disincentives in the following areas
bullOvercoming the throughput incentive
bull Providing reliable means for utilities to recover energy efficiency costs
bull Providing a return on investment for efficiency programs that is competitive with the return utilities earn on new generation
bull Addressing the risk of program costs being disallowed along with other risks
bull Recognizing the full value of energy efficiency to the utility system
Chapter 3 Energy Resource Planning Processes found that there are many approaches to navigate and overcome the barriers to incorporating energy efficiency in planning processes Common themes across approaches include
bull Cost and savings data for energy efficiency measures are readily available
bull Energy capacity and non-energy benefits can justify robust energy efficiency programs
bull A clear path to funding is needed to establish a budgshyet for energy efficiency resources
bull Parties should integrate energy efficiency early in the resource planning process
Based on the eight cases examined using the Energy Efficiency Benefits Calculator in Chapter 4 Business Case for Energy Efficiency energy efficiency investments were found to provide consistently lower costs over time for both utilities and customers while providing positive net benefits to society Key findings include
bull Ratemaking policies to address utility financial barriers to energy efficiency maintain utility health while comshyprehensive cost-effective energy efficiency programs are implemented
bull The costs of energy efficiency and the reduction in utility sales volume initially raise gas or electricity bills due to slightly higher rates but efficiency gains will reduce avershyage customer bills by 2 to 9 percent over a 10-year period
bull Energy efficiency investments yielded net societal benefits on the order of hundreds of millions of dollars for each of the eight small- to medium-sized utility cases examined
Chapter 5 Rate Design found that recognizing the promotion of energy efficiency is an important factor to balance along with the numerous regulatory and legislative goals addressed during the complex rate design process Additional key findings include
bull Several rate design options exist to encourage customers to invest in efficiency and to participate in new programs that provide innovative technologies (eg smart meters)
bull Utility rates that are designed to promote sales or maxishymize stable revenues tend to lower customer incentives to adopt energy efficiency
bull Some rate forms like declining block rates or rates with large fixed charges reduce the savings that customers can attain from adopting energy efficiency
bull Appropriate rate designs should consider the unique characteristics of each customer class
bull Energy efficiency can be promoted through non-tariff mechanisms that reach customers through their utility bill
bull More effort is needed to communicate the benefits and opportunities for energy efficiency to customers regulators and utility decision-makers
Chapter 6 Energy Efficiency Program Best Practices provided a summary of best practices as well as general program key findings The best practice strategies for program planning design implementation and evaluashytion are found to be independent of the policy model in which the program operates These best practices organized by four major groupings are provided below
bull Making Energy Efficiency A Resource
mdash Require leadership at multiple levels
To create a sustainable aggressive national commitment to energy efficiency 7-5
mdash Align organizational goals
mdash Understand the efficiency resource
bull Developing An Energy Efficiency Plan
mdash Offer programs for all key customer classes
mdash Align goals with funding
mdash Use cost-effectiveness tests that are consistent with long-term planning
mdash Consider building codes and appliance standards when designing programs
mdash Plan to incorporate new technologies
mdash Consider efficiency investments to alleviate transmisshysion and distribution constraints
mdash Create a roadmap of key program components milestones and explicit energy use reduction goals
bull Designing and Delivering Energy Efficiency Programs
mdash Begin with the market in mind
mdash Leverage private sector expertise external funding and financing
mdash Start with demonstrated program modelsmdashbuild infrastructure for the future
bull Ensuring Energy Efficiency Investments Deliver Results
mdash Budget plan and initiate evaluation
mdash Develop program and project tracking systems
mdash Conduct process evaluations
mdash Conduct impact evaluations
mdash Communicate evaluation results to key stakeholders
The key program findings in Chapter 6 are drawn from the programs reviewed for this report2 These findings include
bull Energy efficiency resources are being acquired on average at about one-half the cost of typical new power sources and about one-third of the cost of natural gas supply in many casesmdashcontributing to an overall lower-cost energy system for rate-payers (EIA 2006)
bull Many energy efficiency programs are being delivered at a total program cost of about $002 to $003 per lifetime kilowatt-hour (kWh) saved and $130 to $200 per lifeshytime million British thermal units (MMBtu) saved These costs are less than the avoided costs seen in most regions of the country Funding for the majority of programs reviewed ranges from about 1 to 3 percent of electric utility revenue and 05 to 1 percent of gas utility revenue
bull Even low energy cost states such as those in the Pacific Northwest have reason to invest in energy efficiency because energy efficiency provides a low-cost reliable resource that reduces customer utility bills Energy efficienshycy also costs less than constructing new generation and provides a hedge against market fuel and environmental risks (NWPCC 2005)
bull Well-designed energy efficiency programs provide opportunities for customers of all types to adopt energy saving measures and reduce their energy bills These programs can help customers make sound energy-use decisions increase control over their energy bills and empower them to manage their energy usage Customers can experience significant savings depending on their own habits and the program offered
bull Consistently funded well-designed efficiency programs are cutting electricity and natural gas loadmdashproviding annual savings for a given program year of 015 to 1 percent of energy sales These savings typically will
2 See Chapter 6 Energy Efficiency Program Best Practices Tables 6-2 and 6-3 for more information on energy efficiency programs reviewed
7-6 National Action Plan for Energy Efficiency
accrue at this level for 10 to 15 years These programs are helping to offset 20 to 50 percent of expected energy growth in some regions without compromising end-user activity or economic well being
bull Research and development enables a continuing source of new technologies and methods for improving energy efficiency and helping customers control their energy bills
bull Many state and regional studies have found that pursuing economically attractive but as yet untapped energy efficiency could yield more than 20 percent savings in total electricity demand nationwide by 2025 These savings could help cut load growth by half or more compared to current forecasts Savings in direct use of natural gas could similarly provide a 50 percent or greater reduction in natural gas demand growth Energy savings potential varies by customer segment but there are cost-effective opportunities for all customer classes
bull Energy efficiency programs are being operated successfully across many different contexts regulated and unregulated markets utility state or third-party administration investor- publicly- and cooperatively-owned utilities and gas and electric utilities
bull Energy efficiency resources are being acquired through a variety of mechanisms including system benefits charges (SBC) energy efficiency portfolio standards (EEPS) and resource planning (or cost-of-service) efforts
bull Cost-effective energy efficiency programs exist for electricity and natural gas including programs that can be specifically targeted to reduce peak load
bull Effective models exist for delivering gas and electric energy efficiency programs to all customer classes Models might vary for some programs based on whether a utility is in the initial stages of energy efficiency programming or has been implementing programs for years
bull Energy efficiency programs projects and policies benefit from established and stable regulations clear goals and comprehensive evaluation
bull Energy efficiency programs benefit from committed program administrators and oversight authorities as well as strong stakeholder support
bull Most large-scale energy efficiency programs have improved productivity enabling job growth in the commercial and industrial sectors
bull Large-scale energy efficiency programs can reduce wholesale market prices
References
Northwest Power and Conservation Council [NWPCC] (2005 May) The 5th Northwest Electric Power and Conservation Plan lthttpwwwnwcouncilorgenergy powerplandefaulthtmgt
US Energy Information Administration [EIA] (2006) Annual Energy Outlook 2006 Washington DC
To create a sustainable aggressive national commitment to energy efficiency 7-7
Additional Guidanceon Removing theThroughput Incentive
Overview
In order to eliminate the conflict between the publicservice objectives of least-cost service on the one handand a utilityrsquos profitability objectives on the other handit is necessary to remove the throughput incentive Someoptions for removing the throughput incentive are gen-erally called decoupling because these options decoupleprofits from sales volume In its simplest form decou-pling is accomplished by periodically adjusting tariffprices so that the utilityrsquos revenues (and hence its profits)are on a total company basis held relatively constant inthe face of changes in customer consumption
This appendix explains options to address the throughputincentive by changing regulations and the way utilitiesmake money to ensure that utility net income and cover-age of fixed costs are not affected solely by sales volume
Types of Decoupling
Utilities and regulators have implemented a variety ofdifferent approaches to remove the throughput incen-tive Regardless of which approach is used a frame ofreference is created and used to compare with actualresults Periodic tariff price adjustments true up actualresults to the expected results and are critical to thedecoupling approach
bull Average revenue-per-customer This approach is oftenconsidered for utilities where their underlying costsduring the period between rate adjustments do notvary with consumption Such can be the case for a
wires-only distribution company where the majority ofinvestments are in the wires and transformers used todeliver the commodity
bull Forecast revenues over a period of time and use a bal-ancing account This approach is often considered forutilities where a significant portion of the costs (primarilyfuel) vary with consumption For these cases it mightbe best to use a price-based decoupling mechanism forthe commodity portion of electric service (which givesthe utility the incentive to reduce fuel and other vari-able costs) while using a revenue-per-customerapproach for the ldquowiresrdquo costs Alternatively regula-tors can use traditional tariffs for the commodity por-tion and apply decoupling only to the wires portion ofthe business
Sample Approach to Removing the
Throughput Incentive1
Implementing decoupling normally begins with a tradi-tional revenue requirement rate case Decoupling canalso be overlaid on existing tariffs where there is a highconfidence that those tariffs continue to represent theutilityrsquos underlying revenue requirements
Under traditional rate of return regulation
Price (Rates) = Revenue RequirementSales (test year or forecasted)
The National Action Plan for Energy Efficiency provides policy recommendations and options to support astrong commitment to cost-effective energy efficiency in the United States One policy that receives agreat deal of attention is reducing or eliminating the financial incentive for a utility to sell more energymdashthe throughput incentive Options exist to address the throughput incentive as discussed in moredetail in this appendix
To create a sustainable aggressive national commitment to energy efficiency Appendix A-1
Appendix
A
1 In this section the revenue per customer approach is discussed but can be easily adapted to a revenue forecast approach
The revenue requirement as found in the rate case will notchange again until the next rate case Note that the rev-enue requirement contains an allowance for profit anddebt coverage Despite all the effort in the rate case to cal-culate the revenue requirement what really matters afterthe rate case is the price the consumer pays for electricity
After the rate case
Actual revenues = Price Actual Sales
And
Actual Profit = Actual Revenue ndash Actual Costs
Based on the rate case ldquotest yearrdquo data an average revenue-per-customer value can then be calculated for each rate class
Revenue Requirement t0 number of customers t0 = revenue per customer (RPC)
Thus at time ldquozerordquo(t0) the companyrsquos revenues equalits number of customers multiplied by the revenues percustomer while the prices paid by customers equal therevenues to be collected divided by customersrsquo con-sumption units (usually expressed as $kW for metereddemand and $kWh for metered energy) Looking for-ward as the number of customers changes the revenueto be collected changes
Revenue Requirement tn = RPC number of customers tn
For each future period (t1 t2hellip tn ) the new revenue tobe collected is then divided by the expected consump-tion to periodically derive a new price the true-up
Price (Rates) tn = Revenue Requirement tn Sales tn
True up = Price tn ndash Price t0
Prices can also be trued-up based on deviations betweenrevenue and cost forecasts and actual results where aforecast approach is used Note that no redesign of rates
is necessary as part of decoupling Rate redesign mightbe desirable for other reasons (for more information onchanges that promote energy efficiency see Chapter 5Rate Design) and decoupling does not interfere withthose reasons
The process can be augmented by various features thatfor example explicitly factor in utility productivityexogenous events (events of financial significance outof control of the utility) or factors that might changeRPC over time
Timing of Adjustments
Rates can be adjusted monthly quarterly or annually(magnitude of any tn) By making the adjustments moreoften the magnitude of any price change is minimizedHowever frequent adjustments will impose some addi-tional administrative expense A plan that distinguishescommodity cost from other costs could have more fre-quent adjustments for more volatile commodities (ifthese are not already being dealt with by an adjustmentclause) Because the inputs used for these adjustmentsare relatively straight-forward coming directly from theutilityrsquos billing information each filing should be largelyadministrative and not subject to a significant controversyor litigation This process can be further streamlinedthrough the use of ldquodeadbandsrdquo which allow for smallchanges in either direction in revenue or profits with noadjustment in rates
Changes to Utility Incentives
With decoupling in place a prudently managed utility willreceive revenue from customers that will cover its fixedcosts including profits If routine costs go up the utility willabsorb those costs A reduction in costs produces theopportunity for additional earnings The primary driver forprofitability growth however will be the addition of newcustomers and the greatest contribution to profits will befrom customers who are more efficientmdashthat is whoseincremental costs are the lowest
Appendix A-2 National Action Plan for Energy Efficiency
An effective decoupling plan should lower utility risk tosome degree Reduced risk should be reflected in thecost of capital and for investor-owned utilities can berealized through either an increase in the debtequityratio or a decrease in the return on equity investmentFor all utilities these changes will flow through to debtratings and credit requirements
In addition decoupling can be combined with perform-ance indicators to ensure that service quality is main-tained and that cost reductions are the result of gains inefficiency and not a decline in the level of service Otherexogenous factors such as inflation taxes and economicconditions can also be combined with decoupling how-ever these factors do not address the primary purpose ofremoving the disincentive to efficiency Also if there is adistinct productivity for the electric utility as comparedwith the general economy a factor accounting for it canbe woven into the revenue per customer calculationsover time
Allocation of Weather Risk
One specific factor that is implicit in any regulatoryapproach (whether it be traditional regulation or decou-pling) is the allocation of weather risk between utilitiesand their customers Depending on the policy position ofthe regulatory agency the risk of weather changes canbe allocated to either customers or the utility This deci-sion is inherent to the rate structure even if the regula-tory body makes no cognizant choice
Under traditional regulation weather risk is usuallylargely borne by the utility which means that the utilitycan suffer shortfalls if the weather is milder than normalAt the same time it can enjoy windfalls if the weather ismore extreme than normal These scenarios resultbecause while revenues will change with weather theunderlying cost structure typically does not These situa-tions translate directly into greater earnings variabilitywhich implies a higher required cost of capital In orderto allocate the weather risk to the utility the ldquotest yearrdquo
information used to compute the base revenue-per-cus-tomer values should be weather normalized Thereafterwith each adjustment to prices the consumption datawould weather normalize as well
Potential Triggers and
Special Considerations in
Decoupling Mechanisms
Because decoupling is a different way of doing businessfor regulators and utilities it is prudent to consider off-ramps or triggers that can avoid unpleasant surprisesThe following are some of the approaches that might beappropriate to consider
bull Banding of rate adjustments To minimize the magni-tude of adjustments the decoupling mechanism couldbe premised on a ldquodead bandrdquo within which no adjust-ment would be made The effect would be to reducethe number of tariff changes and possibly but not necessarily the associated periodic filings
The plan can also cap the amount of any single rateadjustment To the extent it is based on reasonablecosts otherwise recoverable under the plan the excesscould be set aside in a regulatory account for laterrecovery
bull Banding of earnings To control the profit level of theregulated entity within some bounds earnings greaterandor less than certain limits can be shared with cus-tomers For example consider a scenario in which theearnings band is 1 percent on return on equity (eitherway) compared to the allowed return found in the mostrecent rate case If the plan would share results outsidethe band 50-50 then if the utility earns +15 percent ofthe target an amount equal to 025 percent of earnings(half the excess) is returned to consumers through a priceadjustment If the utility earns -13 percent of the targethowever an amount equal 015 percent of earnings (halfthe deficiency) is added to the price Designing this band
To create a sustainable aggressive national commitment to energy efficiency Appendix A-3
should leave the utility with ample incentive to makeand benefit from process engineering improvementsduring the plan recognizing that a subsequent ratecase might result in the benefits accruing in the longrun to consumers While the illustration is ldquosymmetri-calrdquo in practice the band can be asymmetrical in sizeand sharing proportion to assure the proper balancebetween consumer and utility interests
bull Course corrections for customer count changes majorchanges for unique major customers and largechanges in revenues-per-customer Industrial con-sumers might experience more volatility in average useper customer calculations because there are typically asmall number of these customers and they can be quitevaried For example the addition or deletion of onelarge customer (or of a work shift for a large customer)might make a significant difference in the revenue percustomer values for that class or result in appropriateshifting of revenues among customers To address thisproblem some trigger or off-ramp might be appropriateto review such unexpected and significant changesand to modify the decoupling calculation to accountfor them In some cases a new rate case might be warranted from such a change
bull Accounting for utilities whose marginal revenues percustomer are significantly different than their embeddedaverage revenue per customer If a utilityrsquos revenue percustomer has been changing rapidly over time imposi-tion of a revenue-per-customer decoupling mechanismwill have the effect of changing its profit growth pathFor example if incremental revenues per customer aregrowing rapidly decoupling will have the effect of low-ering future earnings although not necessarily belowthe companyrsquos allowed rate of return On the otherhand if incremental revenues per customer are declin-ing decoupling will have the effect of increasing futureearnings Where these trends are strong and there is adesire to make decoupling ldquoearnings neutralrdquo vis-agrave-visthe status quo earning path the revenue-per-customervalue can be tied to an upward or downward growthrate This type of adjustment is more oriented towardmaintaining neutrality than reflecting any underlyingeconomic principle Care should be taken to excluderecent growth in revenues per customer that are drivenby inefficient consumption (usually tied to the utilityhaving a pro-consumption marketing program)
Appendix A-4 National Action Plan for Energy Efficiency
Business Case Details
A business case is an analysis that shows the benefits of
energy efficiency to the utility customers and society
within an approach that can lead to actions by utilities
regulators and other stakeholders Making the business
case for energy efficiency programs requires a different
type of analysis than that required for traditional supply-
side resources Because adoption of energy efficiency
reduces utility sales and utility size traditional metrics
such as impact on rates and total earnings do not
measure the benefits of energy efficiency However by
examining other metrics such as customer bills and utility
earnings per share the benefits to all stakeholders of
adopting energy efficiency can be demonstrated These
benefits include reduced customer bills decreased cost
per unit of energy provided increased net resource sav-
ings decreased emissions and decreased reliance on
energy supplies
This appendix provides more detailed summary and inter-
pretation of results for the eight cases discussed in
Chapter 4 Business Case for Energy Efficiency All
results are from the Energy Efficiency Benefits Calculatorrsquos
interpretation tab
To help natural gas and electric utilities utility regulators and partner organizations communicate thebusiness case for energy efficiency the National Action Plan for Energy Efficiency provides an EnergyEfficiency Benefits Calculator (Calculator available at wwwepagovcleanenergyeeactionplanhtm) ThisCalculator examines the financial impact of energy efficiency on major stakeholders and was used todevelop the eight cases discussed in Chapter 4 Business Case for Energy Efficiency Additional details onthese eight cases are described in this appendix
To create a sustainable aggressive national commitment to energy efficiency Appendix B-1
Appendix
B
Overview
Case 1 Low-Growth Electric and Gas Utility
Utility Perspective
Utility Financial Health ndash Small Changes The change in utility financial health depends on whether or not there are decoupling mechanisms in place if there are shareshyholder incentives in place (for investor-owned utilities) the frequency of rate adjustments and other factors Depending on the type of utility the measure of financial health changes Investor-owned utility health is measured by return on equity (ROE) while publicly or cooperatively owned utility health is measured by cash position or debt coverage ratio
Electric Gas
Investor-Owned Utility Comparison of Return on Equity
Year
Aft
er T
ax R
OE
()
ROE - No EE
ROE - EE no Decoupling
ROE - EE and Decoupling
Target ROE
3
6
9
12
15
1 2 3 4 5 6 7 8 9 10
Investor-Owned Utility Comparison of Return on Equity
Year A
fter
Tax
RO
E (
)
ROE - No EE
ROE - EE no Decoupling
ROE - EE and Decoupling
Target ROE
3
6
9
12
15
1 2 3 4 5 6 7 8 9 10
Utility Earnings ndash Results Vary Utility earnings depend on growth rate capital investment frequency of rate adjustments and other factors If energy efficient (EE) reduces capital investment the earnings will be lower in the EE case unless shareholder incentives for EE are introduced However utility return (ROE or earnings per share) may not be affected
Utility Earnings
Year
Earn
ings
($M
M)
Earnings $MM - No EE
Earnings $MM - EE no Decoupling
Earnings $MM - EE and Decoupling
$0
$20
$40
$60
$80
$100
1 2 3 4 5 6 7 8 9 10
Utility Earnings
Year
Earn
ings
($M
M)
Earnings $MM - No EE
Earnings $MM - EE no Decoupling
Earnings $MM - EE and Decoupling
$0
$20
$40
$60
$80
$100
1 2 3 4 5 6 7 8 9 10
Appendix B-2 National Action Plan for Energy Efficiency
Customer Perspective
Customer Bills ndash Decrease In the first year customer utility bills increase because the cost of the EE program has not yet produced savings Total cusshytomer bills decline over time usually within the first three years indicating customer savings resulting from lower energy consumption
Electric Gas
Percent Change in Customer Bills
Year
Cha
nge
in B
ills
()
Change in Customer Bills () - EE no Decoupling
Change in Customer Bills () - EE and Decoupling
-21
-18
-15
-12
-9
-6
-3
0
3
6
1 2 3 4 5 6 7 8 9 10
Percent Change in Customer Bills
Year
Cha
nge
in B
ills
()
Change in Customer Bills () - EE no Decoupling
Change in Customer Bills () - EE and Decoupling
-10
-8
-6
-4
-2
0
2
4
1 2 3 4 5 6 7 8 9 10
Utility Rates ndash Mild Increase
The rates customers pay ($kWh $therm) increase when avoided costs are less than retail rates which is typically the case for most EE programs Rates increase because revenue requirements increase more quickly than sales
Comparison of Average Rate
Year
Ave
rage
Rat
e ($
kW
h)
Utility Average Rate - No EE
Utility Average Rate - EE no Decoupling
Utility Average Rate - EE and Decoupling
$010
$015
$020
$025
$030
1 2 3 4 5 6 7 8 9 10
Comparison of Average Rate
Year
Ave
rage
Rat
e ($
the
rm)
Utility Average Rate - No EE
Utility Average Rate - EE no Decoupling
Utility Average Rate - EE and Decoupling
$080
$085
$090
$095
$100
$105
$110
1 2 3 4 5 6 7 8 9 10
To create a sustainable aggressive national commitment to energy efficiency Appendix B-3
Societal Perspective
Societal Net Savings ndash Increase The net savings are the difference of total utility costs including EE program costs with EE and without EE In the first year the cost of the EE program is a cost to society Over time cumulative EE savings lead to a utility production cost savings that is greater than the EE program cost The graph shape is therefore upward sloping Total Societal Net Savings is the same with and without decoupling therefore only one line is shown
Electric Gas
Annual Total Societal Net Savings
Year
Net
Soc
ieta
l Ben
efit
($M
)
Total Societal Net Savings ($M)
-$15
-$10
-$5
$0
$5
$10
$15
$20
$25
1 2 3 4 5 6 7 8 9 10
Annual Total Societal Net Savings
Year N
et S
ocie
tal B
enefi
t ($
M)
Total Societal Net Savings ($M)
-$15
-$10
-$5
$0
$5
$10
$15
$20
$25
1 2 3 4 5 6 7 8 9 10
Total Societal Cost Per Unit ndash Declines Total cost of providing each unit of energy (MWh therm) declines over time because of the impacts of energy savings decreased peak load requirements and decreased costs during peak periods Well-designed EE programs can deliver energy at an average cost less than that of new power sources When the two lines cross the annual cost of EE equals the annual savings resulting from EE The Societal Cost and Societal Savings are the same with and without decoupling
Delivered Costs and Benefits of EE
Year
$M
Wh
Societal Cost ($MWh saved)
Societal Savings ($MWh saved)
$0
$100
$200
$300
$400
1 2 3 4 5 6 7 8 9 10
$1
$3
$5
Delivered Costs and Benefits of EE
Year
$th
erm
Societal Cost ($therm saved)
Societal Savings ($therm saved)
$0
$2
$4
$6
1 3 5 7 92 4 6 8 10
Appendix B-4 National Action Plan for Energy Efficiency
Emissions and Cost Savings ndash Increase Annual tons of emissions saved increases Emissions cost savings increases when emissions cost is monetized Emissions costs and savings are the same with and without decoupling
Electric Gas
Annual Emissions Savings
Tons
Sav
ed
0
10
20
30
40
50
60
70
1 2 3 4 5 6 7 8 9 10 0
20
40
60
80
100
120
140
160
180
200 Tons SO2 Saved Tons CO Saved Tons VOC Saved 1000 Tons CO2 Saved
Tons NO x Saved Tons PM-10 Saved
1000
Ton
s C
O2
save
d
Year
Annual Emissions Savings
Tons
Sav
ed
90
80
70
60
50
40
30
20
10
0
Tons NO x Saved Tons PM-10 Saved
Tons SO2 Saved Tons CO Saved 1000 Tons CO2 Saved
1 2 3 4 5 6 7 8 9 10 Year
Growth Offset by EE ndash Increase As EE programs ramp up energy consumption declines This comparison shows the growth with and without EE and illusshytrates the amount of EE relative to load growth Load growth and energy savings are not impacted by decoupling With load growth assumed at zero no load or percent growth offset shown
Percent Growth Offset by Energy Efficiency
GW
h
Energy Savings - EE (GWh)
Load Growth - No EE (GWh)
Growth Offset by EE ()
Year
0
200
400
600
800
1000
1200
1400
1 2 3 4 5 6 7 8 9 10 0
20
40
60
80
100
120
140
160
Percent Growth Offset by Energy Efficiency
Mcf
Year
Energy Savings - EE (Mcf)
Load Growth - No EE (Mcf)
Growth Offset by EE ()
0
1000
2000
3000
4000
5000
6000
7000
1 2 3 4 5 6 7 8 9 10
0
5
10
15
20
25
To create a sustainable aggressive national commitment to energy efficiency Appendix B-5
Peak Load Growth ndash Decrease Peak load requirements decrease because peak capacity savings are captured due to EE measures Peak load is not impacted by decoupling
Electric Gas
90
100
110
120
130
140
150
160
1 2 3 4 5 6 7 8 9 10
Comparison of Peak Load Growth
Year
Peak
Loa
d
of
Firs
t Y
r
Forecasted Growth - No EE
Forecasted Growth - EE and Decoupling
Comparison of Peak Load Growth
Year
Peak
Loa
d
of
Firs
t Y
r
Forecasted Growth - No EE
Forecasted Growth - EE and Decoupling
90
100
110
120
130
140
150
160
1 2 3 4 5 6 7 8 9 10
Appendix B-6 National Action Plan for Energy Efficiency
Case 2 High-Growth Electric and Gas Utility
Utility Perspective
Utility Financial Health ndash Small Changes The change in utility financial health depends on whether or not there are decoupling mechanisms in place if there are shareshyholder incentives in place (for investor-owned utilities) the frequency of rate adjustments and other factors Depending on the type of utility the measure of financial health changes Investor-owned utility health is measured by ROE while publicly or cooperatively owned utility health is measured by cash position or debt coverage ratio
Electric Gas
Investor-Owned Utility Comparison of Return on Equity
Year
Aft
er T
ax R
OE
()
ROE - No EE
ROE - EE no Decoupling
ROE - EE and Decoupling
Target ROE
3
6
9
12
15
1 2 3 4 5 6 7 8 9 10
Investor-Owned Utility Comparison of Return on Equity
Year
Aft
er T
ax R
OE
()
ROE - No EE
ROE - EE no Decoupling
ROE - EE and Decoupling
Target ROE
3
6
9
12
15
1 2 3 4 5 6 7 8 9 10
Utility Earnings ndash Results Vary Utility earnings depend on growth rate capital investment frequency of rate adjustments and other factors If EE reduces capital investment the earnings will be lower in the EE case unless shareholder incentives for EE are introduced However utility return (ROE or earnings per share) may not be affected
Utility Earnings
Year
Earn
ings
($M
M)
Earnings $MM - No EE
Earnings $MM - EE no Decoupling
Earnings $MM - EE and Decoupling
$0
$20
$40
$60
$80
$100
1 2 3 4 5 6 7 8 9 10
Utility Earnings
Year
Earn
ings
($M
M)
Earnings $MM - No EE
Earnings $MM - EE no Decoupling
Earnings $MM - EE and Decoupling
$0
$20
$40
$60
$80
$100
1 2 3 4 5 6 7 8 9 10
To create a sustainable aggressive national commitment to energy efficiency Appendix B-7
Customer Perspective
Customer Bills ndash Decrease In the first year customer utility bills increase because the cost of the EE program has not yet produced savings Total cusshytomer bills decline over time usually within the first three years indicating customer savings resulting from lower energy consumption
Electric Gas
Percent Change in Customer Bills
Year
Cha
nge
in B
ills
()
Change in Customer Bills () - EE no Decoupling
Change in Customer Bills () - EE and Decoupling
-21
-18
-15
-12
-9
-6
-3
0
3
6
1 2 3 4 5 6 7 8 9 10
Percent Change in Customer Bills
Year
Cha
nge
in B
ills
()
Change in Customer Bills () - EE no Decoupling
Change in Customer Bills () - EE and Decoupling
-10
-8
-6
-4
-2
0
2
4
1 2 3 4 5 6 7 8 9 10
Utility Rates ndash Mild Increase The rates customers pay ($kWh $therm) increase when avoided costs are less than retail rates which is typically the case for most EE programs Rates increase because revenue requirements increase more quickly than sales
Comparison of Average Rate
Year
Ave
rage
Rat
e ($
kW
h)
Utility Average Rate - No EE
Utility Average Rate - EE no Decoupling
Utility Average Rate - EE and Decoupling
$010
$015
$020
$025
$030
1 2 3 4 5 6 7 8 9 10
Comparison of Average Rate
Year
Ave
rage
Rat
e ($
the
rm)
Utility Average Rate - No EE
Utility Average Rate - EE no Decoupling
Utility Average Rate - EE and Decoupling
$080
$085
$090
$095
$100
$105
$110
1 2 3 4 5 6 7 8 9 10
Appendix B-8 National Action Plan for Energy Efficiency
Societal Perspective
Societal Net Savings ndash Increase The net savings are the difference of total utility costs including EE program costs with EE and without EE In the first year the cost of the EE program is a cost to society Over time cumulative EE savings lead to a utility production cost savings that is greater than the EE program cost The graph shape is therefore upward sloping Total Societal Net Savings is the same with and without decoupling therefore only one line is shown
Electric Gas
Annual Total Societal Net Savings
Year
Net
Soc
ieta
l Ben
efit
($M
)
Total Societal Net Savings ($M)
-$15
-$10
-$5
$0
$5
$10
$15
$20
$25
1 2 3 4 5 6 7 8 9 10
Annual Total Societal Net Savings
Net
Soc
ieta
l Ben
efit
($M
)
Total Societal Net Savings ($M)
Year
$-15
$-10
$-5
$0
$5
$10
$15
$20
$25
1 2 3 4 5 6 7 8 9 10
Total Societal Cost Per Unit ndash Declines Total cost of providing each unit of energy (MWh therm) declines over time because of the impacts of energy savings decreased peak load requirements and decreased costs during peak periods Well-designed EE programs can deliver energy at an average cost less than that of new power sources When the two lines cross the annual cost of EE equals the annual savings resulting from EE The Societal Cost and Societal Savings are the same with and without decoupling
Delivered Costs and Benefits of EE
Year
$M
Wh
$0
$100
$200
$300
$400
1 2 3 4 5 6 7 8 9 10
Societal Cost ($MWh saved)
Societal Savings ($MWh saved)
Delivered Costs and Benefits of EE
Year
$th
erm
Societal Cost ($therm saved)
Societal Savings ($therm saved)
$0
$1
$2
$3
$4
$5
$6
1 3 5 7 92 4 6 8 10
To create a sustainable aggressive national commitment to energy efficiency Appendix B-9
Emissions and Cost Savings ndash Increase Annual tons of emissions saved increases Emissions cost savings increases when emissions cost is monetized Emissions costs and savings are the same with and without decoupling
Electric Gas
Annual Emissions Savings
Tons
Sav
ed
0
10
20
30
40
50
60
70
1 2 3 4 5 6 7 8 9 10 0
20
40
60
80
100
120
140
160
180
200 Tons SO2 Saved Tons CO Saved Tons VOC Saved 1000 Tons CO2 Saved
Tons NO x Saved Tons PM-10 Saved
1000
Ton
s C
O2
save
d
Year
7 8 9
Annual Emissions Savings
Tons
Sav
ed
Tons SO2 Saved Tons CO Saved 1000 Tons CO2 Saved
Tons NO x Saved Tons PM-10 Saved
0
10
20
30
40
50
60
70
80
90
1 2 3 4 5 6 10
Year
Growth Offset by EE ndash Increase As EE programs ramp up energy consumption declines This comparison shows the growth with and without EE and illusshytrates the amount of EE relative to load growth Load growth and energy savings are not impacted by decoupling With load growth assumed at zero no load or percent growth offset shown
Percent Growth Offset by Energy Efficiency
Energy Savings - EE (GWh)
Load Growth - No EE (GWh)
Growth Offset by EE ()
GW
h
0
200
400
600
800
1000
1200
1400
1 2 3 4 5 6 7 8 9 10
0
20
40
60
80
100
120
140
160
Year
Percent Growth Offset by Energy Efficiency
Energy Savings - EE (Mcf)
Load Growth - No EE (Mcf)
Growth Offset by EE ()
Mcf
0
1000
2000
3000
4000
5000
6000
7000
1 2 3 4 5 6 7 8 9 10 0
5
10
15
20
25
Year
Appendix B-10 National Action Plan for Energy Efficiency
Peak Load Growth ndash Decrease Peak load requirements decrease because peak capacity savings are captured due to EE measures Peak load is not impacted by decoupling
Electric Gas
90
100
110
120
130
140
150
160
1 2 3 4 5 6 7 8 9 10
Comparison of Peak Load Growth
Year
Peak
Loa
d
of
Firs
t Y
r
Forecasted Growth - No EE
Forecasted Growth - EE and Decoupling
Comparison of Peak Load Growth
Year
Peak
Loa
d
of
Firs
t Y
rForecasted Growth - No EE
Forecasted Growth - EE and Decoupling
90
100
110
120
130
140
150
160
1 2 3 4 5 6 7 8 9 10
To create a sustainable aggressive national commitment to energy efficiency Appendix B-11
Case 3 Low-Growth with Power Plant Deferral
Utility Perspective
Utility Financial Health ndash Small Changes The change in utility financial health depends on whether or not there are decoupling mechanisms in place if there are shareholder incentives in place (for investor-owned utilities) the frequency of rate adjustments and other factors Depending on the type of utility the measure of financial health changes Investor-owned utility health is measured by ROE while publicly or cooperatively owned utility health is measured by cash position or debt coverage ratio
Investor-Owned Utility Comparison of Return on Equity
Aft
er T
ax R
OE
()
ROE - No EE
ROE - EE no Decoupling
ROE - EE and Decoupling
Target ROE
Year
3
6
9
12
15
1 2 3 4 5 6 7 8 9 10
Utility Earnings ndash Results Vary Utility earnings depend on growth rate capital investment frequency of rate adjustments and other factors If EE reduces capital investment the earnings will be lower in the EE case unless shareholder incentives for EE are introduced However utility return (ROE or earnings per share) may not be affected
Utility Earnings
Year
Earn
ings
($M
M)
Earnings $MM - No EE
Earnings $MM - EE no Decoupling
Earnings $MM - EE and Decoupling
$0
$20
$40
$60
$80
$100
1 2 3 4 5 6 7 8 9 10
Appendix B-12 National Action Plan for Energy Efficiency
Customer Perspective
Customer Bills ndash Decrease In the first year customer utility bills increase because the cost of the EE program has not yet produced savings Total customer bills decline over time usually within the first three years indicating customer savings resulting from lower energy consumption
Percent Change in Customer Bills
6
Societal Perspective
Societal Net Savings ndash Increase The net savings are the difference of total utility costs including EE program costs with EE and without EE In the first year the cost of the EE program is a cost to society Over time cumulative EE savings lead to a utility production cost savings that is greater than the EE program cost The graph shape is therefore upward sloping Total Societal Net Savings is the same with and without decoupling thereshyfore only one line is shown
Cha
nge
in B
ills
()
3
0
-3
-6
-9
-12
-15
-18
-21
Annual Total Societal Net Savings
Year
Net
Soc
ieta
l Ben
efit
($M
)
Total Societal Net Savings ($M)
-$600
-$400
-$200
$0
$200
$400
$600
1 2 3 4 5 6 7 8 9 10
1 2 3 4 5 6 7 8 9 10
Year
Change in Customer Bills () - EE no Decoupling
Change in Customer Bills () - EE and Decoupling
Utility Rates ndash Mild Increase The rates customers pay ($kWh) increase when avoided costs are less than retail rates which is typically the case for most EE programs Rates increase because revenue requireshyments increase more quickly than sales
Comparison of Average Rate
Year
Ave
rage
Rat
e ($
kW
h)
Utility Average Rate - No EE
Utility Average Rate - EE no Decoupling
Utility Average Rate - EE and Decoupling
$010
$015
$020
$025
$030
1 2 3 4 5 6 7 8 9 10
To create a sustainable aggressive national commitment to energy efficiency Appendix B-13
Total Societal Cost Per Unit ndash Declines Total cost of providing each unit of energy (MWh) declines over time because of the impacts of energy savings decreased peak load requirements and decreased costs during peak periods Well-designed EE programs can deliver energy at an average cost less than that of new power sources Societal savings increase when an infrashystructure project is delayed and then decrease when built When the two lines cross the annual cost of EE equals the annual savings resulting from EE
Delivered Costs and Benefits of EE
Year
$M
Wh
Societal Cost ($MWh saved)
Societal Savings ($MWh saved)
-$5000
-$2500
$0
$2500
$5000
$7500
$10000
1 2 3 4 5 6 7 8 9 10
Growth Offset by EE ndash Increase As EE programs ramp up energy consumption declines This comparison shows the growth with and without EE and illustrates the amount of EE relative to load growth Load growth and energy savings are not impacted by decoupling With load growth assumed at zero no load or percent growth offset shown
Percent Growth Offset by Energy Efficiency
GW
h Energy Savings - EE (GWh)
Load Growth - No EE (GWh)
Growth Offset by EE ()
0
200
400
600
800
1000
1200
1400
1 2 3 4 5 6 7 8 9 10 0
20
40
60
80
100
120
140
160
Year
Emissions and Cost Savings - Increase Peak Load Growth ndash Decrease Annual tons of emissions saved increases Emissions cost Peak load requirements decrease because peak capacitysavings increases when emissions cost is monetized savings are captured due to EE measures Peak load is notEmissions costs and savings are the same with and with- impacted by decouplingout decoupling
90
100
110
120
130
140
150
160
1 2 3 4 5 6 7 8 9 10
Comparison of Peak Load Growth
Year
Peak
Loa
d
of
Firs
t Y
r
Forecasted Growth - No EE
Forecasted Growth - EE and Decoupling
Annual Emissions Savings
Tons
Sav
ed
0
10
20
30
40
50
60
70
1 2 3 4 5 6 7 8 9 10 0
20
40
60
80
100
120
140
160
180
200 Tons SO2 Saved Tons CO Saved Tons VOC Saved 1000 Tons CO2 Saved
Tons NO x Saved Tons PM-10 Saved
1000
Ton
s C
O2
save
d
Year
Appendix B-14 National Action Plan for Energy Efficiency
Case 4 High-Growth With Power Plant Deferral
Utility Perspective
Utility Financial Health ndash Small Changes The change in utility financial health depends on whether or not there are decoupling mechanisms in place if there are shareholder incentives in place (for investor-owned utilities) the frequency of rate adjustments and other factors Depending on the type of utility the measure of financial health changes Investor-owned utility health is measured by ROE while publicly or cooperatively owned utility health is measured by cash position or debt coverage ratio
Investor-Owned Utility Comparison of Return on Equity
Year
Aft
er T
ax R
OE
()
ROE - No EE
ROE - EE no Decoupling
ROE - EE and Decoupling
Target ROE
3
6
9
12
15
1 2 3 4 5 6 7 8 9 10
Utility Earnings ndash Results Vary Utility earnings depend on growth rate capital investment frequency of rate adjustments and other factors If EE reduces capital intvestment the earnings will be lower in the EE case unless shareholder incentives for EE are introshyduced However utility return (ROE or earnings per share) may not be affected
Utility Earnings
YearEa
rnin
gs ($
MM
)
Earnings $MM - No EE
Earnings $MM - EE no Decoupling
Earnings $MM - EE and Decoupling
$0
$20
$40
$60
$80
$100
1 2 3 4 5 6 7 8 9 10
To create a sustainable aggressive national commitment to energy efficiency Appendix B-15
Customer Perspective
Customer Bills ndash Decrease In the first year customer utility bills increase because the cost of the EE program has not yet produced savings Total customer bills decline over time usually within the first three years indicating customer savings resulting from lower energy consumption
Percent Change in Customer Bills
Year
Cha
nge
in B
ills
()
Change in Customer Bills () - EE no Decoupling
Change in Customer Bills () - EE and Decoupling
-21
-18
-15
-12
-9
-6
-3
0
3
6
1 2 3 4 5 6 7 8 9 10
Utility Rates ndash Mild Increase The rates customers pay ($kWh) increase when avoided costs are less than retail rates which is typically the case for most EE programs Rates increase because revenue requireshyments increase more quickly than sales
Societal Perspective
Societal Net Savings ndash Increase The net savings are the difference of total utility costs including EE program costs with EE and without EE In the first year the cost of the EE program is a cost to society Over time cumulative EE savings lead to a utility production cost savings that is greater than the EE program cost The graph shape is therefore upward sloping Total Societal Net Savings is the same with and without decoupling thereshyfore only one line is shown
Annual Total Societal Net Savings
Year N
et S
ocie
tal B
enef
it ($
M)
Total Societal Net Savings ($M)
$200
$400
$600
1 2 3 4 5 6 7 8 9 10
$0
-$200
-$400
-$600
Comparison of Average Rate
Year
Ave
rage
Rat
e ($
kW
h)
Utility Average Rate - No EE
Utility Average Rate - EE no Decoupling
Utility Average Rate - EE and Decoupling
$010
$015
$020
$025
$030
1 2 3 4 5 6 7 8 9 10
Appendix B-16 National Action Plan for Energy Efficiency
Total Societal Cost Per Unit ndash Declines Total cost of providing each unit of energy (MWh) declines over time because of the impacts of energy savings decreased peak load requirements and decreased costs during peak periods Well-designed EE programs can deliver energy at an average cost less than that of new power sources Societal savings increase when an infrashystructure project is delayed and then decrease when built When the two lines cross the annual cost of EE equals the annual savings resulting from EE
Delivered Costs and Benefits of EE
$M
Wh
Societal Cost ($MWh saved)
Societal Savings ($MWh saved)
Year
-$5000
-$2500
$0
$2500
$5000
$7500
$10000
1 2 3 4 5 6 7 8 9 10
Emissions and Cost Savings ndash Increase Annual tons of emissions saved increases Emissions cost savings increases when emissions cost is monetized Emissions costs and savings are the same with and without decoupling
Annual Emissions Savings
Tons
Sav
ed
0
10
20
30
40
50
60
70
1 2 3 4 5 6 7 8 9 10 0
20
40
60
80
100
120
140
160
180
200 Tons SO2 Saved Tons CO Saved Tons VOC Saved 1000 Tons CO2 Saved
Tons NO x Saved Tons PM-10 Saved
1000
Ton
s C
O2
save
d
Year
Growth Offset by EE ndash Increase As EE programs ramp up energy consumption declines This comparison shows the growth with and without EE and illustrates the amount of EE relative to load growth Load growth and energy savings are not impacted by decoupling With load growth assumed at zero no load or percent growth offset shown
Percent Growth Offset by Energy Efficiency
GW
h Energy Savings - EE (GWh)
Load Growth - No EE (GWh)
Growth Offset by EE ()
0
200
400
600
800
1000
1200
1400
1 2 3 4 5 6 7 8 9 10 0
20
40
60
80
100
120
140
160
Year
Peak Load Growth ndash Decrease Peak load requirements decrease because peak capacity savshyings are captured due to EE measures Peak load is not impacted by decoupling
90
100
110
120
130
140
150
160
1 2 3 4 5 6 7 8 9 10
Comparison of Peak Load Growth
Year
Peak
Loa
d
of
Firs
t Y
r
Forecasted Growth - No EE
Forecasted Growth - EE and Decoupling
To create a sustainable aggressive national commitment to energy efficiency Appendix B-17
Case 5 Vertically Integrated Utility
Utility Perspective
Utility Financial Health ndash Small Changes The change in utility financial health depends on whether or not there are decoupling mechanisms in place if there are shareholder incentives in place (for investor-owned utilities) the frequency of rate adjustments and other factors Depending on the type of utility the measure of financial health changes Investor-owned utility health is measured by ROE while publicly or cooperatively owned utility health is measured by cash position or debt coverage ratio
Investor-Owned Utility Comparison of Return on Equity
Year
Aft
er T
ax R
OE
()
ROE - No EE
ROE - EE no Decoupling
ROE - EE and Decoupling
Target ROE
3
6
9
12
15
1 2 3 4 5 6 7 8 9 10
Utility Earnings ndash Results Vary Utility earnings depend on growth rate capital investment frequency of rate adjustments and other factors If EE reduces capital investment the earnings will be lower in the EE case unless shareholder incentives for EE are introduced However utility return (ROE or earnings per share) may not be affected
Utility Earnings
Year
Earn
ings
($M
M)
Earnings $MM - No EE
Earnings $MM - EE no Decoupling
Earnings $MM - EE and Decoupling
$0
$20
$40
$60
$80
$100
1 2 3 4 5 6 7 8 9 10
Appendix B-18 National Action Plan for Energy Efficiency
Customer Perspective
Customer Bills ndash Decrease In the first year customer utility bills increase because the cost of the EE program has not yet produced savings Total customer bills decline over time usually within the first three years indicating customer savings resulting from lower energy consumption
Percent Change in Customer Bills
6
3
Societal Perspective
Societal Net Savings ndash Increase The net savings are the difference of total utility costs including EE program costs with EE and without EE In the first year the cost of the EE program is a cost to society Over time cumulative EE savings lead to a utility production cost savings that is greater than the EE program cost The graph shape is therefore upward sloping Total Societal Net Savings is the same with and without decoupling thereshyfore only one line is shown
Annual Total Societal Net Savings
Year
Net
Soc
ieta
l Ben
efit
($M
)
Total Societal Net Savings ($M)
-$15
-$10
-$5
$0
$5
$10
$15
$20
$25
1 2 3 4 5 6 7 8 9 10
1 2 3 4 5 6 7 8 9 10
Cha
nge
in B
ills
() 0
-3
-6
-9
-12
-15
-18
-21
Year
Change in Customer Bills () - EE no Decoupling
Change in Customer Bills () - EE and Decoupling
Utility Rates ndash Mild Increase The rates customers pay ($kWh) increase when avoided costs are less than retail rates which is typically the case for most EE programs Rates increase because revenue requireshyments increase more quickly than sales
Comparison of Average Rate
Year
Ave
rage
Rat
e ($
kW
h)
Utility Average Rate - No EE
Utility Average Rate - EE no Decoupling
Utility Average Rate - EE and Decoupling
$010
$015
$020
$025
$030
1 2 3 4 5 6 7 8 9 10
To create a sustainable aggressive national commitment to energy efficiency Appendix B-19
Total Societal Cost Per Unit ndash Declines Total cost of providing each unit of energy (MWh) declines over time because of the impacts of energy savings decreased peak load requirements and decreased costs during peak periods Well-designed EE programs can deliver energy at an average cost less than that of new power sources When the two lines cross the annual cost of EE equals the annual savings resulting from EE The Societal Cost and Societal Savings are the same with and without decoupling
Delivered Costs and Benefits of EE
Year
$M
Wh
Societal Cost ($MWh saved)
Societal Savings ($MWh saved)
$0
$100
$200
$300
$400
1 2 3 4 5 6 7 8 9 10
1401200
1201000
100 800
80 600
60
400 40
200 20
0
1 2 3 4 5 6 7 8 9 10 0
Year
Energy Savings - EE (GWh)
Load Growth - No EE (GWh)
Growth Offset by EE ()
Peak Load Growth ndash Decrease Peak load requirements decrease because peak capacity savings are captured due to EE measures Peak load is not impacted by decoupling
Growth Offset by EE ndash Increase As EE programs ramp up energy consumption declines This comparison shows the growth with and without EE and illustrates the amount of EE relative to load growth Load growth and energy savings are not impacted by decoupling With load growth assumed at zero no load or percent growth offset shown
Percent Growth Offset by Energy Efficiency
1601400
GW
h
Emissions and Cost Savings ndash Increase Annual tons of emissions saved increases Emissions cost savings increases when emissions cost is monetized Emissions costs and savings are the same with and withshyout decoupling
Annual Emissions Savings
Tons
Sav
ed
0
10
20
30
40
50
60
70
1 2 3 4 5 6 7 8 9 10 0
20
40
60
80
100
120
140
160
180
200 Tons SO2 Saved Tons CO Saved Tons VOC Saved 1000 Tons CO2 Saved
Tons NO x Saved Tons PM-10 Saved
1000
Ton
s C
O2
save
d
Year
90
100
110
120
130
140
150
160
1 2 3 4 5 6 7 8 9 10
Comparison of Peak Load Growth
Year
Peak
Loa
d
of
Firs
t Y
r
Forecasted Growth - No EE
Forecasted Growth - EE and Decoupling
Appendix B-20 National Action Plan for Energy Efficiency
Case 6 Restructured Delivery-Only Utility
Utility Perspective
Utility Financial Health ndash Small Changes The change in utility financial health depends on whether or not there are decoupling mechanisms in place if there are shareholder incentives in place (for investor-owned utilities) the frequency of rate adjustments and other factors Depending on the type of utility the measure of financial health changes Investor-owned utility health is measured by ROE while publicly or cooperatively owned utility health is measured by cash position or debt coverage ratio
Investor-Owned Utility Comparison of Return on Equity
Year
Aft
er T
ax R
OE
()
ROE - No EE
ROE - EE no Decoupling
ROE - EE and Decoupling
Target ROE
3
6
9
12
15
1 2 3 4 5 6 7 8 9 10
Utility Earnings ndash Results Vary Utility earnings depend on growth rate capital investment frequency of rate adjustments and other factors If EE reduces capital investment the earnings will be lower in the EE case unless shareholder incentives for EE are introduced However utility return (ROE or earnings per share) may not be affected
Utility Earnings
Earn
ings
($M
M)
Earnings $MM - No EE
Earnings $MM - EE no Decoupling
Earnings $MM - EE and Decoupling
Year
$0
$20
$40
$60
$80
$100
1 2 3 4 5 6 7 8 9 10
To create a sustainable aggressive national commitment to energy efficiency Appendix B-21
Customer Perspective
Customer Bills ndash Decrease In the first year customer utility bills increase because the cost of the EE program has not yet produced savings Total customer bills decline over time usually within the first three years indicating customer savings resulting from lower energy consumption
Percent Change in Customer Bills
Year
Cha
nge
in B
ills
()
Change in Customer Bills () - EE no Decoupling
Change in Customer Bills () - EE and Decoupling
-21
-18
-15
-12
-9
-6
-3
0
3
6
1 2 3 4 5 6 7 8 9 10
Utility Rates ndash Mild Increase The rates customers pay ($kWh) increase when avoided costs are less than retail rates which is typically the case for most EE programs Rates increase because revenue requireshyments increase more quickly than sales
Societal Perspective
Societal Net Savings ndash Increase The net savings are the difference of total utility costs including EE program costs with EE and without EE In the first year the cost of the EE program is a cost to society Over time cumulative EE savings lead to a utility production cost savings that is greater than the EE program cost The graph shape is therefore upward sloping Total Societal Net Savings is the same with and without decoupling thereshyfore only one line is shown
Annual Total Societal Net Savings
Year N
et S
ocie
tal B
enefi
t ($
M)
Total Societal Net Savings ($M)
-$15
-$10
-$5
$0
$5
$10
$15
$20
$25
1 2 3 4 5 6 7 8 9 10
Comparison of Average Rate
Year
Ave
rage
Rat
e ($
kW
h)
Utility Average Rate - No EE
Utility Average Rate - EE no Decoupling
Utility Average Rate - EE and Decoupling
$010
$015
$020
$025
$030
1 2 3 4 5 6 7 8 9 10
Appendix B-22 National Action Plan for Energy Efficiency
Total Societal Cost Per Unit ndash Declines Total cost of providing each unit of energy (MWh) declines over time because of the impacts of energy savings decreased peak load requirements and decreased costs during peak periods Well-designed EE programs can deliver energy at an average cost less than that of new power sources When the two lines cross the annual cost of EE equals the annual savings resulting from EE The Societal Cost and Societal Savings are the same with and without decoupling
Delivered Costs and Benefits of EE
$400
Growth Offset by EE ndash Increase As EE programs ramp up energy consumption declines This comparison shows the growth with and without EE and illustrates the amount of EE relative to load growth Load growth and energy savings are not impacted by decoupling With load growth assumed at zero no load or percent growth offset shown
Percent Growth Offset by Energy Efficiency
160
140
1400
1200
1201000
100 800
80
Peak Load Growth ndash Decrease Peak load requirements decrease because peak capacity savings are captured due to EE measures Peak load is not impacted by decoupling
$300
Emissions and Cost Savings ndash Increase Annual tons of emissions saved increases Emissions cost savings increases when emissions cost is monetized
$200
200
GW
h
600 60
400 40
$M
Wh
20
$100 0
1 2 3 4 5 6 7 8 9 10
$0
0
Year 1 2 3 4 5 6 7 8 9 10
Energy Savings - EE (GWh)Year Load Growth - No EE (GWh)
Growth Offset by EE ()Societal Cost ($MWh saved)
Societal Savings ($MWh saved)
Comparison of Peak Load Growth
Year
Peak
Loa
d
of
Firs
t Y
r
Forecasted Growth - No EE
Forecasted Growth - EE and Decoupling
90
100
110
120
130
140
150
160
1 2 3 4 5 6 7 8 9 10
Emissions costs and savings are the same with and withshyout decoupling
Annual Emissions Savings
Tons
Sav
ed
0
10
20
30
40
50
60
70
1 2 3 4 5 6 7 8 9 10 0
20
40
60
80
100
120
140
160
180
200 Tons SO2 Saved Tons CO Saved Tons VOC Saved 1000 Tons CO2 Saved
Tons NO x Saved Tons PM-10 Saved
1000
Ton
s C
O2
save
d
Year
To create a sustainable aggressive national commitment to energy efficiency Appendix B-23
Case 7 Electric Publicly and Cooperatively Owned Debt Coverage Ratio
Utility Perspective
Utility Financial Health ndash Small Changes The change in utility financial health depends on whether or not there are decoupling mechanisms in place if there are shareholder incentives in place (for investor-owned utilities) the frequency of rate adjustments and other factors Depending on the type of utility the measure of financial health changes Investor-owned utility health is measured by ROE while publicly or cooperatively owned utility health is measured by cash position or debt coverage ratio
Public PowerCooperative Debt Coverage Ratio
Year
Deb
t C
over
age
Ratio
Debt Coverage Ratio - No EE
Debt Coverage Ratio - EE no Decoupling
Debt Coverage Ratio - EE and Decoupling
100
150
200
250
1 3 5 7 92 4 6 8 10
Utility Earnings ndash Results Vary Utility earnings depend on growth rate capital investment frequency of rate adjustments and other factors If EE reduces capital investment the earnings will be lower in the EE case unless shareholder incentives for EE are introduced However utility return (ROE or earnings per share) may not be affected
Utility Earnings
Earn
ings
($M
M)
Earnings $MM - No EE
Earnings $MM - EE no Decoupling
Earnings $MM - EE and Decoupling
$0
$20
$40
$60
$80
$100
1 2 3 4 5 6 7 8 9 10
Year
Appendix B-24 National Action Plan for Energy Efficiency
Customer Perspective
Customer Bills ndash Decrease In the first year customer utility bills increase because the cost of the EE program has not yet produced savings Total customer bills decline over time usually within the first three years indicating customer savings resulting from lower energy consumption
Percent Change in Customer Bills
Year
Cha
nge
in B
ills
()
Change in Customer Bills () - EE no Decoupling
Change in Customer Bills () - EE and Decoupling
-21
-18
-15
-12
-9
-6
-3
0
3
6
1 2 3 4 5 6 7 8 9 10
Utility Rates ndash Mild Increase The rates customers pay ($kWh) increase when avoided costs are less than retail rates which is typically the case for most EE programs Rates increase because revenue requireshyments increase more quickly than sales
Societal Perspective
Societal Net Savings ndash Increase The net savings are the difference of total utility costs including EE program costs with EE and without EE In the first year the cost of the EE program is a cost to society Over time cumulative EE savings lead to a utility production cost savings that is greater than the EE program cost The graph shape is therefore upward sloping Total Societal Net Savings is the same with and without decoupling thereshyfore only one line is shown
Annual Total Societal Net Savings
Year
Net
Soc
ieta
l Ben
efit
($M
)
Total Societal Net Savings ($M)
-$15
-$10
-$5
$0
$15
$20
$25
1 2 3 4 5 6 7 8 9 10
$5
$10
Comparison of Average Rate
Year
Ave
rage
Rat
e ($
kW
h)
Utility Average Rate - No EE
Utility Average Rate - EE no Decoupling
Utility Average Rate - EE and Decoupling
$010
$015
$020
$025
$030
1 2 3 4 5 6 7 8 9 10
To create a sustainable aggressive national commitment to energy efficiency Appendix B-25
Total Societal Cost Per Unit ndash Declines Total cost of providing each unit of energy (MWh) declines over time because of the impacts of energy savings decreased peak load requirements and decreased costs during peak periods Well-designed EE programs can deliver energy at an average cost less than that of new power sources When the two lines cross the annual cost of EE equals the annual savings resulting from EE The Societal Cost and Societal Savings are the same with and without decoupling
Delivered Costs and Benefits of EE
Year
$M
Wh
Societal Cost ($MWh saved)
Societal Savings ($MWh saved)
$0
$100
$200
$300
$400
1 2 3 4 5 6 7 8 9 10
1401200
1201000
100 800
80 600
60
400 40
200 20
00 1 2 3 4 5 6 7 8 9 10
Year
Energy Savings - EE (GWh)
Load Growth - No EE (GWh)
Growth Offset by EE ()
Peak Load Growth ndash Decrease Peak load requirements decrease because peak capacity savings are captured due to EE measures Peak load is not impacted by decoupling
Growth Offset by EE ndash Increase As EE programs ramp up energy consumption declines This comparison shows the growth with and without EE and illustrates the amount of EE relative to load growth Load growth and energy savings are not impacted by decoupling With load growth assumed at zero no load or percent growth offset shown
Percent Growth Offset by Energy Efficiency
1601400
GW
h
Emissions and Cost Savings ndash Increase Annual tons of emissions saved increases Emissions cost savings increases when emissions cost is monetized Emissions costs and savings are the same with and withshyout decoupling
Annual Emissions Savings
Tons
Sav
ed
0
10
20
30
40
50
60
70
1 2 3 4 5 6 7 8 9 10 0
20
40
60
80
100
120
140
160
180
200 Tons SO2 Saved Tons CO Saved Tons VOC Saved 1000 Tons CO2 Saved
Tons NO x Saved Tons PM-10 Saved
1000
Ton
s C
O2
save
d
Year
Comparison of Peak Load Growth
Year
Peak
Loa
d
of
Firs
t Y
r
Forecasted Growth - No EE
Forecasted Growth - EE and Decoupling
90
100
110
120
130
140
150
160
1 2 3 4 5 6 7 8 9 10
Appendix B-26 National Action Plan for Energy Efficiency
Case 8 Electric Publicly and Cooperatively Owned Cash Position
Utility Perspective
Utility Financial Health ndash Small Changes The change in utility financial health depends on whether or not there are decoupling mechanisms in place if there are shareholder incentives in place (for investor-owned utilities) the frequency of rate adjustments and other factors Depending on the type of utility the measure of financial health changes Investor-owned utility health is measured by ROE while publicly or cooperatively owned utility health is measured by cash position or debt coverage ratio
Cash Position at End of Year
Year
End
of Y
ear
Cas
h ($
MM
)
$40
$50
$60
$70
$80
1 2 3 4 5 6 7 8 9 10
Cash Position - No EE
Cash Position - EE no Decoupling
Cash Position - EE and Decoupling
Utility Earnings ndash Results Vary Utility earnings depend on growth rate capital investment frequency of rate adjustments and other factors If EE reduces capital investment the earnings will be lower in the EE case unless shareholder incentives for EE are introduced However utility return (ROE or earnings per share) may not be affected
Utility Earnings
Earn
ings
($M
M)
Earnings $MM - No EE
Earnings $MM - EE no Decoupling
Earnings $MM - EE and Decoupling
$0
$20
$40
$60
$80
$100
1 2 3 4 5 6 7 8 9 10
Year
To create a sustainable aggressive national commitment to energy efficiency Appendix B-27
Customer Perspective
Customer Bills ndash Decrease In the first year customer utility bills increase because the cost of the EE program has not yet produced savings Total customer bills decline over time usually within the first three years indicating customer savings resulting from lower energy consumption
Percent Change in Customer Bills
Year
Cha
nge
in B
ills
()
Change in Customer Bills () - EE no Decoupling
Change in Customer Bills () - EE and Decoupling
-21
-18
-15
-12
-9
-6
-3
0
3
6
1 2 3 4 5 6 7 8 9 10
Utility Rates ndash Mild Increase The rates customers pay ($kWh) increase when avoided costs are less than retail rates which is typically the case for most EE programs Rates increase because revenue requireshyments increase more quickly than sales
Societal Perspective
Societal Net Savings ndash Increase The net savings are the difference of total utility costs including EE program costs with EE and without EE In the first year the cost of the EE program is a cost to society Over time cumulative EE savings lead to a utility production cost savings that is greater than the EE program cost The graph shape is therefore upward sloping Total Societal Net Savings is the same with and without decoupling thereshyfore only one line is shown
Annual Total Societal Net Savings
Year N
et S
ocie
tal B
enefi
t ($
M)
Total Societal Net Savings ($M)
-$15
-$10
-$5
$0
$15
$20
$25
1 2 3 4 5 6 7 8 9 10
$5
$10
Comparison of Average Rate
Year
Ave
rage
Rat
e ($
kW
h)
Utility Average Rate - No EE
Utility Average Rate - EE no Decoupling
Utility Average Rate - EE and Decoupling
$010
$015
$020
$025
$030
1 2 3 4 5 6 7 8 9 10
Appendix B-28 National Action Plan for Energy Efficiency
Total Societal Cost Per Unit ndash Declines Total cost of providing each unit of energy (MWh) declines over time because of the impacts of energy savings decreased peak load requirements and decreased costs during peak periods Well-designed EE programs can deliver energy at an average cost less than that of new power sources When the two lines cross the annual cost of EE equals the annual savings resulting from EE The Societal Cost and Societal Savings are the same with and without decoupling
Growth Offset by EE ndash Increase As EE programs ramp up energy consumption declines This comparison shows the growth with and without EE and illustrates the amount of EE relative to load growth Load growth and energy savings are not impacted by decoupling With load growth assumed at zero no load or percent growth offset shown
Percent Growth Offset by Energy Efficiency
GW
h
Energy Savings - EE (GWh)
Load Growth - No EE (GWh)
Growth Offset by EE ()
Year
0
200
400
600
800
1000
1200
1400
1 2 3 4 5 6 7 8 9 10 0
20
40
60
80
100
120
140
160
Delivered Costs and Benefits of EE
Year
$M
Wh
Societal Cost ($MWh saved)
Societal Savings ($MWh saved)
$0
$100
$200
$300
$400
1 2 3 4 5 6 7 8 9 10
Peak Load Growth ndash Decrease Peak load requirements decrease because peak capacity
Emissions and Cost Savings ndash Increase savings are captured due to EE measures Peak load is not Annual tons of emissions saved increases Emissions cost sav- impacted by decoupling ings increases when emissions cost is monetized Emissions costs and savings are the same with and without decoupling
Annual Emissions Savings
70 Tons SO2 Saved Tons CO Saved Tons VOC Saved 1000 Tons CO2 Saved
Tons NO x Saved Tons PM-10 Saved 200
180 60
Comparison of Peak Load Growth
Year
Peak
Loa
d
of
Firs
t Y
r
Forecasted Growth - No EE
Forecasted Growth - EE and Decoupling
90
100
110
120
130
140
150
160
1 2 3 4 5 6 7 8 9 10
160 50 140
12040 100
30 80
60
40 20
10 20
0 0 1 2 3 4 5 6 7 8 9 10
Year
1000
Ton
s C
O s
aved
2
Tons
Sav
ed
To create a sustainable aggressive national commitment to energy efficiency Appendix B-29
Funding and printing for this report was provided by the US Department of Energy and US Environmental
Protection Agency in their capacity as co-sponsors for the National Action Plan for Energy Efficiency
RecycledRecyclablemdashPrinted with Vegetable Oil Based Inks on 100 (Minimum 50 postconsumer) Recycled Paper
The goal is to create a sustainable
aggressive national commitment
to energy efficiency through gas and
electric utilities utility regulators
and partner organizations
Improving energy efficiency in our homes businesses schools governments and
industriesmdashwhich consume more than 70 percent of the natural gas and electricity used
in the countrymdashis one of the most constructive cost-effective ways to address the
challenges of high energy prices energy security and independence air pollution and
global climate change
The US Department of Energy and US Environmental Protection Agency facilitate the
work of the Leadership Group and the National Action Plan for Energy Efficiency
Acknowledgements
The National Action Plan for Energy Efficiency Report discusses policy planning and program issues based on a formal work plan developed during the December 2005 and March 2006 Leadership Group meetings The Leadership Group is led by co-chairs Diane Munns (Member of the Iowa Utilities Board and President of the National Association of Regulatory Utility Commissioners) and Jim Rogers (President and Chief Executive Officer of Duke Energy) A full list of Leadership Group members is provided in both the Executive Summary (Table ES-1) and Chapter 1 (Table 1-2) of this report Rich Scheer of Energetics Inc facilitated the Leadership Group discussions during both Leadership Group meetings
Expert consultants funded by the US Department of Energy (DOE) and the US Environmental Protection Agency (EPA) drafted many chapters of the Action Plan Report These consultants included
bull Regulatory Assistance Project Chapter 2 and Appendix A
bull Energy and Environmental Economics Inc Chapters 3 through 5 Energy Efficiency Benefits Calculator and Appendix B
bull KEMA Chapter 6
In addition Rich Sedano of the Regulatory Assistance Project and Alison Silverstein of Alison Silverstein Consulting provided their expertise during review and editing of the overall report
DOE and EPA facilitated the work of the Leadership Group and this report including Larry Mansueti with DOErsquos Office of Electricity Delivery and Energy Reliability Mark Ginsberg with DOErsquos Office of Energy Efficiency and Renewable Energy and Kathleen Hogan Stacy Angel Maureen McNamara Katrina Pielli and Tom Kerr with EPArsquos Climate Protection Partnership Division
Eastern Research Group Inc provided technical review copyediting graphics and production services
To create a sustainable aggressive national commitment to energy efficiency i
List of Figures
Figure ES-1 National Action Plan for Energy Efficiency RecommendationsES-2
Figure ES-2 National Action Plan for Energy Efficiency Recommendations amp OptionsES-8
Figure 1-1 Energy Efficiency Spending Has Declined 1-5
Figure 1-2 Energy Efficiency Has Been a Resource in the Pacific Northwest for the Past Two Decades 1-7
Figure 1-3 National Action Plan for Energy Efficiency Report Addresses Actions to Encourage Greater Energy Efficiency 1-11
Figure 3-1 Energy-Efficiency Supply Curve ndash Potential in 2011 3-2
Figure 3-2 California Efficiency Structure Overview3-10
Figure 3-3 California Investor-Owned Utility Process 3-11
Figure 3-4 BPA Transmission Planning Process 3-12
Figure 3-5 New York Efficiency Structure Overview3-13
Figure 4-1 Comparison of Deferral Length with Low- and High-Growth 4-10
Figure 6-1 Impacts of the Northeast Lighting and Appliance Initiative 6-33
Figure 7-1 National Action Plan for Energy Efficiency Recommendations 7-1
Figure 7-2 National Action Plan for Energy Efficiency Report Addresses Actions to Encourage Greater Energy Efficiency 7-2
National Action Plan for Energy Efficiency ii
List of Tables
Table ES-1 Members of the National Action Plan for Energy Efficiency ES-10
Table 1-1 Summary of Benefits for National Energy Efficiency Efforts 1-8
Table 1-2 Members of the National Action Plan for Energy Efficiency 1-16
Table 2-1 Options to Mitigate the Throughput Incentive Pros and Cons 2-6
Table 2-2 Examples of Decoupling2-12
Table 2-3 Examples of Incentives for Energy Efficiency Investments 2-15
Table 3-1 Levelized Costs and Benefits From Four Regions 3-9
Table 3-2 Incorporation of Energy Efficiency in Californiarsquos Investor-Owned Utilitiesrsquo Planning Processes3-11
Table 3-3 Incorporation of Energy Efficiency in BPArsquos Planning Processes3-13
Table 3-4 Incorporation of Energy Efficiency in NYSERDArsquos Planning Processes 3-14
Table 3-5 Incorporation of Energy Efficiency in Minnesotarsquos Planning Processes 3-15
Table 3-6 Incorporation of Energy Efficiency in Texasrsquo Planning Processes 3-16
Table 3-7 Incorporation of Energy Efficiency in PacifiCorprsquos Planning Processes 3-17
Table 4-1 Summary of Main Assumptions and Results for Each Business Case Analyzed4-3
Table 4-2 High- and Low-Growth Results Electric Utility 4-6
Table 4-3 High- and Low-Growth Results Natural Gas Utility 4-8
Table 4-4 Power Plant Deferral Results 4-11
Table 4-5 Vertically Integrated and Delivery Company Results 4-13
Table 4-6 Publicly- and Cooperatively-Owned Utility Results 4-15
Table 5-1 Partial List of Utilities With Inclining Tier Residential Rates 5-6
Table 5-2 Pros and Cons of Rate Design Forms 5-9
Table 5-3 Conditions That Assist Success 5-11
Table 6-1 Overview of Energy Efficiency Programs 6-4
Table 6-2 Efficiency Measures of Natural Gas Savings Programs 6-6
Table 6-3 Efficiency Measures of Electric and Combination Programs 6-8
Table 6-4 Achievable Energy Efficiency Potential From Recent Studies 6-16
Table 6-5 NYSERDA 2004 Portfolio 6-20
To create a sustainable aggressive national commitment to energy efficiency iii
List of Tables (continued)
Table 6-6 Nevada Resource Planning Programs 6-21
Table 6-7 Overview of Cost-Effectiveness Tests 6-23
Table 6-8 Research amp Development (RampD) Activities of Select Organizations 6-25
Table 6-9 Emerging Technologies for Programs 6-27
Table 6-10 Key Stakeholders Barriers and Program Strategies by Customer Segment6-31
Table 6-11 Types of Financial Incentives 6-40
Table 6-12 Sample Progression of Program Designs6-42
Table 6-13 Program Examples for Key Customer Segments 6-44
Table 6-14 Evaluation Approaches6-46
Table 7-1 Leadership Group Recommendations and Options to Consider by Chapter 7-3
iv National Action Plan for Energy Efficiency
List of Acronyms
A
aMW average megawatts
B
Bcf billion cubic feet
BOMA Building Owners amp Managers Association
BPA Bonneville Power Administration
C
CI commercial and industrial
CEC California Energy Commission
CO2 carbon dioxide
CPP critical peak pricing
CPUC California Public Utility Commission
D
DEER Database for Energy Efficiency Resources
DOE US Department of Energy
DSM demand-side management
E
EE energy efficiency
EEPS energy efficiency portfolio standard
EERS energy efficiency resource standard
EPA US Environmental Protection Agency
EPRI Electric Power Research Institute
ESCO energy services company
ETO Energy Trust of Oregon
F
FERC Federal Energy Regulatory Commission
G
GWh gigawatt-hour (1000000 kWh)
H
HERS Home Energy Rating System
HVAC heating ventilation and air conditioning
I
IOU investor-owned utility
IPMVP International Performance Measurement and Verification Protocol
IRP integrated resource plan
ISO independent system operator
ISO-NE ISO New England
K
kWh kilowatt-hour (3412 British thermal units)
L
LIHEAP Low-Income Home Energy Assistance
Program
LIPA Long Island Power Authority
To create a sustainable aggressive national commitment to energy efficiency v
List of Acronyms (continued)
M
MampV measurement and verification
Mcf one thousand cubic feet
MMBtu million British thermal units
MW megawatt (1000000 watts)
MWh megawatt-hour (1000 kWh)
N
NEEP Northeast Energy Efficiency Partnerships
NERC North American Electric Reliability Council
NOX nitrogen oxides
NPV net present value
NSPC Non-Residential Standard Performance Contract
NWPCC Northwest Power and Conservation Council
NYSERDA New York State Energy Research and Development Authority
P
PBL Power Business Line
PGampE Pacific Gas amp Electric
PIER Public Interest Energy Research
PSE Puget Sound Energy
PUCT Public Utility Commission of Texas
PURPA Public Utility Regulatory Policies Act
R
RampD research and development
RARP Residential Appliance Recycling Program
REAP Residential Energy Affordability Partnership Program
RFP request for proposals
RGGI Regional Greenhouse Gas Initiative
RIM rate impact measure
ROE return on equity
RPC revenue per customer
RTO regional transmission organization
RTP real-time pricing
S
SBC system benefits charge
SCE Southern California Edison
SMUD Sacramento Municipal Utility District
SO2 sulfur dioxide
T
TOU time of use
TRC total resource cost
V
VOLL value of lost load
VOS value of service
W
WAP Weatherization Assistance Program
vi National Action Plan for Energy Efficiency
Table of Contents
Acknowledgements i
List of Figuresii
List of Tablesiii
List of Acronyms v
Executive SummaryES-1
Chapter 1 Introduction and Background1-1
Chapter 2 Utility Ratemaking amp Revenue Requirements2-1
Chapter 3 Energy Resource Planning Processes 3-1
Chapter 4 Business Case for Energy Efficiency 4-1
Chapter 5 Rate Design5-1
Chapter 6 Energy Efficiency Program Best Practices 6-1
Chapter 7 Report Summary 7-1
Appendix A Additional Guidance on Removing the Throughput Incentive A-1
Appendix B Business Case DetailsB-1
To create a sustainable aggressive national commitment to energy efficiency vii
Executive Summary
This National Action Plan for Energy Efficiency (Action Plan) presents policy recommendations for creating a sustainable aggressive national commitment to energy efficiency through gas and electric utilities utility regulators and partner organizations Such a commitment could save Americans many billions of dollars on energy bills over the next 10 to 15 years contribute to energy security and improve our environment The Action Plan was developed by more than 50 leading organizations representing key stakeholder perspectives These organizations pledge to take specific actions to make the Action Plan a reality
A National Action Plan
for Energy Efficiency
We currently face a set of serious challenges with regard to the US energy system Energy demand continues to grow despite historically high energy prices and mountshying concerns over energy security and independence as well as air pollution and global climate change The decishysions we make now regarding our energy supply and demand can either help us deal with these challenges more effectively or complicate our ability to secure a more stable economical energy future
Improving the energy efficiency1 of our homes businessshyes schools governments and industriesmdashwhich consume more than 70 percent of the natural gas and electricity used in the countrymdashis one of the most constructive cost-effective ways to address these chalshylenges2 Increased investment in energy efficiency in our homes buildings and industries can lower energy bills reduce demand for fossil fuels help stabilize energy prices enhance electric and natural gas system reliabilishyty and help reduce air pollutants and greenhouse gases
Despite these benefits and the success of energy effishyciency programs in some regions of the country energy efficiency remains critically underutilized in the nationrsquos energy portfolio3 Now we simultaneously face the chalshylenges of high prices the need for large investments in new energy infrastructure environmental concerns and
security issues It is time to take advantage of more than two decades of experience with successful energy effishyciency programs broaden and expand these efforts and capture the savings that energy efficiency offers Much more can be achieved in concert with ongoing efforts to advance building codes and appliance standards provide tax incentives for efficient products and buildings and promote savings opportunities through programs such as ENERGY STARreg Efficiency of new buildings and those already in place are both important Many homeowners businesses and others in buildings and facilities already standing todaymdashwhich will represent the vast majority of the nationrsquos buildings and facilities for years to comemdashcan realize significant savings from proven energy efficiency programs
Bringing more energy efficiency into the nationrsquos energy mix to slow demand growth in a wise cost-effective mannermdashone that balances energy efficiency with new generation and supply optionsmdashwill take concerted efforts by all energy market participants customers utilshyities regulators states consumer advocates energy service companies (ESCOs) and others It will require education on the opportunities review of existing polishycies identification of barriers and their solutions assessshyment of new technologies and modification and adopshytion of policies as appropriate Utilities4 regulators and partner organizations need to improve customer access to energy efficiency programs to help them control their own energy costs provide the funding necessary to
To create a sustainable aggressive national commitment to energy efficiency ES-1
deliver these programs and examine policies governing energy companies to ensure that these policies facilishytatemdashnot impedemdashcost-effective programs for energy efficiency Historically the regulatory structure has rewarded utilities for building infrastructure (eg power plants transmission lines pipelines) and selling energy while discouraging energy efficiency even when the energy-saving measures cost less than constructing new infrastructure5 And it has been difficult to establish the funding necessary to capture the potential benefits that cost-effective energy efficiency offers
This National Action Plan for Energy Efficiency is a call to action to bring diverse stakeholders together at the national regional state or utility level as appropriate and foster the discussions decision-making and commitshyments necessary to take investment in energy efficiency to a new level The overall goal is to create a sustainable aggressive national commitment to energy efficiency through gas and electric utilities utility regulators and partner organizations
The Action Plan was developed by a Leadership Group composed of more than 50 leading organizations represhysenting diverse stakeholder perspectives Based upon the policies practices and efforts of many organizations across the country the Leadership Group offers five
recommendations as ways to overcome many of the barriers that have limited greater investment in programs to deliver energy efficiency to customers of electric and gas utilities (Figure ES-1) These recommendations may be pursued through a number of different options depending upon state and utility circumstances
As part of the Action Plan leading organizations are comshymitting to aggressively pursue energy efficiency opportushynities in their organizations and assist others who want to increase the use of energy efficiency in their regions Because greater investment in energy efficiency cannot happen based on the work of one individual or organizashytion alone the Action Plan is a commitment to bring the appropriate stakeholders togethermdashincluding utilities state policy-makers consumers consumer advocates businesses ESCOs and othersmdashto be part of a collaborashytive effort to take energy efficiency to a new level As energy experts utilities may be in a unique position to play a leading role
The reasons behind the National Action Plan for Energy Efficiency the process for developing the Action Plan and the final recommendations are summarized in greater detail as follows
Figure ES-1 National Action Plan for Energy Efficiency Recommendations
bull Recognize energy efficiency as a high-priority energy resource
bull Make a strong long-term commitment to implement cost-effective energy efficiency as a resource
bull Broadly communicate the benefits of and opportunities for energy efficiency
bull Promote sufficient timely and stable program funding to deliver energy efficiency where cost-effective
bull Modify policies to align utility incentives with the delivery of cost-effective energy efficiency and
modify ratemaking practices to promote energy efficiency investments
ES-2 National Action Plan for Energy Efficiency
The United States Faces Large and
Complex Energy Challenges
Our expanding economy growing population and rising standard of living all depend on energy services Current projections anticipate US energy demands to increase by more than one-third by 2030 with electricity demand alone rising by more than 40 percent (EIA 2006) At work and at home we continue to rely on more and more energy-consuming devices At the same time the country has entered a period of higher energy costs and limited supplies of natural gas heating oil and other fuels These issues present many challenges
Growing energy demand stresses current systems
drives up energy costs and requires new investments
Events such as the Northeast electricity blackout of August 2003 and Hurricanes Katrina and Rita in 2005 increased focus on energy reliability and its economic and human impacts Transmission and pipeline systems are becoming overburdened in places Overburdened systems limit the availability of low-cost electricity and fossil fuels raise energy prices in or near congested areas and potentially compromise energy system reliashybility High fuel prices also contribute to higher electricishyty prices In addition our demand for natural gas to heat our homes for industrial and business use and for power generation is straining the available gas supply in North America and putting upward pressure on natural gas prices Addressing these issues will require billions of dollars in investments in energy efficiency new power plants gas rigs transmission lines pipelines and other infrastructure notwithstanding the difficulty of building new energy infrastructure in dense urban and suburban areas In the absence of investments in new or expandshyed capacity existing facilities are being stretched to the point where system reliability is steadily eroding and the ability to import lower cost energy into high-growth load areas is inhibited potentially limiting economic expansion
High fuel prices increase financial burdens on houseshy
holds and businesses and slow our economy Many household budgets are being strained by higher energy
costs leaving less money available for other household purchases and needs This burden is particularly harmful for low-income households Higher energy bills for industry can reduce the nationrsquos economic competitiveshyness and place US jobs at risk
Growing energy demand challenges attainment of
clean air and other public health and environmental
goals Energy demand continues to grow at the same time that national and state regulations are being impleshymented to limit the emission of air pollutants such as sulshyfur dioxide (SO2) nitrogen oxides (NOx) and mercury to protect public health and the environment In addition emissions of greenhouse gases continue to increase
Uncertainties in future prices and regulations raise
questions about new investments New infrastructure is being planned in the face of uncertainties about future energy prices For example high natural gas prices and uncertainty about greenhouse gas and other environshymental regulations impede investment decisions on new energy supply options
Our energy system is vulnerable to disruptions in
energy supply and delivery Natural disasters such as the hurricanes of 2005 exposed the vulnerability of the US energy system to major disruptions which have sigshynificant impacts on energy prices and service reliability In response national security concerns suggest that we should use fossil fuel energy more efficiently increase supply diversity and decrease the vulnerability of domesshytic infrastructure to natural disasters
Energy Efficiency Can Be a Beneficial
Resource in Our Energy Systems
Greater investment in energy efficiency can help us tackshyle these challenges Energy efficiency is already a key component in the nationrsquos energy resource mix in many parts of the country Utilities states and others across the United States have decades of experience in delivershying energy efficiency to their customers These programs can provide valuable models upon which more states
To create a sustainable aggressive national commitment to energy efficiency ES-3
Benefits of Energy Efficiency
Lower energy bills greater customer control and
greater customer satisfaction Well-designed energy efficiency programs can provide opportunities for cusshytomers of all types to adopt energy savings measures that can improve their comfort and level of service while reducing their energy bills6 These programs can help customers make sound energy use decisions increase control over their energy bills and empower them to manage their energy usage Customers are experiencing savings of 5 10 20 or 30 percent depending upon the customer program and average bill Offering these programs can also lead to greater customer satisfaction with the service provider
Lower cost than supplying new generation only
from new power plants In some states well-designed energy efficiency programs are saving enershygy at an average cost of about one-half of the typical cost of new power sources and about one-third of the cost of natural gas supply (EIA 2006)7 When inteshygrated into a long-term energy resource plan energy efficiency programs could help defer investments in new plants and lower the total cost of delivering electricity
Modular and quick to deploy Energy efficiency proshygrams can be ramped up over a period of one to three years to deliver sizable savings These programs can also be targeted to congested areas with high prices to bring relief where it might be difficult to deliver new supply in the near term
Significant energy savings Well-designed energy efficiency programs are delivering annual energy savshyings on the order of 1 percent of electricity and natushyral gas sales8 These programs are helping to offset 20 to 50 percent of expected growth in energy demand in some areas without compromising the end usersrsquo activities and economic well-being (Nadel et al 2004 EIA 2006)
Environmental benefits While reducing customersrsquo energy bills cost-effective energy efficiency offers environmental benefits related to reduced demand such as lower air pollution reduced greenhouse gas emissions lower water use and less environmental damage from fossil fuel extraction Energy efficiency can be an attractive option for utilities in advance of requirements to reduce greenhouse gas emissions
Economic development Greater investment in enershygy efficiency helps build jobs and improve state economies Energy efficiency users often redirect their bill savings toward other activities that increase local and national employment with a higher employment impact than if the money had been spent to purchase energy (Kushler et al 2005 NYSERDA 2004) Many energy efficiency programs create construction and installation jobs with multiplier impacts on employshyment and local economies Local investments in enershygy efficiency can offset imports from out-of-state improving the state balance of trade Lastly energy efficiency investments usually create long-lasting infrastructure changes to building equipment and appliance stocks creating long-term property improvements that deliver long-term economic value (Innovest 2002)
Energy security Energy efficiency reduces the level of US per capita energy consumption thus decreasing the vulnerability of the economy and individual conshysumers to energy price disruptions from natural disasshyters and attacks on domestic and international energy supplies and infrastructure In addition energy effishyciency can be used to reduce the overall system peak demand or the peak demand in targeted load areas with limited generating or transport capability Reducing peak demand improves system reliability and reduces the potential for unplanned brownshyouts or black-outs which can have large adverse economic consequences
ES-4 National Action Plan for Energy Efficiency
utilities and other organizations can build Experience shows that energy efficiency programs can lower customer energy bills cost less than and help defer new energy infrastructure provide energy savings to consumers improve the environment and spur local economic development (see box on Benefits of Energy Efficiency) Significant opportunities for energy efficiency are likely to continue to be available at low costs in the future State and regional studies have found that adoption of economically attractive but as yet untapped energy efficiency could yield more than 20 percent savings in total electricity demand nationwide by 2025 Depending on the underlying load growth these savings could help cut load growth by half or more comshypared to current forecasts (Nadel et al 2004 SWEEP 2002 NEEP 2005 NWPCC 2005 WGA 2006) Similarly savings from direct use of natural gas could provide a 50 percent or greater reduction in natural gas demand growth (Nadel et al 2004)
Capturing this energy efficiency resource would offer substantial economic and environmental benefits across the country Widespread application of energy efficiency programs that already exist in some regions could delivshyer a large part of these potential savings9 Extrapolating the results from existing programs to the entire country would yield annual energy bill savings of nearly $20 bilshylion with net societal benefits of more than $250 billion over the next 10 to 15 years This scenario could defer the need for 20000 megawatts (MW) or 40 new 500shyMW power plants as well as reduce US emissions from energy production and use by more than 200 million tons of carbon dioxide (CO2) 50000 tons of SO2 and 40000 tons of NOx annually10 These significant ecoshynomic and environmental benefits can be achieved relashytively quickly because energy efficiency programs can be developed and implemented within several years
Additional policies and programs are required to help capture these potential benefits and address our subshystantial underinvestment in energy efficiency as a nation An important indicator of this underinvestment is that the level of funding across the country for organized effishy
ciency programs is currently less than $2 billion per year while it would require about 4 times todayrsquos funding levshyels to achieve the economic and environment benefits presented above11 12
The current underinvestment in energy efficiency is due to a number of well-recognized barriers including some of the regulatory policies that govern electric and natushyral gas utilities These barriers include
bull Market barriers such as the well-known ldquosplitshyincentiverdquo barrier which limits home buildersrsquo and commercial developersrsquo motivation to invest in energy efficiency for new buildings because they do not pay the energy bill and the transaction cost barrier which chronically affects individual consumer and small business decision-making
bull Customer barriers such as lack of information on energy saving opportunities lack of awareness of how energy efficiency programs make investments easier and lack of funding to invest in energy efficiency
bull Public policy barriers which can present prohibitive disincentives for utility support and investment in energy efficiency in many cases
bull Utility state and regional planning barriers which do not allow energy efficiency to compete with supply-side resources in energy planning
bull Energy efficiency program barriers which limit investment due to lack of knowledge about the most effective and cost-effective energy efficiency program portfolios programs for overcoming common marketplace barriers to energy efficiency or available technologies
While a number of energy efficiency policies and programs contribute to addressing these barriers such as building codes appliance standards and state government leadshyership programs organized energy efficiency programs
To create a sustainable aggressive national commitment to energy efficiency ES-5
provide an important opportunity to deliver greater energy efficiency in the homes buildings and facilities that already exist today and that will consume the majorshyity of the energy used in these sectors for years to come
The Leadership Group and National
Action Plan for Energy Efficiency
Recognizing that energy efficiency remains a critically underutilized resource in the nationrsquos energy portfolio more than 50 leading electric and gas utilities state utilshyity commissioners state air and energy agencies energy service providers energy consumers and energy effishyciency and consumer advocates have formed a Leadership Group together with the US Department of Energy (DOE) and the US Environmental Protection Agency (EPA) to address the issue The goal of this group is to create a sustainable aggressive national comshymitment to energy efficiency through gas and electric utilities utility regulators and partner organizations The Leadership Group recognizes that utilities and regulators play critical roles in bringing energy efficiency programs to their communities and that success requires the joint efforts of customers utilities regulators states and other partner organizations
Under co-chairs Diane Munns (Member of the Iowa Utilities Board and President of the National Association of Regulatory Utility Commissioners) and Jim Rogers (President and Chief Executive Officer of Duke Energy) the Leadership Group members (see Table ES-1) have developed the National Action Plan for Energy Efficiency Report which
bull Identifies key barriers limiting greater investment in energy efficiency
bull Reviews sound business practices for removing these barriers and improving the acceptance and use of energy efficiency relative to energy supply options
bull Outlines recommendations and options for overcoming these barriers
The members of the Leadership Group have agreed to pursue these recommendations and consider these options through their own actions where appropriate and to support energy efficiency initiatives by other industry members and stakeholders
Recommendations
The National Action Plan for Energy Efficiency is a call to action to utilities state utility regulators consumer advoshycates consumers businesses other state officials and other stakeholders to create an aggressive sustainable national commitment to energy efficiency1 The Action Plan offers the following recommendations as ways to overcome barriers that have limited greater investment in energy efficiency for customers of electric and gas utilshyities in many parts of the country The following recomshymendations are based on the policies practices and efforts of leading organizations across the country For each recommendation a number of options are availshyable to be pursued based on regional state and utility circumstances (see also Figure ES-2)
Recognize energy efficiency as a high-priority energy
resource Energy efficiency has not been consistently viewed as a meaningful or dependable resource comshypared to new supply options regardless of its demonshystrated contributions to meeting load growth13
Recognizing energy efficiency as a high-priority energy resource is an important step in efforts to capture the benefits it offers and lower the overall cost of energy services to customers Based on jurisdictional objectives energy efficiency can be incorporated into resource plans to account for the long-term benefits from energy savshyings capacity savings potential reductions of air pollushytants and greenhouse gases as well as other benefits The explicit integration of energy efficiency resources into the formalized resource planning processes that exist at regional state and utility levels can help estabshylish the rationale for energy efficiency funding levels and for properly valuing and balancing the benefits In some jurisdictions these existing planning processes might need to be adapted or even created to meaningfully
ES-6 National Action Plan for Energy Efficiency
incorporate energy efficiency resources into resource planning Some states have recognized energy efficiency as the resource of first priority due to its broad benefits
Make a strong long-term commitment to implement
cost-effective energy efficiency as a resource Energy efficiency programs are most successful and provide the greatest benefits to stakeholders when appropriate polishycies are established and maintained over the long-term Confidence in long-term stability of the program will help maintain energy efficiency as a dependable resource compared to supply-side resources deferring or even avoiding the need for other infrastructure investshyments and maintain customer awareness and support Some steps might include assessing the long-term potential for cost-effective energy efficiency within a region (ie the energy efficiency that can be delivered cost-effectively through proven programs for each cusshytomer class within a planning horizon) examining the role for cutting-edge initiatives and technologies estabshylishing the cost of supply-side options versus energy effishyciency establishing robust measurement and verification (MampV) procedures and providing for routine updates to information on energy efficiency potential and key costs
Broadly communicate the benefits of and opportunishy
ties for energy efficiency Experience shows that enershygy efficiency programs help customers save money and contribute to lower cost energy systems But these benshyefits are not fully documented nor recognized by cusshytomers utilities regulators or policy-makers More effort is needed to establish the business case for enershygy efficiency for all decision-makers and to show how a well-designed approach to energy efficiency can benefit customers utilities and society by (1) reducing cusshytomersrsquo bills over time (2) fostering financially healthy utilities (eg return on equity earnings per share and debt coverage ratios unaffected) and (3) contributing to positive societal net benefits overall Effort is also necesshysary to educate key stakeholders that although energy efficiency can be an important low-cost resource to inteshygrate into the energy mix it does require funding just as a new power plant requires funding Further education
is necessary on the impact that energy efficiency proshygrams can have in concert with other energy efficiency policies such as building codes appliance standards and tax incentives
Promote sufficient timely and stable program fundshy
ing to deliver energy efficiency where cost-effective
Energy efficiency programs require consistent and long-term funding to effectively compete with energy supply options Efforts are necessary to establish this consistent long-term funding A variety of mechanisms have been and can be used based on state utility and other stakeshyholder interests It is important to ensure that the effishyciency programsrsquo providers have sufficient long-term funding to recover program costs and implement the energy efficiency measures that have been demonstratshyed to be available and cost effective A number of states are now linking program funding to the achievement of energy savings
Modify policies to align utility incentives with the
delivery of cost-effective energy efficiency and modify
ratemaking practices to promote energy efficiency
investments Successful energy efficiency programs would be promoted by aligning utility incentives in a manner that encourages the delivery of energy efficienshycy as part of a balanced portfolio of supply demand and transmission investments Historically regulatory policies governing utilities have more commonly compensated utilities for building infrastructure (eg power plants transmission lines pipelines) and selling energy while discouraging energy efficiency even when the energy-saving measures might cost less Within the existing regshyulatory processes utilities regulators and stakeholders have a number of opportunities to create the incentives for energy efficiency investments by utilities and cusshytomers A variety of mechanisms have already been used For example parties can decide to provide incenshytives for energy efficiency similar to utility incentives for new infrastructure investments provide rewards for prushydent management of energy efficiency programs and incorporate energy efficiency as an important area of consideration within rate design Rate design offers
To create a sustainable aggressive national commitment to energy efficiency ES-7
Figure ES-2 National Action Plan for Energy Efficiency Recommendations amp Options
Recognize energy efficiency as a high priority
energy resource
Options to consider bull Establishing policies to establish energy efficiency as
a priority resource bull Integrating energy efficiency into utility state and
regional resource planning activities bull Quantifying and establishing the value of energy
efficiency considering energy savings capacity savshyings and environmental benefits as appropriate
Make a strong long-term commitment to implement
cost-effective energy efficiency as a resource
Options to consider bull Establishing appropriate cost-effectiveness tests for
a portfolio of programs to reflect the long-term benefits of energy efficiency
bull Establishing the potential for long-term cost-effective energy efficiency savings by customer class through proven programs innovative initiatives and cutting-edge technologies
bull Establishing funding requirements for delivering long-term cost-effective energy efficiency
bull Developing long-term energy saving goals as part of energy planning processes
bull Developing robust measurement and verification (MampV) procedures
bull Designating which organization(s) is responsible for administering the energy efficiency programs
bull Providing for frequent updates to energy resource plans to accommodate new information and technology
Broadly communicate the benefits of and
opportunities for energy efficiency
Options to consider bull Establishing and educating stakeholders on the
business case for energy efficiency at the state utilshyity and other appropriate level addressing relevant customer utility and societal perspectives
bull Communicating the role of energy efficiency in
lowering customer energy bills and system costs and risks over time
bull Communicating the role of building codes applishyance standards and tax and other incentives
Provide sufficient timely and stable program funding
to deliver energy efficiency where cost-effective
Options to consider bull Deciding on and committing to a consistent
way for program administrators to recover energy efficiency costs in a timely manner
bull Establishing funding mechanisms for energy efficiency from among the available options such as revenue requirement or resource procurement funding system benefits charges rate-basing shared-savings incentive mechanisms etc
bull Establishing funding for multi-year periods
Modify policies to align utility incentives with the
delivery of cost-effective energy efficiency and
modify ratemaking practices to promote energy
efficiency investments
Options to consider bull Addressing the typical utility throughput incentive
and removing other regulatory and management disincentives to energy efficiency
bull Providing utility incentives for the successful management of energy efficiency programs
bull Including the impact on adoption of energy efficiency as one of the goals of retail rate design recognizing that it must be balanced with other objectives
bull Eliminating rate designs that discourage energy efficiency by not increasing costs as customers consume more electricity or natural gas
bull Adopting rate designs that encourage energy efficiency by considering the unique characteristics of each customer class and including partnering tariffs with other mechanisms that encourage energy efficiency such as benefit sharing programs and on-bill financing
ES-8 National Action Plan for Energy Efficiency
opportunities to encourage customers to invest in efficiency where they find it to be cost effective and participate in new programs that provide innovative technologies (eg smart meters) to help customers control their energy costs
National Action Plan for Energy
Efficiency Next Steps
In summer 2006 members of the Leadership Group of the National Action Plan on Energy Efficiency are announcing a number of specific activities and initiatives to formalize and reinforce their commitments to energy efficiency as a resource To assist the Leadership Group and others in making and fulfilling their commitments a number of tools and resources have been developed
National Action Plan for Energy Efficiency Report
This report details the key barriers to energy efficiency in resource planning utility incentive mechanisms rate design and the design and implementation of energy efficiency programs It also reviews and presents a varishyety of policy and program solutions that have been used to overcome these barriers as well as the pros and cons for many of these approaches
Energy Efficiency Benefits Calculator This calculator can be used to help educate stakeholders on the broad benefits of energy efficiency It provides a simplified framework to demonstrate the business case for energy efficiency from the perspective of the consumer the utilshyity and society It has been used to explore the benefits of energy efficiency program investments under a range of utility structures policy mechanisms and energy growth scenarios The calculator can be adapted and applied to other scenarios
Experts and Resource Materials on Energy Efficiency
A number of educational presentations on the potential for energy efficiency and various policies available for pursuing the recommendations of the Action Plan will be developed In addition lists of policy and program experts in energy efficiency and the various policies availshyable for pursuing the recommendations of the Action
Plan will be developed These lists will be drawn from utilities state utility regulators state energy offices third-party energy efficiency program administrators consumer advocacy organizations ESCOs and others These resources will be available in fall 2006
DOE and EPA are continuing to facilitate the work of the Leadership Group and the National Action Plan for Energy Efficiency During winter 2006ndash2007 the Leadership Group plans to report on its progress and identify next steps for the Action Plan
To create a sustainable aggressive national commitment to energy efficiency ES-9
Table ES-1 Members of the National Action Plan for Energy Efficiency
Co-Chairs
Diane Munns Member Iowa Utilities Board President National Association of Regulatory Utility Commissioners
Jim Rogers President and Chief Executive Officer Duke Energy
Leadership Group
Barry Abramson Senior Vice President Servidyne Systems LLC
Angela S Beehler Director of Energy Regulation Wal-Mart Stores Inc
Bruce Braine Vice President Strategic Policy Analysis American Electric Power
Jeff Burks Director of Environmental Sustainability PNM Resources
Kateri Callahan President Alliance to Save Energy
Glenn Cannon General Manager Waverly Light and Power
Jorge Carrasco Superintendent Seattle City Light
Lonnie Carter President and Chief Executive Officer Santee Cooper
Mark Case Vice President for Business Performance Baltimore Gas and Electric
Gary Connett Manager of Resource Planning and Great River Energy Member Services
Larry Downes Chairman and Chief Executive Officer New Jersey Natural Gas (New Jersey Resources Corporation)
Roger Duncan Deputy General Manager Distributed Energy Services Austin Energy
Angelo Esposito Senior Vice President Energy Services and Technology New York Power Authority
William Flynn Chairman New York State Public Service Commission
Jeanne Fox President New Jersey Board of Public Utilities
Anne George Commissioner Connecticut Department of Public Utility Control
Dian Grueneich Commissioner California Public Utilities Commission
Blair Hamilton Policy Director Vermont Energy Investment Corporation
Leonard Haynes Executive Vice President Supply Technologies Southern Company Renewables and Demand Side Planning
Mary Healey Consumer Counsel for the State of Connecticut Connecticut Consumer Counsel
Helen Howes Vice President Environment Health and Safety Exelon
Chris James Air Director Connecticut Department of Environmental Protection
Ruth Kinzey Director of Corporate Communications Food Lion
Peter Lendrum Vice President Sales and Marketing Entergy Corporation
Rick Leuthauser Manager of Energy Efficiency MidAmerican Energy Company
Mark McGahey Manager Tristate Generation and Transmission Association Inc
Janine Migden- Consumersrsquo Counsel Office of the Ohio Consumersrsquo Counsel Ostrander
Richard Morgan Commissioner District of Columbia Public Service Commission
Brock Nicholson Deputy Director Division of Air Quality North Carolina Air Office
Pat Oshie Commissioner Washington Utilities and Transportation Commission
Douglas Petitt Vice President Government Affairs Vectren Corporation
ES-10 National Action Plan for Energy Efficiency
Bill Prindle Deputy Director American Council for an Energy-Efficient Economy
Phyllis Reha Commissioner Minnesota Public Utilities Commission
Roland Risser Director Customer Energy Efficiency Pacific Gas and Electric
Gene Rodrigues Director Energy Efficiency Southern California Edison
Art Rosenfeld Commissioner California Energy Commission
Jan Schori General Manager Sacramento Municipal Utility District
Larry Shirley Division Director North Carolina Energy Office
Michael Shore Senior Air Policy Analyst Environmental Defense
Gordon Slack Energy Business Director The Dow Chemical Company
Deb Sundin Director Business Product Marketing Xcel Energy
Dub Taylor Director Texas State Energy Conservation Office
Paul von Director Energy and Environmental Affairs Johnson Controls Paumgartten
Brenna Walraven Executive Director National Property Management USAA Realty Company
Devra Wang Director California Energy Program Natural Resources Defense Council
Steve Ward Public Advocate State of Maine
Mike Weedall Vice President Energy Efficiency Bonneville Power Administration
Tom Welch Vice President External Affairs PJM Interconnection
Jim West Manager of energy right amp Green Power Switch Tennessee Valley Authority
Henry Yoshimura Manager Demand Response ISO New England Inc
Observers
James W (Jay) Counsel Steel Manufacturers Association Brew
Roger Cooper Executive Vice President Policy and Planning American Gas Association
Dan Delurey Executive Director Demand Response Coordinating Committee
Roger Fragua Deputy Director Council of Energy Resource Tribes
Jeff Genzer General Counsel National Association of State Energy Officials
Donald Gilligan President National Association of Energy Service Companies
Chuck Gray Executive Director National Association of Regulatory Utility Commissioners
John Holt Senior Manager of Generation and Fuel National Rural Electric Cooperative Association
Joseph Mattingly Vice President Secretary and General Counsel Gas Appliance Manufacturers Association
Kenneth Mentzer President and Chief Executive Officer North American Insulation Manufacturers Association
Christina Mudd Executive Director National Council on Electricity Policy
Ellen Petrill Director PublicPrivate Partnerships Electric Power Research Institute
Alan Richardson President and Chief Executive Officer American Public Power Association
Steve Rosenstock Manager Energy Solutions Edison Electric Institute
Diane Shea Executive Director National Association of State Energy Officials
Rick Tempchin Director Retail Distribution Policy Edison Electric Institute
Mark Wolfe Executive Director Energy Programs Consortium
To create a sustainable aggressive national commitment to energy efficiency ES-11
Notes
1 Energy efficiency refers to using less energy to pro- See highlights of some of these programs in Chapter vide the same or improved level of service to the 6 Energy Efficiency Program Best Practices Tables energy consumer in an economically efficient way 6-1 and 6-2 The term energy efficiency as used here includes 10 These economic and environmental savings estishyusing less energy at any time including at times of mates are extrapolations of the results from region-peak demand through demand response and peak al program to a national scope Actual savings at the shaving efforts regional level vary based on a number of factors For
2 Addressing transportation-related energy use is also these estimates avoided capacity value is based on an important challenge as energy demand in this peak load reductions de-rated for reductions that do sector continues to increase and oil prices hit historshy not result in savings of capital investments ical highs However transportation issues are out- Emissions savings are based on a marginal on-peak side the scope of this effort which is focused only generation fuel of natural gas and marginal off-on electricity and natural gas systems peak fuel of coal with the on-peak period capacity
3 This effort is focused on energy efficiency for regushy requirement double that of the annual average lated energy forms Energy efficiency for unregulat- These assumptions vary by region based upon situashyed energy forms such as fuel oil for example is tion-specific variables Reductions in capped emisshyclosely related in terms of actions in buildings but is sions might reduce the cost of compliance quite different in terms of how policy can promote 11 This estimate of the funding required assumes 2 investments percent of revenues across electric utilities and 05
4 A utility is broadly defined as an organization that percent across gas utilities The estimate also delivers electric and gas utility services to end users assumes that energy efficiency is delivered at a total including but not limited to investor-owned pub- cost (utility and participant) of $004 per kWh and licly-owned cooperatively-owned and third-party $3 per million British thermal units (MMBtu) which energy efficiency utilities are higher than the costs of many of todayrsquos programs
5 Many energy efficiency programs have an average 12 This estimate is provided as an indicator of underinshylife cycle cost of $003kilowatt-hour (kWh) saved vestment and is not intended to establish a national which is 50 to 75 percent of the typical cost of new funding target Appropriate funding levels for pro-power sources (ACEEE 2004 EIA 2006) The cost grams should be established at the regional state of energy efficiency programs varies by program and or utility level In addition energy efficiency invest-can include higher cost programs and options with ments by customers businesses industry and govshylower costs to a utility such as modifying rate designs ernment also contribute to the larger economic and
6 See Chapter 6 Energy Efficiency Program Best environment benefits of energy efficiency Practices for more information on leading programs 13 One example of energy efficiencyrsquos ability to meet
7 Data refer to EIA 2006 new power costs and gas load growth is the Northwest Power Planning prices in 2015 compared to electric and gas pro- Councilrsquos Fifth Power Plan which uses energy con-gram costs based on leading energy efficiency proshy servation and efficiency to meet a targeted 700 MW grams many of which are discussed in Chapter 6 of forecasted capacity between 2005 and 2009 Energy Efficiency Program Best Practices (NWPCC 2005)
8 Based on leading energy efficiency programs many of which are discussed in Chapter 6 Energy Efficiency Program Best Practices
9 These estimates are based on assumptions of avershyage program spending levels by utilities or other program administrators with conservatively high numbers for the cost of energy efficiency programs
ES-12 National Action Plan for Energy Efficiency
References For More Information
American Council for an Energy-Efficient Economy [ACEEE] (2004) A Federal System Benefits Fund Assisting States to Establish Energy Efficiency and Other System Benefit Programs Washington DC
Innovest Strategic Value Advisors [Innovest] (2002 October) Energy Management amp Investor Returns The Real Estate Sector
Kushler M PhD York D PhD and Witte P MA (2005 January) Examining the Potential for Energy Efficiency to Help Address the Natural Gas Crisis in the Midwest Washington DC American Council for an Energy-Efficient Economy [ACEEE]
Nadel S Shipley A and Elliott RN (2004) The Technical Economic and Achievable Potential for Energy Efficiency in the USmdashA Meta-Analysis of Recent Studies Washington DC American Council for an Energy-Efficient Economy [ACEEE]
New York State Energy Research and Development Authority [NYSERDA] (2004 May) New York Energy $martSM Program Evaluation and Status Report Report to the System Benefits Charge Advisory Group Final Report Albany
Northeast Energy Efficiency Partnerships [NEEP] (2005 May) Economically Achievable Energy Efficiency Potential in New England Optimal Energy
Northwest Power and Conservation Council [NWPCC] (2005 May) The 5th Northwest Electric Power and Conservation Plan lthttpwwwnwcouncilorg energypowerplandefaulthtmgt
Southwest Energy Efficiency Project [SWEEP] (2002 November) The New Mother Lode The Potential for More Efficient Electricity Use in the Southwest Report for the Hewlett Foundation Energy Series
US Energy Information Administration [EIA] (2006) Annual Energy Outlook 2006 Washington DC
Western Governorsrsquo Association [WGA] (2006 June) Clean Energy a Strong Economy and a Healthy Environment A Report of the Clean and Diversified Energy Advisory Committee
Stacy Angel
US Environmental Protection Agency Office of Air and Radiation Climate Protection Partnerships Division Tel (202) 343-9606 E-mail angelstacyepagov
Larry Mansueti
US Department of Energy Office of Electricity Delivery and Energy Reliability Tel (202) 586-2588 E-mail lawrencemansuetihqdoegov
Or visit wwwepagovcleanenergyeeactionplan
To create a sustainable aggressive national commitment to energy efficiency ES-13
1Introduction and Background
Overview
We currently face a number of challenges in securing affordable reliable secure and clean energy to meet our nationrsquos growing energy demand Demand is outshypacing supply costs are rising and concerns for the envishyronment are growing
Improving the energy efficiency1 of our homes businessshyes schools governments and industries ndash which conshysume more than 70 percent of the energy used in the countrymdashis one of the most constructive cost-effective ways to address these challenges Greater investment in energy efficiency programs across the country could help meet our growing electricity and natural gas demand save customers billions of dollars on their energy bills reduce emissions of air pollutants and greenhouse gases and contribute to a more secure reliable and low-cost energy system Despite this opportunity energy efficienshycy remains an under-utilized resource in the nationrsquos energy portfolio
There are many ways to increase investment in cost-effective energy efficiency including developing building codes and appliance standards implementing governshyment leadership efforts and educating the public through programs such as ENERGY STARreg2 Another important area is greater investment in organized enershygy efficiency programs that are managed by electric and natural gas providers states or third-party administrashytors Energy efficiency programs already contribute to the energy mix in many parts of the country and have delivered significant savings and other benefits Despite the benefits these programs face hurdles in many areas of the country Identifying and removing these barriers is a focus of this effort
October 2005 Excerpt from Letter From Co-Chairs to the National Action Plan for Energy Efficiency Leadership Group
Energy efficiency is a critically under-utilized resource in the nationrsquos energy portfolio Those states and utilities that have made significant investments in energy effishyciency have lowered the growth for energy demand and moderated their energy costs However many hurdles remain that block broader investments in cost-effective energy efficiency
That is why we have agreed to chair the Energy Efficiency Action Plan It is our hope that with the help of leading organizations like yours we will identify and overcome these hurdles
Through this Action Plan we intend to identify the major barriers currently limiting greater investment by utilities in energy efficiency We will develop a series of business cases that will demonstrate the value and contributions of energy efficiency and explain how to remove these barriers (including regulatory and market challenges) These business cases along with descriptions of leading energy efficiency programs will build upon practices already in place across the country
Diane Munns Jim Rogers PresidentNARUC President and CEO Member Iowa Utilities Board Duke Energy
To drive a sustainable aggressive national commitment to energy efficiency through gas and electric utilities utility regulators and partner organizations more than 50 leading organizations joined together to develop this National Action Plan for Energy Efficiency The Action Plan is co-chaired by Diane Munns Member of the Iowa
1 Energy efficiency refers to using less energy to provide the same or improved level of service to the energy consumer in an economically efficient way The term energy efficiency as used here includes using less energy at any time including at times of peak demand through demand response and peak shaving efforts
2 See EPA 2006 for a description of a broad set of policies being used at the state level to advance energy efficiency
To create a sustainable aggressive national commitment to energy efficiency 1-1
Utilities Board and President of the National Association of Regulatory Utility Commissioners and Jim Rogers President and Chief Executive Officer of Duke Energy The Leadership Group includes representatives from a broad set of stakeholders including electric and gas utilities state utility commissioners state air and energy agencies energy service providers energy consumers and energy efficiency and consumer advocates This effort is facilitated by the US Department of Energy (DOE) and the US Environmental Protection Agency (EPA) The National Action Plan for Energy Efficiency
bull Identifies key barriers limiting greater investment in energy efficiency
bull Reviews sound business practices for removing these barriers and improving the acceptance and use of enershygy efficiency relative to energy supply options and
bull Outlines recommendations and options for overcoming these barriers
In addition members of the Leadership Group are comshymitting to act within their own organizations and spheres of influence to increase attention and investshyment in energy efficiency Greater investment in energy efficiency cannot happen based on the work of one indishyvidual or organization alone The Leadership Group recognizes that the joint efforts of the customer utility regulator and partner organizations are needed to reinshyvigorate and increase the use of energy efficiency in America As energy experts utilities may be in a unique position to play a leadership role
The rest of this introduction chapter establishes why now is the time to increase our investment in energy effishyciency outlines the approach taken in the National Action Plan for Energy Efficiency and explains the strucshyture of this report
Why Focus on Energy Efficiency
Energy Challenges
We currently face multiple challenges in providing affordable clean and reliable energy in todayrsquos complex energy markets
bull Electricity demand continues to rise Given current energy consumption and demographic trends DOE projects that US energy consumption will increase by more than one-third by the year 2025 Electric power consumption is expected to increase by almost 40 percent and total fossil fuel use is projected to increase similarly (EIA 2005) At work and at home we continue to rely on more energy-consuming devices This growth in demand stresses current systems and requires substantial new investments in system expansions
bull High energy prices Our demand for natural gas to heat our homes for industrial and business uses and for power plants is straining the available gas supply in North America and putting upward pressure on natushyral gas prices Many household budgets are being strained by higher energy costs leaving less money available for other household purchases and needs this situation is particularly harmful for low-income households Consumers are looking for ways to manshyage their energy bills Higher energy bills for industry are reducing the nationrsquos economic competitiveness and placing US jobs at risk Higher energy prices also raise the financial risk associated with the developshyment of new natural gas-fired power plants which had been expected to make up more than 60 percent of capacity additions over the next 20 years (EIA 2005) Coal prices are also increasing and contributing to higher electricity costs
bull Energy system reliability Events such as the Northeast electricity blackout of August 2003 and Hurricanes Katrina and Rita in 2005 highlighted the vulnerability of our energy system to disruptions This led to an
1-2 National Action Plan for Energy Efficiency
increased focus on energy reliability and its economic and human impacts as well as national security conshycerns using fossil fuel more efficiently and increasing energy supply diversity
bull Transmission systems are overburdened in some places limiting the flow of economical generation and in some cases shrinking reserve margins of the electricity grid to inappropriately small levels This situation can cause reliability problems and high electricity prices in or near congested areas
bull Environmental concerns Energy demand continues to grow as national and state regulations are being impleshymented to significantly limit the emissions of air pollushytants such as sulfur dioxide (SO2) nitrogen oxides (NOx) and mercury to protect public health and the environshyment Many existing base load generation plants are aging and significant retrofits are needed to ensure old generating units meet these emissions regulations In addition emissions of greenhouse gases continue to increase
Addressing these issues will require billions of dollars in investments in new power plants gas rigs transmission lines pipelines and other infrastructure notwithstandshying the difficulty of building new energy infrastructure in dense urban and suburban locations even with current energy efficiency investment The decisions we make now regarding our energy supply and demand can either help us deal with these challenges more effectively or complicate our ability to secure a more stable economishycal energy future
Benefits of Energy Efficiency
Greater investment in energy efficiency can help us tackle these challenges Energy efficiency is already a key composhynent in the nationrsquos energy resource mix in many parts of
the country and experience shows that energy efficiency programs can lower customer energy bills cost less than and help defer new energy production provide environshymental benefits and spur local economic development Some of the major benefits of energy efficiency include
bull Lower energy bills greater customer control and greater customer satisfaction Well-designed programs can provide opportunities for all customer classes to adopt energy savings measures and reduce their enershygy bills3 These programs can help customers make sound energy use decisions increase control over their energy bills with savings of 5 to 30 percent and empower them to manage their energy usage Customers often express greater satisfaction with elecshytricity and natural gas providers where energy efficienshycy is offered
bull Lower cost than supplying new generation only from new power plants Well-designed energy efficiency programs are saving energy at an average cost of one-half of the typical cost of new power sources and about one-third of the cost of providing natural gas4
When integrated into a long-term energy resource plan energy efficiency could help defer investments in new plants and lower the total energy system cost
bull Modular and quick to deploy Energy efficiency proshygrams can be ramped up over a period of one to three years to deliver sizable savings These programs can also be targeted to congested areas with high prices to bring relief where it might be difficult to deliver new supply in the near term
bull Significant energy savings Well-designed energy effishyciency programs are delivering energy savings each year on the order of 1 percent of total electric and natshyural gas sales5 These programs are helping to offset 20 to 50 percent of expected growth in energy
3 See Chapter 6 Energy Efficiency Program Best Practices for more information on leading programs 4 Based on new power costs and gas prices in 2015 (EIA 2006) compared to electric and gas program costs based on leading energy programs many of
which are discussed in Chapter 6 Energy Efficiency Program Best Practices 5 Based on leading energy efficiency programs many of which are discussed in Chapter 6 Energy Efficiency Program Best Practices
To create a sustainable aggressive national commitment to energy efficiency 1-3
demand in some areas without compromising the end usersrsquo activities and economic well-being (Nadel et al 2004 EIA 2006)
bull Environmental benefits Cost-effective energy efficienshycy offers environmental benefits related to reduced demand such as reduced air pollution and greenhouse gas emissions lower water use and less environmental damage from fossil fuel extraction Energy efficiency is an attractive option for generation owners in advance of requirements to reduce greenhouse gas emissions
bull Economic development Greater investment in energy efficiency helps build jobs and improve state economies Energy efficiency users often redirect their bill savings toward other activities that increase local and national employment with a higher employment impact than if the money had been spent to purchase energy (York and Kushler 2005 NYSERDA 2004) Many energy effishyciency programs create construction and installation jobs with multiplier impacts on other employment and local economies (Sedano et al 2005) Local investshyments in energy efficiency can offset energy imports from out-of-state improving the state balance of trade Lastly energy efficiency investments usually create long-lasting infrastructure changes to building equipment and appliance stocks creating long-term property improvements that deliver long-term economic value (Innovest 2002)
bull Energy security Energy efficiency reduces the level of US per capita energy consumption thus decreasing the vulnerability of the economy and individual conshysumers to energy price disruptions from natural disasters and attacks upon domestic and international energy supplies and infrastructure
Decades of Experience With Energy
Efficiency
Utilities and their regulators began recognizing thepotential benefits of improving efficiency and reducingdemand in the 1970s and 1980s These ldquodemand-side
Long Island Power Authorityrsquos (LIPA) Clean Energy Program Drives Economic Development Customer Savings and Environmental Quality Enhancements
LIPA started its Clean Energy Initiative in 1999 and has invested $229 million over the past 6 years LIPArsquos portfolio of energy efficiency programs from 1999 to 2005 produced significant energy savings emissions reductions and stimulated economic growth on Long Island
bull 296 megawatts (MW) peak demand savings
bull 1348 gigawatt-hours (GWh) cumulative savings
bull Emissions reductions of
bull Greater than 937402 tons of carbon dioxide (CO2)
bull Greater than 1334 tons of NOX
bull Greater than 4298 tons of SO2
bull $275 million in customer bill savings and rebates
bull $234 million increase in net economic output on Long Island
bull 4500 secondary jobs created
Source LIPA 2006
managementrdquo (DSM) approaches meet increased demands for electricity or natural gas by managing the demand on the customerrsquos side of the meter rather than increasing or acquiring more supplies Planning processes such as ldquoleast-cost planningrdquo or ldquointegrated resource planningrdquo have been used to evaluate DSM programs on par with supply options and allow investment in DSM programs when they cost less than new supply options
DSM program spending exceeded $2 billion a year (in 2005 dollars) in 1993 and 1994 (York and Kushler 2005) In the late 1990s funding for utility-sponsored energy efficiency was reduced in about half of the states due to changed regulatory structures and increased political and regulatory pressures to hold down electricishyty prices This funding has partially recovered with new
1-4 National Action Plan for Energy Efficiency
policies and funding mechanisms (see Figure 1-1) impleshymented to ensure that some level of cost-effective energy efficiency was pursued
Notwithstanding the policy and regulatory changes that have affected energy efficiency program funding wide scale organized energy efficiency programs have now been operating for decades in certain parts of the counshytry These efforts have demonstrated the following
bull Energy efficiency programs deliver significant savings In the mid-1990s based on the high program funding levels of the early 1990s electric utilities estimated proshygram savings of 30 gigawatts (the output of about 100 medium-sized power plants) and more than 60 million megawatt-hours (MWh)
bull Energy efficiency programs can be used to meet a sigshynificant portion of expected load growth For example
mdash The Pacific Northwest region has met 40 percent of its growth over the past two decades through energy efficiency programs (see Figure 1-2)
mdash Californiarsquos energy efficiency goals adopted in 2004 by the Public Utilities Commission are to
Connecticutrsquos Energy Efficiency Programs Generate Savings of $550 Million in 2005 In 2005 the Connecticut Energy Efficiency Fund managed by the Energy Conservation Management Board invested $80 million in enershygy efficiency This investment is expected to proshyduce $550 million of bill savings to Connecticut electricity consumers In addition the 2005 proshygrams administered by Northeast Utilities and United Illuminating resulted in
bull 126 MW peak demand reduction
bull 4398 GWh lifetime savings
bull Emissions reductions of
mdash Greater than 27 million tons of CO2
mdash Greater than 1702 tons of NOX
mdash Greater than 4616 tons of SO2
bull 1000 non-utility jobs in the energy efficiency industry
Source CECMB 2006
Figure 1-1 Energy Efficiency Spending Has Declined
$25
Puget Sound Energyrsquos (PSE) Resource Plan Includes Accelerated Conservation to Minimize Risks and Costs
PSErsquos 2002 and 2005 Integrated Resource Plans (IRPs) found that the accelerated development of energy efficiency minimizes both costs and risks As a result PSE significantly expanded its energy efficiency efforts PSE is now on track to save 279 average MW (aMW) between 2006 and 2015more than the company had saved between 1980and 2004 The 279 aMW of energy efficiency repshyresents nearly 10 percent of its forecasted 2015
Inve
stm
ent
in b
illio
ns r
eal 2
005
dolla
rs
$00 1992 1993 1994 1995 1996 1997 1998 1999 2000 2001 2002 2003
$20
$15
$10
$05
Year sales
Source Data derived from ACEEE 2005 Scorecard (York and Kushler Source Puget Sound Energy 2005 2005) adjusted for inflation using US Department of Labor Bureau of
Labor Statistics Inflation Calculator
To create a sustainable aggressive national commitment to energy efficiency 1-5
use energy efficiency to displace more than half of future electricity load growth and avoid the need to build three large (500 MW) power plants
bull Energy efficiency is being delivered cost-competitively with new supply Programs across the country are demonstrating that energy efficiency can be delivered at a cost of 2 to 4 cents per kilowatt-hour (kWh) and a cost of $130 to $200 per lifetime million British thershymal units (MMBtu) saved
bull Energy efficiency can be targeted to reduce peak demand A variety of programs address the peak demand of different customer classes lowering the strain on existing supply assets (eg pipeline capacity transmission and distribution capacity and power plant capability) allowing energy delivery companies to betshyter utilize existing assets and deferring new capital investments
bull Proven cost-effective program models are available to build upon These program models are available for almost every customer class both gas and electric
Southern California Edisonrsquos (SCE) Energy Efficiency Investments Provide Economic and Environmental Savings
SCErsquos comprehensive portfolio of energy efficiency programs for 2006 through 2008 will produce
bull 3 percent average bill reduction by 2010
bull 35 billion kWh of energy savings
bull 888 MW of demand savings
bull 205 million tons of CO2 emission reductions
bull 55 million tons of NOX emission reductions
bull Energy saved at a cost of less than 41 centskWh Source Southern California Edison 2006
New York Statersquos Aggressive Energy Efficiency Programs Help Power the Economy As Well As Reduce Energy Costs
New York State Energy Research and Development Authorityrsquos (NYSERDArsquos) portfolio of energy efficiency programs for the period from 1999 to 2005 proshyduced significant energy savings as well as stimushylated economic growth and jobs and reduced energy prices in the state
bull 19 billion kWhyear of energy savings
bull 4166 added jobsyear (createdretained) from 1999 to 2017
bull $244 millionyear in added total economic growth from 1999 to 2017
bull $945 million in energy price savings over three years
Source NYSERDA 2006
National Case for Energy Efficiency
Improving the energy efficiency of homes businesses schools governments and industriesmdashwhich consume more than 70 percent of the energy used in the country mdash is one of the most constructive cost-effective ways to address the nationrsquos energy challenges Many of these buildings and facilities are decades old and will consume the majority of the energy to be used in these sectors for years to come State and regional studies have found that adopshytion of economically attractive but as yet untapped energy efficiency could yield more than 20 percent savings in total electricity demand nationwide by 2025 Depending on the underlying load growth these savings could help cut load growth by half or more compared to current forecasts (Nadel et al 2004 SWEEP 2002 NEEP 2005 NWPCC 2005 WGA 2006) Similarly energy efficiency targeted at direct natural gas use could lower natural gas demand growth by 50 percent (Nadel et al 2004) Furthermore studies also show that significant reductions in energy consumption can be achieved quickly (Callahan 2006) and at low costs for many years to come
1-6 National Action Plan for Energy Efficiency
0
500
Figure 1-2 Energy Efficiency Has Been a Resource in the Pacific Northwest for the Past Two Decades
Pacific Northwest Energy Efficiency Energy Efficiency Met Nearly 40 Percent of Pacific Achievements 1978 - 2004 Northwest Regional Firm Sales Growth Between 1980
to 2003 Since 1978 Bonneville Power
3000 Administration (BPA) amp Utility Programs Energy Codes amp Federal
2500 Efficiency Standards Have Produced Nearly 3000 aMW of Savings
2000
1500
1000
Generation Conservation
Ave
rage
Meg
awat
ts (a
MW
)
1978 1982 1986 1990 1994 1998 2002
BPA and Utility Programs
Alliance Programs
State Codes
Federal Standards
Source Eckman 2005
Capturing this energy efficiency resource would offer bull Avoided annual air emissions of more than 200 million substantial economic and environmental benefits across tons of CO2 50000 tons of SO2 and 40000 tons of NOX the country Widespread application of energy efficiency programs that already exist in some regions6 could deliv- These benefits illustrate the magnitude of the benefits er a large part of these potential savings Extrapolating cost-effective energy efficiency offers They are estimated the results from existing programs to the entire country based on (1) assumptions of average program spending would yield over the next 10 to 15 years7 levels by utilities or other program administrators that
currently sponsor energy efficiency programs and bull Energy bill savings of nearly $20 billion annually (2) conservatively high estimates for the cost of the energy
efficiency programs themselves (see Table 1-1)9 They are bull Net societal benefits of more than $250 billion8 not meant as a prescription there are differences in
opportunities and costs for energy efficiency that need bull Avoided need for 20000 MW (40 new 500 MW- to be addressed at the regional state and utility level to
power plants) design and operate effective programs
6 See highlights of some of these programs in Chapter 6 Energy Efficiency Program Best Practices Tables 6-1 and 6-2 7 These economic and environmental savings estimates extrapolate the results from regional programs to a national scope Actual savings at the regionshy
al level vary based on a number of factors For these estimates avoided capacity value is based on peak load reductions de-rated for reductions that do not result in savings of capital investments Emission savings are based on a marginal on-peak generation fuel of natural gas and marginal off-peak fuel of coal with the on-peak period capacity requirement double that of the annual average These assumptions vary by region based upon situation-specific variables Reductions in capped emissions might reduce the cost of compliance
8 Net present value (NPV) assuming 5 percent discount rate 9 This estimate of the funding required assumes 2 percent of revenues across electric utilities and 05 percent across gas utilities The estimate also
assumes that energy efficiency is delivered at a total cost (utility and participant) of $004 per kWh and $3 per MMBtu which are higher than the costs of many of todayrsquos programs
To create a sustainable aggressive national commitment to energy efficiency 1-7
Table 1-1 Summary of Benefits for National Energy Efficiency Efforts
Program Cost Electric Natural Gas Total
Utility Program Spending ( of utility revenue) 20 05
Total Cost of Efficiency (customer amp utility) $35MWh $3MMBtu
Cost of Efficiency (customer) $15MWh $2MMBtu
Average Annual Cost of Efficiency ($MM) $6800 $1200
Total Cost of Efficiency (NPV $MM) $140000 $25000 $165000
Efficiency Spending - Customer (NPV $MM) $60000 $13000 $73000
Efficiency Program Spending - Utility (NPV $MM) $80000 $13000 $93000
Resulting Savings Electric Natural Gas Total
Net Customer Savings (NPV $MM) $277000 $76500 $353500
Annual Customer Savings $MM $18000 $5000 $23000
Net Societal Savings (NPV $MM) $270000 $74000 $344000
Annual Net Societal Savings ($MM) $17500 $5000 $22500
Decrease in Revenue Requirement (NPV $MM) $336000 $89000 $425000
Annual Decrease in Revenue Requirement ($MM) $22000 $6000 $28000
Energy Savings Electric Natural Gas Total
Percent of Growth Saved Year 15 61 52
Percent of Consumption Saved Year 15 12 5
Peak Load Reduction Year 15 (De-rated)1 34000 MW
Energy Saved Year 15 588000 GWh 1200 BcF
Energy Saved (cumulative) 9400000 GWh 19000 BcF
Emission Reductions Electric Natural Gas Total
CO2 Emission Reduction (1000 Tons) Year 15 338000 72000 410000
NOx Emission Reduction (Tons) Year 15 67000 61000 128000
Other Assumptions Electric Natural Gas
Load Growth () 2 1
Utility NPV Discount Rate 5 5
Customer NPV Discount Rate 5 5
EE Project Life Term (years) 15 15
Source Energy Efficiency Benefits Calculator developed for the National Action Plan for Energy Efficiency 2006
NPV = net present value $MM = million dollars1 De-rated peak load reduction based on the coincident peak load reduced multiplied by the percent of growth-related capital expenditures that are saved
Peak load reductions in unconstrained areas are not counted
1-8 National Action Plan for Energy Efficiency
As a nation we are passing up these savings by subshystantially underinvesting in energy efficiency One indishycator of this underinvestment is the level of energy efficiency program funding across the country Based on the effectiveness of current energy efficiency proshygrams operated in certain parts of the country the funding necessary to yield the economic and environshymental benefits presented above is approximately four times the funding levels for organized efficiency proshygrams today (less than $2 billion per year) Again this is one indicator of underinvestment and not meant to be a national funding target Appropriate funding levels need to be established at the regional state or utility level based on the cost-effective potential for energy efficiency as well as other factors
The current underinvestment in energy efficiency is due to a number of well-recognized barriers Some key barshyriers arise from choices concerning regulation of electric and natural gas utilities These barriers include
bull Market barriers such as the well-known ldquosplit-incenshytiverdquo barrier which limits home buildersrsquo and commershycial developersrsquo motivation to invest in new building energy efficiency because they do not pay the energy bill and the transaction cost barrier which chronically affects individual consumer and small business decision-making
bull Customer barriers such as lack of information on enershygy saving opportunities lack of awareness of how energy efficiency programs make investments easier through low-interest loans rebates etc lack of time and attention to implementing efficiency measures and lack of availability of necessary funding to invest in energy efficiency
bull Public policy barriers which often discourage efficienshycy investments by electric and natural gas utilities transmission and distribution companies power proshyducers and retail electric providers Historically these organizations have been rewarded more for building infrastructure (eg power plants transmission lines pipelines) and increasing energy sales than for helping their customers use energy wisely even when the energy-saving measures might cost less10
bull Utility state and region planning barriers which do not allow energy efficiency to compete with supply-side resources in energy planning
bull Energy efficiency program barriers which limit investshyment due to lack of knowledge about the most effecshytive and cost-effective energy efficiency program portfolios programs for overcoming common market barriers to energy efficiency or available technologies
While a number of energy efficiency policies and proshygrams contribute to addressing these barriers such as building codes appliance standards and state governshyment leadership programs energy efficiency programs organized through electricity and gas providers also encourage greater energy efficiency in the homes buildings and facilities that exist today that will conshysume the majority of the energy used in these sectors for years to come
10 Many energy efficiency programs have an average lifecycle cost of $003kWh saved which is 50-75 of the typical cost of new power sources (ACEEE 2004 EIA 2006)
To create a sustainable aggressive national commitment to energy efficiency 1-9
The National Action Plan for Energy
Efficiency
To drive a sustainable aggressive national commitment to energy efficiency through gas and electric utilities utility regulators and partner organizations more than 50 leading organizations joined together to develop this National Action Plan for Energy Efficiency The Leadership Group members (Table 1-2) have developed this National Action Plan for Energy Efficiency Report which
bull Reviews the barriers limiting greater investment in energy efficiency by gas and electric utilities and partshyner organizations
bull Presents sound business strategies that are available to overcome these barriers
bull Documents a set of business cases showing the impacts on key stakeholders as utilities under different circumstances increase energy efficiency programs
bull Presents best practices for energy efficiency program design and operation
bull Presents policy recommendations and options for spurring greater investment in energy efficiency by utilshyities and energy consumers
The report chapters address four main policy and proshygram areas (see Figure 1-3)
bull Utility Ratemaking and Revenue Requirements Lost sales from the expanded use of energy efficiency have a negative effect on the financial performance of elecshytric and natural gas utilities particularly those that are investor-owned under conventional regulation Cost-recovery strategies have been designed and impleshymented to successfully ldquodecouplerdquo utility financial health from electricity sales volumes to remove finanshycial disincentives to energy efficiency and incentives have been developed and implemented to make enershygy efficiency investments as financially rewarding as capital investments
The goal of the National Action Plan for Energy Efficiency is to create a sustainshyable aggressive national commitment to energy efficiency through gas and electric utilities utility regulators and partner organizations
The Leadership Group bull Recognizes that utilities and regulators have critishy
cal roles in creating and delivering energy efficienshycy programs to their communities
bull Recognizes that success requires the joint efforts of the customer utility regulator and partner organizations
bull Will work across their spheres of influence to remove barriers to energy efficiency
bull Commits to take action within their own organishyzation to increase attention and investment in energy efficiency
Leadership Group Recommendations bull Recognize energy efficiency as a high-priority
energy resource
bull Make a strong long-term commitment to impleshyment cost-effective energy efficiency as a resource
bull Broadly communicate the benefits of and opporshytunities for energy efficiency
bull Promote sufficient timely and stable program funding to deliver energy efficiency where cost-effective
bull Modify policies to align utility incentives with the delivery of cost-effective energy efficiency and modify ratemaking practices to promote energy efficiency investments
1-10 National Action Plan for Energy Efficiency
bull Planning Processes Energy efficiency along with other customer-side resources are not fully integrated into state and utility planning processes that identify the need to acquire new electricity and natural gas resources
bull Rate Design Some regions are successfully using rate designs such as time-of-use (TOU) or seasonal rates to more accurately reflect the cost of providing electricity and to encourage customers to consume less energy
bull Energy Efficiency Program Best Practices Documentation One reason given for slow adoption of energy efficiency
is a lack of knowledge about the most effective and cost-effective energy efficiency program options However many states and electricity and gas providers are successfully operating energy efficiency programs across end-use sectors and customer classes including residential commercial industrial low-income and small business These programs employ a variety of approaches including providing public information and training offering financing and financial incenshytives allowing energy savings bidding and offering performance contracting
Figure 1-3 National Action Plan for Energy Efficiency Report Addresses Actions to Encourage Greater Energy Efficiency
Timeline Actions to Encourage Greater Energy Efficiency
Utility Resource Program Policy Structure Planning Implementation
Develop Utility Incentives for Energy Efficiency
Develop Rate Designs to Encourage Energy Efficiency
Include Energy Efficiency in Utility Resource Mix
Measurement amp Evaluation
Program Roll-out
Develop Effective Energy Efficiency Programs
Revise Plans and Policies Based on Results
Action Plan Report Chapter Areas and Key Barriers
Utility Ratemaking amp Revenue
Requirements
Energy efficiency reduces utility earnings
Planning Processes
Planning does not incorporate demand-
side resources
Rate Design
Rates do not encourage energy
efficiency investments
Model Program
Documentation
Limited information on existing best practices
To create a sustainable aggressive national commitment to energy efficiency 1-11
Business Cases for Energy Efficiency
A key element of the National Action Plan for Energy Efficiency is exploring the benefits of energy efficiency and the mechanisms and policies that might need to be modified so that each of the key stakeholders can beneshyfit from energy efficiency investments A key issue is that adoption of energy efficiency saves resources and utility costs but also reduces utility sales Therefore the effect on utility financial health must be carefully evaluated To that end the Leadership Group offers an Energy Efficiency Benefits Calculator (Calculator) that evaluates the financial impact of energy efficiency on its major stakeholdersmdashutilities customers and society The
Calculator allows stakeholders to examine different effishyciency and utility cases with transparent input assumpshytions
The business cases presented in Chapter 4 of this report show the impact of energy efficiency investments upon sample utilityrsquos financial health and earnings upon cusshytomer energy bills and upon social resources such as net efficiency costs and pollutant emissions In general the impacts of offering energy efficiency programs vershysus not offering efficiency follow the trends and findshyings illustrated below from the customer utility and society perspectives
Utility Perspective Energy efficiency affects utility revenues shareholder earnings and costs associated with capital investments The utility can be financially neutral to investments in energy efficiency at a minimum or encourage greater investment through the implementation of a variety of decoupling ratemaking and incentives policies These policies can ensure that shareholder returns and earnings could be the same or increased Utility investment in infrastructure and contractual obligations for energy procurement could be reduced providing a favorable balance sheet impact
Utility Returns ndash No Change or Increase
Utility earnings remain stable or increase if decoupling or the use of shareholder incenshytives accompanies an energy efficiency program Without incentives earnings might be lower because effective energy efficiency will reduce the utilityrsquos sales volume and reduce the utilityrsquos rate base and thus the scope of its earnings
Change in Utility Earnings ndash Results Vary
Depending on the inclusion of decoupling andor shareholder incentives utility earnshyings vary Utility earnings increase if decoupling or shareholder incentives are included If no incentives earnings might be lower due to reduced utility investment
Peak Load Growth and Associated Capital Investment ndash Decreases
Capital investments in new resources and energy delivery infrastructure are reduced because peak capacity savings are captured due to energy efficiency measures
Customer Perspective Customersrsquo overall bills will decrease with energy efficiency because lower energy usage offsets potential rate increases to cover the cost of offering the efficiency program
Customer Bills ndash Decrease
Total customer bills decline over time as a result of investment in cost-effective energy efficiency programs as customers save due to lower energy consumption This decline follows an initial rise in customer bills reflecting the cost of energy efficiency programs which will then reduce costs over many years
1-12 National Action Plan for Energy Efficiency
Customer Perspective (continued)
Customer Rates ndash Mild Increase12
Rates might increase slightly to cover the cost of the energy efficiency program
Community or Society Perspective From a broad communitysociety perspective energy efficiency produces real savshyings over time While initially energy efficiency can raise energy costs slightly to finance the new energy efficiency investment the reduced bills (as well as price moderation effects) provide a rapid payback on these investments especially compared to the ongoing costs to cover the investments in new energy production and delivery infrastrucshyture costs Moreover the environmental benefits of energy efficiency continue to grow The Calculator evaluates the net societal savings utility savings emissions reductions and the avoided growth in energy demand associated with energy efficiency
Net Resources Savings ndash Increases
Over time as energy efficiency programs ramp up cumulative energy efficiency savshyings lead to cost savings that exceed the energy efficiency program cost
Total Resource Cost (TRC) per Unit - Declines
Total cost of providing each unit of energy (MWh MMBtu gas) declines over time because of the impacts of energy savings decreased peak load requirements and decreased costs during peak periods Well-designed energy efficiency programs can deliver energy at an average cost less than that of new power sources
Emissions and Cost Savings ndash Increases
Efficiency prevents or avoids producing many annual tons of emissions and emission control costs
Growth Offset by EE ndash Increases
As energy efficiency programs ramp up the percent of growth that is offset by energy efficiency climbs and then levels as cumulative savings as a percent of demand growth stabilizes
12 The changes shown in the business cases indicate a change from what would have otherwise occurred This change does not include a one-time infrashystructure investment in the assumptions but it does include smooth capital expenditures Energy efficiency will moderate prices of fossil fuels The fuel price reductions from an aggressive energy efficiency program upon fuel prices have not been included and could result in an overall rate reduction
To create a sustainable aggressive national commitment to energy efficiency 1-13
About This Report
The National Action Plan for Energy Efficiency is strucshytured as follows
Chapter 2 Utility Ratemaking amp Revenue Requirements
bull Reviews mechanisms for removing disincentives for utilities to consider energy efficiency
bull Reviews the pros and cons for different strategies to reward utility energy efficiency performance including the use of energy efficiency targets shared savings approaches and shareholdercompany performance incentives
bull Reviews various funding options for energy efficiency programs
bull Presents recommendations and options for modifying policies to align utility incentives with the delivery of cost-effective energy efficiency and providing for suffishycient and stable program funding to deliver energy effishyciency where cost effective
Chapter 3 Energy Resource Planning Processes
bull Reviews state and regional planning approaches including Portfolio Management and Integrated Resource Planning which are being used to evaluate a broad array of supply and demand options on a level playing field in terms of their ability to meet projected energy demand
bull Reviews methods to quantify and simplify the value streams that arise from energy efficiency investmentsmdash including reliability enhancementcongestion relief peak demand reductions and greenhouse gas emissions reductionsmdashfor direct comparison to supply-side options
bull Presents recommendations and options for making a strong long-term commitment to cost-effective energy efficiency as a resource
Chapter 4 Business Case for Energy Efficiency
bull Outlines the business case approach used to examine the financial implications of enhanced energy efficienshycy investment on utilities consumers and society
bull Presents case studies for eight different electric and natural gas utility situations including different ownershyship structures gas and electric utilities and different demand growth rates
Chapter 5 Rate Design
bull Reviews a variety of rate design structures and their effect in promoting greater investment in energy effishyciency by the end-user
bull Presents recommended strategies that encourage greater use of energy efficiency through rate design
Chapter 6 Energy Efficiency Program Best Practices
bull Reviews and presents best practices for operating sucshycessful energy efficiency programs at a portfolio level addressing issues such as assessing energy efficiency potential screening energy efficiency programs for cost-effectiveness and developing a portfolio of approaches
bull Provides best practices for successful energy efficiency programs across end-use sectors customer classes and a broad set of approaches
bull Documents the political and administrative factors that lead to program success
Chapter 7 Report Summary
bull Summarizes the policy and program recommendations and options
1-14 National Action Plan for Energy Efficiency
For More Information
Visit the National Action Plan for Energy Efficiency Web site wwwepagovcleanenergyeeactionplanhtm or contact
Stacy Angel
US Environmental Protection Agency Office of Air and Radiation Climate Protection Partnerships Division AngelStacyepagov
Larry Mansueti
US Department of Energy Office of Electricity Delivery and Energy Reliability LawrenceMansuetihqdoegov
To create a sustainable aggressive national commitment to energy efficiency 1-15
Table 1-2 Members of the National Action Plan for Energy Efficiency
Co-Chairs
Diane Munns Member Iowa Utilities Board President National Association of Regulatory Utility Commissioners
Jim Rogers President and Chief Executive Officer Duke Energy
Leadership Group
Barry Abramson Senior Vice President Servidyne Systems LLC
Angela S Beehler Director of Energy Regulation Wal-Mart Stores Inc
Bruce Braine Vice President Strategic Policy Analysis American Electric Power
Jeff Burks Director of Environmental Sustainability PNM Resources
Kateri Callahan President Alliance to Save Energy
Glenn Cannon General Manager Waverly Light and Power
Jorge Carrasco Superintendent Seattle City Light
Lonnie Carter President and Chief Executive Officer Santee Cooper
Mark Case Vice President for Business Performance Baltimore Gas and Electric
Gary Connett Manager of Resource Planning and Great River Energy Member Services
Larry Downes Chairman and Chief Executive Officer New Jersey Natural Gas (New Jersey Resources Corporation)
Roger Duncan Deputy General Manager Distributed Energy Services Austin Energy
Angelo Esposito Senior Vice President Energy Services and Technology New York Power Authority
William Flynn Chairman New York State Public Service Commission
Jeanne Fox President New Jersey Board of Public Utilities
Anne George Commissioner Connecticut Department of Public Utility Control
Dian Grueneich Commissioner California Public Utilities Commission
Blair Hamilton Policy Director Vermont Energy Investment Corporation
Leonard Haynes Executive Vice President Supply Technologies Southern Company Renewables and Demand Side Planning
Mary Healey Consumer Counsel for the State of Connecticut Connecticut Consumer Counsel
Helen Howes Vice President Environment Health and Safety Exelon
Chris James Air Director Connecticut Department of Environmental Protection
Ruth Kinzey Director of Corporate Communications Food Lion
Peter Lendrum Vice President Sales and Marketing Entergy Corporation
Rick Leuthauser Manager of Energy Efficiency MidAmerican Energy Company
Mark McGahey Manager Tristate Generation and Transmission Association Inc
Janine Migden- Consumersrsquo Counsel Office of the Ohio Consumersrsquo Counsel Ostrander
Richard Morgan Commissioner District of Columbia Public Service Commission
Brock Nicholson Deputy Director Division of Air Quality North Carolina Air Office
Pat Oshie Commissioner Washington Utilities and Transportation Commission
Douglas Petitt Vice President Government Affairs Vectren Corporation
1-16 National Action Plan for Energy Efficiency
Bill Prindle Deputy Director American Council for an Energy-Efficient Economy
Phyllis Reha Commissioner Minnesota Public Utilities Commission
Roland Risser Director Customer Energy Efficiency Pacific Gas and Electric
Gene Rodrigues Director Energy Efficiency Southern California Edison
Art Rosenfeld Commissioner California Energy Commission
Jan Schori General Manager Sacramento Municipal Utility District
Larry Shirley Division Director North Carolina Energy Office
Michael Shore Senior Air Policy Analyst Environmental Defense
Gordon Slack Energy Business Director The Dow Chemical Company
Deb Sundin Director Business Product Marketing Xcel Energy
Dub Taylor Director Texas State Energy Conservation Office
Paul von Director Energy and Environmental Affairs Johnson Controls Paumgartten
Brenna Walraven Executive Director National Property Management USAA Realty Company
Devra Wang Director California Energy Program Natural Resources Defense Council
Steve Ward Public Advocate State of Maine
Mike Weedall Vice President Energy Efficiency Bonneville Power Administration
Tom Welch Vice President External Affairs PJM Interconnection
Jim West Manager of energy right amp Green Power Switch Tennessee Valley Authority
Henry Yoshimura Manager Demand Response ISO New England Inc
Observers
James W (Jay) Counsel Steel Manufacturers Association Brew
Roger Cooper Executive Vice President Policy and Planning American Gas Association
Dan Delurey Executive Director Demand Response Coordinating Committee
Roger Fragua Deputy Director Council of Energy Resource Tribes
Jeff Genzer General Counsel National Association of State Energy Officials
Donald Gilligan President National Association of Energy Service Companies
Chuck Gray Executive Director National Association of Regulatory Utility Commissioners
John Holt Senior Manager of Generation and Fuel National Rural Electric Cooperative Association
Joseph Mattingly Vice President Secretary and General Counsel Gas Appliance Manufacturers Association
Kenneth Mentzer President and Chief Executive Officer North American Insulation Manufacturers Association
Christina Mudd Executive Director National Council on Electricity Policy
Ellen Petrill Director PublicPrivate Partnerships Electric Power Research Institute
Alan Richardson President and Chief Executive Officer American Public Power Association
Steve Rosenstock Manager Energy Solutions Edison Electric Institute
Diane Shea Executive Director National Association of State Energy Officials
Rick Tempchin Director Retail Distribution Policy Edison Electric Institute
Mark Wolfe Executive Director Energy Programs Consortium
To create a sustainable aggressive national commitment to energy efficiency 1-17
References
American Council for an Energy-Efficient Economy [ACEEE] (2004) A Federal System Benefits Fund Assisting States to Establish Energy Efficiency and Other System Benefit Programs Washington DC
Callahan K Alliance to Save Energy (2006 January 17) Energy Efficiency As a Cornerstone of National Energy Policy Presented to United States Energy Association Washington DC
Connecticut Energy Conservation Management Board [CECMB] (2006 March) Energy Efficiency Investing in Connecticutrsquos Future Report of The Energy Conservation Management Board Year 2005 Programs and Operations lthttpwwwdpucstatectusElectricnsfcafda4284 95eb61485256e97005e054b5abe828f8be753568 525713900520270$FILEFINAL20ECMB20200 520Reportpdfgt
Eckman T (2005 September 26) The Northwest Forecast Energy Efficiency Dominates Resource Development Paper presented at the ACEEE Energy Efficiency As a Resource Conference lthttpwwwnwcouncilorgenergypresentdefaulthtmgt
Innovest Strategic Value Advisors [Innovest] (2002 October) Energy Management amp Investor Returns The Real Estate Sector
Long Island Power Authority [LIPA] (2006) Clean Energy Initiative Annual Report 2005
Nadel S Shipley A and Elliott RN (2004) The Technical Economic and Achievable Potential for Energy Efficiency in the USmdashA Meta-Analysis of Recent Studies Washington DC American Council for an Energy-Efficient Economy [ACEEE]
New York State Energy Research and Development Authority [NYSERDA] (2006 May) New York Energy $martSM Program Evaluation and Status Report Report to the System Benefits Charge Advisory Group Draft Report
New York State Energy Research and Development Authority [NYSERDA] (2004 May) New York Energy $martSM Program Evaluation and Status Report Report to the System Benefits Charge Advisory Group Final Report Albany
Northeast Energy Efficiency Partnerships [NEEP] (2005 May) Economically Achievable Energy Efficiency Potential in New England Optimal Energy
Northwest Power and Conservation Council [NWPCC] (2005 May) The 5th Northwest Electric Power and Conservation Plan lthttpwwwnwcouncilorg energy powerplandefaulthtmgt
Puget Sound Energy (2005 April) Least Cost Plan lthttpwwwpsecomenergyEnvironment electricSupplyResPlanningaspxgt
Sedano R Murray C and Steinhurst W R (2005 May) Electric Energy Efficiency and Renewable Energy in New England An Assessment of Existing Policies and Prospects for the Future Montpelier VT The Regulatory Assistance Project
Southern California Edison (2006 January 6) Advice Letter (1955-e) to the California Energy Commission
Southwest Energy Efficiency Project [SWEEP] (2002 November) The New Mother Lode The Potential for More Efficient Electricity Use in the Southwest Report for the Hewlett Foundation Energy Series
US Energy Information Administration [EIA] (2006) Annual Energy Outlook 2006 Washington DC)
US Energy Information Administration [EIA] (2005 January) Annual Energy Outlook 2005 Washington DC) lthttpwwweiadoegovoiaf archiveaeo05indexhtmlgt
US Environmental Protection Agency [EPA] (2006) Clean Energy-Environment Guide to Action Policies Best Practices and Action Steps for States Washington DC
Western Governorsrsquo Association [WGA] (2006 June) Clean Energy a Strong Economy and a Healthy Environment A Report of the Clean and Diversified Energy Advisory Committee
York D and Kushler M (2005 October) ACEEErsquos 3rd
National Scorecard on Utility and Public Benefits Energy Efficiency Programs A National Review and Update of State Level Activity httpwwwaceeeorgpubsu054pdf
1-18 National Action Plan for Energy Efficiency
2Utility Ratemaking amp Revenue Requirements
While some utilities manage aggressive energy efficiency programs as a strategy to diversify their portfolio lower costs and meet customer demand many still face important financial disincentives to implementing such programs Regulators working with utilities and other stakeholders as well as boards working with publicly owned utilities can establish or reinforce several policies to help address these disincentives includshying overcoming the throughput incentive ensuring program cost recovery and defining shareholder performance incentives
Overview
The practice of utility regulation is in part a choice about how utilities make money and manage risk These regulatory choices can guide utilities toward or away from investing in energy efficiency demand response and distributed generation (DG) Traditional ratemaking approaches have strongly linked a utilityrsquos financial health to the volume of electricity or gas sold via the ratemaking structure creating a disincentive to investshyment in cost-effective demand-side resources that reduce sales The ratemaking structure and process establishes the rates that generate the revenues that gas and electric utilities both public and private can recover based on the just and reasonable costs they incur to operate the system and to procure and deliver energy resources to serve their customers
Alternate financial incentive structures can be designed to encourage utilities to actively promote implementashytion of energy efficiency when it is cost effective to do so Aligning utility and public interest aims by disconshynecting profits and fixed cost recovery from sales volshyumes ensuring program cost recovery and rewarding shareholders can ldquolevel the playing fieldrdquo to allow for a fair economically based comparison between supply-and demand-side resource alternatives and can yield a lower cost cleaner and reliable energy system
This chapter explores the utility regulatory approaches that limit greater deployment of energy efficiency as a resource in US electricity and natural gas systems Generally it is within the power of utility commissions and utilities to remove these barriers1 Eliminating the throughput incentive is one way to remove a disincentive to invest in efficiency Offering shareholder incentives will further encourage utility investment Other disincen-
Leadership Group Recommendations
Applicable to Utility Ratemaking and
Revenue Requirements
bull Modify policies to align utility incentives with the delivshyery of cost-effective energy efficiency and modify ratemaking practices to promote energy efficiency investments
bull Make a strong long-term commitment to implement cost-effective energy efficiency as a resource
bull Broadly communicate the benefits of and opportunities for energy efficiency
bull Provide sufficient timely and stable program funding to deliver energy efficiency where cost-effective
A more detailed list of options specific to the objective of promoting energy efficiency in ratemaking and revenue requirements is provided at the end of this chapter
1 In some cases state law limits the latitude of a commission to grant ratemaking or earnings flexibility Removing barriers to energy efficiency in these states faces the added challenge of amending statutes
To create a sustainable aggressive national commitment to energy efficiency 2-1
tives for energy efficiency include a short-term resource acquisition horizon and wholesale market rules that do not capture the system value of energy efficiency After an introduction to these barriers and solutions this chapter will report on successful efforts in states to implement these solutions The chapter closes with a set of recommendations for pursuing the removal of these barriers
This chapter refers to utilities as integrated energy comshypanies selling electricity as well as delivering it Many of these concepts however also apply to states that removed retail electricity sales responsibilities from utilishytiesmdashturning the utility into an electric transmission and distribution company without a retail sales function
Barriers and Solutions to Effective
Energy Efficiency Deployment
Common disincentives for utilities to invest more in cost-effective energy efficiency programs include the ldquothroughput incentiverdquo the lack of a mechanism for utilities to recover the costs of and provide funding for energy efficiency programs and a lack of shareholder and other performance incentives to compete with those for investments in new generation
Traditional Regulation Motivates Utilities to Sell More The Throughput Incentive
Rates change with each major ldquorate caserdquo the traditionshyal and dominant form of state-level utility ratemaking2
Between rate cases utilities have a financial incentive to increase retail sales of electricity (relative to forecast or historic levels which set ldquobaserdquo rates) and to maximize the ldquothroughputrdquo of electricity across their wires This incentive exists because there is often a significant increshymental profit margin on incremental sales When rates
are reset the throughput incentive resumes with the new base In jurisdictions where prices are capped for an extended time the utility might be particularly anxious to grow sales to add revenue to cover cost increases that might occur during the freeze
With traditional ratemaking there are few mechanisms to prevent ldquoover-recoveryrdquo of costs which occurs if sales are higher than projected and no way to prevent ldquounder-recoveryrdquo which can happen if forecast sales are too optimistic (such as when weather or regional ecoshynomic conditions deviate from forecasted or ldquonormalrdquo conditions)3
This dynamic creates an automatic disincentive for utilishyties to promote energy efficiency because those actions will reduce the utilityrsquos net incomemdasheven if energy effishyciency is clearly established and agreed-upon as a less expensive means to meet customer needs as a least-cost resource and is valuable to the utility for risk manageshyment congestion reduction and other reasons (EPA 2006) The effect of this disincentive is exacerbated in the case of distribution-only utilities because the revshyenue impact of electricity sales reduction is disproporshytionately larger for utilities without generation resources While some states have ordered utilities to implement energy efficiency others have questioned the practicality of asking a utility to implement cost-effective energy efficiency when their financial self-interest is to have greater sales
Several options exist to help remove this financial barrier to greater investment in energy efficiency
Decouple Sales from Profits and Fixed Cost Recovery
Utilities can be regulated or managed in a manner that allows them to receive their revenue requirement with less linkage to sales volume The point is to regulate utilities such that reductions in sales from consumer-funded energy
2 Public power utilities and cooperative utilities have their own processes to adjust rates that do not require state involvement 3 Over-recovery means that more money is collected from consumers in rates than is needed to pay for allowed costs including return on investment This
happens because average rates tend to collect more for sales in excess of projected demand than the marginal cost to produce and deliver the electricshyity for those increased sales Likewise under-recovery happens if sales are less than the amount used to set rates (Moskovitz 2000)
2-2 National Action Plan for Energy Efficiency
Utility and Industry Structure and Energy Efficiency
Publicly and Cooperatively Owned Utilities
Compared With Investor-Owned Utilities
The throughput incentive affects municipal and coopshyerative utilities in a distinctive way Public power and co-ops and their lenders are concerned with ensuring that income covers debt costs while they are not conshycerned about ldquoprofitsrdquo Available low-cost financing for co-ops sometimes comes with restrictions that limit its use to power lines and generation further diminishing interest in energy efficiency investments
Natural Gas vs Electric Utilities
Natural gas and electric utilities both experience the throughput incentive under traditional ratemaking Natural gas utilities operate in a more competitive environment than do electric utilities because of the non-regulated alternative fuels but this situation can cut either way for energy efficiency For some gas utilshyities energy efficiency is an important customer servshyice tool while in other cases it is just seen as an imposed cost that competitors do not have Natural gas companies in the United States also generally see a decline in sales due to state-of-the-art efficiencies in gas end uses a phenomenon not seen by electric companies Yet cost-effective efficiency opportunities for local gas distribution companies remain available
efficiency building codes appliance standards and distribshyuted generation are welcomed and not discouraged
For example if utility revenues were connected to the number of customers instead of sales the utility would experience different incentives and might behave quite difshyferently Under this approach at the conclusion of a conshyventional revenue requirement proceeding a utilityrsquos revshyenues per customer could be fixed An automatic adjustshyment to the revenue requirement would occur to account for new or departing customers (a more reliable driver of
Restructured vs Traditional Markets
The transition to retail electric competition threw open for reconsideration all assumptions about utility strucshyture The effects on energy efficiency have been strongly positive and negative The throughput incenshytive is stronger for distribution-only companies with no generation and transmission rate base Price caps which typically are imposed in a transition to retail competition diminish utility incentive to reduce sales because added revenue helps cope with new costs Price caps also discourage utilities from adding near-term costs that can produce a long-term benefit such as energy efficiency As a result energy efficiency is often disconnected from utility planning On the other hand several states have provided stable funding for energy efficiency as part of the restructuring process
High-Cost vs Low-Cost States
Energy efficiency has been more popular in high-cost states Low-cost states tend to see energy efficiency as more expensive than their supplies from hydroelectric and coal sources though there are exceptions where efficiency is seen as a low-cost incremental resource and a way to meet environmental goals Looking forshyward all states face similar higher cost options for new generation suggesting that the current resource mix will be less important than future resource options in considering the value of new energy efficiency investments
costs than sales) An alternative to the revenue per cusshytomer approach is to use a simple escalation formula to forecast the fixed cost revenue requirement over time
Under this type of rate structure a utility that is more effishycient and reduces its costs over time through energy effishyciency will be able to increase profits Furthermore if sales are reduced by any means (eg efficiency weather or ecoshynomic swings) revenues and profits will not be affected
To create a sustainable aggressive national commitment to energy efficiency 2-3
This approach eliminates the throughput disincentive and does not require a commission resolution of the amount of lost revenues associated with energy efficiency (see Table 2-1) A critical element of revenue decoupling is a true-up of actual results to forecasted results Rates would vary up or down reflecting a balancing account for total authorized revenue requirements and actual revshyenues from electricity or gas consumed by customers The true-up is fundamental to accomplish decoupling profits and fixed cost revenues from sales volumes Annual adjustments have been typical and can be modeled in the Energy Efficiency Benefits Calculator (see Chapter 4 Business Case for Energy Efficiency) but a quarterly or monthly adjustment might be preferred The plan may also include a deadband meaning that modest deviashytions from the forecast would produce no change in rates while larger deviations will result in a rate change The plan might also share some of the deviations between customers and the utility The magnitude of rate changes at any one time can be capped if the utility and regulators agree to defer the balance of exceptional changes to be resolved later Prudence reviews should be unaffected by a decoupling plan A decoupling plan would typically last a few years and could be changed to reflect new circumstances and lessons learned Decoupling has the potential to lower the risk of the utilshyity and this feature should lead to consumer benefits through an overall lower cost of capital to the utility4
Decoupling through a revenue per customer cap is presently more prevalent in natural gas companies but can be a sound tool for electric companies also Rate design need not be affected by decoupling (see Chapter 5 Rate Design for rate design initiatives that promote energy efficiency) and a shift of revenues from the varishyable portion of rates to the fixed portion does not address the throughput incentive The initial revenue requirement would be determined in a routine rate case the revenue per customer calculation would flow from
the same billing determinants used to set rates Service performance measures can be added to assure that cost reductions result from efficiency rather than service reductions Some state laws limit the use of balancing accounts and true-ups so legislative action would be necessary to enable decoupling in those states
A decoupling system can be simple or complex dependshying on the needs of regulators the utility or other parshyties and the value of a broad stakeholder process leading up to a decoupling system (Kantor 2006) As the text box addressing lessons learned suggests it is important to establish the priorities that the system is being creatshyed to address so it can be as simple as possible while avoiding unintended consequences Additionally it is important to evaluate any decoupling system to ensure it is performing as expected5
Shifting More Utility Fixed Costs Into Fixed Customer
Charges
Traditionally rates recover a portion of the utilityrsquos fixed costs through volumetric rates which helps service remain affordable To better assure recovery of capital asset costs with reduced dependence on sales state utilshyity commissions could reduce variable rates and increase the fixed rate component often referred to as the fixed charge or customer charge This option might be particshyularly relevant in retail competition states because wires-only electric utilities have relatively high proportions of fixed costs This shift is attractive to some natural gas systems experiencing sales volume attrition due to improved furnace efficiency and other trends This shift reduces the throughput incentive for distribution compashynies and is an alternative to decoupling There are some limiting concerns including the effect a reduction in the variable charge might have on consumption and conshysumers motivation to practice energy efficiency and the potential for high using consumers to benefit from the change while low-using customers pay more
4 The lowering of a gas utilityrsquos cost of capital because of the reduced risk introduced by a revenue decoupling mechanism was recently affirmed by Barone (2006)
5 Two recent papers discuss decoupling in some detail Costello 2006 and NERA 2006
2-4 National Action Plan for Energy Efficiency
The First Wave of Decoupling and Lessons Learned
In the early 1990s several state commissions and utilshyities responded to the throughput incentive by creatshying decoupling systems In all cases decoupling was discontinued by the end of the decade The reasons for discontinuation provide guidance to those considshyering decoupling today and indicate that the initial idea was good but that the execution left important issues unaddressed
In the case of California decoupling was functioning well using forecasted revenues and true-ups to actushyals but the move to retail competition precipitated its end in 1996 (CPUC 1996) Following the energy crishysis of 2000-2001 California recognized the imporshytance of long-term energy efficiency investments and reinstated mechanisms to eliminate the throughput incentive
Puget Sound Energy in Washington adopted a decoushypling plan in 1990 There were several problems The split between variable power costs (recovered via a true-up based on actual experience) and fixed costs (recovered based on a revenue-per-customer calculashytion) was wrong While customer numbers (and revenue) were increasing new investments in transshymission were not needed so the fixed cost part of the plan over-recovered Meanwhile new generation from independent generators was too expensive and this added power cost (minus a prudence disalshylowance which further complicated the scene) was passed to ratepayers Unlike the current California decoupling method there was no reasonable forecast over time for power costs Risk of power cost increasshyes was insufficiently shared The results were a big rate increase and anger among customers In retrospect risk allocation and the split of fixed and variable costs were incompatible to the events that followed and offer a useful lesson to future attempts The true-up
process and the weather normalization process worked well The power costs that ignited the controshyversy over the decoupling plan would have been recoverable in rates under the traditional system A recent effort to restore decoupling with Puget foundered over a dispute about whether the allowed return on equity during a prior rate case should be changed if decoupling was reinstated (Jim Lazar pershysonal communication October 21 2005)
Central Maine Power also adopted a decoupling plan at the beginning of the 1990s The plan was ill-equipped however to account for an ensuing steep economic downturn that reduced sales by several pershycentage points Unfortunately this effect far outshyweighed any benefits from energy efficiency The true-ups called for in the plan were onerous due to the dip in sales and authorities decided to delay them in hopes that the economy would turn around When that did not happen the rate change was quite large and was attributed to the decoupling plan even though most of the rate increase was due to reduced sales and would have occurred anyway A lesson from this experience is to not let the period between true-ups go on too long and to consider more carefully what happens if market prices the economy the weather or other significant drivers are well outside expected ranges
In both the Puget and Central Maine cases responsibilshyity for large rate increases was misassigned to the decoupling plan when high power costs from indeshypendent power producers (Puget) or general economic conditions (Central Maine) were primarily responsible That said serious but correctable flaws in the decoushypling plans left consumers exposed to more risk than was necessary
To create a sustainable aggressive national commitment to energy efficiency 2-5
Provide Utilities the Profit Lost Through Efficiency
Another way to address the throughput incentive is to calculate the profits foregone to successful energy effishyciency Lost Revenue Adjustment Mechanisms (LRAM) allow a utility to directly recoup the ldquolostrdquo profits and contributions to fixed costs associated with not selling additional units of energy because of the success of energy efficiency programs in reducing electricity conshysumption The amount of lost profit can be estimated by multiplying the fixed portion of the utilityrsquos prices by the
energy savings from energy efficiency programs or the energy generated from DG based on projected savings or ex post impact evaluation studies The amount of lost estimated profits is then directly returned to the utilityrsquos shareholders Some states have adopted these mechashynisms either through rate cases or add-ons to the fuel adjustment clause calculations
Experience has shown that LRAM can allow utilities to recover more profits than the energy efficiency program
Table 2-1 Options to Mitigate the Throughput Incentive Pros and Cons
Policy Pros Cons
Traditional cost of service plus return regulation
bull Familiar system for regulators and utilities
bull Rate changes follow rate cases (except for fuelpurchased gas adjustment clause states)
bull Reduced sales reduce net income and contributions to fixed costs
bull Sales forecasts can be contentious
bull Harder to connect good utility performance to a financial consequence Risks outside control of utility might be assigned to the utility
Decoupling (use of a forecast of revenue or revenue per customer with true-ups to actual results during a defined timeframe)
bull Removes sales incentive and distributed resource disincenshytives
bull Authorized fixed costs covered by revenue
bull All beneficial actions and policies that reduce sales (distribshyuted generation energy efficiency programs codes and standards voluntary actions by customers demand response) can be promoted by the utility without adversely affecting net income or coverage of fixed costs Opportunity to easily reward or penalize utilities based on performance
bull True-ups from balancing accounts or revenue per customer are simple
bull Easy to add productivity factors inflation adjustments and performance indicators with rewards and penalties that can be folded into the true-up process
bull Reduces volatility of utility revenue resulting from many causes Risks from abnormal weather economic performshyance or energy markets can be allocated explicitly between customers and the utility
bull Lack of experience Viewed by some as a more complex process
bull Quality of forecasts is very important
bull Some consumer advocates are uncomfortable with rate adjustments outside rate case or familiar fuel adjustment clause
bull Frequent rate adjustments from true-ups are objectionable to those favoring rate stability who worry about accountashybility for rate increases
bull Process of risk allocation can cause decoupling plan to break down Connection between reconstituted risks and cost of capital can cause impasse
bull Many issues to factor into the decoupling agreement Past experience with decoupling indicates that it can be hard to ldquoget it rightrdquo though these experiences suggest solutions
Lost revenue adjustment bull Restores revenue to utility that would have gone to earnshyings and coverage of fixed costs but is lost by energy effishyciency
bull Diminishes the throughput disincentive for specific qualifyshying programs
bull Any sales reductions from efficiency initiatives outside qualshyifying programs are not addressed leaving the throughput incentive in place
bull Historically contentious complex process to decide on lost revenue adjustment Potentially rewards under-performing energy efficiency programs
Independent energy efficiency administration
bull Administration of energy efficiency is assigned to an entity without the conflict of the throughput incentive
bull Utility can still promote load building Programs that would reduce sales outside the activities of the independent administrator might still be discouraged due to the throughput incentive
2-6 National Action Plan for Energy Efficiency
actually saved because the lost profit is based on projectshyed rather than actual energy savings Resolving LRAM in rate cases has been contentious in some states Furthermore because utilities still earn increased profits on additional sales this approach still discourages utilishyties from implementing additional energy efficiency or supporting independent energy efficiency activities A comparison of decoupling and the LRAM approach is provided in Table 2-1
A variation is to roughly estimate the amount of lost profshyits and make a specified portion (50 to 100 percent) availshyable to the utility to collect based on its performance at achieving certain program goals This approach is simpler and more constructive than a commission docket to calshyculate lost revenue It provides a visible way for the utilishyty to earn back lost profits with program performance and achievements consistent with the public interest This system translates well into employee merit pay systems and the goals can fit nicely into management objectives reported to shareholders a utilityrsquos board of directors or Governors Public interest groups appreciate the connecshytion to performance
Non-Utility Administration
Several states such as Oregon Vermont and New York have elected to relieve utilities from the task of managshying energy efficiency programs In some cases state govshyernment has taken on this responsibility and in others a third party was created or hired for this purpose The utility still has the throughput incentive so while effishyciency administration might be without conflict the utilshyity may still engage in load-building efforts contrary to the messages from the efficiency programs Addressing the throughput incentive remains desirable even where non-utility administration is in place Non-utility energy efficiency administration can apply to either electricity or natural gas Where non-utility energy efficiency adminisshytration is in place cooperation with the utility remains important to ensure that the customer receives good service (Harrington 2003)
Wholesale Power Markets and the Throughput
Incentive
In recent years wholesale electric power prices have increased driven by increases in commodity fuel costs In many parts of the country these increases have created a situation in which utilities with generation or firm power contracts that cost less than clearing prices might make a profit if they can sell excess energy into the wholesale market Some have questioned whether or not the situation of utilities seeing wholesale profits from reduced retail sales diminishes or removes the throughshyput incentive
Empirically these conditions do not appear to have moved utilities to accelerate energy efficiency program deployment In states in which generation is divested from the local utility the companies serving retail cusshytomers see no change to the throughput incentive There is little to suggest how these market conditions will persist or change In the absence of a more definishytive course change evidence suggests that the recent trend should not dissuade policymakers and market parshyticipants from addressing the throughput incentive
Recovering Costs Providing Funding for Energy Efficiency Programs
Removing the throughput incentive is a necessary step in addressing the barriers many utilities face to investing more in energy efficiency It is unlikely to be sufficient by itself in promoting greater investment however because under traditional ratemaking utilities might be unable to cover the costs of running energy efficiency programs6 To ensure funds are available for energy efficiency policy-makers can utilize and establish the following mechanisms with cooperation from stakeholders
Revenue Requirement or Procurement Funding
Policy-makers and regulators can set clear expectations that utilities should consider energy efficiency as a resource in their resource planning processes and it should spend money to procure that resource as it would
6 See Chapter 3 Energy Resource Planning Processes for discussion of utility resource planning budgets being used to fund energy efficiency
To create a sustainable aggressive national commitment to energy efficiency 2-7
for other resources This spending would be part of the utility revenue requirement and would likely appear as part of the resource procurement spending for all resources needed to meet consumer demand in all hours In retail competition states the default service provider the distribution company or a third party can handle the responsibility of acquiring efficiency resources
Spending Budgets
To reduce regulatory disputes and create an atmosphere of stability among utility managers trade allies and cusshytomers the legislature or regulator can determine a budget level for energy efficiency spendingmdashgenerally a percentage of utility revenue This budget level would be set to achieve some amount of the potentially available cost-effective program opportunities The spending budget allows administrator staff trade allies and conshysumers to count on a baseline level of effort and reduces the likelihood of spending disruptions that erode cusshytomer expectations and destroy hard-to-replace market infrastructure needed to deliver energy efficiency Unfortunately spending budgets are sometimes treated as a maximum spending level even if more cost-effective efficiency can be gained Alternatively a spending budgshyet can be treated as a minimum if policymakers also declare efficiency to be a resource In that event addishytional cost-effective investments would be recovered as part of the utility revenue requirement
Savings Target
An alternative to minimum spending levels is a minishymum energy savings target This alternative could be policy-driven (designed for consistency to obtain a cershytain percentage of existing sales or forecasted growth or as an Energy Efficiency Portfolio Standard [EEPS]) or resource-driven (changing as system needs dictate) Efficiency budgets can be devised annually to achieve the targets The use of savings targets does not address how money is collected from customers or how proshygram administration is organized For more information on how investments are selected see Chapter 3 Energy Resource Planning Processes
Clear Reliable and Timely Energy Efficiency Cost
Recovery System
Utilities value a clear and timely path to cost recovery and a well-functioning regulatory process should provide that Such a process contributes to a stable regulatory atmosphere that supports energy efficiency programs Cost recovery can be linked to program performance (as discussed in the next section) so that utilities would be responsible for prudent spending of efficiency funds
The energy efficiency program cost recovery issue is elimshyinated from the utility perspective if a non-utility adminshyistrative structure is used however this approach does not eliminate the throughput incentive Furthermore funding still needs to be established for the non-utility administrator
Tariff Rider for Energy Efficiency
A tariff rider for energy efficiency allows for a periodic rate adjustment to account for the difference between planned costs (included in rates) and actual costs
System Benefits Charge
In implementing retail competition several states added a separate charge to customer bills to collect funds for energy efficiency programs several other states have adopted this idea as well A system benefits charge (SBC) is designed to provide a stable stream of funds for public purposes like energy efficiency SBCs do have disadvantages If the funds enter the purview of state government they can be vulnerable to decisions to use the funds for general government purposes Also the charge appears to be an add-on to bills which can irrishytate some consumers This distinct funding stream can lead to a disconnection in resource planning between energy efficiency and other resources Regulators and utilities might need to take steps to ensure a comprehenshysive planning process when dealing with this type of funding7
7 This device might also pool funds for other public benefit purposes such as renewable energy system deployment and bill assistance for low-income consumers
2-8 National Action Plan for Energy Efficiency
Providing Incentives for Energy Efficiency Investment
Some suggest that if energy efficiency is a cost-effective resource utilities should invest in it for that reason with no reason for added incentives Others say that for effective results incentives should be considered because utilities are not rewarded financially for energy efficiency resources as they are for supply-side resources This section reviews options for utility incentives to promote energy efficiency
When utilities invest in hard assets they depreciate these costs over the useful lives of the assets Consumers pay a return on investment for the un-depreciated balance of costs not yet recovered which spreads the rate effect of the asset over time Utilities often do not have any opportunity to earn a return on energy efficiency spending as they do with hard assets This lack of opportunity for profit can introduce a bias against efficiency investment Incentives for energy efficiency should be linked to achieving performance objectives to avoid unnecessary expenditures and be evaluated by regulators based on their ability to produce cost-effective program performshyance Performance objectives can also form the basis of penalties for inferior program performance Financial incentives for utilities should represent revenues above those that would normally be recovered in a revenue requirement from a rate case
Energy Efficiency Costs Capitalize or Expense
In most jurisdictions energy efficiency costs are expensed which means all costs incurred for energy effishyciency are placed into rates during the year of the expense When a utility introduces an energy efficiency program or makes a significant increase or decrease in energy efficiency spending rates must change to collect all annual costs An increase in rates might be opposed by consumer advocates and other stakeholders especially if parties disagree on whether the energy efficiency programs are cost-effective
To moderate the rate effect of efficiency regulators could capitalize efficiency costs at least in part8
Capitalizing helps the utility by allowing for cost recovshyery over time but can cost consumers more than expensshying in the long run Some efficiency programs can meet short term rate-oriented cost-effectiveness tests if costs are capitalized However if the choice is made to capitalshyize the regulator still has to decide the appropriate amortization period for program costs balancing conshycern for immediate rate impacts and long term costs9
Capitalizing energy efficiency investments may be limitshyed by the magnitude of ldquoregulatory assetsrdquo that is appropriate for a utility Bond ratings might decline if the utility asset account has too many assets that are not backed by physical capital The limit on capitalized effishyciency investment varies depending on the rest of the utility balance sheet
Some argue that capitalizing energy efficiency is too costly and that rate effects from expensing are modest Others note that in some places capitalizing energy efficiency is the only way to deal with transitional rate effects and can provide a match over time between the costs and benefits of the efficiency investments (Arthur Rosenfeld personal communication February 20 2006)
In some cases it might be appropriate to consider encouraging unregulated utility affiliates to invest in and benefit from energy efficiency and other distributed resources
Bonus Return Shared Savings
To encourage energy efficiency investments over supply investments regulators can authorize a return on investshyment that is slightly higher (eg 5 percent) for energy efficiency investments or offer a bonus return on equity investment for superior performance Another approach is to share a percentage of the energy savings value pershyhaps 5 to 20 percent with the utility A shared savings system has the virtue of linking the magnitude of the
8 Capitalizing energy efficiency also reinforces the idea of efficiency as a substitute to supply and transmission 9 Iowa and Vermont initially capitalized energy efficiency spending but transitioned to expense in the late 1990s
To create a sustainable aggressive national commitment to energy efficiency 2-9
reward with the level of program performance A variashytion is to hold back some of the funds allocated to enershygy efficiency for award to shareholders for achieving energy efficiency targets Where this incentive is used the holdback can run between 3 and 8 percent of the program budget Some of these funds can be channeled to employees to reward their efforts (Arthur Rosenfeld personal communication February 20 2006 Plunkett 2005)
Bonus returns shared savings and other incentives can raise the total cost of energy efficiency However if the incentives are well-designed and effective they will encourage the utility to become proficient at achieving energy efficiency savings The utility might be motivated to provide greater savings for consumers through more cost-effective energy efficiency
Energy Efficiency Lowers Risk
Energy efficiency can help the financial ratings of utilities if it reduces the risks associated with regulatory uncershytainty long-term investments in gas supply and transport and electric power and transmission and the risks associshyated with fossil fuel market prices that are subject to volatility and unpredicted price increases By controlling usage and demand utilities can also control the need for new infrastructure and exposure to commodity markets providing risk management benefits To the extent that a return on efficiency investments is likely and the chance of a disallowance of associated costs is minimized investors will be satisfied Decoupling tends to stabilize actual utility revenues providing a better match to actual cost which should further benefit utility bond ratings
Reversing a Short-Term Resource Acquisition Focus Focus on Bills Not Just Rates
Policy-makers tend to focus on electric rates because they can be easily compared across states They become a measure for business-friendliness and companies conshysider rate levels in manufacturing siting and expansion decisions But rates are not the only measure of service A short-term focus on low rates can lead to costly missed
investment opportunities and higher overall costs of electricity service over the long run
Over the long term energy efficiency benefits can extend to all consumers Eventually reduced capital commitments and lower energy costs resulting from cost-effective energy efficiency programs benefit all consumers and lower overall costs to the economy freeshying customer income for more productive purposes like private investment savings and consumption Improved rate stability and risk management from limitshyed sales growth tends to improve the reputation of the utility Incentives and removing the throughput incenshytive make it easier for utilities to embrace stable or declining sales
A commitment to energy efficiency means accepting a new cost in rates over the short-term to gain greater sysshytem benefits and lower long-term costs as is the case with other utility investments State and local political support with a measure of public education might be needed to maintain stable programs in the face of pershysistent immediate pressure to lower rates
Related Issues With Wholesale Markets and Long-Term Planning
Regulatory factors can hinder greater investment in cost-effective energy efficiency programs These factors include the demand-side of the wholesale market not reacting to supply events like shortages or wholesale price spikes and for the electric sector a short-term generation planning horizon especially in retail compeshytition states In addition transmission system planning by regional transmission organizations (RTOs) and utilishyties tends to focus on wires and supply solutions not demand resources like efficiency The value of sustained usage reductions through energy efficiency demand response and distributed generation is not generally conshysidered nor compensated for in wholesale tariffs These are regulatory choices and are discussed further in Chapter 3 Energy Resource Planning Processes10
10 Planning and rate design implications are more thoroughly discussed in Chapters 3 Energy Resource Planning Processes and Chapter 5 Rate Design
2-10 National Action Plan for Energy Efficiency
Energy Efficiency Makes Wholesale Energy Markets
Work Better
In the wholesale market venue the value of energy effishyciency would be revealed by a planning process that treats customer load as a manageable resource like supshyply and transmission with investment in demand-side solutions in a way that is equivalent to (not necessarily the same as) supply and transmission solutions Demand response and efficiency can be called forth that specifishycally reduces demand at peak times or in other strategic ways or that reduces demand year-round
Declare Energy Efficiency a Resource
To underscore the importance of energy efficiency states can declare in statute or regulatory policy that energy efficiency is a resource and that utilities should factor energy efficiency into resource planning and acquisition States concerned with risks on the supply side can also go one step further and designate that energy efficiency is the preferred resource
Link Energy and Environmental Regulation
Environmental policy-makers have observed that energy efficiency is an effective and comparatively inexpensive way to meet tightening environmental limits to electric power generation yet this attribute rarely factors into decisions by utility regulators about deployment of enershygy efficiency This issue is discussed further in Chapter 3 Energy Resource Planning Processes
State and Regional Examples of
Successful Solutions to Energy
Efficiency Deployment
Numerous states have previously addressed or are curshyrently exploring energy efficiency electric and gas incenshytive mechanisms Experiments in incentive regulation occurred through the mid-1990s but generally were overtaken by events leading to various forms of restrucshyturing States are expressing renewed interest in incenshytive regulation due to escalating energy costs and a recognition that barriers to energy efficiency still exist Many state experiences are highlighted in the following text and Table 2-2
Addressing the Throughput Disincentive
Direction Through Legislation
New Mexico offers a bold statutory statement directing regulation to remove barriers to energy efficiency ldquoIt serves the public interest to support public utility investshyments in cost-effective energy efficiency and load manshyagement by removing any regulatory disincentives that might exist and allowing recovery of costs for reasonable and prudently incurred expenses of energy efficiency and load management programsrdquo (New Mexico Efficient Use of Energy Act of 2005)
Decoupling Net Income From Sales
California adopted decoupling for its investor-owned companies as it restored utility responsibility for acquirshying all cost-effective resources The state has also required these companies to pursue all cost-effective energy efficiency at or near the highest levels in the United States A balancing account collects forecasted revenues and rates are reset periodically to adjust for the difference between actual revenues and forecasts Because some utility cost changes are factored into most decoupling systems rate cases can become less frequent because revenues and costs track more closely over time11
11 See for example orders in California PUC docket A02-12-027 httpwwwcpuccagovproceedingsA0212027htm Oregon had used this method successfully for PacifiCorp but when the utility was acquired by Scottish Power the utility elected to return to the more familiar regulatory form
To create a sustainable aggressive national commitment to energy efficiency 2-11
Maryland and Oregon have decoupling mechanisms in place for natural gas In Maryland Baltimore Gas and Electric has operated with decoupling for more than seven years and Washington Gas recently adopted decoupling indicating that regulators view decoupling as a success12 In Oregon Northwest Natural Gas has a similar decoupling mechanism in place13
The inherently cooperative nature of decoupling is demonstrated by utilities and public interest advocates agreeing on a system that addresses public and private interests In all these instances no rate design shift was needed to implement decouplingmdashthe change is invisible
to customers A new proposal for New Jersey Natural Gas would adopt a system similar to those in use in Oregon and Maryland
See Table 2-2 for additional examples of decoupling
Reducing Cost Recovery Through Volumetric Charges
After New York moved to retail competition and sepashyrated energy commodity sales from the electricity delivshyery utility the distribution utilitiesrsquo rates were modified to increase fixed cost recovery through per-customer charges and to decrease the magnitude of variable volshyumetric rates Removing fixed generation costs as these
Table 2-2 Examples of Decoupling
State Type of Utility Key Features Related Rate Design Shifts
PoliticalAdministrative Factors
California
Investor-owned electric and gas Balancing account to collect forecasted revenue annual true-up
No Driven by commission outcome of energy crisis consensus oriented
httpwwwepagovcleanrgypdfkeystonePrusnekPresentationpdf
httpwwwcpuccagovPublishedFinal_decision15019htm
Maryland
Investor-owned gas only Revenue per customer cap monthly true-up No Revenue stability primary motive of
utility frequent true-ups
httpwwwenergeticscommadripdfstimmerman_101105pdf
httpwwwbgecomvcmfilesBGEFilesRates20and20TariffsGas20Service20TariffBrdr_3doc
Investor-owned gas only at presshyent investor-owned electric in the past
Revenue per customers cap annual true-up No Revenue stability primary motive of
utility renewed in 2005
Oregon httpwwwraponlineorgPubsGeneralOregonPaperpdf
httpwwwadvisorinsightcompubindexes600_minwn_irhtm
httpwwwnwnaturalcomCMS300uploadedFiles24190aipdf
httpappspucstateorusorders2002ords02-633pdf
New Jersey Investor-owned gas (proposed) Revenue per customer No
Explicit intent of utility to promote energy efficiency and stabilize fixed cost recovery
httpwww2njresourcescomnewstransnewsrptaspYear=2005 (see 120505)
Vermont Investor-owned electric (proposed)
Forecast revenue cap and costs balancing account and true-ups
No Legislative change promoted utility proposal small utility looking for stability
httpwwwgreenmountainpowerbizatyourservice2006ratefilingshtml
12 BGampErsquos ldquoMonthly Rate Adjustmentrdquo tariff rider is downloadable at httpwwwbgecomportalsitebgemenuitem6b0b25553d65180159c031e0da 6176a0
13 The full agreement can be found in Appendix A of Order 02-634 available at httpappspucstateorusorders2002ords02-634pdf See also Hansen and Braithwait (2005) for an independent assessment of the Northwest Natural Gas decoupling plan prepared for the commission
2-12 National Action Plan for Energy Efficiency
assets were divested dampened the effects on conshysumers In combination with tracking and deferral mechshyanisms to protect the utility from unanticipated costs and savings the utilities have little incentive to increase electric sales
Using a Lost Revenue Adjustment
Minnesota provided Xcel Energy with lost revenue adjustments for energy efficiency through 1999 and then moved to a performance-based incentive Iowa currently provides utilities with lost revenue adjustments for energy efficiency Connecticut allows lost revenue recovery for all electric energy efficiency Massachusetts allows lost revenue recovery for all gas energy efficiency requiring the accumulated lost revenues to be recovered within three years to prevent large accumulated balshyances Oregon allows lost revenue recovery for utility efficiency programs Lost revenue adjustments have been removed in many states because of their cost to consumers New Jersey is in the midst of a transition to a state-run administrator and provides lost revenue for utility-run programs in the meantime
Non-Utility Administration
Several states have taken over the administration of energy efficiency including Wisconsin (Focus on Energy) Maine (Efficiency Maine) New Jersey and Ohio In other states a third party has been set up to administer programs including Vermont (Efficiency Vermont) and Oregon (Energy Trust of Oregon) The New York State Energy Research and Development Authority (NYSERDA) a public authority fits into both categories There is no retail competition in Vermont or Wisconsin this change was based entirely on an expecshytation of effectiveness Oregon combines natural gas and electric efficiency programs but only for the larger companies in each sector Statewide branding of energy efficiency programs is a dividend of non-utility adminisshytration Connecticut introduced an aspect of non-utility administration by vesting its Energy Conservation Management Board a state board including state offishycials utility managers and others with responsibility to approve energy efficiency plans and budgets
Recovering Costs Providing Funding for Energy Efficiency Programs
Revenue Requirement
When energy efficiency programs first began they were funded as part of a utility revenue requirement In many states like Iowa this practice has continued uninterrupted In California retail competition interrupted this method of acquiring energy efficiency but since 2003 California is again funding energy efficiency along with other resources through the revenue requirement a practice known there as ldquoprocurement fundingrdquo California also funds energy efficiency through SBC funding
Capitalizing Energy Efficiency Costs
Oregon allows capitalization of costs and the small electrics do so Washington Vermont and Iowa capitalshyized energy efficiency costs when programs began in the 1980s to moderate rate effects Vermont for example amortized program costs over five years In the late 1990s however as program spending declined these states ended the practice of capitalizing energy efficienshycy costs electing to expense all costs Currently Vermont stakeholders are discussing how to further increase efficiency spending beyond the amount collected by the SBC and they are reconsidering moderating new rate effects through capitalizing costs
Spending Budgets Tariff Riders
and System Benefits Charges
Several states have specified percentages of net utility revenue or a specific charge per energy unit to be spent for energy efficiency resources Massachusetts for example specifies 25 mills per kilowatt-hour (kWh) (while spending for natural gas energy efficiency is determined case by case) In Minnesota there is a separate percentage designated for electric (15 percent of gross operating revenues) and for natural gas (05 percent) utilities Vermont adopted a statewide SBC for its vertically inteshygrated electric sector while its gas energy efficiency costs remain embedded in the utility revenue requirement Strong statutory protections guard funds from government appropriation Wisconsin requires a charge but leaves the commission to determine the appropriate level for each
To create a sustainable aggressive national commitment to energy efficiency 2-13
utility There is a history of SBC funds being used for genshyeral government within the state 2005 legislation apparently intended to make funding more secure (Wisconsin Act 141 of 2005)
The New York commission chose to establish an annual spending budget for its statewide effort (exclusive of the public authorities and utilities) increasing it to $150 milshylion in 2001 and to $175 million in 2006 Washington tariffs include a rider that allows adjustment of rates to recover energy efficiency costs that diverge from amounts included in rates with annual true-ups
Providing Incentives for Energy Efficiency Investment
Performance Incentives
In Connecticut the two electric utilities managing energy efficiency programs are eligible for ldquoperformance management feesrdquo tied to performance goals approved by the regulators including lifetime energy savings demand savings and other measures Incentives are available for a range of outcomes from 70 to 130 percent of pre-determined goals In 2004 the two utilities collectively reached 130 percent of their energy savings goals and 124 percent of their demand savings goals They received performance management fees totaling $527 million The 2006 joint budget anticipates $29 million in performance incentives
In 1999 the Minnesota Commission adopted performshyance incentives for the electric and natural gas investor-owned utilities that began at 90 percent of performance targets and are awarded for up to 150 percent of target levels Performance targets for Minnesota utilities spendshying more than the minimum spending requirement are adjusted to the minimum spending level for purposes of calculating the performance incentive
Rhode Island and Massachusetts offer similarly strucshytured incentives Rhode Island sets aside roughly 5 pershycent of the efficiency budget for performance incentives This amount is less than the amount that would probashy
bly be justified if a lost revenue adjustment were used A collaborative group of stakeholders recommends pershyformance indicators and levels to qualify for incentives In Massachusetts utilities achieving performance tarshygets earn 5 percent on money spent for efficiency (in addition to being able to expense efficiency costs)
Efficiency Vermont operates under a contract with the Vermont Public Service Board The original contract called for roughly 3 percent of the budget for efficiency programs to be held back and paid if Efficiency Vermont meets a variety of performance objectives
Shared Savings
Before retail competition California used a shared savshyings approach in which the utilities received revenue equal to a portion of the savings value produced by the energy efficiency programs A similar mechanism might be reinstated in 2006 (Arthur Rosenfeld personal communication February 20 2006)
Bonus Rate of Return
Nevada allows a bonus rate of return for demand-side management that is 5 percent higher than authorized rates of return for supply investments Regulations specify programs that qualify and the process to account for qualifying investments (Nevada Regulation of Public Utilities Generally 2004)
Lower Risk of Disallowance Through Multi-
Stakeholder Collaborative
California Rhode Island and other states employ stakeholder collaboratives to resolve important program and administrative issues and to provide settlements to the regulator
See Table 2-3 for additional examples of incentives for energy efficiency investments
2-14 National Action Plan for Energy Efficiency
Table 2-3 Examples of Incentives for Energy Efficiency Investments
State Type of Utility Key Features PoliticalAdministrative Factors
California Investor-owned electric Shared savings Encouraged by energy commission and utilities Incentive proportionate to value of savings no cap
httpwwwraponlineorgConferencesMinnesotaPresentationsPrusnekCAEEMinnesotapdf
Connecticut Investor-owned electric Performance incentives
Part of retail competition bargain incentive limited to a percentage of program budget simple to compare results to performance goals
httpwwwstatectusdpucecmbindexhtml
Massachusetts Rhode Island Investor-owned electric Performance incentives
Part of retail competition bargain incentive limited to a percentage of program budget simple to compare results to performance goals
httpwwwmassgovdteelectric04-11819orderpdf (Docket 04-11)
httpwwwripucorgeventsactionsdocket3463_NEC-2004DSMSettle(91203)pdf
Minnesota Investor-owned electric and natural gas Performance incentives
Utility-specific plan arising to resolve other regulatory issues incentive awarded on a sliding scale of performshyance compared with goals decoupling not authorized by statute
httpwwwraponlineorgPubsRatePayerFundedEERatePayerFundedMNpdf
Nevada Investor-owned electric Bonus rate of return on equity Process to establish bonus is statutory
See httpwwwlegstatenvusNACNAC-704htmlNAC704Sec9523
Vermont Efficiency utility Performance incentives
Incentive structure set by contract result of bargain between commission and third-party efficiency provider
httpwwwstatevtuspsbeeucontracthtml
Regulatory Drivers for Efficiency in Resource Planning and Energy Markets
Declare Energy Efficiency a Resource
In New Mexico the legislature has declared a goal of ldquodecreasing electricity demand by increasing energy effishyciency and demand response and meeting new generashytion needs first with renewable and distributed generation resources and second with clean fossil-fueled generationrdquo (New Mexico Efficient Use of Energy Act of 2005)
In California the state has made it very clear that energy efficiency is the most important resource (California SB 1037 2005) After the crises of 2000 and 2001 state leaders used energy efficiency to dampen demand growth and market volatility An Energy Action Plan adopted in 2003 by the California Public Utilities Commission (CPUC) the California Energy Commission (CEC) and the power authority developed a ldquoloading orderrdquo for new electric resources the Energy Action Plan
has been revised but the energy efficiency preference remains firm The intent of the loading order is to ldquodecreas(e) electricity demand by increasing energy effishyciency and demand response and meeting new generashytion needs first with renewable and distributed generation resources and second with clean fossil-fueled generationrdquo (CEC 2005) As a result utilities are acquiring energy efficiency in amounts well in excess of those that would be procured with the SBC alone Further the utilities are integrating efficiency into their resource plans and using efficiency to solve resource problems
Clarifying the primary regulatory status of efficiency makes it clear that sympathetic regulation and cost recovery policies are important California has adopted decoupling of net income and sales for its investor-owned utilities to remove regulatory barriers to a full financial commitment to energy efficiency
To create a sustainable aggressive national commitment to energy efficiency 2-15
One device for implementing this policy is an energy effishyciency supply curve The CEC created such a curve based on an assessment of energy efficiency potential to provide guidance as it reintroduced energy efficiency procurement expectations for the utilities in 2003 Furthermore the CPUC cooperated with the CEC to set energy savings targets for each of the California investor-owned utilities based on an assessment of cost-effectiveness potential
A different approach to declaring energy efficiency a resource is to establish a portfolio or performance stanshydard for energy efficiency In 2005 Pennsylvania and Connecticut included energy efficiency in their resource portfolio standards Requiring all retail sellers to acquire sufficient certificates of energy savings will allocate revshyenue to efficiency providers in an economically efficient way (Pennsylvania Alternative Energy Portfolio Standards Act of 2004 Connecticut Act Concerning Energy Independence of 2005)
As an outcome of its electric restructuring law Texas is using energy efficiency as a resource to reduce demand Texasrsquo spending for energy efficiency is intended to proshyduce savings to meet 10 of forecasted electric demand growth Performance is exceeding this level
Consider Energy Efficiency As a System Reliability
Solution
In New England Independent System Operator New England (ISO-NE) faced a reliability problem in southwest Connecticut A transmission line to solve the problem was under development but would not be ready in time New central station generation could not be sited in this congested area Because the marketplace was not providshying a solution ISO-NE issued a Request for Proposal (RFP) for any resources that would address the reliability probshylem and be committed for four years One energy efficienshycy bid was selectedmdasha commercial office building lighting project worth roughly 5 megawatts (MW) Conditions of the award were very strict about availability of the capacity savings This project will help to demonstrate how energy efficiency does deliver capacity While ISO-NE deemed the RFP an emergency step that it would not undertake routinely this process demonstrates that energy
efficiency can be important to meeting reliability goals and can be paid for through federal jurisdictional tariffs
Other states including Indiana Vermont and Minnesota direct that energy efficiency be considered as an alternative when utilities are proposing a power line project (Indiana Resource Assessment 1995 Vermont Section 248 Minnesota Certificate of need for large energy facility 2005)
Key Findings
This chapter reviews opportunities to make energy effishyciency an attractive business prospect by modifying elecshytric and gas utility regulation and by the way that utilities collect revenue and make a profit Key findings of this chapter indicate
bull There are real financial disincentives that hinder all utilshyities in their pursuit of energy efficiency as a resource even when it is cost-effective and would lead to a lower cost energy system Regulation which is a key source of these disincentives can be modified to remove these barriers
bull Many states have experience in addressing financial disincentives in the following areas
mdash Overcoming the throughput incentive
mdash Providing reliable means for utilities to recover energy efficiency costs
mdash Providing a return on investment for efficiency programs that is competitive with the return utilities earn on new generation
mdash Addressing the risk of program costs being disallowed and other risks
mdash Recognizing the full value of energy efficiency to the utility system
2-16 National Action Plan for Energy Efficiency
Recommendations and Options
The National Action Plan for Energy Efficiency Leadership Group offers the following recommendations as ways to overcome many of the barriers to energy efficiency in utilishyty ratemaking and revenue requirements and provides a number of options for consideration by utilities regulators and stakeholders (as presented in the Executive Summary)
Recommendation Modify policies to align utility
incentives with the delivery of cost-effective energy
efficiency and modify ratemaking practices to promote
energy efficiency investments Successful energy efficiency programs would be promoted by aligning utility incentives in a manner that encourages the delivery of energy efficiency as part of a balanced portfolio of supply demand and transmission investments Historically regshyulatory policies governing utilities have more commonly compensated utilities for building infrastructure (eg power plants transmission lines pipelines) and selling energy while discouraging energy efficiency even when the energy-saving measures might cost less Within the existing regulatory processes utilities regulators and stakeholders have a number of opportunities to create the incentives for energy efficiency investments by utilities and customers A variety of mechanisms have already been used For example parties can decide to provide incentives for energy efficiency similar to utility incentives for new infrastructure investments and provide rewards for prudent management of energy efficiency programs
Options to Consider
bull Addressing the typical utility throughput incentive and removing other regulatory and management disincentives to energy efficiency
bull Providing utility incentives for the successful manageshyment of energy efficiency programs
Recommendation Make a strong long-term commitshy
ment to implement cost-effective energy efficiency as
a resource Energy efficiency programs are most successful and provide the greatest benefits to stakeholders when appropriate policies are established and maintained over
the long-term Confidence in long-term stability of the proshygram will help maintain energy efficiency as a dependable resource compared to supply-side resources deferring or even avoiding the need for other infrastructure investshyments and maintain customer awareness and support
Options to Consider
bull Establishing funding requirements for delivering long-term cost-effective energy efficiency
bull Designating which organization(s) is responsible for administering the energy efficiency programs
Recommendation Broadly communicate the benefits
of and opportunities for energy efficiency
Experience shows that energy efficiency programs help customers save money and contribute to lower cost enershygy systems But these benefits are not fully documented nor recognized by customers utilities regulators or policy-makers More effort is needed to establish the business case for energy efficiency for all decision-makers and to show how a well-designed approach to energy efficiency can benefit customers utilities and society by (1) reducing customersrsquo bills over time (2) fostering financially healthy utilities (eg return on equity earnings per share and debt coverage ratios unaffected) and (3) contributing to posishytive societal net benefits overall Effort is also necessary to educate key stakeholders that although energy efficiency can be an important low-cost resource to integrate into the energy mix it does require funding just as a new power plant requires funding
Options to Consider
bull Establishing and educating stakeholders on the busishyness case for energy efficiency at the state utility other appropriate level addressing customer utility and societal perspectives
bull Communicating the role of energy efficiency in lowering customer energy bills and system costs and risks over time
To create a sustainable aggressive national commitment to energy efficiency 2-17
Recommendation Provide sufficient timely and stable
program funding to deliver energy efficiency where
cost-effective Energy efficiency programs require consisshytent and long-term funding to effectively compete with energy supply options Efforts are necessary to establish this consistent long-term funding A variety of mechashynisms have been and can be used based on state utility and other stakeholder interests It is important to ensure that the efficiency program providers have sufficient long-term funding to recover program costs and impleshyment the energy efficiency measures that have been demonstrated to be available and cost-effective A number of states are now linking program funding to the achievement of energy savings
Options to Consider
bull Deciding on and committing to a consistent way for program administrators to recover energy efficiency costs in a timely manner
bull Establishing funding mechanisms for energy efficiency from among the available options such as revenue requirement or resource procurement funding SBCs rate-basing shared-savings incentive mechanisms etc
bull Establishing funding for multi-year periods
2-18 National Action Plan for Energy Efficiency
References
Barone RJ (2006 May 23) Presentation to the Rethinking Natural Gas Utility Rate Design Conference Columbus Ohio
California Energy Commission [CEC] (2005 July) Implementing Californiarsquos Loading Order for Electricity Resources
California Public Utility Commission [CPUC] (1996 December 20) Opinion on Cost Recovery Plans CPUC D96-12-077
California SB 1037 California Statutes of 2005 Chapter 366 (2005) lthttpinfosencagovpubbillsensb_1001shy1050sb_1037_bill_20050929_chapteredhtmlgt
Connecticut An Act Concerning Energy Independence Public Act No 05-1 (House Bill No 7501) (2005) lthttpwwwcgactgovaspcgabillstatuscgabillstashytusaspselBillType=Billampbill_num=7501ampwhich_year =2005gt
Costello K (2006 April) Revenue Decoupling for Natural Gas Utilities National Regulatory Research Institute lthttpwwwnrriohioshystateeduNaturalGasrevenue-decoupling-for-natushyral-gas-utilitiesgt
Hansen DG and Braithwait SD (2005 March 31) A Review of Distribution Margin Normalization as Approved by the Oregon Public Utility Commission for Northwest Natural Madison Wisconsin Christensen Associates Consulting
Harrington C (2003 May) Who Should Deliver Ratepayer Funded Energy Efficiency Regulatory Assistance Project lthttpwwwraponlineorg showpdfaspPDF_URL=rdquoPubsRatePayerFundedEE RatePayerFundedEEPartIpdfrdquogt
Indiana Resource Assessment Indiana Administrative Code [IAC] 170 IAC 4-7-6 Resource assessment (1995) lthttpwwwingovlegislativeiac T01700A00040PDFgt
Kantor G (2006 June 20) Presentation to the 2006 Western Conference of Public Service Commissioners Jackson Wyoming
Minnesota Certificate of need for large energy facility Minnesota Statutes Chapter 216B243(3) (2005) lthttpwwwrevisorlegstatemnusstats 216B243htmlgt
Moskovitz D (2000) Profits and Progress Through Distributed Resource Regulatory Assistance Project lthttpwwwraponlineorgshowpdfaspPDF_URL= PubsGeneralProfitsandProgressdrpdfgt
Nevada Regulation of Public Utilities Generally Nevada Administrative Code 7049523 Costs of impleshymenting programs for conservation and demand management Accounting recovery (2004) lthttpwwwlegstatenvusNACNACshy704htmlNAC704Sec9523gt
NERA Economic Consulting (2006 April 20) Distributed Resources Incentives lthttpwwwenergeticscommadripdfsnera_0424 06pdfgt
New Mexico Efficient Use of Energy Act New Mexico Statutes Chapt 62-17-2 and Chapt 62-17-3 (2005)
Pennsylvania Alternative Energy Portfolio Standards Act Pennsylvania Act No 213 (SB 1030) (2004) lthttpwwwlegisstatepausWU01LIBIBT20030 SB1030P1973HTMgt
Plunkett J Horowitz P Slote S (2005) Rewarding Successful Efficiency Investment in Three Neighboring States The Sequel the Re-make and the Next Generation (In Vermont Massachusetts and Connecticut) A 2004 ACEEE Summer Study on Energy Efficiency in Buildings lthttpwwwaceeeorgconf04sspanel5htmgt
US Environmental Protection Agency [EPA] (2006) Clean Energy-Environment Guide to Action Policies Best Practices and Action Steps for States (Section 62) Washington DC
Vermont Section 248 30 Vermont Statutes Annotated sect 248 4 (A)(b) New gas and electric purchases investments and facilities certificate of public good lthttpwwwlegstatevtusstatutesfullsecshytioncfmTitle=30ampChapter=005ampSection=00248gt
2005 Wisconsin Act 141 (2005 Senate Bill 459) lthttpwwwlegisstatewius2005dataacts05Act 141pdfgt
To create a sustainable aggressive national commitment to energy efficiency 2-19
3Energy Resource Planning Processes
Including energy efficiency in the resource planning process is essential to realizing its full value and setshyting resource savings and funding targets accordingly Many utilities states and regions are estimating and verifying the wide range of benefits from energy efficiency and are successfully integrating energy efficiency into the resource planning process This chapter of the National Action Plan for Energy Efficiency Report discusses the barriers that obstruct incorporating energy efficiency in resource planning and presshyents six regional approaches to demonstrate how those barriers have been successfully overcome
Overview
Planning is a core function of all utilities large and small natural gas and electric public and private The decisions made in planning affect customer costs reliability of service risk management and the environment Many stakeholders are closely involved and participate in planshyning processes and related decisions Active participants often include utilities utility regulators city councils state and local policy-makers regional organizations environmental groups and customer groups Regional planning processes organized through regional transmisshysion organizations (RTOs) also occur with the collaborashytions of utilities and regional stakeholders
Different planning processes are employed within each utilshyity state and region Depending on a utilityrsquos purpose and context (eg electric or gas utility vertically integrated or restructured) different planning decisions must be made Local and regional needs also affect planning and resource requirements and the scope of planning processes Further the role of states and regions in planning affects decisions and prescribes goals for energy portfolios such as resource priority fuel diversity and emissions reduction
Through different types of planning processes utilities analyze how to meet customer demands for energy and capacity using supply-side resource procurement (includshying natural gas supply contracts and building new genershyation) transmission distribution and demand-side resources (including energy efficiency and demand response) Such planning often requires iteration and testshying to find the combination of resources that offer maxishymum value over a range of likely future scenarios for the
short- and long-term The value of each of these resources is determined at the utility local state and regional level based on area-specific needs and policy direction In order to fully integrate the value of all resources into planningmdash including energy efficiencymdashresource value and benefits must be determined early in the planning process and projected over the life of the resource plan
Planning processes focus on two general areas (1) energy-related planning such as electricity generation and wholesale energy procurement and (2) capacity-related planning such as construction of new pipelines power plants or electric transmission and distribution projects The value of energy efficiency can be integrated into resource planning decisions for both of these areas
Leadership Group Recommendations
Applicable to Energy Resource
Planning Processes
bull Recognize energy efficiency as a high-priority energy resource
bull Make a strong long-term commitment to implement cost-effective energy efficiency as a resource
bull Broadly communicate the benefits of and opportunishyties for energy efficiency
bull Provide sufficient timely and stable program funding to deliver energy efficiency where cost-effective
A more detailed list of options specific to the objective of promoting energy efficiency in resource planning processes is provided at the end of this chapter
To create a sustainable aggressive national commitment to energy efficiency 3-1
This chapter identifies common challenges for integratshying energy efficiency into existing planning processes and describes examples of successful energy efficiency planning approaches that are used in six regions of the country Finally this chapter summarizes ways to address barriers and offers recommendations and several options to consider for specific actions that would facilitate incorporation of energy efficiency into
Figure 3-1 Energy Efficiency Supply Curve - Potential in 2011 (Levelized Cost in $kilowatt-hours [kWh] Saved)
$100
$090
$080
$070
resource planning
$kw
h $060
$050
Challenges to Incorporating Energy
Efficiency Into Planning
The challenges to incorporating energy efficiency into resource planning have common themes for a wide range of utilities and markets This section describes these challenges in the context of two central questions A) determining the value of energy efficiency in the resource planning and B) setting energy efficiency targets and allocating budgets which are guided by resource planning as well as regulatory and policy decisions
Determining the Value of Energy Efficiency
It is generally accepted that well-designed efficiency measures provide measurable resource savings to utilishyties However there are no standard approaches on how to appropriately quantify and incorporate those benefits into utility resource planning Also there are many different types of energy efficiency programs with different characteristics and target customers Energy efficiency can include utility programs (rebates audits education and outreach) as well as building efficiency codes and standards improvements for new construction Each type of program has different charshyacteristics that should be considered in the valuation process The program information gathered in an enershygy efficiency potential study can be used to create an energy efficiency supply curve as illustrated in Figure 3-1
$040
$030
$020
$010
$000 0 10000 20000 30000 40000 50000 60000
GWh
Source McAuliffe 2003
Common Challenges to Incorporating Energy Efficiency Into Planning
A Determining the Value of Energy Efficiency
Energy Procurement
Estimating energy savings
Valuing energy savings
Capacity amp Resource Adequacy
Estimating capacity savings
Valuing capacity benefits
Factors in achieving benefits
Other Benefits
Incorporating non-energy benefits
B Setting Targets and Allocating Budget
Quantity of EE to implement
Estimating program effectiveness
Institutional difficulty in reallocating budget
Cost expenditure timing vs benefits
Ensuring program costs are recaptured
3-2 National Action Plan for Energy Efficiency
The analysis commonly used to value energy efficiency compares the costs of energy efficiency resources to the costs of the resources that are displaced by energy effishyciency The sidebar shows the categories of benefits for electric and gas utilities that are commonly evaluated The approach is to forecast expected future costs with and without energy efficiency resources and then estishymate the level of savings that energy efficiency will proshyvide This analysis can be conducted with varying levels of sophistication depending on the metrics used to comshypare alternative resource plans Typically the evaluation is made based on the expected cost difference however rdquoportfoliordquo approaches also evaluate differences in cost variance and reliability which can provide additional rationale for including energy efficiency as a resource
The resource benefits of energy efficiency fall into two general categories
(1) Energy-related benefits that affect the procurement of wholesale electric energy and natural gas and delivery losses
(2) Capacity-related benefits that affect wholesale elecshytric capacity purchases construction of new facilities and system reliability
The energy-related benefits of energy efficiency are relashytively easy to forecast Because utilities are constantly adjusting the amount of energy purchased short-term deviations in the amount of energy efficiency achieved can be accommodated The capacity-related benefits occur when construction of a facility needed to reliably serve customers can be delayed or avoided because the need has already been met Therefore achieving capacity benefits requires much more certainty in the future success of energy efficiency programs (particularly the measures targeting peak loads) and might be harder to achieve in practice However the ability to provide capacity benefits has been a focus in California the Pacific Northwest and other regions and it should become easier to assess capacity savings as more proshygrams gain experience and capacity savings are measshyured and verified Current methods for estimating energy benefits and capacity benefits are presented here
Estimating Energy Benefits
Estimating energy benefits requires established methods for estimating the quantity of energy savings and the benefits of these savings to the energy system
bull Estimating Quantity of Energy Savings Savings estishymates for a wide variety of efficiency measures have been well studied and documented Approaches to estimate the level of free-riders and program particishypants who would have implemented the energy effishyciency on their own have been established Similarly the expected useful lives of energy efficiency measures and their persistence are commonly evaluated and included in the analysis Detailed databases of efficiency measures have been developed for several regions including California and the Pacific Northwest However it is often necessary to investigate and valishydate the methods and assumptions behind those estishymates to build consensus around measured savings that all stakeholders find credible Savings estimates can be verified through measurements and load research Best practices for measurement and verificashytion (MampV) are discussed in more detail in Chapter 6 Energy Efficiency Program Best Practices
Benefits of Energy Efficiency in Resource Planning
Electricity Natural Gas
Energy-related benefits
Reduced wholesale energy purchases
Reduced wholesale natural gas purchases
Reduced line losses Reduced losses and unaccounted for gas
Reduced air emissions Reduced air emissions
Capacity-related benefits
Generation capacity resource adequacy regional markets
Production and liquified natural gas facilities
Operating reserves and other ancillary services
Pipeline capacity
Transmission and distribution capacity
Local storage and pressure
Other benefits Market price reductions (consumer surplus)
Lower portfolio risk
Localin-state jobs
Low-income assistance and others
To create a sustainable aggressive national commitment to energy efficiency 3-3
bull Quantifying Value of Energy Savings The most readily available benchmark for the value of energy savings is the prevailing price of wholesale electricity and natural gas Even for a vertically integrated utility with its own production energy efficiency might decrease the need to make market purchases or if the utility has excess energy energy efficiency can allow the utility to sell more into the market In cases when the market prices are not appropriate benchmarks (because of contract limitations on reselling energy or limited market access) contract prices or production costs can be used In addition the value of losses and other variable costs associated with energy delivery can be quantified and are well known
The challenge that remains is in forecasting future energy costs beyond the period when market data are available or contracts are in place Long-run forecasts vary in comshyplexity from a simple escalation rate to market-based approaches that forecast the cost of new resource addishytions to models that simulate the system of existing resources (including transmission constraints) and evalushyate the marginal cost of operating the system as new generation is added to meet the forecasted load growth Most utilities have an established approach to forecast long-term market prices and the same forecasting techshynique and assumptions should be used for energy effishyciency as are used to evaluate supply-side resource options In addition to a forecast of energy prices some regions include the change in market prices as a result of energy efficiency Estimating these effects requires modshyeling of complex interactions in the energy market Furthermore reduced market prices are not necessarily a gain from a societal perspective because the gains of consumers result in an equal loss to producers therefore whether to include these savings is a policy decision
Estimating Capacity Benefits
Estimating capacity benefits requires estimating the level of capacity savings and the associated benefits If energy efficiencyrsquos capacity benefits are not considered in the resource plan the utility will overinvest in capital assets
such as power plants and transmission and distribution and underinvest in energy efficiency
bull Estimating Capacity Savings In addition to energy savshyings electric efficiency reduces peak demand and the need for new investments in generation transmission and distribution infrastructure Natural gas efficiency can reduce the need for a new pipeline storage liquefied natural gas (LNG) facility or other investshyments necessary to maintain pressure during high-load periods Because of the storage and pressure variation possible in the natural gas system capacity-related costs are not as extreme in the natural gas system as they are for electricity In both cases estimating reducshytions of peak demand is more difficult for electricity than it is for natural gas and timing is far more critical For peak demand savings to actually be realized the targeted end-use load reductions must occur and the efficiency measure must provide savings coincident with the utilityrsquos peak demand Therefore different energy efficiency measures that reduce load at different times of day (eg commercial vs residential lighting) might have different capacity values Area- and time-specific marginal costing approaches have been develshyoped to look at the value of coincident peak load reductions which have significantly higher value during critical hours and in constrained areas of the system (see sidebar on page 3-5)
A critical component of the resource planning process whether focused on demand- or supply-side resources is accurate unbiased load forecasting Inaccurate load forecasts either cause excessive and expensive investshyment in resources if too aggressive or create costly shortages if too low Similarly tracking and validation of energy efficiency programs are important for increasing the accuracy of estimates of their effects in future resource plans
Estimating the capacity savings to apply to load growth forecasts requires estimating two key factors The first is determining the amount of capacity reduced by energy efficiency during critical or peak hours The
3-4 National Action Plan for Energy Efficiency
second factor is estimating the rdquoequivalent reliabilityrdquo of the load reduction This measure captures both the probability that the savings will actually occur and that the savings will occur during system-constrained hours Applying estimates of equivalent reliability to various types of resources allows comparison on an equal basis with traditional capacity investments This approach is similar in concept to the equivalent capacity factor used to compare renewable resources such as wind
and solar with traditional fossil-fueled generation In markets where capacity is purchased rdquocountingrdquo rules for different resource types determine the equivalent reliability The probability that savings will actually occur during peak periods is easier to estimate with some certainty for a large number of distributed effishyciency measures (eg air conditioners) as opposed to a limited number of large centralized measures (eg water treatment plants)
California Avoided Costs by Time and Location
California is a good example of the effect of area and time-differentiation for efficiency measures that have dramatically different impact profiles The average avoided cost for efficiency (including energy and capacity cost components) in California is $71megawatt-hour (MWh) Applying avoided costs for each of six time of use (TOU) periods (super-peak mid-peak and off-peak
for summer and winter seasons) increases the value of air conditioning to $104MWh or 45 percent and lowshyers the value of outdoor lighting to $57MWh or 20 pershycent Refrigeration with its consistent load profile throughout the day and year is unaffected Applying avoided costs by hour captures the extreme summer
peak prices and increases the value of air conditioning savings still further to $123MWh Incorporating hourly avoided costs increases the total benefits of air condishytioning load reduction by more than $50MWh This type of hourly analysis is currently being used in Californiarsquos avoided cost proceedings for energy efficiency
Avoided distribution capacity costs are also estimated by region in California The Greater San Francisco Bay Area region is shown above in detail In San Francisco and Oakland avoided capacity costs are low because those areas are experiencing little load growth and have little need for new distribution investment The Stockton area on the other hand is experiencing high growth and has significant new distribution infrastructure requirements
Comparison of Avoided Costs for Three Implementation Approaches
$shy
$20
$40
$60
$80
$100
$120
$140
Air Conditioning Outdoor Lighting Refrigeration
Wei
ghte
d A
vera
ge A
void
ed C
ost
($M
Wh)
Hourly TOU Average Annual Average
$8000
$4250
$500
$MW
Greater San Francisco Bay Area Avoided Distribution Costs
To create a sustainable aggressive national commitment to energy efficiency 3-5
bull Valuing Capacity Benefits The value of capacity beneshyfits lies in the savings of not having to build or purchase new infrastructure or make payments to capacity marshykets for system reliability Because reliability of the nationrsquos energy infrastructure is critical it is difficult to make the decision to defer these investments without some degree of certainty that the savings will be achieved Disregarding or undervaluing the transmisshysion and generation capacity value of energy efficiency can however lead to underinvestment in energy effishyciency Realizing energy efficiencyrsquos capacity savings requires close coordination between efficiency and resource planners1 to ensure that specific planned investments can actually be deferred as a result of energy efficiency programs In the long term lower load levels will naturally lead to lower levels of infrashystructure requirements without a change in existing planning processes
Targeted implementation of energy efficiency designed to defer or eliminate traditional reliability investments in the short term (whether generation transmission or disshytribution) requires that energy efficiency ramp up in time to provide sufficient peak load savings before the new infrastructure is needed States with existing efficiency programs can use previous experience to estimate future adoption rates In states that do not have previous expeshyrience with energy efficiency however the adoption rate of efficiency measures is difficult to estimate making it hard to precisely quantify the savings that will be achieved by a certain date Therefore if the infrastrucshyture project is critical for reliability it is difficult to rely on energy as an alternative The value of the targeted reductions and project deferrals can also be a challenge to quantify because of the uncertainty in the future investment needs and costs However there are examshyples of how to overcome this challenge such as the Bonneville Power Administration (BPA) transmission planning process (described later) Vermont Docket 7081 is another collaborative processmdashinitiated at the direcshy
tion of the legislaturemdashthat is working on a new transshymission planning process that will explicitly incorporate energy efficiency (Vermont Public Service Board 2005) Both BPA and Vermont Docket 7081 stress the need to start well in advance of the need for reductions to allow the energy efficiency program to be developed and valishydated In addition by starting early conventional altershynatives can serve as a back-stop if needed Starting early is also easier organizationally if alternatives are initiated before project proponents are vested in building new transmission lines
The deferral of capacity expenditures can produce the same reliability level for customers In cases when an energy efficiency program changes the expected reliability level (either higher or lower) the value to customers must be introduced as either a benefit or cost A typical approach is to use the customerrsquos Value of Lost Load (VOLL) as determined through Value of Service (VOS) studies and multiply by the expected change in customer outage hours However VOS studies based on customer surveys typically show wide-ranging results and are often difficult to substantiate
In regions with established capacity markets the valuashytion process is easier because the posted market prices are the value of capacity The approach to value these benefits is therefore similar to the market price forecasting approach described to value energy benefits Regional planning processes can also include energy efficiency in their resource planning Regional electricity planning processes primarily focus on developing adequate resources to meet regional reliability criteria as defined in each of the North American Electric Reliability Council (NERC) regions Establishing capacity and ancillary servshyice market rules that allow energy efficiency and customer load response to participate can bring energy efficiency into the planning process For example Independent System Operator New England (ISO-NE) Demand Resources Working Group will be including
1 The transmission planning process requires collaboration of regional stakeholders including transmission owners utilities and regulators Distribution planning departments of electric utilities typically make the decisions for distribution-level and local transmission facilities Planning and development of high-voltage transmission facilities on the bulk-supply system is done at the independent system operator (ISO)RTO and North American Electric Reliability Council (NERC) regional levels At a minimum transmission adequacy must uphold the established NERC reliability standards
3-6 National Action Plan for Energy Efficiency
energy efficiency and demand response as qualifying resources for the New England Forward Capacity Market Another example is PJM Interconnection (PJM) which has recently made its Economic Load Response Program a permanent feature of the PJM markets (in addition to the Emergency Load Response Program that was permanently established in 2002) and has recently opened its Synchronized and Non-Synchronized Reserve markets to demand response providers
Other Benefits
Energy efficiency provides several types of non-energy benefits not typically included in traditional resource planning These benefits include environmental improveshyment support for low-income customers economic development customer satisfaction and comfort and other potential factors such as reduced costs for bill colshylection and service shut-offs improvements in household safety and health and increased property values As an economic development tool energy efficiency attracts and retains businesses creates local jobs and helps busishyness competitiveness and area appeal
Environmental benefits predominantly air emissions reductions might or might not have specific economic value depending on the region and the pollutant The market price of energy will include the producerrsquos costs of obtaining required emission allowances (eg nitrogen oxides [NOX] sulfur dioxide [SO2]) and emission reducshytion equipment Emissions of carbon dioxide (CO2) also are affected by planning decisions of whether to consider the value of unregulated emissions The costs of CO2
were included in Californiarsquos assessment of energy effishyciency on the basis that these costs might become priced in the future and the expected value of future CO2 prices should be considered when making energy efficiency investments2 Even without regulatory policy guidance several utilities incorporate the estimated future costs of emissions such as CO2 into their resources planning process to control the financial risks associated with future regulatory changes3 For example Idaho Power
Company includes an estimated future cost of CO2 emisshysions in its resource planning and in determining the cost-effectiveness of efficiency programs
Many of these benefits do not accrue directly to the utility raising additional policy and budgeting issues regarding whether and how to incorporate those benefits for planning purposes Municipal utilities and governmental agencies have a stronger mandate to include a wider variety of non-energy benefits in energy efficiency planshyning than do investor-owned utilities (IOUs) Regulators of IOUs might also determine that these benefits should be considered Many of the benefits are difficult to quantify However non-energy benefits can also be conshysidered qualitatively when establishing the overall enershygy efficiency budget and in developing guidelines for targeting appropriate customers (eg low income or other groups)
Setting Energy Efficiency Targets and Allocating Budget
One of the biggest barriers to energy efficiency is develshyoping a budget to fund energy efficiency particularly at utilities or in states that havenrsquot had significant proshygrams historically This is a not strictly a resource planshyning issue but a regulatory policy and organizational issue as well The two main organizational approaches for funding energy efficiency are resource planning processes which establish the energy efficiency budget and targets within the planning process and public goods-funded charges which create a separate budget to support energy efficiency through a rate surcharge There are successful examples of both approaches as well as examples that use both mechanisms (California BPA PacifiCorp and Minnesota)
Setting targets for energy efficiency resource savings and budgets is a collaborative process between resource planning staff which evaluates cost-effectiveness and other key stakeholders Arguably all energy efficiency
2 California established a cost of $8ton of CO2 in 2004 escalating at 5 per year (CPUC 2005) 3 For further discussion see Bokenkamp et al 2005
To create a sustainable aggressive national commitment to energy efficiency 3-7
measures identified as cost effective in an integrated resource plan (IRP) should be implemented4 In practice a number of other factors must be considered For example the achievable level of savings and costs expertise and labor and ability to ramp up programs also affects the size scope and mix of energy efficiency programs All of these considerations plus the cost-effectiveness of enershygy efficiency should be taken into account when estabshylishing the funding levels for energy efficiency The fundshying process might also require an iterative process that describes the alternative plans to regulators and other stakeholders Some jurisdictions use a policy directive such as rdquoall cost-effective energy efficiencyrdquo (California) while others allocate a fixed budget amount (New York) specify a fixed percentage of utility revenue (Minnesota and Oregon) or a target load reduction amount (Texas)
Implementation of a target for electric and gas energy savings or Energy Efficiency Resources Standard (EERS) or Energy Efficiency Portfolio Standard (EEPS) such as the Energy Efficiency Goal adopted in Texas (PUCT Subst R sect25181) is an emerging policy tool adopted or being considered in a number of states (ACEEE 2006) Some states have adopted standards with flexibility for how utilities meet such targets such as savings by end users improvements in distribution system efficiency and market-based trading systems
Resource Planning Process
If energy efficiency is considered as a resource then the appropriate amount of energy efficient funding will be allocated through the utility planning process based on cost-effectiveness portfolio risk energy and capacity benefits and other criteria Many utilities find that a resource plan that includes energy efficiency yields a lower cost portfolio so overall procurement costs should decline more than the increase in energy efficiency program costs and the established revenue requirement of the utility will be sufficient to fund the entire supply and demand-side resource portfolio
A resource planning process that includes energy effishyciency must also include a mechanism to ensure cost-recovery of energy efficiency spending Most resource planning processes are collaborative forums to ensure that stakeholders understand and support the overall plan and its cost recovery mechanism In some cases utility costs might have to be shifted between utility functions (eg generation and transmission) to enable cost recovery for energy efficiency expenditures For example transmission owners might not see energy effishyciency as a non-wires solution to transmission system deficiencies because it is unclear to what extent energy efficiency costs can be collected in the Federal Energy Regulatory Commission (FERC) transmission tariff Therefore even if energy efficiency is less costly than the transmission upgrade it is unclear whether the transmisshysion upgrade budget can be shifted to energy efficiency and still collected in rates Another challenge for collecting efficiency funding in the transmission tariff is allocation of energy efficiency costs across multiple transmission owners particularly if energy efficiency costs are incurred by a single transmission owner while transmisshysion costs are shared among several owners
These examples demonstrate that in order to implement integrated resource planning the regulatory agency responsible for determining rates must allow rates designed to support transmission distribution or other functions to be used for efficiency The transmission companies in Connecticut have been allowed to include reliability-driven energy efficiency in tariffs although this is noted as an emergency situation not to be repeated as a normal course of business These interactions between regulatory policy and utility resource planning demonshystrate that utilities cannot be expected to act alone in increasing energy efficiency through their planning process
Public Purpose- or System Benefits Charge-Funded
Programs
One way to fund energy efficiency is to develop a separate funding mechanism collected in rates to support
4 Established cost-effectiveness tests such as the total resource cost (TRC) test are commonly used to determine the cost-effectiveness of energy efficiency programs Material from Chapter 6 Energy Efficiency Program Best Practices describes these tests in more detail
3-8 National Action Plan for Energy Efficiency
investment in energy efficiency In deregulated markets with unbundled rates this mechanism can appear as a separate customer charge often referred to as a system benefits charge (SBC) Establishing a public purpose charge has the advantage of ensuring policy-makers that there is an allocation of funding towards energy efficiency and can be necessary in deregulated markets where the delivery company cannot capture the savings of energy efficiency This approach separates the energy efficiency budget from the resource planning process however
Developing a new rate surcharge or expanding an existing surcharge also raises many of the questions addressed in Chapter 2 Utility Ratemaking amp Revenue Requirements For example are the customer segments paying into SBCs receiving a comparable level of energy efficiency assistance in return or are the increases a cross-subsidy Often industrial customers prefer to implement their own efficiency rather than contribute to a pool Also if the targets are used to set shareholder incentives the incentives should be appropriate for the aggressiveness of the program Additionally because the targeted budget allocation in public purpose-funded programs is often set independently of the utilityrsquos overall resource planning process (and is not frequently changed) utilities might not have funding available to procure all cost-effective savings derived from energy efficiency measures This type of scenario can result in potentially higher costs for customers than would occur if each cost-effective efficiency opportunity were pursued
Overcoming Challenges Alternative
Approaches
Successful incorporation of energy efficiency into the resource planning process requires utility executives resource planning staff regulators and other stakeholders to value energy efficiency as a resource and to be comshymitted to making it work within the utility or regional resource portfolio To illustrate approaches to overcoming these barriers we highlight several successful energy efficiency programs by California the New York State
Energy Research and Development Authority (NYSERshyDA) BPA Minnesota Texas and PacifiCorp The energy efficiency programs in these six regions demonstrate sevshyeral different ways to incorporate energy efficiency into planning processes in each example the economics generally work well for efficiency programs
The primary driver of energy efficiency in planning is the low levelized cost of energy savings Table 3-1 shows the reported levelized cost of electricity and natural gas effishyciency from three of the regions surveyed The reported utility cost of efficiency ranges between $001kilowattshyhour (kWh) and $003kWh for Pacific Gas amp Electric (PGampE) NYSERDA and the Northwest Power and Conservation Council (NWPCC) When including both utility program costs and customer costs the range is $003kWh to $005kWh The range of reported benefits for electric energy efficiency is from $006kWh to $008kWh For natural gas only PampGE reported specific natural gas efficiency measures these show similarly low levelized costs relative to benefits
Table 3-1 Levelized Costs and Benefits From Four Regions
Electric ($kWh) Natural Gas ($therm)
Utility Cost
Utility amp Customer
Cost
Benefit Utility Cost
Utility amp Customer
Cost
Benefit
PGampE 1 003 005 008 028 056 081
NYSERDA 2 001 003 006 NA NA NA
NWPCC 3 0024 NA 0060 NA NA NA
Texas 4 0025 NA 00606 NA NA NA
1 PGampE 2005 2 NYSERDA 2005 3 NWPCC 2005 4 Calculated based on Texas Utility Avoided Cost (PUCT Substantive Rule
sect2518 of 2000) $00268kWh for energy and $7850kW-year for capacity converted to $kWh based on assumption of 10-year measure life load factor of 264 percent which is calculated from Texasrsquo 2004 efficiency-based reductions of 193 MW of peak demand and 448 GWh of energy (Frontier Associates 2005)
5 Based on 2004 spending of $87 million 448 GWh annual Assumed life of 10 years (PUCT Substantive Rule sect25181 of 2000)
6 Based on Public Utility Commission of Texas (PUCT) Deemed Avoided Costs of $00268kWh for energy and $7850kW-year for capacity 448GWh and 193MW of peak load reduction
To create a sustainable aggressive national commitment to energy efficiency 3-9
California
California has had a continued commitment to energy efficiency since the late 1970s Two major efforts are curshyrently being coordinated in the state that address energy use in new buildings as well as efficiency upgrades in existing buildings Figure 3-2 shows the policy structure with the California Energy Commission (CEC) leading the building codes and standards process and the California Public Utility Commission (CPUC) leading the IOU and third-party administered efficiency programs Jointly the agencies publish the Energy Action Plan that explicitly states a goal to integrate rdquoall cost-effective energy efficiencyrdquo Recently the CPUC approved an effishyciency budget of $2 billion over the next three years to serve a population of approximately 35 million
The process for designing and implementing efficiency programs in California by the IOUs is to develop the proshygrams (either by the utility or through third-party solicishytation) evaluate cost-effectiveness establish and gain approval for the program funding and evaluate the proshygramrsquos success through MampV Figure 3-2 illustrates this approach
Table 3-2 describes how California addresses barriers for incorporating energy efficiency in planning for the IOU process
Source Energy and Environmental Economics Inc
3-10 National Action Plan for Energy Efficiency
Figure 3-3 California Investor-Owned Utility (IOU) Process
Resources and Ramp-up Limits
Rank and Estimate Potential for Cost Effective
Portfolios
Determine Target Energy Evaluate Program Funding Level
Efficiency Cost Effectiveness (through CPUC Programs
process)
CPUC Avoided Costs
Implement Approved
Programs to Approved Levels
Perform MampV and Adjust
Programs for Next Year
Source Energy and Environmental Economics Inc
Table 3-2 Incorporation of Energy Efficiency in Californiarsquos Investor-Owned Utilitiesrsquo Planning Processes
Barriers California CPUC-Administered Programs
A Determining the Value of Energy Efficiency
Energy Procurement
Estimated energy savings Customer adoption rates are forecast into the energy efficiency plans with monthly or quarterly reporting of program success for tracking
Valuing energy savings Energy savings are based on market prices of future electricity and natural gas adjusted by loss factors Emission savings are based on expected emission rates of marginal generating plants in each hour (electricity) or emissions for natural gas
Capacity amp Resource Adequacy
Estimating capacity savings Capacity savings are evaluated using the load research data for each measure
Valuing capacity benefits
Factors in achieving benefits
Each capacity-related value is estimated by climate zone of the state and incorporated into an rdquoall-inrdquo energy value Transmission and distribution capacity for electricity is allocated based on weather in each climate zone and by season for natural gas Californias energy market (currently) includes both energy and capacity so there is no explicit capacity value for electric generation
Capacity benefits are based on the best forecast of achieved savings There is no explicit link between forecasted benefits of energy efficiency and actual capacity savings
Other Benefits
Incorporating non-energy benefits Non-energy benefits are considered in the development of the portfolio of energy efficiency but not explicitly quantified in the avoided cost calculation
B Setting Targets and Allocating Budget
Quantity of energy efficiency to implement
Estimating program effectiveness
Institutional difficulty in reallocating budget
Cost expenditure timing vs benefits
Ensuring the program costs are recaptured
CPUC has approved budget and targets for the statersquos efficiency programs which are funded through both a public purpose charge and procurement funding
A portion of the public purpose funds are dedicated to evaluation measurement and verification with the goal of improving the understanding and quantification of savings and benefit estimates
By using public purpose funds budget doesnt have to be reallocated from other functions for energy efficiency
Capacity benefits are based on the best forecast of achieved savings
CPUC requires that the utilities integrate energy efficiency into their long-term procurement plans to address this issue
To create a sustainable aggressive national commitment to energy efficiency 3-11
Bonneville Power Administration Transmission Planning and Regional Roundtable
In the Northwest BPA has been leading an industry roundtable to work with distribution utilities local and state government environmental interests and other stakeholders to incorporate energy efficiency and other distributed energy resources (DER) into transmission planning DER includes energy efficiency as well as distrishybution generation and other nonwires solutions Figure 3-4 illustrates the analysis approach and data sources Within BPA the Transmission Business Line (TBL) works with the energy efficiency group in Power Business Line
(PBL) to develop an integrated transmission plan The process includes significant stakeholder contributions in both input data assumptions (led by NWPCC) and in reviewing the overall analysis at the roundtable5
Table 3-3 describes how BPA works with stakeholders to address barriers for incorporating energy efficiency in planning processes
Figure 3-4 BPA Transmission Planning Process
IOUs and Public Utilities
BPA Transmission Business Line Transmission
Planning
Regional Stakeholder Group BPA Roundtable Utilities interest groups other stakeholders discuss
issues and provide analysis review
Distributed resource analysis results
NWPCC Regional Planning Process
BPA PBL Efficiency Group Evaluate cost-effective DER based on transmission plan
and other forecasts
Load forecasts Publicly vetted energy
price forecasts conservation database
Transmission costs and
required DER load relief
Revise transmission plan as appropriate and fund transmission and
DER investments
Transmission plans
Group Data Decision
Source Energy and Environmental Economics Inc
5 NWPCC conducts regional energy efficiency planning More information can be found at lthttpwwwnwcouncilorggt
3-12 National Action Plan for Energy Efficiency
rsquoTable 3-3 Incorporation of Energy Efficiency in BPA s Planning Processes
Barriers BPA-Administered Programs
A Determining the Value of Energy Efficiency
Energy Procurement
Estimated energy savings The process uses the NWPCC database to define the measure impact and costs NWPCC maintains a publicly available regional efficiency database that is well regarded and has its own process for stakeholder collaboration Adoption rates are estimated based on a range of historical program success
Valuing energy savings Energy savings are valued based on the NWPCC long-run forecast of energy value for the region plus marginal losses
Capacity amp Resource Adequacy
Estimating capacity savings Capacity savings are based on expected NWPCC efficiency measure coincident peak impacts
Valuing capacity benefits The deferral value of transmission investments is used to evaluate the transmission capacity value which is the focus of these studies The approach is to calculate the difference in present value revenue requirement before and after the energy efficiency investment (Present Worth Method)
Factors in achieving benefits The BPA energy efficiency and transmission planning staff work together to ensure that the revised plan with Non-Construction Alternatives (NCAs) satisfies reliability criteria Ultimately the decision to defer transmission and rely on NCAs will be approved by transmission planning
Other Benefits
Incorporating non-energy benefits The analysis includes an evaluation of the environmental externalities but no other non-energy benefits
B Setting Targets and Allocating Budget
Quantity of energy efficiency to implement
The target for NCAs is established by the amount of load that must be reduced to defer the transmission line and maintain reliability This target is driven by the load growth forecasts of the utilities in the region
Estimating program effectiveness BPA has been doing demonstrations and pilots of high-potential NCAs to refine the estimates of program penetration cost necessary timeline for achieving load reductions customer acceptance and other factors The results of these pilots will help to refine the estimates used in planning studies
Institutional difficulty in reallocating budget
If NCAs have lower cost than transmission transmission capital budget will be reallocated to support NCA investments up to the transmission deferral value Additional costs of NCAs that are justified based on energy value are supported by other sources (BPA energy efficiency local utility programs and customers)
Cost expenditure timing vs benefits Both transmission and NCAs require upfront investments so there is no significant time lag between costs and benefits The transmission savings benefit is achieved concurrently with the decision to defer the transmission investment Energy benefits on the other hand occur over a longer timeframe and are funded like other energy efficiency programs
Ensuring the program costs are recaptured
By developing an internal planning process to reallocate budget it is easier to ensure that the savings occur
New York State Energy Research and Development Authority (NYSERDA)
In the mid-1990s New York restructured the electric utilshyities and moved responsibility for implementing energy efficiency programs to the NYSERDA The following figure shows an overview of the NYSERDA process The programs are funded through the SBC funds (approxishymately $175 million per year) and NYSERDA reports on the program impact and cost-effectiveness to the New York State Public Service Commission (NYS PSC) annually
Table 3-4 describes how NYSERDA addresses the barriers to implementing energy efficiency
Source Energy and Environmental Economics Inc
To create a sustainable aggressive national commitment to energy efficiency 3-13
rsquoTable 3-4 Incorporation of Energy Efficiency in NYSERDA s Planning Processes
Barriers NYSERDA-Administered Programs
A Determining the Value of Energy Efficiency
Energy Procurement
Estimating energy savings NYSERDA internally develops estimates of savings for individual energy efficiency programs and the portfolio in aggreshygate In addition NYSERDA accounts for free-riders and spillover effects (net to gross ratio) when estimating energy savings Savings estimates are verified and refined with an MampV program
Valuing energy savings A long-run forecast of electricity demand is developed using a production simulation model which is then calibrated to market prices An estimate of reduced market prices due to decreased demand is also included as a benefit
Capacity amp Resource Adequacy
Estimating capacity savings Similar to energy savings capacity savings are estimated for individual energy efficiency programs and the portfolio in aggregate Savings estimates are verified and refined with an MampV program
Valuing capacity benefits The value of generation capacity in New York is established by examining historical auction clearing prices in the NYISOrsquos unforced capacity market The baseline values are then escalated over time using a growth rate derived from NYSERDArsquos electric system modeling results These capacity costs are used to value those NYSERDA programs that effecshytively lower system peak demand
Factors in achieving benefits The capacity value is included as the best estimate of future capacity savings by New York utilities There is no direct link however between the forecasted savings and the actual change in utility procurement budgets
Other Benefits
Incorporating non-energy benefits The cost-effectiveness of NYSERDA programs is estimated using four scenarios of increasing NEB levels from (1) energy savings benefits (2) adding market price effects (3) adding non-energy benefits and (4) adding macro-economic effects of program spending
B Setting Energy Efficiency Targets
Quantity of energy efficiency to implement
The overall size of the NYSERDA program is determined by the aggregate funding level established by the NYS PSC NYSERDA with advice from the SBC Advisory Group recommends specific sub-program funding levels for approval by the staff at NYS PSC
Estimating program effectiveness NYSERDA prepares an annual report on program effectiveness including estimated and verified impacts and cost effecshytiveness which is then reviewed by the SBC Advisory Group and submitted to the NYS PSC
Institutional difficulty in reallocating budget
By establishing a separate state research and development authority to administer energy efficiency the institutional problems of determining and allocating budget towards energy efficiency are eliminated NYSERDA is supported primarily by SBCs collected by the utilities at the direction of NYS PSC
Cost expenditure timing vs benefits Similarly by funding the programs through an SBC the customers are directly financing the program thereby making the timing of benefits less important
Ensuring the program costs are recaptured
Forecasts of savings are based on the best estimate of future savings There is no direct link to ensure these savings actually occur
Minnesota
The Minnesota legislature passed the Conservation Improvement Program (CIP) in 1982 State law requires that (1) electric utilities that operate nuclear-power plants devote at least 2 percent of their gross operating revenue to CIP (2) other electric utilities devote at least 15 percent of their revenue and (3) natural gas utilities devote at least 05 percent Energy is supplied predomishynantly by two utilities Xcel which provides 49 percent of the electricity and 25 percent of the natural gas and CenterPoint Energy which provides 45 percent of the natural gas Facilities with a peak electrical demand of at least 20 megawatts (MW) are permitted to opt out of CIP and avoid paying the programrsquos rate adjustment in
their electric and natural gas bills (10 facilities have done so) While the Minnesota Department of Commerce oversees the CIP programs of all utilities in the state the department only has the authority to order changes in the programs of the IOUs
Utilities are required to file an IRP every 2 years using 5- 10- and 15-year planning horizons to determine the need for additional resources The statutory emphasis is on demand-side management (DSM) and renewable resources A utility must first show why these resources will not meet future needs before proposing traditional utility investments The plans are reviewed and approved by the Minnesota Public Utilities Commission CIP is the
3-14 National Action Plan for Energy Efficiency
Table 3-5 Incorporation of Energy Efficiency in Minnesotarsquos Planning Processes
Barriers Minnesota-Administered Programs
A Determining the Value of Energy Efficiency
Energy Procurement
Estimating energy savings Energy savings and avoided costs are determined independently by each utility resulting in a wide range of estimates that are not consistent Energy costs are considered a trade secret and not disclosed publicly Valuing energy savings
Capacity amp Resource Adequacy
Estimating capacity savings Capacity savings and avoided costs are determined independently by each utility resulting in a wide range of estimates that are not consistent Power plant transmission and distribution costs are considered trade secrets and are not disclosed publicly Valuing capacity benefits
Factors in achieving benefits There is no direct link between the forecasted capacity savings and the actual change in utility procurement budgets
Other Benefits
Incorporating non-energy benefits Differences in the utilitiesrsquo valuation methods produce varying estimates In addition the Department of Commerce incorporates an externality avoided cost in the electric societal cost benefit test providing utilities with values in $ton for several emissions which the utilities translate to amounts in $MWh based on each utilityrsquos emissions profile
B Setting Targets and Allocating Budget
Quantity of energy efficiency to implement
The Department of Commerce approves budget and targets for each utility Funding levels are determined by state law which requires 05 percent to 2 percent of utility revenues be dedicated to conservation programs depending on the type of utility
Estimating program effectiveness Program effectiveness is handled by each utility Minnesotarsquos IOUs rely on the software tools DSManager and BENCOST to measure electric and gas savings respectively
Institutional difficulty in reallocating budget
Budget is not reallocated from other functions Funding is obtained via a surcharge on customer bills
Cost expenditure timing vs benefits By using a percentage of revenue set-aside utility customers are directly financing the program therefore timing of benefits is not critical
Ensuring the program costs are recaptured
State law requires that each utility file an IRP with the Public Utilities Commission The conservation plans approved by the Department of Commerce are the primary mechanism by which utilities meet conservation targets included in their IRPs
primary mechanism by which the electric utilities achieve the conservation targets included in their IRPs
The Department of Commerce conducts a biennial review of the CIP plan for each investor-owned utility Interested parties may file comments and suggest altershynatives before the department issues a decision approvshying or modifying the utilityrsquos plan Utilities that meet or exceed the energy savings goals established by the Department of Commerce receive a financial bonus which they are permitted to collect through a rate increase Both electric utilities have exceeded their goals for the last several years Table 3-5 describes how the Minnesota Department of Commerce addresses barriers to implementing energy efficiency
Texas
Texas Senate Bill 7 (1999) enacted in the 1999 Texas legislature mandates that at least 10 percent of an investor-owned electric utilityrsquos annual growth in electricity demand be met through energy efficiency programs each year The Public Utility Commission of Texas (PUCT) Substantive Rule establishes procedures for meeting this legislative mandate directing the transmission and distrishybution (TampD) utilities to hire third-party energy efficiency providers to deliver energy efficiency services to every customer class using ldquodeemed savingsrdquo estimates for each energy efficiency measure (PUCT 2000) Approved program costs are included in the IOUrsquos transmission and distribution rates and expenditures are reported separately in the IOUrsquos annual energy efficiency report to the PUCT Actual energy and capacity savings are verified by independent experts chosen by the PUCT Incentives are based on prescribed avoided costs which are set by
To create a sustainable aggressive national commitment to energy efficiency 3-15
Table 3-6 Incorporation of Energy Efficiency in Texasrsquo Planning Processes
Barriers Texas-Administered Programs
A Determining the Value of Energy Efficiency
Energy Procurement
Estimating energy savings Energy savings are based on either deemed savings or through MampV All savings estimates are subject to verification by a commission-appointed MampV expert
Valuing energy savings Avoided costs shall be the estimated cost of new gas turbine which for energy was initially set in PUCT section 25181shy5 to be $00268 kWh saved annually at the customerrsquos meter
Capacity amp Resource Adequacy
Estimating capacity savings Capacity savings are based on either deemed savings or through MampV All savings estimates are subject to verification by a commission-appointed MampV expert
Valuing capacity benefits Avoided costs shall be the estimated cost of new gas turbine which for capacity was initially set in PUCT section 25181-5 to be $785kW saved annually at the customerrsquos meter
Other Benefits
Incorporating non-energy benefits Environmental benefits of up to 20 percent above the cost effectiveness standard can be applied for projects in an area that is not in attainment of ambient air quality standards
B Setting Energy Efficiency Targets
Quantity of energy efficiency to implement
Senate Bill 7 (SB7) mandates that beginning in 2004 at least 10 percent of an investor-owned electric utilityrsquos annual growth in electricity demand be met through energy efficiency programs each year (based on historic five-year growth rate for the firm) Funding for additional programs is available if deemed cost-effective
Estimating program effectiveness Each year the utility submits to the PUCT an energy efficiency plan for the year ahead and an energy efficiency report for the past year The plan must be approved by the commission and the year-end report must include information regarding the energy and capacity saved Also independent MampV experts selected by the commission to verify the achieved savings as reported in each utilityrsquos report
Institutional difficulty in reallocating budget
Funds required for achieving the energy efficiency goal are included in transmission and distribution rates and energy efficiency expenditures are tracked separately from other expenditures
Cost expenditure timing vs benefits By using a percentage of revenue set aside utility customers directly finance the program therefore timing of benefits is not critical
Ensuring the program costs are recaptured
The annual energy efficiency report submitted by the IOU to the PUCT includes energy and capacity savings program expenditures and unspent funds There is no verification that the estimated avoided costs are captured in utility savings
the PUCT El Paso Electric Company will be included in the program beginning with an efficiency target of 5 pershycent of growth in 2007 and 10 percent of growth in 2008
The 2004 report on Texasrsquo program accomplishments highlights the level of savings and success of the program ldquoIn 2004 the investor-owned utilities in Texas achieved their statewide goals for energy efficiency once again 193 MW of peak demand reduction was achieved which was 36 above its goal of 142 MW In addition 448 gigawatt-hours (GWh) of demand eduction was achieved These energy savings correspond to a reduction of 1460352 pounds of nitrogen oxide (NOX) emissions Incentives or rebates were provided to project sponsors to offset the costs of a variety of enershygy efficiency improvements Two new energy efficiency
programs were voluntarily introduced by the Texas utilishytiesrdquo Table 3-6 describes how Texas utilities address barshyriers to implementing energy efficiency
PacifiCorp
PacifiCorp is an investor-owned utility with more than 8400 MW of generation capacity that serves approxishymately 16 million retail customers in portions of Utah Oregon Wyoming Washington Idaho and California PacifiCorp primarily addresses its energy efficiency planshyning objectives as part of its IRP process Efficiency-based measures are evaluated based on their effect on the overall cost of PacifiCorprsquos preferred resource portfolio defined as the overall supply portfolio with the best balshyance of cost and risk
3-16 National Action Plan for Energy Efficiency
Additionally some states that are in PacifiCorprsquos service terrishytory such as Oregon and California also mandate that the company allocate funds for efficiency under related statewide public goods regulations ldquoIn Oregon SB 1149 requires that investor-owned electric companies collect from all retail customers a public purpose charge equal to 3 of revenues collected from customers Of this amount 57 (17 of revenues) goes toward Class 2 [energy efficiency-based] demand side management (DSM) The Energy Trust of Oregon (ETO) was set up to determine the manner in which public purpose funds will be spentrdquo(PacifiCorp 2005) Using the IRP model to determine investment in enershygy efficiency however PacifiCorp allocates more money to efficiency than required by state statute
As of the 2004 IRP PacifiCorp planned to implement a base of 250 average megawatts (aMW) of energy efficiency and to seek an additional 200 aMW of new efficiency programs if cost-effective options could be identified PacifiCorp models the impact of energy effishyciency as a shaped load reduction to their forecasted load and computes the change in supply costs with and without the impact of DSM This approach allows differshyent types of DSM to receive different values based on the alternative supply costs in different parts of the PacifiCorp service territory For example the IRP plan indicates that ldquoresidential air conditioning decrements produce the highest value [in the East and West]
Table 3-7 Incorporation of Energy Efficiency in PacifiCorprsquos Planning Processes
Barriers PacifiCorp-Administered Programs
A Determining the Value of Energy Efficiency
Energy Procurement
Estimating energy savings The load forecast in the IRP is reduced by the amount of energy projected to be saved by existing programs existing programs that are expanded to other states and new cost-effective programs that resulted from the 2003 DSM request for proposals (RFPs) These load decrements have hourly shapes based on the types of measures installed for each program
Valuing energy savings Efficiency-based (or Class 2) DSM programs are valued based on cost effectiveness from a utility cost test perspective minimizing the present value revenue requirement The IRP (using the preferred portfolio of supply-side resources) is run with and without these DSM decrements and their value in terms of cost-savings is calculated as the difference in revenue requirements for that portfolio with and without these Class 2 load reductions
Capacity amp Resource Adequacy
Estimating capacity savings
Valuing capacity benefits
PacifiCorp explicitly evaluates the capacity value of dispatchable and price-based DSM or lsquoClass 1rsquo DSM and the ability to hit target reserve margins in the system with these resources The IRP resulted in a recommendation to defer three different supply-side projects The capacity benefits of more traditional energy efficiency programs are not explicitly evaluated however the planned energy efficiency reductions are used to update the load forecast in the next yearrsquos IRP which could result in additional deferrals
Capacity savings are valued at the forecasted costs of displaced generation projects By integrating the evaluation of DSM into the overall portfolio the value of energy efficiency is directly linked to specific generation projects It does not appear that PacifiCorp evaluates the potential for avoided transmission and distribution capacity
Other Benefits
Incorporating non-energy benefits Non-energy benefits are considered in the selection of a preferred portfolio of resources but the non-energy benefits of efficiency are not explicitly used in the IRP
B Setting Energy Efficiency Targets
Quantity of energy efficiency to implement
Estimating program effectiveness
Institutional difficulty in reallocating budget
Cost expenditure timing vs benefits
Ensuring the program costs are recaptured
As part of the 2004 IRP PacifiCorp determined that a base of 250 aMW of efficiency should be included in the goals for the next 10 years and that an additional 200 aMW should be added if cost-effective programs could be identified
Measurement methodology for new projects is not explicitly identified in the IRP but values from existing programs and the forecasted load shapes for PacifiCorprsquos customers will be used to predict benefits
Funding is integrated into the overall process of allocating budget to resource options (both supply side and demand side) and faces only challenges associated with any resource option namely proof of cost-effective benefit to the resource portfolio
The IRP process for PacifiCorp seeks to gain the best balance of cost and risk using the present value of revenue requireshyments which accounts for timing issues associated with any type of resource evaluated including efficiency
Successive IRPs will continue to evaluate the cost-effectiveness of energy efficiency programs to determine their effect on overall costs of the resource portfolio
To create a sustainable aggressive national commitment to energy efficiency 3-17
Programs with this end use impact provide the most value to PacifiCorprsquos system because they reduce demand during the highest use hours of the year sumshymer heavy load hours The commercial lighting and sysshytem load shapes with the highest load factors provide the lowest avoided costsrdquo It does not appear that PacifiCorp recomputes the overall risk of its portfolio with increased energy efficiency Table 3-7 describes how PacifiCorp addresses barriers to implementing energy efficiency
Key Findings
This section describes the common themes in the approaches used to navigate and overcome the barriers to incorporating energy efficiency in the planning process While there are many approaches to solving each issue the following key findings stand out
bull Cost and Savings Data for Energy Efficiency Measures Are Readily Available Given the long history of energy efficiency programs in several regions existing resources to assist in the design and implementation of energy efficiency programs are widely available Both California and the Northwest maintain extensive pubshylicly available online databases of energy efficiency measures and impacts the Database for Energy Efficiency Resources (DEER) in California6 and NWPCC Database in the Northwest7 DEER includes both elecshytricity and natural gas measures while NWPCC contains only electricity measures These databases incorporate a number of factors affecting savings estimates including climate zones building type building vintage and cusshytomer usage patterns Energy efficiency and resource planning studies containing detailed information on efficiency measures are available for regions throughout the United States It is often possible to adjust existing data for use in a specific utility service area with relatively straightforward assumptions
bull Energy Capacity and Non-Energy Benefits Can Justify Robust Energy Efficiency Programs Energy savings alone are usually more than sufficient to justify and fund a wide range of efficiency measures for elecshytricity and natural gas However the capacity and non-energy benefits of energy efficiency are important factors to consider in assessing energy efficiency measures on an equal basis with traditional utility investments In practice policy budget expertise and human resources are the more limiting constraints to effectively incorporating energy efficiency into planning
mdash Estimating the quantity and value of energy savings is relatively straightforward Well-established methods for estimating the quantity and value of energy savings have been used in many regions and forums All of the regional examples for estimating energy and capacity savings for energy efficiency evaluate the savings for an individual measure using either measurements or engineering simulation and then aggregate these by the expected number of cusshytomers who will adopt the measure Both historical and forward market prices are readily available parshyticularly for natural gas where long-term forward markets are more developed
mdash Estimating capacity savings is more difficult but challenges are being overcome Capacity savings depend more heavily on regional weather conditions and timing of the peak loads and therefore are difficult to estimate Results from one region do not readily transfer to another Also publicly available market data for capacity are not as readily available as for energy even though the timing and location of the savings are critical Because potential capacity savings are larger for electricity energy efficiency than natural gas capturing capacity value is a larger issue for electric utilities Production simulation can explicitly evaluate the change in power plant investshyment and impact of such factors as re-dispatch due
to transmission constraints variation in load growth
6 The DEER Web site description and history can be found at httpwwwenergycagovdeer The DEER database of measures can be found at httpeegacpuccagovdeer
7 The NWPCC Web site comments and efficiency measure definition can be found at httpwwwnwcouncilorgcommentsdefaultasp
3-18 National Action Plan for Energy Efficiency
and other factors But these models are analytically complex and planning must be tightly integrated with other utility planning functions to accurately assess savings These challenges can and have been overcome in different ways in regions with a long track-record of energy efficiency programs (eg California BPA New York)
mdash Estimating non-energy benefits is an emerging approach in many jurisdictions Depending on the jurisdiction legislation and regulatory commission policies might expressly permit and even require the consideration of non-energy benefits in cost-effecshytiveness determinations However specific guidelines regarding the quantification and inclusion of non-energy benefits are still under discussion or in develshyopment in most jurisdictions The consideration of both non-energy and capacity benefits of energy efficiency programs is relatively new compared to the long history of valuing energy savings
bull A Clear Path to Funding Is Needed to Establish a Budget for Energy Efficiency Resources There are three main approaches to funding energy efficiency investments 1) utility resource planning processes 2) public purpose funding and 3) a combination of both In a utility resource planning process such as the BPA non-construction alternatives process efficiency options for meeting BPArsquos objectives are compared to potential supply-side investments on an equal basis when allocating the available budget In this type of resource planning process budget is allocated to effishyciency measures from each functional area according to the benefits provided by efficiency programs The advantage of this approach is that the budget for effishyciency is linked directly to the savings it can achieve however particularly in the case of capacity-related benefits which have critical timing and load reduction targets to maintain reliability it is a difficult process
The public purpose funding and SBC approaches in New York Minnesota and other states are an alternashytive to budget reallocation within the planning process In California funding from both planning processes and public purpose funding is used Public purpose funds do not have the same direct link to energy savshyings so programs might not capture all the savings attributed to the program Funding targets might be set before available efficiency options have been explored so if other cost-effective efficiency measures are later identified additional funding might not be available This situation can result in customer costs being higher than they would have been if all cost-effective efficiency savings opportunities had been supshyported Using public purpose funding significantly simshyplifies the planning process however and puts more control over the amount of energy efficiency in the control of regulators or utility boards As compared to resource planning far less time and effort are required on the part of regulators or legislators to direct a specific amount of funding to cost-effective efficiency programs
bull Integrate Energy Efficiency Early in the Resource Planning Process In order to capture the full value of deferring the need for new investments in capacity energy efficiency must be integrated early in the planshyning process This step will avoid sunk investment assoshyciated with longer lead-time projects Efficiency should also be planned to target investments far enough into the future so that energy efficiency programs have the opportunity to ramp up and provide sufficient load reduction This timeline will allow the utility to build expertise and establish a track record for energy effishyciency as well as be able to monitor peak load reducshytions Starting early also allows time to gain support of the traditional project proponents before they are vested in the outcome
To create a sustainable aggressive national commitment to energy efficiency 3-19
Recommendations and Options
The National Action Plan for Energy Efficiency Leadership Group offers the following recommendations as ways to overcome many of the barriers to energy efficiency in resource planning and provides a number of options for consideration for consideration by utilities regulators and stakeholders (as presented in the Executive Summary)
Recommendation Recognize energy efficiency as a high
priority energy resource Energy efficiency has not been consistently viewed as a meaningful or dependable resource compared to new supply options regardless of its demonstrated contributions to meeting load growth Recognizing energy efficiency as a high-priority energy resource is an important step in efforts to capture the benefits it offers and lower the overall cost of energy services to customers Based on jurisdictional objectives energy efficiency can be incorporated into resource plans to account for the long-term benefits from energy savings capacity savings potential reductions of air polshylutants and greenhouse gases as well as other benefits The explicit integration of energy efficiency resources into the formalized resource planning processes that exist at regional state and utility levels can help estabshylish the rationale for energy efficiency funding levels and for properly valuing and balancing the benefits In some jurisdictions these existing planning processes might need to be adapted or even created to meaningfully incorporate energy efficiency resources into resource planning Some states have recognized energy efficiency as the resource of first priority due to its broad benefits
Options to Consider
bull Establishing policies to establish energy efficiency as a priority resource
bull Integrating energy efficiency into utility state and regional resource planning activities
bull Quantifying and establishing the value of energy effishyciency considering energy savings capacity savings and environmental benefits as appropriate
Recommendation Make a strong long-term commitment
to implement cost-effective energy efficiency as a
resource Energy efficiency programs are most successshyful and provide the greatest benefits to stakeholders when appropriate policies are established and mainshytained over the long-term Confidence in long-term stashybility of the program will help maintain energy efficiency as a dependable resource compared to supply-side resources deferring or even avoiding the need for other infrastructure investments and maintain customer awareness and support Some steps might include assessing the long-term potential for cost-effective enershygy efficiency within a region (ie the energy efficiency that can be delivered cost-effectively through proven programs for each customer class within a planning horishyzon) examining the role for cutting-edge initiatives and technologies establishing the cost of supply-side options versus energy efficiency establishing robust MampV proceshydures and providing for routine updates to information on energy efficiency potential and key costs
Options to Consider
bull Establishing appropriate cost-effectiveness tests for a portfolio of programs to reflect the long-term benefits of energy efficiency
bull Establishing the potential for long-term cost-effective energy efficiency savings by customer class through proven programs innovative initiatives and cutting-edge technologies
bull Establishing funding requirements for delivering long-term cost-effective energy efficiency
bull Developing long-term energy saving goals as part of energy planning processes
bull Developing robust MampV procedures
bull Designating which organization(s) is responsible for administering the energy efficiency programs
bull Providing for frequent updates to energy resource plans to accommodate new information and technology
3-20 National Action Plan for Energy Efficiency
Recommendation Broadly communicate the benefits of
and opportunities for energy efficiency Experience shows that energy efficiency programs help customers save money and contribute to lower cost energy sysshytems But these benefits are not fully documented nor recognized by customers utilities regulators or policy-makers More effort is needed to establish the business case for energy efficiency for all decision-makers and to show how a well-designed approach to energy efficiency can benefit customers utilities and society by (1) reducing customersrsquo bills over time (2) fostering financially healthy utilities (eg return on equity earnings per share and debt coverage ratios unaffected) and (3) conshytributing to positive societal net benefits overall Effort is also necessary to educate key stakeholders that although energy efficiency can be an important low-cost resource to integrate into the energy mix it does require funding just as a new power plant requires funding
Options to Consider
bull Establishing and educating stakeholders on the business case for energy efficiency at the state utility and other appropriate level addressing customer utility and societal perspectives
bull Communicating the role of energy efficiency in lowering customer energy bills and system costs and risks over time
Recommendation Provide sufficient timely and stable
program funding to deliver energy efficiency where
cost-effective Energy efficiency programs require consisshytent and long-term funding to effectively compete with energy supply options Efforts are necessary to establish this consistent long-term funding A variety of mechashynisms has been and can be used based on state utility and other stakeholder interests It is important to ensure that the efficiency program providers have sufficient long-term funding to recover program costs and impleshyment the energy efficiency measures that have been demonstrated to be available and cost-effective A number of states are now linking program funding to the achievement of energy savings
Options to Consider
bull Deciding on and committing to a consistent way for program administrators to recover energy efficiency costs in a timely manner
bull Establishing funding mechanisms for energy efficiency from among the available options such as revenue requirements or resource procurement funding SBCs rate-basing shared-savings incentive mechanisms etc
bull Establishing funding for multi-year periods
To create a sustainable aggressive national commitment to energy efficiency 3-21
References
American Council for an Energy Efficient Economy [ACEEE] (2006 February) Energy Efficiency Resource Standards Experience and Recommendations lthttpaceeeorgpubseo63htmgt
Bokenkamp K LaFlash H Singh V and Wang D (2005 July) Hedging Carbon Risk Protecting Customers and Shareholders from the Financial Risk Associated with Carbon Dioxide Emissions The Electricity Journal 10(6)11ndash24
California Public Utilities Commission [CPUC] (2005 April 7) Interim Opinion On E3 Avoided Cost Methodology Order Instituting Rulemaking to Promote Consistency in Methodology and Input Assumptions in Commission Applications of Short-Run and Long-run Avoided Costs Including Pricing for Qualifying Facilities Rulemaking 04-04-025 (Filed April 22 2004) lthttpwwwethreecom CPUC45195pdfgt
Frontier Associates (2005 November 1) Energy Efficiency Accomplishments on the Texas Investor Owned Utilities (Calendar Year 2004)
McAluliffe P (2003 June 20) Presentation to the California Energy Commission
New York State Energy Research and Development Authority [NYSERDA] (2005 May) New York Energy $martSM Program Cost-Effectiveness Assessment Albany New York
Northwest Power and Conservation Council [NWPCC] (2005 May) The 5th Northwest Electric Power and Conservation Plan lthttpwwwnwcouncilorg energy powerplandefaulthtmgt
Pacific Gas amp Electric Company [PGampE] (2005 June) 2006-2008 Energy Efficiency Program Portfolio Volume I Prepared Testimony
PacifiCorp (2005 January) 2004 Integrated Resource Plan lthttpwwwpacificorpcomNavigation Navigation23807htmlgt
Public Utilities Commission of Texas [PUCT] (2000 March) Substantive Rule sect25181 Energy Efficiency Goal lthttpwwwpucstatetxusrules subruleselectric2518125181pdfgt
Texas Senate Bill 7 Section 39905 (1999) lthttpwwwcapitolstatetxus cgi-bintlotextframecmdLEG=76ampSESS= RampCHAMBER=SampBILLTYPE=BampBILLSUFFIX= 00007ampVERSION=5ampTYPE=Bgt
Vermont Public Service Board (2005 July 20) Docket 7081 Investigation into Least-Cost Integrated Resource Planning for Vermont Electric Power Company Incs Transmission System
3-22 National Action Plan for Energy Efficiency
4Business Case for Energy Efficiency
A well-designed approach to energy efficiency can benefit utilities customers and society by (1) fostering financially healthy utilities (2) reducing customersrsquo bills over time and (3) contributing to positive societal net benefits overall By establishing and communicating the business case for energy efficiency across utility customer and societal perspectives cost-effective energy efficiency can be better integrated into the energy mix as an important low-cost resource
Overview
Energy efficiency programs can save resources lower utility costs and reduce customer energy bills but they also can reduce utility sales Therefore the effect on utility financial health must be carefully evaluated and policies might need to be modified to keep utilities financially healthy (return on equity [ROE] earnings per share debt coverage ratios unaffected) as they pursue efficiency The extent of the potential economic and environmental benefits from energy efficiency the impact on a utilityrsquos financial results and the importance of modifying existshying policies to support greater investment in these energy efficiency programs depend on a number of market conshyditions that can vary from one region of the country to another
To explore the potential benefits from energy efficiency programs and the importance of modifying existing polishycies a number of business cases have been developed These business cases show the impact of energy efficiency investments on the utilityrsquos financial health and earnings customer energy bills and social resources such as net
Leadership Group Recommendation Applicable to the Business Case for Energy Efficiency
bull Broadly communicate the benefits of and opportunities for energy efficiency
A more detailed list of options specific to the objective of promoting the business case for energy efficiency is provided at the end of this chapter
Key Findings From the Eight Business Cases Examined
bull For both electric and gas utilities energy efficiency investments consistently lower costs over time for both utilities and customers while providing positive net benefits to society When enhanced by ratemaking policies to address utility financial barriers to energy efficiency such as decoupling the utilityrsquos revenues from sales volumes utility financial health can be maintained while comprehensive cost-effective energy efficiency programs are implemented
bull The costs of energy efficiency and reduced sales volume might initially raise gas or electricity bills due to slightly higher rates from efficiency investshyment and reduced sales However as the effishyciency gains help participating customers lower their energy consumption the decreased energy use offsets higher rates to drive their total energy bills down In the eight cases examined average customer bills were reduced by 2 percent to 9 percent over a ten year period compared to the no-efficiency scenario
bull Investment in cost-effective energy efficiency programs yield a net benefit to societymdashon the order of hundreds of millions of dollars in net present value (NPV) for the illustrative case studies (small- to medium-sized utilities)
To create a sustainable aggressive national commitment to energy efficiency 4-1
efficiency costs and pollutant emissions The business cases were developed using an Energy Efficiency Benefits Calculator (Calculator) that facilitates evaluation of the financial impact of energy efficiency on its major stakeshyholdersmdashutilities customers and society The Calculator allows users to examine efficiency investment scenarios across different types of utilities using transparent input assumptions (see Appendix B for detailed inputs and results)1 Policies evaluated with the Calculator are discussed in more detail in Chapter 2 Utility Ratemaking amp Revenue Requirements and Chapter 3 Energy Resource Planning Processes
Eight business cases are presented to illustrate the impact of comprehensive energy efficiency programs on utilities their customers and society The eight cases represent a range of utility types under different growth and investment situations Each case compares the consequences of three scenariosmdashno energy efficiency programs without a decoupling mechanism energy effishyciency without decoupling and energy efficiency with decoupling Energy efficiency spending was assumed to be equal to 2 percent of electricity revenue and 05 pershycent of natural gas revenue across cases regardless of the decoupling assumption these assumptions are similar to many of the programs being managed in regions of the country today2 In practice decoupling and shareshyholder incentives often lead to increased energy efficiency investments by utilities increasing customer and societal benefits
Business Cases Evaluated
Cases 1 and 2 Investor-Owned Electric and Natural Gas Utilitiesbull Case 1 Low-Growth bull Case 2 High-Growth
Cases 3 and 4 Electric Power Plant Deferral bull Case 3 Low-Growth bull Case 4 High-Growth
Cases 5 and 6 Investor-Owned Electric Utility Structurebull Case 5 Vertically Integrated Utility bull Case 6 Restructured Delivery-Only Utility
Cases 7 and 8 Publicly and CooperativelyOwned Electric Utilitiesbull Case 7 Minimum Debt Coverage Ratio bull Case 8 Minimum Cash Position
Table 4-1 provides a summary of main assumpshytions and results of the business cases
Table 4-1 summarizes assumptions about the utility size energy efficiency program and each business case All values shown compare the savings with and without energy efficiency over a 15-year horizon The present value calculations are computed over 30 years to account for the lifetime of the energy efficiency investshyments over 15 years
1 The Calculator was designed to assess a wide variety of utility types using easily obtainable input data It was not designed for applications requiring detailed data for specific applications such as rate setting comparing different types of energy efficiency policies cost-effectiveness testing energy efficiency resource planning and consumer behavior analysis
2 See Chapter 6 Energy Efficiency Program Best Practices for more information on existing programs 3 Cumulative and NPV business case results are calculated using a 5 percent discount rate over 30 years to include the project life term for energy effishy
ciency investments of 15 years All values are in nominal dollars with NPV reported in 2007 dollars (year 1 = 2007) Consistent rates are assumed in year 0 and then adjusted by the Calculator for case-specific assumptions Reductions in utility revenue requirement do not change with decoupling in the Calculator but might in practice if decoupling motivates the utility to deliver additional energy efficiency In these cases societal benefits conservativeshyly equals only the savings from reduced wholesale electricity purchases and capital expenditures minus utility and participant costs of energy efficiency Energy efficiency program costs given in $megawatt-hour (MWh) for electric utilities and $million British thermal units (MMBtu) for gas utilities
4-2 National Action Plan for Energy Efficiency
Tab
le 4
-1
Su
mm
ary
of
Ma
in A
ssu
mp
tio
ns a
nd
Re
su
lts f
or
Ea
ch B
usin
ess C
ase
An
aly
zed
3
To create a sustainable aggressive national commitment to energy efficiency
Case
1
Case
2
Low
Lo
w
Gro
wth
G
row
th
Elec
tric
El
ectr
ic
Uti
lity
Uti
lity
Case
3
Case
4
Low
Gro
wth
Lo
w G
row
th
wit
h 20
09
wit
h 20
09
Pow
er
Pow
er
Plan
t Pl
ant
Case
5
Case
6
Vert
ical
D
eliv
ery
Uti
lity
Uti
lity
Case
7
Case
8
Elec
tric
El
ectr
ic
Publ
icC
oop
Publ
icC
oop
Deb
t Co
vera
ge
No
Deb
t Ra
tio
Uti
lity
Size
Annu
al R
even
ue ($
MM
) - Y
ear 0
Peak
Loa
d (M
W) o
r Sal
es (B
cF) -
Yea
r 0
$284
$2
84
600
MW
60
0 M
W
$284
$2
84
600
MW
60
0 M
W
$284
$2
84
600
MW
60
0 M
W
$237
$2
37
600
MW
60
0 M
W
Para
met
er T
este
d Lo
ad
Load
G
row
th
Gro
wth
Lo
ad G
row
th
Load
Gro
wth
Ve
rtic
al
Deliv
ery
Util
ity
Util
ity
Debt
Cov
erag
e Ca
sh P
ositi
onRa
tio
Ass
umpt
ions
Tha
t D
iffe
r Be
twee
nCa
ses
Load
Gro
wth
Ass
umpt
ion
Aver
age
Rate
- Ye
ar 1
1
5
$01
2M
Wh
$01
2M
Wh
1
5
$01
2M
Wh
$01
2M
Wh
2
2
$01
2M
Wh
$01
2M
Wh
2
2
$01
0M
Wh
$01
0M
Wh
EE P
rogr
am
Cum
ulat
ive
Savi
ngs
(EE
vs N
o EE
cas
e)
Util
ity S
pend
ing
as P
erce
nt o
f Rev
enue
()
Annu
al U
tility
Spe
ndin
g (N
PV in
$M
M)
EE P
roje
ct L
ife Te
rm (y
ears
)
Perc
ent o
f Gro
wth
Sav
ed
Tota
l Cos
t of E
E in
Yea
r 0 ($
MW
h or
$M
MBt
u)
Util
ity C
ost i
n Ye
ar 0
($M
Wh
or $
MM
Btu)
Cust
omer
Cos
t in
Year
0 ($
MW
h or
$M
MBt
u)
810
5 G
Wh
810
5 G
Wh
20
2
0
$70
$70
15
15
142
21
$35
00
$35
00
$20
00
$20
00
$15
00
$15
00
810
5 G
Wh
810
5 G
Wh
20
2
0
$70
$70
15
15
142
21
$35
00
$35
00
$20
00
$20
00
$15
00
$15
00
810
5 G
Wh
810
5 G
Wh
20
2
0
$70
$70
15
15
66
66
$35
00
$35
00
$20
00
$20
00
$15
00
$15
00
675
4 G
Wh
675
4 G
Wh
20
2
0
$58
$58
15
15
55
55
$35
00
$35
00
$20
00
$20
00
$15
00
$15
00
Busi
ness
Cas
e Re
sult
s(N
PV in
$M
M)
Redu
ctio
n in
Rev
enue
Req
uire
men
t ($M
M)
o
f Tot
al R
even
ue R
equi
rem
ent
Net
Cus
tom
er S
avin
gs -
no d
ecou
plin
g ($
MM
)
o
f Tot
al C
usto
mer
Bill
s
Net
Cus
tom
er S
avin
gs -
deco
uplin
g ($
MM
)
o
f Tot
al C
usto
mer
Bill
s
Net
Soc
ieta
l Sav
ings
($M
M)
o
f Tot
al S
ocie
tal C
ost
$396
$3
18
55
3
0
$504
$3
72
70
3
5
$344
$2
66
48
2
5
$289
$2
58
237
5
211
9
$476
$3
38
60
3
0
$608
$3
75
77
3
3
$424
$2
86
54
2
5
$332
$2
69
272
6
221
0
$372
$3
48
41
4
4
$447
$4
37
64
5
6
$320
$2
96
45
3
8
$282
$2
71
67
22
22
$288
$2
70
40
4
3
$459
$2
66
64
4
2
$245
$2
26
434
36
$225
$2
25
222
2
222
2
Air
Em
issi
on S
avin
gs10
00 To
ns C
O2
Tons
NO
x 31
1 31
1 61
61
31
1 31
1 61
61
31
1 31
1 61
61
25
9 25
9 51
51
EE P
rogr
am R
esul
ts d
o no
t cha
nge
whe
n de
coup
ling
is a
ctiv
ated
Reve
nue
Requ
irem
ent a
nd N
et S
ocie
tal S
avin
gs d
o no
t cha
nge
with
dec
oupl
ing
Busi
ness
Cas
e re
sults
are
the
diffe
renc
e be
twee
n th
e N
o EE
and
EE
case
s
Air E
miss
ion
Savi
ngs
are
the
diffe
renc
e be
twee
n N
o EE
and
EE
case
s an
d do
not
cha
nge
whe
n de
coup
ling
is ac
tivat
ed
Case
1
Case
2
Hig
h Lo
w G
row
th
Gro
wth
G
as U
tilit
y G
as U
tilit
y
$344
$3
44
33 B
cF
33 B
cF
Load
Gro
wth
Lo
ad G
row
th
0
2
$1th
erm
$1
ther
m
31 B
cF
31 B
cF
05
0
5
$21
$21
15
15
410
18
$30
0 $3
00
$15
0 $1
50
$15
0 $1
50
$211
$1
42
38
2
2
$258
$1
56
46
2
4
$158
$9
0
28
1
4
$143
$1
19
338
0
282
6
128
128
107
107
BcF
=
billi
on
cubi
c fe
et
CO2
=
carb
on
diox
ide
EE
=
ener
gy
effic
ienc
y G
Wh
=
giga
wat
t-ho
ur
NO
x =
ni
trou
s ox
ides
$M
M
=
mill
ion
dolla
rs
MM
Btu
=
mill
ion
Briti
sh
ther
mal
un
its
MW
h =
meg
awat
t-ho
ur N
PV =
net
pre
sent
val
ue
4-3
While these eight business cases are not comprehensive they allow some generalizations about the likely financial implications of energy efficiency investments These genshyeralizations depend upon the three different perspecshytives analyzed
bull Utility Perspective The financial health of the utility is modestly impacted because the introduction of energy efficiency reduces sales If energy efficiency is accomshypanied with mechanisms to protect shareholdersmdash such as a decoupling mechanism to buffer revenues and profits from sales volumesmdashthe utilityrsquos financial situation can remain neutral to the efficiency investshyments4 This effect holds true for both public and investor-owned utilities
bull Customer Perspective Access to energy efficiency drives customer bills down over time Across the eight case studies energy bills are reduced by 2 percent to 9 percent over a 10 to 15-year period Even though the efficiency investment and decreased sales drives rates slightly higher this increase is more than offset in average customer bills due to a reduction in energy usage
bull Societal Perspective The monetary benefits from energy efficiency exceed costs and are supplemented by other benefits such as lower air emissions
Generalizations may also be made about the impact of policies to remove the throughput incentive such as decoupling mechanisms across these business cases5
These generalizations include
bull Utility Perspective Policies that remove the throughput incentive can provide utilities with financial protection from changes in throughput due to energy efficiency by smoothing the utilityrsquos financial performance while
lowering customer bills Generally the business case results show that a decoupling mechanism benefits utilities more if the energy savings from efficiency are a greater percent of load growth Also because small reductions in throughput have a greater effect on the financial condition of distribution utilities decoupling generally benefits distribution utilities more than vertishycally integrated utilities A utilityrsquos actual results will depend on the structure of its efficiency program as well as the specific decoupling and attrition mechanisms
bull Customer Perspective Decoupling generates more freshyquent but smaller rate adjustments over time because variations in throughput require periodic rate ldquotrueshyupsrdquo Decoupling leads to modestly higher rates earlier for customers when efficiency account for a high pershycent of load growth In all cases energy efficiency reduces average customer bills over time with and without decoupling
bull Societal Perspective The societal benefits of energy efficiency are tied to the amount of energy efficiency implemented Therefore to the extent that decoupling encourages investment in energy efficiency it is a positive from a societal perspective Decoupling itself does not change the societal benefits of energy efficiency
While these cases are a good starting point each utility will have some unique characteristics such as differences in fuel and other costs growth rates regulatory strucshyture and required capital expenditures These and other inputs can be customized in the Calculator so users can consider the possible impacts of energy efficiency on their unique situations The Calculator was developed to aid users in promoting the adoption of energy efficiency programs and the results are therefore geared for education and outreach purposes6
4 Though not modeled in these business case scenarios incentive mechanisms can also be used to let shareholders profit from achieving efficiency goals further protecting shareholders Such incentives can increase the utility and shareholder motivations for increased energy efficiency investment
5 The decoupling mechanism assumed by the Calculator is a ldquogenericrdquo balancing account that adjusts rates annually to account for reduced sales volumes thereby maintaining revenue at target projections Differences in utility incentives that alternative decoupling mechanisms provide are discussed in Chapter 2 Utility Ratemaking amp Revenue Requirements but are not modeled The decoupling mechanism does not protect the utility from cost variations
6 The Calculator was designed to assess a wide variety of utility types using easily obtainable input data It was not designed for applications requiring detailed data for specific applications such as rate setting comparing different types of energy efficiency policies cost effectiveness testing energy effishyciency resource planning and consumer behavior analysis
4-4 National Action Plan for Energy Efficiency
Business Case Results
The eight cases evaluated were designed to isolate the impact of energy efficiency investments and decoupling mechanisms in different utility contexts (eg low-growth and high-growth utilities vertically integrated and restructured utility or cash-only and debt-financed publicly and cooperatively owned utilities) For each case three energy efficiency scenarios are evaluated (no efficiency without decoupling efficiency withshyout decoupling and efficiency with decoupling) while holdshying all other utility conditions and assumptions constant The eight scenarios are divided into four sets of two cases each with contrasting assumptions
An explanation of the key results of the business cases is provided below with further details provided for each case in Appendix B
Cases 1 and 2 Low-Growth and High-Growth Utilities
In this first comparison the results of implementing energy efficiency on two investor-owned electric and natural gas distribution utilities are contrasted These utilities are spending the same percent of revenue on energy efficiency and vary only by load growth The low-growth electric utility (Case 1) has a 1 percent sales growth rate and the low-growth gas utility has a 0 pershycent sales growth rate while the high-growth electric utility (Case 2) has a 5 percent sales growth rate and the high-growth gas utility has a 2 percent sales growth rate Table 4-2 compares the results for electric utilities and Table 4-3 compares the results for the natural gas utilishyties In both cases (and all other cases examined) the Calculator assumes a lsquocurrent yearrsquo test year for rate-setting When rate adjustments are needed the rates are set based on the costs and sales in that same year Therefore differences between forecasted and actual growth rates do not affect the results
Both electric and natural gas utilities show similar trends With low load growth the same level of energy efficiency investment offsets a high percentage of load growth and
utility return on equity (ROE) falls below target until the next rate case unless decoupling is in place7 In contrast the high-growth utility has an ROE that exceeds the target rate of return until the rates are decreased to account for the increasing sales In both cases energy efficiency reduces the utility return from what it would have been absent energy efficiency Generally speaking energy efficiency investments that account for a higher percentage of load growth expose an electric or natural gas utility to a greater negative finanshycial effect unless decoupling is in place
These cases also look at the difference between the two utilities with and without a decoupling mechanism Both utilities earn their target ROE in rate case years with and without the energy efficiency in place (Note that in pracshytice decoupling does not guarantee achieving the target ROE) For the low-growth utility the decoupling mechashynism drives a rate adjustment to reach the target ROE and the utility has higher ROE than without decoupling (Case 1) In the high-growth case decoupling decreases ROE relative to the case without decoupling (Case 2) and prevents the utility from earning slightly above its target ROE from increased sales in between rate cases allowing customer rates to decline sooner in the high-growth electric case if decoupling is in place
In both electric and natural gas Case 1 and Case 2 average customer bills decline over time The average bill is lower beginning in year 3 in the electric utility with no decoupling comparison and in year 5 with decoupling A similar pattern is found for the gas utility example Average bills decrease more when the efficiency is a higher percent of load growth even though rates slightly increase due to efficiency investments and reduced sales The average customer bill declines more smoothly when a decoupling mechanism is used due to more frequent rate adjustments
For both electricity and natural gas energy efficiency the net societal benefit is computed as the difference of the total benefits of energy efficiency less the total costs From a socishyetal perspective the benefits include the value of reduced expenditure on energy (including market price reductionsmdash
7 In Cases 1 and 2 the electric utility invests 2 percent of revenue in energy efficiency and the gas utility invests 05 percent of revenue
To create a sustainable aggressive national commitment to energy efficiency 4-5
Table 4-2 High- and Low-Growth Results Electric Utility
Case 1 Low-Growth (1) Return on Equity (ROE) Without efficiency and decoupling the low sales drive ROE below the target return Target ROE is achieved with energy efficiency (EE) and decoupling Increasing energy efficiency without decoupling decreases ROE
Case 2 High-Growth (5) Return on Equity (ROE) With high load growth without decoupling the utilishyty achieves greater than the target ROE until rates are adjusted With energy efficiency sales and earnings are reduced reducing ROE
Investor-Owned Utility Comparison of Return on Equity
Year
Aft
er T
ax R
OE
()
ROE - No EE ROE - EE no Decoupling ROE - EE and Decoupling Target ROE
3
6
9
12
15
1 2 3 4 5 6 7 8 9 10 Year
Case 1 Case 2
Aft
er T
ax R
OE
()
3
6
9
12
15
1 2 3 4 5 6 7 8 9 10
Comparison of Average Rate
Aver
age
Rate
($k
Wh)
Utility Average Rate - No EE Utility Average Rate - EE no Decoupling Utility Average Rate - EE and Decoupling
$010
$015
$020
$025
$030
1 2 3 4 5 6 7 8 9 10
Aver
age
Rate
($k
Wh)
$010
$015
$020
$025
$030
1 2 3 4 5 6 7 8 9 10
Year Year
Case 1 Case 2
Case 1 Low-Growth (1) Rates Without energy efficiency the utility sells higher volumes than in the no efficiency scenarios and has slightly lower rates Rates in the energy efficiency scenario increase primarily due to lower throughput rates are slightly higher in the decoupling scenario due to increase earnings to the target ROE
Case 2 High-Growth (5) Rates In the high-growth case rates are relatively flat Without energy efficiency the utility sells higher volumes and has slightly lower rates Decoupling does not have a great impact in this case because the ROE is near target levels without any rate adjustments
4-6 National Action Plan for Energy Efficiency
if any) reduced losses reduced capital expenditures and societal benefits are positive the energy efficiency is cost-reduced air emissions (if emissions are monetized)8 The effective from a societal perspective In both Case 1 and costs include both utility program and administration costs Case 2 (and all other cases evaluated using the tool) the net as well as the participant costs of energy efficiency If the net societal benefits are positive for investments in energy
Table 4-2 High- and Low-Growth Results Electric Utility (continued)
Case 1 Low-Growth (1)Bills Total customer bills with energy efficiency programs decline over time indicating customer savings resulting from lower energy consumption Rate increases through the decoupling mechanism reduce the pace of bill savings in the decoupling case
Percent Change in Customer Bills
Case 1 6
Case 2 High-Growth (5)Bills Total customer bills with energy efficiency decline over time indicating customer savings resulting from lower energy consumption There is little difference between the decoupling and no decoupling cases in the high-growth scenario
Case 2 6
-18
1 2 3 4 5 6 7 8 9 10
Cha
nge
in B
ills
()
-18
-21 -21 1 2 3 4 5 6 7 8 9 10
Year Year
3 3
Cha
nge
in B
ills
()
0 0
-3 -3
-6 -6
-9 -9
-12 -12
-15 -15
Change in Customer Bills () - EE no Decoupling Change in Customer Bills () - EE and Decoupling
Case 1 Low-Growth (1)Net Societal Benefits Over time the savings from energy efficiency exceed the annual costs The societal cost and societal savings are the same with and without decoupling
Delivered Costs and Benefits of EE
Case 1 $400
$300
Case 2 High-Growth (5)Net Societal Benefits Over time the savings from energy efficiency exceed the annual costs The societal cost and societal savings are the same with and without decoupling
Case 2$400
$300
1 2 3 4 5 6 7 8 9 10
$100$100
1 2 3 4 5 6 7 8 9 10 $0$0
Year Year
$M
Wh
$M
Wh
$200 $200
Societal Cost ($MWh saved) Societal Savings ($MWh saved)
8 The cases discussed in this document include conservative assumptions and do not include market price reductions or monetize air emissions in net societal benefits
To create a sustainable aggressive national commitment to energy efficiency 4-7
efficiency In the low-growth case the savings exceed costs years for the electric utility cases and four years for the natshywithin two years for both the electric and natural case cases ural gas utility cases Energy efficiency has a similar effect In the high-growth case the savings exceed costs within five upon natural gas utilities as shown in Table 4-3
Table 4-3 High- and Low-Growth Results Natural Gas Utility
Case 1 Low-Growth (0) Return on Equity (ROE) Without efficiency and decoupling the low sales result in ROE falling below the target return Similarly energy efficiency without decoupling drops utility return below target ROE Target ROE is achieved with decoupling
Case 2 High-Growth (2) Return on Equity (ROE) With high load growth energy efficiency has less impact on total sales and earnings Thus the utility achieves close to its target ROE in the early years although without decoupling ROE falls slightly in later years as energy efficiency reduces sales over time
Investor-Owned Utility Comparison of Return on Equity
Aft
er T
ax R
OE
()
3
6
9
12
15
1 2 3 4 5 6 7 8 9 10
Aft
er T
ax R
OE
()
3
6
9
12
15
1 2 3 4 5 6 7 8 9 10 Year
ROE - No EE ROE - EE no Decoupling ROE - EE and Decoupling Target ROE
Year
Case 1 Case 2
Comparison of Average Rate
Ave
rage
Rat
e ($
the
rm)
$080
$085
$090
$095
$100
$105
$110
1 2 3 4 5 6 7 8 9 10 Year Year
Case 1 Case 2
Ave
rage
Rat
e ($
the
rm)
$080
$085
$090
$095
$100
$105
$110
1 2 3 4 5 6 7 8 9 10
Utility Average Rate - No EE Utility Average Rate - EE no Decoupling Utility Average Rate - EE and Decoupling
Case 1 Low-Growth (0) Rates Rates increase over time because of increasing rate base and low sales growth Without energy efficiency the utilshyity sells higher volumes and has lower rates Decoupling increases rates when sales volumes are below target
Case 2 High-Growth (2) Rates Without energy efficiency the utility sells higher volumes and has lower rates Energy efficiency increases rates slightly in later years by reducing sales volumes
4-8 National Action Plan for Energy Efficiency
Table 4-3 High- and Low-Growth Results Natural Gas Utility (continued)
Case 1 Low-Growth (0)Customer Bills Total customer bills with energy efficiency decline over time indicating customer savings resulting from lower energy consumption Customer utility bills initially increase slightly with decoupling as rates are increased to hold ROE at the target level and spending increases on efficiency
Percent Change in Customer Bills
Case 1 4
Case 2 High-Growth (2)Customer Bills Customer utility bills with energy efficiency reflect the more limited impact of efficiency programs on rate proshyfile Total customer bills decline over time indicating cusshytomer savings resulting from lower energy consumption
Case 24
-10 1 2 3 4 5 6 7 8 9 10 1 2 3 4 5 6 7 8 9 10
-10
Year Year
Cha
nge
in B
ills
() 22
Cha
nge
in B
ills
()
00
-2 -2
-4 -4
-6 -6
-8 -8
Change in Customer Bills () - EE no Decoupling Change in Customer Bills () - EE and Decoupling
Case 1 Low-Growth (0)Net Societal Benefits Over time the savings from energy efficiency exceed the annual costs The societal cost and societal savings are the same with and without decoupling
Delivered Costs and Benefits of EE
Case 1 $6
$5
Case 2 High-Growth (2)Net Societal Benefits Over time the savings from energy efficiency exceed the annual costs The societal cost and societal savings are the same with and without decoupling
Case 2 $6
$5
$1
1 32 5 76 94 8 10
$1
$0 $0 1 2 3 4 5 6 7 8 9 10
Year Year
$4 $4
$th
erm
$th
erm
$3 $3
$2 $2
Societal Cost ($therm saved) Societal Savings ($therm saved)
To create a sustainable aggressive national commitment to energy efficiency 4-9
Cases 3 and 4 Electric Power Plant Deferral
This case study examines an electric investor-owned utility with a large capital project (modeled here as a 500-MW combined-cycle power plant although the conclusions are similar for other large capital projects) planned for construction in 20099 Again the effect of a 1 percent growth rate (Case 3) is compared with a 5 percent growth rate (Case 4) with identical energy efficiency investments of 2 percent of electric utility revenues
Figure 4-1 shows the capital expenditure for the project with and without an aggressive energy efficiency plan and a summary of the net benefits from each perspecshytive The length of investment deferral is based on the percent of peak load reduced due to energy efficiency
investments The vertical axis shows how the expendishyture in nominal dollars starts at $500 million in 2009 or slightly higher (due to inflation) after deferral With Case 3 energy efficiency investments account for a higher percentage of peak load growth and can defer the projshyect until 2013 With higher growth and the same level of efficiency savings (Case 4) the same efficiency investshyment only defers the project until 2010
In Case 3 the energy efficiency program causes a greater reduction in revenue requirementmdasha 30-year reduction of $476 million rather than a Case 4 reduction of $338 millionmdashproviding benefits from a customer perspective From a societal perspective the low-growth case energy efficiency program yields higher net societal benefit as well $332 million versus $269 million
Figure 4-1 Comparison of Deferral Length with Low- and High-Growth
30-year savings impact from EE Low-Growth Utility High-Growth Utility Decrease in Revenue Requirement (net present value [NPV] million dollars [$MM]) $476 $338 Net Customer Savings ndash decoupling (NPV $MM) $319 $275 Net Societal Benefit (NPV $MM) $332 $269
Comparison of Investment Timing - Electric Utility
0
100
200
300
400
500
600
2007 2008 2009 2010 2011 2012 2013 2014 2015 2016
Year
Cap
ital E
xpen
ditu
re (
Nom
inal
$M
illion
s)
0
100
200
300
400
500
600
2007 2008 2009 2010 2011 2012 2013 2014 2015 2016
Year
Cap
ital E
xpen
ditu
re (
Nom
inal
$M
illion
s)
Without Energy Efficiency With Energy Efficiency
Case 3 Case 4
Case 3 Low-Growth Investment Timing Case 4 High-Growth Investment Timing
9 This illustration demonstrates how energy efficiency can be used including efforts to reduce peak capacity requirements to defer a single 500 MW combined cycle power plant Energy efficiency can also be used to defer other smaller investments
4-10 National Action Plan for Energy Efficiency
Table 4-4 compares the reduction in revenue requirement due to the deferral of the power plant investment between the two cases In Case 3 the reduction in revenue requireshyment due to the deferral to 2013 results in present value savings of $36 million over the three years that the plant was deferred In Case 4 the deferral provides present value savings of $11 million for the one-year deferral
Although the project is deferred longer in the low-growth case fewer sales overall and higher installed capshyital costs result in higher rates over time relative to the
high-growth case In both cases the increase in rates from energy efficiency programs starting in year 1 is significantly less than the rate increase that occurs after the new power plant investment is made leading to lower customer bills Customer bill savings are greatest during the years that the plant is deferred10
Cases 5 and 6 Vertically Integrated Utility vs Restructured Delivery Company
In this example a vertically integrated electric utility (Case 5) is compared with the restructured electric delivery
Table 4-4 Power Plant Deferral Results
Comparison of Average Rate
Year
Ave
rage
Rat
e ($
kW
h)
$010
$015
$020
$025
$030
1 2 3 4 5 6 7 8 9 10
Year
Ave
rage
Rat
e ($
kW
h)
$010
$015
$020
$025
$030
1 2 3 4 5 6 7 8 9 10
Case 3 Case 4
Utility Average Rate - No EE Utility Average Rate - EE no Decoupling Utility Average Rate - EE and Decoupling
Case 3 Low-Growth (1) Revenue Requirement 2009 project deferred to 2013 resulting in a reducshytion in revenue requirement due to deferring the power plant over three years of PV$36 million
Other Capital Expenditures The low-growth case leads to the savings of other capshyital expenditures compared to the high-growth case
Retail Rates With low load growth a given amount of energy efficiency defers so much load growth that the new power plant can be deferred for three years allowing the utility to conserve capital and postshypone rate increases for several years
Case 4 High-Growth (5) Revenue Requirement 2009 project deferred to 2010 resulting in a reducshytion in revenue requirement from deferring the power plant over a year of PV$11 million
Other Capital Expenditures The low-growth case leads to the savings of other capshyital expenditures compared to the high-growth case
Retail Rates With high load growth energy efficiency reduces load growth enough to defer the new power plant investshyment by one year slowing implementation of a relashytively smaller rate increase
10 The Calculator assumes that a rate case occurs in the year following a large capital investment When a decoupling mechanism is used a higher rate adjustment (and immediate decrease in bill savings) occurs once a new major infrastructure investment is brought online This charge is due to the new level of capital expenditures at the same time a positive decoupling rate adjustment is making up for previous deficiencies
To create a sustainable aggressive national commitment to energy efficiency 4-11
company (Case 6) both experiencing a 2 percent growth expenditures than a restructured delivery utility rate and investing 2 percent of revenue in energy effi- In general the financial impact of energy efficiency on ciency These cases assume that the vertically integrated delivery utilities is more pronounced than on vertically utility has more capital assets and larger annual capital integrated utilities with the same number of customers and
Table 4-4 Power Plant Deferral Results (continued)
Case 3 Low-Growth (1)Customer Bills Although rates rise with large capital expenditures bills continue to fall over time as energy efficiency drives customer volume down to offset the higher rates
Percent Change in Customer Bills
Case 3 6
Case 4 High-Growth (5)Customer Bills Although rates rise with large capital expenditures bills continue to fall over time as energy efficiency drives customer volume down to offset the higher rates
Case 4 6
Cha
nge
in B
ills
()
-21
3
0
-3
-6
-9
-12
-15
-18
3
Cha
nge
in B
ills
()
0
-3
-6
-9
-12
-15
-18
-21 1 2 3 4 5 6 7 8 9 10 1 2 3 4 5 6 7 8 9 10
Year Year
Change in Customer Bills () - EE no Decoupling Change in Customer Bills () - EE and Decoupling
Case 3 Low-Growth (1) Case 4 High-Growth (5) Load Impact Load Impact Energy efficiency significantly reduces load growth With high growth energy efficiency has a limited and reduces the need for new capital investment impact on peak load and defers a modest amount of
new capital investment
Comparison of Peak Load Growth
Case 3 Case 4 160 160
Peak
Loa
d
of F
irst Y
r
Peak
Loa
d
of F
irst Y
r
150
140
130
120
110
100
150
140
130
120
110
100
90 90 1 2 3 4 5 6 7 8 9 10 1 2 3 4 5 6 7 8 9 10
Year Year
Forecasted Growth - EE and Decoupling Forecasted Growth - No EE
4-12 National Action Plan for Energy Efficiency
sales Once divested of a generation plant the Table 4-5 summarizes the comparison of ROE rates bills distribution utility is a smaller company (in terms of total and societal benefits Without implementing energy effishyrate base and capitalization) and fluctuations in through- ciency both utilities are relatively financially healthy put and earnings have a relatively larger impact on return achieving near their target rate of return in each year
Table 4-5 Vertically Integrated and Delivery Company Results
Case 5 Vertically IntegratedReturn on Equity (ROE) Because the vertically integrated utility has a large rate base the impact of energy efficiency upon total earnings is limited and it has little impact upon ROE (with or withshyout decoupling)
Investor-Owned Utility Comparison of Return on Equity
Case 515
Case 6 Delivery UtilityReturn on Equity (ROE) With a smaller rate base and revenues only from kWh deliveries energy efficiency has a larger impact on a ROE without decoupling than a vertically integrated utility
Case 6 15
Aft
er T
ax R
OE
()
Aft
er T
ax R
OE
()
12
9
6
12
9
6
3 1 2 3 4 5 6 7 8 9 10
Year
Case 5 Vertically IntegratedRates Without energy efficiency the utility sells higher volumes and has lower rates Total retail rates including delivery and energy are similar for the vertically integrated and restructured utilities
Comparison of Average Rate
Case 5 $030
3 1 2 3 4 5 6 7 8 9 10
Year
ROE - No EE ROE - EE no Decoupling ROE - EE and Decoupling Target ROE
Case 6 Delivery Utility Rates Without energy efficiency the utility sells higher volumes and has lower rates Total retail rates including delivery and energy are similar for the vertically integrated and restructured utilities
Case 6 $030
Ave
rage
Rat
e ($
kW
h)
Ave
rage
Rat
e ($
kW
h)
$025
$020
$015
$025
$020
$015
$010 $010 1 2 3 4 5 6 7 8 9 10 1 2 3 4 5 6 7 8 9 10
Year Year
Utility Average Rate - No EE Utility Average Rate - EE no Decoupling Utility Average Rate - EE and Decoupling
To create a sustainable aggressive national commitment to energy efficiency 4-13
Table 4-5 Vertically Integrated and Delivery Company Results (continued)
Case 5 Vertically IntegratedBills Total customer bills with energy efficiency programs decline over time indicating average customer savings resulting from lower energy consumption Customer utility bills decrease more smoothly with decoupling as a result of the more frequent rate adjustments
Percent Change in Customer Bills
Case 5 6
Case 6 Delivery UtilityBills Total customer bills with energy efficiency programs decline over time indicating average customer savings resulting from lower energy consumption Customer utilshyity bills decrease more slowly in the decoupling case because rates are increased earlier to offset reduced sales
Case 6 6
Cha
nge
in B
ills
()
Cha
nge
in B
ills
() 3 3
0
-3
-6
-9
-12
-15
-18
0
-3
-6
-9
-12
-15
-18
-21 1 2 3 4 5 6 7 8 9 10 1 2 3 4 5 6 7 8 9 10
-21
Year Year
Change in Customer Bills () - EE no Decoupling Change in Customer Bills () - EE and Decoupling
Case 5 Vertically IntegratedNet Societal Benefits Over time the savings from energy efficiency exceed the annual costs The societal cost and societal savings are the same with and without decoupling
Delivered Costs and Benefits of EE
Case 5$400
$300
1 2 3 4 5 6 7 8 9 10
$M
Wh
$200
$100 $100
Case 6 Delivery UtilityNet Societal Benefits As with the vertically integrated utility savings from energy efficiency exceed the costs over time The distribution utility has a lower initial societal savings because the distribution company reduces fewer capital expenditures at the outset of the energy efficiency investments Over time the societal costs and savings are similar to the distribution company
Case 6$400
$300
1 2 3 4 5 6 7 8 9 10
$M
Wh
$200
$0 $0
Year Year
Societal Cost ($MWh saved) Societal Savings ($MWh saved)
4-14 National Action Plan for Energy Efficiency
however introducing energy efficiency reduces ROE and earnings for both utilities unless a decoupling mechashynism is put in place Customer rates increases bill savings and societal benefits follow similar trends with energy efficiency as discussed in Cases 1 and 2
Cases 7 and 8 Publicly and Cooperatively Owned Electric Utilities
The first six cases used an investor-owned electric utility to illustrate the business case for energy efficiency The Calculator also can evaluate the impact of efficiency programs on publicly and cooperatively owned electric utilities Many of the issues related to the impact of growth rates and capital deferral discussed in the investor-owned utility examples apply equally to publicly and cooperatively owned utilities From a net societal benefit perspective the results are identical for publicly cooperatively and privately owned utilities The ratemaking and utility financing perspectives are different however
The financial position of publicly owned utilities is evalushyated primarily based on either the debt coverage ratio (which is critical to maintaining a high bond rating and low cost capital) or the minimum cash position (for utilities with no debt) Table 4-6 shows the results of a publicly or cooperatively owned utility with an energy efficiency program of 2 percent of revenue and load growth of 2 percent In both cases the assumption is made that the utility adjusts rates whenever the debt coverage ratio or minimum cash position falls below a threshold This assumption makes comparisons of differshyent cases more difficult but the trends are similar to the investor-owned utilities on a regular rate case cycle The change in utility financial health due to energy efficiency is relatively modest because of the ability to adjust the retail rates to maintain financial health The publicly and cooperatively owned utilities will experience similar financial health problems as investor-owned utilities if they do not adjust rates
Table 4-6 Publicly and Cooperatively Owned Utility Results
Case 7 Minimum Debt Coverage Ratio Utility Financial Health A decoupling mechanism stabilizes the utilityrsquos ability to cover debt by adjusting rates for variations in throughput Without decoupling rates are adjusted whenever the debt coverage rate falls below a threshold (ratio 2 in the example) The rate adjustment is required earlier in the energy efficiency scenario
Case 8 Minimum Cash Position Utility Financial Health In the no decoupling cases (with and without energy efficiency) rates are reset if the cash position falls below a minimum threshold ($70 million in this example) With decoupling the utility adjusts rates to hit the target cash level in each year The results are similar as long as there is an ability to reset rates when needed to maintain a minimum cash position
Public PowerCooperative Debt Coverage Ratio
Year
Deb
t C
over
age
Ratio
Debt Coverage Ratio - No EE
Debt Coverage Ratio - EE no Decoupling
Debt Coverage Ratio - EE and Decoupling
100
150
200
250
1 3 5 7 92 4 6 8 10
Cash Position at End of Year
Year
End
of Y
ear
Cas
h ($
MM
)
$40
$50
$60
$70
$80
1 2 3 4 5 6 7 8 9 10
Cash Position - No EE
Cash Position - EE no Decoupling
Cash Position - EE and Decoupling
Case 7 Case 8
To create a sustainable aggressive national commitment to energy efficiency 4-15
4-16 National Action Plan for Energy Efficiency
Case 7 Minimum Debt Coverage Ratio Customer Rates With or without decoupling rates are adjusted to maintain financial health Rates are lowest without energy efficiency and highest with energy efficiency and decoupling
Case 8 Minimum Cash Position Customer Rates Once energy efficiency is implemented retail rate levels are similar with or without decoupling in place The decoupling case is slightly smoother with smaller more frequent rate adjustments
Comparison of Average Rate
Year
Aver
age
Rate
($k
Wh)
$010
$015
$020
$025
$030
1 2 3 4 5 6 7 8 9 10 Year
Aver
age
Rate
($k
Wh)
$010
$015
$020
$025
$030
1 2 3 4 5 6 7 8 9 10
Utility Average Rate - No EE Utility Average Rate - EE no Decoupling Utility Average Rate - EE and Decoupling
Case 7 Case 8
Table 4-6 Publicly and Cooperatively Owned Utility Results (continued)
Case 7 Minimum Debt Coverage Ratio Customer Bills Average customer bills decline with energy efficiency investments with and without decoupling The lsquorandomnessrsquo in the bill change is due to different timshying of rate adjustments in the energy efficiency and no energy efficiency cases However overall the trend is downward
Case 8 Minimum Cash Position Customer Bills Average customer bills decline with energy efficiency investments in both the decoupling and no decoupling cases
Percent Change in Customer Bills
Year 1 2 3 4 5 6 7 8 9 10
Year 1 2 3 4 5 6 7 8 9 10
Change in Customer Bills () - EE no Decoupling Change in Customer Bills () - EE and Decoupling
Case 7 Case 8
Chan
ge in
Bill
s (
)
Chan
ge in
Bill
s (
)
-21
-18
-15
-12
-9
-6
-3
0
3
6
-21
-18
-15
-12
-9
-6
-3
0
3
6
Key Findings
This chapter summarizes eight business cases for energy efficiency resulting from the Energy Efficiency Benefits Calculator This Calculator provides simplified results from a utility customer and societal perspective As stated on page 4-1 the key findings from the eight cases examined include
bull For both electric and gas utilities energy efficiency investments consistently lower costs over time for both utilities and customers while providing positive net benefits to society When enhanced by ratemaking policies to address utility financial barriers to energy efficiency such as decoupling the utilityrsquos revenues from sales volumes utility financial health can be maintained while comprehensive cost-effective energy efficiency programs are implemented
bull The costs of energy efficiency and reduced sales volume might initially raise gas or electricity bills due to slightly higher rates from efficiency investment and reduced sales However as the efficiency gains help participating customers lower their energy consumpshytion the decreased energy use offsets higher rates to drive their total energy bills down In the 8 cases examshyined average customer bills were reduced by 2 percent to 9 percent over a ten year period compared to the no-efficiency scenario
bull Investment in cost-effective energy efficiency programs yields a net benefit to societymdashon the order of hundreds of millions of dollars in NPV for the illustrative case studies (small- to medium-sized utilities)
Recommendations and Options
The National Action Plan for Energy Efficiency Leadership Group offers the following recommendation as a way to overcome many of the barriers to energy efficiency and provides the following options for consideration by utilishyties regulators and stakeholders (as presented in the Executive Summary)
Recommendation Broadly communicate the beneshyfits of and opportunities for energy efficiency Experience shows that energy efficiency programs help customers save money and contribute to lower cost energy systems But these impacts are not fully docushymented nor recognized by customers utilities regulators and policy-makers More effort is needed to establish the business case for energy efficiency for all decision-makers and to show how a well-designed approach to energy efficiency can benefit customers utilities and society by (1) reducing customers bills over time (2) fostering financially healthy utilities (return on equity [ROE] earnshyings per share debt coverage ratios unaffected) and (3) contributing to positive societal net benefits overall Effort is also necessary to educate key stakeholders that although energy efficiency can be an important low-cost resource to integrate into the energy mix it does require funding just as a new power plant requires funding
Options to Consider bull Establishing and educating stakeholders on the busishy
ness case for energy efficiency at the state utility and other appropriate level addressing relevant customer utility and societal perspectives
bull Communicating the role of energy efficiency in lowering customer energy bills and system costs and risks over time
Reference
National Action Plan for Energy Efficiency (2006) Energy Efficiency Benefits Calculator lthttpwwwepagovcleanenergyeeactionplanhtmgt
To create a sustainable aggressive national commitment to energy efficiency 4-17
5 Rate Design
Retail electricity and natural gas utility rate structures and price levels influence customer consumption and thus are an important tool for encouraging the adoption of energy-efficient technologies and practices The rate design process typically involves balancing multiple objectives among which energy efficiency is often overlooked Successful rate designs must balance the overall design goals of utilities customers regulators and other stakeholders including encouraging energy efficiency
Overview
Retail rate designs with clear and meaningful price signals coupled with good customer education can be powerful tools for encouraging energy efficiency At the same time rate design is a complex process that must take into account multiple objectives (Bonbright 1961 Philips 1988) The main priorities for rate design are recovery of utility revenue requirements and fair apporshytionment of costs among customers
Other important regulatory and legislative goals include
bull Stable revenues for the utility
bull Stable rates for customers
bull Social equity in the form of lifeline rates for essential needs of households (PURPA of 1978)
bull Simplicity of understanding for customers and ease of implementation for utilities
bull Economic efficiency to promote cost-effective load management
This chapter considers the additional goal of encouraging investment in energy efficiency While it is difficult to achieve every goal of rate design completely considerashytion of a rate designrsquos impact on adoption of energy effishyciency and any necessary trade-offs can be included as part of the ratemaking process
Using Rate Design to Promote Energy Efficiency
In developing tariffs to encourage energy efficiency the following questions arise (1) What are the key rate design issues and how do they affect rate designs for energy efficiency (2) What different rate design options are possible and what are their pros and cons (3) What other mechanisms can encourage efficiency that are not driven by tariff savings and (4) What are the most successful strategies for encouraging energy efficiency in different jurisdictions These questions are addressed throughout this chapter
Leadership Group Recommendations
Applicable to Rate Design
bull Modify ratemaking practices to promote energy efficiency investments
bull Broadly communicate the benefits of and opportunities for energy efficiency
A more detailed list of options specific to the objective of promoting energy efficiency in rate design is provided at the end of this chapter
Background Revenues and Rates
Utility rates are designed to collect a specific revenue requirement based on natural gas or electricity sales As rates are driven by sales and revenue requirements these three aspects of regulation are tightly linked (Revenue requirement issues are discussed in Chapter 2 Utility Ratemaking amp Revenue Requirements)
To create a sustainable aggressive national commitment to energy efficiency 5-1
Until the 1970s rate structures were based on the principle of average-cost pricing in which customer prices reflected the average costs to utilities of serving their customer class Because so many of a utilityrsquos costs were fixed the main goal of rate design up until the 1970s was to promote sales Higher sales allowed fixed costs to be spread over a larger base and helped push rates down keeping stakeholders content with average-cost based rates (Hyman et al 2000)
This dynamic began to change in many jurisdictions in the 1970s with rising oil prices and increased emphasis on conservation With the passage of the 1978 Public Utility Regulatory Policies Act (PURPA) declining block rates were replaced by flat rates or even inverted block rates as utilities began to look for ways to defer new plant investment and reduce the environmental impact of energy consumption
Key Rate Design Issues
Utilities and regulators must balance competing goals in designing rates Achieving this balance is essential for obtaining regulatory and customer acceptance The main rate design issues are described below
Provide Recovery of Revenue Requirements and Stable Utility Revenues
A primary function of rates is to let utilities collect their revenue requirements Utilities often favor rate forms that maximize stable revenues such as declining block rates The declining block rate has two or more tiers of usage with the highest rates in the first tier Tier 1 is typically a relatively low monthly usage level that most customers exceed This rate gives utilities a high degree of certainty regarding the number of kilowatt-hours
(kWh) or therms that will be billed in Tier 1 By designing Tier 1 rates to collect the utilityrsquos fixed costs the utility gains stability in the collection of those costs At the same time the lower Tier 2 rates encourage higher energy consumption rather than efficiency which is detrimental to energy efficiency impacts1 Because energy efficiency measures are most likely to change customer usage in Tier 2 customers will see smaller bill reductions under declining block rates than under flat rates Although many utilities have phased out declining block rates a number of utilities continue to offer them2
Another rate element that provides revenue stability but also detracts from the incentive to improve efficiency is collecting a portion of the revenue requirement through a customer charge that is independent of usage Because the majority of utility costs do not vary with changes in customer usage level in the short run the customer charge also has a strong theoretical basis This approach has mixed benefits for energy efficiency On one hand a larger customer charge means a smaller volumetric charge (per kWh or therm) which lowers the customer incentive for energy efficiency On the other hand a larger customer charge and lower volushymetric charge reduces the utilities profit from increased sales reducing the utility disincentive to promote energy efficiency
Rate forms like declining block rates and customer charges promote revenue stability for the utility but they create a barrier to customer adoption of energy efficiency because they reduce the savings that cusshytomers can realize from reducing usage In turn elecshytricity demand is more likely to increase which could lead to long-term higher rates and bills where new supply is more costly than energy efficiency To proshymote energy efficiency a key challenge is to provide a
1 Brown and Sibley (1986) opine that a declining block structure can promote economic efficiency if the lowest tier rate can be set above marginal cost while inducing additional consumption by some consumers A rising marginal cost environment suggests however that a declining block rate structure with rates below the increasing marginal costs is economically inefficient
2 A partial list of utilities with declining block residential rates includes Dominion Virginia Power VA Appalachian Power Co VA Indianapolis Power and Light Co IN Kentucky Power Co KY Cleveland Electric Illum Co OH Toledo Edison Co OH Rappahannock Electric Coop VA Lincoln Electric System NE Cuivre River Electric Coop Inc MO Otter Tail Power Co ND Wheeling Power Co WV Matanuska Electric Assn Inc AK Homer Electric Association Inc AK Lower Valley Energy NE
5-2 National Action Plan for Energy Efficiency
level of certainty to utilities for revenue collection without dampening customer incentive to use energy more efficiently
Fairly Apportion Costs Among Customers
Revenue allocation is the process that determines the share of the utilityrsquos total revenue requirement that will be recovered from each customer class In regulatory proceedings this process is often contentious as each customer class seeks to pay less This process makes it difficult for utilities to propose rate designs that shift revenues between different customer classes
In redesigning rates to encourage energy efficiency it is important to avoid unnecessarily or inadvertently shifting costs between customer classes Rate design changes should instead focus on providing a good price signal for customer consumption decisions
Promote Economic Efficiency for Cost-Effective Load Management
According to economic theory the most efficient outshycome occurs when prices are equal to marginal costs resulting in the maximum societal net benefit from consumption
Marginal Costs
Marginal costs are the changes in costs required to proshyduce one additional unit of energy In a period of rising marginal costs rates based on marginal costs more realshyistically reflect the cost of serving different customers and provide an incentive for more efficient use of resources (Bonbright 1961 Kahn 1970 Huntington 1975 Joskow 1976 Joskow 1979)
A utilitys marginal costs often include its costs of complyshying with local state and federal regulations (eg Clean Air Act) as well as any utility commission policies addressshying the environment (eg the use of the societal test for benefit-cost assessments) Rate design based on the utilitys marginal costs that promotes cost-effective energy
efficiency will further increase environmental protection by reducing energy consumption
Despite its theoretical attraction there are significant barshyriers to fully implementing marginal-cost pricing in elecshytricity especially at the retail level In contrast to other commodities the necessity for generation to match load at all times means that outputs and production costs are constantly changing and conveying these costs as real time ldquoprice signalsrdquo to customers especially residential customers can be complicated and add additional costs Currently about half of the nationrsquos electricity customers are served by organized real-time electricity markets which can help provide time-varying prices to customers by regional or local area
Notwithstanding the recent price volatility exacerbated by the 2005 hurricane season and current market condishytions wholesale natural gas prices are generally more stable than wholesale electricity prices largely because of the ability to store natural gas As a result marginal costs have been historically a less important issue for natural gas pricing
Short-Run Versus Long-Run Price Signals
There is a fundamental conflict between whether electricity and natural gas prices should reflect short-run or long-run marginal costs In simple terms short-run costs reflect the variable cost of production and delivery while long-run costs also include the cost of capital expansion For proshygrams such as real-time pricing in electricity short-run marginal costs are used for the price signals so they can induce efficient operating decisions on a daily or hourly basis
Rates that reflect long-run marginal costs will promote economically efficient investment decisions in energy efficiency because the long-run perspective is consistent with the long expected useful lives of most energy effishyciency measures and the potential for energy efficiency to defer costly capital investments For demand-response and other programs intended to alter consumption on a daily or hourly basis however rates based on short-run
To create a sustainable aggressive national commitment to energy efficiency 5-3
Applicability of Rate Design Issues
Implications for Clean Distributed Generation and
Demand Response The rate issues for energy effishyciency also apply to clean distributed generation and demand response with two exceptions Demand response is focused on reductions in usage that occur for only a limited number of hours in a year and occur at times that are not known far in advance (typically no more than one day notice and often no more than a few hours notice) Because of the limited hours of operation the revenue erosion from demand response is small compared to an energy efficiency measure In addition it could be argued that short-run rather than long-run costs are the appropriate cost metric to use in valuing and pricing demand response programs
Public Versus Private Utilities The rate issues are essentially the same for both public and private utilishyties Revenue stability might be a lesser concern for public utilities as they could approach their city leaders for rate changes Frequent visits to council chambers for rate changes might be frowned upon however so revenue stability will likely remain imporshytant to many public utilities as well
marginal cost might be more appropriate Therefore in developing retail rates the goals of short-run and long-run marginal based pricing must be balanced
Cost Causation
Using long-run marginal costs to design an energy-efficiency enhancing tariff can present another challenge mdashpotential inconsistency with the cost-causation princishyple that a tariff should reflect the utilitys various costs of serving a customer This potential inconsistency diminishes in the long run however because over the long run some costs that might be considered fixed in the near term (eg generation or transmission capacity new interstate pipeline capacity or storage) are actually varishyable Such costs can be reduced through sustained load
Gas Versus Electric As discussed above gas marginal costs are less volatile than electricity marginal costs so providing prices that reflect marginal costs is generally less of a concern for the gas utilities In addition the nature of gas service does not lend itself to complicated rate forms such as those seen for some electricity cusshytomers Nevertheless gas utilities could implement increasing tier block rates andor seasonally differenshytiated rates to stimulate energy efficiency
Restructured Versus Non-Restructured Markets
Restructuring has had a substantial impact on the funding administration and valuation of energy effishyciency programs It is no coincidence that areas with high retail electricity rates have been more apt to restructure their electricity markets The higher rates increase the appeal of energy efficiency measures and the entry of third-party energy service companies can increase customer interest and education regarding energy efficiency options In a retail competition envishyronment however there might be relatively little rate-making flexibility In several states restructuring has created transmission and distribution-only utilities so the regulatorrsquos ability to affect full electricity rates might be limited to distribution costs and rates for default service customers
reductions provided by energy efficiency investment induced by appropriately designed marginal cost-based rates Some costs of a utility do not vary with a cusshytomers kWh usage (eg hookup and local distribution) As a result a marginal cost-based rate design may necessarily include some fixed costs which can be collected via a volumetric adder or a relatively small customer charge However utilities that set usage rates near long-run marginal costs will encourage energy effishyciency and promote other social policy goals such as affordability for low-income and low-use customers whose bills might increase with larger fixed charges Hence a practical implementation of marginal-cost based ratemaking should balance the trade-offs and competing goals of rate design
5-4 National Action Plan for Energy Efficiency
Provide Stable Rates and Protect Low-Income Customers
Rate designs to promote energy efficiency must conshysider whether or not the change will lead to bill increases Mitigating large bill increases for individual customers is a fundamental goal of rate design and in some jurisdictions low-income customers are also afforded particular attention to ensure that they are not adversely affected by rate changes In some cases low-income customers are eligible for special rates or rate riders that protect them from large rate increases as exemplified by the lifeline rates provision in Section 114 of the 1978 PURPA Strategies to manage bill impacts include phasing-in rate changes to reduce the rate shock in any single year creating exemptions for certain at-risk customer groups and disaggregating customers into small customer groups to allow more targeted rate forms
Because of the concern over bill impacts new and innoshyvative rates are often offered as voluntary rates While improving acceptance voluntary rate structures generally attract a relatively small percentage of customers (less than 20 percent) unless marketed heavily by the utility Voluntary rates can lead to some ldquofree ridersrdquo meaning customers who achieve bill reductions without changing their consumption behavior and providing any real savshyings to the utility Rates to promote energy efficiency can be offered as voluntary but the low participation and free rider issues should be taken into account in their design to ensure that the benefits of the consumption changes they encourage are at least as great as the resulting bill decreases
Maintain Rate Simplicity
Economists and public policy analysts can become enamshyored with efficient pricing schemes but customers genshyerally prefer simple rate forms The challenge for promoting energy efficiency is balancing the desire for rates that provide the right signals to customers with the need to have rates that customers can understand and to which they can respond Rate designs that are too complicated for customers to understand will not be
effective at promoting efficient consumption decisions Particularly in the residential sector customers might pay more attention to the total bill than to the underlying rate design
Addressing the Issues
Alternative Approaches
The prior sections listed the issues that stakeholders must balance in designing new rates This section presents some traditional and non-traditional rate designs and discusses their merits for promoting energy efficiency The alternatives described below vary by meteringbilling requirement information complexity and ability to reflect marginal cost3
Rate Design Options
Inclining Tier Block
Inclining tier block rates also referred to as inverted block rates have per-unit prices that increase for each successive block of energy consumed Inclining tiered rates offer the advantages of being simple to understand and simple to meter and bill Inclining rates can also meet the policy goal of protecting small users which often include low-income customers In fact it was the desire to protect small users that prompted the initiation of increasing tiers in California Termed ldquolifeline ratesrdquo at the time the intention was to provide a small base level of electricity to all residential customers at a low rate and charge the higher rate only to usage above that base level The concept of lifeline rates continues in varshyious forms for numerous services such as water and sewer services and can be considered for delivery or commodity rates for electricity and natural gas However in many parts of the country low-income customers are not necessarily low-usage customers so a lifeline rate might not protect all low-income customers from energy bills
3 As part of its business model a utility may use innovative rate options for the purpose of product differentiation For example advanced metering that enables a design with continuously time-varying rates can apply to an end-use (eg air conditioning) that is the main contributor to the utilitys system peak Another example is the bundling of sale of electricity and consumer devices (eg a 10-year contract for a central air conditioner whose price includes operation cost)
To create a sustainable aggressive national commitment to energy efficiency 5-5
Tiered rates also provide a good fit for regions where the long-run marginal cost of energy exceeds the curshyrent average cost of energy For example regions with extensive hydroelectric resources might have low avershyage costs but their marginal cost might be set by much higher fossil plant costs or market prices (for purchase or export)
See Table 5-1 for additional utilities that offer inclining tier residential rates
Time of Use (TOU)
TOU rates establish varying charges by season or time of day Their designs can range from simple on- and off-peak rates that are constant year-round to more complishycated rates with seasonally differentiated prices for sevshyeral time-of-day periods (eg on- mid- and off-peak) TOU rates have support from many utilities because of the flexibility to reflect marginal costs by time of delivery
TOU rates are commonly offered as voluntary rates for residential electric customers4 and as mandatory rates for larger commercial and industrial customers Part of the reason for TOU rates being applied primarily to
larger users is the additional cost of TOU metering and billing as well as the assumed greater ability of larger customers to shift their loads
TOU rates are less applicable to gas rates because the natural storage capability of gas mains allows gas utilities to procure supplies on a daily rather than hourly basis Additionally seasonal variations are captured to a large extent in costs for gas procurement which are typically passed through to the customer An area with conshystrained seasonal gas transportation capacity however could merit a higher distribution cost during the conshystrained season Alternatively a utility could recover a higher share of its fixed costs during the high demand season because seasonal peak demand drives the sizing of the mains
As TOU rates are typically designed to be revenue-neutral with the status quo rates a high on-peak price will be accompanied by a low off-peak price Numerous studies in electricity have shown that while the high on-peak prices do cause a reduction in usage during that period the low off-peak prices lead to an increase in usage in the low-cost period There has also been an
Table 5-1 Partial List of Utilities With Inclining Tier Residential Rates
Utility Name State Tariff URL
Florida Power and Light FL httpwwwfplcomaccesscontentshow_to_read_your_billshtml
Consolidated Edison NY httpwwwconedcomdocumentselec201-210pdf
Pacific Gas amp Electric CA httpwwwpgecomresfinancial_assistancemedical_baseline_life_support
understandingindexhtmltopic4
Southern California Edison CA httpwwwscecomNRrdonlyres728FFC8C-91FD-4917-909Bshy
Arizona Public Service Co AZ httpswwwapscommy_accountRateComparerhtml
Sacramento Municipal Util Dist CA httpwwwsmudorgresidentialrateshtml
Indiana Michigan Power Co MI httpswwwindianamichiganpowercomglobalutilitiestariffs
MichiganMISTD1-31-06pdf
Modesto Irrigation District CA httpwwwmidorgservicestariffsratesums-d-residentialpdf
Turlock Irrigation District CA httpwwwtidorgPublisher_PDFsDEpdf
Granite State Electric Co NH httpwwwnationalgriduscomgranitestatehomerates4_dasp
Vermont Electric Cooperative Inc VT httpwwwvtcoopcomPageVieweraspxPageName=Rates20Summary
City of Boulder NV httpwwwbcnvorgutilitieshtmlelectricwaterandsewer
4 For a survey of optional rates with voluntary participation see Horowitz and Woo (2006)
5-6 National Action Plan for Energy Efficiency
ldquoincome effectrdquo observed where people buy more energy as their overall bill goes down due to switching conshysumption to lower price periods The net effect might not be a significant decrease in total electricity usage but TOU rates do encourage reduced usage when that reduction is the most valuable Another important conshysideration with TOU prices is the environmental impact Depending on generation mix and the diurnal emissions profile of the region shifting consumption from the on-peak period to off-peak period might provide environshymental net benefits
The Energy Policy Act of 2005 Section 1252 requires states and non-regulated utilities by August 8 2007 to consider adopting a standard requiring electric utilities to offer all of their customers a time-based rate schedule such as time-of-use pricing critical peak pricing real-time pricing or peak load reduction credits
Dynamic Rates
Under a dynamic rate structure the utility has the ability to change the cost or availability of power with limited or no notice Common forms of dynamic rates include the following
bull Real-time pricing (RTP) rates vary continuously over time in a way that directly reflects the wholesale price of electricity
bull Critical peak pricing (CPP) rates have higher rates during periods designated as critical peak periods by the utility Unlike TOU blocks the days in which critical peaks occur are not designated in the tariff but are designated on relatively short notice for a limited number of days during the year
bull Non-firm rates typically follow the pricing form of the otherwise applicable rates but offer discounts or incentive payments for customers to curtail usage during times of system need (Horowitz and Woo 2006) Such periods of system need are not designated in advance through the tariff and the customer might receive little notice before energy supply is interrupted In some
cases customers may be allowed to ldquobuy throughrdquo periods when their supply will be interrupted by paying a higher energy charge (a non-compliance penalty) In those cases the non-firm rate becomes functionally identical to CPP rates
Dynamic rates are generally used to 1) promote load shifting by large sophisticated users 2) give large users access to low ldquosurplus energyrdquo prices or 3) reduce peak loads on the utility system Therefore dynamic rates are complementary to energy efficiency but are more useful for achieving demand response during peak periods than reducing overall energy usage
Two-Part Rates
Two-part rates refer to designs wherein a base level of customer usage is priced at rates similar to the status quo (Part 1) and deviations from the base level of usage are billed at the alternative rates (Part 2) Two-part rates are common among RTP programs to minimize the free rider problem By implementing a two-part rate cusshytomers receive the real time price only for their change in usage relative to their base level of usage Without the two-part rate form most low load-factor customers on rates with demand charges would see large bill reducshytions for moving to an RTP rate
A two-part rate form however could also be combined with other rate forms that are more conducive to energy efficiency program adoption For example a two-part rate could be structured like an increasing tiered block rate with the Tier 1 allowance based on the customerrsquos historical usage This structure would address many of the rate design barriers such as revenue stability Of course there would be implementation issues such as determining what historical period is used to set Part 1 and how often that baseline is updated to reflect changes in usage Also new customers would need to be assigned an interim baseline
To create a sustainable aggressive national commitment to energy efficiency 5-7
Demand Charges
Demand charges bill customers based on their peak usage rather than their total usage during the month For electricshyity demand charges are based on usage during particular TOU periods (eg peak demand) or usage during any perishyod in the month (eg maximum demand) Demand charges can also use a percentage of the highest demand over the prior year or prior season as a minimum demand level used for billing For natural gas demand can be based on the highest monthly usage over the past year or season
For both gas and electricity utilities prefer demand charges over volumetric charges because they provide greater revenue certainty and encourage more consisshytent asset utilization In contrast to a demand charge a customer charge that covers more of a utilityrsquos fixed costs reduces profits from increased sales and the utility disincentive to promote energy efficiency
For energy efficiency programs demand charges could help promote reductions in usage for those end uses that cause the customerrsquos peak5 In general however volumetric rates are more favorable for energy efficiency promotion Increasing the demand charges would reduce the magnitude of the price signal that could be sent through a volumetric charge
Mechanisms Where Customer Benefits Are Not Driven by Tariff Savings
The rate design forms discussed above allow customers to benefit from energy efficiency through bill reductions however other types of programs provide incentives that are decoupled from the customerrsquos retail rate
Discount for Efficiency via Conservation Behavior
In some cases energy efficiency benefits are passed on to customers through mechanisms other than retail rates For example in California the ldquo2020rdquo program was impleshymented in 2001 giving customers a 20 percent rebate off their summer bills if they could reduce their electricity
consumption by 20 percent compared to the summer perishyod the prior year The programs success was likely due to a combination of aggressive customer education energy conservation behavior (reducing consumption through limshyiting usage of appliances and end-uses) and investment in energy efficiency Pacific Gas amp Electric (PGampE) has just implemented a similar program for natural gas wherein customers can receive a rebate of 20 percent of their last winterrsquos bill if they can reduce natural gas usage by 10 pershycent this winter season The 2020 program was popular and effective It was easy for customers to understand and there might be a psychological advantage to a program that gives you a rebate (a received reward) as opposed to one that just allows you to pay less than you otherwise would have (a lessened penalty) Applying this concept might require some adjustments to account for changes in weather or other factors
Benefit Sharing
There are two types of benefit sharing with customers6
Under the first type of shared savings a developer (utility or third party) installs an energy-saving device The cusshytomer shares the bill savings with the developer until the customerrsquos project load has been paid off In the second type of shared savings the utility is typically the developer and installs an energy efficiency or distributed generashytion device at the customer site The customer then pays an amount comparable to what the bill would have been without the device or measures installed less a portion of the savings of the device based on utility avoided costs This approach decouples the customer benefits from the utility rate but it can be complicated to detershymine what the consumption would have been without the device or energy efficiency
PacifiCorp in Oregon tackled this problem by offering a cash payment of 35 percent of the cost savings for residenshytial weatherization measures where the cost savings was based on the measurersquos expected annual kWh savings and a schedule of lifecycle savings per kWh (PacifiCorp 2002)
5 Horowitz and Woo (2006) show that demand charges can be used to differentiate service reliability thus implementing curtailable and interruptible service programs that are useful for meeting system resource adequacy
6 Note that benefit sharing is not the same as ldquoshared savingsrdquo used in the context of utility incentives for promoting energy efficiency programs
5-8 National Action Plan for Energy Efficiency
Table 5-2 Pros and Cons of Rate Design Forms
Program Type Criteria
Avoided Cost Benefits Energy and Peak Customer Incentive and Impact on Non- Implementation and and Utility Incentives Reductions Bill Impact Participants Transition Issues
Increasing Tier Block (Inverted block)
httpwwwpgecom tariffspdfE-1pdf
httpwwwsdgecom tm2pdfDRpdf
httpwwwsdgecom tm2pdfGRpdf
Pro Good match when long-run marginal costs are above average costs
Con Might not be the right price signal if long-run marginal costs are below average costs
Pro Can achieve annual energy reductions
Con Does not encourage reductions in any particshyular period (unless comshybined with a time-based rate like TOU)
Pro Provides strong incentive to reduce usage
Con Could result in large bill increases for users that cannot change their usage level and could encourage more usage by the smaller customers
Pro If mandatory little impact on other customer classes
Con Could not be implemented on a voluntary basis because of free rider losses
Pro Simple to bill with existing meters
Con Could require phased transition to mitigate bill impacts
Time of Use (TOU)
httpwwwnationalgridus commasselectric homerates4_touasp
Pro (1) Low implemenshytation cost (2) Tracks expected marginal costs
Con Unclear if marginal costs should be short-or long-run
Pro Can achieve peak load relief
Con Might not achieve substantial energy reductions or produce significant emissions benefits
Pro Provides customers with more control over their bills than flat rates and incentive to reduce peak usage
Con If mandatory could result in large bill increases for users that cannot change their usage pattern
Pro If mandatory little average impact but can be large on some customers
Con If optional potentially large impact due to free riders which can be mitigated by a careful design
Pro Extensive industry experience with TOU rate
Con (1) If mandatory likely opposed by customers but not necessarily the utility (2) If optional opposed by non-participants and possibly the utility
Dynamic Rates Real Time Pricing (RTP)
httpwwwexeloncorpco mcomedlibrarypdfs advance_copy_tariff_ revision6pdf
httpwwwsouthern companycom gulfpowerpricinggulf_ ratesaspmnuOpco=gulf ampmnuType=comampmnuIte m=errates
httpwwwnationalgridus comniagaramohawk non_htmlrates_psc207 pdf
Pro (1) Tracks day-ahead or day-of short-run marginal cost for economically efficient daily consumption decisions (2) RTP rates can be set to help allocate capacity in an economically efficient manner during emergencies
Con No long-run price signal for investment decisions
Pro Can achieve peak load relief
Con (1) Not applicable to gas (2) Might not achieve substantial annual energy reductions or produce significant emissions benefits
Same as above Same as above Con (1) If mandatory likely opposed by customers and the utility due to complexity and implementation cost (2) High implementation cost for metering and information system costs
Dynamic Rates Critical Peak Pricing (CPP)
httpwwwsoutherncomshypanycomgulfpower pricingpdfrsvppdf
httpwwwidahopower comaboutus regulatoryinfotariffPdf aspid=263amppdf
httpwwwpgecom tariffspdfE-3pdf
Pro (1) Tracks short-run marginal cost shortly before emergency (2) If the CPP rates are set at correctly predicted marginal cost during emergency they ration capacity efficiently
Con High implementashytion cost
Pro Likely to achieve load relief
Con Unlikely to provide significant annual energy reductions
Same as above Pro Little impact unless the utility heavily discounts the rate for the non-critical hours
Con (1) If mandatory likely opposed by customers and the utility due to high implementation cost (2) If optional few would object unless the implementation cost spills over to other customer classes
To create a sustainable aggressive national commitment to energy efficiency 5-9
Table 5-2 Pros and Cons of Rate Design Forms (continued)
Program Type Criteria
Avoided Cost Benefits Energy and Peak Customer Incentive and Impact on Implementation and and Utility Incentives Reductions Bill Impact Non-Participants Transition Issues
Dynamic Rates Nonfirm
httpwwwpacificorpcom Regulatory_Rule_Schedul eRegulatory_Rule_Sched ule2220pdf
Pro (1) Provides emergency load relief to support system reliability (2) Implements efficient rationing
Con (1) Does not track costs (2) Potentially high implementation cost
Pro (1) Can achieve load reductions to meet system needs (2) Applicable to both gas and electric service
Con Unlikely to encourage investment in energy efficiency measures
Pro Bill savings comshypensate customer for accepting lower reliability
Pro Little impact unless the utility offers a curtailable rate discount that exceeds the utilitys expected cost savings
Pro (1) If optional nonshyparticipants would not object unless discount is ldquoexcessiverdquo (2) If manshydatory different levels of reliability (at increasing cost) would need to be offered
Con Complicated notice and monitoring requirements
Two-Part Rates
httpwwwaepcustomer comtariffsMichiganpdf MISTD4-28-05pdf
Pro Allows rate to be set at utility avoided cost
Con Requires estabshylishing customer baseshyline which is subject to historical usage weather and other factors
Pro Can be used to encourage or discourage peak usage depending on characteristics of ldquopart twordquo rate form
Pro Provides incentives for changes in customerrsquos usage Therefore no change in usage results in the same bill
Pro Non-participants are held harmless
Pro Complexity can be controlled through design of ldquopart twordquo rate form
Con (1) Customers might not be accustomed to the concept (2) Difficult to implement for many smaller customers
Demand Charges
httpwwwscecomNR sc3tm2pdfce30-12pdf
Pro Reflects the cusshytomerrsquos usage of the utility infrastructure
Con Does not conshysider the duration of the usage (beyond 15 minutes or one hour for electric)
Pro Can achieve load reductions
Con Might not achieve substantial annual reductions
Pro Provides customers with incentive to reduce peak usage and flatten their usage profile
Con If mandatory could result in large bill increases for users who cannot change their usage pattern
Pro If mandatory little average impact but can be large on some cusshytomers
Con If optional potenshytially large impact due to free riders but this can be mitigated by a careful design
Con (1) If mandatory likely opposed by customers and the utility due to high implementashytion cost (2) If optional few would object unless the implementation cost spills over to other customer classes
Discount for Efficiency Benefit Sharing etc
httpwwwcpuccagov PUBLISHEDNEWS_ RELEASE51362htm
httpwwwpacificorp comRegulatory_Rule_ ScheduleRegulatory_Rule _Schedule7794pdf
Pro Incentive can be tied directly to avoided costs without the need to change overall rate design
Con Only a portion of the benefits are reflected in the incenshytive as rate savings will still be a factor for most options
Pro Utilities generally have control over what measures are eligible for an incentive so the mix of peak and energy savshyings can be determined during program design
Con Impacts might be smaller than those attainable through mandatory rate programs
Pro (1) Provides direct incentive for program participation plus ongoing bill reductions (for most options) (2) Does not require rate changes
Con Existing rate forms might impede adoption because of overly low bill savings
Pro Reflects the characteristics of the underlying rate form
Pro Implementation simplified by the ability to keep status quo rates
Con Places burden for action on the energy efficiency implementer whereas a mandatory rate change could encourage customers to seek out efficiency options
Energy Efficiency Customer Rebate Programs (eg 2020 program in California)
wwwscecomRebatesand Savings2020
wwwsdgecomtm2pdf 20-20-TOUpdf
wwwpgecomtariffspdf EZ-2020pdf
Pro Can avoid more drastic rationing mechanisms when resources are signifishycantly constrained
Con Customer discounts are not set based on utility cost savings and therefore these programs might over-reward cutomers who qualify
Pro (1) Links payment of incentive directly to metered energy savings (2) Easy to measure and verify
Con Focused on throughput and not capacity savings
Pro (1) Provides a clear incentive to customers to reduce their energy usage motivates customers and gets them thinking about their energy usage (2) Can provide significant bill savings (3) Doesnrsquot require customers to sign up for any program and can be offered to everyone
Con Shifts costs to nonshyparticipants to the extent that the rebate exceeds the change in utility cost
Pro Very successful during periods when public interest is served for short-term resource savings (eg energy crisis)
Con Implementation and effectiveness might be reduced after being in place for several years
5-10 National Action Plan for Energy Efficiency
On-Bill Financing
The primary function of on-bill financing is to remove the barrier presented by the high first-time costs of many enershygy efficiency measures On-bill financing allows the cusshytomer to pay for energy efficiency equipment over time and fund those payments through bill savings On-bill financing can also deliver financial benefits to the particishypants by providing them access to low financing costs offered by the utility An example of on-bill financing is the ldquoPay As You Saverdquo (PAYS) program which provides upfront funding in return for a monthly charge that is always less than the savings7
Pros and Cons of Various Designs Rate design involves tradeoffs among numerous goals Table 5-2 summarizes the pros and cons of the various rate design forms from various stakeholder perspectives considering implementation and transition issues In most cases design elements can be combined to mitigate
weaknesses of any single design element so the table should be viewed as a reference and starting point
Successful Strategies
Rate design is one of a number of factors that contribute to the success of energy efficiency programs Along with rate design it is important to educate customers about their rates so they understand the value of energy effishyciency investment decisions Table 5-3 shows examples of four states with successful energy efficiency programs and complementary rate design approaches Certainly one would expect higher rates to spur energy efficiency adoption and that appears to be the case for three of the four example states However Washington has an active and cost-effective energy efficiency program despite an average residential rate far below the national average of 103 cents per kWh (EIA 2006)
Table 5-3 Conditions That Assist Success
California Washington State Massachusetts New York
Rate Forms and Cost Structures
Increasing tier block rates for residenshytial (PGampE SCE and SDGampE) Increasing block rate for residential gas (SDGampE)
httpwwwpgecomtariffspdfE-1pdf
httpwwwscecomNRsc3tm2pdf ce12-12pdf
httpwwwsdgecomtm2pdfDRpdf
httpwwwsdgecomtm2pdfGRpdf
Increasing tier block rates for resishydential electric (PacifiCorp) Gas rates are flat volumetric (Puget Sound Electric [PSE]) High export value for electricity especially in the summer afternoon
httpwwwpacificorpcomRegulat ory_Rule_ScheduleRegulatory_ Rule_Schedule2205pdf
Flat electricity rates per kWh with voluntary TOU rates for distribution service (Massachusetts Electric)
httpwwwnationalgridus commasselectricnon_html rates_tariffpdf
Increasing tier rates for residential (Consolidated Edison)
httpwwwconedcom documentselec 201-210pdf
Resource and Load Characteristics
Summer electric peaks Marginal resources are fossil units High marshyginal cost for electricity especially in the summer afternoon Import transfer capability can be constrained Winter gas peaks although electric generashytion is flattening the difference
httpwwwethreecomCPUC E3_Avoided_Costs_Finalpdf
Winter peaking electric loads but summer export opportunities Heavily hydroelectric so resource availability can vary with precipitashytion Gas is winter peaking
httpwwwnwcouncilorgenergy powersupplyoutlookasp
httpwwwnwcouncilorgenergy powerplanplanDefaulthtm
httpwwwpsecomenergyEnviron mentsupplyPDFsII--Summary20 Charts20and20Graphspdf
Part of Indpendant System Operator New England (ISO-NE) which is summer peaking
httpwwwnepoolcom transceltreport20052005 _celt_reportpdf
High summer energy costs and capacity concerns in the summer for the New York City area
httpwwweiadoegov cneafelectricitypage fact_sheetsnewyorkhtml
7 See httpwwwpaysamericaorg
To create a sustainable aggressive national commitment to energy efficiency 5-11
Table 5-3 Conditions That Assist Success (continued)
California Washington State Massachusetts New York
Average Residential Electric Rates
137 centskWh
(EIA 2006)
67 centskWh
(EIA 2006)
176 centskWh
(EIA 2006)
157 centskWh
(EIA 2006)
Market and Utility Structure
Competitive electric generation and gas procurement Regulated wires and pipes
httpwwwenergycagovelectricity divestiturehtml
httpwwwcpuccagovstatic energyelectricab57_briefing_ assembly_may_10pdf
Vertically integrated
httpwwwwutcwagov webimagensf63517e4423a08d e988256576006a80bcfe15f75d 7135a7e28825657e00710928 OpenDocument
Competitive generation Regulated wires
httpwwweiadoegov cneafelectricitypage fact_sheetsmasshtml
Competitive generation Regulated wires
httpwwwnyserdaorgsep sepsection2-1pdf
Political and Administrative Actors
Environmental advocacy in the past and desire to avoid another energy capacity crisis Energy efficiency focuses on electricity
httpwwwenergycagov 2005publicationsCEC-999-2005shy015CEC-999-2005-015PDF
httpwwwenergycagov 2005publicationsCEC-999-2005shy011CEC-999-2005-011PDF
httpwwwcpuccagovPUBLISHED NEWS_RELEASE49757htm
httpwwwcpuccagovstatic energyelectricenergy+efficiency abouthtm
Strong environmental commitshyment and desire to reduce susceptibility to market risks
httpwwwnwenergyorgnews newsnews_conservationhtml
DSM instituted as an alternative to new plant construction in the late 1980s and early 1990s (integrated resource manshyagement) Energy efficiency now under the oversight of Division of Energy Resources
httpwwwmassgovEoca docsdoerpub_info ee-longpdf
PSC established policy goals to promote competitive energy efficiency service and provide direct benefits to the people of New York
On 11606 Governor George E Pataki unveiled ldquoa compreshyhensive multi-faceted plan that will help reduce New Yorkrsquos dependence on imported energyrdquo
httpwwwgetenergysmart orgAboutNYESasp
httpwwwnygovgovernorp ress060116062html
Demand-Side Management (DSM) Funding
System benefits charge (SBC) and procurement payment
httpwwwcpuccagovstatic energyelectricenergy+efficiency ee_fundinghtm
SBC
httpwwwwutcwagov webimagensf8d712cfdd4796c8 888256aaa007e94b40b2e3934 3c0be04a88256a3b007449fe OpenDocument
SBC
httpwwwmassgovEoca docsdoerpub_info ee-longpdf
SBC
httpwwwgetenergysmart orgAboutNYESasp
Part of Washingtonrsquos energy efficiency efforts can be explained by the high value for power exports to California and partly by the regional focus on promoting energy efficiency Washington and the rest of the Pacific Northwest region place a high social value on environshymental protection so Washington might be a case where the success of energy efficiency is fostered by high public awareness and the willingness of the public to look beyond the short-term out-of-pocket costs and consider the longer term impacts on the environment
The other three states shown in Table 5-3 share the comshymon characteristics of high residential rates energy effishyciency funded through a system benefits surcharge and competitive electric markets The formation of competishytive electric markets could have also encouraged energy efficiency by (1) establishing secure funding sources or energy efficiency agencies to promote energy efficiency (2) increasing awareness of energy issues and risks regarding future energy prices and (3) the entrance of new energy agents promoting energy efficiency
5-12 National Action Plan for Energy Efficiency
Key Findings mdash Large Commercial and Industrial Two-part rates These rates provide bill stability and can be established
This chapter summarizes the challenges and opportuni- so that the change in consumption through adoption ties for employing rate designs to encourage utility of energy efficiency is priced at marginal cost The promotion and customer adoption of energy efficiency complexity in establishing historical baseline quantities Key findings of this chapter include might limit the application of two-part rates to the
larger customers on the system bull Rate design is a complex process that balances
numerous regulatory and legislative goals It is impor- mdash All Customer Classes Seasonal price differentials tant to recognize the promotion of energy efficiency in Higher prices during the higher cost peak season the balancing of objectives encourage customer conservation during the peak
and can reduce peak load growth For example bull Rate design offers opportunities to encourage cus- higher winter rates can encourage the purchase of
tomers to invest in efficiency where they find it to be more efficient space heating equipment cost-effective and to participate in new programs that provide innovative technologies (eg smart meters) to bull Energy efficiency can be promoted through non-tariff help customers control their energy costs mechanisms that reach customers through their utility
bill Such mechanisms include bull Utility rates that are designed to promote sales or maxshy
imize stable revenues tend to lower the incentive for mdash Benefit Sharing Programs Benefit sharing programs customers to adopt energy efficiency can resolve situations where normal customer bill
savings are smaller than the cost of energy efficiency bull Rate forms like declining block rates or rates with large programs
fixed charges reduce the savings that customers can attain from adopting energy efficiency mdash On-Bill Financing Financing support can help cusshy
tomers overcome the upfront costs of efficiency bull Appropriate rate designs should consider the unique devices
characteristics of each customer class Some general rate design options by customer class are listed below mdash Energy Efficiency Rebate Programs Programs that
offer discounts to customers who reduce their mdash Residential Inclining tier block rates These rates energy consumption such as the 2020 rebate pro-
can be quickly implemented for all residential and gram in California offer clear incentives to cusshysmall commercial and industrial electric and gas tomers to focus on reducing their energy use customers At a minimum eliminate declining tier block rates As metering costs decline also explore bull More effort is needed to communicate the benefits dynamic rate options for residential customers and opportunities for energy efficiency to customers
regulators and utility decision-makers mdash Small Commercial Time of use rates While these
rates might not lead to much change in annual usage the price signals can encourage customers to consume less energy when energy is the most expensive to produce procure and deliver
To create a sustainable aggressive national commitment to energy efficiency 5-13
Recommendations and Options
The National Action Plan for Energy Efficiency Leadership Group offers the following recommendations as ways to overcome many of the barriers to energy efficiency in rate design and provides a number of options for conshysideration by utilities regulators and stakeholders (as presented in the Executive Summary)
Recommendation Modify ratemaking practices to
promote energy efficiency investments Rate design offers opportunities to encourage customers to invest in efficiency where they find it to be cost-effective and to participate in new programs that bring them innovative technologies (eg smart meters) to help them control their energy costs
Options to Consider
bull Including the impact on adoption of energy efficiency as one of the goals of retail rate design recognizing that it must be balanced with other objectives
bull Eliminating rate designs that discourage energy effishyciency by not increasing costs as customers consume more electricity or natural gas
bull Adopting rate designs that encourage energy efficiency considering the unique characteristics of each cusshytomer class and including partnering tariffs with other mechanisms that encourage energy efficiency such as benefit sharing programs and on-bill financing
Recommendation Broadly communicate the benefits
of and opportunities for energy efficiency Experience shows that energy efficiency programs help customers save money and contribute to lower cost energy sysshytems But these impacts are not fully documented nor recognized by customers utilities regulators and policy-makers More effort is needed to establish the business case for energy efficiency for all decision-makers and to show how a well-designed approach to energy efficienshycy can benefit customers utilities and society by (1) reducing customers bills over time (2) fostering finanshycially healthy utilities (return on equity [ROE] earnings per share debt coverage ratios unaffected) and (3) conshytributing to positive societal net benefits overall Effort is also necessary to educate key stakeholders that although energy efficiency can be an important low-cost resource to integrate into the energy mix it does require funding just as a new power plant requires funding Further education is necessary on the impact that energy efficiency programs can have in concert with other energy efficiency policies such as building codes appliance standards and tax incentives
Option to Consider
bull Communicating on the role of energy efficiency in lowering customer energy bills and system costs and risks over time
5-14 National Action Plan for Energy Efficiency
References
Baskette C Horii B Kollman E amp Price S (2006) Avoided Cost Estimation and Post-Reform Funding Allocation for Californias Energy Efficiency Programs Energy 316-7 1084-1099
Bonbright JC (1961) Principles of Public Utility Rates New York Columbia University Press
Brown SJ and Sibley DS (1986) The Theory of Public Utility Pricing New York Cambridge University Press
Horowitz I and Woo CK (2006) Designing Pareto-Superior Demand-Response Rate Options Energy 316-7 1040-1051
Huntington S (1975) The Rapid Emergence of Marginal Cost Pricing in the Regulation of Electric Utility Rate Structures Boston University Law Review 55 689-774
Hyman LS Hyman AS amp Hyman RC (2000) Americas Electric Utilities Past Present and Future 7th Edition Arlington VA Public Utilities Reports
Joskow PL (1976) Contributions to the Theory of Marginal Cost Pricing Bell Journal of Economics 7(1) 197-206
Joskow P (1979) Public Utility Regulatory Policy Act of 1978 Electric Utility Rate Reform Natural Resources Journal 19 787-809
Kahn A (1970) The Economics of Regulation New York John Wiley amp Sons
PacifiCorp (2002 September 30) Oregon Schedule 9mdash Residential Energy Efficiency Rider Optional Weatherization Services PUC OR No 35 Advice No 02-027 lthttpwwwpacificorpcomRegulatory_ Rule_ScheduleRegulatory_Rule_Schedule7794pdfgt
Phillips CF (1988) The Regulation of Public Utilities Theory and Practice Arlington VA Public Utilities Reports
Public Utility Regulatory Policies Act (PURPA) of 1978 Section 114
US Energy Information Administration [EIA] (2006) Average Retail Price of Electricity to Ultimate Customers by End-Use Sector by State Electric Power Monthly
To create a sustainable aggressive national commitment to energy efficiency 5-15
6Energy Efficiency Program Best Practices
Energy efficiency programs have been operating successfully in some parts of the country since the late 1980s From the experience of these successful programs a number of best practice strategies have evolved for making energy efficiency a resource developing a cost-effective portfolio of energy efficiency proshygrams for all customer classes designing and delivering energy efficiency programs that optimize budgets and ensuring that programs deliver results
Overview
Cost-effective energy efficiency programs have been delivered by large and small utilities and third-party proshygram administrators in some parts of the country since the late 1980s The rationale for utility investment in effishyciency programming is that within certain existing marshykets for energy-efficient products and services there are barriers that can be overcome to ensure that customers from all sectors of the economy choose more energy-efficient products and practices Successful programs have developed strategies to overcome these barriers in many cases partnering with industry and voluntary national and regional programs so that efficiency proshygram spending is used not only to acquire demand-side resources but also to accelerate market-based purchases by consumers
Leadership Group Recommendations
Applicable to Energy Efficiency
Program Best Practices
bull Recognize energy efficiency as a high priority energy resource
bull Make a strong long-term commitment to cost-effective energy efficiency as a resource
bull Broadly communicate the benefits of and opporshytunities for energy efficiency
bull Provide sufficient and stable program funding to deliver energy efficiency where cost-effective
A list of options for promoting best practice energy efficiency programs is provided at the end of this chapter
Challenges that limit greater utility investment in energy efficiency include the following
bull The majority of utilities recover fixed operating costs and earn profits based on the volume of energy they sell Strategies for overcoming this throughput disinshycentive to greater investment in energy efficiency are discussed in Chapter 2 Utility Ratemaking amp Revenue Requirements
bull Lack of standard approaches on how to quantify and incorporate the benefits of energy efficiency into resource planning efforts and institutional barriers at many utilities that stem from the historical business model of acquiring generation assets and building transmission and distribution systems Strategies for overcoming these challenges are addressed in Chapter 3 Incorporating Energy Efficiency in Resource Planning
bull Rate designs that are counterproductive to energy efficiency might limit greater efficiency investment by large customer groups where many of the most cost-effective opportunities for efficiency programshyming exist Strategies for encouraging rate designs that are compatible with energy efficiency are disshycussed in Chapter 5 Rate Design
bull Efficiency programs need to address multiple cusshytomer needs and stakeholder perspectives while simultaneously addressing multiple system needs in many cases while competing for internal resources This chapter focuses on strategies for making energy efficiency a resource developing a cost-effective portshyfolio of energy efficiency programs for all customer classes designing and delivering efficiency programs that optimize budgets and ensuring that those proshygrams deliver results are the focus of this chapter
To create a sustainable aggressive national commitment to energy efficiency 6-1
Programs that have been operating over the past decade and longer have a history of proven savings in megawatts (MW) megawatt-hours (MWh) and therms as well as on customer bills These programs show that energy efficiency can compare very favorably to supply-side options
This chapter summarizes key findings from a portfolioshylevel1 review of many of the energy efficiency programs that have been operating successfully for a number of years It provides an overview of best practices in the following areas
bull Political and human factors that have led to increased reliance on energy efficiency as a resource
bull Key considerations used in identifying target measures2 for energy efficiency programming in the near- and long-term
bull Program design and delivery strategies that can maxishymize program impacts and increase cost-effectiveness
bull The role of monitoring and evaluation in ensuring that program dollars are optimized and that energy efficiency investments deliver results
Background
Best practice strategies for program planning design and implementation and evaluation were derived from a review of energy efficiency programs at the portfolio level across a range of policy models (eg public benefit charge administration integrated resource planning) The box on page 6-3 describes the policy models and Table 6-1 provides additional details and examples of programs operating under various policy models This chapter is not intended as a comprehensive review of the energy efficiency programs operating around the country but does highlight key factors that can help improve and
accelerate energy efficiency program success Organizations reviewed for this effort have a sustained history of successful energy efficiency program impleshymentation (See Tables 6-2 and 6-3 for summaries of these programs) and share the following characteristics
bull Significant investment in energy efficiency as a resource within their policy context
bull Development of cost-effective programs that deliver results
bull Incorporation of program design strategies that work to remove near- and long-term market barriers to investshyment in energy efficiency
bull Willingness to devote the necessary resources to make programs successful
Most of the organizations reviewed also have conducted full-scale impact evaluations of their portfolio of energy efficiency investments within the last few years
The best practices gleaned from a review of these organshyizations can assist utilities their commissions state energy offices and other stakeholders in overcoming barriers to significant energy efficiency programming and begin tapping into energy efficiency as a valuable and clean resource to effectively meet future supply needs
1 For the purpose of this chapter portfolio refers to the collective set of energy efficiency programs offered by a utility or third-party energy efficiency program administrator
2 Measures refer to the specific technologies (eg efficient lighting fixture) and practices (eg duct sealing) that are used to achieve energy savings
6-2 National Action Plan for Energy Efficiency
Energy Efficiency Programs Are Delivered Within Many Policy Models
Systems Benefits Charge (SBC) Model
In this model funding for programs comes from an SBC that is either determined by legislation or a regulatory process The charge is usually a fixed amount per kilowatt-hour (kWh) or million British thermal units (MMBtu) and is set for a number of years Once funds are collected by the distribution or integrated utility programs can be administered by the utility a state agency or a third party If the utility implements the programs it usually receives current cost recovery and a shareholder incentive Regardless of administrative structure there is usually an opportunity for stakeshyholder input
This model provides stable program design In some cases funding has become vulnerable to raids by state agencies In areas aggressively pursuing energy efficiency as a resource limits to additional funding have created a ceiling on the resource While predomshyinantly used in the electric sector this model can and is being used to fund gas programs
Integrated Resource Plan (IRP) Model
In this model energy efficiency is part of the utilityrsquos IRP Energy efficiency along with other demand-side options is treated on an equivalent basis with supply Cost recovery can either be in base rates or through a separate charge The utility might receive a shareholdshyer incentive recovery of lost revenue (from reduced sales volume) or both Programs are driven more by the resource need than in the SBC models This genshyerally is an electric-only model The regional planning model used by the Pacific Northwest is a variation on this model
Request For Proposal (RFP) Model
In this case a utility or an independent system operashytor (ISO) puts out a competitive solicitation RFP to acquire energy efficiency from a third-party provider to meet demand particularly in areas where there are transmission and distribution bottlenecks or a genershyation need Most examples of this model to date have been electric only The focus of this type of program is typically on saving peak demand
Portfolio Standard
In this model the program adminstrator is subject to a portfolio standard expressed in terms of percentage of overall energy or demand This model can include gas as well as electric and can be used independentshyly or in conjunction with an SBC or IRP requirement
Municipal UtilityElectric Cooperative Model
In this model programs are administered by a municshyipal utility or electric cooperative If the utilitycoopershyative owns or is responsible for generation the energy efficiency resource can be part of an IRP Cost recovery is most likely in base rates This model can include gas as well as electric
To create a sustainable aggressive national commitment to energy efficiency 6-3
Table 6-1 Overview of Energy Efficiency Programs
Policy Model Examples
Funding Type
Shareholder Incentive1
Lead Administrator
Role in Resource
Acquisition
Scope of Programs
Political Context
SBC with utility implementation
California
Rhode Island
Connecticut
Massachusetts
Separate charge Usually Utility Depends on whether utility owns generation
Programs for all customer classes
Most programs of this type came out of a restructuring settlement in states where there was an existing infrastrucshyture at the utilities
SBC with state or third-party implementation
New York
Vermont
Wisconsin
Separate charge No State agency Third party
None or limited Programs for all customer classes
Most programs of this type came out of a restructuring settlement
IRP or gas planning model
Nevada
Arizona
Minnesota
Bonneville Power Administration (BPA) (regional planning model as well)
Vermont Gas
Keyspan
Varies in rates capitalized or separate charge
In some cases Utility Integrated Program type dictated by resource need
Part of IRP requirement may be combined with other models
RFP model for full-scale programs and congestion relief
Varies No Utility buys from third party
Integrated ndash can be TampD only
Program type dictated by resource need
Connecticut and Con Edison going out to bid to reduce congestion
Portfolio standard model (can be combined with SBC or IRP)
Nevada
California
Connecticut
Texas
Varies Varies Utility may implement programs or buy to meet standard
Standard portfolio Programs for all customer classes
Generally used in states with existing programs to increase program activity
Municipal utility amp electric cooperative
Sacramento Municipal Utility District (CA)
City of Austin (TX)
Great River Energy (MN)
In rates No Utility Depends on whether utility owns generation
Programs for all customer classes
Based on customer and resource needs can be similar to IRP model
1 A shareholder incentive is a financial incentive to a utility (above those that would normally be recovered in a rate case) for achieving set goals for energy efficiency program performance
6-4 National Action Plan for Energy Efficiency
Key Findings
Overviews of the energy efficiency programs reviewed for this chapter are provided in Table 6-2 and 6-3 Key findings drawn from these programs include
bull Energy efficiency resources are being acquired on avershyage at about one-half the cost of the typical new power sources and about one-third of the cost of natshyural gas supply in many casesmdashand contribute to an overall lower cost energy system for rate-payers (EIA 2006)
bull Many energy efficiency programs are being delivered at a total program cost of about $002 to $003 per lifeshytime kilowatt-hour (kWh) saved and $030 to $200 per lifetime million British thermal units (MMBtu) saved These costs are less than the avoided costs seen in most regions of the country Funding for the majority of programs reviewed ranges from about 1 to 3 pershycent of electric utility revenue and 05 to 1 percent of gas utility revenue
bull Even low energy cost states such as those in the Pacific Northwest have reason to invest in energy efficiency as energy efficiency provides a low-cost reliable resource that reduces customer utility bills Energy effishyciency also costs less than constructing new generashytion and provides a hedge against market fuel and environmental risks (Northwest Power and Conservation Council 2005)
bull Well-designed programs provide opportunities for cusshytomers of all types to adopt energy savings measures and reduce their energy bills These programs can help customers make sound energy use decisions increase control over their energy bills and empower them to manage their energy usage Customers can experience significant savings depending on their own habits and the program offered
bull Consistently funded well-designed efficiency programs are cutting electricity and natural gas loadmdashproviding annual savings for a given program year of 015 to 1
percent of energy sales These savings typically will accrue at this level for 10 to 15 years These programs are helping to offset 20 to 50 percent of expected energy growth in some regions without compromising end-user activity or economic well being
bull Research and development enables a continuing source of new technologies and methods for improving energy efficiency and helping customers control their energy bills
bull Many state and regional studies have found that purshysuing economically attractive but as yet untapped energy efficiency could yield more than 20 percent savshyings in total electricity demand nationwide by 2025 These savings could help cut load growth by half or more compared to current forecasts Savings in direct use of natural gas could similarly provide a 50 percent or greater reduction in natural gas demand growth Potential varies by customer segment but there are cost-effective opportunities for all customer classes
bull Energy efficiency programs are being operated successshyfully across many different contexts regulated and unregulated markets utility state or third-party administration investor-owned public and cooperashytives and gas and electric utilities
bull Energy efficiency resources are being acquired through a variety of mechanisms including system benefits charges (SBCs) energy efficiency portfolio standards (EEPSs) and resource planning (or cost of service) efforts
bull Cost-effective energy efficiency programs for electricity and natural gas can be specifically targeted to reduce peak load
bull Effective models are available for delivering gas and electric energy efficiency programs to all customer classes Models may vary based on whether a utility is in the inishytial stages of energy efficiency programming or has been implementing programs for a number of years
To create a sustainable aggressive national commitment to energy efficiency 6-5
Table 6-2 Efficiency Measures of Natural Gas Savings Programs
Program Administrator Keyspan
(MA)
Vermont Gas
(VT)
SoCal Gas
(CA)
Policy Model Gas Gas Gas
Period 2004 2004 2004
Program Funding
Average Annual Budget ($MM) 12 11 21
of Gas Revenue 100 160 053
Benefits
Annual MMBtu Saved 1 (000s MMBtu) 500 60 1200
Lifetime MMBtu Saved 2 (000s MMBtu) 6000 700 15200
Cost-Effectiveness
Cost of Energy Efficiency ($lifetime MMBtu) 2 2 1
Retail Gas Prices ($thousand cubic feet [Mcf]) 11 9 8
Cost of Energy Efficiency ( Avoided Energy Cost) 19 18 18
Total Avoided Cost (2005 $MMBtu) 3 12 11 7
1 SWEEP 2006 Southern California Gas Company 2004 2 Lifetime MMBtu calculated as 12 times annual MMBtu saved where not reported (not reported for Keyspan or Vermont Gas) 3 VT and MA avoided cost (therms) represents all residential (not wholesale) cost considerations (ICF Consulting 2005)
bull Energy efficiency programs projects and policies benshyefit from established and stable regulations clear goals and comprehensive evaluation
bull Energy efficiency programs benefit from committed program administrators and oversight authorities as well as strong stakeholder support
bull Most large-scale programs have improved productivity enabling job growth in the commercial and industrial sectors
bull Large-scale energy efficiency programs can reduce wholesale market prices
Lessons learned from the energy efficiency programs operated since inception of utility programs in the late 1980s are presented as follows and cover key aspects of energy efficiency program planning design implemenshytation and evaluation
Summary of Best Practices
In this chapter best practice strategies are organized and explained under four major groupings
bull Making Energy Efficiency a Resource
bull Developing an Energy Efficiency Plan
bull Designing and Delivering Energy Efficiency Programs
bull Ensuring Energy Efficiency Investments Deliver Results
For the most part the best practices are independent of the policy model in which the programs operate Where policy context is important it is discussed in relevant secshytions of this chapter
6-6 National Action Plan for Energy Efficiency
Making Energy Efficiency a Resource
Energy efficiency is a resource that can be acquired to help utilities meet current and future energy demand To realize this potential requires leadership at multiple levels organizational alignment and an understanding of the nature and extent of the energy efficiency resource
bull Leadership at multiple levels is needed to establish the business case for energy efficiency educate key stakeshyholders and enact policy changes that increase investshyment in energy efficiency as a resource Sustained leadership is needed from
mdash Key individuals in upper management at the utility who understand that energy efficiency is a resource alternative that can help manage risk minimize long-term costs and satisfy customers
mdash State agencies regulatory commissions local governshyments and associated legislative bodies andor consumer advocates that expect to see energy efficiency considered as part of comprehensive utility management
mdash Businesses that value energy efficiency as a way to improve operations manage energy costs and conshytribute to long-term energy price stability and availabilishyty as well as trade associations and businesses such as Energy Service Companies (ESCOs) that help members and customers achieve improved energy performance
mdash Public interest groups that understand that in order to achieve energy efficiency and environmental objectives they must help educate key stakeholders and find workable solutions to some of the financial challenges that limit acceptance and investment in energy efficiency by utilities3
bull Organizational alignment With policies in place to supshyport energy efficiency programming organizations need to institutionalize policies to ensure that energy efficiency goals are realized Factors contributing to success include
mdash Strong support from upper management and one or more internal champions
mdash A framework appropriate to the organization that supports large-scale implementation of energy effishyciency programs
mdash Clear well-communicated program goals that are tied to organizational goals and possibly compensation
mdash Adequate staff resources to get the job done
mdash A commitment to continually improve business processes
bull Understanding of the efficiency resource is necessary to create a credible business case for energy efficiency Best practices include the following
mdash Conduct a ldquopotential studyrdquo prior to starting programs to inform and shape program and portfolio design
mdash Outline what can be accomplished at what costs
mdash Review measures for all customer classes including those appropriate for hard-to-reach customers such as low income and very small business customers
Developing an Energy Efficiency Plan
An energy efficiency plan should reflect a long-term pershyspective that accounts for customer needs program cost-effectiveness the interaction of programs with other policies that increase energy efficiency the opporshytunities for new technology and the importance of addressing multiple system needs including peak load reduction and congestion relief Best practices include the following
bull Offer programs for all key customer classes
bull Align goals with funding
3 Public interest groups include environmental organizations such as the National Resources Defense Council (NRDC) Alliance to Save Energy (ASE) and American Council for an Energy Efficient Economy (ACEEE) and regional market transformation entities such as the Northeast Energy Efficiency Partnerships (NEEP) Southwest Energy Efficiency Project (SWEEP) and Midwest Energy Efficiency Alliance (MEEA)
To create a sustainable aggressive national commitment to energy efficiency 6-7
Table 6-3 Efficiency Measures of Electric and Combination Programs
NYSERDA (NY)
Efficiency Vermont
(VT)
MA Utilities (MA)
WI Department of
Administration12
CA Utilities (CA)
Policy Model SBC wState Admin SBC w3rd Party Admin SBC wUtility Admin SBC wState Admin SBC wUtility Admin amp Portfolio Standard
Period 2005 2004 2002 2005 2004
Program Funding
Spending on Electric Energy Efficiency ($MM) 1 138 14 123 63 317
Budget as of Electric Revenue 2 13 33 30 14 15
Avg Annual Budget Gas ($MM) NR 10 NA 3 11 NA NA
of Gas Revenue NR 10 NA NA NA NA
Benefits Annual MWh Saved MWh Sales 34 02 09 04 01 10 Lifetime MWh Saved 5 (000s MWh) 6216 700 3428 1170 22130 Annual MW Reduction 172 15 48 81 377 Lifetime MMBtu Saved 5 (000s MMBtu) 17124 470 850 11130 43410 Annual MMBtu Saved (000s MMBtu) 1427 40 70 930 3620
Non-Energy Benefits $79M bill reduction 37200 CCF of water
$21M bill reduction
2090 new jobs created
Value of non-energy benefits
Residential $6M CI $36M
NR
Avoided Emissions (tonsyr for 1 program year) (could include benefits from load response renewable and DG programs)
NOX 470
SO2 850
CO2 400000
Unspecified pollutants 460000 over
lifetime
NOX 135
SO2 395
CO2 161205
NOX 2167
SO2 4270
CO2 977836
(annual savings from 5program years)
NR
Cost-Effectiveness Cost of Energy Efficiency
$lifetime (kWh) 6 002 002 003 005 001 $lifetime (MMBtu) NA NA 032 NA NA
Retail Electricity Prices ($kWh) 013 011 011 007 013 Retail Gas Prices ($mcf) NA NA NR NA NA Avoided Costs (2005$) 78
Energy ($kWh) 003 007 007 002 to 006 13 006 Capacity ($kW)9 2820 362 664 On-Peak Energy ($kWh) 008 Off-Peak Energy ($kWh) 006
Cost of Energy Efficiency as Avoided Energy Cost 89 29 10 90 23
CI = Commercial and Industrial CO2 = Carbon Dioxide $MM = Million Dollars NA = Not Applicable NR = Not Reported NOX = Nitrogen Oxides SO2 = Sulfur Dioxide 1 NYSERDA 2005 spending derived from subtracting cumulative 2004 spending from cumulative 2005 spending includes demand response and
research and development (RampD) 2 ACEEE 2004 Seattle City Light 2005 3 Annual MWh Saved averaged over program periods for Wisconsin and California Utilities NYSERDA 2005 energy efficiency savings derived from
subtracting cumulative 2004 savings from 2005 cumulative reported savings 4 EIA 2006 Austin Energy 2004 Seattle City Light 2005 Total sales for California Utilities in 2003 and SMUD in 2004 were derived based on
growth in total California retail sales as reported by EIA 5 Lifetime MWh savings based on 12 years effective life of installed equipment where not reported for NYSERDA Wisconsin Nevada SMUD BPA
and Minnesota Lifetime MMBtu savings based on 12 years effective life of installed equipment
6-8 National Action Plan for Energy Efficiency
Table 6-3 Efficiency Measures of Electric and Combination Programs (continued)
Nevada CT Utilities (CT)
SMUD (CA)
Seattle City Light (WA) Austin Energy
Bonneville Power Administration (ID MT OR WA)
MN Electric and Gas Investor-Owned
Utilities (MN)
IRP with Portfolio Standard
SBC wUtility Admin amp Portfolio Standard
Municipal Utility Municipal Utility Municipal Utility Regional Planning IRP and Conservation
Improvement Program
2003 2005 2004 2004 2005 2004 2003
Program Funding
11 65 30 20 25 78 52
05 31 15 34 19 NR NR
NA NA NA NA NA NA $14
NA NA NA NA NA NA 050
Benefits 01 10 05 07 09 05 420 4400 630 1000 930 3080 3940 16 135 14 7 50 472 129
NA NA NA NA 10777 NA 22010 NA NA NA NA 1268 NA 1830
NR lifetime savings of $550M on bills NR
lifetime savings of $430M on bills
created
Potentially over 900 jobs created
Residential $6M CI $36M
NR NR
NR
NOX 334
SO2 123
CO2 198586
NOX 18
CO2 353100 (cummulative
annual savings for 13 years)
NOX 640
SO2 104
CO2 680000 over lifetime
NR NR
Cost-Effectiveness
003 001 003 002 003 003 001 NA NA NA NA 232 NA 006
009 010 010 006 012 Wholesaler - NA 006 NA NA NA NA NA NA 580
007 NR NR Wholesaler - NA NR 3606 2033
008 006
Not calculated 21 63 Not calculated Not calculated Not calculated
6 Calculated for all cases except SMUD SMUD data provided by J Parks Manager Energy Efficiency and Customer RampD Sacramento Municipal Utility District (personal communication May 19 2006)
7 Avoided cost reported as a consumption ($kWh) not a demand (kW) figure 8 Total NSTAR avoided cost for 2006 9 Avoided capacity reported by NYSERDA as the three-year averaged hourly wholesale bid price per MWh 10 NYSERDA does not separately track gas-related project budget revenue or benefits 11 NSTAR Gas only 12 Wisconsin has a portfolio that includes renewable distributed generation some comparisons might not be appropriate 13 Range based on credits given for renewable distributed generation
To create a sustainable aggressive national commitment to energy efficiency 6-9
bull Use cost-effectiveness tests that are consistent with long-term planning
bull Consider building codes and appliance standards when designing programs
bull Plan to incorporate new technologies
bull Consider efficiency investments to alleviate transmisshysion and distribution constraints
bull Create a roadmap of key program components milestones and explicit energy use reduction goals
Designing and Delivering Energy Efficiency Programs
Program administrators can reduce the time to market and implement programs and increase cost-effectiveness by leveraging the wealth of knowledge and experience gained by other program administrators throughout the nation and working with industry to deliver energy effishyciency to market Best practices include the following
bull Begin with the market in mind
mdash Conduct a market assessment
mdash Solicit stakeholder input
mdash Listen to customer and trade ally needs
mdash Use utility channels and brands
mdash Promote both energy and non-energy (eg improved comfort improved air quality) benefits of energy efficient products and practices to customers
mdash Coordinate with other utilities and third-party proshygram administrators
mdash Leverage the national ENERGY STAR program
mdash Keep participation simple
mdash Keep funding (and other program characteristics) as consistent as possible
mdash Invest in education training and outreach
mdash Leverage customer contact to sell additional efficienshycy and conservation
bull Leverage private sector expertise external funding and financing
mdash Leverage manufacturer and retailer resources through cooperative promotions
mdash Leverage state and federal tax credits and other tax incentives (eg accelerated depreciation first-year expensing sales tax holidays) where available
mdash Build on ESCO and other financing program options
mdash Consider outsourcing some programs to private and not-for-profit organizations that specialize in program design and implementation through a competitive bidding process
bull Start with demonstrated program modelsmdashbuild infrastructure for the future
mdash Start with successful program approaches from other utilities and program administrators and adapt them to local conditions to accelerate program design and effective implementation
mdash Determine the right incentives and if incentives are finanshycial make sure that they are set at appropriate levels
mdash Invest in educating and training the service industry (eg home performance contractors heating and coolshying technicians) to deliver increasingly sophisticated energy efficiency services
mdash Evolve to more comprehensive programs
6-10 National Action Plan for Energy Efficiency
mdash Change measures over time to adapt to changing markets and new technologies
mdash Pilot test new program concepts
Ensuring Energy Efficiency Investments Deliver Results
Program evaluation helps optimize program efficiency and ensure that energy efficiency programs deliver intended results Best practices include the following
bull Budget plan and initiate evaluation from the onset formalize and document evaluation plans and processes
bull Develop program and project tracking systems that support evaluation and program implementation needs
bull Conduct process evaluations to ensure that programs are working efficiently
bull Conduct impact evaluations to ensure that mid- and long-term goals are being met
bull Communicate evaluation results to key stakeholders Include case studies to make success more tangible
Making Energy Efficiency a Resource
Energy efficiency programs are being successfully operated across many different contexts including electric and gas utilities regulated and unregulated markets utility state and third-party administrators and investor-owned pubshylic and cooperatively owned utilities These programs are reducing annual energy use by 015 to 1 percent at spendshying levels between 1 and 3 percent of electric and 05 and 15 percent of gas revenuesmdashand are poised to deliver substantially greater reductions over time These organishyzations were able to make broader use of the energy efficiency resource in their portfolio by having
bull Leadership at multiple levels to enact policy change
bull Organizational alignment to ensure that efficiency goals are realized
bull A well-informed understanding of the efficiency resource including the potential for savings and the technologies for achieving them
Examples of leadership organizational alignment and the steps that organizations have taken to understand the nature and extent of the efficiency resource are provided in the next sections
Leadership
Many energy efficiency programs reviewed in this chapter began in the integrated resource plan (IRP) era of the electric utilities of the 1980s As restructuring started in the late 1990s some programs were suspended or halted In some cases (such as California New York Massachusetts Connecticut and Rhode Island) however settlement agreements were reached that allowed restructuring legislation to move forward if energy effishyciency programming was provided through the distribushytion utility or other third-party providers In many cases environmental advocates energy service providers and state agencies played active roles in the settlement process to ensure energy efficiency was part of the restructured electric utility industry Other states (such as Minnesota Wisconsin and Vermont) developed legislashytion to address the need for stable energy efficiency proshygramming without restructuring their state electricity markets In addition a few states (including California Minnesota New Jersey Oregon Vermont and Wisconsin) enacted regulatory requirements for utilities or other parties to provide gas energy efficiency proshygrams (Kushler et al 2003) Over the past few years the mountain states have steadily ramped up energy efficiency programs
In all cases to establish energy efficiency as a resource required leadership at multiple levels
bull Leadership is needed to establish the business case for energy efficiency educate key stakeholders and enact policy changes that increase investment in energy efficiency as a resource Sustained leadership is needed from
To create a sustainable aggressive national commitment to energy efficiency 6-11
mdash Key individuals in upper management at the utility who understand that energy efficiency is a resource alternative that can help manage risk minimize long-term costs and satisfy customers
mdash State agencies regulatory commissions local govshyernments and associated legislative bodies andor consumer advocates that expect to see energy efficienshycy considered as part of comprehensive utility manageshyment
mdash Businesses that value energy efficiency as a way to improve operations manage energy costs and conshytribute to long-term energy price stability and availshyability as well as trade associations and businesses such as ESCOs that help members and customers achieve improved energy performance
ndash Public interest groups that understand that in order to achieve energy efficiency and environmental objectives they must help educate key stakeholders and find workshyable solutions to some of the financial challenges that limit acceptance and investment in energy efficiency by utilities
The following are examples of how leadership has resulted in increased investment in energy efficiency
bull In Massachusetts energy efficiency was an early conshysideration as restructuring legislation was discussed The Massachusetts Department of Public Utilities issued an order in DPU 95-30 establishing principles to ldquoestablish the essential underpinnings of an electric industry structure and regulatory framework designed to minimize long-term costs to customers while mainshytaining safe and reliable electric service with minimum impact on the environmentrdquo Maintaining demand side management (DSM) programs was one of the major principles the department identified during the transition to a restructured electric industry The Conservation Law Foundation the Massachusetts Energy Efficiency Council the National Consumer Law Center the Division of Energy Resources the Union of Concerned Scientists and others took leadership roles in ensuring energy efficiency was part of a restructured industry (MDTE 1995)
bull Leadership at multiple levels led to significantly expanded programming of Nevadarsquos energy efficiency program from about $2 million in 2001 to an estimated $26 million to $33 million in 2006
ldquoThere are lsquochampionsrsquo for expanded energy efficiency efforts in Nevada either in the state energy office or in the consumer advocatersquos office Also there have been very supportive individuals in key positions within the Nevada utilities These individuals are committed to developing and implementing effective DSM programs along with a supportive policy frameworkrdquo (SWEEP 2006)
Public interest organizations including SWEEP also played an important role by promoting a supportive polshyicy framework (see box on page 6-13 ldquoCase Study Nevada Efficiency Program Expansionrdquo for additional information)
bull Fort Collins City Council (Colorado) provides an example of local leadership The council adopted the Electric Energy Supply Policy in March 2003 The Energy Policy includes specific goals for city-wide energy consumpshytion reduction (10 percent per capita reduction by 2012) and peak demand reduction (15 percent per capita by 2012) Fort Collins Utilities introduced a variety of new demand-side management (DSM) programs and services in the last several years in pursuit of the energy policy objectives
bull Governor Huntsmanrsquos comprehensive policy on energy efficiency for the state of Utah which was unveiled in April 2006 is one of the most recent examples of leadshyership The policy sets a goal of increasing the statersquos energy efficiency by 20 percent by the year 2015 One key strategy of the policy is to collaborate with utilities regulators and the private sector to expand energy efficiency programs working to identify and remove barriers and assisting the utilities in ensuring that efficiency programs are effective attainable and feasible to implement
6-12 National Action Plan for Energy Efficiency
Organizational Alignment
Once policies and processes are in place to spearhead increased investment in energy efficiency organizations often institutionalize these policies to ensure that goals are realized The most successful energy efficiency proshygrams by utilities or third-party program administrators share a number of attributes They include
bull Clear support from upper management and one or more internal champions
bull Clear well-communicated program goals that are tied to organizational goals and in some cases compensation
bull A framework appropriate to the organization that supshyports large-scale implementation of energy efficiency programs
bull Adequate staff resources to get the job done
bull Strong regulatory support and policies
bull A commitment to continually improve business processes
ldquoSupport of upper management is critical to program successrdquo (Komor 2005) In fact it can make or break a program If the CEO of a company or the lead of an agency is an internal champion for energy efficiency it will be truly a part of how a utility or agency does busishyness Internal champions below the CEO or agency level are critical as well These internal champions motivate their fellow employees and embody energy efficiency as part of the corporate culture
Case Study Nevada Efficiency Program Expansion
Nevada investor-owned utilities (IOUs) Nevada Power and Sierra Pacific Power Company phased-out DSM programs in the mid-1990s After 2001 when the legislature refined the statersquos retail electric restructuring law to permit only large customers (gt1 megawatt [MW]) to purchase power competitively utilities returned to a vertically integrated structure and DSM programs were restarted but with a budget of only about $2 million that year
As part of a 2001 IRP proceeding a collaborative process was established for developing and analyzing a wider range of DSM program options All parties reached an agreement to the IRP proceeding calling for $112 million per year in utility-funded DSM programs with an emphasis on peak load reduction but also significant energy savshyings New programs were launched in March 2003
In 2004 the Nevada public utilities commission also approved a new policy concerning DSM cost recovery allowing the utilities to earn their approved rate of return plus 5 percent (eg a 15 percent return if the approved rate is 10 percent) on the equity-portion of their DSM program funding This step gave the utilities a much greater financial incentive to expand their DSM programs
In June 2005 legislation enacted in Nevada added energy savings from DSM programs to the statersquos Renewable Portfolio Standard This innovative policy allows energy savings from utility DSM programs and efficiency measshyures acquired through contract to supply up to 25 percent of the requirements under the renamed clean energy portfolio standard The clean energy standard is equal to 6 percent of electricity supply in 2005 and 2006 and increases to 9 percent in 2007 and 2008 12 percent from 2009 to 2010 15 percent in 2011 and 2012 18 percent in 2013 and 2014 and 20 percent in 2015 and thereshyafter At least half of the energy savings credits must come from electricity savings in the residential sector
Within months of passage the utilities proposed a large expansion of DSM programs for 2006 In addition to the existing estimated funding of $26 million the Nevada utilshyities proposed adding another $75 million to 2006 DSM programs If funding is approved the Nevada utilities estishymate the 2006 programs alone will yield gross energy savshyings of 153 gigawatt-hoursyr and 63 MW (Larry Holmes personal communication February 28 2006)
Source Geller 2006
To create a sustainable aggressive national commitment to energy efficiency 6-13
Tying energy efficiency to overall corporate goals and compensation is important particularly when the utility is the administrator of energy efficiency programs Ties to corporate goals make energy efficiency an integral part of how the organization does business as exemplified below
bull Bonneville Power Administration (BPA) includes energy efficiency as a part of its overall corporate strategy and its executive compensation is designed to reflect how well the organization meets its efficiency goals BPArsquos strategy map states ldquoDevelopment of all cost-effective energy efficiency in the loads BPA serves facilitates development of regional renewable resources and adopts cost-effective non-construction alternatives to transmission expansionrdquo (BPA 2004)
bull National Grid ties energy efficiency goals to staff and executive compensation (P Arons personnel communishycation June 15 2006)
bull Sacramento Municipal Utility District (SMUD) ties energy efficiency to its reliability goal ldquoTo ensure a reliable energy supply for customers in 2005 the 2005 budget includes sufficient capacity reserves for the peak summer season We have funded all of the Districtrsquos commercial and resishydential load management programs and on-going effishyciency programs in Public Good to continue to contribute to peak load reductionrdquo (SMUD 2004a)
bull Nevada Powerrsquos Conservation Department had a ldquoPerformance Dashboardrdquo that tracks costs participating customers kWh savings kW savings $kWh $kW customer contribution to savings and total customer costs on a real time basis both by program and overall
bull Austin Energyrsquos Mission Statement is ldquoto deliver clean affordable reliable energy and excellent customer servshyicesrdquo (Austin Energy 2004)
bull Seattle City Light has actively pursued conservation as an alternative to new generation since 1977 and has tracked progress toward its goals (Seattle City Light 2005) Its longstanding resolute policy direction estabshylishes energy conservation as the first choice resource In more recent years the utility has also been guided by the cityrsquos policy to meet of all the utilityrsquos future load growth with conservation and renewable resources (Steve Lush personal communication June 2006)
From Pacific Gas and Electricrsquos (PGampErsquos) Second Annual Corporate Responsibility Report (2004)
ldquoOne of the areas on which PGampE puts a lot of emphasis is helping our customers use energy more efficientlyrdquo
ldquoFor example we plan to invest more than $2 billion on energy efficiency initiatives over the next 10 years Whatrsquos exciting is that the most recent regulatory approval we received on this was the result of collaboration by a large and broad group of parties including manufacturers customer groups environmental groups and the statersquos utilitiesrdquo
mdash Beverly Alexander Vice President Customer Satisfaction PGampE
Having an appropriate framework within the organizashytion to ensure success is also important In the case of the utility this would include the regulatory framework that supports the programs including cost recovery and potentially shareholder incentives andor decoupling For a third-party administrator an appropriate framework might include a sound bidding process by a state agency to select the vendor or vendors and an appropriate regshyulatory arrangement with the utilities to manage the funding process
Adequate resources also are critical to successful impleshymentation of programs Energy efficiency programs need to be understood and supported by departments outside those that are immediately responsible for proshygram delivery If information technology legal power supply transmission distribution and other departshyments do not share and support the energy efficiency goals and programs it is difficult for energy efficiency programs to succeed When programs are initiated the need for support from other departments is greatest Support from other departments needs to be considered in planning and budgeting processes
6-14 National Action Plan for Energy Efficiency
As noted in the Nevada case study having a shareholder incentive makes it easier for a utility to integrate effishyciency goals into its business because the incentive offshysets some of the concerns related to financial treatment of program expenses and potential lost revenue from decreased sales For third-party program administrators goals might be built into the contract that governs the overall implementation of the programs For example Efficiency Vermontrsquos contract with the Vermont Department of Public Service Board has specific pershyformance targets An added shareholder return will not motivate publicly and cooperatively owned utilities though they might appreciate reduced risks from exposhysure to wholesale markets and the value added in improved customer service SMUD for example cites conservation programs as a way to help customers lower their utility bills (SMUD 2004b) These compashynies like IOUs can link employee compensation to achieving energy efficiency targets
Business processes for delivering energy efficiency proshygrams and services to customers should be developed and treated like other business processes in an organizashytion and reviewed on a regular basis These processes should include documenting clear plans built on explicit assumptions ongoing monitoring of results and plan inputs (assumptions) and regular reassessment to improve performance (using improved performance itself as a metric)
Understanding the Efficiency Resource
Energy efficiency potential studies provide the initial jusshytification (the business case) for utilities embarking on or expanding energy efficiency programs by providing information on (1) the overall potential for energy effishyciency and (2) the technologies practices and sectors with the greatest or most cost-effective opportunities for achieving that potential Potential studies illuminate the nature of energy efficiency resource and can be used by legislators and regulators to inform efficiency policy and programs Potential studies can usually be completed in three to eight months depending on the level of detail availability of data and complexity They range in cost
from $100000 to $300000 (exclusive of primary data collection) Increasingly many existing studies can be drawn from to limit the extent and cost of such an effort
The majority of organizations reviewed in developing this chapter have conducted potential studies in the past five years In addition numerous other studies have been conshyducted in recent years by a variety of organizations intershyested in learning more about the efficiency resource in their state or region Table 6-4 summarizes key findings for achievable potential (ie what can realistically be achieved from programs within identified funding paramshyeters) by customer class from a selection of these studies It also illustrates that this potential is well represented across the residential commercial and industrial sectors The achievable estimates presented are for a future time period are based on realistic program scenarios and repshyresent potential program impacts above and beyond natshyurally occurring conservation Energy efficiency potential studies are based on currently available technologies New technologies such as those discussed in Table 6-9 will conshytinuously and significantly increase potential over time
The studies show that achievable potential for reducing overall energy consumption ranges from 7 to 32 percent for electricity and 5 to 19 percent for gas and that demand for electricity and gas can be reduced by about 05 to 2 percent per year For context national electricity consumption is projected to grow by 16 percent per year and gas consumption is growing 07 percent per year (EIA 2006a)
The box on page 6-17 ldquoOverview of a Well-Designed Potential Studyrdquo provides information on key elements of a potential study Related best practices for efficiency programs administrators include
bull Conducting a ldquopotential studyrdquo prior to starting programs
bull Outlining what can be accomplished at what cost
bull Reviewing measures appropriate to all customer classes including those appropriate for hard-to-reach customers such as low income and very small business customers
To create a sustainable aggressive national commitment to energy efficiency 6-15
6-16 National Action Plan for Energy Efficiency
Tab
le 6
-4
Ach
ieva
ble
En
erg
y E
ffici
en
cy P
ote
nti
al
Fro
m R
ece
nt
Stu
die
s
Stat
eRe
gion
St
udy
Leng
th(Y
ears
)
Ach
ieva
ble
Dem
and
Redu
ctio
n (M
W)
Ach
ieva
ble
Gas
Co
nsum
ptio
nRe
duct
ion
(MM
Btu)
Ach
ieva
ble
GW
h Re
duct
ion
Dem
and
Savi
ngs
a s
of 2
004
Stat
eN
amep
late
Capa
city
10
Ann
ual
M
WSa
ving
s
Elec
tric
itySa
ving
s as
o
f Tot
al20
04 S
tate
Usag
e 11
Ann
ual
G
Wh
Savi
ngs
Gas S
avin
gs
as
of T
otal
20
04 S
tate
Usag
e12
Ann
ual
MM
Btu
Savi
ngs
Resi
dent
ial
Com
mercia
l In
dust
rial
Resi
dent
ial
Com
mercia
l In
dust
rial
Resi
dent
ial
Com
mercia
l In
dust
rial
Elec
tricit
y El
ectricit
y Ga
s
US
(Cle
anEn
ergy
Fut
ure)
1 20
n
a n
a n
a 50
000
000
0 30
000
000
0 1
400
000
000
392
732
281
360
292
076
na
na
24
1
2
10
0
5
Con
Edis
on 2
10
na
na
na
113
967
00
10782
100
23
100
0 n
a n
a n
a n
a n
a n
a n
a 19
19
Paci
fic
NW
3 20
n
a n
a n
a n
a n
a n
a 11
169
9
715
501
1 n
a n
a 12
5
0
6
na
na
Puge
t So
und
4 20
13
3 148
16
na
na
na
116
9 1
293
139
93
0
5
95
0
5
na
na
Conn
ecti
cut
5 8
240
575
93
na
na
na
165
5 2
088
723
125
16
13
4
1
7
na
na
Calif
orni
a 6
9 180
0 2
600
155
0 27
500
000
20
600
000
-
920
0 11
900
880
0 9
6
11
11
8
1
3
10
1
1
Sout
hwes
t 7 17
n
a n
a n
a n
a n
a n
a 24
593
50
291
-
na
na
328
19
n
a n
a
New
Yor
k 8
19
358
4 8
180
602
na
na
na
157
28
2948
818
0 23
1
1
2
143
08
n
a n
a
Illin
ois 9
17
na
na
na
na
na
na
--
670
00
na
na
432
25
n
a n
a
AVER
AG
E
11
1
3
12
MW
= M
egaw
att
MM
Btu
= M
illio
n Br
itish
ther
mal
uni
ts
1 O
RNL
200
02 N
YSE
RDA
OE
200
63
NPC
C 2
005
4 Pu
get
Soun
d En
ergy
200
35 G
DS
Ass
ocia
tes
and
Qua
ntum
Con
sulti
ng 2
004
6 K
EMA
200
2 K
EMA
amp X
ENER
GY
200
3a K
EMA
amp X
ENER
GY
200
3b
7 SW
EEP
200
28 N
YSE
RDA
OE
200
39 A
CEE
E 1
998
10
EIA
200
5a
11 E
IA 2
005b
12
EIA
200
6b
Overview of a Well-Designed Potential Study
Well-designed potential studies assess the following types of potential
Technical potential assumes the complete penetration of all energy-conservation measures that are considered technically feasible from an engineering perspective
Economic potential refers to the technical potential of those measures that are cost-effective when compared to supply-side alternatives The economic potential is very large because it is summing up the potential in existing equipment without accounting for the time period during which the potential would be realized
Maximum achievable potential describes the economic potential that could be achieved over a given time period under the most aggressive program scenario
Achievable potential refers to energy saved as a result of specific program funding levels and incentives These savings are above and beyond those that would occur naturally in the absence of any market intervention
Naturally occurring potential refers to energy saved as a result of normal market forces that is in the absence of any utility or governmental intervention
The output of technical and economic potential is the size of the energy efficiency resource in MW MWh MMBtu and other resources The potential is built up from savings and cost data from hundreds of measures and is typically summarized by sector using detailed demographic inforshymation about the customer base and the base of applishyances building stock and other characteristics of the relevant service area
After technical and economic potential is calculated typishycally the next phase of a well-designed potential study is to create program scenarios to estimate actual savings that could be generated by programs or other forms of intervention such as changing building codes or appliance standards
Program scenarios developed to calculate achievable potential are based on modeling example programs and using market models to estimate the penetration of the program Program scenarios require making assumptions about rebate or incentive levels program staffing and marketing efforts
Scenarios can also be developed for different price assumptions and load growth scenarios as shown below in the figure of a sample benefitcost output from a potential study conducted for the state of California
Benefits and Costs of Electric Energy Efficiency Savings 2002-2011
$0
$5
$10
$15
$20
$25
Pres
ent V
alue
in $
Bill
ions
Total Benefits Non-Incentive Participant Costs
Program Incentives
Program Admin amp Marketing
Business-as-Usual Advanced Efficiency Max Efficiency
Net Benefits $55B
Net Benefits $119B
Net Benefits $86B
Source KEMA 2002
To create a sustainable aggressive national commitment to energy efficiency 6-17
bull Ensuring that potential state and federal codes and stanshydards are modeled and included in evaluation scenarios
bull Developing scenarios for relevant time periods
In addition an emerging best practice is to conduct uncertainty analysis on savings estimates as well as other variables such as cost
With study results in hand program administrators are well positioned to develop energy efficiency goals idenshytify program measures and strategies and determine funding requirements to deliver energy efficiency proshygrams to all customers Information from a detailed potential study can also be used as the basis for calculating program cost-effectiveness and determining measures for inclusion during the program planning and design phase Detailed potential studies can provide informashytion to help determine which technologies are replaced most frequently and are therefore candidates to deliver early returns (eg an efficient light bulb) and how long the savings from various technologies persist and thereshyfore will continue to deliver energy savings For example an energy efficient light bulb might last six years whereshyas an efficient residential boiler might last 20 years (Additional information on measure savings and lifeshytimes can be found in Resources and Expertise a forthshycoming product of the Action Plan Leadership Group)
Developing an Energy Efficiency Plan
The majority of organizations reviewed for this chapter are acquiring energy efficiency resources for about $003lifetime kWh for electric programs and about $130 to $200 per lifetime MMBtu for gas program (as shown previously in Tables 6-1 and 6-2) In many cases energy efficiency is being delivered at a cost that is subshystantially less than the cost of new supplymdashon the order of half the cost of new supply In addition in all cases where information is available the costs of saved energy are less than the avoided costs of energy These organishyzations operate in diverse locations under different administrative and regulatory structures They do howshy
ever share many similar best practices when it comes to program planning including one or more of the following
bull Provide programs for all key customer classes
bull Align goals with funding
bull Use cost-effectiveness tests that are consistent with long-term planning
bull Consider building codes and appliance standards when designing programs
bull Plan for developing and incorporating new technology
bull Consider efficiency investments to alleviate transmisshysion and distribution constraints
bull Create a roadmap that documents key program comshyponents milestones and explicit energy reduction goals
Provide Programs for All Customer Classes
One concern sometimes raised when funding energy efficiency programs is that all customers are required to contribute to energy efficiency programming though not all customers will take advantage of programs once they are available raising the issue that non-participants subsidize the efficiency upgrades of participants
While it is true that program participants receive the direct benefits that accrue from energy efficiency upgrades all customer classes benefit from well-managed energy efficiency programs regardless of whether or not they participate directly For example an evaluation of the New York State Energy Research and Development Authorityrsquos (NYSERDArsquos) program portfolio concluded that ldquototal cost savings for all customers including non participating customers [in the New York Energy $mart Programs] is estimated to be $196 million for program activities through year-end 2003 increasing to $420 to $435 million at full implementationrdquo (NYSERshyDA 2004)
6-18 National Action Plan for Energy Efficiency
In addition particularly for programs that aim to accelerate market adoption of energy efficiency products or services there is often program ldquospilloverrdquo to non-program participants For example an evaluation of National Gridrsquos Energy Initiative Design 2000plus and other small commercial and industrial programs found energy efficient measures were installed by non-participants due to program influences on design professionals and vendors The analysis indicated that ldquonon-participant spillover from the programs amounted to 12323174 kWh in the 2001 program year which is approximately 92 percent of the total savings produced in 2001 by the Design 2000plus and Energy Initiative programs combinedrdquo (National Grid 2002)
Furthermore energy efficiency programming can help contribute to an overall lower cost system for all cusshytomers over the longer term by helping avoid the need to purchase energy or the need to build new infrastrucshyture such as generation transmission and distribution lines For example
bull The Northwest Power Planning and Conservation Council found in its Portfolio Analysis that strategies that included more conservation had the least cost and the least risk (measured in dollars) relative to strategies that included less conservation The most aggressive conservation case had an expected system cost of $18 billion lower and a risk factor of $25 billion less than the strategy with the least conservation (NPPC 2005)
bull In its 2005 analysis of energy efficiency and renewable energy on natural gas consumption and price ACEEE states ldquoIt is important to note that while the direct benefits of energy efficiency investment flow to particshyipating customers the benefits of falling prices accrue to all customersrdquo Based on their national scenario of cost-effective energy efficiency opportunities ACEEE found that total costs for energy efficiency would be $8 billion and would result in consumer benefits of $32 billion in 2010 (Elliot amp Shipley 2005)
bull Through cost-effective energy efficiency investments in 2004 Vermonters reduced their annual electricity use by 58 million kWh These savings which are expected to continue each year for an average of 14 years met 44 percent of the growth in the states energy needs in 2004 while costing ratepayers just 28 cents per kWh That cost is only 37 percent of the cost of generating transmitting and distributing power to Vermonts homes and businesses (Efficiency Vermont 2004)
bull The Massachusetts Division of Energy noted that cumulative impact on demand from energy efficiency measures installed from 1998 to 2002 (excluding reductions from one-time interruptible programs) was significantmdashreducing demand by 264 megawatt (MW) During the summer of 2002 a reduction of this magnitude meant avoiding the need to purchase $194 million worth of electricity from the spot market (Massachusetts 2004)
Despite evidence that both program participants and non-participants can benefit from energy efficiency proshygramming it is a best practice to provide program opportunities for all customer classes and income levels This approach is a best practice because in most cases funding for efficiency programs comes from all customer classes and as mentioned above program participants will receive both the indirect benefits of system-wide savings and reliability enhancements and the direct benefits of program participation
All program portfolios reviewed for this chapter include programs for all customer classes Program administrators usually strive to align program funding with spending based on customer class contributions to funds It is not uncommon however to have limited cross-subsidization for (1) low-income agricultural and other hard-to-reach customers (2) situations where budgets limit achievable potential and the most cost-effective energy efficiency savings are not aligned with customer class contributions to energy efficiency funding and (3) situations where energy efficiency savings are targeted geographically based on system needsmdashfor example air conditioner
To create a sustainable aggressive national commitment to energy efficiency 6-19
turn-ins or greater new construction incentives that are targeted to curtail load growth in an area with a supply or transmission and distribution need For programs tarshygeting low-income or other hard-to-reach customers it is not uncommon for them to be implemented with a lower benefit-cost threshold as long as the overall energy efficiency program portfolio for each customer class (ie residential commercial and industrial) meets cost-effectiveness criteria
NYSERDAlsquos program portfolio is a good example of proshygrams for all customer classes and segments (see Table 6-5)
Table 6-5 NYSERDA 2004 Portfolio
Sector Program of Sector Budget
Residential Small Homes 23
Keep Cool 19
ENERGY STAR Products 20
Program Marketing 16
Multifamily 10
AwarenessOther 12
Low Income Assisted Multifamily 59
Assisted Home Performance 17
Direct Install 8
All Other 16
Business Performance Contracting 36
Peak Load Reduction 12
Efficient Products 9
New Construction 23
Technical Assistance 10
All Other 10
Nevada PowerSierra Pacific Power Companyrsquos portfolio provides another example with notable expansion of program investments in efficient air conditioning ENERGY STAR appliances refrigerator collection and renewable energy investments within a one-year timeframe (see Table 6-6)
Align Goals With Funding
Regardless of program administrative structure and policy context it is a best practice for organizations to align funding to explicit goals for energy efficiency over the near-term and long-term How quickly an organization is able to ramp up programs to capture achievable potenshytial can vary based on organizational history of running DSM programs and the sophistication of the marketshyplace in which a utility operates (eg whether there is a network of home energy raters ESCOs or certified heating ventilation and air conditioning [HVAC] contractors)
Utilities or third-party administrators should set long-term goals for energy efficiency designed to capture a significant percentage of the achievable potential energy savings identified through an energy efficiency potential study Setting long-term goals is a best practice for administrators of energy efficiency program portfolios regardless of policy models and whether they are an investor-owned or a municipal or cooperative utility or a third-party program administrator Examples of how long-term goals are set are provided as follows
bull In states where the utility is responsible for integrated resource planning (the IRP Model) energy efficiency must be incorporated into the IRP This process generally requires a long-term forecast of both spending and savshyings for energy efficiency at an aggregated level that is consistent with the time horizon of the IRPmdashgenerally at least 10 years Five- and ten-year goals can then be develshyoped based on the resource need In states without an SBC the budget for energy efficiency is usually a revenue requirement expense item but can be a capital investshyment or a combination of the two (As discussed in Chapter 2 Utility Ratemaking amp Revenue Requirements capitalizing efficiency program investments rather than expensing them can reduce short-term rate impacts)
bull Municipal or cooperative utilities that own generation typically set efficiency goals as part of a resource planshyning process The budget for energy efficiency is usually a revenue requirement expense item a capital expendishyture or a combination of the two
6-20 National Action Plan for Energy Efficiency
Table 6-6 Nevada Resource Planning Programs
2005 Budget 2006 Budget
Air Conditioning Load Management $3450000 $3600000
High-Efficiency Air Conditioning 2600000 15625000
Commercial Incentives 2300000 2800000
Low-Income Support 1361000 1216000
Energy Education 1205000 1243000
ENERGY STAR Appliances 1200000 2050000
School Support 850000 850000
Refrigerator Collection 700000 1915000
Commercial New Construction 600000 600000
Other ndash Miscellaneous amp Technology 225000 725000
Total Nevada Resource Planning Programs $14491000 $30624000
SolarGenerations 1780075 7220000
Company Renewable ndash PV 1000000 1750000
California Program 370000 563000
Sierra Natural Gas Programs mdash 820000
Total All Programs $17641075 $40977000
bull A resource portfolio standard is typically set at a pershycentage of overall energy or demand with program plans and budgets developed to achieve goals at the portfolio level The original standard can be developed based on achievable potential from a potential study or as a percentage of growth from a base year
bull In most SBC models the funding is determined by a small volumetric charge on each customerrsquos utility bill This charge is then used as a basis for determining the overall budget for energy efficiency programmingmdash contributions by each customer class are used to inform the proportion of funds that should be targeted to each customer class Annual goals are then based on these budgets and a given program portfolio Over time the goal of the program should be to capture a large pershycentage of achievable potential
bull In most gas programs funding can be treated as an expense in a capital budget or a combination (as is the case in some of the electric examples shown previshyously) Goals are based on the budget developed for the time period of the plan
Once actual program implementation starts program experience is usually the best basis for developing future budgets and goals for individual program years
Use Cost-Effectiveness Tests That Are Consistent With Long-Term Planning
All of the organizations reviewed for this chapter use cost-effectiveness tests to ensure that measures and proshygrams are consistent with valuing the benefits and costs of their efficiency investments relative to long-term
To create a sustainable aggressive national commitment to energy efficiency 6-21
supply options Most of the organizations reviewed use either the total resource cost (TRC) societal or program administrator test (utility test) to screen measures None of the organizations reviewed for this chapter used the rate impact measure (RIM) test as a primary decision-making test5 The key cost-effectiveness tests are described as follows per Swisher et al (1997) with key benefits and costs further illustrated in Table 6-7
bull Total Resource Cost (TRC) Test Compares the total costs and benefits of a program including costs and benefits to the utility and the participant and the avoided costs of energy supply
bull Societal Test Similar to the TRC Test but includes the effects of other societal benefits and costs such as envishyronmental impacts water savings and national security
bull UtilityProgram Administrator Test Assesses benefits and costs from the program administratorrsquos perspective (eg benefits of avoided fuel and operating capacity costs compared to rebates and administrative costs)
bull Participant Test Assesses benefits and costs from a parshyticipantrsquos perspective (eg the reduction in customersrsquo bills incentives paid by the utility and tax credits received as compared to out-of-pocket expenses such as costs of equipment purchase operation and mainshytenance)
bull Rate Impact Measure (RIM) Assesses the effect of changes in revenues and operating costs caused by a program on customersrsquo bills and rates
Another metric used for assessing cost-effectiveness is the cost of conserved energy which is calculated in cents per kWh or dollars per thousand cubic feet (Mcf) This measure does not depend on a future projection of energy prices and is easy to calculate however it does not fully capture the future market price of energy
An overall energy efficiency portfolio should pass the cost-effectiveness test(s) of the jurisdiction In an IRP sitshyuation energy efficiency resources are compared to new supply-side optionsndashessentially the program administrashytor or utility test In cases where utilities have divested generation a calculated avoided cost or a wholesale market price projection is used to represent the generashytion benefits Cost-effectiveness tests are appropriate to screen out poor program design and to identify proshygrams in markets that have been transformed and might need to be redesigned to continue Cost-effectiveness analysis is important but must be supplemented by other aspects of the planning process
If the TRC or societal tests are used ldquoother resource beneshyfitsrdquo can include environmental benefits water savings and other fuel savings Costs include all program costs (adminshyistrative marketing incentives and evaluation) as well as customer costs Future benefits from emissions trading (or other regulatory approaches that provide payment for emisshysion credits) could be treated as additional benefits in any of these models Other benefits of programs can include job impacts sales generated gross state product added impacts from wholesale price reductions and personal income (Wisconsin 2006 Massachusetts 2004)
Example of Other Benefits
The Massachusetts Division of Energy Resources estimates that its 2002 DSM programs produced 2093 jobs increased disposable income by $79 million and provided savings to all customers of $194 million due to lower wholesale energy clearshying prices (Massachusetts 2004)
At a minimum regulators require programs to be cost-effective at the sector level (residential commercial and industrial) and typically at the program level as well Many program administrators bundle measures under a single program umbrella when in reality measures are delivered to customers through different strategies and marketing channels This process allows program adminshy
5 The RIM test is viewed as less certain than the other tests because it is sensitive to the difference between long-term projections of marginal or market costs and long-term projections of rates (CEC 2001)
6-22 National Action Plan for Energy Efficiency
Table 6-7 Overview of Cost-Effectiveness Tests
Benefits Costs
Test Externalities Energy
Benefits G TampD
Demand Benefits G TampD
Non-Energy Benefits
Other Resource Benefits
Impact On
Rates
Program Implementation
Costs
Program Evaluation
Costs
Customer Costs
Total Resource Cost Test X X X X X X
Societal Test X X X X X X X X
Utility Test Administrator Test
X X X X
Rate Impact Test X X X X X
Participant Test X X X X
G TampD = Generation Transmission and Distribution
istrators to adjust to market realities during program implementation For example within a customer class or segment if a high-performing and well-subscribed proshygram or measure is out-performing a program or measshyure that is not meeting program targets the program administrator can redirect resources without seeking additional regulatory approval
Individual programs should be screened on a regular basis consistent with the regulatory schedulemdashtypically once a year Individual programs in some customer segments such as low income are not always required to be cost-effective as they provide other benefits to society that might not all be quantified in the cost-effectiveness tests The same is true of education-only programs that have hard-to-quantify benefits in terms of energy impacts (See section on conducting impact evaluations for information related to evaluating energy education programs)
Existing measures should be screened by the program administrator at least every two years and new measshyures should be screened annually to ensure they are pershyforming as anticipated Programs should be reevaluated and updated from time to time to reflect new methods
technologies and systems For example many programs today include measures such as T-5 lighting that did not exist five to ten years ago
Consider Building Codes and Appliance Standards When Designing Programs
Enacting state and federal codes and standards for new products and buildings is often a cost-effective opportunity for energy savings Changes to building codes and applishyance standards are often considered an intervention that could be deployed in a cost-effective way to achieve results Adoption of state codes and standards in many states requires an act of legislation beyond the scope of utility programming but utilities and other third-party program administrators can and do interact with state and federal codes and standards in several ways
bull In the case of building codes code compliance and actual building performance can lag behind enactment of legislation Some energy efficiency program adminshyistrators design programs with a central goal of improving code compliance Efficiency Vermontrsquos ENERGY STAR Homes program (described in the box on page 6-24) includes increasing compliance with Vermont Building Code as a specific program objective
To create a sustainable aggressive national commitment to energy efficiency 6-23
The California investor owned utilities also are working with the national ENERGY STAR program to ensure availability of ENERGY STARTitle 24 Building Code-compliant residential lighting fixtures and to ensure overall compliance with their new residential building code through their ENERGY STAR Homes program
bull Some efficiency programs fund activities to advance codes and standards For example the California IOUs are funding a long-term initiative to contribute expertise research analysis and other kinds of support to help the California Energy Commission (CEC) develop and adopt energy efficiency standards One rationale for utility investment in advancing codes and standards is that utilshyities can lock in a baseline of energy savings and free up program funds to work on efficiency opportunities that could not otherwise be realized In Californiarsquos case the IOUs also developed a method for estimating savings associated with their codes and standards work The method was accepted by the California Public Utilities Commission and is formalized in the California Energy Efficiency Evaluation Protocols Technical Methodological and Reporting Require-ments for Evaluation Professionals (CPUC 2006)
Regardless of whether they are a component of an energy efficiency program organizations have found that it is essential to coordinate across multiple states and regions
when pursuing state codes and standards to ensure that retailers and manufacturers can respond appropriately in delivering products to market
Program administrators must be aware of codes and standards Changes in codes and standards affect the baseline against which future program impacts are measured Codes and standards should be explicitly conshysidered in planning to prevent double counting The Northwest Power and Conservation Council (NWPCC) explicitly models both state codes and federal standards in its long-term plan (NWPCC 2005)
Plan for Developing and Incorporating New Technology
Many of the organizations reviewed have a history of providing programs that change over time to accommoshydate changes in the market and the introduction of new technologies The new technologies are covered using one or more of the following approaches
bull They are included in research and development (RampD) budgets that do not need to pass cost-effectiveness tests as they are by definition addressing new or experimental technologies Sometimes RampD funding
Efficiency Vermont ENERGY STAR Homes Program
In the residential new construction segment Efficiency Vermont partners with the national ENERGY STAR proshygram to deliver whole house performance to its cusshytomers and meet both resource acquisition and market transformation goals Specific objectives of Efficiency Vermontrsquos program are to
bull Increase market recognition of superior construction
bull Increase compliance with the Vermont Building Code
bull Increase penetration of cost-effective energy efficiency measures
bull Improve occupant comfort health and safety (including improved indoor air quality)
bull Institutionalize Home Energy Rating Systems (HERS)
Participating homebuilders agree to build to the proshygrams energy efficiency standards and allow homes to be inspected by an HERS rater The home must score 86+ on the HERS inspection and include four energy efficient light fixtures power-vented or sealed combustion equipment and an efficient mechanical ventilation system with automatic controls When a home passes builders receive a rebate check proshygram certificate an ENERGY STAR Homes certificate and gifts Efficiency Vermont ENERGY STAR Homes Program saved more than 700 MWh with program spending of $14 million in 2004
Source Efficiency Vermont 2005
6-24 National Action Plan for Energy Efficiency
comes from sources other than the utility or state agency Table 6-8 summarizes RampD activities of several organizations reviewed
bull They are included in pilot programs that are funded as part of an overall program portfolio and are not indishyvidually subject to cost-effectiveness tests
bull They are tested in limited quantities under existing proshygrams (such as commercial and industrial custom rebate programs)
Technology innovation in electricity use has been the corshynerstone of global economic progress for more than 50 years In the future advanced industrial processes heating and cooling and metering systems will play very imporshytant roles in supporting customersrsquo needs for efficient use of energy Continued development of new more efficient technologies is critical for future industrial and commercial processes Furthermore technology innovation
that targets improved energy efficiency and energy manshyagement will enable society to advance and sustain enershygy efficiency in the absence of government-sponsored or regulatory-mandated programs Robust and competitive consumer-driven markets are needed for energy efficient devices and energy efficiency service
The Electric Power Research Institute (EPRI)US Department of Energy (DOE) Gridwise collaborative and the Southern California Edison (SCE) Lighting Energy Efficiency Demand Response Program are two examples of research and development activities
bull The EPRI IntelliGrid Consortium is an industry-wide inishytiative and publicprivate partnership to develop the technical foundation and implementation tools to evolve the power delivery grid into an integrated energy and communications system on a continental scale A key development by this consortium is the IntelliGrid Architecture an open-standards-based architecture
Table 6-8 Research amp Development (RampD) Activities of Select Organizations
Program Administrator RampD Funding Mechanism(s) RampD as of Energy
Efficiency Budget Examples of RampD Technologies
Initiatives Funded
PGampE
CEC Public Interest Energy Research (PIER) performs research from California SBC funding (PGampE does not have access to their bills SBC funds) other corporate funds support the California Clean Energy Fund
1ab California Clean Energy Fund - New technologies and demonstration projects
NYSERDA SBC funding 13cd Product development demonstration and evaluation university research techshynology market opportunities studies
BPA In rates 6ef PNL DOE GridWise Collaborative Northwest Energy Efficiency Alliance university research
SCE
CEC Public Interest Energy Research (PIER) performs research from California SBC funding (SCE does not have access to their bills SBC funds) Procurement proceedings and other corporate funds support Emerging Technologies and Innovative Design for Energy Efficiency programs
5ghi Introduction of emerging technologies (second D of RDampD)
a [Numerator] $4 million in 2005 for Californial Clean Energy Fund (CCEF 2005) b [Denominator] $867 million to be spent 2006-2008 on energy efficiency projects not including evaluation measurement and validation (CPUC
2005) 13 of full budget used for single year budget ($289 million) c [Numerator] $17 million for annual energy efficiency RampD budget consists of residential ($8 M) industrial ($6 M) and transportation ($3 M)
(G Walmet NYSERDA personal communication May 23 2006) d [Denominator] $134 M for New York Energy $mart from 32004-32005 (NYSERDA 2005b) e [Numerator] BPA funded the Northwest Energy Efficiency Alliance with $10 million in 2003 [Denominator] The total BPA energy efficiency allocashy
tion was $138 million (Blumstein et al 2005) f [Note] BPA overall budgetting for energy efficiency increased in subsequent years (eg $170 million in 2004 with higher commitments going to an average of $245 million from 2006-2012) (Alliance to Save Energy 2004)
g Funding for the statewide Emerging Technologies program will increase in 2006 to $10 million [Numerator] out of a total budget of $581 million [Denominator] for utility energy-efficiency programs (Mills and Livingston 2005)
h [Note] Data from Mills and Livingston (2005) differs from $675 million 3-yr figure from CPUC (2005) i Additional 3 is spent on Innovative Design for Energy Efficiency (InDEE) (D Arambula SCE personal communication June 8 2006)
To create a sustainable aggressive national commitment to energy efficiency 6-25
for integrating the data communication networks and smart equipment on the grid and on consumer premshyises Another key development is the consumer portalmdash essentially a two-way communication link between utilities and their customers to facilitate information exchange (EPRI 2006) Several efficiency program adminshyistrators are pilot testing GridWiseIntelligrid as presented in the box below
bull The Lighting Energy Efficiency Demand Response Program is a program proposed by SCE It will use Westinghousersquos twondashway wireless dimmable energy effishyciency T-5 fluorescent lighting as a retrofit for existing T-12 lamps SCE will be able to dispatch these lighting systems using wireless technology The technology will be piloted in small commercial buildings the educational sector office buildings and industrial facilities and could give SCE the ability to reduce load by 50 percent on those installations This is an excellent example of combining energy efficiency and direct load control technologies
Both EPRI and ESource (a for-profit membership-based energy information service) are exploring opportunities to expand their efforts in these areas ESource is also
Pilot Tests of GridWiseIntelligrid
GridWise Pacific Northwest Demonstration Projects These projects are designed to demonstrate how advanced information-based technologies can be used to increase power grid efficiency flexibility and reliability while reducing the need to build additional transmission and distribution infrastructure These pilots are funded by DOErsquos Office of Electricity Delivery and Energy Reliability
Olympic Peninsula Distributed ResourcesDemonstrationThis project will integrate demand response and disshytributed resources to reduce congestion on the grid including demand response with automated control technology smart appliances a virtual real-time
considering developing a database of new energy efficiency and load response technologies Leveraging RampD resources through regional and national partnering efforts has been successful in the past with energy effishyciency technologies Examples include compact fluoresshycent lighting high-efficiency ballasts and new washing machine technologies Regional and national efforts send a consistent signal to manufacturers which can be critical to increasing RampD activities
Programs must be able to incorporate new technologies over time As new technologies are considered the proshygrams must develop strategies to overcome the barriers specific to these technologies to increase their acceptance Table 6-9 provides some examples of new technologies challenges and possible strategies for overcoming these challenges A cross-cutting challenge for many of these technologies is that average rate designs do not send a price signal during periods of peak demand A strategy for overcoming this barrier would be to investigate time-sensitive rates (see Chapter 5 Rate Design for additional information)
market Internet-based communications contract options for customers and the use of distributed generation
Grid-Friendly Appliance Demonstration In this project appliance controllers will be used in both clothes dryers and water heaters to detect flucshytuations in frequency that indicate there is stress in the grid and will respond by reducing the load on that appliance
These pilots include Pacific Northwest National Laboratory Bonneville Power Administration PacificCorp Portland General Electric Mason County PUD 3 Clallam County PUD and the city of Port Angeles
6-26 National Action Plan for Energy Efficiency
Table 6-9 Emerging Technologies for Programs
Technology Program Description Availability Key
Challenges Key
Strategies Examples
Smart Grid GridWise technologies
Smart grid technologies include both customer-side and grid-side technologies that allow for more efficient operation of the grid
Available in pilot situations
Cost
Customer Acceptance
Communication Protocols
Pilot programs
RampD programs
GridWise pilot in Pacific NW
Smart appliances Smart Homes
Homes with gateways that would allow for control of appliances and other end-uses via the Internet
Available Cost
Customer Acceptance
Communication Protocols
Pilot programs
Customer education
GridWise pilot in Pacific NW
Load control of AC via smart thermostat
AC controlled via smart thermostat
Communication can be via wireless power line carrier (PLC) or Internet
Widely available Cost
Customer acceptance
Used to control loads in congested situation
Pilot and full-scale programs
Customer education
Long Island Power Authority (LIPA) Austin Energy Utah Power and Light ISO New England
Dynamic pricingcritical peak pricing thermostat control with enhanced metering
Providing customers with either real time or critical peak pricing via a communication technology Communication can be via wireless PLC or Internet Customers can also be provided with educational materials
Available Cost
Customer acceptance
Split incentives in deregulated markets
Regulatory barriers
Pilot and full-scale Programs
Used in congested areas
Customer education
Georgia (large users) Niagara Mohawk California Peak Pricing Experiment Gulf Power
Control of lighting via wireless power line carrier or other communication technologies
Using direct control to control commercial lighting during high price periods
Recently available Cost
Customer acceptance
Contractor acceptance
RampD programs
Pilot programs
SCE pilot using wireless
NYSERDA pilot with power line carrier control
T-5s Relatively new lighting technology for certain applications
Widely available Cost
Customer acceptance
Contractor acceptance
Add to existing programs as a new measure
Included in most large-scale programs
New generation tankless water heaters
Tankless water heaters do not have storage tanks and do not have standby losses They can save energy relative to conventional water heaters in some applications Peak demand implications are not yet known
Widely available Cost
Customer acceptance
Contractor acceptance
Add to existing programs as a new measure
More common in the EU
Some load control technologies will require more than bull Interactive communications Interactive communica-RampD activities to become widespread To fully capture tions that allow for two-way flow of price information
and utilize some of these technologies the following and decisions would add new functionality to the
four building blocks are needed electricity system
To create a sustainable aggressive national commitment to energy efficiency 6-27
bull Innovative rates and regulation Regulations are needed to provide adequate incentives for energy efficiency investments to both suppliers and customers
bull Innovative markets Market design must ensure that energy efficiency and load response measures that are advanced by regulation become self-sustaining in the marketplace
bull Smart end-use devices Smart devices are needed to respond to price signals and facilitate the management of the energy use of individual and networked appliances
In addition the use of open architecture systems is the only long-term way to take existing non-communicating equipment into an energy-efficient future that can use two-way communications to monitor and diagnose appliances and equipment
Consider Efficiency Investments to Alleviate Transmission and Distribution Constraints
Energy efficiency has a history of providing value by reducshying generation investments It should also be considered with other demand-side resources such as demand response as a potential resource to defer or avoid investshyments in transmission and distribution systems Pacific Gas and Electricrsquos (PGampE) Model Energy Communities Project (the Delta Project) provides one of the first examples of this approach This project was conceived to test whether demand resources could be used as a least cost resource to defer the capital expansion of the transmission and distribushytion system in a constrained area In this case efforts were focused on the constrained area and customers were offered versions of existing programs and additional measshyures to achieve a significant reduction in the constrained area (PGampE 1993) A recently approved settlement at the Federal Energy Regulatory Commission (FERC) allows energy efficiency along with load response and distributed generashytion to participate in the Independent System Operator New England (ISO-NE) Forward Capacity Market (FERC 2006 FERC 2005) In addition Consolidated Edison has successshyfully used a Request For Proposals (RFP) approach to defer distribution upgrades in four substation areas with contracts
totaling 45 MW Con Ed is currently in a second round of solicitations for 150 MW (NAESCO 2005) Recent pilots using demand response energy efficiency and intelligent grid are proving promising as shown in the BPA example in the box on page 6-29
To evaluate strategies for deferring transmission and distribushytion investments the benefits and costs of energy efficiency and other demand resources are compared to the cost of deferring or avoiding a distribution or transmission upgrade (such as a substation upgrade) in a constrained area This cost balance is influenced by location-specific transmission and distribution costs which can vary greatly
Create a Roadmap of Key Program Components Milestones and Explicit Energy Use Reduction Goals
Decisions regarding the key considerations discussed throughout this section are used to inform the developshyment of an energy efficiency plan which serves as a roadmap with key program components milestones and explicit energy reduction goals
A well-designed plan includes many of the elements disshycussed in this section including
bull Budgets (see section titled ldquoLeverage Private-Sector Expertise External Funding and Financingrdquo for informashytion on the budgeting processes for the most common policy models)
mdash Overall
mdash By program
bull Kilowatt kWh and Mcf savings goals overall and by program
mdash Annual savings
mdash Lifetime savings
bull Benefits and costs overall and by program
bull Description of any shareholder incentive mechanisms
6-28 National Action Plan for Energy Efficiency
Bonneville Power Administration (BPA) Transmission Planning
BPA has embarked on a new era in transmission planning As plans take shape to address load growth constraints and congestion on the transmisshysion system BPA is considering measures other than building new lines while maintaining its commitshyment to provide reliable transmission service The agency along with others in the region is exploring ldquonon-wires solutionsrdquo as a way to defer large construction projects
BPA defines non-wires solutions as the broad array of alternatives including but not limited to demand response distributed generation conservation measshyures generation siting and pricing strategies that individually or in combination delay or eliminate the
For each program the plan should include the following
bull Program design description
bull Objectives
bull Target market
bull Eligible measures
bull Marketing plan
bull Implementation strategy
bull Incentive strategy
bull Evaluation plan
bull Benefitcost outputs
bull Metrics for program success
bull Milestones
The plan serves as a road-map for programs Most proshygram plans however are modified over time based on
need for upgrades to the transmission system The industry also refers to non-wires solutions as non-construction alternatives or options
BPA has reconfigured its transmission planning process to include an initial screening of projects to assess their potential for a non-wires solution BPA is now committed to using non-wires solutions screening criteria for all capital transmission projects greater than $2 million so that it becomes an institutionalshyized part of planning BPA is currently sponsoring a number of pilot projects to test technologies resolve institutional barriers and build confidence in using non-wires solution
changing conditions (eg utility supply or market changes) and program experience Changes from the original roadmap should be both documented and justified A plan that includes all of these elements is an appropriate startshying point for a regulatory filing A well-documented plan is also a good communications vehicle for informing and educating stakeholders The plan should also include a description of any pilot programs and RampD activities
Energy Efficiency Program Design
and Delivery
The organizations reviewed for this chapter have learned that program success is built over time by understanding the markets in which efficient products and services are delivered by addressing the wants and needs of their customers by establishing relationships with customers and suppliers and by designing and delivering programs accordingly
bull They have learned that it is essential to program sucshycess to coordinate with private market actors and other influential stakeholders to ensure that they are well informed about program offerings and share this information with their customersconstituents
To create a sustainable aggressive national commitment to energy efficiency 6-29
bull Many of the organizations reviewed go well beyond merely informing businesses and organizations by actually partnering with them in the design and delivery of one or more of their efficiency programs
bull Recognizing that markets are not defined by utility service territory many utilities and other third-party program administrators actively cooperate with one another and with national programs such as ENERGY STAR in the design and delivery of their programs
This section discusses key best practices that emerge from a decade or more of experience designing and implementing energy efficiency programs
Begin With the Market in Mind
Energy efficiency programs should complement rather than compete with private and other existing markets for energy efficient products and services The rationale for utility or third-party investment in efficiency programshyming is usually based on the concept that within these markets there are barriers that need to be overcome to ensure that an efficient product or service is chosen over a less efficient product or standard practice Barriers might include higher initial cost to the consumer lack of knowledge on the part of the supplier or the customer split incentives between the tenant who pays the utility bills and the landlord who owns the building lack of supply for a product or service or lack of time (eg to research efficient options seek multiple bidsmdashparticularly during emergency replacements)
Conduct a Market Assessment
Understanding how markets function is a key to successful program implementation regardless of whether a program is designed for resource acquisition market transformashytion or a hybrid approach A market assessment can be a valuable investment to inform program design and impleshymentation It helps establish who is part of the market (eg manufacturers distributors retailers consumers) what the key barriers are to greater energy efficiency from the producer or consumer perspectives who are the key trend-setters in the business and the key influencers in
consumer decision-making and what approaches might work best to overcome barriers to greater supply and investment in energy efficient options andor uptake of a program A critical part of completing a market assessment is a baseline measurement of the goods and services involved and the practices attitudes behaviors factors and conditions of the marketplace (Feldman 1994) In addition to informing program design and implementashytion the baseline assessment also helps inform program evaluation metrics and serves as a basis for which future program impacts are measured As such market assessshyments are usually conducted by independent third-party evaluation professionals The extent and needs of a market assessment can vary greatly For well-established program models market assessments are somewhat less involved and can rely on existing program experience and literature with the goal of understanding local differences and estabshylishing the local or regional baseline for the targeted energy efficiency product or service
Table 6-10 illustrates some of the key stakeholders barshyriers to energy efficiency and program strategies that are explored in a market assessment and are useful for considering when designing programs
Solicit Stakeholder Input
Convening stakeholder advisory groups from the onset as part of the design process is valuable for obtaining multiple perspectives on the need and nature of planned programs This process also serves to improve the proshygram design and provides a base of program support within the community
Once programs have been operational for a while stakeshyholder groups should be reconvened to provide program feedback Stakeholders that have had an ongoing relationshyship with one or more of the programs can provide insight on how the programs are operating and perceived in the community and can recommend program modifications They are also useful resources for tapping into extended networks beyond those easily accessible to the program providers For example contractors building owners and building operators can be helpful in providing access to their specific trade or business organizations
6-30 National Action Plan for Energy Efficiency
Table 6-10 Key Stakeholders Barriers and Program Strategies
by Customer Segment
Customer Segment Key Stakeholders Key Program Barriers Key Program Strategies
Large Commercial amp Industrial Retrofit
Contractors Building owners and operators Distributors lighting HVAC motors other Product manufacturers Engineers Energy services companies
Access to capital Competing priorities Lack of information Short-term payback (lt2 yr) mentality
Financial incentives (rebates) Performance contracting Performance benchmarking Partnership with ENERGY STAR Low interest financing Information from unbiased sources Technical assistance Operations and maintenance training
Small Commercial
Distributors lighting HVAC other Building owners Business owners Local independent trades
Access to capital Competing priorities Lack of information
Financial incentives (rebates) Information from unbiased sources Direct installation Partnership with ENERGY STAR
Commercial amp Industrial New Construction
Architects Engineers Building and energy code officials Building owners Potential occupants
Projectprogram timing Competing priorities Split incentives (for rental property) Lack of information Higher initial cost
Early intervention (ID requests for hook-up) Design assistance Performance targetingbenchmarking Partnership with ENERGY STAR Training of architects and engineers Visible and ongoing presence in design
community Education on life cycle costs
Residential Existing Homes
Distributors appliances HVAC lighting Retailers appliance lighting windows Contractors HVAC insulation remodeling Homeowners
Higher initial cost Lack of information Competing priorities Inexperience or prior negative experience
wtechnology (eg early compact florescent lighting)
Emergency replacements
Financial incentives Partnership with ENERGY STAR Information on utility Web sites bill inserts
and at retailers Coordination with retailers and contractors
Residential New Homes
Contractors general and HVAC Architects Code officials Builders Home buyers Real estate agents Financial institutions
Higher initial cost Split incentives builder is not the
occupant
Partnership with ENERGY STAR Linking efficiency to quality Working with builders Building code education amp compliance Energy efficient mortgages
Multifamily Owners and operators Contractors Code officials Tenants
Split incentives Lack of awareness
Financial incentives Marketing through owner and operator
associations
Low Income Service providers Weatherization Assistance Program (WAP) Low-Income Home Energy Assistance Program (LIHEAP)
Social service providers state and local agencies
NGOs and advocacy groups Credit counseling organizations Tenants
Program funding Program awareness Bureaucratic challenges
Consistent eligibility requirements with existing programs
Direct installation Leveraging existing customer channels for
promotion and delivery Fuel blind approach
To be successful stakeholder groups should focus on the big picture be well organized and be representative Stakeholder groups usually provide input on budgets allocation of budgets sectors to address program design evaluation and incentives
Listen to Customer and Trade Ally Needs
Successful energy efficiency programs do not exist without customer and trade ally participation and acceptance of these technologies Program designs should be tested with customer market research before finalizing offerings Customer research could include surveys focus groups
To create a sustainable aggressive national commitment to energy efficiency 6-31
Best Practice Solicit Stakeholder Input
Minnesotas Energy Efficiency Stakeholder Process exemplifies the best practice of engaging stakeshyholders in program design The Minnesota Public Utility Commission hosted a roundtable with the commission utilities and other stakeholders to review programs Rate implications and changes to the programs are worked out through this collaboshyrative and drive program design (MPUC 2005)
Successful stakeholder processes generally have the following attributes
bull Neutral facilitation of meetings
bull Clear objectives for the group overall and for each meeting
bull Explicit definition of stakeholder groups role in program planning (usually advisory only)
bull Explicit and fair processes for providing input
bull A timeline for the stakeholder process
forums and in-depth interviews Testing of incentive levels and existing market conditions by surveying trade allies is critical for good program design
Use Utility Channels and Brand
Utilities have existing channels for providing information and service offerings to their customers These include Web sites call centers bill stuffers targeted newsletters as well as public media Using these channels takes advantage of existing infrastructure and expertise and provides customers with energy information in the way that they are accustomed to obtaining it These methods reduce the time and expense of bringing information to customers In cases where efficiency programming is delivered by a third party gaining access to customer data and leveraging existing utility channels has been highly valuable for program design and implementation In cases such as Vermont (where the utilities are not responsible for running programs) it has been helpful to have linkages from the utility Web sites to Efficiency Vermontrsquos programs and to establish Efficiency Vermont
as a brand that the utilities leverage to deliver information about efficiency to their customers
Promote the Other Benefits of Energy Efficiency
and Energy Efficient Equipment
Most customers are interested in reducing energy conshysumption to save money Many however have other motivations for replacing equipment or renovating space that are consistent with energy efficiency improvements For example homeowners might replace their heating system to improve the comfort of their home A furnace with a variable speed drive fan will further increase comshyfort (while saving energy) by providing better distribution of both heating and cooling throughout the home and reducing fan motor noise It is a best practice for proshygram administrators to highlight these features where non-energy claims can be substantiated
Coordinate With Other Utilities and Third-Party
Program Administrators
Coordination with other utilities and third-party program administrators is also important Both program allies and customers prefer programs that are consistent across states and regions This approach reduces transaction costs for customers and trade allies and provides consisshytent messages that avoid confusing the market Some programs can be coordinated at the regional level by entities such as Northeast Energy Efficiency Partnership (NEEP) the Northwest Energy Efficiency Alliance and the Midwest Energy Efficiency Alliance Figure 6-1 illustrates the significant impact that initiative sponsors of the Northeast Lighting and Appliance Initiative (coordinated regionally by NEEP) have been able to have on the marshyket for energy-efficient clothes washers by working in coordination over a long time period NEEP estimates the program is saving an estimated 36 million kWh per year equivalent to the annual electricity needs of 5000 homes (NEEP undated)
Similarly low-income programs benefit from coordinashytion with and use of the same eligibility criteria as the federal Low-Income Home Energy Assistance Program (LIHEAP) or Weatherization Assistance Program (WAP) These programs have existing delivery channels that can
6-32 National Action Plan for Energy Efficiency
Figure 6-1 Impacts of the Northeast Lighting and Appliance Initiative
Perc
ent
of
ENER
GY
STA
R C
loth
es W
ash
er S
ales 1
09
08
07
06
05
04
03
02
01
0 1998 1999 2000 2001 2002 2003 2004 2005 2006 2007
Sponsor states with initiative Standard takes effect 2007 Federal Minimum Efficiency
National average
Sponsor states absent initiative Sponsor states (with initiative)
2003 National clothes washers campaign kicks off
2004 More stringent ENERGY STAR spec takes effect
1998 6 manufacturers 2002 18 manufacturers 15 qualified products 99 qualified products
National Average
2001 Whirlpool enters market
1998 Regional initiative begins
Sponsor states (absent initiative)
be used to keep program costs down while providing substantial benefit to customers On average weathershyization reduces heating bills by 31 percent and overall energy bills by $274 per year for an average cost per home of $2672 per year Since 1999 DOE has been encouraging the network of weatherization providers to adopt a whole-house approach whereby they approach residential energy efficiency as a system rather than as a collection of unrelated pieces of equipment (DOE 2006) The Long Island Power Authorityrsquos (LIPA) program shown at right provides an example
Leverage the National ENERGY STAR Program
Nationally ENERGY STAR provides a platform for proshygram implementation across customer classes and defines voluntary efficiency levels for homes buildings and products ENERGY STAR is a voluntary public-private partnership designed to reduce energy use and related greenhouse gas emissions The program administered by the US Environmental Protection Agency (EPA) and the DOE has an extensive network of partners including equipment manufacturers retailers builders ESCOs prishyvate businesses and public sector organizations
Since the late 1990s EPA and DOE have worked with utilities state energy offices and regional nonprofit organizations to help leverage ENERGY STAR messaging
tools and strategies to enhance local energy efficiency programs Today more than 450 utilities (and other effishyciency program administrators) servicing 65 percent of US households participate in the ENERGY STAR program (See box on page 6-34 for additional information) New Jersey and Minnesota provide examples of states that have leveraged ENERGY STAR
Long Island Power Authority (LIPA)Residential Energy AffordabilityPartnership Program (REAP)
This program provides installation of comprehenshysive electric energy efficiency measures and energy education and counseling The program targets customers who qualify for DOErsquos Low-Income Weatherization Assistance Program (WAP) as well as electric space heating and cooling customers who do not qualify for WAP and have an income of no more than 60 percent of the median houseshyhold income level LIPArsquos REAP program has saved 25 MW and 21520 MWh 1999 to 2004 with spending of $124 million
Source LIPA 2004
To create a sustainable aggressive national commitment to energy efficiency 6-33
bull New Jerseys Clean Energy Program The New Jersey Board of Public Utilities Office of Clean Energy has incorshyporated ENERGY STAR tools and strategies since the inception of its residential products and Warm Advantage (gas) programs Both programs encourage customers to purchase qualified lighting appliances windows proshygrammable thermostats furnaces and boilers The New
ENERGY STAR Program Investments
In support of the ENERGY STAR program EPA and DOE invest in a portfolio of energy efficiency efforts that utilities and third-party program administrators can leverage to further their local programs including
bull Education and Awareness Building ENERGY STAR sponsors broad-based public campaigns to educate consumers on the link between energy use and air emissions and to raise awareness about how products and services carrying the ENERGY STAR label can protect the environment while saving money
bull Establishing Performance Specifications and Performing Outreach on Efficient Products More than 40 product categories include ENERGY STAR-qualifying models which ENERGY STAR promotes through education campaigns information exchanges on utility-retailer program models and extensive online resources Online resources include qualifying product lists a store locator and information on product features
bull Establishing Energy Efficiency Delivery Models to Existing Homes ENERGY STAR assistance includes an emphasis on home diagnostics and evaluation improvements by trained techniciansbuilding proshyfessionals and sales training It features online consumer tools including the Home Energy Yardstick and Home Energy Advisor
Jersey Clean Energy Program also educates consumers retailers builders contractors and manufacturers about ENERGY STAR In 2005 New Jerseys Clean Energy Program saved an estimated 60 million kWh of elecshytricity 16 million therms of gas and 45000 tons of carbon dioxide (CO2)
bull Establishing Performance Specifications and Performing Outreach for New Homes ENERGY STAR offers builder recruitment materials sales toolkits consumer messaging and outreach that help support builder training consumer education and verification of home performance
bull Improving the Performance of New and Existing Commercial Buildings EPA has designed an Energy Performance Rating System to measure the energy performance at the whole-building level to help go beyond a component-by-component approach that misses impacts of design sizing installation controls operation and maintenance EPA uses this tool and other guidance to help building owners and utility programs maximize energy savings
Additional information on strategies tools and resources by customer segment is provided in the fact sheet ldquoENERGY STARmdashA Powerful Resource for Saving Energyrdquo which can be downloaded from wwwepagovcleanenergypdfnapee_energystarshyfactsheetpdf
6-34 National Action Plan for Energy Efficiency
bull Great River Energy Minnesota In 2005 Great River Energy emphasized cost-effective energy conservation by offering appliance rebates to cooperative members who purchase ENERGY STAR qualifying refrigerators clothes washers and dishwashers Great River provided its memshyber cooperatives with nearly $2 million for energy consershyvation rebates and grants including the ENERGY STAR rebates as a low-cost resource alternative to building new peaking generation In addition to several off-peak proshygrams Great River Energys residential DSMconservashytion program consists of
mdash Cycled air conditioning
mdash Interruptible commercial load responsemanagement
mdash Interruptible irrigation
mdash Air and ground source heat pumps
mdash ENERGY STAR high-efficiency air conditioning rebate
mdash ENERGY STAR appliance rebates
mdash ENERGY STAR compact fluorescent lamp rebate
mdash Low-income air conditioning tune-ups
mdash Residential and commercial energy audits
Keep Participation Simple
Successful programs keep participation simple for both customers and trade allies Onerous or confusing particshyipation rules procedures and paperwork can be a major deterrent to participation from trade allies and cusshytomers Applications and other forms should be clear and require the minimum information (equipment and customer) to confirm eligibility and track participation by customer for measurement and verification (MampV) purshyposes Given that most energy efficiency improvements are made at the time of either equipment failure or retrofit timing can be critical A program that potentialshyly delays equipment installation or requires customer or contractor time for participation will have fewer
A Seattle City Light Example of aSimple Program
Seattle City Lightrsquos $mart Business program offers a ldquoper-fixturerdquo rebate for specific fixtures in existing small businesses Customers can use their own licensed electrical contractor or select from a pre-approved contractor list Seattle City Light provides the rebate to either the installer or participating customer upon completion of the work Completed work is subject to onsite verification
Since 1986 Seattle City Lightrsquos $mart Business program has cumulative savings (for all measshyures) of 70382 MWh and 2124 MW
Source Seattle City Light 2005
participants (and less support from trade allies) Seattle City Lightrsquos program shown above has two paths for easy participation
Keep Funding (and Other Program Characteristics)
as Consistent as Possible
Over time both customers and trade allies become increasingly aware and comfortable with programs Disruptions to program funding frustrate trade allies who cannot stock appropriately or are uncomfortable making promises to customers regarding program offershyings for fear that efficiency program administrators will be unable to deliver on services or financial incentives
Invest in Education Training and Outreach
Some of the key barriers to investment in energy efficiency are informational Education outreach and training should be provided to trade allies as well as customers Some programs are information-only programs some programs have educational components integrated into the program design and budget and in some cases education is budgeted and delivered somewhat independently of specific programs In general standshyalone education programs do not comprise more than
To create a sustainable aggressive national commitment to energy efficiency 6-35
10 percent of the overall energy efficiency budget but information training and outreach might comprise a larger portion of some programs that are designed to affect long-term markets when such activities are tied to explicit uptake of efficiency measures and practices This approach might be particularly applicable in the early years of implementation when information and training are most critical for building supply and demand for products and services over the longer term KeySpan and Flex Your Power are examples of coordinating education training and outreach activities with programs
Leverage Customer Contact to Sell Additional Efficiency
and Conservation Measures
Program providers can take advantage of program contact with customers to provide information on other program
KeySpan Example
KeySpan uses training and certification as critical parts of its energy efficiency programs KeySpan provides building operator certification training provides training on the Massachusetts state building code and trains more than 1000 trade allies per year
Source Johnson 2006
California Flex Your Power Campaign
The California Flex Your Power Campaign was inishytiated in 2001 in the wake of Californiarsquos rolling black-outs While initially focused on immediate conservation measures the campaign has transishytioned to promoting energy efficiency and long-term behavior change The program coordinates with the national ENERGY STAR program as well as the California investor-owned utilities to ensure that consumers are aware of energy efficiency options and the incentives available to them through their utilities
offerings as well as on no or low-cost opportunities to reduce energy costs Information might include proper use or maintenance of newly purchased or installed equipment or general practices around the home or workplace for efficiency improvements Education is often included in low-income programs which generally include direct installation of equipment and thus already include in-home interaction between the program provider and customer The box below provides some additional considerations for low-income programs
Leverage Private-Sector Expertise External Funding
and Financing
Well-designed energy efficiency programs leverage external funding and financing to stretch available dollars and to take advantage of transactions as they occur in
Low-Income Programs
Most utilities offer energy efficiency programs targeted to low-income customers for multiple reasons
bull Low-income customers are less likely to take advantage of rebate and other programs because they are less likely to be purchasing appliances or making home improvements
bull The ldquoenergy burdenrdquo (percent of income spent on energy) is substantially higher for low-income customers making it more difficult to pay bills Programs that help reduce energy costs reduce the burden making it easier to maintain regular payments
bull Energy efficiency improvements often increase the comfort and safety of these homes
bull Utilities have the opportunity to leverage federal programs such as LIHEAP and WAP to provide comprehensive services to customers
bull Low-income customers often live in less efficient housing and have older less efficient appliances
bull Low-income customers often comprise a subshystantial percentage (up to one-third) of utility residential customers and represent a large potential for efficiency and demand reduction
bull Using efficiency education and incentives in conjunction with credit counseling can be very effective in this sector
6-36 National Action Plan for Energy Efficiency
the marketplace This approach offers greater financial incentives to the consumer without substantially increasshying program costs It also has some of the best practice attributes discussed previously including use of existing channels and infrastructure to reach customers The folshylowing are a few opportunities for leveraging external funding and financing
bull Leverage Manufacturer and Retailer Resources Through Cooperative Promotions For example for mass market lighting and appliance promotions many program administrators issue RFPs to retailers and manufacturers asking them to submit promotional ideas These RFPs usually require cost sharing or in-kind advertising and promotion as well as requirements that sales data be provided as a condition of the contract This approach allows competitors to differentiate themselves and market energy efficiency in a way that is compatible with their business model
bull Leverage State and Federal Tax Credits Where Available Many energy efficiency program administrators are now pointing consumers and businesses to the new federal tax credits and incorporating them in their proshygrams In addition program administrators can edushycate their customers on existing tax strategies such as accelerated depreciation and investment tax strategies to help them recoup the costs of their investments faster Some states offer additional tax credits andor offer sales tax ldquoholidaysrdquo where sales tax is waived at point of sale for a specified period of time ranging from one day to a year The North Carolina Solar Center maintains a database of efficiency incentives including state and local tax incentives at wwwdsireusaorg
bull Build on ESCO and Other Financing Program Options This is especially useful for large commercial and industrial projects
The NYSERDA and California programs presented at right and on the following page are both good examples of leveraging the energy services market and increasing ESCO presence in the state
New York Energy $mart Commercial Industrial Performance Program
The New York Energy $mart CommercialIndustrial Performance Program which is administered by NYSERDA is designed to promote energy savings and demand reduction through capital improveshyment projects and to support growth of the energy service industry in New York state Through the program ESCOs and other energy service providers receive cash incentives for completion of capital projects yielding verifiable energy and demand savings By providing $111 million in pershyformance-based financial incentives this nationally recognized program has leveraged more than $550 million in private capital investments MampV ensures that electrical energy savings are achieved Since January 1999 more than 860 projects were completed in New York with an estimatshyed savings of 790 million kWhyr
Sources Thorne-Amann and Mendelsohn 2005 AESP 2006
bull Leverage Organizations and Outside Education and Training Opportunities Many organizations provide education and training to their members sometimes on energy efficiency Working with these organizations provides access to their members and the opportunity to leverage funding or marketing opportunities provided by these organizations
In addition the energy efficiency contracting industry has matured to the level that many proven programs have been ldquocommoditizedrdquo A number of private firms and not-for-profit entities deliver energy efficiency proshygrams throughout the United States or in specific regions of the country ldquoThe energy efficiency industry is now a $5 billion to $25 billion industry (depending on how expansive onersquos definition) with a 30-year history of developing and implementing all types of programs for
To create a sustainable aggressive national commitment to energy efficiency 6-37
California Non-Residential Standard Performance Contract (NSPC) Program
The California NSPC program is targeted at cusshytomer efficiency projects and is managed on a statewide basis by PGampE SCE and San Diego Gas amp Electric Program administrators offer fixed-price incentives (by end use) to project sponsors for measured kilowatt-hour energy savings achieved by the installation of energy efficiency measures The fixed price per kWh performance measurement protocols payment terms and other operating rules of the program are specified in a standard contract This program has helped to stimulate the energy services market in the state In program year 2003 the California NSPC served 540 cusshytomers and saved 336 gigawatt-hours and 654 million therms
Source Quantum Consulting Inc 2004
utilities and projects for all types of customers across the countryrdquo (NAESCO 2005) These firms can quickly get a program up and running as they have the expertise processes and infrastructure to handle program activishyties New program administrators can contract with these organizations to deliver energy efficiency program design delivery andor implementation support in their service territory
Fort Collins Utilities was able to achieve early returns for its Lighting with a Twist program (discussed on page 6shy39) by hiring an experienced implementation contractor through a competitive solicitation process and negotiating cooperative marketing agreements with national retail chains and manufacturers as well as local hardware stores
The Building Owners amp Managers Association (BOMA) Energy Efficiency Program
The BOMA Foundation in partnership with the ENERGY STAR program has created an innovative operational excellence program to teach property owners and managers how to reduce energy conshysumption and costs with proven no- and low-cost strategies for optimizing equipment people and practices The BOMA Energy Efficiency Program consists of six Web-assisted audio seminars (as well as live offerings at the BOMA International Convention) The courses are taught primarily by real estate professionals who speak in business vernacular about the process of improving performance The courses are as follows
bull Introduction to Energy Performance
bull How to Benchmark Energy Performance
bull Energy-Efficient Audit Concepts amp Economic Benefits
bull No- and Low-Cost Operational Adjustments to Improve Energy Performance
bull Valuing Energy Enhancement Projects amp Financial Returns
bull Building an Energy Awareness Program
The commercial real estate industry spends approximately $24 billion annually on energy and contributes 18 percent of the US CO2 emissions According to EPA and ENERGY STAR Partner observations a 30 percent reduction is readily achievable simply by improving operating standards
6-38 National Action Plan for Energy Efficiency
Fort Collins Utilities Lighting With a Twist
Fort Collins Utilities estimates annual savings of 2023 MWh of electricity with significant winter peak demand savings of 1850 kW at a total resource cost of $0018kWh from its Lighting with a Twist program which uses ENERGY STAR as a platform The program was able to get off to quick and successful start by hiring an experienced implementation contractor and negotiating cooperative marketing agreements with retailers and manufacturersmdashfacilitating the sale of 78000 compact fluorescent light bulbs through six retail outlets from October to December 2005 (Fort Collins Utilities et al 2005)
Start Simply With Demonstrated Program Models Build Infrastructure for the Future
Utilities starting out or expanding programs should look to other programs in their region and throughout the country to leverage existing and emerging best programs After more than a decade of experience running energy efficiency programs many successful program models have emerged and are constantly being refined to achieve even more cost-effective results
While programs must be adapted to local realities utilities and state utility commissions can dramatically reduce their learning curve by taking advantage of the wealth of data and experience from other organizations around the country The energy efficiency and services community has numerous resources and venues for sharing information and formally recognizing best practice programs The Association of Energy Service Professionals (wwwaesporg) the Association of Energy Engineers (wwwaeecenterorg) and the American Council for an Energy Efficient Economy (wwwaceeeorg) are a few of these resources Opportunities for education and information sharing are also provided via national federal programs such as ENERGY STAR (wwwenergystargov) and the Federal Energy
Management Program (wwweereenergygovfemp) Additional resources will be provided in Energy Efficiency Best Practices Resources and Expertise (a forthcoming product of the Leadership Group) Leveraging these resources will reduce the time and expense of going to market with new efficiency programs This will also increase the quality and value of the programs implemented
Start With Demonstrated Program Approaches That Can
Easily Be Adapted to New Localities
Particularly for organizations that are new to energy effishyciency programming or have not had substantial energy efficiency programming for many years it is best to start with tried and true programs that can easily be transferred to new localities and be up and running quickly to achieve near term results ENERGY STAR lighting and appliance proshygrams that are coordinated and delivered through retail sales channels are a good example of this approach on the residential side On the commercial side prescriptive incenshytives for technologies such as lighting packaged unitary heating and cooling equipment commercial food service equipment and motors are good early targets While issues related to installation can emerge such as design issues for lighting and proper sizing issues for packaged unitary heatshying and cooling equipment these technologies can deliver savings independent from how well the buildingrsquos overall energy system is managed and controlled In the early phase of a program offering prescriptive rebates is simple and can garner supplier interest in programs but as programs progress rebates might need to be reduced or transitioned to other types of incentives (eg cooperative marketing approaches customer referrals) or to more comprehensive approaches to achieving energy savings If the utility or state is in a tight supply situation it might make sense to start with proven larger scale programs that address critical load growth drivers such as increased air conditioning load from both increased central air conditioning in new construction and increased use of room air conditioners
Determine the Right Incentives and Levels
There are many types of incentives that can be used to spur increased investment in energy-efficient products and services With the exception of education and
To create a sustainable aggressive national commitment to energy efficiency 6-39
Table 6-11 Types of Financial Incentives
Financial Incentives Description
Prescriptive Rebate Usually a predetermined incentive payment per item or per kW or kWh saved Can be provided to the customer or a trade ally
Custom Rebate A rebate that is customized by the type of measures installed Can be tied to a specific payback criteria or energy savings Typically given to the customer
Performance Contracting Incentive A program administrator provides an incentive to reduce the risk premium to the ESCO installing the measures
Low Interest Financing A reduced interest rate loan for efficiency projects Typically provided to the customer
Cooperative Advertising Involves providing co-funding for advertising or promoting a program or product Often involves a written agreement
Retailer Buy Down A payment to the retailer per item that reduces the price of the product
MW Auction A program administrator pays a third party per MW andor per MWh for savings
training programs most programs offer some type of financial incentive Table 6-11 shows some of the most commonly used financial incentives Getting incentives right and at the right levels ensures program success and efficient use of resources by ensuring that programs do not ldquooverpayrdquo to achieve results The market assessment and stakeholder input process can help inform initial incentives and levels Ongoing process and impact evaluation (discussed below) and reassessment of cost-effectiveness can help inform when incentives need to be changed reduced or eliminated
Invest in the Service Industry Infrastructure
Ultimately energy efficiency is implemented by peoplemdash home performance contractors plumbers electricians architects ESCOs product manufacturers and othersmdash who know how to plan for and deliver energy efficiency to market
While it is a best practice to incorporate whole house and building performance into programs these proshygrams cannot occur unless the program administrator has a skilled supportive community of energy service professionals to call upon to deliver these services to market In areas of the country lacking these talents development of these markets is a key goal and critical part of the program design
In many marketsmdasheven those with well established effishyciency programsmdashit is often this lack of infrastructure or supply of qualified workers that prevents wider deployshyment of otherwise cost-effective energy efficiency programs Energy efficiency program administrators often try to address this lack of infrastructure through various program strategies including pilot testing programs that foster demand for these services and help create the business case for private sector infrastructure development and vocational training and outreach to universities with incentives or business referrals to spur technician training and certification
Examples of programs that have leveraged the ESCO industry were provided previously One program with an explicit goal of encouraging technical training for the residential marketplace is Home Performance with ENERGY STAR which is an emerging program model being implemented in a number of states including Wisconsin New York and Texas (see box on page 6-41 for an example) The program can be applied in the gas or electric context and is effective at reducing peak load because the program captures improvements in heating and cooling performance
6-40 National Action Plan for Energy Efficiency
Austin Energy Home Performance with ENERGY STAR
In Texas Austin Energyrsquos Home Performance with ENERGY STAR program focuses on educating cusshytomers and providing advanced technical training for professional home performance contractors to identify energy efficiency opportunities with an emphasis on safety customer comfort and energy savings Participating Home Performance contracshytors are given the opportunity to receive technical accreditation through the Building Performance Institute
Qualified contractors perform a top-to-bottom energy inspection of the home and make cusshytomized recommendations for improvements These improvements might include measures such as air-sealing duct sealing adding insulation installing energy efficient lighting and installing new HVAC equipment or windows if needed In 2005 Austin Energy served more than 1400 homeowners with an average savings per cusshytomer of $290 per year Collectively Austin Energy customers saved an estimated $410000 and more than 3 MW through the Home Performance with ENERGY STAR program
Source Austin Energy 2006
Evolve to More Comprehensive Programs
A sample of how program approaches might evolve over time is presented in Table 6-12 As this table illustrates programs typically start with proven models and often simpler approaches such as providing prescriptive rebates for multiple technologies in commercialindustrial existing building programs In addition early program options are offered for all customer classes and all of the programs deliver capacity benefits in addition to energy efficiency Ultimately the initial approach taken by a program administrator will depend on how quickly the program needs to ramp up and on the availability of
service industry professionals who know how to plan for and deliver energy efficiency to market
As program administrators gain internal experience and a greater understanding of local market conditions and regulators and stakeholders gain greater confidence in the value of the energy efficiency programs being offered program administrators can add complexity to the programs provided and technologies addressed The early and simpler programs will help establish internal relationships (across utility or program provider departshyments) and external relationships (between program providers trade allies and other stakeholders) Both the program provider and trade allies will better understand roles and relationships and trade allies will develop familiarity with program processes and develop trust in the programs Additional complexity can include alternative financing approaches (eg performance contracting) the inclusion of custom measures bidding programs whole buildings and whole home approaches or addishytional cutting edge technologies In addition once programs are proven within one subsector they can often be offered with slight modification to other sectors for example some proven residential program offerings might be appropriate for multi-family or low-income cusshytomers and some large commercial and industrial offerings might be appropriate for smaller customers or multifamily applications Many of the current ENERGY STAR market-based lighting and appliance programs that exist in many parts of the country evolved from customer-based lighting rebates with some in-store promotion Many of the more complex commercial and industrial programs such at NSTAR and National Gridrsquos Energy Initiative program evolved from lighting HVAC and motor rebate programs
The Wisconsin and Xcel Energy programs discussed on page 6-43 are also good examples of programs that have become more complex over time
Change Measures Over Time
Program success changing market conditions changes in codes and changes in technology require reassessing the measures included in a program High saturations in the market lower incremental costs more rigid codes or
To create a sustainable aggressive national commitment to energy efficiency 6-41
Table 6-12 Sample Progression of Program Designs
Sector Program Ramp Up Energy amp Environmental Co-Benefits (In Addition to kWh)
Early (6 Months -2 YRS)
Midterm (2-3 YRS)
Longer Term (3 To 7 YRS) Other Fuels
Peak (S = Summer W = Winter)
Water Savings Other
Residential Existing Homes
Market-based lighting amp appliance program
Home performance with ENERGY STAR pilot
Home performance with ENERGY STAR
HVAC rebate Add HVAC practices
X
X
X
S W
S W
S
X Bill savings and reduced emissions
Residential New Construction
ENERGY STAR Homes pilot (in areas without existing infrastructure)
ENERGY STAR Homes
Add ENERGY STAR Advanced Lighting Package
X S W
S W
X Bill savings and reduced emissions
Low-Income Education and coordination with weatherization programs
Direct install
Add home repair
X
X
W
S W X
Bill savings and reduced emissions
Improved bill payment
Improved comfort
Multifamily Lighting audits
Direct install X
S W
S W
Bill savings and reduced emissions
Commercial Existing Buildings
Lighting motors HVAC pumps refrigeration food service equipment prescriptive rebates
ESCO-type program
Custom measures
Comprehensive approach
S W
S W X
Bill savings and reduced emissions
Commercial New Construction
Lighting motors HVAC pumps refrigeration food service equipment prescriptive rebates Custom measures
and design assistance
S W
S W X
Bill savings and reduced emissions
Small Business Lighting and HVAC rebates
Direct install
S W
S W
Bill savings and reduced emissions
the availability of newer more efficient technologies are specific applications As barriers hindering customer all reasons to reassess what measures are included in a investment in a measure are reduced it might be appro-program Changes can be incremental such as limiting priate to lower or eliminate financial incentives altogether incentives for a specific measure to specific markets or It is not uncommon however for programs to continue
6-42 National Action Plan for Energy Efficiency
Wisconsin Focus on Energy Comprehensive Commercial Retrofit Program
Wisconsin Focus on Energyrsquos Feasibility Study Grants and Custom Incentive Program encourages commershycial customers to implement comprehensive multi-measure retrofit projects resulting in the long-term in-depth energy savings Customers implementing multi-measure projects designed to improve the whole building might be eligible for an additional 30 percent payment as a comprehensive bonus incentive The Comprehensive Commercial Retrofit Program saved 70414701 kWh 164 MW and 2 million therms from 2001 through 2005
Sources Thorne-Amann and Mendelsohn 2005 Wisconsin 2006
Xcel Energy Design Assistance
Energy Design Assistance offered by Xcel targets new construction and major renovation projects The program goal is to improve the energy efficiency of new construction projects by encouraging the design team to implement an integrated package of energy efficient strategies The target markets for the proshygram are commercial customers and small business customers along with architectural and engineering firms The program targets primarily big box retail public government facilities grocery stores health-care education and institutional customers The program offers three levels of support depending on project size For projects greater than 50000 square feet the program offers custom consulting For projshyects between 24000 and 50000 square feet the program offers plan review Smaller projects get a standard offering The program covers multiple HVAC lighting and building envelope measures The program also addresses industrial process motors and variable speed drives Statewide the Energy Design Assistance program saved 543 GWh and 153 MW at a cost of $53 million in 2003
Source Minnesota Office of Legislative Auditor 2005 Quantum Consulting Inc 2004
monitoring product and measure uptake after programs have ceased or to support other activities such as conshytinued education to ensure that market share for products and services are not adversely affected once financial incentives are eliminated
Pilot New Program Concepts
New program ideas and delivery approaches should be inishytially offered on a pilot basis Pilot programs are often very limited in duration geographic area sector or technology depending upon what is being tested There should be a specific set of questions and objectives that the pilot proshygram is designed to address After the pilot period a quick assessment of the program should be conducted to detershymine successful aspects of the program and any problem areas for improvement which can then be addressed in a more full-scale program The NSTAR program shown below is a recent example of an emerging program type that was originally started as a pilot
Table 6-13 provides a summary of the examples proshyvided in this section
NSTAR Electricrsquos ENERGY STARBenchmarking Initiative
NSTAR is using the ENERGY STAR benchmarking and portfolio manager to help its commercial cusshytomers identify and prioritize energy efficiency upgrades NSTAR staff assist the customer in using the ENERGY STAR tools to rate their building relative to other buildings of the same type and identify energy efficiency upgrades Additional support is provided through walk-through energy audits and assistance in applying for NSTAR financial incentive programs to implement efficiency measures
Ongoing support is available as participants monitor the impact of the energy efficiency improvements on the buildingrsquos performance
To create a sustainable aggressive national commitment to energy efficiency 6-43
Table 6-13 Program Examples for Key Customer Segments
Customer Program Program Program Description Program Model Key Best Segment Administrator Strategies Practices Proven Emerging
All Training and certification components
KeySpan KeySpanrsquos programs include a signifishycant certification and training composhynent This includes building operator certification building code training and training for HVAC installers Strategies include training and certification
X Donrsquot underinvest in education training and outreach Solicit stakeshyholder input Use utilities channels and brand
Commercial Industrial
Non-residential performance contracting program
California Utilities This program uses a standard contract approach to provide incentives for measured energy savings The key strategy is the provision of financial incentives
X Build upon ESCO and other financing program options Add program complexity over time Keep participation simple
Commercial Industrial New Construction
Energy design assistance
XCEL This program targets new construction and major renovation projects Key strategies are incentives and design assistance for electric saving end uses
X Keep participation simple Add complexity over time
Commercial Industrial
Custom incentive program
Wisconsin Focus on Energy
This program allows commercial and industrial customers to implement a wide array of measures Strategies include financial assistance and technical assistance
X Keep participation simple Add complexity over time
Large Commercial Industrial
NY Performance Contracting Program
NYSERDA Comprehensive Performance Contracting Program provides incenshytives for measures and leverages the energy services sector The predomishynant strategies are providing incenshytives and using the existing energy services infrastructure
X Does allow for technologies to be added over time
Leverage customer conshytact to sell additional measures Add program complexity over time Keep participation simple Build upon ESCO and other financing options
Large Commercial Industrial
ENERGY STAR Benchmarking
NSTAR NSTAR uses EPArsquos ENERGY STAR benchmarking and Portfolio Manager to assist customers in rating their buildings
X Coordinate with other programs Keep particishypation simple Use utility channels and brand Leverage ENERGY STAR
Small Commercial
Smart business Seattle City Light This program has per unit incentives for fixtures and is simple to participate in It also provides a list of pre-qualified contractors
X Use utility channels and brand Leverage cusshytomer contact to sell additional measures Keep funding consistent
Residential Flex Your Power California IOUrsquos This is an example of the CA utilities working together on a coordinated camshypaign to promote ENERGY STAR prodshyucts Lighting and appliances were among the measures promoted Strategies include incentives and advertising
X Donrsquot underinvest in edushycation training and outshyreach Solicit stakeholder input Use utilities chanshynels and brand Coordinate with other programs Leverage manshyufacturer and retailer resources Keep participashytion simple Leverage ENERGY STAR
Residential shyLow Income
Residential affordability program
LIPA Comprehensive low-income program that installs energy saving measures and also provides education Strategies are incentives and education
X Coordinate with other programs Keep participashytion simple Leverage customer contact to sell additional measures
6-44 National Action Plan for Energy Efficiency
Table 6-13 Program Examples for Key Customer Segments (continued)
Customer Segment
Program Program Administrator
Program Description Strategies
Program Model Key Best Practices
Proven Emerging
Residential Existing Homes
Home Performance with ENERGY STAR
Austin Energy Whole house approach to existing homes Measures include air sealing insulation lighting duct-sealing and replacing HVAC
X Start with proven modshyels Use utilities channels and brand Coordinate with other programs
Residential New Construction
ENERGY STAR Homes
Efficiency Vermont Comprehensive new construction proshygram based on a HERS rating system Measures include HVAC insulation lighting windows and appliances
X Donrsquot underinvest in education training and outreach Solicit stakeshyholder input Leverage state and federal tax credits Leverage ENERGY STAR
Residential Existing Homes
Residential program
Great River Coop Provides rebates to qualifying applishyances and technologies Also provides training and education to customers and trade allies Is a true dual-fuel program
X Start with proven modshyels Use utilities chanshynels and brand Coordinate with other programs
Residential Existing Homes
New Jersey Clean Energy Program
New Jersey BPU Provides rebates to qualifying applishyances and technologies Also provides training and education to customers and trade allies Is a true dual-fuel program
X Start with proven modshyels Coordinate with other programs
Commercial Existing
Education and training
BOMA Designed to teach members how to reduce energy consumption and costs through no- and low-cost strategies
X Leverage organizations and outside education and training opportunishyties Leverage ENERGY STAR
Ensuring Energy Efficiency
Investments Deliver Results
Program evaluation informs ongoing decision-making improves program delivery verifies energy savings claims and justifies future investment in energy efficiency as a reliable energy resource Engaging in evaluation during the early stages of program development can save time and money by identifying program inefficiencies and sugshygesting how program funding can be optimized It also helps ensure that critical data are not lost
The majority of organizations reviewed for this paper have formal evaluation plans that address both program processes and impacts The evaluation plans in general are developed consistent with the evaluation budget cycle and allocate evaluation dollars to specific programs and activities Process and impact evaluations are performed for each program early in program cycles As programs and portfolios mature process evaluations are less frequent than impact evaluations Over the maturation
period impact evaluations tend to focus on larger programs (or program components) and address more complex impact issues
Most programs have an evaluation reporting cycle that is consistent with the program funding (or budgeting) cycle In general savings are reported individually by sector and totaled for the portfolio Organizations use evaluation results from both process and impact evaluations to improve programs moving forward and adjust their portshyfolio of energy efficiency offerings based on evaluation findings and other factors Several organizations have adopted the International Performance Measurement and Verification Protocol (IPMVP) to provide guidelines for evaluation approaches California has its own set of forshymal protocols that address specific program types Key methods used by organizations vary based on program type and can include billing analysis engineering analysis metering sales data tracking and market effects studies
Table 6-14 summarizes the evaluation practices of a subset of the organizations reviewed for this study
To create a sustainable aggressive national commitment to energy efficiency 6-45
6-46 National Action Plan for Energy Efficiency
Tabl
e 6-
14 E
valu
atio
n A
ppro
ache
s N
YSER
DA
(NY)
Ef
fici
ency
Verm
ont
(VT)
Elec
tric
Uti
litie
sN
STA
R (M
A)
WI D
epar
tmen
t of
Adm
inis
trat
ion
(WI)
CA U
tilit
ies
(CA
) M
N E
lect
ric
and
Gas
Inve
stor
-O
wne
d U
tilit
ies
(MN
)
Bonn
evill
e Po
wer
Adm
inis
trat
ion
(ID
MT
OR
WA
)
Polic
y M
odel
SB
C w
sta
tead
min
istr
atio
n SB
C w
3rd
part
yad
min
istr
atio
n SB
C w
util
ityad
min
istr
atio
n SB
C w
sta
tead
min
istr
atio
n SB
C w
util
ityad
min
istr
atio
n IR
P an
d Co
nser
vatio
nIm
prov
emen
t Pro
gram
Re
gion
al P
lann
ing
Mod
el
Prog
ram
Fun
ding
Sou
rce
Annu
al a
ppro
pria
tion
8-ye
ar re
new
able
port
folio
sta
ndar
dpr
ogra
m 5
-yea
rpu
blic
ben
efit
prog
ram
s
Not
ava
ilabl
e SB
C SB
C ndash
elec
tric
rate
paye
rs
Not
ava
ilabl
e U
tiliti
es b
y or
der o
f sta
tele
gisl
atur
e to
spe
nd a
perc
ent o
f rev
enue
s on
effic
ienc
y pr
ogra
ms
Not
ava
ilabl
e
Prog
ram
Bud
geti
ng C
ycle
An
nual
3
year
s An
nual
from
SBC
An
nual
Cu
rren
t fun
ding
cyc
leis
3 y
ears
Pr
evio
uspe
riods
wer
e on
ly 2
year
s
Curr
ently
a 2
-yea
r cyc
le
but a
4-y
ear c
ycle
is re
cshyom
men
ded
Nat
ural
gas
subm
its p
lans
1 y
ear
elec
tric
ity th
e ne
xt
Depe
nden
t upo
n ra
te c
ase
can
be e
very
2 to
5 y
ears
Gen
eral
lyam
ortiz
ed a
nnua
lly
Eval
uati
on F
undi
ng C
ycle
An
nual
N
ot a
vaila
ble
Annu
al e
valu
atio
n is
alin
e ite
m in
bud
getin
gpr
oces
s
Annu
al
Ong
oing
eve
ry y
ear
Upc
omin
g co
ntra
cts
will
be
3 ye
ar e
valu
atio
nw
ith a
nnua
l rep
ortin
g
Fund
ed a
s ne
eded
Ev
alua
tion
fund
ed p
erio
dica
llyw
hen
nece
ssar
y St
artin
g to
do
mor
e fre
quen
t eva
luat
ions
than
in p
revi
ous
year
s
Eval
uati
on R
epor
ting
Cycl
e Q
uart
erly
and
annu
ally
An
nual
ly a
nd a
sne
eded
An
nual
ly b
ut n
ot e
very
prog
ram
eve
ry y
ear
Twic
e pe
r yea
r An
nual
An
nual
sta
tus
repo
rts
Not
ava
ilabl
e
Role
of
Dee
med
Sav
ings
(ie
pre
-det
erm
ined
sa
ving
s)
Estim
ate
savi
ngs
Prog
ram
pla
nnin
gan
d go
als
Estim
ate
savi
ngs
DOER
for r
epor
t to
legi
slat
ure
Pro
gram
plan
ning
and
des
ign
Estim
ate
savi
ngs
Prog
ram
plan
ning
and
goa
ls
Plan
ning
Inp
uts
for
TRC
anal
ysis
Adj
uste
d re
gula
rly b
ased
on
eval
uatio
n re
sults
Not
ava
ilabl
e De
term
ine
paym
ent s
ched
ule
for e
ffici
ency
mea
sure
s w
ithes
tabl
ishe
d sa
ving
s re
cord
s
Repo
rt G
ross
Sav
ings
(usu
ally
kW
h k
W)
No
No
Yes
Yes
Yes
Not
ava
ilabl
e Ye
s G
ross
sav
ings
form
s ba
sis
for r
egio
nal p
ower
pla
ns
Repo
rt N
et S
avin
gs(u
sual
ly k
Wh
kW
) Ye
s Ye
s Ye
s Ye
s Ye
s N
ot a
vaila
ble
Yes
Use
d to
eva
luat
e th
e ef
fishyci
ency
of m
easu
res
and
fine-
tune
pro
gram
s Sa
ving
s ne
tted
out d
epen
ds u
pon
prog
ram
Net
Sav
ings
Com
pone
nts
Inst
alla
tion
Verif
icat
ion
Yes
Yes
Yes
Yes
Not
ava
ilabl
e
Engi
neer
ing
Revi
ew
Yes
Yes
Yes
Yes
Not
ava
ilabl
e
Free
Rid
ersh
ip
Yes
Yes
Yes
Yes
Yes
Yes
Not
ava
ilabl
e
Spill
over
or M
arke
t Effe
cts
Yes
Yes
Yes
Yes
Yes
Not
ava
ilabl
e
Rete
ntio
n Ye
s Ye
s Ye
s Ye
s N
ot a
vaila
ble
Non
-Ene
rgy
Bene
fits
Yes
Yes
Not
ava
ilabl
e
Oth
er N
ot S
peci
fied
Yes
Tabl
e 6-
14 E
valu
atio
n A
ppro
ache
s (c
ontin
ued)
NYS
ERD
A(N
Y)
Effi
cien
cyVe
rmon
t(V
T)
Elec
tric
Uti
litie
sN
STA
R (M
A)
WI D
epar
tmen
t of
Adm
inis
trat
ion
(WI)
CA U
tilit
ies
(CA
) M
N E
lect
ric
and
Gas
Inve
stor
-O
wne
d U
tilit
ies
(MN
)
Bonn
evill
e Po
wer
Adm
inis
trat
ion
(ID
MT
OR
WA
)
Educ
atio
n an
d Tr
aini
ng in
EE B
udge
t Ye
s N
ot a
vaila
ble
Yes
Not
ava
ilabl
e Ye
s N
ot a
vaila
ble
Yes
Educ
atio
n an
d Tr
aini
ngEv
alua
ted
Yes
Not
ava
ilabl
e De
pend
s on
pro
gram
In
itial
yea
rs o
nly
Yes
Not
ava
ilabl
e N
o
Eval
uati
on F
undi
ng a
sPe
rcen
t of
Pro
gram
Budg
et
Not
ava
ilabl
e lt
1
2
8 in
crea
se fr
om 4
25
N
o m
ore
than
3
of
min
imum
effi
cien
cysp
endi
ng re
quire
men
t
lt1
Eval
uati
on B
udge
t N
ot a
vaila
ble
Not
ava
ilabl
e Va
ries
annu
ally
dep
ende
ntup
on p
roje
ct p
ortfo
lio a
ndot
her d
eman
ds
Not
Ava
ilabl
e $1
60M
M o
ver 3
yea
rs
Not
ava
ilabl
e $1
MM
Fina
ncia
l Eva
luat
ion
Inte
rnal
Stat
e Co
mpt
rolle
rCP
A
CPA
Inte
rnal
CPA
CP
A N
ot a
vaia
ble
Inte
rnal
Rev
iew
ed b
yDe
part
men
t of C
omm
erce
Re
view
ed b
y Le
gisl
atur
e
Inte
rnal
Cost
-Eff
ecti
vene
ssA
naly
sis
Yes
Yes
Yes
Yes
Yes
Yes
Yes
Tim
ing
Annu
ally
Tr
ienn
ially
Va
ries
annu
ally
dep
ende
ntup
on p
roje
ct p
ortfo
lio a
ndot
her d
eman
ds
Perio
dica
lly (l
ess
frequ
ent
than
fund
ing
cycl
e)
Not
ava
ilabl
e 2
year
s Pe
riodi
cally
Test
Use
d (R
IM T
RC U
tility
O
ther
) TR
C O
ther
U
tility
Cos
t Tes
t and
Soci
etal
Cos
t-Be
nefit
Test
TRC
Soci
etal
als
o in
clud
es
econ
omic
impa
cts
TRCP
AC (p
rogr
amad
min
istr
ator
test
) So
ciet
al U
tility
Par
ticip
ant
Rate
paye
r TR
C
Who
Eva
luat
es
Inde
pend
ent
eval
uato
rs
Inde
pend
ent
expe
rts
unde
r con
shytr
act t
o DP
S
Util
ities
man
age
inde
shype
nden
t eva
luat
ors
thro
ugh
RFP
proc
ess
One
inde
pend
ent t
eam
of
eval
uato
rs
Inde
pend
ent e
valu
ashyto
rs h
ired
for e
ach
proshy
gram
via
RFP
pro
cess
Depa
rtm
ent o
fCo
mm
erce
Leg
isla
ture
Aud
itCo
mm
issi
on i
f dee
med
ne
cess
ary
Inde
pend
ent e
valu
ator
s
Ove
rsig
ht o
f ev
alua
tion
N
YSER
DA
prov
ides
ong
oing
over
sigh
tPu
blic
Util
ities
Com
mis
sion
fina
lau
dien
ce
Depa
rtm
ent o
fPu
blic
Ser
vice
Ev
alua
tions
are
revi
ewed
in c
olla
bora
tive
and
filed
with
the
Mas
sach
uset
tsDe
part
men
t of
Tele
com
mun
icat
ions
and
Ener
gy
WI D
epar
tmen
t of
Adm
inis
trat
ion
Calif
orni
a Pu
blic
Util
ities
Com
mis
sion
and
CEC
Depa
rtm
ent o
f Com
mer
ce
Pow
er C
ounc
il
Prot
ocol
s IP
MVP
N
ot a
vaila
ble
Not
ava
ilabl
e N
one
Has
had
stat
ewid
e pr
oshyto
cols
for m
any
year
sN
ew p
roto
cols
wer
ere
cent
ly a
dopt
ed
Not
ava
ilabl
e IP
MVP
as
refe
renc
e
To create a sustainable aggressive national commitment to energy efficiency 6-47
Best practices for program evaluation that emerge from review of these organizations include the following
bull Budget plan and initiate evaluation from the onset
bull Formalize and document evaluation plans
bull Develop program tracking systems that are compatible with needs identified in evaluation plans
bull Conduct process evaluations to ensure that programs are working efficiently
bull Conduct impact evaluations to ensure that mid- and long-term goals are being met
bull Communicate evaluation results
Budget Plan and Initiate Evaluation From the Onset
A well-designed evaluation plan addresses program process and impact issues Process evaluations address issues associated with program delivery such as marketing staffing paperwork flow and customer interactions to understand how they can be improved to better meet program objectives Impact evaluations are designed to determine the energy or peak savings from the program Sometimes evaluations address other program benefits such as non-energy benefits to consumers water savings economic impacts or emission reductions Market research is often included in evaluation budgets to assist in assessing program delivery options and for establishing baselines An evaluation budget of 3 to 6 percent of proshygram budget is a reasonable spending range Often evalshyuation spending is higher in the second or third year of
ldquoWe should measure the performance of DSM programs in much the same way and with the same competence and diligence that we monitor the performance of power plantsrdquo
mdashEric Hirst (1990) Independent Consultant and Former Corporate Fellow Oak Ridge National Laboratory
a program Certain evaluation activities such as estabshylishing baselines are critical to undertake from the onset to ensure that valuable data are not lost
Develop Program and Project Tracking Systems That Support Evaluation Needs
A well-designed tracking system should collect sufficiently detailed information needed for program evaluation and implementation Data collection can vary by program type technologies addressed and customer segment however all program tracking systems should include
bull Participating customer information At a minimum create an unique customer identifier that can be linked to the utilityrsquos Customer Information System (CIS) Other customer or site specific information might be valuable
bull Measure specific information Record equipment type equipment size or quantity efficiency level and estimated savings
bull Program tracking information Track rebates or other program services provided (for each participant) and key program dates
bull All program cost information Include internal staffing and marketing costs subcontractor and vendor costs and program incentives
Efficiency Vermontrsquos tracking system incorporates all of these features in a comprehensive easy-to-use relational database that includes all program contacts including program allies and customers tracks all project savings and costs shows the underlying engineering estimates for all measures and includes billing data from all of the Vermont utilities
6-48 National Action Plan for Energy Efficiency
Conduct Process Evaluations to Ensure Programs Are Working Efficiently
Process evaluations are a tool to improve the design and delivery of the program and are especially important for newer programs Often they can identify improvements to program delivery that reduce program costs expedite program delivery improve customer satisfaction and better focus program objectives Process evaluation can also address what technologies get rebates or determine rebate levels Process evaluations use a variety of qualitashytive and quantitative approaches including review of proshygram documents in-depth interviews focus groups and surveys Customer research in general such as regular customer and vendor surveys provides program adminshyistrators with continual feedback on how the program is working and being received by the market
Conduct Impact Evaluations to Ensure Goals Are Being Met
Impact evaluations measure the change in energy usage (kWh kW and therms) attributable to the program They use a variety of approaches to quantify energy savshyings including statistical comparisons engineering estishymation modeling metering and billing analysis The impact evaluation approach used is a function of the budget available the technology(ies) addressed the certainty of the original program estimates and the level of estimated savings The appliance recycling example shown at right is an example of how process and impact evaluations have improved a program over time
Measurement and Verification (MampV)
The term ldquomeasurement and verificationrdquo is often used in regard to evaluating energy efficiency programs Sometimes this term refers to ongoing MampV that is incorporated into program operations such as telephone confirmation of installations by third-party installers or measurement of savings for selected projects Other times it refers to external (program operations) evaluations to document savings
California Residential ApplianceRecycling Program (RARP)
The California RARP was initially designed to remove older inefficient second refrigerators from participant households As the program matured evaluations showed that the potential for removing old second refrigerators from households had decreased substantially as a result of the program The program now focuses on pick-up of older refrigerators that are being replaced to keep these refrigerators out of the secondary refrigerator market
Organizations are beginning to explore the use of the EPA Energy Performance Rating System to measure the energy performance at the whole-building level complement traditional MampV measures and go beyond component- by-component approaches that miss the interactive impacts of design sizing installation controls and operation and maintenance
While most energy professionals see inherent value in providing energy education and training (lack of inforshymation is often identified as a barrier to customer and market actor adoption of energy efficiency products and practices) few programs estimate savings directly as a result of education efforts Until 2004 California assigned a savings estimate to the Statewide Education and Training Services program based on expenditures
Capturing the energy impacts of energy education proshygrams has proven to be a challenge for evaluators for several reasons First education and training efforts are often integral to specific program offerings For example training of HVAC contractors on sizing air conditioners might be integrated into a residential appliance rebate program Second education and training are often a small part of a program in terms of budget and estimated savings Third impact evaluation efforts might be expensive compared to the education and training budget and anticipated savings Fourth education and training efforts are not always designed to achieve direct benefits They are often designed to inform participants or market actors of program opportunities simply to familiarize them with energy efficiency options Most evaluations of
To create a sustainable aggressive national commitment to energy efficiency 6-49
Best Practices in Evaluation
bull Incorporating an overall evaluation plan and budget into the program plan
bull Adopting a more in-depth evaluation plan each program year
bull Prioritizing evaluation resources where the risks are highest This includes focusing impact evaluation activities on the most uncertain outcomes and highest potential savings New and pilot programs have the most uncertain outcomes as do newer technologies
bull Allowing evaluation criteria to vary across some program types to allow for education outreach and innovation
bull Conducting ongoing verification as part of the program process
energy education and training initiatives have focused on process issues Recently there have been impact evalshyuations of training programs especially those designed to produce direct energy savings such as Building Operator Certification
In the future energy efficiency will be part of emissions trading initiatives (such as the Regional Greenhouse Gas Initiative [RGGI]) and is likely to be eligible for payments for reducing congestion and providing capacity value such as in the ISO-NE capacity market settlement These emerging opportunities will require that evaluation methods become more consistent across states and regions which might necessitate adopting consistent protocols for project-level verification for large projects and standardizing sampling approaches for residential measures such as compact fluoshyrescent lighting This is an emerging need and should be a future area of collaboration across states
Communicate Evaluation Results to Key Stakeholders
Communicating the evaluation results to program administrators and stakeholders is essential to enhancing program effectiveness Program administrators need to understand evaluation approaches findings and espeshycially recommendations to improve program processes
bull Establishing a program tracking system that includes necessary information for evaluation
bull Matching evaluation techniques to the situation in regards to the costs to evaluate the level of precision required and feasibility
bull Maintaining separate staff for evaluation and for program implementation Having outside review of evaluations (eg state utility commission) especially if conducted by internal utility staff
bull Evaluating regularly to refine programs as needed (changing market conditions often require program changes)
and increase (or maintain) program savings levels Stakeholders need to see that savings from energy effishyciency programs are realized and have been verified independently
Evaluation reports need to be geared toward the audishyences reviewing them Program staff and regulators often prefer reports that clearly describe methodologies limitations and findings on a detailed and program level Outside stakeholders are more likely to read shorter evalshyuation reports that highlight key findings at the cusshytomer segment or portfolio level These reports must be written in a less technical manner and highlight the impacts of the program beyond energy or demand savings For example summary reports of the Wisconsin Focus on Energy programs highlight energy demand and therm savings by sector but also discuss the environshymental benefits of the program and the impacts of energy savings on the Wisconsin economy Because the public benefits budget goes through the state legislature the summary reports include maps of Wisconsin showing where Focus on Energy projects were completed Examples of particularly successful investments with the customerrsquos permission should be part of the evaluation These case studies can be used to make the success more tangible to stakeholders
6-50 National Action Plan for Energy Efficiency
Recommendations and Options
The National Action Plan for Energy Efficiency Leadership Group offers the following recommendations as ways to promote best practice energy efficiency programs and provides a number of options for consideration by utilishyties regulators and stakeholders
Recommendation Recognize energy efficiency as a high-
priority energy resource Energy efficiency has not been consistently viewed as a meaningful or dependable resource compared to new supply options regardless of its demonstrated contributions to meeting load growth Recognizing energy efficiency as a high priority energy resource is an important step in efforts to capture the benefits it offers and lower the overall cost of energy services to customers Based on jurisdictional objectives energy efficiency can be incorporated into resource plans to account for the long-term benefits from energy savshyings capacity savings potential reductions of air pollushytants and greenhouse gases as well as other benefits The explicit integration of energy efficiency resources into the formalized resource planning processes that exist at regional state and utility levels can help estabshylish the rationale for energy efficiency funding levels and for properly valuing and balancing the benefits In some jurisdictions existing planning processes might need to be adapted or new planning processes might need to be created to meaningfully incorporate energy efficiency resources into resource planning Some states have recshyognized energy efficiency as the resource of first priority due to its broad benefits
Option to Consider
bull Quantifying and establishing the value of energy effishyciency considering energy savings capacity savings and environmental benefits as appropriate
Recommendation Make a strong long-term commitshy
ment to cost-effective energy efficiency as a resource
Energy efficiency programs are most successful and provide the greatest benefits to stakeholders when appropriate policies are established and maintained over the long-term Confidence in long-term stability of the program
will help maintain energy efficiency as a dependable resource compared to supply-side resources deferring or even avoiding the need for other infrastructure investshyments and maintains customer awareness and support Some steps might include assessing the long-term potential for cost-effective energy efficiency within a region (ie the energy efficiency that can be delivered cost-effectively through proven programs for each customer class within a planning horizon) examining the role for cutting-edge initiatives and technologies estabshylishing the cost of supply-side options versus energy efficiency establishing robust MampV procedures and providing for routine updates to information on energy efficiency potential and key costs
Options to Consider
bull Establishing appropriate cost-effectiveness tests for a portfolio of programs to reflect the long-term benefits of energy efficiency
bull Establishing the potential for long-term cost-effective energy efficiency savings by customer class through proven programs innovative initiatives and cutting-edge technologies
bull Establishing funding requirements for delivering long-term cost-effective energy efficiency
bull Developing long-term energy saving goals as part of energy planning processes
bull Developing robust MampV procedures
bull Designating which organization(s) is responsible for administering the energy efficiency programs
bull Providing for frequent updates to energy resource plans to accommodate new information and technology
Recommendation Broadly communicate the benefits of
and opportunities for energy efficiency Experience shows that energy efficiency programs help customers save money and contribute to lower cost energy systems But these impacts are not fully documented nor
To create a sustainable aggressive national commitment to energy efficiency 6-51
recognized by customers utilities regulators and policy-makers More effort is needed to establish the business case for energy efficiency for all decision-makers and to show how a well-designed approach to energy efficiency can benefit customers utilities and society by (1) reducing customers bills over time (2) fostering financially healthy utilities (return on equity [ROE] earnings per share debt coverage ratios) and (3) contributing to positive societal net benefits overall Effort is also necessary to educate key stakeholders that although energy efficiency can be an important low-cost resource to integrate into the energy mix it does require funding just as a new power plan requires funding Further education is necessary on the impact that energy efficiency programs can have in concert with other energy efficiency policies such as building codes appliance standards and tax incentives
Options to Consider
bull Communicating the role of energy efficiency in lowering customer energy bills and system costs and risks over time
bull Communicating the role of building codes appliance standards tax and other incentives
Recommendation Provide sufficient and stable program
funding to deliver energy efficiency where cost-
effective Energy efficiency programs require consistent and long-term funding to effectively compete with energy supply options Efforts are necessary to establish this consistent long-term funding A variety of mechanisms have been and can be used based on state utility and other stakeholder interests It is important to ensure that the efficiency programs providers have sufficient proshygram funding to recover energy efficiency program costs and implement the energy efficiency that has been demonstrated to be available and cost-effective A number of states are now linking program funding to the achievement of energy savings
Option to Consider bull Establishing funding for multi-year periods
References
Alliance to Save Energy (2004 December 1) Alliance to Save Energyrsquos 2004 lsquoStars of Energy Efficiencyrsquo Bank of America Marriott International BPASCE EEIrsquos Kuhn DOErsquos Garman Alliance Founder Sen Charles Percy lthttpwwwaseorgcontent newsdetail1919gt
American Council for an Energy Efficiency Economy [ACEEE] (1998) Energy Efficiency and Economic Development in IllinoismdashStatewide Savings 2015
Association of Energy Services Professionals [AESP] (2006 February 6) AESP Annual Awards Program Presentation
Austin Energy (2004) 2004 Annual Report lthttpwwwaustinenergycomAbout20Us NewsroomReportsannualReportpdfgt
Austin Energy (2006) 2006 ENERGY STAR Awards Application
Balzar B (2006 February 21) Recent History and Successes Energy Efficiency amp Conservation State of Nevada Presentation to the Arkansas Public Service Commission
Blumstein C Goldman C amp Barbose G (2005 May) Who should administer energy-efficiency programs Energy Policy 33(8)1053-1067
Bonnville Power Administration (2004 May 27) BPA Strategy Map lthttpwwwbpagovcorporate about_BPAStrategycfmgt
California Clean Energy Fund [CCEF] (2005) About UsmdashOverview lthttpwwwcalceforgaboutindexaspgt
California Energy Commission (2001 October) California Standard Practice Manual Economic Analysis of Demand Side Programs and Projects lthttpwwwenergycagovgreenbuildingdocuments background07-J_CPUC_STANDARD_PRACTICE _MANUALPDFgt
California Public Utilities Commission [CPUC] (2006 April) California Energy Efficiency Evaluation Protocols Technical Methodological and Reporting Requirements for Evaluation Professionals lthttpwwwcalmacorgpublicationsEvaluatorsProt ocols_Final_AdoptedviaRuling_06-19-2006pdfgt
6-52 National Action Plan for Energy Efficiency
California Public Utilities Commission [CPUC] (2005 August 17) Interim Opinion Energy Efficiency Portfolio Plans and Program Funding Levels For 2006ndash2008mdashPhase 1 Issues lthttpwwwcpuccagov publishedcomment_decision48667-03htmP292_ 37591gt
Efficiency Vermont (2004) Working Together for an Energy Efficient Vermont 2004 Annual Report lthttpwwwefficiencyvermontcompages CommonAboutUsAnnualReportgt
Electric Power Research Institute [EPRI] (2006) IntelliGrid lthttpwwwepricomIntelliGridgt
Elliot R N amp Shipley A M (2005 April) Impacts of Energy Efficiency and Renewable Energy on Natural Gas Markets Updated and Expanded Analysis American Council for an Energy Efficient Economy Report E052
Feldman S (1994) Market Transformation Hot Topic or Hot Air ACEEE Summer Study on Energy Efficiency in Buildings Washington DC American Council for an Energy Efficient Economy [ACEEE]
Fort Collins Utilities APT amp EFI (2005) 2005 ENERGY STAR Awards Application
GDS Associates amp Quantum Consulting (2004 June) Independent Assessment of Conservation and Energy Efficiency Potential for Connecticut and the Southwest Connecticut Region
Geller H (2006 May) Catching Up Progress with Utility Energy Efficiency Programs in the Southwest Southwest Energy Efficiency Project [SWEEP]
Hirst E (1990) Measuring Performance Key to Successful Utility Demand-Side Management Programs Oak Ridge National Laboratory [ORNL]
ICF Consulting (2005 September) Avoided Costs of Energy in New England Due to Energy Efficiency Programs Presented to AESC Study Group
Johnson B (2006 April 27) Market Transformation as a Tool to Meet Natural Gas Savings Targets KeySpan Energy Delivery AESP Brown Bag Session Presentation
KEMA (2004) New Jersey Energy Efficiency and Distributed Generation Market Assessment
KEMA (2002 September) Californiarsquos Secret Energy Surplus The Potential for Energy Efficiency
KEMA amp XENERGY (2003a April) California Residential Sector Energy Efficiency Potential Study
KEMA amp XENERGY (2003b March) California Statewide Commercial Sector Natural Gas Energy Efficiency Potential Study
Komor P (2005 March) Ten Key Lessons Learned from Successful Energy Efficiency Programs Platts
Kushler M York D amp Witte P (2004 April) Five Years In An Examination of the First Half-Decade of Public Benefits Energy Efficiency Policies Washington DC American Council for an Energy Efficient Economy [ACEEE] lthttpwwwaceeeorgpubsu042htmgt
Kushler M York D amp Witte P (2003 December) Responding to the Natural Gas Crisis Americarsquos Best Natural Gas Energy Efficiency Programs Washington DC American Council for an Energy Efficient Economy
Long Island Power Authority (2004) LIPA Clean EnergyInitiative Annual Report 2004 Uniondale NY
Massachusetts Department of Telecommunications andEnergy [MDTE] (1998) Investigation by the DTEupon its own motion commencing a Notice ofInquiryRulemaking pursuant to 220 CMR sectsect200 et seg establishing the procedures to be folshylowed in electric industry restructuring by electric companies subject to GL c 164 (DPUDTE 96shy100)
Massachusetts Department of Telecommunications and Energy [MDTE] (1995) Investigation by the Department of Public Utilities on its own motion into electric industry restructuring (DPU 95-30)
Massachusetts Office of Consumer Affairs and Business Regulation Division of Energy Resources [Massachusetts] (2004 Summer) 2002 Energy Efficiency Activities A Report by the Division of Energy Resources An Annual Report to the Great and General Court on the Status of Energy Efficiency Activities in Massachusetts lthttpwwwmassgovdoerpub_infoee02shylongpdfgt
To create a sustainable aggressive national commitment to energy efficiency 6-53
Mills E and Livingston J (2005 November 11) Energy Traversing The Valley Of Death Forbes lthttpwwwforbescom20051117utilitiesshyemerging-tech-cz_1117energy_programshtmlgt
Minnesota Public Utilities Commission [MPUC] (2005 December 6) Next Generation of Energy Efficiency Initiatives in Minnesota Presentation lthttpwwwraponlineorgConferencesMinnesota NextGenerationofEnergyEfficiencyNotespdfgt
Minnesota Office of Legislative Auditor (2005) Evaluation Report Energy Conservation Improvement Program
National Association of Energy Service Companies [NAESCO] (2005) Industry Information Is it DeJa Vu All Over Again The Resurgence of DSM Bidding Programs
National Grid (2002 July 2) 2001 Commercial and Industrial Free-Ridership and Spillover Study
New York State Energy Research and Development Authority [NYSERDA] amp Optimal Energy Inc [OE] (2006) Gas Energy Resource Development Potential in Consolidated Edison Service Area Service Area Savings 2016
New York State Energy Research and Development Authority [NYSERDA] (2005a May) Annual Report for 2004 ndash Evaluation and Status Report to the Systems Benefits Advisory Group lthttpwwwnyserdaorgEnergy_Information05sbc reportaspgt
New York State Energy Research and Development Authority [NYSERDA] (2005b) Making a Difference Through Education 2004ndash2005 Annual Report lthttpwwwnyserdaorgpublications04-05annual reportaspgt
New York State Energy Research and Development Authority [NYSERDA] (2004 May) Annual Report for 2003 ndash Evaluation and Status Report to the Systems Benefits Advisory Group lthttpwwwnyserdaorgEnergy_Information04sbc reportaspgt
New York State Energy Research and Development Authority [NYSERDA]Optimal Energy Inc (2003) Energy Efficiency and Renewable Energy Resource Development Potential in New York State
Northeast Energy Efficiency Project [NEEP] (undated) The Northeast Residential ENERGY STAR Products Initiative
Northwest Power and Conservation Council [NWPCC] (2005 May) The Fifth Northwest Electric Power and Conservation Plan
Oak Ridge National Laboratory [ORNL] (2000) Scenarios for a Clean Energy Future
Pacific Gas and Electric [PGampE] (1993 September) The Model Energy Communities Program (the Delta Project) Summary of Lessons Learned
Puget Sound Energy (2003) Least Cost Plan Advisory GroupConservation Resource Advisory Group Meeting
Quantum Consulting Inc (2004 December) National Energy Efficiency Best Practices Study lthttpwwweebestpracticescomgt
RLW Analytics Inc amp Shel Feldman Management Consulting (2001 June 7) The Remaining Electric Energy Efficiency Opportunities in Massachusetts Prepared for Program Administrators and Massachusetts Division of Energy Resources lthttpwwwmassgovdoerpub_infoe3opdfgt
Sacramento Municipal Utility District [SMUD] (2004a) Benefiting Society and the Environment SMUD Public Good Report 2004 lthttpwwwsmudorgaboutreportsreport_pdfs2 004_PublicGoodspdfgt
Sacramento Municipal Utility District [SMUD] (2004b November 3) 2005 Budget Letter to Board of Directors
Seattle City Light (2005) Energy Conservation Accomplishments 1977-2004 Evaluation Unit Conservation Resources Division lthttpwww seattlegovlightConservecv5_pubhtmgt
Southern California Gas Company (2004 May) Energy Efficiency Programs Annual Summary and Technical Appendix ndash 2003 Results lthttpwwwsocalgascomregulatoryefficiencyrep orts2003shtmlgt
Southwest Energy Efficiency Project [SWEEP] (2006 January) Natural Gas Demand-Side Management Programs A National Survey
6-54 National Action Plan for Energy Efficiency
Southwest Energy Efficiency Project [SWEEP] (2002 November) The New Mother Lode The Potential for More Efficient Electricity Use in the Southwest
Swisher J de Martino Jannuzzi G amp Redlinger R (1997 November) Tools and Methods for Integrated Resource Planning Improving Energy Efficiency and Protecting the Environment United Nations Environment Programme [UNEP] Collaborating Centre on Energy and Environment
Thorne-Amann J and Mendelsohn E (2005) Comprehensive Commercial Retrofit Programs A Review of Activity and Opportunities Report Number A052 American Council for an Energy Efficient Economy [ACEEE]
US Department of Energy [DOE] (2006) Weatherization Assistance Plan lthttpwwweere energygovweatherizationgt
US Energy Information Administration [EIA] (2006a) Annual Energy Outlook Washington DC
US Energy Information Administration [EIA] (2006b June) Natural Gas Consumption by End Use Natural Gas Navigator lthttptontoeiadoegovdnavngng_cons_sum_a_ EPG0_VC0_mmcf_ahtmgt
US Energy Information Administration [EIA] (2005a November) US Electric Power Industry Existing Net Summer Capacity by State Electric Power Annual lthttpwwweiadoegovcneaf electricityepaexisting_capacity_statexlsgt
US Energy Information Administration [EIA] (2005b December) Sales to Bundled and Unbundled Consumers by Sector Census Division and State Electricity Sales 2004mdashElectric Sales Revenue and Price lthttpwwweiadoegovcneafelectricity esrtable2xlsgt
US Energy Information Administration [EIA] (2004) Sales to Bundled and Unbundled Consumers lthttpwwweiadoegovcneafelectricityesr table2xlsgt
Wisconsin Department of Administration Division of Energy Focus Evaluation Team [Wisconsin] (2006 March 3) Semiannual Report (FY 06) Midyear Focus on Energy Public Benefits Evaluation
To create a sustainable aggressive national commitment to energy efficiency 6-55
7Report Summary
This report presents a variety of policy planning and program approaches that can be used to help natushyral gas and electric utilities utility regulators and partner organizations pursue the National Action Plan for Energy Efficiency recommendations and meet their commitments to energy efficiency This chapter summarizes these recommendations and the energy efficiency key findings discussed in this report
Overview
This National Action Plan for Energy Efficiency (Action Plan) is a call to action to bring diverse stakeholders together at the national regional state or utility level as appropriate to foster the discussions decision-making and commitments necessary to take investment in energy efficiency to a new level The overall goal is to create a sustainable aggressive national commitment to energy efficiency through gas and electric utilities utility regulators and partner organizations
Based on the policies practices and efforts of many organizations previously discussed in this report the Leadership Group offers five recommendations as ways to overcome many of the barriers that have limited greater investment in programs to deliver energy effishyciency to customers of electric and gas utilities (Figure 7-1) These recommendations may be pursued through a number of different options depending on state and utility circumstances
As part of the Action Plan leading organizations are committing to aggressively pursue energy efficiency opportunities in their organizations and to assist others who want to increase the use of energy efficiency in their regions The commitments pursued under the Action Plan have the potential to save Americans many billions of dollars on energy bills over the next 10 to 15 years contribute to energy security and improve the environment
Recommendations and Options
to Consider
The Action Plan Report provides information on the barshyriers that limit greater investment in programs to deliver energy efficiency to customers of electric and gas utilishyties Figure 7-2 illustrates the key barriers and how they relate to policy structure utility resource planning and program implementation
Figure 7-1 National Action Plan for Energy Efficiency Recommendations
bull Recognize energy efficiency as a high-priority energy resource
bull Make a strong long-term commitment to implement cost-effective energy efficiency as a resource
bull Broadly communicate the benefits of and opportunities for energy efficiency
bull Promote sufficient timely and stable program funding to deliver energy efficiency where cost-effective
bull Modify policies to align utility incentives with the delivery of cost-effective energy efficiency and
modify ratemaking practices to promote energy efficiency investments
To create a sustainable aggressive national commitment to energy efficiency 7-1
Several options exist for utilities regulators and partner organizations to overcome these barriers and pursue the Action Plan recommendations Different state and utility circumstances affect which options are pursued Table 7-1 provides a list of the Leadership Group recommendations along with sample options to consider The table also provides a cross reference to supporting discussions in Chapters 2 through 6 of this report
Key Findings
The key finding of the Action Plan Report is that energy efficiency can be a cost-effective resource and can proshyvide multiple benefits to utilities customers and society These benefits also discussed in more detail in Chapter 1 Introduction and Background1 include
bull Lower energy bills greater customer control and greater customer satisfaction
bull Lower cost than only supplying new generation from new power plants
bull Advantages from being modular and quick to deploy
bull Significant energy savings
bull Environmental benefits
bull Economic development opportunities
bull Energy security
Figure 7-2 National Action Plan for Energy Efficiency Report Addresses Actions to Encourage Greater Energy Efficiency
Timeline Actions to Encourage Greater Energy Efficiency
Utility Resource Program Policy Structure Planning Implementation
Develop Utility Incentives for Energy Efficiency
Develop Rate Designs to Encourage Energy Efficiency
Include Energy Efficiency in Utility Resource Mix
Measurement amp Evaluation
Program Roll-out
Develop Effective Energy Efficiency Programs
Revise Plans and Policies Based on Results
Action Plan Report Chapter Areas and Key Barriers
Utility Ratemaking amp Revenue
Requirements
Energy efficiency reduces utility earnings
Planning Processes
Planning does not incorporate demand-
side resources
Rate Design
Rates do not encourage energy
efficiency investments
Model Program
Documentation
Limited information on existing best practices
1 Chapter 6 Energy Efficiency Program Best Practices also provides more information on these benefits
7-2 National Action Plan for Energy Efficiency
Table 7-1 Leadership Group Recommendations and Options to Consider by Chapter
Leadership Group Recommendations
(With Options To Consider)
Chapter 2 Utility
Ratemaking amp Revenue
Requirements
Chapter 3 Energy
Resource Planning Processes
Chapter 4 Business Case
for Energy Efficiency
Chapter 5 Rate Design
Chapter 6 Energy
Efficiency Program Best
Practices
Recognize energy efficiency as a high priority energy resource
X X
Establishing policies to establish energy efficiency as a priority resource
X
Integrating energy efficiency into utility state and regional resource planning activities
X
Quantifying and establishing the value of energy efficiency considering energy savings capacity savings and environmental benefits as appropriate
X X
Make a strong long-term commitment to cost effective energy efficiency as a resource
X X X
Establishing appropriate cost-effectiveness tests for a portfolio of programs to reflect the long-term benefits of energy efficiency
X X
Establishing the potential for long-term cost effective energy efficiency savings by customer class through proven programs innovative initiatives and cutting-edge technologies
X X
Establishing funding requirements for delivering long-term cost-effective energy efficiency
X X X
Developing long-term energy saving goals as part of energy planning processes
X X
Developing robust measurement and verification (MampV) procedures
X X
Designating which organization(s) is responsishyble for administering the energy efficiency programs
X X X
Providing for frequent updates to energy resource plans to accommodate new information and technology
X X
Broadly communicate the benefits of and opportunities for energy efficiency
X X X X X
Establishing and educating stakeholders on the business case for energy efficiency at the state utility and other appropriate level addressing releshyvant customer utility and societal perspectives
X X X
Communicating the role of energy efficiency in lowering customer energy bills and system costs and risks over time
X X X X X
Communicating the role of building codes appliance standards and tax and other incentives
X
To create a sustainable aggressive national commitment to energy efficiency 7-3
Table 7-1 Leadership Group Recommendations and Options to Consider by Chapter (continued)
Leadership Group Recommendations
(With Options To Consider)
Chapter 2 Utility
Ratemaking amp Revenue
Requirements
Chapter 3 Energy
Resource Planning Processes
Chapter 4 Business Case
for Energy Efficiency
Chapter 5 Rate Design
Chapter 6 Energy
Efficiency Program Best
Practices
Provide sufficient timely and stable program funding to deliver energy efficiency where cost-effective
X X X
Deciding on and committing to a consistent way for program administrators to recover energy efficiency costs in a timely manner
X X
Establishing funding mechanisms for energy efficiency from among the available options such as revenue requirement or resource procurement funding system benefits charges rate-basing shared-savings incentive mechanisms etc
X X
Establishing funding for multi-year periods X X X
Modify policies to align utility incentives with the delivery of cost-effective energy efficiency and modify ratemaking practices to promote energy efficiency investments
X X
Addressing the typical utility throughput incentive and removing other regulatory and management disincentives to energy efficiency
X
Providing utility incentives for the successful management of energy efficiency programs
X
Including the impact on adoption of energy efficiency as one of the goals of retail rate design recognizing that it must be balanced with other objectives
X
Eliminating rate designs that discourage energy efficiency by not increasing costs as customers consume more electricity or natural gas
X
Adopting rate designs that encourage energy efficiency by considering the unique charactershyistics of each customer class and including partnering tariffs with other mechanisms that encourage energy efficiency such as benefit sharing programs and on-bill financing
X
7-4 National Action Plan for Energy Efficiency
As discussed in Chapter 2 Utility Ratemaking amp Revenue Requirements financial disincentives exist that hinder utilities from pursuing energy efficiency even when cost-effective Many states have experience in addressing utility financial disincentives in the following areas
bullOvercoming the throughput incentive
bull Providing reliable means for utilities to recover energy efficiency costs
bull Providing a return on investment for efficiency programs that is competitive with the return utilities earn on new generation
bull Addressing the risk of program costs being disallowed along with other risks
bull Recognizing the full value of energy efficiency to the utility system
Chapter 3 Energy Resource Planning Processes found that there are many approaches to navigate and overcome the barriers to incorporating energy efficiency in planning processes Common themes across approaches include
bull Cost and savings data for energy efficiency measures are readily available
bull Energy capacity and non-energy benefits can justify robust energy efficiency programs
bull A clear path to funding is needed to establish a budgshyet for energy efficiency resources
bull Parties should integrate energy efficiency early in the resource planning process
Based on the eight cases examined using the Energy Efficiency Benefits Calculator in Chapter 4 Business Case for Energy Efficiency energy efficiency investments were found to provide consistently lower costs over time for both utilities and customers while providing positive net benefits to society Key findings include
bull Ratemaking policies to address utility financial barriers to energy efficiency maintain utility health while comshyprehensive cost-effective energy efficiency programs are implemented
bull The costs of energy efficiency and the reduction in utility sales volume initially raise gas or electricity bills due to slightly higher rates but efficiency gains will reduce avershyage customer bills by 2 to 9 percent over a 10-year period
bull Energy efficiency investments yielded net societal benefits on the order of hundreds of millions of dollars for each of the eight small- to medium-sized utility cases examined
Chapter 5 Rate Design found that recognizing the promotion of energy efficiency is an important factor to balance along with the numerous regulatory and legislative goals addressed during the complex rate design process Additional key findings include
bull Several rate design options exist to encourage customers to invest in efficiency and to participate in new programs that provide innovative technologies (eg smart meters)
bull Utility rates that are designed to promote sales or maxishymize stable revenues tend to lower customer incentives to adopt energy efficiency
bull Some rate forms like declining block rates or rates with large fixed charges reduce the savings that customers can attain from adopting energy efficiency
bull Appropriate rate designs should consider the unique characteristics of each customer class
bull Energy efficiency can be promoted through non-tariff mechanisms that reach customers through their utility bill
bull More effort is needed to communicate the benefits and opportunities for energy efficiency to customers regulators and utility decision-makers
Chapter 6 Energy Efficiency Program Best Practices provided a summary of best practices as well as general program key findings The best practice strategies for program planning design implementation and evaluashytion are found to be independent of the policy model in which the program operates These best practices organized by four major groupings are provided below
bull Making Energy Efficiency A Resource
mdash Require leadership at multiple levels
To create a sustainable aggressive national commitment to energy efficiency 7-5
mdash Align organizational goals
mdash Understand the efficiency resource
bull Developing An Energy Efficiency Plan
mdash Offer programs for all key customer classes
mdash Align goals with funding
mdash Use cost-effectiveness tests that are consistent with long-term planning
mdash Consider building codes and appliance standards when designing programs
mdash Plan to incorporate new technologies
mdash Consider efficiency investments to alleviate transmisshysion and distribution constraints
mdash Create a roadmap of key program components milestones and explicit energy use reduction goals
bull Designing and Delivering Energy Efficiency Programs
mdash Begin with the market in mind
mdash Leverage private sector expertise external funding and financing
mdash Start with demonstrated program modelsmdashbuild infrastructure for the future
bull Ensuring Energy Efficiency Investments Deliver Results
mdash Budget plan and initiate evaluation
mdash Develop program and project tracking systems
mdash Conduct process evaluations
mdash Conduct impact evaluations
mdash Communicate evaluation results to key stakeholders
The key program findings in Chapter 6 are drawn from the programs reviewed for this report2 These findings include
bull Energy efficiency resources are being acquired on average at about one-half the cost of typical new power sources and about one-third of the cost of natural gas supply in many casesmdashcontributing to an overall lower-cost energy system for rate-payers (EIA 2006)
bull Many energy efficiency programs are being delivered at a total program cost of about $002 to $003 per lifetime kilowatt-hour (kWh) saved and $130 to $200 per lifeshytime million British thermal units (MMBtu) saved These costs are less than the avoided costs seen in most regions of the country Funding for the majority of programs reviewed ranges from about 1 to 3 percent of electric utility revenue and 05 to 1 percent of gas utility revenue
bull Even low energy cost states such as those in the Pacific Northwest have reason to invest in energy efficiency because energy efficiency provides a low-cost reliable resource that reduces customer utility bills Energy efficienshycy also costs less than constructing new generation and provides a hedge against market fuel and environmental risks (NWPCC 2005)
bull Well-designed energy efficiency programs provide opportunities for customers of all types to adopt energy saving measures and reduce their energy bills These programs can help customers make sound energy-use decisions increase control over their energy bills and empower them to manage their energy usage Customers can experience significant savings depending on their own habits and the program offered
bull Consistently funded well-designed efficiency programs are cutting electricity and natural gas loadmdashproviding annual savings for a given program year of 015 to 1 percent of energy sales These savings typically will
2 See Chapter 6 Energy Efficiency Program Best Practices Tables 6-2 and 6-3 for more information on energy efficiency programs reviewed
7-6 National Action Plan for Energy Efficiency
accrue at this level for 10 to 15 years These programs are helping to offset 20 to 50 percent of expected energy growth in some regions without compromising end-user activity or economic well being
bull Research and development enables a continuing source of new technologies and methods for improving energy efficiency and helping customers control their energy bills
bull Many state and regional studies have found that pursuing economically attractive but as yet untapped energy efficiency could yield more than 20 percent savings in total electricity demand nationwide by 2025 These savings could help cut load growth by half or more compared to current forecasts Savings in direct use of natural gas could similarly provide a 50 percent or greater reduction in natural gas demand growth Energy savings potential varies by customer segment but there are cost-effective opportunities for all customer classes
bull Energy efficiency programs are being operated successfully across many different contexts regulated and unregulated markets utility state or third-party administration investor- publicly- and cooperatively-owned utilities and gas and electric utilities
bull Energy efficiency resources are being acquired through a variety of mechanisms including system benefits charges (SBC) energy efficiency portfolio standards (EEPS) and resource planning (or cost-of-service) efforts
bull Cost-effective energy efficiency programs exist for electricity and natural gas including programs that can be specifically targeted to reduce peak load
bull Effective models exist for delivering gas and electric energy efficiency programs to all customer classes Models might vary for some programs based on whether a utility is in the initial stages of energy efficiency programming or has been implementing programs for years
bull Energy efficiency programs projects and policies benefit from established and stable regulations clear goals and comprehensive evaluation
bull Energy efficiency programs benefit from committed program administrators and oversight authorities as well as strong stakeholder support
bull Most large-scale energy efficiency programs have improved productivity enabling job growth in the commercial and industrial sectors
bull Large-scale energy efficiency programs can reduce wholesale market prices
References
Northwest Power and Conservation Council [NWPCC] (2005 May) The 5th Northwest Electric Power and Conservation Plan lthttpwwwnwcouncilorgenergy powerplandefaulthtmgt
US Energy Information Administration [EIA] (2006) Annual Energy Outlook 2006 Washington DC
To create a sustainable aggressive national commitment to energy efficiency 7-7
Additional Guidanceon Removing theThroughput Incentive
Overview
In order to eliminate the conflict between the publicservice objectives of least-cost service on the one handand a utilityrsquos profitability objectives on the other handit is necessary to remove the throughput incentive Someoptions for removing the throughput incentive are gen-erally called decoupling because these options decoupleprofits from sales volume In its simplest form decou-pling is accomplished by periodically adjusting tariffprices so that the utilityrsquos revenues (and hence its profits)are on a total company basis held relatively constant inthe face of changes in customer consumption
This appendix explains options to address the throughputincentive by changing regulations and the way utilitiesmake money to ensure that utility net income and cover-age of fixed costs are not affected solely by sales volume
Types of Decoupling
Utilities and regulators have implemented a variety ofdifferent approaches to remove the throughput incen-tive Regardless of which approach is used a frame ofreference is created and used to compare with actualresults Periodic tariff price adjustments true up actualresults to the expected results and are critical to thedecoupling approach
bull Average revenue-per-customer This approach is oftenconsidered for utilities where their underlying costsduring the period between rate adjustments do notvary with consumption Such can be the case for a
wires-only distribution company where the majority ofinvestments are in the wires and transformers used todeliver the commodity
bull Forecast revenues over a period of time and use a bal-ancing account This approach is often considered forutilities where a significant portion of the costs (primarilyfuel) vary with consumption For these cases it mightbe best to use a price-based decoupling mechanism forthe commodity portion of electric service (which givesthe utility the incentive to reduce fuel and other vari-able costs) while using a revenue-per-customerapproach for the ldquowiresrdquo costs Alternatively regula-tors can use traditional tariffs for the commodity por-tion and apply decoupling only to the wires portion ofthe business
Sample Approach to Removing the
Throughput Incentive1
Implementing decoupling normally begins with a tradi-tional revenue requirement rate case Decoupling canalso be overlaid on existing tariffs where there is a highconfidence that those tariffs continue to represent theutilityrsquos underlying revenue requirements
Under traditional rate of return regulation
Price (Rates) = Revenue RequirementSales (test year or forecasted)
The National Action Plan for Energy Efficiency provides policy recommendations and options to support astrong commitment to cost-effective energy efficiency in the United States One policy that receives agreat deal of attention is reducing or eliminating the financial incentive for a utility to sell more energymdashthe throughput incentive Options exist to address the throughput incentive as discussed in moredetail in this appendix
To create a sustainable aggressive national commitment to energy efficiency Appendix A-1
Appendix
A
1 In this section the revenue per customer approach is discussed but can be easily adapted to a revenue forecast approach
The revenue requirement as found in the rate case will notchange again until the next rate case Note that the rev-enue requirement contains an allowance for profit anddebt coverage Despite all the effort in the rate case to cal-culate the revenue requirement what really matters afterthe rate case is the price the consumer pays for electricity
After the rate case
Actual revenues = Price Actual Sales
And
Actual Profit = Actual Revenue ndash Actual Costs
Based on the rate case ldquotest yearrdquo data an average revenue-per-customer value can then be calculated for each rate class
Revenue Requirement t0 number of customers t0 = revenue per customer (RPC)
Thus at time ldquozerordquo(t0) the companyrsquos revenues equalits number of customers multiplied by the revenues percustomer while the prices paid by customers equal therevenues to be collected divided by customersrsquo con-sumption units (usually expressed as $kW for metereddemand and $kWh for metered energy) Looking for-ward as the number of customers changes the revenueto be collected changes
Revenue Requirement tn = RPC number of customers tn
For each future period (t1 t2hellip tn ) the new revenue tobe collected is then divided by the expected consump-tion to periodically derive a new price the true-up
Price (Rates) tn = Revenue Requirement tn Sales tn
True up = Price tn ndash Price t0
Prices can also be trued-up based on deviations betweenrevenue and cost forecasts and actual results where aforecast approach is used Note that no redesign of rates
is necessary as part of decoupling Rate redesign mightbe desirable for other reasons (for more information onchanges that promote energy efficiency see Chapter 5Rate Design) and decoupling does not interfere withthose reasons
The process can be augmented by various features thatfor example explicitly factor in utility productivityexogenous events (events of financial significance outof control of the utility) or factors that might changeRPC over time
Timing of Adjustments
Rates can be adjusted monthly quarterly or annually(magnitude of any tn) By making the adjustments moreoften the magnitude of any price change is minimizedHowever frequent adjustments will impose some addi-tional administrative expense A plan that distinguishescommodity cost from other costs could have more fre-quent adjustments for more volatile commodities (ifthese are not already being dealt with by an adjustmentclause) Because the inputs used for these adjustmentsare relatively straight-forward coming directly from theutilityrsquos billing information each filing should be largelyadministrative and not subject to a significant controversyor litigation This process can be further streamlinedthrough the use of ldquodeadbandsrdquo which allow for smallchanges in either direction in revenue or profits with noadjustment in rates
Changes to Utility Incentives
With decoupling in place a prudently managed utility willreceive revenue from customers that will cover its fixedcosts including profits If routine costs go up the utility willabsorb those costs A reduction in costs produces theopportunity for additional earnings The primary driver forprofitability growth however will be the addition of newcustomers and the greatest contribution to profits will befrom customers who are more efficientmdashthat is whoseincremental costs are the lowest
Appendix A-2 National Action Plan for Energy Efficiency
An effective decoupling plan should lower utility risk tosome degree Reduced risk should be reflected in thecost of capital and for investor-owned utilities can berealized through either an increase in the debtequityratio or a decrease in the return on equity investmentFor all utilities these changes will flow through to debtratings and credit requirements
In addition decoupling can be combined with perform-ance indicators to ensure that service quality is main-tained and that cost reductions are the result of gains inefficiency and not a decline in the level of service Otherexogenous factors such as inflation taxes and economicconditions can also be combined with decoupling how-ever these factors do not address the primary purpose ofremoving the disincentive to efficiency Also if there is adistinct productivity for the electric utility as comparedwith the general economy a factor accounting for it canbe woven into the revenue per customer calculationsover time
Allocation of Weather Risk
One specific factor that is implicit in any regulatoryapproach (whether it be traditional regulation or decou-pling) is the allocation of weather risk between utilitiesand their customers Depending on the policy position ofthe regulatory agency the risk of weather changes canbe allocated to either customers or the utility This deci-sion is inherent to the rate structure even if the regula-tory body makes no cognizant choice
Under traditional regulation weather risk is usuallylargely borne by the utility which means that the utilitycan suffer shortfalls if the weather is milder than normalAt the same time it can enjoy windfalls if the weather ismore extreme than normal These scenarios resultbecause while revenues will change with weather theunderlying cost structure typically does not These situa-tions translate directly into greater earnings variabilitywhich implies a higher required cost of capital In orderto allocate the weather risk to the utility the ldquotest yearrdquo
information used to compute the base revenue-per-cus-tomer values should be weather normalized Thereafterwith each adjustment to prices the consumption datawould weather normalize as well
Potential Triggers and
Special Considerations in
Decoupling Mechanisms
Because decoupling is a different way of doing businessfor regulators and utilities it is prudent to consider off-ramps or triggers that can avoid unpleasant surprisesThe following are some of the approaches that might beappropriate to consider
bull Banding of rate adjustments To minimize the magni-tude of adjustments the decoupling mechanism couldbe premised on a ldquodead bandrdquo within which no adjust-ment would be made The effect would be to reducethe number of tariff changes and possibly but not necessarily the associated periodic filings
The plan can also cap the amount of any single rateadjustment To the extent it is based on reasonablecosts otherwise recoverable under the plan the excesscould be set aside in a regulatory account for laterrecovery
bull Banding of earnings To control the profit level of theregulated entity within some bounds earnings greaterandor less than certain limits can be shared with cus-tomers For example consider a scenario in which theearnings band is 1 percent on return on equity (eitherway) compared to the allowed return found in the mostrecent rate case If the plan would share results outsidethe band 50-50 then if the utility earns +15 percent ofthe target an amount equal to 025 percent of earnings(half the excess) is returned to consumers through a priceadjustment If the utility earns -13 percent of the targethowever an amount equal 015 percent of earnings (halfthe deficiency) is added to the price Designing this band
To create a sustainable aggressive national commitment to energy efficiency Appendix A-3
should leave the utility with ample incentive to makeand benefit from process engineering improvementsduring the plan recognizing that a subsequent ratecase might result in the benefits accruing in the longrun to consumers While the illustration is ldquosymmetri-calrdquo in practice the band can be asymmetrical in sizeand sharing proportion to assure the proper balancebetween consumer and utility interests
bull Course corrections for customer count changes majorchanges for unique major customers and largechanges in revenues-per-customer Industrial con-sumers might experience more volatility in average useper customer calculations because there are typically asmall number of these customers and they can be quitevaried For example the addition or deletion of onelarge customer (or of a work shift for a large customer)might make a significant difference in the revenue percustomer values for that class or result in appropriateshifting of revenues among customers To address thisproblem some trigger or off-ramp might be appropriateto review such unexpected and significant changesand to modify the decoupling calculation to accountfor them In some cases a new rate case might be warranted from such a change
bull Accounting for utilities whose marginal revenues percustomer are significantly different than their embeddedaverage revenue per customer If a utilityrsquos revenue percustomer has been changing rapidly over time imposi-tion of a revenue-per-customer decoupling mechanismwill have the effect of changing its profit growth pathFor example if incremental revenues per customer aregrowing rapidly decoupling will have the effect of low-ering future earnings although not necessarily belowthe companyrsquos allowed rate of return On the otherhand if incremental revenues per customer are declin-ing decoupling will have the effect of increasing futureearnings Where these trends are strong and there is adesire to make decoupling ldquoearnings neutralrdquo vis-agrave-visthe status quo earning path the revenue-per-customervalue can be tied to an upward or downward growthrate This type of adjustment is more oriented towardmaintaining neutrality than reflecting any underlyingeconomic principle Care should be taken to excluderecent growth in revenues per customer that are drivenby inefficient consumption (usually tied to the utilityhaving a pro-consumption marketing program)
Appendix A-4 National Action Plan for Energy Efficiency
Business Case Details
A business case is an analysis that shows the benefits of
energy efficiency to the utility customers and society
within an approach that can lead to actions by utilities
regulators and other stakeholders Making the business
case for energy efficiency programs requires a different
type of analysis than that required for traditional supply-
side resources Because adoption of energy efficiency
reduces utility sales and utility size traditional metrics
such as impact on rates and total earnings do not
measure the benefits of energy efficiency However by
examining other metrics such as customer bills and utility
earnings per share the benefits to all stakeholders of
adopting energy efficiency can be demonstrated These
benefits include reduced customer bills decreased cost
per unit of energy provided increased net resource sav-
ings decreased emissions and decreased reliance on
energy supplies
This appendix provides more detailed summary and inter-
pretation of results for the eight cases discussed in
Chapter 4 Business Case for Energy Efficiency All
results are from the Energy Efficiency Benefits Calculatorrsquos
interpretation tab
To help natural gas and electric utilities utility regulators and partner organizations communicate thebusiness case for energy efficiency the National Action Plan for Energy Efficiency provides an EnergyEfficiency Benefits Calculator (Calculator available at wwwepagovcleanenergyeeactionplanhtm) ThisCalculator examines the financial impact of energy efficiency on major stakeholders and was used todevelop the eight cases discussed in Chapter 4 Business Case for Energy Efficiency Additional details onthese eight cases are described in this appendix
To create a sustainable aggressive national commitment to energy efficiency Appendix B-1
Appendix
B
Overview
Case 1 Low-Growth Electric and Gas Utility
Utility Perspective
Utility Financial Health ndash Small Changes The change in utility financial health depends on whether or not there are decoupling mechanisms in place if there are shareshyholder incentives in place (for investor-owned utilities) the frequency of rate adjustments and other factors Depending on the type of utility the measure of financial health changes Investor-owned utility health is measured by return on equity (ROE) while publicly or cooperatively owned utility health is measured by cash position or debt coverage ratio
Electric Gas
Investor-Owned Utility Comparison of Return on Equity
Year
Aft
er T
ax R
OE
()
ROE - No EE
ROE - EE no Decoupling
ROE - EE and Decoupling
Target ROE
3
6
9
12
15
1 2 3 4 5 6 7 8 9 10
Investor-Owned Utility Comparison of Return on Equity
Year A
fter
Tax
RO
E (
)
ROE - No EE
ROE - EE no Decoupling
ROE - EE and Decoupling
Target ROE
3
6
9
12
15
1 2 3 4 5 6 7 8 9 10
Utility Earnings ndash Results Vary Utility earnings depend on growth rate capital investment frequency of rate adjustments and other factors If energy efficient (EE) reduces capital investment the earnings will be lower in the EE case unless shareholder incentives for EE are introduced However utility return (ROE or earnings per share) may not be affected
Utility Earnings
Year
Earn
ings
($M
M)
Earnings $MM - No EE
Earnings $MM - EE no Decoupling
Earnings $MM - EE and Decoupling
$0
$20
$40
$60
$80
$100
1 2 3 4 5 6 7 8 9 10
Utility Earnings
Year
Earn
ings
($M
M)
Earnings $MM - No EE
Earnings $MM - EE no Decoupling
Earnings $MM - EE and Decoupling
$0
$20
$40
$60
$80
$100
1 2 3 4 5 6 7 8 9 10
Appendix B-2 National Action Plan for Energy Efficiency
Customer Perspective
Customer Bills ndash Decrease In the first year customer utility bills increase because the cost of the EE program has not yet produced savings Total cusshytomer bills decline over time usually within the first three years indicating customer savings resulting from lower energy consumption
Electric Gas
Percent Change in Customer Bills
Year
Cha
nge
in B
ills
()
Change in Customer Bills () - EE no Decoupling
Change in Customer Bills () - EE and Decoupling
-21
-18
-15
-12
-9
-6
-3
0
3
6
1 2 3 4 5 6 7 8 9 10
Percent Change in Customer Bills
Year
Cha
nge
in B
ills
()
Change in Customer Bills () - EE no Decoupling
Change in Customer Bills () - EE and Decoupling
-10
-8
-6
-4
-2
0
2
4
1 2 3 4 5 6 7 8 9 10
Utility Rates ndash Mild Increase
The rates customers pay ($kWh $therm) increase when avoided costs are less than retail rates which is typically the case for most EE programs Rates increase because revenue requirements increase more quickly than sales
Comparison of Average Rate
Year
Ave
rage
Rat
e ($
kW
h)
Utility Average Rate - No EE
Utility Average Rate - EE no Decoupling
Utility Average Rate - EE and Decoupling
$010
$015
$020
$025
$030
1 2 3 4 5 6 7 8 9 10
Comparison of Average Rate
Year
Ave
rage
Rat
e ($
the
rm)
Utility Average Rate - No EE
Utility Average Rate - EE no Decoupling
Utility Average Rate - EE and Decoupling
$080
$085
$090
$095
$100
$105
$110
1 2 3 4 5 6 7 8 9 10
To create a sustainable aggressive national commitment to energy efficiency Appendix B-3
Societal Perspective
Societal Net Savings ndash Increase The net savings are the difference of total utility costs including EE program costs with EE and without EE In the first year the cost of the EE program is a cost to society Over time cumulative EE savings lead to a utility production cost savings that is greater than the EE program cost The graph shape is therefore upward sloping Total Societal Net Savings is the same with and without decoupling therefore only one line is shown
Electric Gas
Annual Total Societal Net Savings
Year
Net
Soc
ieta
l Ben
efit
($M
)
Total Societal Net Savings ($M)
-$15
-$10
-$5
$0
$5
$10
$15
$20
$25
1 2 3 4 5 6 7 8 9 10
Annual Total Societal Net Savings
Year N
et S
ocie
tal B
enefi
t ($
M)
Total Societal Net Savings ($M)
-$15
-$10
-$5
$0
$5
$10
$15
$20
$25
1 2 3 4 5 6 7 8 9 10
Total Societal Cost Per Unit ndash Declines Total cost of providing each unit of energy (MWh therm) declines over time because of the impacts of energy savings decreased peak load requirements and decreased costs during peak periods Well-designed EE programs can deliver energy at an average cost less than that of new power sources When the two lines cross the annual cost of EE equals the annual savings resulting from EE The Societal Cost and Societal Savings are the same with and without decoupling
Delivered Costs and Benefits of EE
Year
$M
Wh
Societal Cost ($MWh saved)
Societal Savings ($MWh saved)
$0
$100
$200
$300
$400
1 2 3 4 5 6 7 8 9 10
$1
$3
$5
Delivered Costs and Benefits of EE
Year
$th
erm
Societal Cost ($therm saved)
Societal Savings ($therm saved)
$0
$2
$4
$6
1 3 5 7 92 4 6 8 10
Appendix B-4 National Action Plan for Energy Efficiency
Emissions and Cost Savings ndash Increase Annual tons of emissions saved increases Emissions cost savings increases when emissions cost is monetized Emissions costs and savings are the same with and without decoupling
Electric Gas
Annual Emissions Savings
Tons
Sav
ed
0
10
20
30
40
50
60
70
1 2 3 4 5 6 7 8 9 10 0
20
40
60
80
100
120
140
160
180
200 Tons SO2 Saved Tons CO Saved Tons VOC Saved 1000 Tons CO2 Saved
Tons NO x Saved Tons PM-10 Saved
1000
Ton
s C
O2
save
d
Year
Annual Emissions Savings
Tons
Sav
ed
90
80
70
60
50
40
30
20
10
0
Tons NO x Saved Tons PM-10 Saved
Tons SO2 Saved Tons CO Saved 1000 Tons CO2 Saved
1 2 3 4 5 6 7 8 9 10 Year
Growth Offset by EE ndash Increase As EE programs ramp up energy consumption declines This comparison shows the growth with and without EE and illusshytrates the amount of EE relative to load growth Load growth and energy savings are not impacted by decoupling With load growth assumed at zero no load or percent growth offset shown
Percent Growth Offset by Energy Efficiency
GW
h
Energy Savings - EE (GWh)
Load Growth - No EE (GWh)
Growth Offset by EE ()
Year
0
200
400
600
800
1000
1200
1400
1 2 3 4 5 6 7 8 9 10 0
20
40
60
80
100
120
140
160
Percent Growth Offset by Energy Efficiency
Mcf
Year
Energy Savings - EE (Mcf)
Load Growth - No EE (Mcf)
Growth Offset by EE ()
0
1000
2000
3000
4000
5000
6000
7000
1 2 3 4 5 6 7 8 9 10
0
5
10
15
20
25
To create a sustainable aggressive national commitment to energy efficiency Appendix B-5
Peak Load Growth ndash Decrease Peak load requirements decrease because peak capacity savings are captured due to EE measures Peak load is not impacted by decoupling
Electric Gas
90
100
110
120
130
140
150
160
1 2 3 4 5 6 7 8 9 10
Comparison of Peak Load Growth
Year
Peak
Loa
d
of
Firs
t Y
r
Forecasted Growth - No EE
Forecasted Growth - EE and Decoupling
Comparison of Peak Load Growth
Year
Peak
Loa
d
of
Firs
t Y
r
Forecasted Growth - No EE
Forecasted Growth - EE and Decoupling
90
100
110
120
130
140
150
160
1 2 3 4 5 6 7 8 9 10
Appendix B-6 National Action Plan for Energy Efficiency
Case 2 High-Growth Electric and Gas Utility
Utility Perspective
Utility Financial Health ndash Small Changes The change in utility financial health depends on whether or not there are decoupling mechanisms in place if there are shareshyholder incentives in place (for investor-owned utilities) the frequency of rate adjustments and other factors Depending on the type of utility the measure of financial health changes Investor-owned utility health is measured by ROE while publicly or cooperatively owned utility health is measured by cash position or debt coverage ratio
Electric Gas
Investor-Owned Utility Comparison of Return on Equity
Year
Aft
er T
ax R
OE
()
ROE - No EE
ROE - EE no Decoupling
ROE - EE and Decoupling
Target ROE
3
6
9
12
15
1 2 3 4 5 6 7 8 9 10
Investor-Owned Utility Comparison of Return on Equity
Year
Aft
er T
ax R
OE
()
ROE - No EE
ROE - EE no Decoupling
ROE - EE and Decoupling
Target ROE
3
6
9
12
15
1 2 3 4 5 6 7 8 9 10
Utility Earnings ndash Results Vary Utility earnings depend on growth rate capital investment frequency of rate adjustments and other factors If EE reduces capital investment the earnings will be lower in the EE case unless shareholder incentives for EE are introduced However utility return (ROE or earnings per share) may not be affected
Utility Earnings
Year
Earn
ings
($M
M)
Earnings $MM - No EE
Earnings $MM - EE no Decoupling
Earnings $MM - EE and Decoupling
$0
$20
$40
$60
$80
$100
1 2 3 4 5 6 7 8 9 10
Utility Earnings
Year
Earn
ings
($M
M)
Earnings $MM - No EE
Earnings $MM - EE no Decoupling
Earnings $MM - EE and Decoupling
$0
$20
$40
$60
$80
$100
1 2 3 4 5 6 7 8 9 10
To create a sustainable aggressive national commitment to energy efficiency Appendix B-7
Customer Perspective
Customer Bills ndash Decrease In the first year customer utility bills increase because the cost of the EE program has not yet produced savings Total cusshytomer bills decline over time usually within the first three years indicating customer savings resulting from lower energy consumption
Electric Gas
Percent Change in Customer Bills
Year
Cha
nge
in B
ills
()
Change in Customer Bills () - EE no Decoupling
Change in Customer Bills () - EE and Decoupling
-21
-18
-15
-12
-9
-6
-3
0
3
6
1 2 3 4 5 6 7 8 9 10
Percent Change in Customer Bills
Year
Cha
nge
in B
ills
()
Change in Customer Bills () - EE no Decoupling
Change in Customer Bills () - EE and Decoupling
-10
-8
-6
-4
-2
0
2
4
1 2 3 4 5 6 7 8 9 10
Utility Rates ndash Mild Increase The rates customers pay ($kWh $therm) increase when avoided costs are less than retail rates which is typically the case for most EE programs Rates increase because revenue requirements increase more quickly than sales
Comparison of Average Rate
Year
Ave
rage
Rat
e ($
kW
h)
Utility Average Rate - No EE
Utility Average Rate - EE no Decoupling
Utility Average Rate - EE and Decoupling
$010
$015
$020
$025
$030
1 2 3 4 5 6 7 8 9 10
Comparison of Average Rate
Year
Ave
rage
Rat
e ($
the
rm)
Utility Average Rate - No EE
Utility Average Rate - EE no Decoupling
Utility Average Rate - EE and Decoupling
$080
$085
$090
$095
$100
$105
$110
1 2 3 4 5 6 7 8 9 10
Appendix B-8 National Action Plan for Energy Efficiency
Societal Perspective
Societal Net Savings ndash Increase The net savings are the difference of total utility costs including EE program costs with EE and without EE In the first year the cost of the EE program is a cost to society Over time cumulative EE savings lead to a utility production cost savings that is greater than the EE program cost The graph shape is therefore upward sloping Total Societal Net Savings is the same with and without decoupling therefore only one line is shown
Electric Gas
Annual Total Societal Net Savings
Year
Net
Soc
ieta
l Ben
efit
($M
)
Total Societal Net Savings ($M)
-$15
-$10
-$5
$0
$5
$10
$15
$20
$25
1 2 3 4 5 6 7 8 9 10
Annual Total Societal Net Savings
Net
Soc
ieta
l Ben
efit
($M
)
Total Societal Net Savings ($M)
Year
$-15
$-10
$-5
$0
$5
$10
$15
$20
$25
1 2 3 4 5 6 7 8 9 10
Total Societal Cost Per Unit ndash Declines Total cost of providing each unit of energy (MWh therm) declines over time because of the impacts of energy savings decreased peak load requirements and decreased costs during peak periods Well-designed EE programs can deliver energy at an average cost less than that of new power sources When the two lines cross the annual cost of EE equals the annual savings resulting from EE The Societal Cost and Societal Savings are the same with and without decoupling
Delivered Costs and Benefits of EE
Year
$M
Wh
$0
$100
$200
$300
$400
1 2 3 4 5 6 7 8 9 10
Societal Cost ($MWh saved)
Societal Savings ($MWh saved)
Delivered Costs and Benefits of EE
Year
$th
erm
Societal Cost ($therm saved)
Societal Savings ($therm saved)
$0
$1
$2
$3
$4
$5
$6
1 3 5 7 92 4 6 8 10
To create a sustainable aggressive national commitment to energy efficiency Appendix B-9
Emissions and Cost Savings ndash Increase Annual tons of emissions saved increases Emissions cost savings increases when emissions cost is monetized Emissions costs and savings are the same with and without decoupling
Electric Gas
Annual Emissions Savings
Tons
Sav
ed
0
10
20
30
40
50
60
70
1 2 3 4 5 6 7 8 9 10 0
20
40
60
80
100
120
140
160
180
200 Tons SO2 Saved Tons CO Saved Tons VOC Saved 1000 Tons CO2 Saved
Tons NO x Saved Tons PM-10 Saved
1000
Ton
s C
O2
save
d
Year
7 8 9
Annual Emissions Savings
Tons
Sav
ed
Tons SO2 Saved Tons CO Saved 1000 Tons CO2 Saved
Tons NO x Saved Tons PM-10 Saved
0
10
20
30
40
50
60
70
80
90
1 2 3 4 5 6 10
Year
Growth Offset by EE ndash Increase As EE programs ramp up energy consumption declines This comparison shows the growth with and without EE and illusshytrates the amount of EE relative to load growth Load growth and energy savings are not impacted by decoupling With load growth assumed at zero no load or percent growth offset shown
Percent Growth Offset by Energy Efficiency
Energy Savings - EE (GWh)
Load Growth - No EE (GWh)
Growth Offset by EE ()
GW
h
0
200
400
600
800
1000
1200
1400
1 2 3 4 5 6 7 8 9 10
0
20
40
60
80
100
120
140
160
Year
Percent Growth Offset by Energy Efficiency
Energy Savings - EE (Mcf)
Load Growth - No EE (Mcf)
Growth Offset by EE ()
Mcf
0
1000
2000
3000
4000
5000
6000
7000
1 2 3 4 5 6 7 8 9 10 0
5
10
15
20
25
Year
Appendix B-10 National Action Plan for Energy Efficiency
Peak Load Growth ndash Decrease Peak load requirements decrease because peak capacity savings are captured due to EE measures Peak load is not impacted by decoupling
Electric Gas
90
100
110
120
130
140
150
160
1 2 3 4 5 6 7 8 9 10
Comparison of Peak Load Growth
Year
Peak
Loa
d
of
Firs
t Y
r
Forecasted Growth - No EE
Forecasted Growth - EE and Decoupling
Comparison of Peak Load Growth
Year
Peak
Loa
d
of
Firs
t Y
rForecasted Growth - No EE
Forecasted Growth - EE and Decoupling
90
100
110
120
130
140
150
160
1 2 3 4 5 6 7 8 9 10
To create a sustainable aggressive national commitment to energy efficiency Appendix B-11
Case 3 Low-Growth with Power Plant Deferral
Utility Perspective
Utility Financial Health ndash Small Changes The change in utility financial health depends on whether or not there are decoupling mechanisms in place if there are shareholder incentives in place (for investor-owned utilities) the frequency of rate adjustments and other factors Depending on the type of utility the measure of financial health changes Investor-owned utility health is measured by ROE while publicly or cooperatively owned utility health is measured by cash position or debt coverage ratio
Investor-Owned Utility Comparison of Return on Equity
Aft
er T
ax R
OE
()
ROE - No EE
ROE - EE no Decoupling
ROE - EE and Decoupling
Target ROE
Year
3
6
9
12
15
1 2 3 4 5 6 7 8 9 10
Utility Earnings ndash Results Vary Utility earnings depend on growth rate capital investment frequency of rate adjustments and other factors If EE reduces capital investment the earnings will be lower in the EE case unless shareholder incentives for EE are introduced However utility return (ROE or earnings per share) may not be affected
Utility Earnings
Year
Earn
ings
($M
M)
Earnings $MM - No EE
Earnings $MM - EE no Decoupling
Earnings $MM - EE and Decoupling
$0
$20
$40
$60
$80
$100
1 2 3 4 5 6 7 8 9 10
Appendix B-12 National Action Plan for Energy Efficiency
Customer Perspective
Customer Bills ndash Decrease In the first year customer utility bills increase because the cost of the EE program has not yet produced savings Total customer bills decline over time usually within the first three years indicating customer savings resulting from lower energy consumption
Percent Change in Customer Bills
6
Societal Perspective
Societal Net Savings ndash Increase The net savings are the difference of total utility costs including EE program costs with EE and without EE In the first year the cost of the EE program is a cost to society Over time cumulative EE savings lead to a utility production cost savings that is greater than the EE program cost The graph shape is therefore upward sloping Total Societal Net Savings is the same with and without decoupling thereshyfore only one line is shown
Cha
nge
in B
ills
()
3
0
-3
-6
-9
-12
-15
-18
-21
Annual Total Societal Net Savings
Year
Net
Soc
ieta
l Ben
efit
($M
)
Total Societal Net Savings ($M)
-$600
-$400
-$200
$0
$200
$400
$600
1 2 3 4 5 6 7 8 9 10
1 2 3 4 5 6 7 8 9 10
Year
Change in Customer Bills () - EE no Decoupling
Change in Customer Bills () - EE and Decoupling
Utility Rates ndash Mild Increase The rates customers pay ($kWh) increase when avoided costs are less than retail rates which is typically the case for most EE programs Rates increase because revenue requireshyments increase more quickly than sales
Comparison of Average Rate
Year
Ave
rage
Rat
e ($
kW
h)
Utility Average Rate - No EE
Utility Average Rate - EE no Decoupling
Utility Average Rate - EE and Decoupling
$010
$015
$020
$025
$030
1 2 3 4 5 6 7 8 9 10
To create a sustainable aggressive national commitment to energy efficiency Appendix B-13
Total Societal Cost Per Unit ndash Declines Total cost of providing each unit of energy (MWh) declines over time because of the impacts of energy savings decreased peak load requirements and decreased costs during peak periods Well-designed EE programs can deliver energy at an average cost less than that of new power sources Societal savings increase when an infrashystructure project is delayed and then decrease when built When the two lines cross the annual cost of EE equals the annual savings resulting from EE
Delivered Costs and Benefits of EE
Year
$M
Wh
Societal Cost ($MWh saved)
Societal Savings ($MWh saved)
-$5000
-$2500
$0
$2500
$5000
$7500
$10000
1 2 3 4 5 6 7 8 9 10
Growth Offset by EE ndash Increase As EE programs ramp up energy consumption declines This comparison shows the growth with and without EE and illustrates the amount of EE relative to load growth Load growth and energy savings are not impacted by decoupling With load growth assumed at zero no load or percent growth offset shown
Percent Growth Offset by Energy Efficiency
GW
h Energy Savings - EE (GWh)
Load Growth - No EE (GWh)
Growth Offset by EE ()
0
200
400
600
800
1000
1200
1400
1 2 3 4 5 6 7 8 9 10 0
20
40
60
80
100
120
140
160
Year
Emissions and Cost Savings - Increase Peak Load Growth ndash Decrease Annual tons of emissions saved increases Emissions cost Peak load requirements decrease because peak capacitysavings increases when emissions cost is monetized savings are captured due to EE measures Peak load is notEmissions costs and savings are the same with and with- impacted by decouplingout decoupling
90
100
110
120
130
140
150
160
1 2 3 4 5 6 7 8 9 10
Comparison of Peak Load Growth
Year
Peak
Loa
d
of
Firs
t Y
r
Forecasted Growth - No EE
Forecasted Growth - EE and Decoupling
Annual Emissions Savings
Tons
Sav
ed
0
10
20
30
40
50
60
70
1 2 3 4 5 6 7 8 9 10 0
20
40
60
80
100
120
140
160
180
200 Tons SO2 Saved Tons CO Saved Tons VOC Saved 1000 Tons CO2 Saved
Tons NO x Saved Tons PM-10 Saved
1000
Ton
s C
O2
save
d
Year
Appendix B-14 National Action Plan for Energy Efficiency
Case 4 High-Growth With Power Plant Deferral
Utility Perspective
Utility Financial Health ndash Small Changes The change in utility financial health depends on whether or not there are decoupling mechanisms in place if there are shareholder incentives in place (for investor-owned utilities) the frequency of rate adjustments and other factors Depending on the type of utility the measure of financial health changes Investor-owned utility health is measured by ROE while publicly or cooperatively owned utility health is measured by cash position or debt coverage ratio
Investor-Owned Utility Comparison of Return on Equity
Year
Aft
er T
ax R
OE
()
ROE - No EE
ROE - EE no Decoupling
ROE - EE and Decoupling
Target ROE
3
6
9
12
15
1 2 3 4 5 6 7 8 9 10
Utility Earnings ndash Results Vary Utility earnings depend on growth rate capital investment frequency of rate adjustments and other factors If EE reduces capital intvestment the earnings will be lower in the EE case unless shareholder incentives for EE are introshyduced However utility return (ROE or earnings per share) may not be affected
Utility Earnings
YearEa
rnin
gs ($
MM
)
Earnings $MM - No EE
Earnings $MM - EE no Decoupling
Earnings $MM - EE and Decoupling
$0
$20
$40
$60
$80
$100
1 2 3 4 5 6 7 8 9 10
To create a sustainable aggressive national commitment to energy efficiency Appendix B-15
Customer Perspective
Customer Bills ndash Decrease In the first year customer utility bills increase because the cost of the EE program has not yet produced savings Total customer bills decline over time usually within the first three years indicating customer savings resulting from lower energy consumption
Percent Change in Customer Bills
Year
Cha
nge
in B
ills
()
Change in Customer Bills () - EE no Decoupling
Change in Customer Bills () - EE and Decoupling
-21
-18
-15
-12
-9
-6
-3
0
3
6
1 2 3 4 5 6 7 8 9 10
Utility Rates ndash Mild Increase The rates customers pay ($kWh) increase when avoided costs are less than retail rates which is typically the case for most EE programs Rates increase because revenue requireshyments increase more quickly than sales
Societal Perspective
Societal Net Savings ndash Increase The net savings are the difference of total utility costs including EE program costs with EE and without EE In the first year the cost of the EE program is a cost to society Over time cumulative EE savings lead to a utility production cost savings that is greater than the EE program cost The graph shape is therefore upward sloping Total Societal Net Savings is the same with and without decoupling thereshyfore only one line is shown
Annual Total Societal Net Savings
Year N
et S
ocie
tal B
enef
it ($
M)
Total Societal Net Savings ($M)
$200
$400
$600
1 2 3 4 5 6 7 8 9 10
$0
-$200
-$400
-$600
Comparison of Average Rate
Year
Ave
rage
Rat
e ($
kW
h)
Utility Average Rate - No EE
Utility Average Rate - EE no Decoupling
Utility Average Rate - EE and Decoupling
$010
$015
$020
$025
$030
1 2 3 4 5 6 7 8 9 10
Appendix B-16 National Action Plan for Energy Efficiency
Total Societal Cost Per Unit ndash Declines Total cost of providing each unit of energy (MWh) declines over time because of the impacts of energy savings decreased peak load requirements and decreased costs during peak periods Well-designed EE programs can deliver energy at an average cost less than that of new power sources Societal savings increase when an infrashystructure project is delayed and then decrease when built When the two lines cross the annual cost of EE equals the annual savings resulting from EE
Delivered Costs and Benefits of EE
$M
Wh
Societal Cost ($MWh saved)
Societal Savings ($MWh saved)
Year
-$5000
-$2500
$0
$2500
$5000
$7500
$10000
1 2 3 4 5 6 7 8 9 10
Emissions and Cost Savings ndash Increase Annual tons of emissions saved increases Emissions cost savings increases when emissions cost is monetized Emissions costs and savings are the same with and without decoupling
Annual Emissions Savings
Tons
Sav
ed
0
10
20
30
40
50
60
70
1 2 3 4 5 6 7 8 9 10 0
20
40
60
80
100
120
140
160
180
200 Tons SO2 Saved Tons CO Saved Tons VOC Saved 1000 Tons CO2 Saved
Tons NO x Saved Tons PM-10 Saved
1000
Ton
s C
O2
save
d
Year
Growth Offset by EE ndash Increase As EE programs ramp up energy consumption declines This comparison shows the growth with and without EE and illustrates the amount of EE relative to load growth Load growth and energy savings are not impacted by decoupling With load growth assumed at zero no load or percent growth offset shown
Percent Growth Offset by Energy Efficiency
GW
h Energy Savings - EE (GWh)
Load Growth - No EE (GWh)
Growth Offset by EE ()
0
200
400
600
800
1000
1200
1400
1 2 3 4 5 6 7 8 9 10 0
20
40
60
80
100
120
140
160
Year
Peak Load Growth ndash Decrease Peak load requirements decrease because peak capacity savshyings are captured due to EE measures Peak load is not impacted by decoupling
90
100
110
120
130
140
150
160
1 2 3 4 5 6 7 8 9 10
Comparison of Peak Load Growth
Year
Peak
Loa
d
of
Firs
t Y
r
Forecasted Growth - No EE
Forecasted Growth - EE and Decoupling
To create a sustainable aggressive national commitment to energy efficiency Appendix B-17
Case 5 Vertically Integrated Utility
Utility Perspective
Utility Financial Health ndash Small Changes The change in utility financial health depends on whether or not there are decoupling mechanisms in place if there are shareholder incentives in place (for investor-owned utilities) the frequency of rate adjustments and other factors Depending on the type of utility the measure of financial health changes Investor-owned utility health is measured by ROE while publicly or cooperatively owned utility health is measured by cash position or debt coverage ratio
Investor-Owned Utility Comparison of Return on Equity
Year
Aft
er T
ax R
OE
()
ROE - No EE
ROE - EE no Decoupling
ROE - EE and Decoupling
Target ROE
3
6
9
12
15
1 2 3 4 5 6 7 8 9 10
Utility Earnings ndash Results Vary Utility earnings depend on growth rate capital investment frequency of rate adjustments and other factors If EE reduces capital investment the earnings will be lower in the EE case unless shareholder incentives for EE are introduced However utility return (ROE or earnings per share) may not be affected
Utility Earnings
Year
Earn
ings
($M
M)
Earnings $MM - No EE
Earnings $MM - EE no Decoupling
Earnings $MM - EE and Decoupling
$0
$20
$40
$60
$80
$100
1 2 3 4 5 6 7 8 9 10
Appendix B-18 National Action Plan for Energy Efficiency
Customer Perspective
Customer Bills ndash Decrease In the first year customer utility bills increase because the cost of the EE program has not yet produced savings Total customer bills decline over time usually within the first three years indicating customer savings resulting from lower energy consumption
Percent Change in Customer Bills
6
3
Societal Perspective
Societal Net Savings ndash Increase The net savings are the difference of total utility costs including EE program costs with EE and without EE In the first year the cost of the EE program is a cost to society Over time cumulative EE savings lead to a utility production cost savings that is greater than the EE program cost The graph shape is therefore upward sloping Total Societal Net Savings is the same with and without decoupling thereshyfore only one line is shown
Annual Total Societal Net Savings
Year
Net
Soc
ieta
l Ben
efit
($M
)
Total Societal Net Savings ($M)
-$15
-$10
-$5
$0
$5
$10
$15
$20
$25
1 2 3 4 5 6 7 8 9 10
1 2 3 4 5 6 7 8 9 10
Cha
nge
in B
ills
() 0
-3
-6
-9
-12
-15
-18
-21
Year
Change in Customer Bills () - EE no Decoupling
Change in Customer Bills () - EE and Decoupling
Utility Rates ndash Mild Increase The rates customers pay ($kWh) increase when avoided costs are less than retail rates which is typically the case for most EE programs Rates increase because revenue requireshyments increase more quickly than sales
Comparison of Average Rate
Year
Ave
rage
Rat
e ($
kW
h)
Utility Average Rate - No EE
Utility Average Rate - EE no Decoupling
Utility Average Rate - EE and Decoupling
$010
$015
$020
$025
$030
1 2 3 4 5 6 7 8 9 10
To create a sustainable aggressive national commitment to energy efficiency Appendix B-19
Total Societal Cost Per Unit ndash Declines Total cost of providing each unit of energy (MWh) declines over time because of the impacts of energy savings decreased peak load requirements and decreased costs during peak periods Well-designed EE programs can deliver energy at an average cost less than that of new power sources When the two lines cross the annual cost of EE equals the annual savings resulting from EE The Societal Cost and Societal Savings are the same with and without decoupling
Delivered Costs and Benefits of EE
Year
$M
Wh
Societal Cost ($MWh saved)
Societal Savings ($MWh saved)
$0
$100
$200
$300
$400
1 2 3 4 5 6 7 8 9 10
1401200
1201000
100 800
80 600
60
400 40
200 20
0
1 2 3 4 5 6 7 8 9 10 0
Year
Energy Savings - EE (GWh)
Load Growth - No EE (GWh)
Growth Offset by EE ()
Peak Load Growth ndash Decrease Peak load requirements decrease because peak capacity savings are captured due to EE measures Peak load is not impacted by decoupling
Growth Offset by EE ndash Increase As EE programs ramp up energy consumption declines This comparison shows the growth with and without EE and illustrates the amount of EE relative to load growth Load growth and energy savings are not impacted by decoupling With load growth assumed at zero no load or percent growth offset shown
Percent Growth Offset by Energy Efficiency
1601400
GW
h
Emissions and Cost Savings ndash Increase Annual tons of emissions saved increases Emissions cost savings increases when emissions cost is monetized Emissions costs and savings are the same with and withshyout decoupling
Annual Emissions Savings
Tons
Sav
ed
0
10
20
30
40
50
60
70
1 2 3 4 5 6 7 8 9 10 0
20
40
60
80
100
120
140
160
180
200 Tons SO2 Saved Tons CO Saved Tons VOC Saved 1000 Tons CO2 Saved
Tons NO x Saved Tons PM-10 Saved
1000
Ton
s C
O2
save
d
Year
90
100
110
120
130
140
150
160
1 2 3 4 5 6 7 8 9 10
Comparison of Peak Load Growth
Year
Peak
Loa
d
of
Firs
t Y
r
Forecasted Growth - No EE
Forecasted Growth - EE and Decoupling
Appendix B-20 National Action Plan for Energy Efficiency
Case 6 Restructured Delivery-Only Utility
Utility Perspective
Utility Financial Health ndash Small Changes The change in utility financial health depends on whether or not there are decoupling mechanisms in place if there are shareholder incentives in place (for investor-owned utilities) the frequency of rate adjustments and other factors Depending on the type of utility the measure of financial health changes Investor-owned utility health is measured by ROE while publicly or cooperatively owned utility health is measured by cash position or debt coverage ratio
Investor-Owned Utility Comparison of Return on Equity
Year
Aft
er T
ax R
OE
()
ROE - No EE
ROE - EE no Decoupling
ROE - EE and Decoupling
Target ROE
3
6
9
12
15
1 2 3 4 5 6 7 8 9 10
Utility Earnings ndash Results Vary Utility earnings depend on growth rate capital investment frequency of rate adjustments and other factors If EE reduces capital investment the earnings will be lower in the EE case unless shareholder incentives for EE are introduced However utility return (ROE or earnings per share) may not be affected
Utility Earnings
Earn
ings
($M
M)
Earnings $MM - No EE
Earnings $MM - EE no Decoupling
Earnings $MM - EE and Decoupling
Year
$0
$20
$40
$60
$80
$100
1 2 3 4 5 6 7 8 9 10
To create a sustainable aggressive national commitment to energy efficiency Appendix B-21
Customer Perspective
Customer Bills ndash Decrease In the first year customer utility bills increase because the cost of the EE program has not yet produced savings Total customer bills decline over time usually within the first three years indicating customer savings resulting from lower energy consumption
Percent Change in Customer Bills
Year
Cha
nge
in B
ills
()
Change in Customer Bills () - EE no Decoupling
Change in Customer Bills () - EE and Decoupling
-21
-18
-15
-12
-9
-6
-3
0
3
6
1 2 3 4 5 6 7 8 9 10
Utility Rates ndash Mild Increase The rates customers pay ($kWh) increase when avoided costs are less than retail rates which is typically the case for most EE programs Rates increase because revenue requireshyments increase more quickly than sales
Societal Perspective
Societal Net Savings ndash Increase The net savings are the difference of total utility costs including EE program costs with EE and without EE In the first year the cost of the EE program is a cost to society Over time cumulative EE savings lead to a utility production cost savings that is greater than the EE program cost The graph shape is therefore upward sloping Total Societal Net Savings is the same with and without decoupling thereshyfore only one line is shown
Annual Total Societal Net Savings
Year N
et S
ocie
tal B
enefi
t ($
M)
Total Societal Net Savings ($M)
-$15
-$10
-$5
$0
$5
$10
$15
$20
$25
1 2 3 4 5 6 7 8 9 10
Comparison of Average Rate
Year
Ave
rage
Rat
e ($
kW
h)
Utility Average Rate - No EE
Utility Average Rate - EE no Decoupling
Utility Average Rate - EE and Decoupling
$010
$015
$020
$025
$030
1 2 3 4 5 6 7 8 9 10
Appendix B-22 National Action Plan for Energy Efficiency
Total Societal Cost Per Unit ndash Declines Total cost of providing each unit of energy (MWh) declines over time because of the impacts of energy savings decreased peak load requirements and decreased costs during peak periods Well-designed EE programs can deliver energy at an average cost less than that of new power sources When the two lines cross the annual cost of EE equals the annual savings resulting from EE The Societal Cost and Societal Savings are the same with and without decoupling
Delivered Costs and Benefits of EE
$400
Growth Offset by EE ndash Increase As EE programs ramp up energy consumption declines This comparison shows the growth with and without EE and illustrates the amount of EE relative to load growth Load growth and energy savings are not impacted by decoupling With load growth assumed at zero no load or percent growth offset shown
Percent Growth Offset by Energy Efficiency
160
140
1400
1200
1201000
100 800
80
Peak Load Growth ndash Decrease Peak load requirements decrease because peak capacity savings are captured due to EE measures Peak load is not impacted by decoupling
$300
Emissions and Cost Savings ndash Increase Annual tons of emissions saved increases Emissions cost savings increases when emissions cost is monetized
$200
200
GW
h
600 60
400 40
$M
Wh
20
$100 0
1 2 3 4 5 6 7 8 9 10
$0
0
Year 1 2 3 4 5 6 7 8 9 10
Energy Savings - EE (GWh)Year Load Growth - No EE (GWh)
Growth Offset by EE ()Societal Cost ($MWh saved)
Societal Savings ($MWh saved)
Comparison of Peak Load Growth
Year
Peak
Loa
d
of
Firs
t Y
r
Forecasted Growth - No EE
Forecasted Growth - EE and Decoupling
90
100
110
120
130
140
150
160
1 2 3 4 5 6 7 8 9 10
Emissions costs and savings are the same with and withshyout decoupling
Annual Emissions Savings
Tons
Sav
ed
0
10
20
30
40
50
60
70
1 2 3 4 5 6 7 8 9 10 0
20
40
60
80
100
120
140
160
180
200 Tons SO2 Saved Tons CO Saved Tons VOC Saved 1000 Tons CO2 Saved
Tons NO x Saved Tons PM-10 Saved
1000
Ton
s C
O2
save
d
Year
To create a sustainable aggressive national commitment to energy efficiency Appendix B-23
Case 7 Electric Publicly and Cooperatively Owned Debt Coverage Ratio
Utility Perspective
Utility Financial Health ndash Small Changes The change in utility financial health depends on whether or not there are decoupling mechanisms in place if there are shareholder incentives in place (for investor-owned utilities) the frequency of rate adjustments and other factors Depending on the type of utility the measure of financial health changes Investor-owned utility health is measured by ROE while publicly or cooperatively owned utility health is measured by cash position or debt coverage ratio
Public PowerCooperative Debt Coverage Ratio
Year
Deb
t C
over
age
Ratio
Debt Coverage Ratio - No EE
Debt Coverage Ratio - EE no Decoupling
Debt Coverage Ratio - EE and Decoupling
100
150
200
250
1 3 5 7 92 4 6 8 10
Utility Earnings ndash Results Vary Utility earnings depend on growth rate capital investment frequency of rate adjustments and other factors If EE reduces capital investment the earnings will be lower in the EE case unless shareholder incentives for EE are introduced However utility return (ROE or earnings per share) may not be affected
Utility Earnings
Earn
ings
($M
M)
Earnings $MM - No EE
Earnings $MM - EE no Decoupling
Earnings $MM - EE and Decoupling
$0
$20
$40
$60
$80
$100
1 2 3 4 5 6 7 8 9 10
Year
Appendix B-24 National Action Plan for Energy Efficiency
Customer Perspective
Customer Bills ndash Decrease In the first year customer utility bills increase because the cost of the EE program has not yet produced savings Total customer bills decline over time usually within the first three years indicating customer savings resulting from lower energy consumption
Percent Change in Customer Bills
Year
Cha
nge
in B
ills
()
Change in Customer Bills () - EE no Decoupling
Change in Customer Bills () - EE and Decoupling
-21
-18
-15
-12
-9
-6
-3
0
3
6
1 2 3 4 5 6 7 8 9 10
Utility Rates ndash Mild Increase The rates customers pay ($kWh) increase when avoided costs are less than retail rates which is typically the case for most EE programs Rates increase because revenue requireshyments increase more quickly than sales
Societal Perspective
Societal Net Savings ndash Increase The net savings are the difference of total utility costs including EE program costs with EE and without EE In the first year the cost of the EE program is a cost to society Over time cumulative EE savings lead to a utility production cost savings that is greater than the EE program cost The graph shape is therefore upward sloping Total Societal Net Savings is the same with and without decoupling thereshyfore only one line is shown
Annual Total Societal Net Savings
Year
Net
Soc
ieta
l Ben
efit
($M
)
Total Societal Net Savings ($M)
-$15
-$10
-$5
$0
$15
$20
$25
1 2 3 4 5 6 7 8 9 10
$5
$10
Comparison of Average Rate
Year
Ave
rage
Rat
e ($
kW
h)
Utility Average Rate - No EE
Utility Average Rate - EE no Decoupling
Utility Average Rate - EE and Decoupling
$010
$015
$020
$025
$030
1 2 3 4 5 6 7 8 9 10
To create a sustainable aggressive national commitment to energy efficiency Appendix B-25
Total Societal Cost Per Unit ndash Declines Total cost of providing each unit of energy (MWh) declines over time because of the impacts of energy savings decreased peak load requirements and decreased costs during peak periods Well-designed EE programs can deliver energy at an average cost less than that of new power sources When the two lines cross the annual cost of EE equals the annual savings resulting from EE The Societal Cost and Societal Savings are the same with and without decoupling
Delivered Costs and Benefits of EE
Year
$M
Wh
Societal Cost ($MWh saved)
Societal Savings ($MWh saved)
$0
$100
$200
$300
$400
1 2 3 4 5 6 7 8 9 10
1401200
1201000
100 800
80 600
60
400 40
200 20
00 1 2 3 4 5 6 7 8 9 10
Year
Energy Savings - EE (GWh)
Load Growth - No EE (GWh)
Growth Offset by EE ()
Peak Load Growth ndash Decrease Peak load requirements decrease because peak capacity savings are captured due to EE measures Peak load is not impacted by decoupling
Growth Offset by EE ndash Increase As EE programs ramp up energy consumption declines This comparison shows the growth with and without EE and illustrates the amount of EE relative to load growth Load growth and energy savings are not impacted by decoupling With load growth assumed at zero no load or percent growth offset shown
Percent Growth Offset by Energy Efficiency
1601400
GW
h
Emissions and Cost Savings ndash Increase Annual tons of emissions saved increases Emissions cost savings increases when emissions cost is monetized Emissions costs and savings are the same with and withshyout decoupling
Annual Emissions Savings
Tons
Sav
ed
0
10
20
30
40
50
60
70
1 2 3 4 5 6 7 8 9 10 0
20
40
60
80
100
120
140
160
180
200 Tons SO2 Saved Tons CO Saved Tons VOC Saved 1000 Tons CO2 Saved
Tons NO x Saved Tons PM-10 Saved
1000
Ton
s C
O2
save
d
Year
Comparison of Peak Load Growth
Year
Peak
Loa
d
of
Firs
t Y
r
Forecasted Growth - No EE
Forecasted Growth - EE and Decoupling
90
100
110
120
130
140
150
160
1 2 3 4 5 6 7 8 9 10
Appendix B-26 National Action Plan for Energy Efficiency
Case 8 Electric Publicly and Cooperatively Owned Cash Position
Utility Perspective
Utility Financial Health ndash Small Changes The change in utility financial health depends on whether or not there are decoupling mechanisms in place if there are shareholder incentives in place (for investor-owned utilities) the frequency of rate adjustments and other factors Depending on the type of utility the measure of financial health changes Investor-owned utility health is measured by ROE while publicly or cooperatively owned utility health is measured by cash position or debt coverage ratio
Cash Position at End of Year
Year
End
of Y
ear
Cas
h ($
MM
)
$40
$50
$60
$70
$80
1 2 3 4 5 6 7 8 9 10
Cash Position - No EE
Cash Position - EE no Decoupling
Cash Position - EE and Decoupling
Utility Earnings ndash Results Vary Utility earnings depend on growth rate capital investment frequency of rate adjustments and other factors If EE reduces capital investment the earnings will be lower in the EE case unless shareholder incentives for EE are introduced However utility return (ROE or earnings per share) may not be affected
Utility Earnings
Earn
ings
($M
M)
Earnings $MM - No EE
Earnings $MM - EE no Decoupling
Earnings $MM - EE and Decoupling
$0
$20
$40
$60
$80
$100
1 2 3 4 5 6 7 8 9 10
Year
To create a sustainable aggressive national commitment to energy efficiency Appendix B-27
Customer Perspective
Customer Bills ndash Decrease In the first year customer utility bills increase because the cost of the EE program has not yet produced savings Total customer bills decline over time usually within the first three years indicating customer savings resulting from lower energy consumption
Percent Change in Customer Bills
Year
Cha
nge
in B
ills
()
Change in Customer Bills () - EE no Decoupling
Change in Customer Bills () - EE and Decoupling
-21
-18
-15
-12
-9
-6
-3
0
3
6
1 2 3 4 5 6 7 8 9 10
Utility Rates ndash Mild Increase The rates customers pay ($kWh) increase when avoided costs are less than retail rates which is typically the case for most EE programs Rates increase because revenue requireshyments increase more quickly than sales
Societal Perspective
Societal Net Savings ndash Increase The net savings are the difference of total utility costs including EE program costs with EE and without EE In the first year the cost of the EE program is a cost to society Over time cumulative EE savings lead to a utility production cost savings that is greater than the EE program cost The graph shape is therefore upward sloping Total Societal Net Savings is the same with and without decoupling thereshyfore only one line is shown
Annual Total Societal Net Savings
Year N
et S
ocie
tal B
enefi
t ($
M)
Total Societal Net Savings ($M)
-$15
-$10
-$5
$0
$15
$20
$25
1 2 3 4 5 6 7 8 9 10
$5
$10
Comparison of Average Rate
Year
Ave
rage
Rat
e ($
kW
h)
Utility Average Rate - No EE
Utility Average Rate - EE no Decoupling
Utility Average Rate - EE and Decoupling
$010
$015
$020
$025
$030
1 2 3 4 5 6 7 8 9 10
Appendix B-28 National Action Plan for Energy Efficiency
Total Societal Cost Per Unit ndash Declines Total cost of providing each unit of energy (MWh) declines over time because of the impacts of energy savings decreased peak load requirements and decreased costs during peak periods Well-designed EE programs can deliver energy at an average cost less than that of new power sources When the two lines cross the annual cost of EE equals the annual savings resulting from EE The Societal Cost and Societal Savings are the same with and without decoupling
Growth Offset by EE ndash Increase As EE programs ramp up energy consumption declines This comparison shows the growth with and without EE and illustrates the amount of EE relative to load growth Load growth and energy savings are not impacted by decoupling With load growth assumed at zero no load or percent growth offset shown
Percent Growth Offset by Energy Efficiency
GW
h
Energy Savings - EE (GWh)
Load Growth - No EE (GWh)
Growth Offset by EE ()
Year
0
200
400
600
800
1000
1200
1400
1 2 3 4 5 6 7 8 9 10 0
20
40
60
80
100
120
140
160
Delivered Costs and Benefits of EE
Year
$M
Wh
Societal Cost ($MWh saved)
Societal Savings ($MWh saved)
$0
$100
$200
$300
$400
1 2 3 4 5 6 7 8 9 10
Peak Load Growth ndash Decrease Peak load requirements decrease because peak capacity
Emissions and Cost Savings ndash Increase savings are captured due to EE measures Peak load is not Annual tons of emissions saved increases Emissions cost sav- impacted by decoupling ings increases when emissions cost is monetized Emissions costs and savings are the same with and without decoupling
Annual Emissions Savings
70 Tons SO2 Saved Tons CO Saved Tons VOC Saved 1000 Tons CO2 Saved
Tons NO x Saved Tons PM-10 Saved 200
180 60
Comparison of Peak Load Growth
Year
Peak
Loa
d
of
Firs
t Y
r
Forecasted Growth - No EE
Forecasted Growth - EE and Decoupling
90
100
110
120
130
140
150
160
1 2 3 4 5 6 7 8 9 10
160 50 140
12040 100
30 80
60
40 20
10 20
0 0 1 2 3 4 5 6 7 8 9 10
Year
1000
Ton
s C
O s
aved
2
Tons
Sav
ed
To create a sustainable aggressive national commitment to energy efficiency Appendix B-29
Funding and printing for this report was provided by the US Department of Energy and US Environmental
Protection Agency in their capacity as co-sponsors for the National Action Plan for Energy Efficiency
RecycledRecyclablemdashPrinted with Vegetable Oil Based Inks on 100 (Minimum 50 postconsumer) Recycled Paper