
Naspng491
21
Mike Cronin 716 479 2722 [email protected] Zach Fidurko 716 378 5970 [email protected] Matt Minemier 814-222-1854 [email protected] Naser Saleh 814-441-1599 [email protected] Pure Energy Consultants, LLC East Resources Texas Creek Oriskany Sandstone Reservoir Characterization: Update (Nov 18th, 2010)
Transcript of Naspng491

Mike Cronin716 479 2722
Zach Fidurko716 378 5970
Matt Minemier814-222-1854
Naser Saleh814-441-1599
Pure Energy Consultants, LLC
East Resources Texas Creek Oriskany Sandstone Reservoir Characterization: Update (Nov 18th, 2010)

Recap: Development Plan
Blk = Wells in PlaceRed = Phase 1 Wells: Data Acquisition and ProductionWht = Phase 2 Wells: Conditional on Phase 1, Part In-Field and Part Exploratory.
Volume of Recoverable Gas Per Block (SCF), North Up. Circle Area Denotes Drainage Area (120 acres for Future Wells).
Graham #2

OverviewAccomplished:
-Finished Calculations for Vertical Well Directional, Horizontal Well
- Cement calculations
- Mud design
- Casing design
- Bit selection

Predicting Fracture Gradient
• After PNG 450 NotesFracture Pressure (EQ. 5.25):
Po = Overburden Pressure (0.9 to 1.0 psi/ft)Pr = Pore Pressure (Measurable with a formation tester)α = Constant, approximately 0.5
Equation obtained from John T. Dewan, “Essentials of Modern Open-Hole Log Interpretation.”

0
1000
2000
3000
4000
5000
6000
7000
8000
0 1000 2000 3000 4000 5000 6000 7000 8000
De
pth
(TV
D)
Pressure (psia)Pore Pressure and Fracture Pressure
Pore Pressure
Ben Eaton Fracture
Hubbert & Willis Min
Hubbert & Willis Max
EQ 5.25
Field Mud Pressure
Pore Pressure and Fracture Gradient

0
1000
2000
3000
4000
5000
6000
7000
8000
0 5 10 15 20 25
De
pth
(TV
D)
Equivalent Mud Weight (PPG)
Pore Pressure and Fracture Pressure EMW
Pore Pressure
Ben Eaton Fracture
Hubbert & Willis MinHubbert & Willis Max
Open Hole
9-5/8”
7”
16-20”
Air Till Kickoff Point
Fresh Water Mud to TD

6000
6500
7000
7500
8000
8500
9000
2228000 2230000 2232000 2234000 2236000 2238000 2240000
De
pth
(ft
KB
)X Coordinate
Graham 2 Delciotto 1 Delciotto 2 Shepard 1
Tully Limestone
Hamilton Shale
Marcellus Shale
Needmore Shale
Onondaga Limestone
Oriskany SS
Oriskany TD
Formation Top Bottom Thickness
Sand/Shale/Silstone 0 2640 2640
Shale 2640 6133 3493
Tully Limestone 6133 6262 129
Hamilton Shale 6262 7248 986
Marcellus Shale 7248 7482 234
Needmore Shale 7482 7533 51
Onondaga Limestone 7533 7602 69
Oriskany SS 7602 7671 69
Top: Graham # 2 Formation Tops from East Resources Completion Reports.
Left: Formation Tops in Texas Creek.
Generalizing Well Development:
-Key Formations Identified
-Relate to KOP, Maximum
Inclination, Loss Additives, TD, etc.

0
1000
2000
3000
4000
5000
6000
7000
8000
0 500 1000
Vertical
Vertical Well
-TD = 7500’-MD = 7500’
Drilling Plan:
Use Air and Hammer Bit down to ~6000’.
Switch to Fresh Water Mud and PDC Bit to TD.
Mud up in preparation for Marcellus and Oriskany.

0
1000
2000
3000
4000
5000
6000
7000
8000
0 500 1000Directional
13
20
ft
660’
66
0’
TD = 7500’ KB
Directional Well
40 acre plot, well head at NW corner, target at center.
Well trajectory, looking NE.
KOP = 1300’
R1 = 450’α1 = 12.7o/100’LBC = 157’
LCD = 2571’θ = 20o
DO = 3870’
R2 = 450’α2 = 12.7o/100’LDE = 157’
TD = 7500’ / MD = 7661’
A
B
C
D
E
F
Symmetric Build Hold and Drop ‘S’ Well
-TD = 7500’-MD = 7661’-Horz. Departure = 933’

Directional WellROB1 = 12.7deg/100’ ROB2 = 12.7 deg/100’ Max Inclination = 8.65 degKOP = 1300’ DO = 2301’ TD = 7500’
0
1000
2000
3000
4000
5000
6000
7000
8000
0 5 10 15 20 25
De
pth
(TV
D)
Equivalent Mud Weight (PPG)Pore Pressure and Fracture Pressure EMW
Pore Pressure
Ben Eaton Fracture
Hubbert & Willis Min
Hubbert & Willis Max
Field Mud Pressure

0
1000
2000
3000
4000
5000
6000
7000
8000
0 1000 2000 3000 4000Horizontal
KOP = 6680’
Horizontal Well
R1 = 820’
α = 7o/100’
A
B
C D
KOP = 6680’
Horizontal Departure = 3820’
Horizontal Length = 3000’
L CD = 3000’L BC = 1286’ Planar View of Well Trajectory.
TD = 7500’MD = 10966’

Horizontal WellROB = 7deg/100’KOP = 6680’TD = 7500
0
1000
2000
3000
4000
5000
6000
7000
8000
0 5 10 15 20 25
De
pth
(TV
D)
Equivalent Mud Weight (PPG)Pore Pressure and Fracture Pressure EMW
Pore PressureBen Eaton FractureHubbert & Willis Min
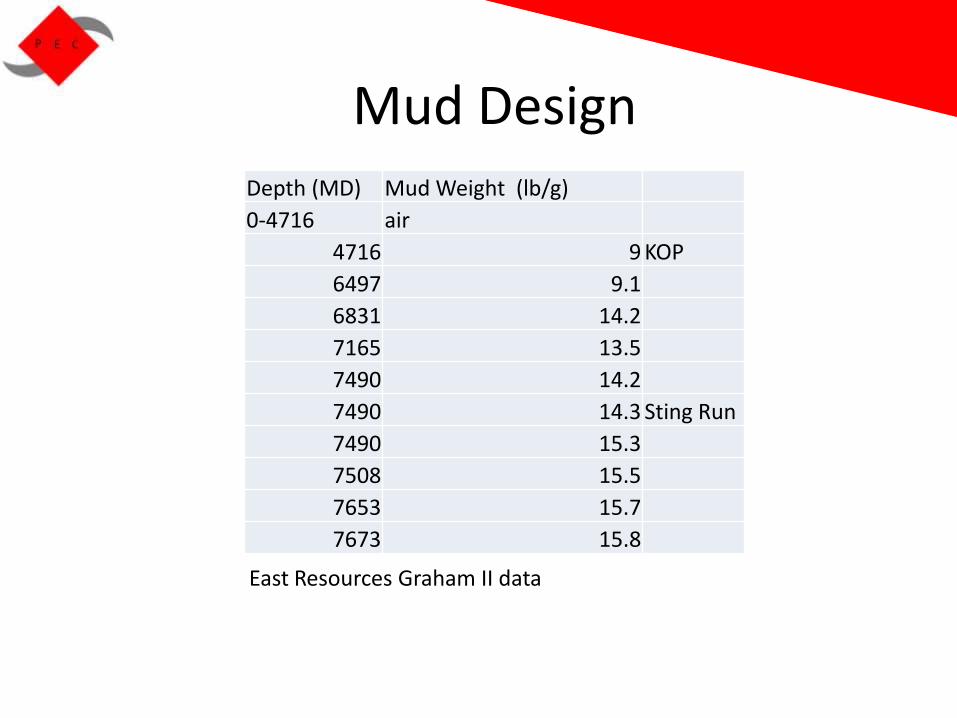
Mud DesignDepth (MD) Mud Weight (lb/g)
0-4716 air
4716 9 KOP
6497 9.1
6831 14.2
7165 13.5
7490 14.2
7490 14.3 Sting Run
7490 15.3
7508 15.5
7653 15.7
7673 15.8
East Resources Graham II data

Mud
Horizontal
Depth (ft) Capacity (bbls)
KOP (6680) 446
Landing Pt (7966) 493
TD (10966) 602 http://www.petroleumonline.com/content/overview.asp?mod=4
• Water based drilling mud – less expensive, Most common in Appalachian • Lost circulation control – controls lost mud in high permeability sandstone,
prevents mud cakes (e.g. Nut shell)
Vertical
Depth (ft) Capacity (bbls)
TVD (7500) 526
Directional
Depth (ft) Capacity (bbls)
KOP (1300) 116.98
TD (7660) 552.1

Hammer Time
ITEM OD & #/ft. LENGTH
Bit 12-1/4" 1.20
Hammer 5.65
Shock Sub 12.14
DC 8" 58.58
Bell Sub 2.76
DC 6" 269.68
XO 1.24
ITEM OD & #/ft. LENGTH
Bit 12-1/4" 1.00
Hammer 5.67
Shocksub 12.18
BHS 2.68
DC 8" 59.14
Bell Sub 2.07
DC 6" 177.33
XO 1.27

Bit Selection
• Reservoir formation
• Why chose a PDC bit?
• How effective is a PDC bit?

Economics Analysis
• The Economic advantage of a PDC bit.
– Save time and money.
– Has more uses.
– Help increase profit.
– AFE

Economic Analysis
ROP DelCiotto #1
Days
0
4.189189 1
2
3
4
59.72973 5
6
7
8
9
10
11
64.35135 12
64.35135
13
29.7027 14
29.7027 15
Graham
days
n/a 0
n/a 1
80.37037 2
n/a 3
n/a 4
n/a 5
n/a 6
n/a 7
23.46218 8
n/a
23.36402 9
n/a
23.36402 10
n/a
23.36402 11
n/a
23.36402 12
n/a
n/a 13
49.42529
n/a 14
21.088 15
n/a 16
n/a 17
n/a 18
n/a 19
18 20
4.5
3.142857 21
n/a
n/a 22
6.333333
8.740741 23
6.785714
8.740741 24
6.785714
ROPDelCiotto
#2
Days
0
54.58537 1
54.58537 2
3
54.58537
4
54.58537
5
54.58537
6
78.10448
78.10448 7
8
78.10448
9
78.10448
10
78.10448
11
78.10448
12
78.10448
28.54936 13
78.10448
28.54936 14
78.10448
28.54936 15
4.59375 16
• Information taken from the Daily reports for:• DelCiotto #1• DelCiotto #2• DelCiotto #3

Casing Details

Casing Strength
Casing Weight Diameter Burst (psi) Collapse (psi) Tensile (lb/ft)
36 # 9-5/8" 3520 2020 3636428
23 # 7" 5280 3270 3636428
10.5 # 4-1/2" 6081 4010 3636428
43.5 # 9-5/8" 8700 4419 830401
26 # 7" 9955 5900 830401
13.5 # 4-1/2" 16275 10670 830401
J-55
P110
TensileCollapseBurst

Cementhttp://loga.la/haynesville-shale-news/?p=361
• Class A cement for all casing strings• Cement goes to surface for all strings• Pump 50% excess to account for fluid lost• Common Additives:
• Bentonite- Increases viscosity, lowers slurry density, decreases cost• Cement retarder- Reduces cement setting time (Calcium lignosulfonate)• Lost circulation- Prevents loss of cement into formation
• Yield is 1.17 cuft/sack
Directional
Casing Weight Capacity (bbls) Sacks
9-5/8" 43.5 # 77.097 370
7" 26 # 73.01 350.4
Horizontal
Casing Weight Capacity (bbls) Sacks
9-5/8" 43.5 # 69.72 334
7" 26 # 28.2 135.5
4-1/2" 13.5 # 195 937
Vertical
Casing Weight Capacity (bbls) Sacks
9-5/8" 43.5 # 69.72 334
7" 26 # 169 559