Nashville-Davidson Metro Housing Policy & Feasibility … · Nashville-Davidson Metro Housing...
38
Berkeley Denver Los Angeles Sacramento Nashville-Davidson Metro Housing Policy & Feasibility Study November 10, 2015 Presented by: Daniel R. Guimond, Principal David T. Schwartz, Vice President Economic & Planning Systems, Inc.
-
Upload
nguyendieu -
Category
Documents
-
view
216 -
download
0
Transcript of Nashville-Davidson Metro Housing Policy & Feasibility … · Nashville-Davidson Metro Housing...
Berkeley Denver Los Angeles Sacramento
Nashville-Davidson Metro Housing Policy & Feasibility Study
November 10, 2015
Presented by:
Daniel R. Guimond, Principal David T. Schwartz, Vice President Economic & Planning Systems, Inc.
1 Nashville Inclusionary Zoning Feasibility Study
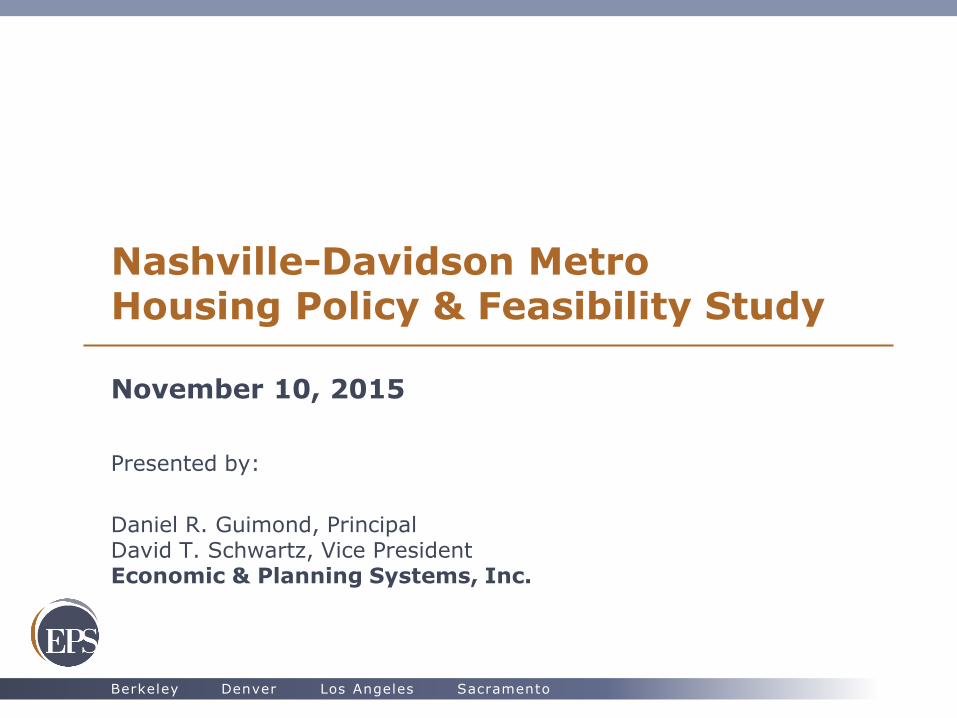
Economic & Planning Systems
• Full service economic consulting firm
• Denver, Berkeley, Sacramento, Los Angeles
• Expertise
– Real estate economics
– Economic development
– Public finance
– Fiscal and economic impacts
– Land use policy
– Housing policy, feasibility and analysis
• Clients
– Cities, Counties, Public Agencies and Special Districts, State and Federal Agencies, Nonprofit/Advocacy Organizations, Private Sector, Educational Institutions, Industry Associations
2 Nashville Inclusionary Zoning Feasibility Study
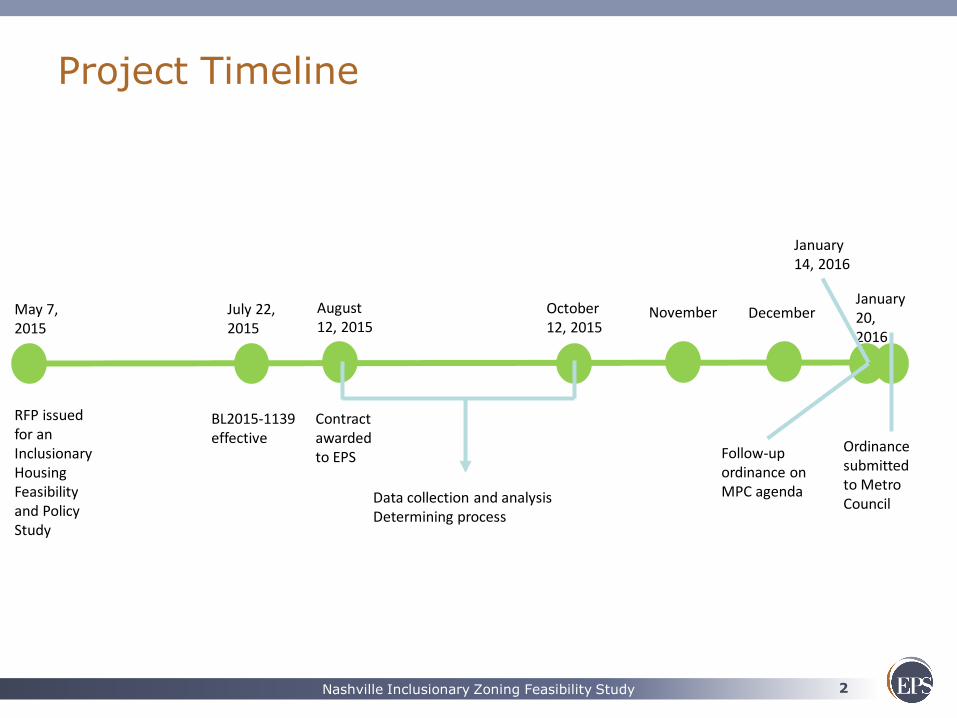
Project Timeline
May 7, 2015
October 12, 2015
RFP issued for an Inclusionary Housing Feasibility and Policy Study
July 22, 2015
BL2015-1139 effective
August 12, 2015
Contract awarded to EPS
Data collection and analysis Determining process
January 20, 2016
November December
January 14, 2016
Follow-up ordinance on MPC agenda
Ordinance submitted to Metro Council
3 Nashville Inclusionary Zoning Feasibility Study
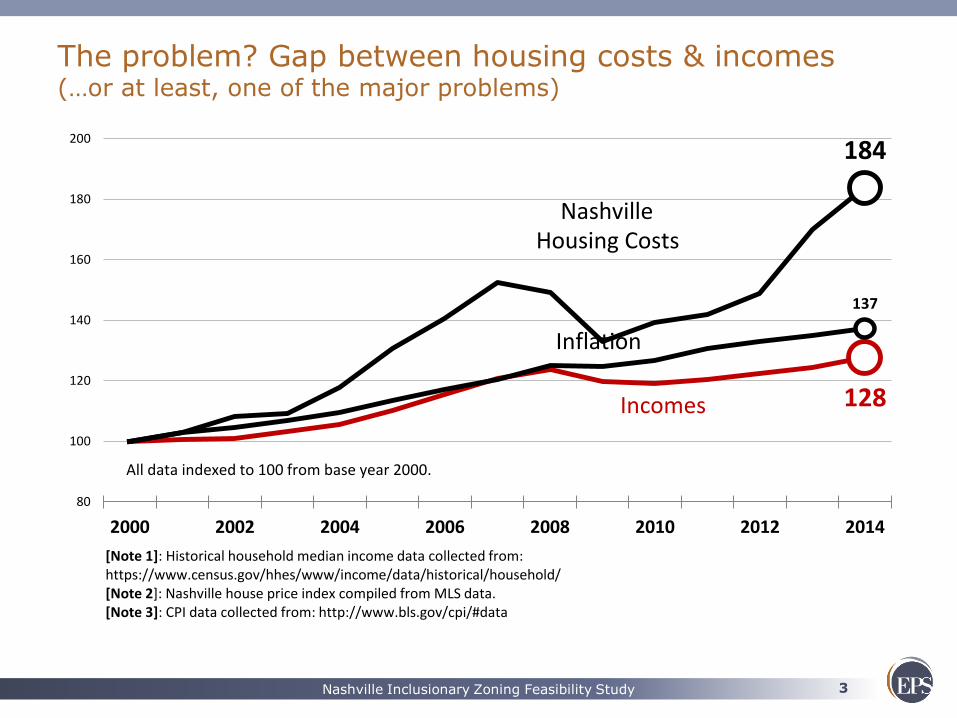
The problem? Gap between housing costs & incomes (…or at least, one of the major problems)
137
80
100
120
140
160
180
200
2000 2002 2004 2006 2008 2010 2012 2014
[Note 1]: Historical household median income data collected from: https://www.census.gov/hhes/www/income/data/historical/household/[Note 2]: Case-Shiller indexes collected from: http://us.spindices.com/indices/real-estate/sp-case-shiller-us-national-home-price-index [Note 3]: CPI data collected from: http://www.bls.gov/cpi/#data
Inflation
All data indexed to 100 from base year 2000.
128
137
80
100
120
140
160
180
200
2000 2002 2004 2006 2008 2010 2012 2014
[Note 1]: Historical household median income data collected from: https://www.census.gov/hhes/www/income/data/historical/household/[Note 2]: Case-Shiller indexes collected from: http://us.spindices.com/indices/real-estate/sp-case-shiller-us-national-home-price-index [Note 3]: CPI data collected from: http://www.bls.gov/cpi/#data
Incomes
Inflation
All data indexed to 100 from base year 2000.
128
160
137
80
100
120
140
160
180
200
2000 2002 2004 2006 2008 2010 2012 2014
[Note 1]: Historical household median income data collected from: https://www.census.gov/hhes/www/income/data/historical/household/[Note 2]: Case-Shiller indexes collected from: http://us.spindices.com/indices/real-estate/sp-case-shiller-us-national-home-price-index [Note 3]: CPI data collected from: http://www.bls.gov/cpi/#data
Housing Costs
Incomes
Inflation
All data indexed to 100 from base year 2000.
National
128
184
137
80
100
120
140
160
180
200
2000 2002 2004 2006 2008 2010 2012 2014
[Note 1]: Historical household median income data collected from: https://www.census.gov/hhes/www/income/data/historical/household/[Note 2]: Nashville house price index compiled from MLS data.[Note 3]: CPI data collected from: http://www.bls.gov/cpi/#data
Housing Costs
Incomes
Inflation
All data indexed to 100 from base year 2000.
Nashville
4 Nashville Inclusionary Zoning Feasibility Study
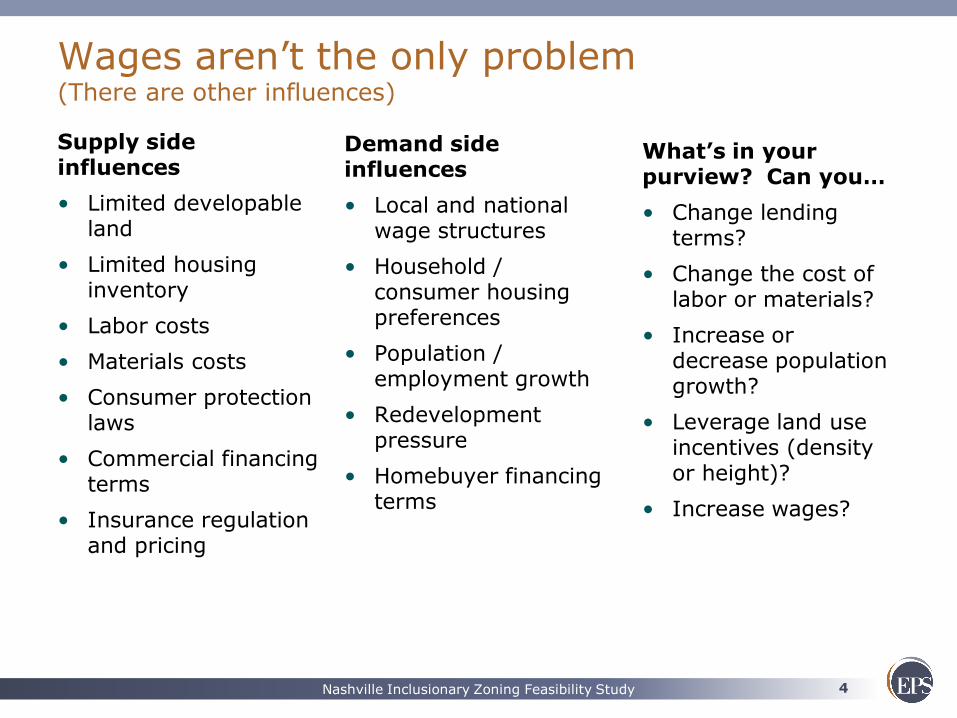
Wages aren’t the only problem (There are other influences)
Supply side influences
• Limited developable land
• Limited housing inventory
• Labor costs
• Materials costs
• Consumer protection laws
• Commercial financing terms
• Insurance regulation and pricing
Demand side influences
• Local and national wage structures
• Household / consumer housing preferences
• Population / employment growth
• Redevelopment pressure
• Homebuyer financing terms
What’s in your purview? Can you…
• Change lending terms?
• Change the cost of labor or materials?
• Increase or decrease population growth?
• Leverage land use incentives (density or height)?
• Increase wages?
5 Nashville Inclusionary Zoning Feasibility Study
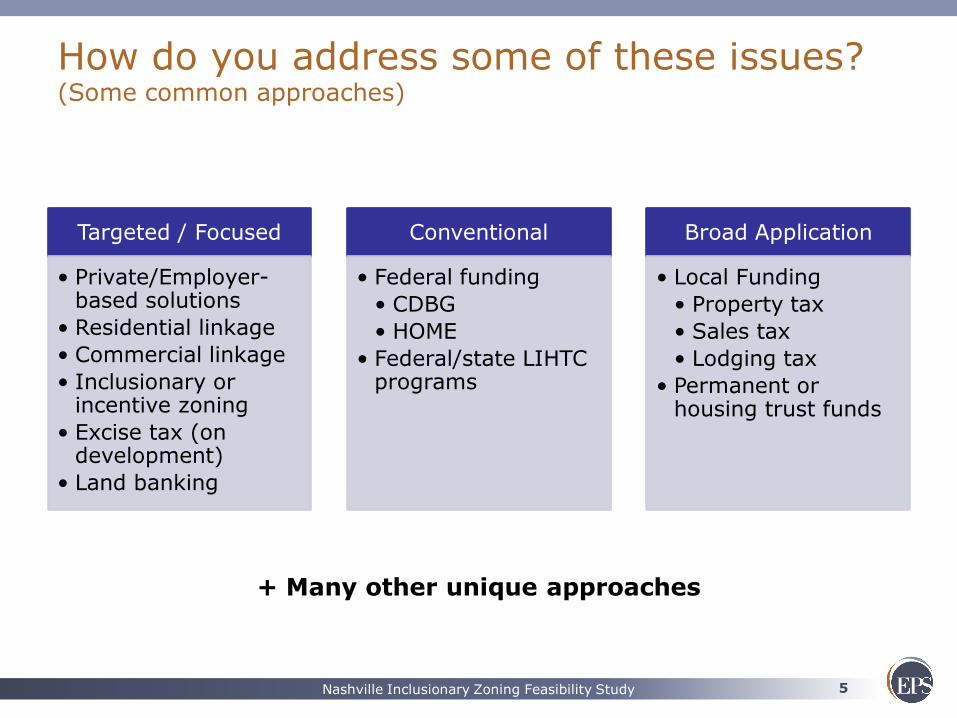
How do you address some of these issues? (Some common approaches)
Targeted / Focused
• Private/Employer-based solutions
• Residential linkage
• Commercial linkage
• Inclusionary or incentive zoning
• Excise tax (on development)
• Land banking
Conventional
• Federal funding
• CDBG
• HOME
• Federal/state LIHTC programs
Broad Application
• Local Funding
• Property tax
• Sales tax
• Lodging tax
• Permanent or housing trust funds
+ Many other unique approaches
6 Nashville Inclusionary Zoning Feasibility Study
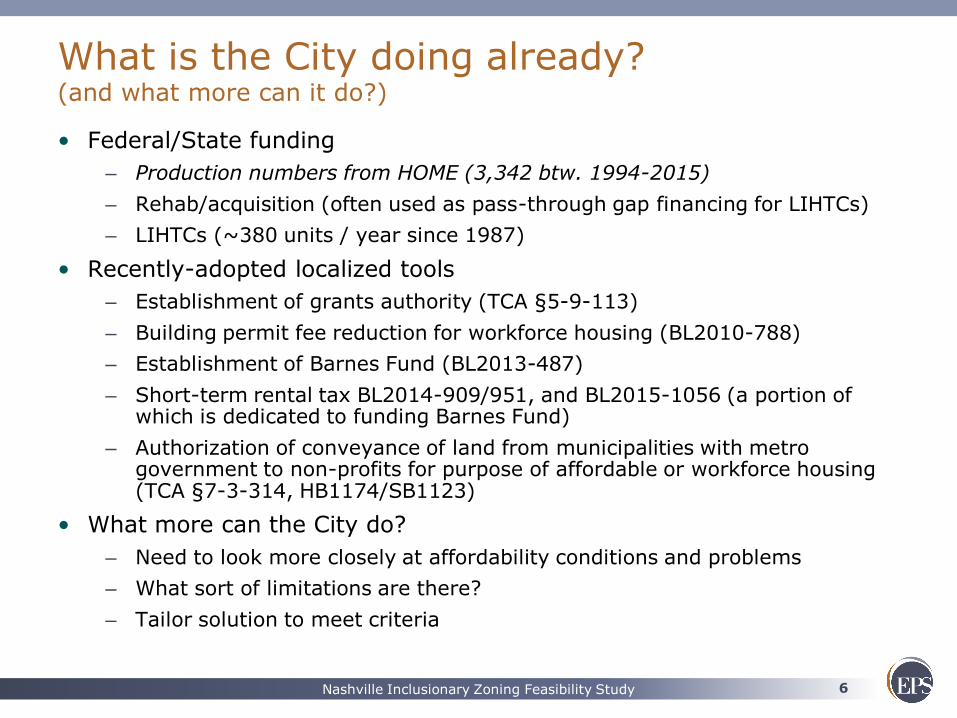
What is the City doing already? (and what more can it do?)
• Federal/State funding
– Production numbers from HOME (3,342 btw. 1994-2015)
– Rehab/acquisition (often used as pass-through gap financing for LIHTCs)
– LIHTCs (~380 units / year since 1987)
• Recently-adopted localized tools
– Establishment of grants authority (TCA §5-9-113)
– Building permit fee reduction for workforce housing (BL2010-788)
– Establishment of Barnes Fund (BL2013-487)
– Short-term rental tax BL2014-909/951, and BL2015-1056 (a portion of which is dedicated to funding Barnes Fund)
– Authorization of conveyance of land from municipalities with metro government to non-profits for purpose of affordable or workforce housing (TCA §7-3-314, HB1174/SB1123)
• What more can the City do?
– Need to look more closely at affordability conditions and problems
– What sort of limitations are there?
– Tailor solution to meet criteria
7 Nashville Inclusionary Zoning Feasibility Study
Definitions TCA § 5-9-113 (2015)
• What is “affordable housing”?
– “…housing that…costs 30 percent or less than the estimated median household income for households earning 60 percent or less of median household income [AMI]…”
• What is “workforce housing”?
– “…housing that…costs 30 percent or less than the estimated median household income for households earning more than 60 percent and not to exceed 120 percent [AMI]…”
8 Nashville Inclusionary Zoning Feasibility Study
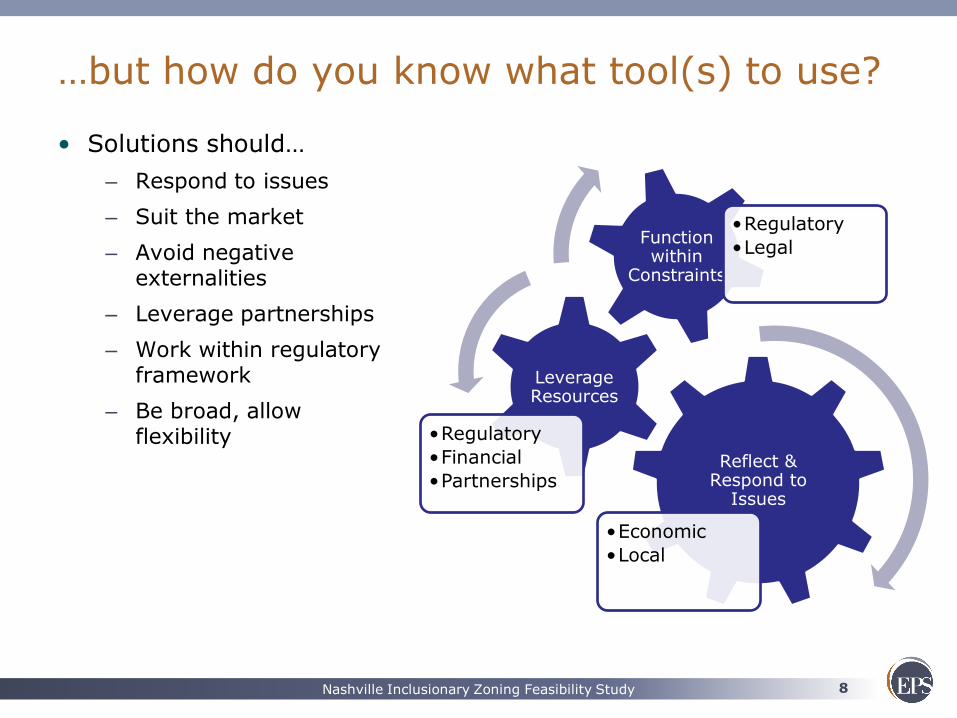
…but how do you know what tool(s) to use?
• Solutions should…
– Respond to issues
– Suit the market
– Avoid negative externalities
– Leverage partnerships
– Work within regulatory framework
– Be broad, allow flexibility
Reflect & Respond to
Issues
•Economic
•Local
Leverage Resources
•Regulatory
•Financial
•Partnerships
Function within
Constraints
•Regulatory
•Legal
9 Nashville Inclusionary Zoning Feasibility Study
ECONOMIC CONDITIONS
A look at some of the problems Nashville is facing
10 Nashville Inclusionary Zoning Feasibility Study
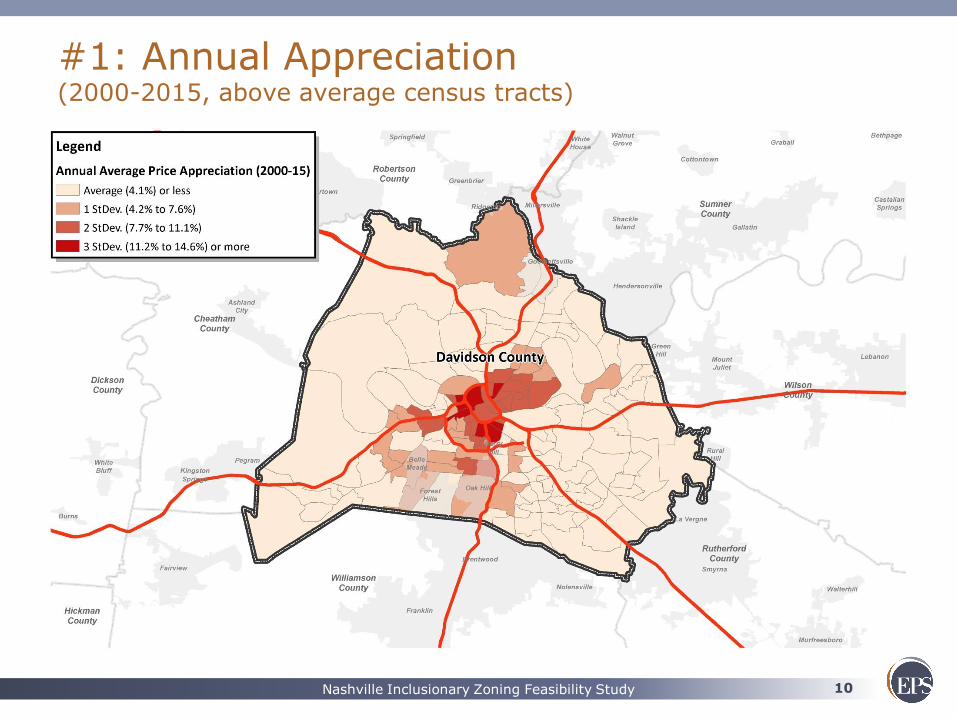
#1: Annual Appreciation (2000-2015, above average census tracts)
11 Nashville Inclusionary Zoning Feasibility Study
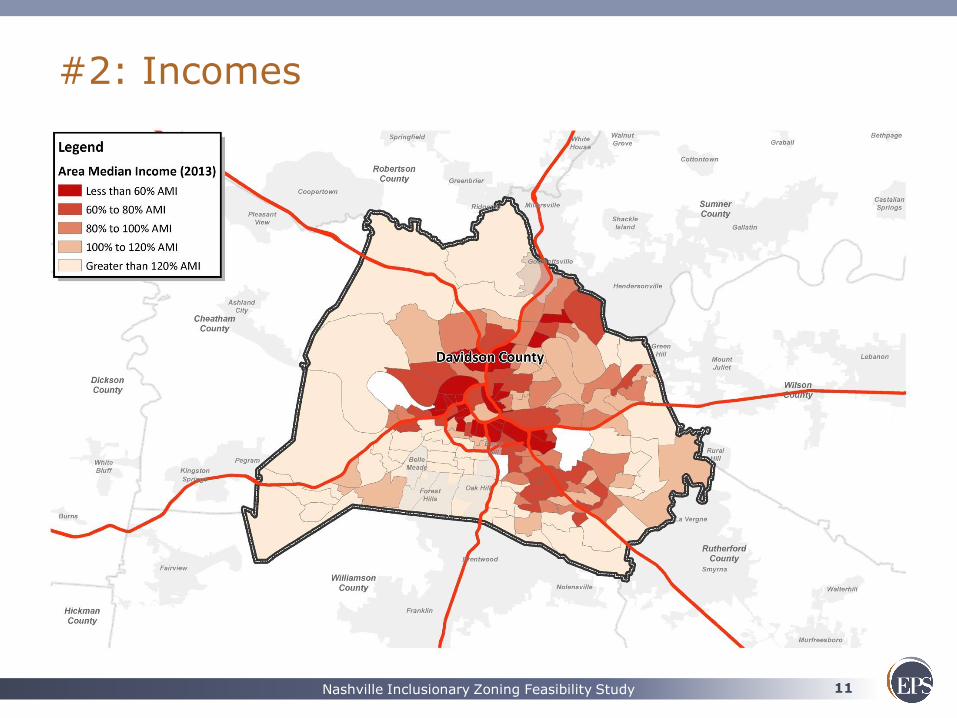
#2: Incomes
12 Nashville Inclusionary Zoning Feasibility Study
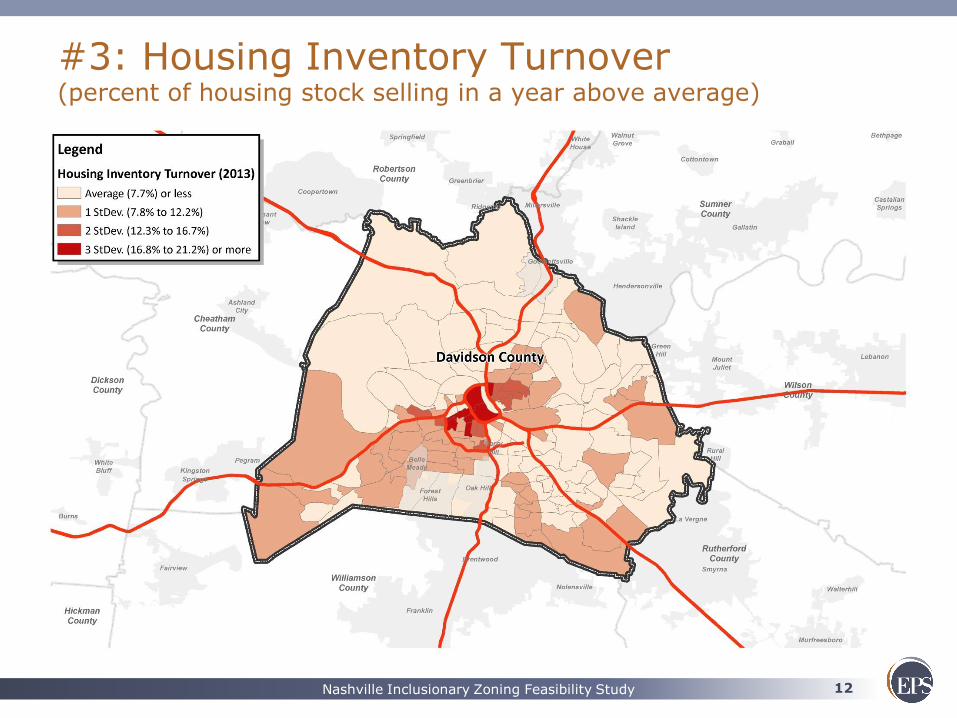
#3: Housing Inventory Turnover (percent of housing stock selling in a year above average)
13 Nashville Inclusionary Zoning Feasibility Study
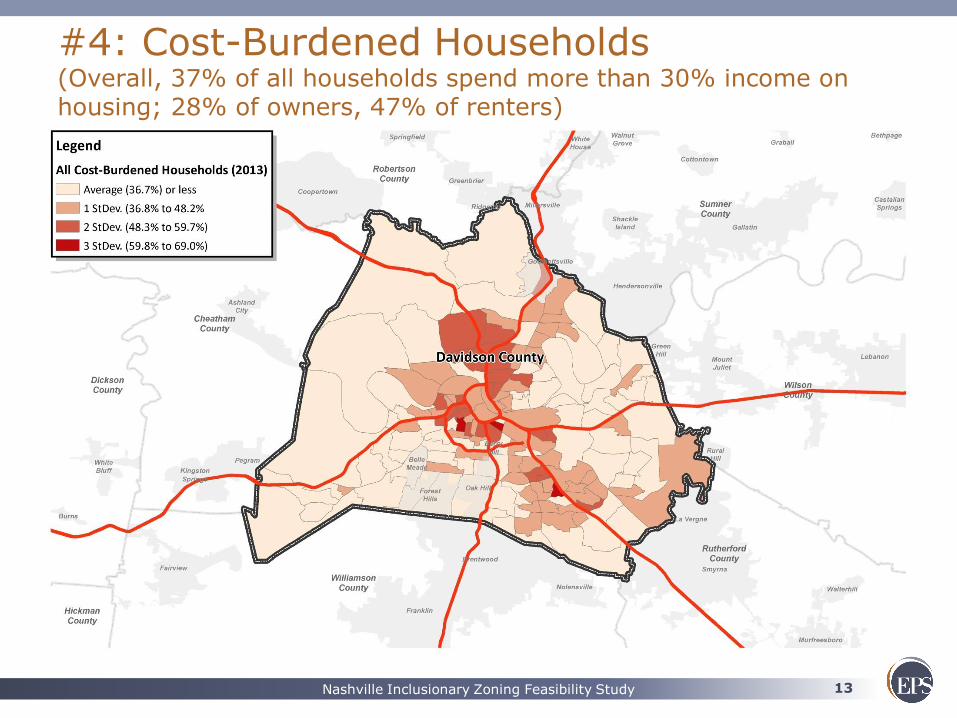
#4: Cost-Burdened Households (Overall, 37% of all households spend more than 30% income on housing; 28% of owners, 47% of renters)
14 Nashville Inclusionary Zoning Feasibility Study
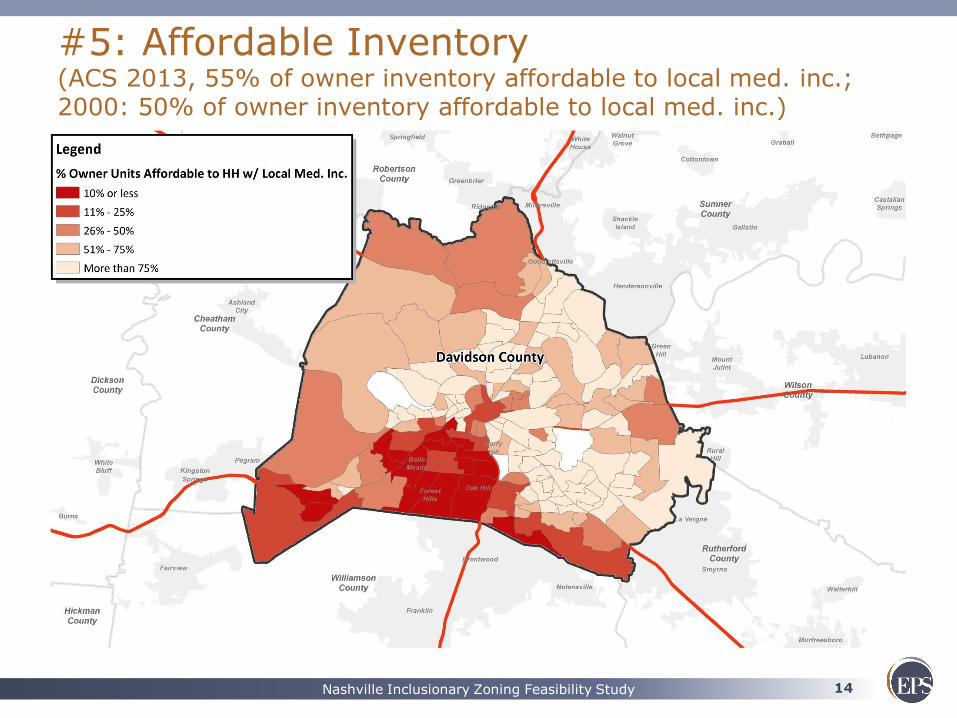
#5: Affordable Inventory (ACS 2013, 55% of owner inventory affordable to local med. inc.; 2000: 50% of owner inventory affordable to local med. inc.)
15 Nashville Inclusionary Zoning Feasibility Study
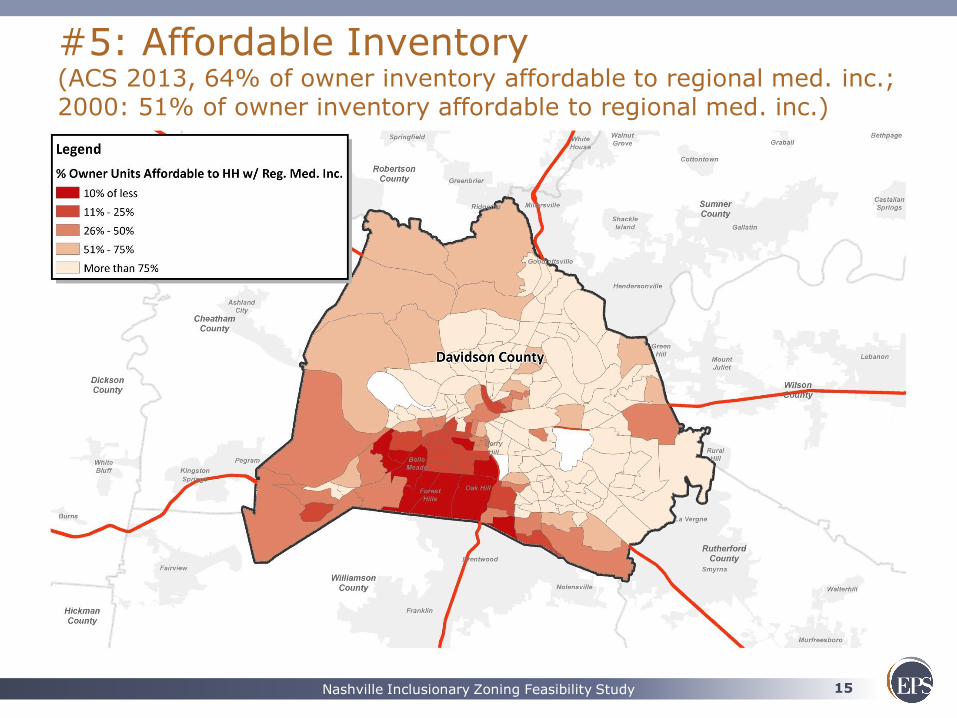
#5: Affordable Inventory (ACS 2013, 64% of owner inventory affordable to regional med. inc.; 2000: 51% of owner inventory affordable to regional med. inc.)
16 Nashville Inclusionary Zoning Feasibility Study
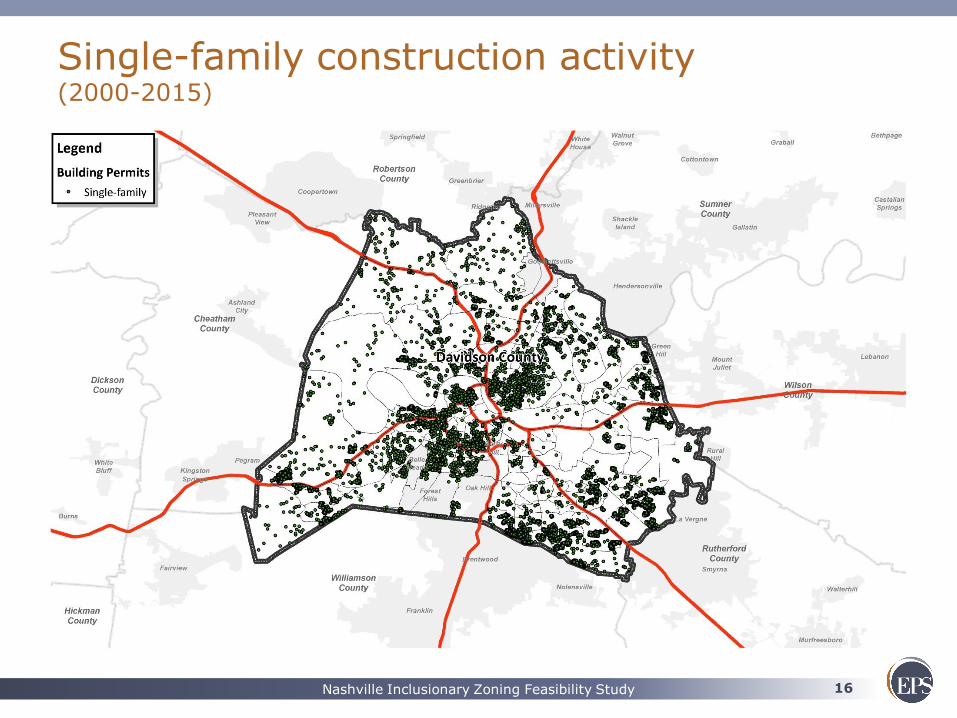
Single-family construction activity (2000-2015)
17 Nashville Inclusionary Zoning Feasibility Study
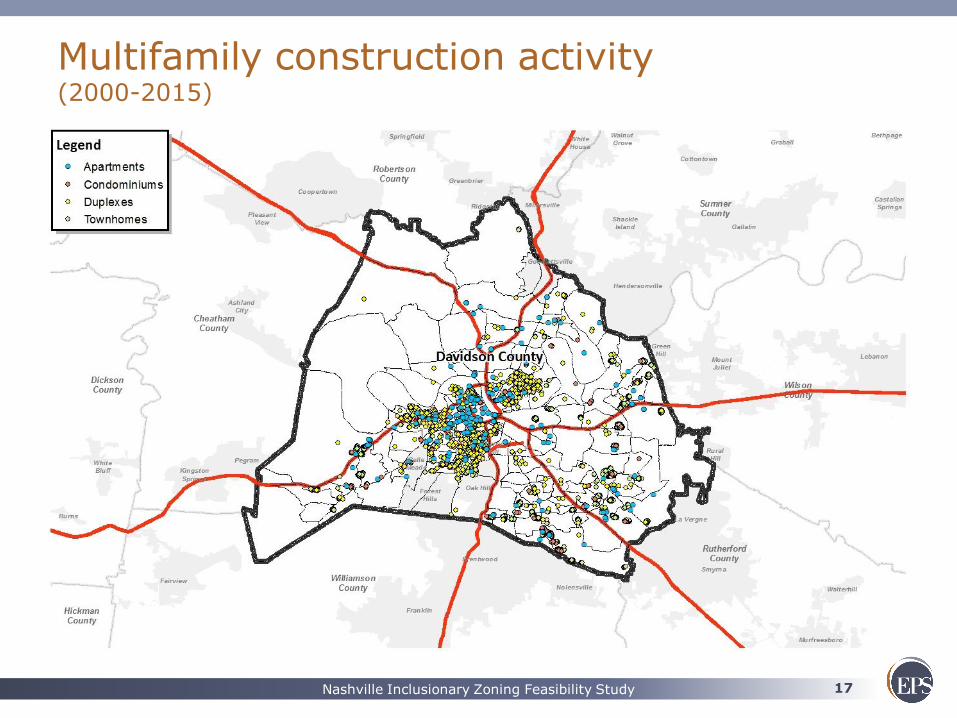
Multifamily construction activity (2000-2015)
18 Nashville Inclusionary Zoning Feasibility Study
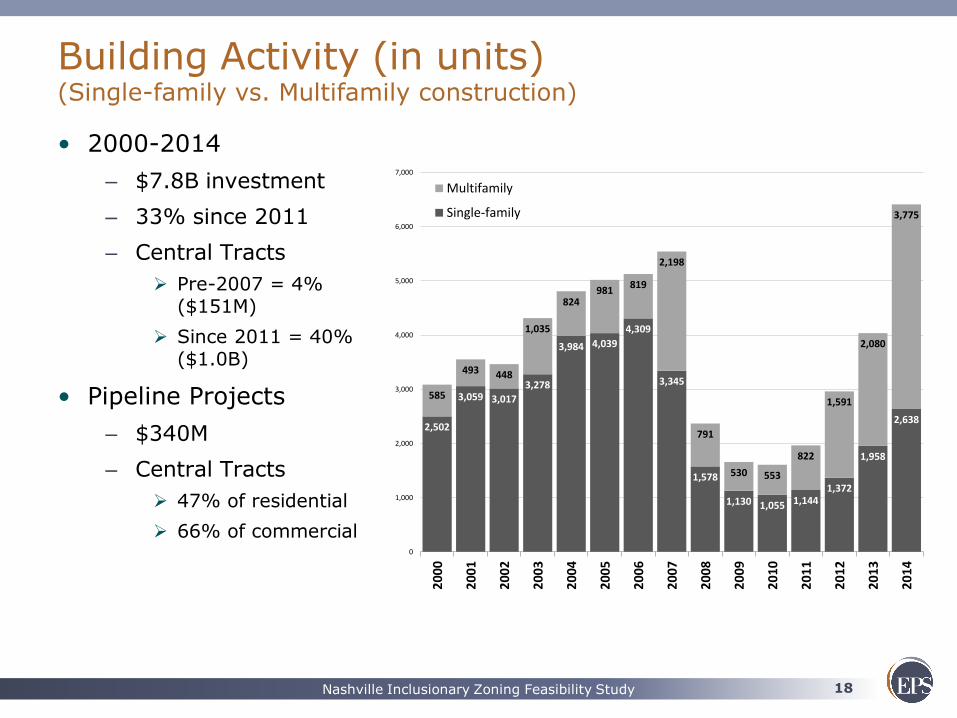
Building Activity (in units) (Single-family vs. Multifamily construction)
• 2000-2014
– $7.8B investment
– 33% since 2011
– Central Tracts
Pre-2007 = 4% ($151M)
Since 2011 = 40% ($1.0B)
• Pipeline Projects
– $340M
– Central Tracts
47% of residential
66% of commercial
2,502
3,059 3,017
3,278
3,984 4,039
4,309
3,345
1,578
1,130 1,055 1,1441,372
1,958
2,638
585
493 448
1,035
824981
819
2,198
791
530 553
822
1,591
2,080
3,775
0
1,000
2,000
3,000
4,000
5,000
6,000
7,000
20
00
20
01
20
02
20
03
20
04
20
05
20
06
20
07
20
08
20
09
20
10
20
11
20
12
20
13
20
14
Multifamily
Single-family
19 Nashville Inclusionary Zoning Feasibility Study
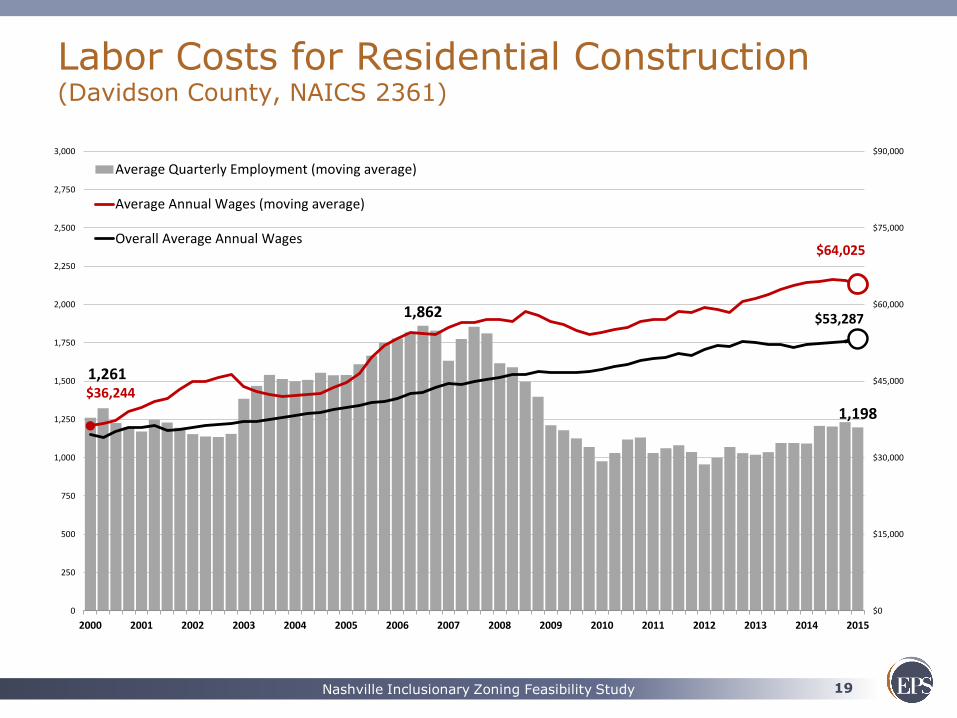
Labor Costs for Residential Construction (Davidson County, NAICS 2361)
1,261
1,862
1,198
$36,244
$64,025
$53,287
$0
$15,000
$30,000
$45,000
$60,000
$75,000
$90,000
0
250
500
750
1,000
1,250
1,500
1,750
2,000
2,250
2,500
2,750
3,000
2000 2001 2002 2003 2004 2005 2006 2007 2008 2009 2010 2011 2012 2013 2014 2015
Average Quarterly Employment (moving average)
Average Annual Wages (moving average)
Overall Average Annual Wages
20 Nashville Inclusionary Zoning Feasibility Study
Other Important Contextual Considerations (federal, state, local)
1. State rent control prohibition - TCA § 66-35-102 (2015)
– “A local government unit shall not enact, maintain or enforce an ordinance or resolution that would have the effect of controlling the amount of rent charged for leasing private residential or commercial property.”
2. “Disparate impact” ruling – Texas Dept. of Housing and Community Affairs et al. v. Inclusive Communities Project, Inc. et al. (2015)
– Implications
– Lingering questions
3. Other Issues
– Federal funding declining sharply
21 Nashville Inclusionary Zoning Feasibility Study
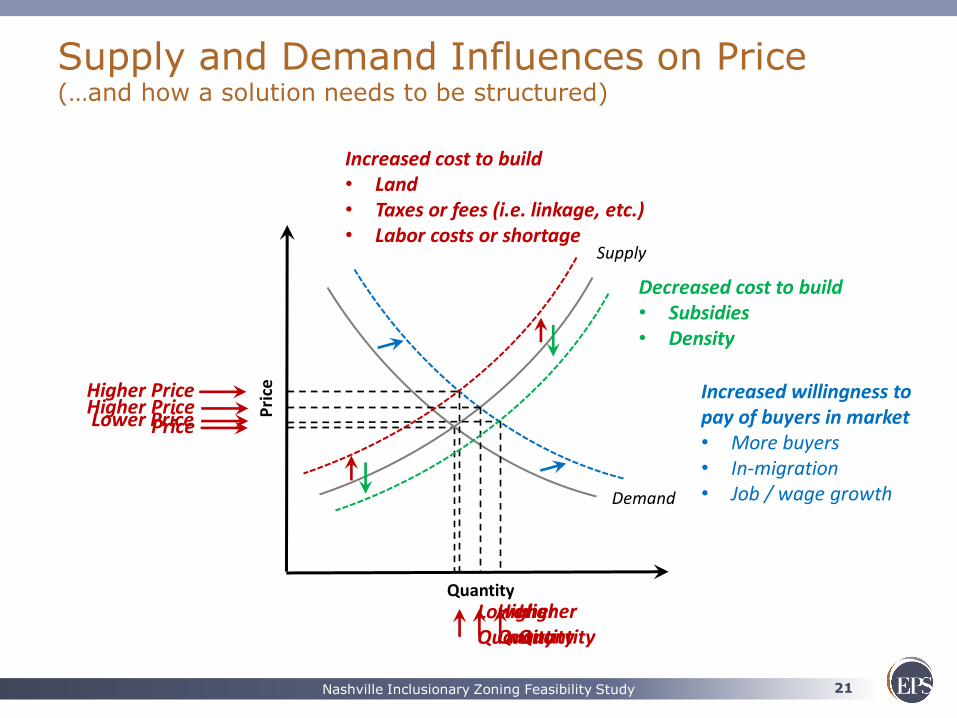
Supply and Demand Influences on Price (…and how a solution needs to be structured)
Supply
Demand
Quantity
Pri
ce
Increased willingness to pay of buyers in market • More buyers • In-migration • Job / wage growth
Price Higher Price Higher Price
Lower Price
Increased cost to build • Land • Taxes or fees (i.e. linkage, etc.) • Labor costs or shortage
Decreased cost to build • Subsidies • Density
Lower Quantity
Higher Quantity
Higher Quantity
22 Nashville Inclusionary Zoning Feasibility Study
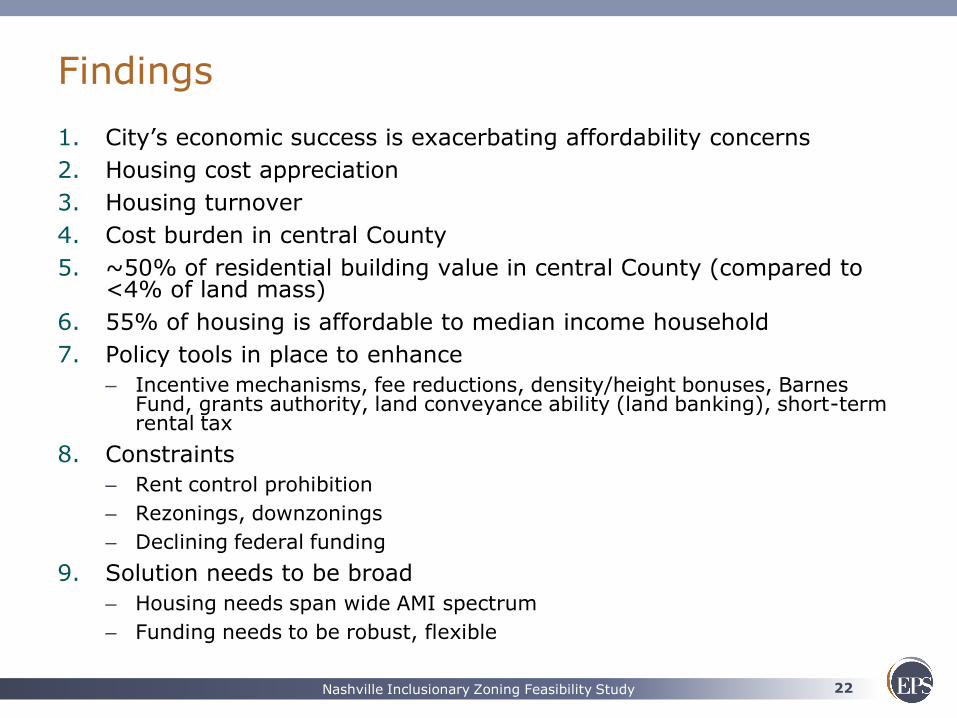
Findings
1. City’s economic success is exacerbating affordability concerns
2. Housing cost appreciation
3. Housing turnover
4. Cost burden in central County
5. ~50% of residential building value in central County (compared to <4% of land mass)
6. 55% of housing is affordable to median income household
7. Policy tools in place to enhance
– Incentive mechanisms, fee reductions, density/height bonuses, Barnes Fund, grants authority, land conveyance ability (land banking), short-term rental tax
8. Constraints
– Rent control prohibition
– Rezonings, downzonings
– Declining federal funding
9. Solution needs to be broad
– Housing needs span wide AMI spectrum
– Funding needs to be robust, flexible
23 Nashville Inclusionary Zoning Feasibility Study
Framing a targeted approach
• What’s the best way to address issues?
– Mandates? Incentives? Funding? Tax reimbursement? Recalibration of zoning tools in targeted locations?
• Will the solutions work in the market?
– Development context? Regulatory? Financially?
• Can any one solution address all levels of housing need?
• Will it leverage partnerships?

24 Nashville Inclusionary Zoning Feasibility Study
APPROACHES
Policies and tools
25 Nashville Inclusionary Zoning Feasibility Study
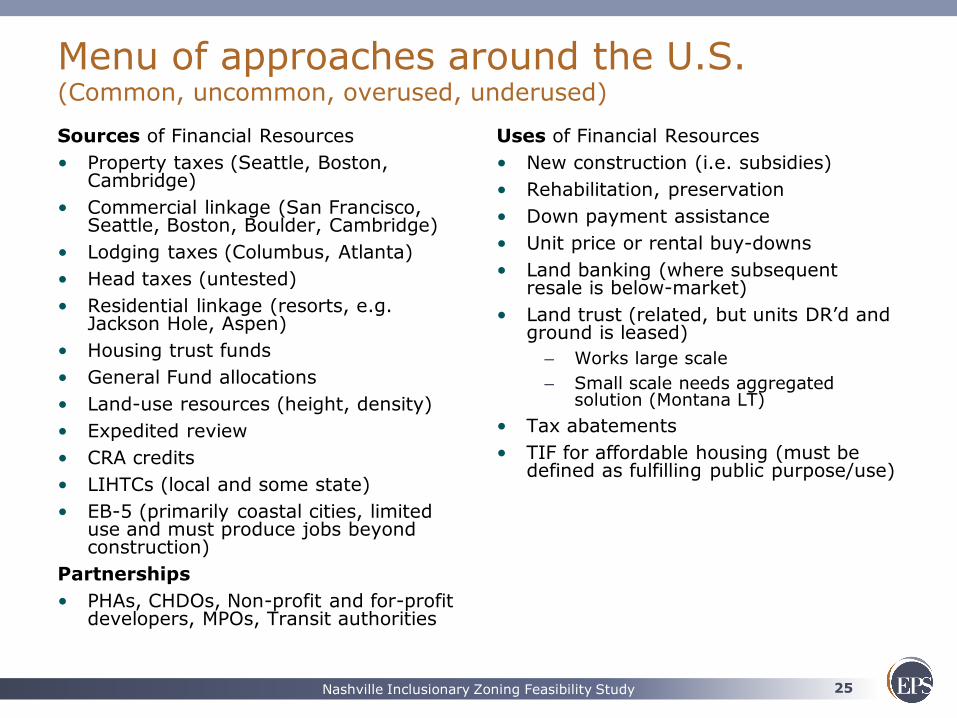
Menu of approaches around the U.S. (Common, uncommon, overused, underused)
Sources of Financial Resources
• Property taxes (Seattle, Boston, Cambridge)
• Commercial linkage (San Francisco, Seattle, Boston, Boulder, Cambridge)
• Lodging taxes (Columbus, Atlanta)
• Head taxes (untested)
• Residential linkage (resorts, e.g. Jackson Hole, Aspen)
• Housing trust funds
• General Fund allocations
• Land-use resources (height, density)
• Expedited review
• CRA credits
• LIHTCs (local and some state)
• EB-5 (primarily coastal cities, limited use and must produce jobs beyond construction)
Partnerships
• PHAs, CHDOs, Non-profit and for-profit developers, MPOs, Transit authorities
Uses of Financial Resources
• New construction (i.e. subsidies)
• Rehabilitation, preservation
• Down payment assistance
• Unit price or rental buy-downs
• Land banking (where subsequent resale is below-market)
• Land trust (related, but units DR’d and ground is leased)
– Works large scale
– Small scale needs aggregated solution (Montana LT)
• Tax abatements
• TIF for affordable housing (must be defined as fulfilling public purpose/use)
26 Nashville Inclusionary Zoning Feasibility Study
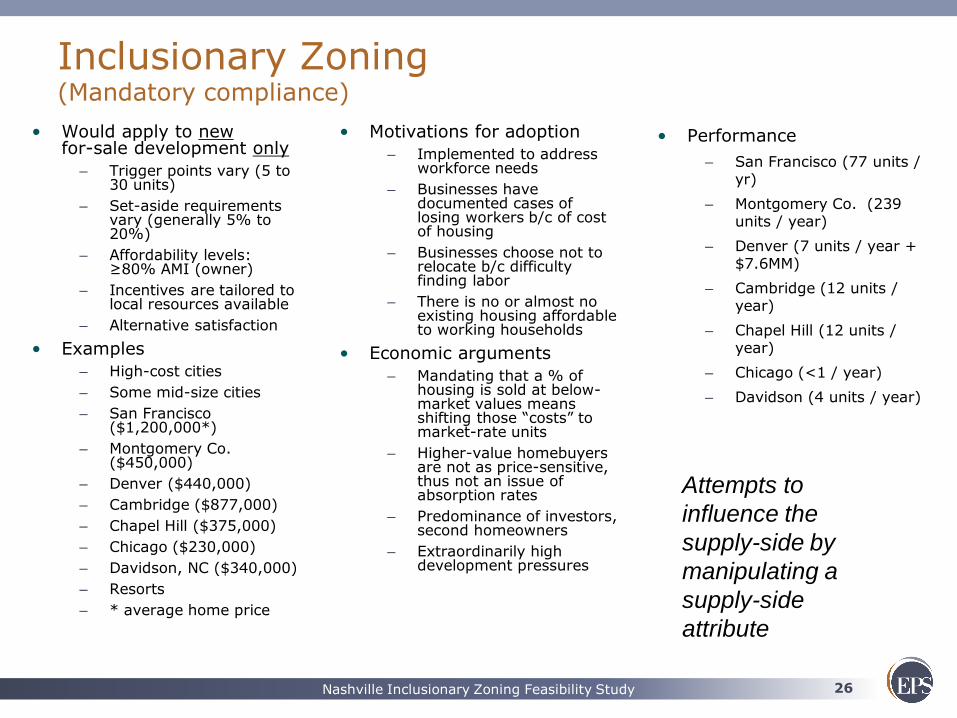
Inclusionary Zoning (Mandatory compliance)
• Would apply to new for-sale development only
– Trigger points vary (5 to 30 units)
– Set-aside requirements vary (generally 5% to 20%)
– Affordability levels: ≥80% AMI (owner)
– Incentives are tailored to local resources available
– Alternative satisfaction
• Examples
– High-cost cities
– Some mid-size cities
– San Francisco ($1,200,000*)
– Montgomery Co. ($450,000)
– Denver ($440,000)
– Cambridge ($877,000)
– Chapel Hill ($375,000)
– Chicago ($230,000)
– Davidson, NC ($340,000)
– Resorts
– * average home price
• Motivations for adoption
– Implemented to address workforce needs
– Businesses have documented cases of losing workers b/c of cost of housing
– Businesses choose not to relocate b/c difficulty finding labor
– There is no or almost no existing housing affordable to working households
• Economic arguments
– Mandating that a % of housing is sold at below-market values means shifting those “costs” to market-rate units
– Higher-value homebuyers are not as price-sensitive, thus not an issue of absorption rates
– Predominance of investors, second homeowners
– Extraordinarily high development pressures
• Performance
– San Francisco (77 units / yr)
– Montgomery Co. (239 units / year)
– Denver (7 units / year + $7.6MM)
– Cambridge (12 units / year)
– Chapel Hill (12 units / year)
– Chicago (<1 / year)
– Davidson (4 units / year)
Attempts to
influence the
supply-side by
manipulating a
supply-side
attribute
28 Nashville Inclusionary Zoning Feasibility Study
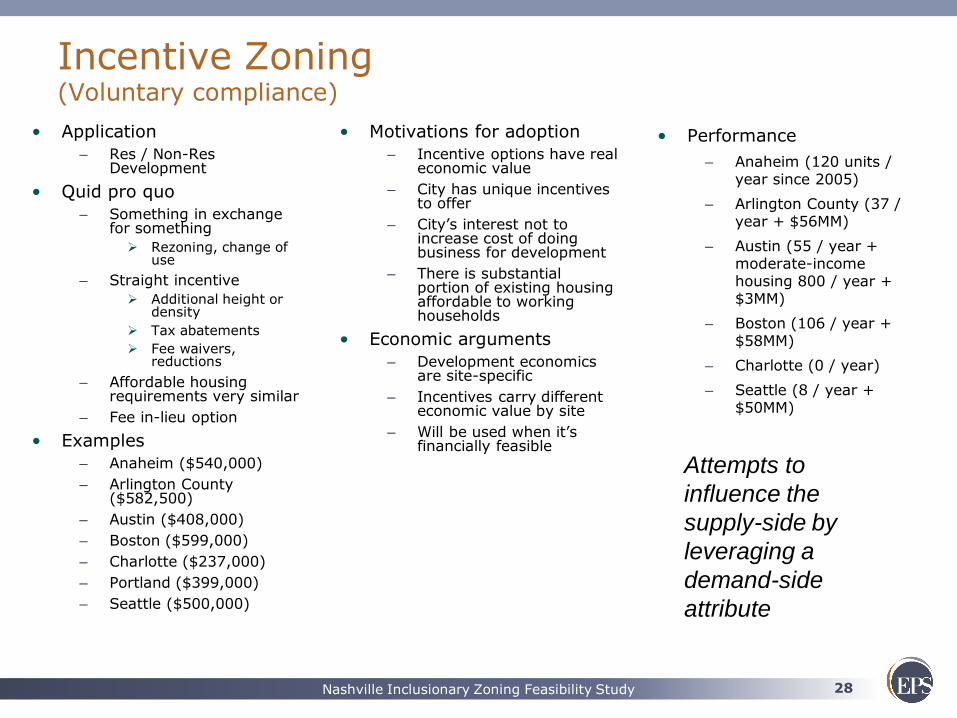
Incentive Zoning (Voluntary compliance)
• Application
– Res / Non-Res Development
• Quid pro quo
– Something in exchange for something
Rezoning, change of use
– Straight incentive
Additional height or density
Tax abatements
Fee waivers, reductions
– Affordable housing requirements very similar
– Fee in-lieu option
• Examples
– Anaheim ($540,000)
– Arlington County ($582,500)
– Austin ($408,000)
– Boston ($599,000)
– Charlotte ($237,000)
– Portland ($399,000)
– Seattle ($500,000)
• Motivations for adoption
– Incentive options have real economic value
– City has unique incentives to offer
– City’s interest not to increase cost of doing business for development
– There is substantial portion of existing housing affordable to working households
• Economic arguments
– Development economics are site-specific
– Incentives carry different economic value by site
– Will be used when it’s financially feasible
• Performance
– Anaheim (120 units / year since 2005)
– Arlington County (37 / year + $56MM)
– Austin (55 / year + moderate-income housing 800 / year + $3MM)
– Boston (106 / year + $58MM)
– Charlotte (0 / year)
– Seattle (8 / year + $50MM)
Attempts to
influence the
supply-side by
leveraging a
demand-side
attribute
29 Nashville Inclusionary Zoning Feasibility Study
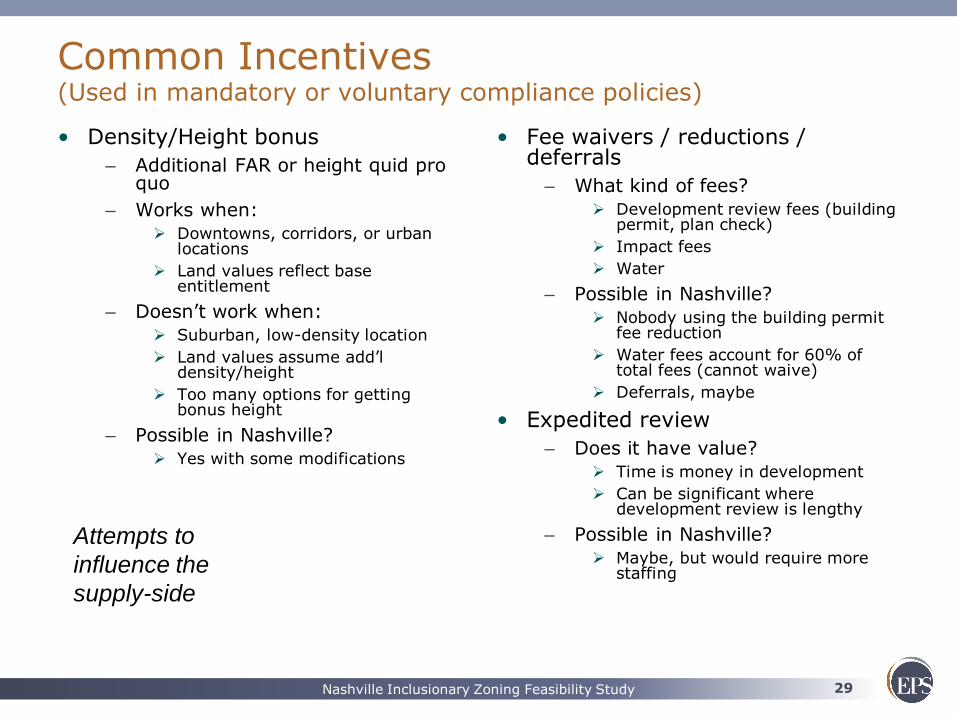
Common Incentives (Used in mandatory or voluntary compliance policies)
• Density/Height bonus
– Additional FAR or height quid pro quo
– Works when:
Downtowns, corridors, or urban locations
Land values reflect base entitlement
– Doesn’t work when:
Suburban, low-density location
Land values assume add’l density/height
Too many options for getting bonus height
– Possible in Nashville?
Yes with some modifications
• Fee waivers / reductions / deferrals
– What kind of fees?
Development review fees (building permit, plan check)
Impact fees
Water
– Possible in Nashville?
Nobody using the building permit fee reduction
Water fees account for 60% of total fees (cannot waive)
Deferrals, maybe
• Expedited review
– Does it have value?
Time is money in development
Can be significant where development review is lengthy
– Possible in Nashville?
Maybe, but would require more staffing
Attempts to
influence the
supply-side
30 Nashville Inclusionary Zoning Feasibility Study
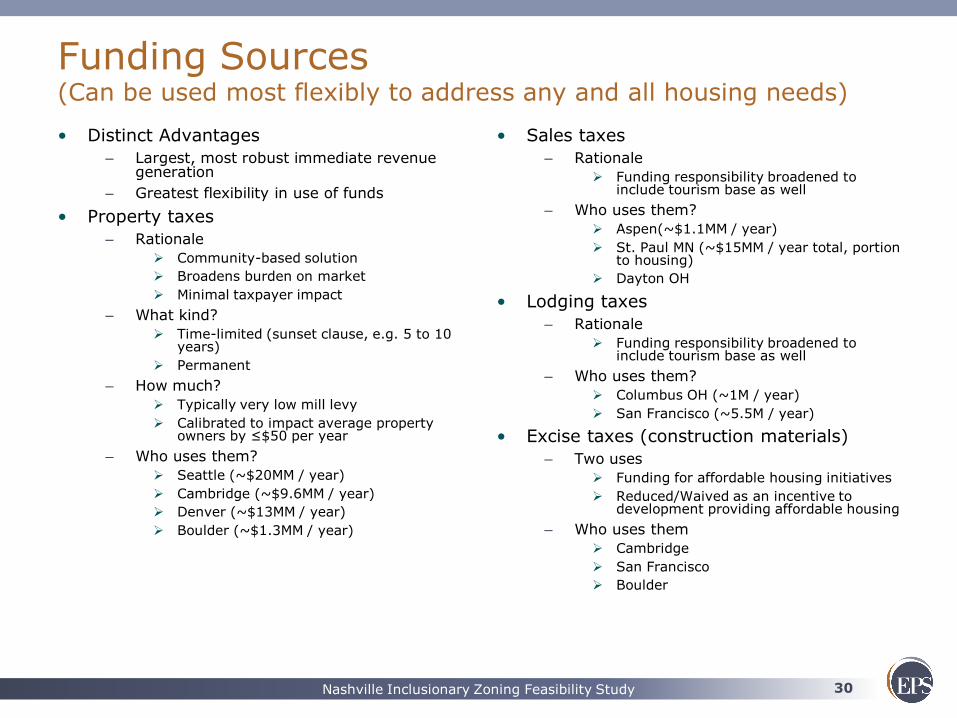
Funding Sources (Can be used most flexibly to address any and all housing needs)
• Distinct Advantages
– Largest, most robust immediate revenue generation
– Greatest flexibility in use of funds
• Property taxes
– Rationale
Community-based solution
Broadens burden on market
Minimal taxpayer impact
– What kind?
Time-limited (sunset clause, e.g. 5 to 10 years)
Permanent
– How much?
Typically very low mill levy
Calibrated to impact average property owners by ≤$50 per year
– Who uses them?
Seattle (~$20MM / year)
Cambridge (~$9.6MM / year)
Denver (~$13MM / year)
Boulder (~$1.3MM / year)
• Sales taxes
– Rationale
Funding responsibility broadened to include tourism base as well
– Who uses them?
Aspen(~$1.1MM / year)
St. Paul MN (~$15MM / year total, portion to housing)
Dayton OH
• Lodging taxes
– Rationale
Funding responsibility broadened to include tourism base as well
– Who uses them?
Columbus OH (~1M / year)
San Francisco (~5.5M / year)
• Excise taxes (construction materials)
– Two uses
Funding for affordable housing initiatives
Reduced/Waived as an incentive to development providing affordable housing
– Who uses them
Cambridge
San Francisco
Boulder
31 Nashville Inclusionary Zoning Feasibility Study
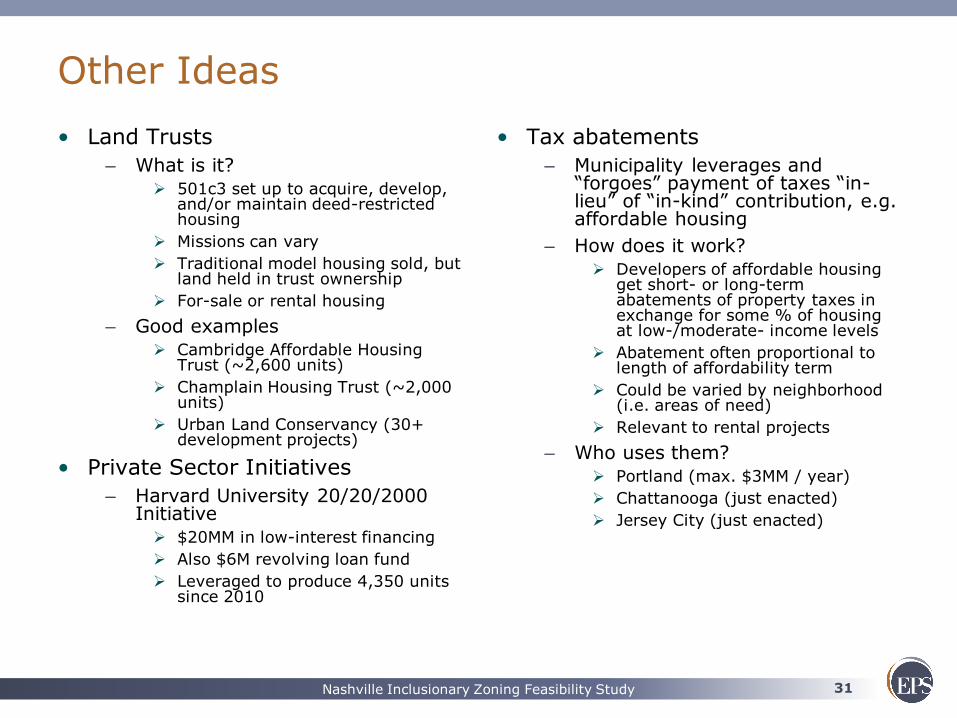
Other Ideas
• Land Trusts
– What is it?
501c3 set up to acquire, develop, and/or maintain deed-restricted housing
Missions can vary
Traditional model housing sold, but land held in trust ownership
For-sale or rental housing
– Good examples
Cambridge Affordable Housing Trust (~2,600 units)
Champlain Housing Trust (~2,000 units)
Urban Land Conservancy (30+ development projects)
• Private Sector Initiatives
– Harvard University 20/20/2000 Initiative
$20MM in low-interest financing
Also $6M revolving loan fund
Leveraged to produce 4,350 units since 2010
• Tax abatements
– Municipality leverages and “forgoes” payment of taxes “in-lieu” of “in-kind” contribution, e.g. affordable housing
– How does it work?
Developers of affordable housing get short- or long-term abatements of property taxes in exchange for some % of housing at low-/moderate- income levels
Abatement often proportional to length of affordability term
Could be varied by neighborhood (i.e. areas of need)
Relevant to rental projects
– Who uses them?
Portland (max. $3MM / year)
Chattanooga (just enacted)
Jersey City (just enacted)
32 Nashville Inclusionary Zoning Feasibility Study
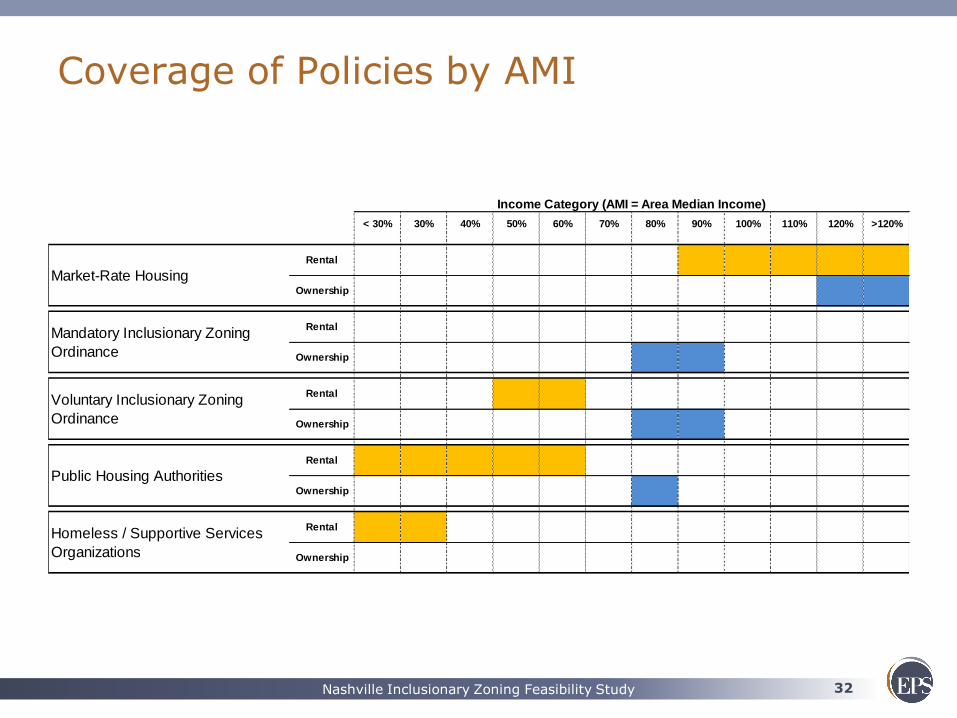
Coverage of Policies by AMI
< 30% 30% 40% 50% 60% 70% 80% 90% 100% 110% 120% >120%
Market-Rate Housing
Mandatory Inclusionary Zoning
Ordinance
Voluntary Inclusionary Zoning
Ordinance
Public Housing Authorities
Homeless / Supportive Services
Organizations
Income Category (AMI = Area Median Income)
Ownership
Rental
Ownership
Rental
Ownership
Rental
Ownership
Rental
Ownership
Rental
33 Nashville Inclusionary Zoning Feasibility Study
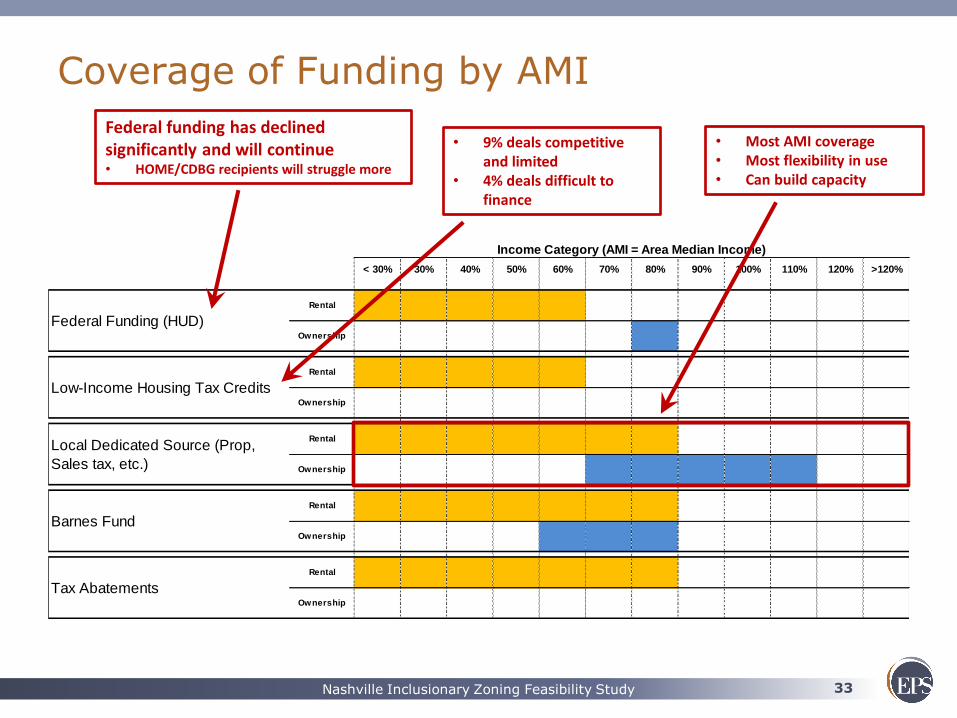
< 30% 30% 40% 50% 60% 70% 80% 90% 100% 110% 120% >120%
Rental
Income Category (AMI = Area Median Income)
Ownership
Rental
Low-Income Housing Tax Credits
Local Dedicated Source (Prop,
Sales tax, etc.)
Tax Abatements
Federal Funding (HUD)
Ownership
Rental
Ownership
Rental
Ownership
Barnes Fund
Rental
Ownership
Coverage of Funding by AMI
Federal funding has declined significantly and will continue • HOME/CDBG recipients will struggle more
• 9% deals competitive and limited
• 4% deals difficult to finance
• Most AMI coverage • Most flexibility in use • Can build capacity

34 Nashville Inclusionary Zoning Feasibility Study
Tailoring an appropriate policy
• Long-term solution to create affordable housing
– Does it respond to the local regulatory environment?
• Will it achieve results?
– Is it seeking to compel or incent a change in behavior?
– Address supply-side
– Real economic incentives
– Works in the current and foreseeable market
• Avoid unintended consequences
– Must reflect existing legal constraints
– Will it negatively affect growth and development patterns?
– Will it positively or negatively exacerbate affordability problems?
35 Nashville Inclusionary Zoning Feasibility Study
FEASIBILITY
Inclusionary Zoning

36 Nashville Inclusionary Zoning Feasibility Study
Major Adjustments
Production Requirement 10% 10% 10% 10% 10% 10% 10% 10%
Cash In-Lieu Amount (as % of Max. Sales Price) 50% 50% 50% 70% 50% 50% 50% 60%
MPDU On-site Construction 100% 100% 0% 0% 100% 100% 0% 0%
MPDU Off-site Construction 0% 0% 0% 0% 0% 0% 0% 0%
% of IH Units Given Cash Subsidy 50% 100% 50% 50% 50% 100% 50% 50%
Size of IH Units as % of MR Units 100% of MR Units 100% of MR Units 100% of MR Units 100% of MR Units 100% of MR Units 100% of MR Units 100% of MR Units 100% of MR Units
AMI Levels
1st AMI Level 80% 80% 80% 80% 80% 80% 80% 80%
2nd AMI Level 80% 80% 80% 80% 80% 80% 80% 80%
3rd AMI Level 80% 80% 80% 80% 80% 80% 80% 80%
MPDU Const.
(Existing Subsidy)
MPDU Const.
(Increased Subsidy) Cash in-lieu (Existing)
Cash in-lieu
(Proposed)
MPDU Const.
(Existing Subsidy)
MPDU Const.
(Increased Subsidy) Cash in-lieu (Existing)
Cash in-lieu
(Proposed)
Revenues
Owner Sales (On- / Off-Site) $53,454,700 $53,454,700 $55,932,000 $55,932,000 $89,076,388 $89,076,388 $93,102,000 $93,102,000
Cash Subsidy for IH Units $44,000 $88,000 $0 $0 $71,500 $143,000 $0 $0
Total Revenues $53,498,700 $53,542,700 $55,932,000 $55,932,000 $89,147,888 $89,219,388 $93,102,000 $93,102,000
Overall Value / Unit $338,599 / unit $338,878 / unit $354,000 / unit $354,000 / unit $338,965 / unit $339,237 / unit $354,000 / unit $354,000 / unit
Development Costs
Land (On- / Off-Site Parcels) $3,267,000 $3,267,000 $3,267,000 $3,267,000 $3,920,400 $3,920,400 $3,920,400 $3,920,400
Hard & Soft Costs (On- / Off-Site Parcels) $44,534,960 $44,534,960 $44,534,960 $44,534,960 $76,266,050 $76,266,050 $76,266,050 $76,266,050
Subtotal Costs $47,801,960 $47,801,960 $47,801,960 $47,801,960 $80,186,450 $80,186,450 $80,186,450 $80,186,450
Plus: CIL $0 $0 $1,593,350 $2,230,690 $0 $0 $2,589,194 $3,107,033
Total Development Costs $47,801,960 $47,801,960 $49,395,310 $50,032,650 $80,186,450 $80,186,450 $82,775,644 $83,293,483
per sqft $257 / sqft $257 / sqft $266 / sqft $269 / sqft $259 / sqft $259 / sqft $267 / sqft $269 / sqft
Project Profit $5,696,740 $5,740,740 $6,536,690 $5,899,350 $8,961,438 $9,032,938 $10,326,356 $9,808,518
Profit (as % of Cost) 11.92% 12.01% 13.23% 11.79% 11.18% 11.26% 12.48% 11.78%
Δ Over / Under Base Case N/A $44,000 $839,950 $202,610 N/A $71,500 $1,364,919 $847,080
Δ / IH Unit N/A $2,750 / unit $52,497 / unit $12,663 / unit N/A $2,750 / unit $52,497 / unit $32,580 / unit
Cash Subsidy / IH Unit $5,500 / unit $11,000 / unit $0 / unit $0 / unit $5,500 / unit $11,000 / unit $0 / unit $0 / unit
CIL / IH Unit $0 / unit $0 / unit $99,584 / unit $139,418 / unit $0 / unit $0 / unit $99,584 / unit $119,501 / unit
Source: Economic & Planning Systems
12-Story 20-Story
Feasibility Model (Sample numbers shown – actuals will differ)
Drop down menus (“dials”) allow for multiple scenarios to be tested
Scenarios can be defined by any combination of prototypical development and “dials”
Revenues
Costs
Project Return
37 Nashville Inclusionary Zoning Feasibility Study
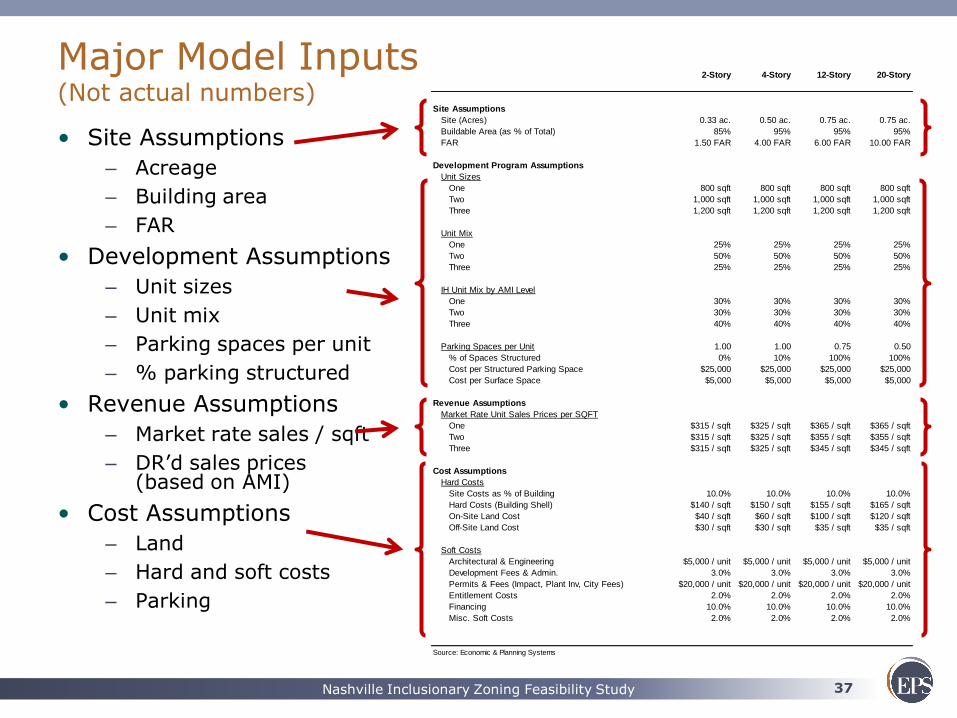
2-Story 4-Story 12-Story 20-Story
Site Assumptions
Site (Acres) 0.33 ac. 0.50 ac. 0.75 ac. 0.75 ac.
Buildable Area (as % of Total) 85% 95% 95% 95%
FAR 1.50 FAR 4.00 FAR 6.00 FAR 10.00 FAR
Development Program Assumptions
Unit Sizes
One 800 sqft 800 sqft 800 sqft 800 sqft
Two 1,000 sqft 1,000 sqft 1,000 sqft 1,000 sqft
Three 1,200 sqft 1,200 sqft 1,200 sqft 1,200 sqft
Unit Mix
One 25% 25% 25% 25%
Two 50% 50% 50% 50%
Three 25% 25% 25% 25%
IH Unit Mix by AMI Level
One 30% 30% 30% 30%
Two 30% 30% 30% 30%
Three 40% 40% 40% 40%
Parking Spaces per Unit 1.00 1.00 0.75 0.50
% of Spaces Structured 0% 10% 100% 100%
Cost per Structured Parking Space $25,000 $25,000 $25,000 $25,000
Cost per Surface Space $5,000 $5,000 $5,000 $5,000
Revenue Assumptions
Market Rate Unit Sales Prices per SQFT
One $315 / sqft $325 / sqft $365 / sqft $365 / sqft
Two $315 / sqft $325 / sqft $355 / sqft $355 / sqft
Three $315 / sqft $325 / sqft $345 / sqft $345 / sqft
Cost Assumptions
Hard Costs
Site Costs as % of Building 10.0% 10.0% 10.0% 10.0%
Hard Costs (Building Shell) $140 / sqft $150 / sqft $155 / sqft $165 / sqft
On-Site Land Cost $40 / sqft $60 / sqft $100 / sqft $120 / sqft
Off-Site Land Cost $30 / sqft $30 / sqft $35 / sqft $35 / sqft
Soft Costs
Architectural & Engineering $5,000 / unit $5,000 / unit $5,000 / unit $5,000 / unit
Development Fees & Admin. 3.0% 3.0% 3.0% 3.0%
Permits & Fees (Impact, Plant Inv, City Fees) $20,000 / unit $20,000 / unit $20,000 / unit $20,000 / unit
Entitlement Costs 2.0% 2.0% 2.0% 2.0%
Financing 10.0% 10.0% 10.0% 10.0%
Misc. Soft Costs 2.0% 2.0% 2.0% 2.0%
Source: Economic & Planning Systems
H:\123099-Denver Housing Economic Study\M odels\[123099-Feasibility M odel-010614.xlsm]M ajor Inputs
Major Model Inputs (Not actual numbers)
• Site Assumptions
– Acreage
– Building area
– FAR
• Development Assumptions
– Unit sizes
– Unit mix
– Parking spaces per unit
– % parking structured
• Revenue Assumptions
– Market rate sales / sqft
– DR’d sales prices (based on AMI)
• Cost Assumptions
– Land
– Hard and soft costs
– Parking
38 Nashville Inclusionary Zoning Feasibility Study
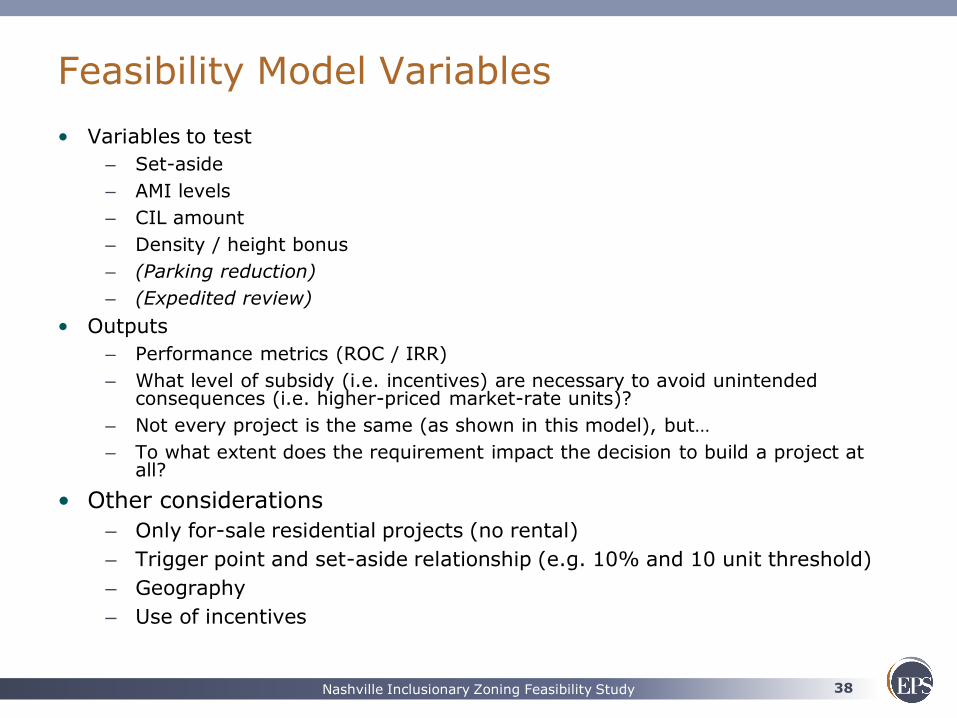
Feasibility Model Variables
• Variables to test
– Set-aside
– AMI levels
– CIL amount
– Density / height bonus
– (Parking reduction)
– (Expedited review)
• Outputs
– Performance metrics (ROC / IRR)
– What level of subsidy (i.e. incentives) are necessary to avoid unintended consequences (i.e. higher-priced market-rate units)?
– Not every project is the same (as shown in this model), but…
– To what extent does the requirement impact the decision to build a project at all?
• Other considerations
– Only for-sale residential projects (no rental)
– Trigger point and set-aside relationship (e.g. 10% and 10 unit threshold)
– Geography
– Use of incentives