
NASA/DoD Aerospace Knowledge Diffusion Research Project · NASA/DoD Aerospace Knowledge Diffusion...
87
NASA/DoD Aerospace Knowledge Diffusion Research Project NASA Technical Memorandum 109123 Report Number 28 The Technical Communication Practices of Aerospace Engineering and Science Students: Results of the Phase 4 Cross-National Surveys Thomas E. Pinelli NASA Langley Research Center Hampton, Virginia fM ,0 0 t,4 I Z Laura M. Hecht Indiana University Bloomington, Indiana Rebecca O. Barclay Rensselaer Polytechnic Institute Troy, New York John M. Kennedy Indiana University Bloomington, Indiana December 1994 0 0 0 Z A 0 I p- I 0 Z National Aeronautics and Space Administration u'l U C Department of Defense O3 O O O N CO t_ INDIANA UNIVERSITY https://ntrs.nasa.gov/search.jsp?R=19950013746 2018-07-20T16:25:10+00:00Z
Transcript of NASA/DoD Aerospace Knowledge Diffusion Research Project · NASA/DoD Aerospace Knowledge Diffusion...

NASA/DoD Aerospace Knowledge
Diffusion Research Project
NASA Technical Memorandum 109123
Report Number 28
The Technical Communication Practices of Aerospace Engineering and
Science Students: Results of the Phase 4 Cross-National Surveys
Thomas E. Pinelli
NASA Langley Research Center
Hampton, Virginia
fM,0
0t,4I
Z
Laura M. Hecht
Indiana University
Bloomington, Indiana
Rebecca O. BarclayRensselaer Polytechnic Institute
Troy, New York
John M. Kennedy
Indiana University
Bloomington, Indiana
December 1994
00
0
Z
A
0
I
p-I
0 Z
National Aeronautics and Space Administration
u'l
UC
Department of Defense
O3
O
OO
NCO
t_
INDIANA UNIVERSITY
https://ntrs.nasa.gov/search.jsp?R=19950013746 2018-07-20T16:25:10+00:00Z
INTRODUCTION
The growing national debate over U.S. competitiveness appears to have produced a con-
sensus of opinion on the following points: (1) the production, transfer, and use of knowledge
is of paramount importance to the process of technological innovation; (2) current "supply-side"
U.S technology policy, which emphasizes the creation of knowledge, should be modified to
include the transfer, absorption, and utilize of that same knowledge; (3) a mechanism that
contains a "proactive" scientific and technical information (STI) component is needed for the
diffusion of knowledge from government research facilities to industry; (4) engineers and
scientists should be proficient in the acquisition, communication, and use of STI; and (5) engi-
neering and science students should be trained in the acquisition, communication, and use of STI
as part of their educational preparation.
Studies such as those conducted by Mailloux (1989) demonstrate that communicating
information takes up as much as 80% of an engineer's time and is considered essential to
successful engineering practice. Surveys of industrial firms that employ engineers and scientists
indicate that employers place a high priority on engineers' ability to acquire, to communicate
orally and in writing, and to use STI. These same studies show that industry respondents rate
the importance of communications skills as high as or higher than their technical skills. Many
industry respondents hold the opinion that newly graduated engineers and scientists lack
proficiency in communications skills (Black, 1994; Morrow, 1994; Evans, et al., 1993; Katz,
1993; Strother, 1992; Garry, 1986; Devon, 1985; and Sylvester, 1980).
Because the effective communication of information is fundamental to engineering,
questions arise of what communications skills should be taught to engineering students and when,
how much communications instruction is necessary, and how effective that instruction is. What
is missing from any discussion of communications skills instruction for engineering student is
(1) a clear explanation from the professional engineering community about what constitutes
"acceptable and desirable communications norms" within that community; (2) adequate and
generalizable data from engineering students about the communications skills instruction they
receive; (3) adequate and generalizable data from entry-level engineers about the adequacy and
usefulness of the instruction they received as students; and (4) a mechanism, probably focused
within academia, that solicits feedback from the workplace and a system that utilizes the feedback
for answering the questions of what and how much should be taught and when, and for deter-
mining the effectiveness of instruction.
To address the second question and help provide a student perspective, we undertook a
survey of aerospace engineering and science students in four countries: India, Japan, Russia, and
the United Kingdom (U.K.) 1 in the spring of 1994. The questions were assembled according to
the following topics: (1) the students' selection of a career in engineering; (2) the importance
1Similar surveys were conducted among engineering and science students attending the
University of Illinois, aerospace engineering students at Texas A&M, and technology students
at Bowling Green State University. Student members of the American Institute of Aeronautics
and Astronautics (AIAA) were also surveyed in the spring of 1993.

of selectedcommunicationsskills to professionalsuccess,the instruction received in these skills,
and the helpfulness (usefulness) of that instruction; (3) the use and importance of libraries and
other information sources and products; and (4) the use of computers, selected information tech-
nologies, and electronic networks. This study contributes to our understanding of the production,
transfer, and use of information by aerospace engineering and provides feedback that may be
helpful in shaping the communications components of engineering curricula in higher education.
BACKGROUND
The diffusion of knowledge, including its production, transfer, and use, is an essential part
of aerospace R&D and is of paramount importance to the process of innovation within the U.S.
aerospace industry. To learn more about this process, researchers at the NASA Langley Research
Center, the Indiana University Center for Survey Research, Rensselaer Polytechnic Institute, and
institutions in selected counties organized a research project to study knowledge diffusion in
aerospace. Sponsored by NASA and the DoD, endorsed by aerospace professional societies, and
sanctioned by several groups and panels, the NASA/DoD Aerospace Knowledge Diffusion
Research Project was begun in 1989 as a five-year project "to provide descriptive and analytical
data regarding the flow of scientific and technical information (STI) at the individual,
organizational, national, and international levels and to examine both the channels used to
communicate STI and the social system of the aerospace knowledge diffusion process" (Pinelli,
Kennedy, and Barclay, 1991). The Project, in four phases, focuses on technology rather than
science and on engineers rather than scientists and takes the position that STI resulting from
federally funded aerospace R&D is an economic asset or resource rather than a component of
national security. The Project Fact Sheet is Appendix A.
The research results of the Project could be used to understand the information
environment in which U.S. aerospace engineers and scientists work (that is, the academic,
government, and industrial sectors), the information-seeking behaviors of U.S. aerospace
engineers and scientists, and the factors that influence their use of STI. Such an understanding
could (1) lead to the development of practical theory, (2) contribute to the design and
development of systems for diffusing aerospace information, and (3) have practical implications
for transferring the results of federally funded R&D to the U.S. aerospace community.
METHODS AND SAMPLE DEMOGRAPHICS
A group of engineering faculty members, librarians, and technical communicators worked
with the Project team to compile the list of survey questions. The questions were pretested
before distribution. The student survey is Appendix B. Faculty members in each of the four
countries distributed self-administered (self-reported) questionnaires to aerospace engineering and
2

sciencestudentsat their respectiveuniversities in the spring of 1994.2 English-language
questionnaires were used in India and the U.K. The survey was translated into Japanese and
Russian for use in Japan and Russia, respectively. With minor exceptions, the questionnaires
used in the four countries were identical. Code books containing the aggregate responses from
three of the four countries are Appendix C. A word of caution: The samples from each country
are small. The samples are, in all likelihood, not representative of all aerospace engineering and
science students in each of the respective countries. Given this limitation, the data should be
regarded as exploratory rather than conclusive. The results should be interpreted cautiously.
Finally, no statistical test(s) or treatment has been applied to the data.
PRESENTATION OF THE DATA
Demographic information for the student samples appears in table 1. The number of
respondents for each country included -- India (40), Japan (77), Russia (117), and the United
Kingdom (U.K.) (127). The majority of the student respondents were male. About 15% of the
U.K. and 13% of the Russian students were female. 3 About 4% of the Japanese students were
women. There were no female students in the Indian sample.
The sample included both undergraduate and graduate students. The entire Indian sample
was composed of graduate students. Slightly more than half (54.1%) of the Japanese students
were undergraduates and 61% of the Russian students were graduate students. Slightly more than
three-quarters (78.2%) of the students from the U.K. were graduate students. Most of the
students surveyed were being educated to become engineers. About three-quarters of the Indian
students (72.5%) and U.K. students (73.2%) were preparing to become engineers. About 90%
of the Russian and almost all (97.3%) of the Japanese students were preparing to become engi-
neers. Twenty percent of the Indian students and about 16% of the U.K. students were preparingto become scientists.
With the exception of the U.K. students, most of the students were citizens of the country
in which their school was located. Forty-five percent of the U.K. students reported that they
were not a citizen of the country where they attended school. Further, 46% of the U.K. students
stated that the U.K. was not their native country. The majority of the students from Japan and
Russia were not members of a professional student (national) engineering, scientific, or technical
society.
2rl'he student surveys were conducted at the Indian Institute of Science, the University of
Tokyo, Moscow Aviation Institute, Cranfield Universify, and the University of Southampton.
rThese percentages are approximately equal to the percentages of female students who
responded to th6 AIAA national student survey we conducted in the U.S.

Finally, we asked respondents to compare their families's incomes with the incomes of
most families in their native countries. Most students reported family incomes that were equal
to or greater that the incomes of most other families. About 23% of the Russian students, about
11% of the U.K., and 13% of the Japanese students reported that their families's incomes werelower than the incomes of other families in their countries.
Table 1. Survey Demographics
Demographics
Gender
Female
Male
Educational Status
UndergraduateGraduateOther
Educational Preparation As
An EngineerA Scientist
Other
Native CountryIndia
JapanRussia
U.K.
Other
Member Of A Professional Student (National)
Engineering, Scientific, Or Technical SocietyYes
No
Citizen of Country Where You Attend SchoolYes
No
Income Relative To Other Families In Native Country
Higher than Other FamiliesAbout the Same as Other Families
Lower than Other Families
Can't Compare to Other Families
India
(n=40)
%
100
100
72.5
20.0
7.5
100
100
27.5
65.0
5.0
2.5
Japan
(n =77)
%
4.1
95.9
54.1
37.8
8.1
97.3
2.7
0.0
100
28.8
71.2
93.2
6.8
22.7
62.7
12.9
2.7
Russia
(n=117)
%
13.0
87.0
39.0
61.0
89.2
6.9
3.9
100
15.5
84.5
94.4
5.6
15.3
68.6
23.3
2.9
U°K.
(n=127)
%
14.6
85.4
14.7
78.26.6
73.2
15.5
11.4
1.6
1.6
0.8
49.646.3
66.7
33.3
54.9
45.1
42.4
44.8
11.2
1.6
4

AerospaceEngineering as a Career Choice
With the exception of the Indian students, most students made their decision to study
engineering prior to starting college (see table 2). There is some variation among students' re-
ports of the timing of their career decision choice. The Japanese sample contains the highest
percentage of students who indicated that they had made their career choices while still in
elementary school (26%). About half of Russian, Japanese, and British respondents reported that
they had made their decisions while still in high school. About 35% of Russian and British
students and 25% of Japanese students decided to study engineering and science when they
started or after they started college. In addition, 65% of Indian respondents reported that they
had made their career choices when they started or after they started college 4.
Table 2. Career Choice/Selection Decision Point
of Aerospace Engineering and Science Students
Decision Points
While Still In Elementary School
While In High School
When Starting College
After Starting CollegeOther
India
(n:40)
%
2.5
17.5
30.0
35.0
15.0
Japan
(n=77)
%
26.0
49.3
6.5
18.2
Russia
(n=llT)
%
11.2
47.4
17.2
19.0
5.2
U.K.
(n=127)
%
8.7
50.8
16.8
18.0
5.7
Factors Influencing Career Choice
Students were asked to rate the importance of six factors that may have influenced their
choice of careers (table 3). Three of the factors deal with the influence of people (i.e., parents,
other family members, and teachers) in helping students to make their career choices; one factor
focused on the influence of information about the career. The remaining two factors related to
the career itself and include such elements as financial security.
4All of the respondents in the Indian sample are graduate students. The higher percentage
of Indian students compared to the other samples who report that they made their career
choice after entering college may in fact represent their decisions to study at the graduate
level rather than their initial decisions to study engineering and science at the undergraduatelevel.
5

The expectation that engineering work is intrinsically rewarding was the factor having the
single greatest influence on the career choice for Indian (60%), Japanese (76.6%), and U.K. stu-
dents (71.5%). Access to information on career opportunities was the most important or influ-
ential factor (45%) for Russian students. Fifty percent of the Indian students reported that access
to information on career opportunities was an important or influential factor in making their
choice to pursue a career in aerospace engineering or science.
Importance ratings of the influence of other people -- parents, teachers, and other family
members -- were lower than the importance rating of job-related factors. Of the three factors
concerned with the influence of people (i.e., parents, other family members, and teachers) in
helping students to make their career choices, the encouragement of parents appears to have
exerted greater influence on career choice than did encouragement from other family members
and teacher. Students in the Indian sample, however, reported that the encouragement of teachers
had a greater influence on their career decisions than did parents and other family members.
Table 3. Influence (Importance) of Selected Factors on Career
Choice of Aerospace Engineering and Science Students
India Japan
(n=40) (n=77)
Factors %a %,
Your Parents Encouraged Your Area
Of Study/Major
Other Family Members Encouraged
Your Area Of Study/Major
Teachers Encouraged Your Area Of
Study/MajorYou Feel That A Career In Your
Major/Area Of Study Will Lead To
Financial SecurityYou Feel That A Career In Your
Major/Area Of Study Will Provide
A Career With RewardingActivities
Information On The Career
Opportunities Available In Your
Major/Area Of StudyOther Factors
37.5 3.9
12.5 2.6
40.0 1.3
30.0 7.8
60.0 76.6
50.0 24.7
25.0 7.8
Russia U.K.
(n=117) (n=127)
%a %a
21.5 14.6
8.8 9.8
13.1 15.7
16.9 23.0
12.7 71.5
45.0 18.9
30.8 22.0
astudents used a 7-point scale to rate the importance of each factor, where 7 indicates the
highest rating. Percentages include combined "6" and "7" responses.
6

Satisfaction with Career Choice
Students were asked to rate their current level of satisfaction with their career choice
(table 4). Forty five percent of Indian students and 32% of the U.K. students reported that they
are happier with their career decisions now compared to when the decisions were first made.
About 43% of the Indian and about 63% of the Japanese students reported that they feel about
the same now as when they first made their career decisions. About 38% of the Russian students
reported they were less happy with their career choice now than when they first made them.
Table 4. Career Choice/Selection Satisfaction
of Aerospace Engineering and Science Students
Satisfaction Level
I Am Happier About My CareerChoice Now Than When I First
Made It
I Feel About The Same Now As When
I First Made It
I Am Less Happy About My Career
Choice Now Than When I First
Made It
India Japan
(n=40) (n=77)
% %
45.0 13.0
42.5 62.3
12.5 24.7
Russia U.K.
(n=117) (n=127)
% %
25.2 32.0
36.5 45.1
38.3 23.0
Career Expectations and Goals
This section explores the expectations of student respondents concerning several aspects
of their future careers. Students were asked to indicate the type of organization in which they
hope to work after graduation. They were also given a list of 15 specific career goals and
aspirations and asked to rate the importance of each to a successful career.
Type of Organization. Students were asked to identify the type of organization in which
they hope to work after graduation. Table 5 shows their organizational preferences. With the
exception of the Indian students, most students report that they plan to work in either national
or multi-national industry. Indian respondents plan to work in either academia (52.5%) or in
government (27.5%). About 35% of the Japanese respondents indicated that they planned to
work in academia, compared to about 13% of British students and less than 9% of the Russian
students. Japanese students were the least interested in working in government (2.6%). Just
under 24% of the Russian students and about 20% of the British students indicated that they
7
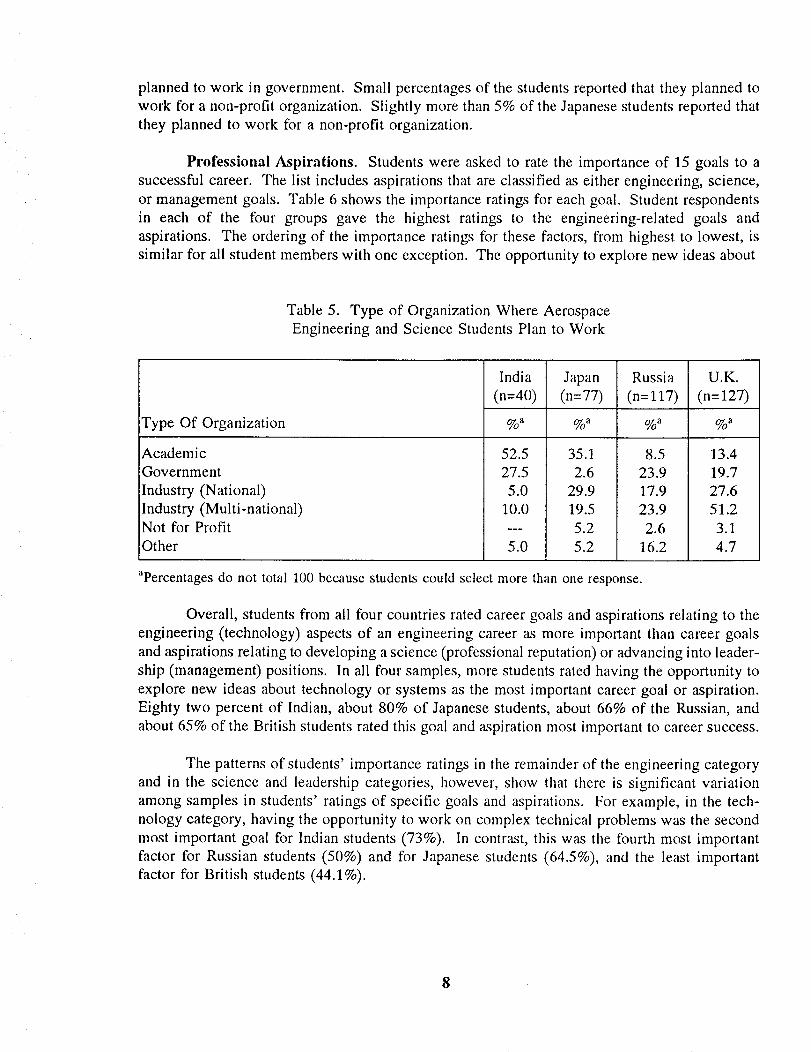
planned to work in government. Small percentages of the students reported that they planned to
work for a non-profit organization. Slightly more than 5% of the Japanese students reported that
they planned to work for a non-profit organization.
Professional Aspirations. Students were asked to rate the importance of 15 goals to a
successful career. The list includes aspirations that are classified as either engineering, science,
or management goals. Table 6 shows the importance ratings for each goal. Student respondents
in each of the four groups gave the highest ratings to the engineering-related goals and
aspirations. The ordering of the importance ratings for these factors, from highest to lowest, is
similar for all student members with one exception. The opportunity to explore new ideas about
Table 5. Type of Organization Where Aerospace
Engineering and Science Students Plan to Work
Type Of Organization
Academic
Government
Industry (National)
Industry (Multi-national)Not for Profit
Other
India
(n=40)
%a
52.5
27.5
5.0
10.0
5.0
Japan
(n=77)
%a
35.1
2.6
29.9
19.5
5.2
5.2
Russia
(n=117)
a
8.5
23.9
17.9
23.9
2.6
16.2
U.K.
(n=127)
%a
13.4
19.7
27.6
51.2
3.1
4.7
apercentages do not total 100 because students could select more than one response.
Overall, students from all four countries rated career goals and aspirations relating to the
engineering (technology) aspects of an engineering career as more important than career goals
and aspirations relating to developing a science (professional reputation) or advancing into leader-
ship (management) positions. In all four samples, more students rated having the opportunity to
explore new ideas about technology or systems as the most important career goal or aspiration.
Eighty two percent of Indian, about 80% of Japanese students, about 66% of the Russian, and
about 65% of the British students rated this goal and aspiration most important to career success.
The patterns of students' importance ratings in the remainder of the engineering category
and in the science and leadership categories, however, show that there is significant variation
among samples in students' ratings of specific goals and aspirations. For example, in the tech-
nology category, having the opportunity to work on complex technical problems was the second
most important goal for Indian students (73%). In contrast, this was the fourth most important
factor for Russian students (50%) and for Japanese students (64.5%), and the least important
factor for British students (44.1%).
8

Table 6. CareerGoalsandAspirationsof Aerospace Engineering and Science Students
Goals
Engineering
Have The Opportunity To Explore
New Ideas About Technology Or Systems
Advance to High Level StaffTechnical Position
Have The Opportunity To Work On
Complex Technical Problems
Work On Projects That UtilizeThe Latest Theoretical Results
In Your Specialty
Work On Projects That Require
Learning New Technical Knowledge
Science
Establish A Reputation Outside
Your Organization As An
Authority In Your FieldReceive Patents for Your Ideas
Publish Articles In Technical
Journals
Communicate Your Ideas To Others
In Your Profession by Presenting
Papers At Professional MeetingsBe Evaluated On The Basis Of Your
Technical Contributions
Leadership (Management)
Become A Manager Or DirectorPlan And Coordinate The Work Of Others
Advance To A Policy-
making Position In Management
Plan Projects And Make Decisions
Affecting The Organization
Be The Technical Leader Of A Group
Of Less Experienced Professionals
India
(n=40)
82.0
55.0
73.0
60.0
67.5
65.0
35.8
75.0
57.5
67.5
Japan
(n=77)
O-_a
80.2
46.0
64.5
68.4
68.9
24.6
23.0
25.7
47.4
40.3
Russia
(n=l17)
O_a
66.1
35.4
50.0
58.5
55.3
59.1
57.8
31.2
45.6
38.1
O.K.
(n-127)
O_a
65.3
52.0
44.1
46.0
57.6
49.6
18.6
25.4
37.3
42.7
22.5
35.0
30.8
36.9
21.1
23.7
11.0
19.0
33.4
21.1
33.9
25.9
31.2
40.5
25.5
60.3
58.8
67.4
73.4
50.4
astudents used a 7-point scale to rate the importance of each goal, where 7 indicates the
highest rating. Pcrcentages include combined "6" and "7" responses.
9

Among goals and aspirations related to science (the development of a professional
reputation), Indian students rated the goal of publishing articles in technical journals more
importantly than any other goal in this category (75%). About 31% of the Russian students,
25.7% of the Japanese students, and 25.4% of British students considered the goal of publishing
articles in technical journals to be important. Russian students were most interested in
establishing a reputation outside of their organization as an authority in their field (59.1%) and
in receiving patents for their ideas (57.8%). The goal rated most important by the Japanese stu-
dents was communicating ideas to others by delivering papers at professional meetings (47.4%)
and being evaluated on the basis of their technical contributions (40.3%). British students rated
the goals of (1) establishing a professional reputation outside of the organization (49.6%) and (2)
to being evaluated on the basis of their technical contributions (42.7%) most important.
Students from the U.K. consistently rated career goals and aspirations associated with
leadership (management) higher than did the Indian, Japanese, and Russian students. Of the five
career goals and aspirations in this category, U.K. students rated "planning projects and making
decision affecting the organization" most important (73.4%) followed by "advancing to a policy-
making position in management" (67.4%). Of the five career goals and aspirations in this
category, Russian (40.5%), Indian students (36.9%), and Japanese students (33.4%) rated
"planning projects and making decision affecting the organization" most important.
Communications Skills
The literature on engineering education establishes the importance of effective
communications skills to professional success (Black, 1994; Morrow, 1994; Evans, et. al., 1993;
Katz, 1993; Garry, 1986; Devon, 1985). Student survey respondents were asked to assess the
importance of selected communications skills to professional success, to indicate if they had
received instruction in these skills, and to rate the helpfulness (usefulness) of that instruction.
Importance of Communications Skills Training
Students were asked to rate the importance of six communications skills to professional
career success (table 7). Although there are variations in students' importance ratings of each
of the six skills across the four samples, as well as their relative rankings of these skills within
each sample, students in all four samples rate the importance of the six skills high. Indian
students consistently assigned higher importance ratings to these (competencies) skills than did
Japanese, Russian, and U.K. students. For example, 90% of the Indian students reported that the
ability to effectively communicate technical information in writing is an important skill,
compared to about 67% of the Japanese, about 68% of the U.K., and about 48% of the Russian
students. The skill (competency) that received the highest importance ratings across samples is
the ability to use computer, communication, and information technology. This skill was rated
most important by the Russian (85.6%) and U.K. (85.8%) students, and was rated second in
importance by Indian (87.5%) and Japanese students (71%).
10
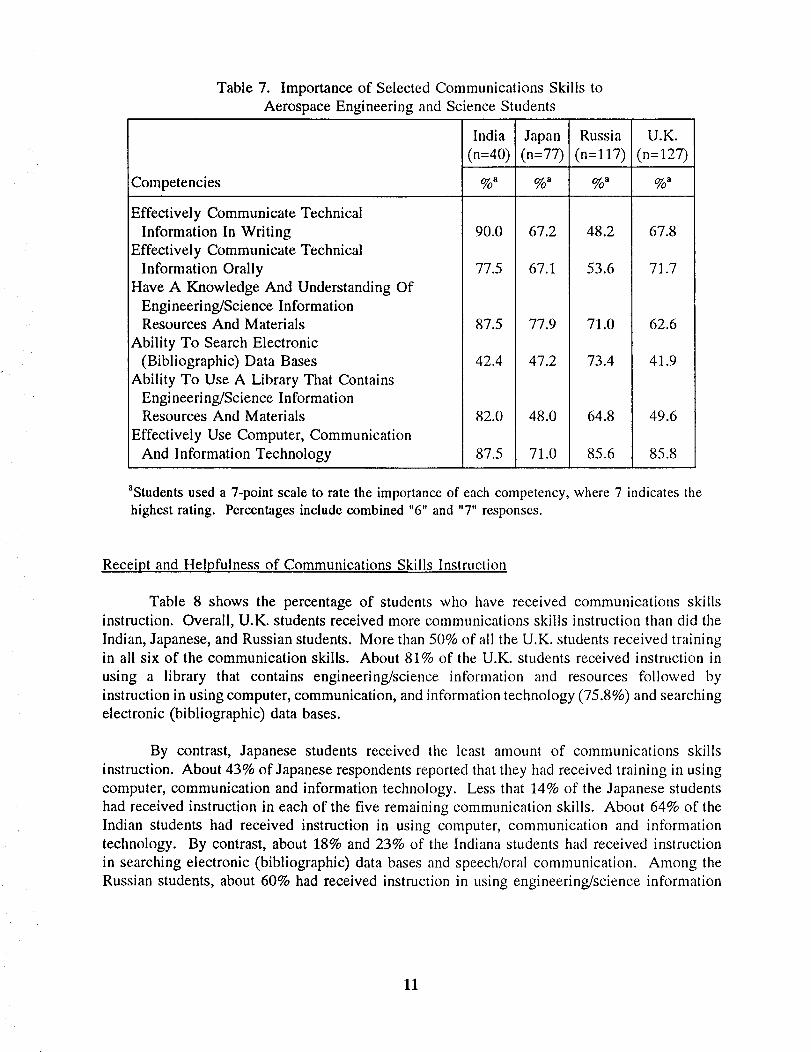
Table7.AerospaceEngineeringandScienceStudents
Competencies
Importanceof SelectedCommunicationsSkills to
Effectively CommunicateTechnicalInformation In Writing
Effectively CommunicateTechnicalInformation Orally
HaveA KnowledgeAnd UnderstandingOfEngineering/ScienceInformationResourcesAnd Materials
Ability To SearchElectronic(Bibliographic)DataBases
Ability To UseA Library That ContainsEngineering/ScienceInformationResourcesAnd Materials
Effectively UseComputer,CommunicationAnd InformationTechnology
India Japan(n=40) (n=77)
%, %,
Russia U.K.(n=117) (n=127)
%, %a
90.0 67.2 48.2
77.5 67.1 53.6
87.5 77.9 71.0
42.4 47.2 73.4
82.0 48.0 64.8
87.5 71.0 85.6
67.8
71.7
62.6
41.9
49.6
85.8
"Studentsuseda 7-pointscaleto ratetheimportanceof eachcompetency,where7 indicatesthehighestrating. Percentagesincludecombined"6" and"7" responses.
Receipt and Helpfulness of Communications Skills Instruction
Table 8 shows the percentage of students who have received communications skills
instruction. Overall, U.K. students received more communications skills instruction than did the
Indian, Japanese, and Russian students. More than 50% of all the U.K. students received trainingin all six of the communication skills. About 81% of the U.K. students received instruction in
using a library that contains engineering/science information and resources followed by
instruction in using computer, communication, and information technology (75.8%) and searching
electronic (bibliographic) data bases.
By contrast, Japanese students received the least amount of communications skills
instruction. About 43% of Japanese respondents reported that they had received training in using
computer, communication and information technology. Less that 14% of the Japanese students
had received instruction in each of the five remaining communication skills. About 64% of the
Indian students had received instruction in using computer, communication and information
technology. By contrast, about 18% and 23% of the Indiana students had received instruction
in searching electronic (bibliographic) data bases and speech/oral communication. Among the
Russian students, about 60% had received instruction in using engineering/science information
11

resourcesand materialsandabout54% hadreceivedinstruction in usinga library that containsengineering/scienceinformationresourcesandmaterials. Justover40% of theRussianstudentsreported that they received training in technical writing/communication and speech/oralcommunication.
Table 8. Communications Skills Instruction Received by
Aerospace Engineering and Science Students
Instruction
Technical Writing/Communication
Speech/Oral Communication
Using A Library That Contains
Engineering/Science Information
Resources And Materials
Using Engineering/Science Information
Resources And Materials
Searching Electronic (Bibliographic)Data Bases
Using Computer, Communication, And
Information Technology
India
(n:40)
%
36.8
23.1
33.3
43.6
17.9
64.1
Japan
(n=77)
%
10.5
13.2
10.5
9.3
11.7
43.4
Russia
(n=117)
%
41.1
43.8
53.6
59.5
17.1
32.4
U.K.
(n=127)
%
54.0
60.5
81.3
61.3
75.0
75.8
Students receiving communications skills instruction were asked to rate the helpfulness
(usefulness) of that instruction (table 9). Although a larger percentage of the U.K. students
received communications skills instruction than did the Indian, Japanese, and Russian students,
the U.K. students reported that their training was not particularly helpful. About 60% reported
that their instruction in using computer, communication and information technology was helpful.
Fewer than 45% of the U.K. students surveyed reported that their training in the other five
communication skills was helpful. Overall, Indian and Russian students rated the communication
skills instruction they received "more helpful" than did the Russian and U.K. students.
Indian students rated the skills instruction they received in speech/oral communication
highest (77.8%) followed by instruction in searching electronic (bibliographic) data bases (71.4%)
and using engineering/science information resources and materials (70.6%). Russian students
rated the instruction they received in using computer, communication, and information technology
highest (65%) followed by instruction in using engineering/science resources and materials
(63.6%) and in using a library that contains engineering/science resources and materials (61.5%).
12

Table9. Helpfulnessof CommunicationsSkills InstructionReceivedby Aerospace Engineering and Science Students
Instruction
Technical Writing/Communication
Speech/Oral Communication
Using A Library That Contains
Engineering/Science InformationResources And Materials
Using Engineering/Science InformationResources And Materials
Searching Electronic (Bibliographic)Data Bases
Using Computer, Communication, And
Information Technology
India Japan
(n=40) (n=77)
%. %a
64.3 50.0
77.8 36.4
42.3 37.5
70.6 33.3
71.4 10.0
60.0 40.0
Russia U.K.
(n=117) (n=127)
%a %a
38.3 40.8
42.6 47.5
61.5 40.6
63.6 36.1
50.0 43.4
65.0 60.8
aStudents used a 7-point scale to rate the helpfulness of the instruction, where 7 indicates the
highest rating. Percentages include combined "6" and "7" responses. Percentages exclude re-
sponses who did not receive instruction.
Impediments to Preparing Written Technical Communications
We asked students to report the extent to which a lack of knowledge/skill about certain
communications principles impedes their ability to prepare written technical communications
(table 10). Overall, students did not report serious problems with their writing skills, at least to
the point that any deficiencies might impede the technical writing process. The lowest
"impedance" scores (i.e., scores clustering around 50% or higher) were recorded only four times.
In terms of their ability to prepare written technical communication, about 37% of the
Indian students reported difficulty with preparing/presenting information in an organized manner;
about 36% reported difficulty in defining the purpose of the communication. Japanese students
reported the greatest difficulty with preparing/presenting information in an organized manner
(58.3%) and in defining the purpose of the communication (50%). About 58% and 54% of the
Russian students reported difficulty with defining the purpose of the communication and pre-
paring/presenting information in an organized manner.
Collaborative Writing
Most students in the sample have some experience in collaborative writing (table 11).
Indian students reported that about 52% of their written technical communication involved
13

Table 10. Factors Impeding the Ability of Aerospace
Engineering and Science Students to Produce Written Technical Communication
Principles
Defining The Purpose Of TheCommunication
Assessing The Needs Of The Reader
Preparing/Presenting Information In
An Organized Manner
Developing Paragraphs
(Introductions, Transitions,
Conclusions)
Writing Grammatically CorrectSentences
Notetaking And Quoting
Editing And RevisingOther
India
(n=40)
a
36.4
31.0
37.1
28.6
20.0
12.5
29.0
Japan
(n=77)
%a
50.0
22.1
58.3
32.4
22.7
23.1
26.3
1.3
Russia
(n=l17)
57.9
33.8
54.3
35.1
32.9
23.7
43.4
6.8
U.K.
(n=127)
a
21.4
19.4
25.0
21.6
15.9
13.7
13.2
0.8
astudents used a 7-point scale to measure the extent to which each principle impedes their ability to pro-
duce written technical communications, where 7 indicates greatly impedes. Percentages include combined
"6" and "7" responses.
collaborative writing. On average, about 33% and 18%, respectively, of the written technical
communication performed by the Russian and U.K. students involved collaborative writing. On
average, about 19% of the written technical communication performed by Japanese students
involved collaborative writing.
Table 11 also reports the percentage of students' written technical communication that is
required to be collaborative. A greater percentage of students' written technical communication
is required to be collaborative. On average, about 54%, 43%, 40%, and 38% of the written
technical communication performed by Indian, Russian, Japanese, and U.K. students are required
to be collaborative.
We also asked students who write collaboratively to compare tile productivity of group
writing to the productivity of writing alone (table 12). A high percentage of Indian (43.3%)
Japanese (41.4%), and Russian (71%) students, respectively reported that writing alone was less
productive than writing alone. About 38% of the U.K. students indicated that collaborative
writing was more productive than writing alone.
14

Table 11. Productionof Written TechnicalCommunicationBy Aerospace Engineering and Science Students
Factor
Percentage Of Written Technical
Communication Involving
Collaborative WritingO%
1 - 24%
25 - 49%
50- 74%
75 - 99%
100%
Mean %
Median %
Percentage Of Written Technical Communication
Required To Be Collaborative? a0%
1 - 24%
25 - 49%
50 - 74%
75 - 99%
100%
Mean %
Median %
India
(n=40)
%
14.7
5.9
11.8
35.3
17.6
14.7
52.1
50.0
16.0
20.0
40.0
16.0
80.0
53.5
50.0
Japan
(n=77)
%
63.2
14.7
4.4
4.4
2.9
10.3
18.5
0.0
18.2
40.9
31.8
9.1
40.2
40.0
Russia
(n=117)
%
33.0
17.0
9.1
25.0
11.4
4.5
33.0
25.0
3.6
21.4
21.4
39.4
7.1
7.1
43.3
50.0
U.K.
(n=1270
%
41.6
34.5
7.1
9.7
6.2
0.9
17.8
5.0
6.6
32.8
14.8
32.8
8.2
4.9
38.3
30.0
apercentages exclude students who report that they never collaborate on academic writing projects.
Use and Importance of Libraries and Selected Information Sources and Products
This section examines the use and importance of libraries and STI sources and products
to engineering and science students. First, we examine the type of library use instruction that
student respondents received, the effectiveness of the information obtained from the library in
meeting students' engineering/science information needs, and their use (search) of electronic
(bibliographic) data bases. Finally, we explore the use and importance of selected information
sources and products.
15

Table 12. Productivity of Collaborative Writing
of Aerospace Engineering and Science Students
How Productive
Less Productive Than Writing Alone
About As Productive As Writing Alone
More Productive Than Writing Alone
India
(n=40)
a
43.4
37.6
20.0
Japan
(n=77)
a
41.4
34.5
24.1
Russia
(n=117)
a
71.0
22.5
6.5
U.K,
(n=127)
a
30.3
31.8
37.9
apercentages exclude students who report that they never collaborate on academic writing projects.
Library Use Instruction
We asked students to indicate whether they had received instruction in six areas related
to library use. These data are summarized in table 13. Higher percentages of U.K. students
reported receiving library training than did Indian, Russian, and Japanese respondents. Nearly
80% of the U.K. students had participated in a library tour, and about 71% reported that they had
received library instruction for end-users in searching electronic (bibliographic) data bases. About
(62%) received a library presentation as part of their academic orientation. Nearly 57% of the
U.K. students reported receiving library orientation as part of an engineering or science course.
About 33% of the Indian students received a library tour or presentation as part of their
academic orientation. About 35% of the Indian students had received a library skill/use course
in engineering/science information resources and materials. About 9% received library orienta-
tion as part of an engineering or science course. About 23% of the Russian students received
a presentation as part of their academic orientation. About 13% of the Russian students reported
receiving library orientation as part of an engineering or science course.
As a group the Japanese students received less library training than did the members of
other three student groups. About 18% and 15%, respectively, of the Japanese students received
a library presentation as part of academic orientation and library orientation as part of an
engineering or science course. About 8% of the Japanese students had participated in a library
tour. About 23% of the Russian students reported participating in a library presentation as part
of their academic orientation. About 13% of the Russian students received library orientation
as part of an engineering or science course and about 13% had received a library tour.
About 79% of the U.K. students had received a library tour and about 62% had received
a library presentation as part of their academic orientation. A majority (57%) of the U.K. students
had received a library skill course in bibliographic instruction, training in using
engineering/science information resources and materials (58.3%), and in searching electronic
(bibliographic) data bases (71.4%).
16

Table 13. Library Training Receivedby AerospaceEngineeringandScienceStudents
Type Of Instruction
Library Tour
Library Presentation As Part OfAcademic Orientation
Library Orientation As Part Of An
Engineering/Science Course
Library Skill/Use Course
(Bibliographic Instruction)
Library Skill/Use Course In
Engineering/Science InformationResources And Materials
Library Instruction For End-user
Searching Of Electronic
(Bibliographic) Data Bases
India
(n=40)
%
33.3
33.3
Japan
(n=77)
%
8.3
17.8
Russia
(n=l17)
%
13.0
23.1
U.K.
(n=127)
%
78.9
62.1
9.1 15.3
22.2 2.7
35.3 2.7
20.0 8.2
12.8 56.6
14.5 57.0
15.6 58.3
10.0 71.4
Library Use
We also asked students respondents to indicate the number of times that they had used
a library during the current school term (see table 14). On average, Indian and U.K. students
Table 14. Use of A Library This School Term by
Aerospace Engineering and Science Students
Visits
0 Times
1- 5 Times
6- 10 Times
11 - 25 Times
26 - 50 Times
51 Or More Times
India
(n=40)
%
8.3
Japan
(n=77)
%
5.4
43.2
35.1
Russia
(n=117)
%
24.5
50.3
11.3
U.K.
(n=127)
%
24.5
20.6
Mean
Median
29.2
29.2
33.3
28.1
20.0
8.1
8.1
9.6
6.0
9.4 23.5
2.8 27.5
1.9 3.9
5.0 20.8
3.0 15.0
17

madegreateruse (i.e., visited the library more times) of a library thandid the JapaneseandRussianstudents. Slightly morethan5% andabout25% of the JapaneseandRussianstudentsuseda library "0" timesduring theschoolterm. The fact that Indianstudentsandabout75%ofthe British studentsaregraduatestudentsandthemajority of RussianandJapanesestudentsareundergraduatesmay explain the differencein library use. Typically, graduatestudentshaveinformationneedsthatgenerallycannotbesatisfiedby textbooksandotherclassroommaterials.Therefore,graduatestudentswouldbeexpectedto makemore frequentuseof library resourcesthanwould undergraduatestudents.
Effectiveness of Information Obtained From the Library
Those students who had used a library during the current term were asked to rate the
effectiveness of the information obtained from the library in meeting their engineering/science
information needs (see table 15). The overall rating of the "effectiveness of the information
received)_s about equal for the four student groups. About 63% of the Indian students reported
that the information received from the library was very effective; none of the Indian students
reported that the information they received was very ineffective in terms of meeting their infor-
mation needs. Between 40% and 49% of the U.K., Japanese, and Russian students reported that
the information they obtained from the library was very effective in meeting their information
needs. Between 3% and 10% of U.K., Japanese, and Russian students reported that the infor-
mation they obtained from the library was very ineffective in meeting their information needs.
Table 15. Effectiveness of Information Obtained From the Library
in Meeting Information Needs of Aerospace Engineering and Science Students
Effectiveness
Very Effective
Neither Effective Nor Ineffective
Very Ineffective
Mean
India
(n=40)
57.5
42.5
5.6
Japan
(n=77)
a
43.4
50.7
5.8
5.2
Russia
(n=l17)
48.7
41.0
10.3
5.2
U.K.
(n=127)
o_a
40.0
57.6
2.4
5.2
astudents used a 7-point scale to rate the effectiveness of the information they obtained from the library,
where 7 indicates the highest rating. Percentages include combined "6" and "7" responses.
Reasons for Nonuse of a Library
We also asked the students who had not used a library during the current term to indicate
their reasons for non-use. The percentages of non-users by the reason for non-use of a library
appear in table 16. All of the Indian and U.K. students reported using a library at least one times
18

during the current school term. About 75% of Japanese non-users and about 53% of Russian
non-user reported that they had no information needs. About 75% of the Russian non-users re-
ported that their information needs were met some other way. Russian students also listed con-
siderably more reasons for library non-use than did respondents in the other three student groups.
Table 16. Reasons Aerospace Engineering and Science Students
Did Not Use A Library During This Current School Term
Reasons
I Had No Information Needs
My Information Needs Were More EasilyMet Some Other Way
Tried The Library Once Or TwiceBefore But I Couldn't Find TheInformation I Needed
The Library Is Physically Too Far
AwayThe Library Staff Is Not
Cooperative Or HelpfulThe Library Staff Does Not Understand
My Information NeedsThe Library Did Not Have The
Information I Need
I Have My Own Personal Library And DoNot Need Another Library
The Library Is Too Slow In GettingThe Information I Need
We Have To Pay To Use The LibraryWe Are Discouraged From Using The
Library
India
(n=40)
O_a
Japan
(n=77)
%
I00.0
0.0
0.0
0.0
0.0
0.0
0.0
25.0
0.00.0
0.0
Russia
(n=117)
%
65.7
78.2
54.5
15.8
54.5
60.0
72.7
63.6
31.60.0
60.0
U.K.
i(n=127)
aAll Indian and U.K. student respondents reported that they used a library at least once this school term
and, therefore, did not report "0" times use to Q.18.
Searching of Electronic (Bibliographic) Data Bases
We were also interested in finding out how students search electronic (bibliographic) data
bases (table 17). About 73% of the Russian students reported that they do not have access to
electronic (bibliographic) data bases and about 15% of Russian students indicate that they have
not used these types of data bases. Of the four student groups, the U.K. students appear to have
the greatest access to electronic (bibliographic) data bases. Of those students that do use them,
about 81% of the U.K. students report that they conduct most or all of their own data base
19

searches.About 15% of the U.K. students report that they do most or all searches through a
librarian. About 31% of the Indian and about 32% of the Japanese students indicated that theydo most or all of their data base searches themselves. About 31% of the Indian students and
about 20% of the Japanese students report that they do most or all searches through a librarian.
Table 17. How Aerospace Engineering and Science Students
Search Electronic (Bibliographic) Data Bases
Approach
I Do All Searches Myself
I Do Most Searches MyselfI Do Half By Myself And Half
Through A LibrarianI Do Most Searches Through A Librarian
I Do All Searches Through A LibrarianI Do Not Use Electronic Data Bases
I Do Not Have Access To ElectronicData Bases
India
(n=40)
%
10.320.5
10.35.1
15.428.2
10.3
Japan
(n=77)
%
11.7
20.8
11.73.93.9
31.2
16.9
Russia
(n=117)
%
4.9
4.9
1.01.8
14.6
72.8
U.K.
(n=127)
%
41.7
38.9
11.93.2
4.0
0.8
Student Information-Seeking Behavior
To learn students' preferences for using particular information sources, we asked students
to indicate the sequence in which they consulted a range of information resources (table 18). The
first step for most students was to consult their personal stores of technical information. (About
36% of Indian students, about 64% of the Japanese students, about 46% of the Russian students,
and about 38% of the U.K. students consulted their personal stores of technical information first.)
The second step for Indian students was to speak to faculty members (23.1%). For Japanese,
Russian, and U.K. students the second step was to speak to other student (26.2%) (37.5%)
(18.1%). Indian and Russian students spoke with faculty members (25.6%)(22.1%) as the third
step. Japanese and U.K. students used literature resources found in a library (36.4)(21.2) as their
third step.
About 97% of the Indian students used literature resources found in a library. However,
about 11% of the Indian students did not consult a librarian during the search process. About
80% of the Japanese students used literature resources found in a library. However, about 90%
of the Japanese students did not consult a librarian during the search process. Further, about 82%
did not search (or have searched for them) an electronic (bibliographic) data base in the library
during the search process.
2O

About 97% of the Russian students used literature resources found in a library. However,
about 93% of the Russian students did not consult a librarian during the search process. Further,
about 99% of them did not search (or have searched for them) an electronic (bibliographic) data
base in the library during the search process. About 88% of the U.K. students used literature
resources found in a library. However, about 55% of the U.K. students did not consult a
librarian during the search process. Further, about 30% did not search (or have searched for
them) an electronic (bibliographic) data base in the library during the search process.
Table 18. Information Sources Used by Aerospace
Engineering and Science Students in Problem Solving
Information Source
Used Personal Store Of
Technical Information
Spoke With Students
Spoke With Faculty MembersUsed Literature Resources
(e.g., Conference Papers,Journal Articles, Technical
Reports)
Spoke With A LibrarianUsed Literature Resources
Found In A Library
Used Personal Store Of
Technical Information
Spoke With Students
Spoke With Faculty MembersUsed Literature Resources
(e.g., Conference Papers,Journal Articles, Technical
Reports)
Spoke With A LibrarianUsed Literature Resources
Found In A Library
Searched (Or Had Someone
Search For Me) An
Electronic (Bibliographic)
Data Base In The Library
Used None Of The Above Steps
Used Used Used Used Used Used Used Did Not
1_ 2nd 3'd 4 th 5 tb 6 th 7 th Use
% % % % % % % %
INDIA
35.9 7.7 20.5 23.1 7.7 0.0 --- 5.1
0.0 17.9 15.4 28.2 28.2 0.0 --- 10.3
28.2 23.1 25.6 17.9 2.6 0.0 --- 2.6
20.0 37.5 22.5 7.5 10.0 0.0 --- 2.5
0.0 0.0 0.0 0.0 2.7 0.1 --- 89.2
17.5 0.0 15.0 17.5 30.0 0.0 --- 2.5
JAPAN
63.6 15.2 7.6 7.6 3.0 0.0 0.0 3.0
4.6 26.2 21.5 13.8 16.9 3.1 0.0 13.8
12.1 15.2 18.2 15.2 15.2 1.5 1.5 21.2
15.2 22.7 13.6 19.7 4.5 0.0 0.0 24.2
0.0 1.5 0.0 0.0 4.4 4.4 0.0 89.7
1.5 18.2 36.4 18.2 6.1 0.0 0.0 19.7
2.9 1.5 1.5 1.5 1.5 7.4 1.5 82.4
13.0 0.0 0.0 0.0 0.0 0.0 0.0 87.0
21
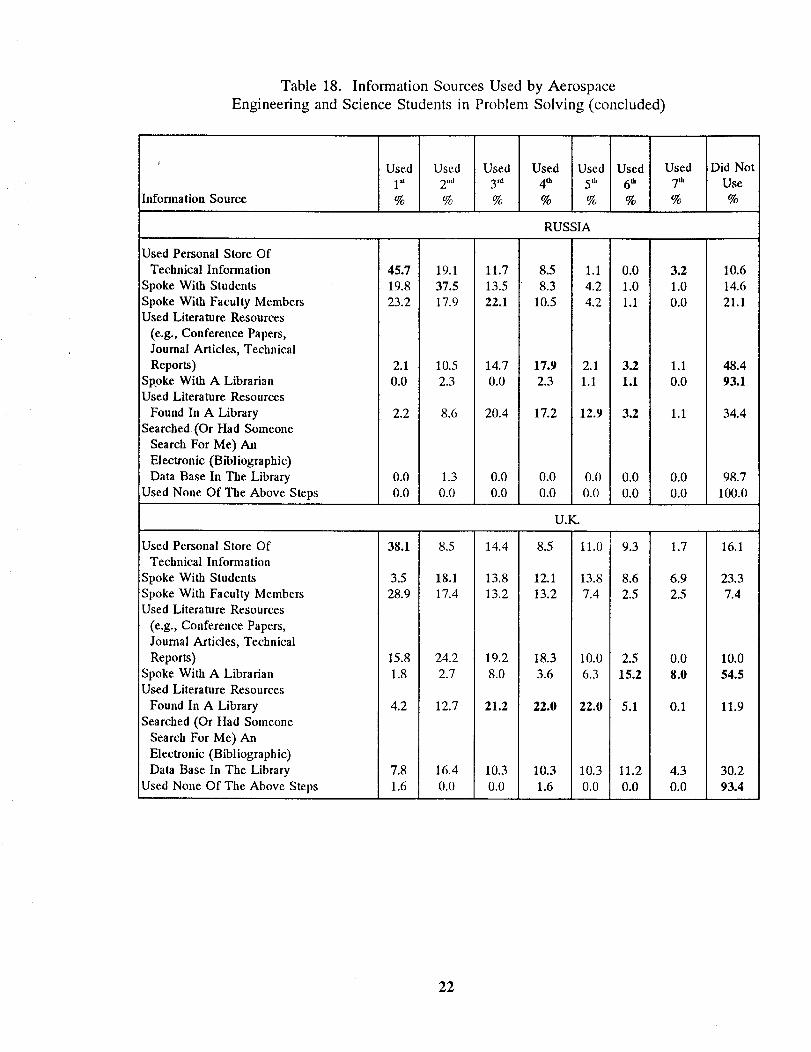
Table 18. Information Sources Used by Aerospace
Engineering and Science Students in Problem Solving (concluded)
Information Source
Used Personal Store Of
Technical Information
Spoke With Students
Spoke With Faculty MembersUsed Literature Resources
(e.g., Conference Papers,
Journal Articles, Technical
Reports)
Spoke With A LibrarianUsed Literature Resources
Found In A Library
Searched (Or Had Someone
Search For Me) An
Electronic (Bibliographic)
Data Base In The Library
Used Nolle Of The Above Steps
Used Personal Store Of
Technical Information
Spoke With Students
Spoke With Faculty MembersUsed Literature Resources
(e.g., Conference Papers,Journal Articles, Technical
Reports)
Spoke With A LibrarianUsed Literature Resources
Found In A Library
Searched (Or Had Someone
Search For Me) Pal
Electronic (Bibliographic)Data Base In The Library
Used Nolle Of The Above Steps
Used Used Used Used Used Used Used Did Not1a 2"a 3rd 4tb 5 th 6 t_ 7 th Use
% % % % % % % %
RUSSIA
45.7 19.1 11.7 8.5 1.1 0.0
19.8 37.5 13.5 8.3 4.2 1.0
23.2 17.9 22.1 10.5 4.2 1.1
2.1 10.5 14.7 17.9 2.1 3.2
0.0 2.3 0.0 2.3 1.1 1.1
2.2 8.6 20.4 17.2 12.9 3.2
0.0 1.3 0.0 0.0 0.0 0.0
0.0 0.0 0.0 0.0 0.0 0.0
U.K.
3.2
1.00.0
1.1
0.0
1.1
0.0
0.0
10.6
14.6
21.1
48.4
93.1
34.4
98.7
100.0
38.1 8.5 14.4 8.5 11.0 9.3 1.7 16.1
3.5 18.1 13.8 12.1 13.8 8.6 6.9 23.3
28.9 17.4 13.2 13.2 7.4 2.5 2.5 7.4
15.8 24.2 19.2 18.3 10.0 2.5
1.8 2.7 8.0 3.6 6.3 15.2
0.0
8.0
4.2 12.7 21.2 22.0 22.0 5.1 0.1
7.8 16.4 10.3 10.3 10.3 11.2
1.6 0.0 0.0 1.6 0.0 0.0
4.3
0.0
10.0
54.5
11.9
30.2
93.4
22

Use and Importance of Selected Information Sources
Student participants were also asked to indicate the frequency of their use of selected
information sources and the importance of these sources (table 19) in meeting the information
needs of aerospace engineer and science students. Students used their personal collections of
information more than any other information source Indian students made the greatest use of
Table 19. Frequency of Use and Importance of Information Sources
Used to Meet Information Needs of Aerospace Engineering and Science Students
During the Most Recent School Term
Information Source
Your Personal Collection
Of Information
Other Students
Faculty Members
LibraryLibrarianYour Personal Contacts
Within IndustryYour Personal Contacts At
Government Laboratories
India
(n=40)
O_ a
97.5
10.0
43.6
87.5
15.4
2.5
5.0
Use
Japan Russia U.K. India
(n=77) (n=l17) (n=127) (n=40)
71.5
58.5
28.6
55.9
5.2
7.8
58.1
31.1
13.2
37.8
2.9
23.6
25.5
75.8
24.2
32.6
73.1
10.6
19.5
8.1
80.0
12.5
45.0
77.5
2.6
12.5
10.0
Importance
Japan Russia
(n=77) (n=l17)
%a %a
50.7 43.9
23.4 23.3
55.9 28.0
54.6 44.3
7.8 5.7
13.0 20.5
16.9 19.8
U.K.
(n=127)
60.0
16.3
33.8
61.7
13.4
19.4
8.0
aFrequency of use was measured using a 5-point scale, where 1 = never and 5 = always. Importance was
measured using a 7-point scale, where 1 = very unimportant and 7 = very important. Percentages include
combined "4" and "5" responses for use and combined "6" and "7" responses for importance.
their personal collections of information (97.5%) followed by the library (87.5%) and faculty
members (43.6%). Japanese students used their personal collections of information (71.5%) most
frequently followed by other students (58.5%) and the library (55.9%). Russian students used
their personal collections of information (58.1%) most frequently followed by the library (37.8%)
and other students (31.1%). U.K. students used their personal collections of information (75.8%)
most frequently followed by the library (73.1%) and faculty members (32.6%).
Respondents in neither of the four groups made frequent personal use of contacts within
industry and government laboratories. Russian (23.6%) and U.K. (19.5%) students made the
most frequent use of personal contacts in industry. Japanese students reported "0" use of
personal contacts in industry. Russian students (25.5%) made the most frequent use of personal
contact in government laboratories.
23

Studentswerealsoaskedto ratethe importanceof theseinformationsourcesin meetingtheir information needs. For Indian students,the ranking of information sourcesby theirimportancemirrorstheir usagepatterns.Personalcollectionsof informationreceivedthehighestimportanceratings,followed by the library andfaculty members.Although they alsousedper-sonalcollectionsof informationmorefrequentlythananyotherinformationsource,RussianandJapanesestudentsgavetheir highestimportanceratingsto the library with personalcollectionsratedassecondin importance. Japanesestudentsgavethe highestratings to faculty members,followed by thelibrary andpersonalcollectionsof information. U.K. studentsgavetheir highestimportanceratingsto the library with personalcollectionsratedassecondin importance.
Use and Importance of Selected Information Products
Students were also asked about the frequency of their use of a variety of information
products during the most recent school term and to rate the importance of these products in
satisfying their information needs (table 20). For the entire sample, textbooks are among the
most intensively used information products, particularly among undergraduate (i.e., Russia and
Japan) students. Russian and Japanese students used textbooks more frequently than any other
information product. Among Indian and British students, the majority of whom are graduate
students, journal articles were the most frequently used information products.
Table 20 also reports the importance ratings to each information product. Russian,
Japanese, and British students rated textbooks more importantly than any other information
product. After textbooks, Russian students rated handbooks and journal articles most important.
British students rated journal articles and conference/meeting papers highest. Japanese students
rated conference/meeting papers and theses/dissertations as the second and third most important
information products. Among Indian students, journal articles, textbooks, and conference/meeting
papers were rated most important.
Use of Foreign and Domestically Produced Technical Reports
Students were asked if they use technical reports produced in the U.S. and foreign
countries (table 21). U.S. NASA reports were heavily used by Indian (90%), British (73.3%),
and Japanese (64.9%) students. A higher percentage of these students used NASA technical
reports than they used the technical reports produced in their own countries. About 74% of the
of Indian students used Indian NAL reports. In terms of frequency, they next used AGARD
technical reports (55%) and British ARC and RAE technical reports (48.7%). About 534% of
the Japanese students used Japanese NAL reports. In terms of frequency, they next used Indian
NAL reports (88.3%) and AGARD technical reports (16.9%). About 47% of the Russian
students used Russian TsAGI technical reports. In terms of frequency, they next used ESA
technical reports (11.9%). About 55% of the U.K. students used British ARC and RAE technical
reports followed by AGARD technical reports (52.6%). Dutch NLR technical reports and French
ONERA technical reports were used infrequently by survey respondents.
24

Table 20. Frequencyof UseandImportanceof Information ProductsUsedto Meet InformationNeedsof Aerospace Engineering and Science Students
During the Most Recent School Term
Information Product
Abstracts 3.6
Conference/Meeting Papers 52.8Journal Articles 66.7
Handbooks 0.8
Textbooks 61.6
Computer Programs/Documentation 32.5
Bibliographic, Numeric, FactualData Bases 7.5 11.7 3.8 20.1 15.0
Theses/Dissertations 27.5 29.9 5.6 32.0 25.0
Technical Reports 35.0 15.6 9.5 47.6 38.5AudioNisual Materials --- 1.3 20.2 5.6 10.2
Foreign Language Technical Reports --- 23.4 12.2 6.4 7.5Technical Translations --- 10.4 14.3 5.6 10.0Patents ...... 1.8 2.4 10.0
Industry Technical Reports 5.2 --- 7.6 11.2 15.4
Drawings/Specifications 2.6 1.3 22.5 4.0 10.0
Preprints Or Deposited Manuscripts 7.5 1.3 2.9 3.3 37.5
Informal Information Products (e.g.,
Vendor/Supply Catalogs,
Company Literature,
Trade Journals/Magazines) 7.5 --- 17.7 22.4 15.0
Use Importance
India Japan Russia U.K. India Japan Russia U.K.n=40 n=77 n=l17 n=127 n=40 n=77 n=l17 n=127
%a o_a o_a o_a 6_a o_a o_a o_a
40.0 23.4 3.8 32.5 29.4 7.8 29.0
37.5 39.0 5.8 42.5 41.4 10.6 43.5
85.0 31.0 21.7 85.0 29.4 39.5 56.8
20.5 11.7 62.6 20.0 17.3 59.6 27.4
80.0 65.0 75.7 62.5 44.0 67.0 59.722.5 19.5 25.5 22.5 17.4 31.7 32.0
10.7 10.7 24.2
34.7 34.7 36.318.7 18.7 40.7
2.6 2.6 7.4
26.7 26.7 9.6
18.7 18.7 4.8
1.3 1.3 6.4
5.3 5.3 17.1
2.7 2.7 5.6
4.0 4.0 4.2
2.6 2.6 17.8
aFrequency of use was measured using a 5-point scale, where 1 = never and 5 = always. Importance was
measured using a 7-point scale, where 1 = very unimportant and 7 = very important. Percentages include
combined "4" and "5" responses for use and combined "6" and "7" responses for importance.
Bilingual and Foreign Language Fluency
Table 22 reports students opinions concerning tile importance of being bilingual relative
to achieving career success. About 51% of the Indiana students reported that, in terms of
achieving their career goals and aspirations, being bilingual is very important. About 57% of the
Japanese students also report that it is very important to be bilingual as did 43.6% of the U.K.
students. Almost three-quarters of the Russian students reported that, in terms of achieving their
career goals and aspirations, being bilingual is very important. About one-quarter of the Indian
and U.K. students reported that, in terms of achieving their career goals and aspirations, being
bilingual is very unimportant.
25

Table 21. Use of Foreign and Domestically Produced
Technical Reports by Aerospace Engineering and Science Students
Country/Organization
AGARD Reports
British ARC and RAE Reports
Dutch NLR Reports
ESA Reports (European Space Agency)
Indian NAL Reports
French ONERA Reports
German DFVLR, DLR, and MBB Reports
Japanese NAL Reports
Russian TsAGI Reports
U.S. NASA Reports
India
(n=40)
%
55.0
48.7
7.9
8.1
74.4
28.9
15.8
9.9
2.6
90.0
Japan
(n=77)
%
16.9
11.7
2.6
11.7
88.3
6.5
5.2
53.2
1.3
64.9
Russia
(n=117)
%
2.0
4.0
2.0
11.9
4.0
4.0
3.0
47.1
21.6
O.K.
(n-127)
%
52.6
54.6
14.9
33.3
4.5
16.5
22.2
7.1
4.4
73.3
Table 22. Importance of Being Bilingual in Achieving the Career Goals and Aspirations
of Aerospace Engineering and Science Students
Importance
Very Important
Of Average Importance
Very Unimportant
India
(n=40)
51.3
10.3
23.4
Japan
(n=77)
O_a
57.4
2.7
4.0
Russia
(n=l17)
O_a
73.1
5.8
3.8
43.6
9.5
20.6
apercentages exclude students who reported that they are not bilingual.
Survey respondents were asked to provide information about their reading and speaking
competencies in five languages (table 23). All of the Indian students read and speak English
fluently. The mean reading and speaking abilities for English were ,X = 4.9 and X = 4.7,
respectively. All of the Japanese students read and about 95% speak English fluently. The
mean reading and speaking abilities for English were X = 3.1 and X = 2.3, respectively. About
81% of the Russian students read and about 80% speak English fluently. The mean reading and
speaking abilities for English were X = 1.8 and X = 2.7, respectively. Indian students reported
limited proficiency in German. About two-thirds of the Japanese students reported reading
proficiency in German; about one-third reported speaking proficiency in German. About two-
thirds of the U.K. students reported reading and speaking proficiency in French.
26

Table 23. Language Fluency of Aerospace Engineering and Science Students
INDIA JAPAN
Reading Speaking Reading Speaking
% Mean % Mean % Mean
Language Speak Ability a Read Ability a Speak Ability a
EnglishFrench
German
JapaneseRussian
Other
% Mean
Read Ability a
100.0 4.9
9.1 1.7
21.6 1.8
0.0 0.0
9.4 5.7
0.0 4.4
100.0
9.1
19.9
0.0
5.7
0.0
4.7
1.0
1.6
0.0
1.5
5.0
100.0
27.4
63.0
97.3
12.5
96.1
3.1
1.2
1.4
4.9
1.3
1.0
94.7
17.6
32.3
97.3
9.60.0
2.3
1.2
1.4
4.8
1.10.0
aA 5-point scale was used to measure fluency with "1" being passably and "5" being fluently; hence, the
higher the average (mean), the greater the ability (fluency) of the student to read/speak the language.
Table 23. Language Fluency of Aerospace Engineering and Science Students (Concluded)
Language
EnglishFrench
German
JapaneseRussian
Other
RUSSIA U.K.
Reading Speaking Reading Speaking
% Mean
Speak Ability a
% Mean
Read Ability a
81.1 1.8
23.8 2.0
28.7 2.5
11.2 2.4
95.2 4.9
13.7 1.0
% Mean
Speak Ability a
79.5 4.8
23.5 2.5
25.5 2.9
11.1 2.8
94.3 3.3
12.8 2.9
% Mean
Read Ability a
100.0 4.8
68.3 2.5
35.3 2.9
6.1 2.8
4.5 3.3
28.4 2.9
99.2
68.2
35.3
6.1
4.5
28.4
4.7
2.2
2.7
2.3
3.8
2.0
aA 5-point scale was used to measure fluency with "1" being passably and "5" being fluently; hence, the
higher the average (mean), the greater the ability (fluency) of the student to read/speak the language.
Use of Computer and Information Technology and Electronic Networks
The use of computer technology to prepare written technical communications was inves-
tigated. Students were asked about their current and anticipated use of selected information
technologies. Specifically, students were asked about their use of electronic networks, their use
of electronic networks for specific purposes, and their use of electronic networks to exchange
messages and files.
27

Computer Ownership and Use of Computers to Prepare Written Technical Communications
Ownership of a personal computer was highest among the Japanese (77.3%) and U.K.
(64.8%) survey respondent (see table 24). About 3% of the Indian and about 11% of the Russian
students owned a personal computer. Nearly all of the Indian, Japanese, and U.K. students we
surveyed use computers when they prepare written technical communications. About 30% of the
Russian students did not use computers when they prepare written technical communications.
Table 24. Computer Ownership/Use/Reasons For Nonuse By
Aerospace Engineering and Science Students
Factor
Do you own a Personal Computer?Yes
No
Do You Use A Computer To PrepareWritten Technical Communication?
No
Yes
Sometimes
Frequently
Always
Your Reason(s) For Not Using A Computer?
No/Limited Computer Access
Lack Of Knowledge/Skill Using A Computer
Prefer Not To Use A ComputerOther
India
(n=40)
%
2.5
97.5
5.1
94.9
17.9
23.1
53.8
0.0
50.0
50.0
0.0
Japan
(n=77)
%
77.3
22.7
9.3
90.7
30.7
30.7
29.3
28.6
28.6
0.0
42.9
Russia
(n=117)
%
11.4
88.6
29.7
70.3
43.6
17.8
8.9
73.3
26.7
6.7
13.3
U.K.
(n=127)
%
64.8
35.2
1.0
99.0
5.4
24.2
69.4
0.0
0.0
0.0
0.0
Those Indian students who do not use computer technology to prepare written technical
communications gave the following reasons for "non-use": lack of knowledge/skill using a com-
puter (50%) and prefer not to use a computer (50%). Japanese students who do not use computer
technology to prepare written technical communications gave the following reasons for "non-use":
lack of knowledge/skill using a computer (28.6%) and no/limited computer access (28.6%).
About 43% of the Japanese students who do not use computer technology to prepare written tech-
nical communications gave "other" as their reason for not using a computer. Russian students
who do not use computer technology to prepare written technical communications gave the fol-
lowing reasons for "non-use": no/lack of access to computer technology (73.3%), lack of know-
28
ledge/skillusinga computer(26.7%),prefernot to usea computer(7.6%),and"other" (13.3%)astheir reasonsfor not usinga computer.
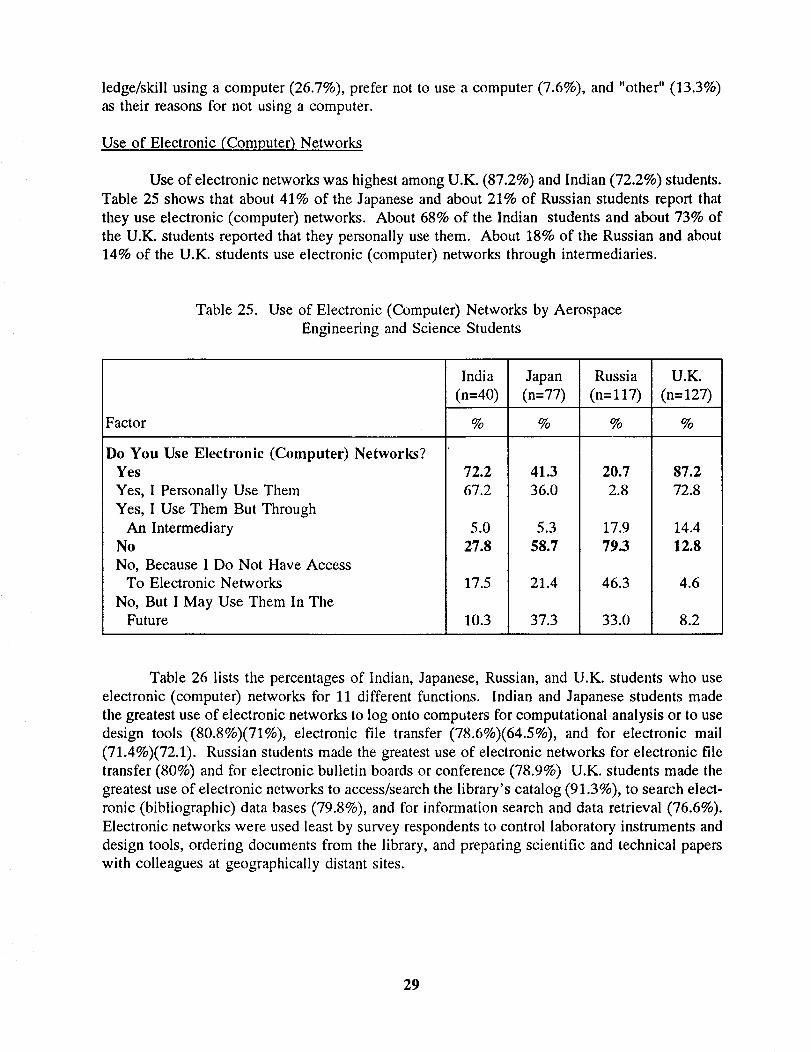
Use of Electronic (Computer) Networks
Use of electronic networks was highest among U.K. (87.2%) and Indian (72.2%) students.
Table 25 shows that about 41% of the Japanese and about 21% of Russian students report that
they use electronic (computer) networks. About 68% of the Indian students and about 73% of
the U.K. students reported that they personally use them. About 18% of the Russian and about
14% of the U.K. students use electronic (computer) networks through intermediaries.
Table 25. Use of Electronic (Computer) Networks by Aerospace
Engineering and Science Students
Factor
Do You Use Electronic (Computer) Networks?Yes
Yes, I Personally Use Them
Yes, I Use Them But Through
An IntermediaryNo
No, Because I Do Not Have Access
To Electronic Networks
No, But I May Use Them In TheFuture
India
(n=40)
%
72.2
Japan
(n=77)
%
41.3
Russia
(n=117)
%
20.7
U.K.
(n=127)
%
87.2
67.2
5.0
27.8
17.5
10.3
36.0
5.3
58.7
21.4
37.3
2.8
17.9
79.3
46.3
33.0
72.8
14.4
12.8
4.6
8.2
Table 26 lists the percentages of Indian, Japanese, Russian, and U.K. students who use
electronic (computer) networks for 11 different functions. Indian and Japanese students made
the greatest use of electronic networks to log onto computers for computational analysis or to use
design tools (80.8%)(71%), electronic file transfer (78.6%)(64.5%), and for electronic mail
(71.4%)(72.1). Russian students made the greatest use of electronic networks for electronic file
transfer (80%) and for electronic bulletin boards or conference (78.9%) U.K. students made the
greatest use of electronic networks to access/search the library's catalog (91.3%), to search elect-
ronic (bibliographic) data bases (79.8%), and for information search and data retrieval (76.6%).
Electronic networks were used least by survey respondents to control laboratory instruments and
design tools, ordering documents from the library, and preparing scientific and technical papers
with colleagues at geographically distant sites.
29

Table 26. Usesof ElectronicNetworksby AerospaceEngineeringandScienceStudents
Purpose
ConnectTo GeographicallyDistantSites
ElectronicMailElectronicBulletin BoardsOr
ConferencesElectronicFile TransferLog On To ComputersFor Computational
Analysis Or To UseDesignToolsControlEquipmentSuchAs Laboratory
InstrumentsOr MachineToolsAccess/SearchThe Library's CatalogOrderDocumentsFromThe LibrarySearchElectronic(Bibliographic)
DataBasesInformationSearchAnd Data
RetrievalPrepareScientific And Technical
PapersWith ColleaguesAt GeographicallyDistantSites
India(n=40)
%
32.171.4
16.778.6
80.8
22.246.414.3
Japan(n=77)
%
45.267.7
31.664.5
71.0
3.245.29.7
Russia(n=117)
%
15.821.1
78.980.0
35.0
47.426.326.3
O.K.
(n=127)
%
52.9
72.1
23.7
54.0
71.8
11.9
91.3
69.9
50.0
42.9
25.0
25.8
45.2
3.2
26.3
50.0
2.6
79.8
76.6
8.9
Students who use electronic (computer) networks to exchange messages or files do so with
others at a wide array of locations (table 27). Seventy five percent of the Indian students use
electronic networks to exchange files with members of their academic classes (see table 27).
About 61% of the Japanese students use electronic networks to exchange messages with others
in their academic community at the same geographic site who are not in their academic classes.
About 37% of the Russian and about 58% of the U.K. students use electronic (computer)
networks to exchange messages with members of their academic classes.
Use of Selected Information Technologies
Students were asked about their use and nonuse of a wide range of information
technologies (table 28). Specifically, they were asked to indicate if they "already use it," "don't
use it but may in the future," and "don't use it and doubt if I will." U.K. students reported the
greatest use of computer-based information technologies such as electronic publishing, electronic
mail, desk top publishing, and electronic bulletin boards and data bases. The Russian students
reported the least use of computer-based information technologies.
30
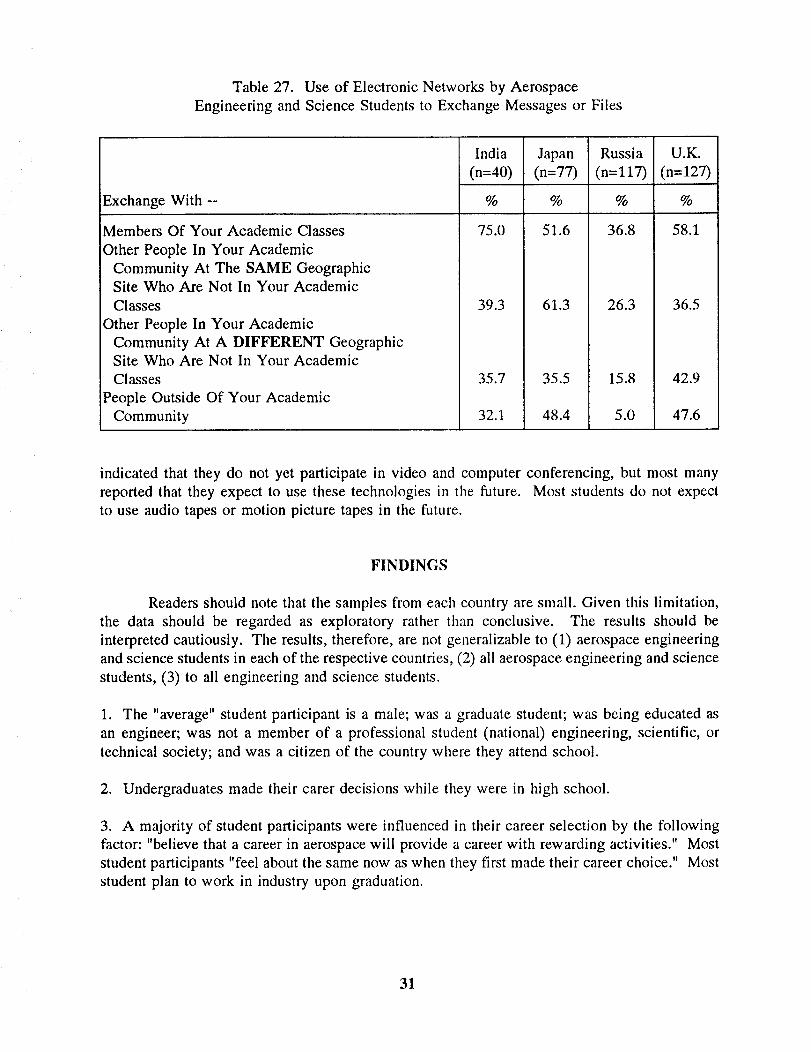
Table 27. Useof Electronic Networks by Aerospace
Engineering and Science Students to Exchange Messages or Files
Exchange With --
Members Of Your Academic Classes
Other People In Your Academic
Community At The SAME GeographicSite Who Are Not In Your Academic
Classes
Other People In Your Academic
Community At A DIFFERENT GeographicSite Who Are Not In Your Academic
Classes
People Outside Of Your Academic
Community
India
(n=40)
%
75.0
39.3
35.7
32.1
Japan
(n=77)
%
51.6
61.3
35.5
48.4
Russia
(n=l17)
%
36.8
26.3
15.8
5.0
U.K.
(n=127)
%
58.1
36.5
42.9
47.6
indicated that they do not yet participate in video and computer conferencing, but most many
reported that they expect to use these technologies in the future. Most students do not expect
to use audio tapes or motion picture tapes in the future.
FINDINGS
Readers should note that the samples from each country are small. Given this limitation,
the data should be regarded as exploratory rather than conclusive. The results should be
interpreted cautiously. The results, therefore, are not generalizable to (1) aerospace engineering
and science students in each of the respective countries, (2) all aerospace engineering and science
students, (3) to all engineering and science students.
1. The "average" student participant is a male; was a graduate student; was being educated as
an engineer; was not a member of a professional student (national) engineering, scientific, or
technical society; and was a citizen of the country where they attend school.
2. Undergraduates made their carer decisions while they were in high school.
3. A majority of student participants were influenced in their career selection by the following
factor: "believe that a career in aerospace will provide a career with rewarding activities." Most
student participants "feel about the same now as when they first made their career choice." Most
student plan to work in industry upon graduation.
31

Table 28. Use, Nonuse, and Potential Use of Information Technologies
by Aerospace Engineering and Science Students
AlreadyUse It
Don't Use It,
But May InFuture
Don't Use It,
And Doubt
If Will
Information Technologies % % %
INDIA
Audio Tapes And CassettesMotion Picture Film
Videotape
Desktop/Electronic Publishing
Computer Cassettes/Cartridge
TapesElectronic Mail
Electronic Bulletin Boards
FAX Or TELEX
Electronic Data Bases
Video Conferencing
Computer Conferencing
Micrographics And Microforms
15.8
23.7
41.0
32.4
46.2
48.7
7.7
17.9
33.3
2.6
0.0
30.8
50.0
39.5
38.5
56.8
51.3
46.2
64.1
64.1
56.4
71.1
73.7
51.3
34.2
36.8
20.5
10.8
2.6
5.1
28.2
17.9
10.3
26.3
26.3
17.9
Audio Tapes And CassettesMotion Picture Film
Videotape
Desktop/Electronic Publishing
Computer Cassettes/Cartridge
TapesElectronic Mail
Electronic Bulletin Boards
FAX Or TELEX
Electronic Data Bases
Video Conferencing
Computer Conferencing
Micrographics And Microforms
9.5
2.7
21.3
13.9
31.5
26.7
20.0
21.3
6.8
0.0
0.0
5.3
JAPAN
25.7
20.2
72.0
62.5
35.6
64.0
62.7
73.3
86.2
66.2
70.3
60.0
64.9
77.3
6.7
23.6
32.9
9.3
17.3
5.3
6.8
33.8
29.7
34.7
32

Table28. Use,Nonuse,andPotentialUseof InformationTechnologiesby AerospaceEngineeringandScienceStudents(Concluded)
AlreadyUse It
Don't UseIt,But May In
Future
Don't Use It,And Doubt
If Will
InformationTechnologies % % %
RUSSIA
Audio TapesAnd CassettesMotion PictureFilmVideotapeDesktop/ElectronicPublishingComputerCassettes/Cartridge
TapesElectronicMailElectronicBulletin BoardsFAX OrTELEXElectronicDataBasesVideo ConferencingComputerConferencingMicrographicsAnd Microforms
25.219.620.417.1
45.24.84.8
10.617.62.91.0
13.5
27.236.358.362.9
46.272.166.368.365.756.763.549.0
47.644.121.420.O
8.723.128.821.216.740.435.637.5
U.K°
Audio Tapes And CassettesMotion Picture Film
Videotape
Desktop/Electronic Publishing
Computer Cassettes/Cartridge
TapesElectronic Mail
Electronic Bulletin Boards
FAX Or TELEX
Electronic Data Bases
Video Conferencing
Computer Conferencing
Micrographics And Microforms
16.3
10.6
31.5
64.8
45.1
51.6
18.2
69.1
51.6
4.1
4.1
26.5
29.3
39.0
48.4
31.2
37.2
42.6
66.1
29.3
43.4
68.3
72.1
42.2
54.5
50.4
20.2
4.1
21.1
5.7
15.7
1.6
4.9
27.6
23.8
31.4
4. In defining career success, most student respondents report that it is important to have the
opportunity to explore new ideas about technology and to have the opportunity to work on
complex technical problems.
33

5. Most student participants report that mastering information skills is important to career
success. A majority of students had not received communication skills instruction. However,
most student who received the instruction reported that the instruction was helpful.
6. On average 52% of the students' written technical communication involved collaborative
writing and 54% of their written technical communication is required to be collaborative. Most
students reported that group writing is as productive or more productive than writing alone.
7. Less than half of the student members received training directed solely at library skills.
8. Indian and U.K. students made greater use of a library (i.e., made more visits) than did
Japanese and Russian students. The mean effectiveness of the information the stud&ats received
from the library ranged from a low of X = 5.2 to a high of X = 5.6. Students reported "I had
no information needs" and "my information needs were more easily met some other way" as the
reasons most frequently given for not using a library.
9. Those students who used electronic (bibliographic) data bases did all or most of their ownsearches.
10 All students consulted their own personal stores of technical information as the first step in
obtaining information used in problem solving.
11. Personal collections of technical information and a library were the most frequently used and
were considered to be the most important information sources by most student respondents.
Textbooks and journal articles were the most frequently used and were considered to be the most
important information products by most student respondents.
12. With the exception of the Russian students, survey respondents made considerable use of
NASA technical reports.
13. Most students reported that being bilingual is important in terms of achieving their career
goals and aspirations.
14. Although the ability to do so varied for the four student samples, most student reported that
they could read and speak English.
15. More Japanese and U.K. students owned a personal computer than did the Indian and
Russian students. Most students used a computer to prepare written technical communications.
No/limited computer access and lack of knowledge/skill using a computer were the reasons
reported most often for not using a computer.
16. More Indian and U.K. students used electronic (computer) networks than did Japanese andRussian students. Most students used electronic networks for electronic mail and electronic file
transfer.
34

CONCLUDING REMARKS
We interpret the survey data to indicate that there are two major differences between
students respondents. The first difference is rooted in the types of organizations that they plan
to join upon graduation. The second is the structure of the academic experience which defines
students' information needs and the strategies employed for meeting them. Undergraduate
students expect to work in industry, at both the national and multi-national levels. The high
importance that undergraduate students placed on goals which define career success through
advancement within the organization are consistent with these expectations. Graduate students
are more likely than undergraduates to aspire to work in academia. The high importance ratings
that graduate students assigned to developing a professional reputation through written and oral
communication of their ideas is consistent with this goal.
There were also clear differences in the information seeking habits of undergraduate and
graduate students. Although undergraduates are at least as well trained in information seeking
skills as graduate students are, undergraduate students apply these skills less often. Industry
recommendations for improvement of engineering education curricula consistently point to the
need for better training in skills related to locating, using, and communicating STI. Nevertheless,
it appears that undergraduate students -- those students who aspire to work in industry -- may
lack the opportunity to hone these skills by applying them routinely during the course of their
education. Because undergraduate students can satisfy their information needs through informal
channels/sources and by mainly using textbooks and other classroom materials, they will probably
attempt to apply this behavior, upon graduation, to "the world of work". When they begin their
careers, these students will be expected to locate, using, and communicate information in a
completely different environment. Reliance on classroom-type materials, such as textbooks, and
strategies, such as discussions with faculty members, may simply be inadequate and possibly
even unacceptable for this new environment.
ACKNOWLEDGEMENTS
The authors acknowledge the Council on Library Resources (CLR) and its president,
Dr. W. David Penniman, for providing the funds used to analyze these data. The authors also
acknowledge the help and assistance of Dr. Robert A. Kilgore in making the student surveys
possible. Finally, we thank Professor M.A. Rama Swamy at the Indian Institute of Science,
Professor Hirotoshi Kubota at the University of Toyko, Dr. Sergey M. Novikov formerly at the
Central Aero-Hydrodynamics Institute, Professor J.L. Stollery and Mr. John Blagden at Cranfield
University, and Professor Michael Goodyer at the University of Southampton for helping to make
the Phase 4 students surveys possible.
35

REFERENCES
Black, K.M. (1994). "An Industry View of Engineering Education." Journal of Engineering
Education, 83:1, 26-28.
Devon, R. (1985). "Industry's Advice for the First Two Years." Engineering Education, 76:2,112-114.
Evans, D.L., G.C. Beakley, P.E. Crouch, and G.T. Yamaguchi. (1993). "Attributes of
Engineering Graduates and Their Impact on Curriculum Design." Journal of Engineering
Education, 82:4, 203-211.
Garry, F.W. (1986). "A Business Look at Engineering Education." Engineering Education, 76:4,203-205.
Katz, S. (1993). "The Entry-Level Engineer: Problems in Transition from Student to
Professional." Journal of Engineering Education, 82:3, 171-174.
Mailloux, E.N. (1989). "Engineering Information Systems." In The Annual Review of
Information Science and Technology. Vol. 25. M.E. Williams, ed. Elsevier Science
Publishers, Amsterdam, 239-266.
Morrow, R.M. (1994). "Issues Facing Engineering Education." Journal of Engineering
Education, 83:1, 15-18.
Pinelli, T.E., J.M. Kennedy, and R.O. Barclay. (1991). "The NASA/DoD Aerospace Knowledge
Research Project." Government Information Quarterly, 8:2, 219-233.
Strother, J.B. (1992). "Reality vs Expectations: Practicing Engineers vs Engineering Students."
Paper presented at International Professional Communication Conference. Santa Fe, NM.
Sylvester, N.D. (1980). "Engineering Education Must Improve the Communication Skills of its
Graduates." Engineering Education, 70, 739-740.
36

APPENDIX A: PROJECT FACT SHEET
NASA/DoD AEROSPACE KNOWLEDGE
DIFFUSION RESEARCH PROJECT
Fact Sheet
The process of producing, transferring, and using scientific and technical information
(STI), which is an essential part of aerospace research and development (R&D), can be
defined as Aerospace Knowledge Diffusion. Studies tell us that timely access to STI can
increase productivity and innovation and help aerospace engineers and scientists maintain and
improve their professional skills. These same studies indicate, however, that we know little
about aerospace knowledge diffusion or about how aerospace engineers and scientists find and
use STI. To learn more about this process, we have organized a research project to study
knowledge diffusion. Sponsored by NASA and the Department of Defense (DoD), the
NASA/DoD Aerospace Knowledge Diffusion Research Project is being conducted by research-
ers at the NASA Langley Research Center, the Indiana University Center for Survey
Research, and Rensselaer Polytechnic Institute. This research is endorsed by several aero-
space professional societies including the AIAA, RAeS, and DGLR and has been sanctioned
by the AGARD and AIAA Technical Information Panels.
This 4-phase project is providing descriptive and analytical data about the flow of STI at
the individual, organizational, national, and international levels. It is examining both the
channels used to communicate STI and the social system of the aerospace knowledge
diffusion process. Phase 1 investigates the information-seeking habits and practices of U.S.
aerospace engineers and scientists, in particular their use of government-funded aerospaceSTI. Phase 2 examines the industry-government interface and emphasizes the role of the
information intermediary in the knowledge diffusion process. Phase 3 concerns the academic-
government interface and emphasizes the information intermediary-faculty-student interface.
Phase 4 explores the information-seeking behaviors of non-U.S, aerospace engineers and
scientists from Western European nations, India, Israel, Japan, and the former Soviet Union.
The results of this research project will help us to understand the flow of STI at the
individual, organizational, national, and international levels. The findings can be used to
identify and correct deficiencies; to improve access and use; to plan new aerospace STI
systems; and should provide useful information to R&D managers, information managers, and
others concerned with improving access to and utilization of ST1. These results will
contribute to increasing productivity and to improving and maintaining the professional
competence of aerospace engineers and scientists. The results of our research are being
shared freely with those who participate in the study.
Dr. Thomas E. Pinelli
Mail Stop 180A
NASA Langley Research Center
Hampton, VA 23681-0001
(804) 864-2491
Fax (804) 864-8311
T.E.Pi nelli@la rc.nasa.gov
Dr. John M. Kennedy
Center for Survey Research
Indiana University
Bloomington, IN 47405
(812) 855-2573
Fax (812) 855-2818
[email protected] ndiana.edu
Rebecca O. Barclay
Dept. of Language, Lit. & Communication
Rensselaer Polytechnic Institute
Troy, NY 12180
(804) 399-5666
Fax (804) 307-4635
37

APPENDIX B: SURVEY INSTRUMENT
Technical Communications in Aerosnace
These questions ask about your career goals and aspirations.
1. To Inane a successful career, how important will it be for you to: (Circle number)
Very Very
Unimportant Important
1 Have the opportunity to explore
new ideas about technology or
systems ............. 1 2 3 4 5 6 7
2 Advance to a high-level staff
technical position ......... 1 2 3 4 5 6 7
3 Have the opportunity to work on
complex technical problems ..... 1 2 3 4 5 6 7
4 Work on projects that utilize the
latest theoretical results in your
specialty ............. 1 2 3 4 5 6 7
5 Work on projects that require
learning new technical
knowledge ............ 1 2 3 4 5 6 7
6 Establish a reputation outside
your organization as an authority in
your field ............. 1 2 3 4 5 6 7
7 Receive patents for your ideas .... 1 2 3 4 5 6 7
8 Publish articles in technical
journals ............. 1 2 3 4 5 6 7
9 Communicate your ideas to others
in your profession through papers
delivered at professional society
meetings ............. 1 2 3 4 5 6 7
10 Be evaluated on the basis of your
technical contributions ....... 1 2 3 4 5 6 7
11 Become a manager or director
in your line of work ........ 1 2 3 4 5 6 7
12 Plan and coordinate the work
of others ............. 1. 2 3 4 5 6 7
13 Advance to a policy-making
position in management ...... 1 2 3 4 5 6 7
14 Plan projects and make decisions
affecting the organization ...... 1 2 3 4 5 6 7
15 Be the technical leader of a group
of less experienced professionals . 1 2 3 4 5 6 7
Don't
Know
38

These questions ask about your decision to choose a career in engineering orscience.
2. How important were each of the following in making your career choice? (Circle number)
Very
Unimportant1 Your parents encouraged your area of
study/major .............. 1 2
2 Other family members encouraged
your area of study/major ......... 1 2
3 Teachers encouraged your area of
study/major .............. 1 2
4 You feel that a career in your major/area
of study will lead to financial security 1 2
5 You feel that a career in your major/area
of study will provide a career with
many rewarding activities ........ 1 2
6 Information on the career opportunities
available in your major/area of study . . . 1 2
Very Not
Important Applicable
3 4 5 6 7 9
3 4 5 6 7 9
3 4 5 6 7 9
3 4 5 6 7 9
3 4 5 6 7 9
3 4 5 6 7 9
7 Other important factors (Please specify)
3, When did you first decide on your area of study/major? (Circle number)
1 While still in elementary school
2 While in high school (or equivalent)
3 When you started college (or equivalent)
4 After starting college (or equivalent)
5 Other (Please specify)
4o How well do your current feelings about the career opportunities in your major/area
of study match with those you had when you first decided on your career path?
Would you say: (Circle ONLY one)
1 I am more happy about my career choice now than when I first made it
2 I feel about the same now as when I first made it
3 I am less happy about my career choice now than when I first made it
39

These questions ask about the importance of certain skills for your professionalSuccess.
5. How important do you think it will it be for you to: (Circle number)
Very Very Don't
Unimportant Important Know1 Effectivelycomrnunicatctechnical
information in writing .......... 1 2 3 4 5 6 7 8
2 Effectively communicate technical
information orally ............ 1 2 3 4 5 6 7 8
3 Havc a knowledge and understanding
of engineering/science information
resources and materials ......... 1 2 3 4 5 6 7 8
4 Be able to search electronic
(bibliographic) data bases ........ 1 2 3 4 5 6 7 8
5 Know how to use a library that contains
engineering/science information resources
and materials .............. 1 2 3 4 5 6 7 8
6 Effectively use computer, communication,
and information technology ........ 1 2 3 4 5 6 7 8
The next group of questions asks about course work or instruction you might have
received as part of your education or academic preparation.
6. Have you received training or course work in: (Circle number)
Yes No
1 Technical writing/communication .......... 1
2 Speech/oral communication ............. 1
3 Using a library that contains engineering/science
information resources and materials ......... 1
4 Using engineering/science information
resources and materials ............... 1
5 Searching electronic (bibliographic) data bases ..... 1
6 Using computer, communication, and information
technology .................... 1
No Instruction
Available
2 8
2 8
2 8
2 8
2 8
2 8
40

7. If you received training or instruction in any of the following, was it helpful?(Circle number)
Did Not
Not Very Don't Receive
Helpful Helpful Know Training
1 Technical writing/communication . . 1 2 3 4 5 6 7 8 10
2 Speech/oral communication ..... 1 2 3 4 5 6 7 8 10
3 Using a library that contains
engineering/science information
resources and materials ...... 1 2 3 4 5 6 7 8 10
4 Using engineering/science information
resources and materials ...... 1 2 3 4 5 6 7 8 10
5 Searching electronic (bibliographic)
data bases ............ 1 2 3 4 5 6 7 8 10
6 Using computer, communication, and
information technology ....... 1 2 3 4 5 6 7 8 10
These next questions ask about your preparation of written technical communica-tion as part of your education or academic preparation.
8. What percentage of your written technical communication involves collaborative writing
(i.e., writing as a member of a group)?
% (If 100_ of your writing is done alone, go to Question 11.)
9. If you do write as a member of a group, what percentage of your written technicalcommunication is required to be collaborative?
%
10. In general, do you find writing as part of a group more or less productive (i.e. quantity/
quality) than writing alone? (Circle number)
1 Less productive than writing alone
2 About as productive as writing alone
3 More productive than writing alone
11. Do you use a computer to prepare written technical communication?
(Circle number)
1 Never
2 Sometimes }3 Frequently Go to Question 13.
4 Always
41

12. If NEVER, which one of the following best explains your reasons for non-use?
(Circle numbers)
1 No or limited computer access
2 Lack of knowledge/skill using a computer
3 Prefer not to use a computer
4 Other (Please specify)
13. To what extent does lack of knowledge/skill about each of the following communication
principles impede your ability to produce (i.e., quality/quantity) written technical
communication? (Circle all that apply.)
Does not Greatly
Impede Impedes
1 Defining the purpose of the
communication ......... 1 2 3 4 5 6 7
2 Assessing the needs of thereader ............ 1 2 3 4 5 6 7
3 Preparing/presenting information
in an organized manner .... 1 2 3 4 5 6 7
4 Developing paragraphs
(introductions, transitions,
and conclusions) ........ 1 2 3 4 5 6 7
5 Writing grammatically
correct sentences ....... 1 2 3 4 5 6 7
6 Notetaking and quoting ..... 1 2 3 4 5 6 7
7 Editing and revising ...... 1 2 3 4 5 6 7
8 Other (Please specify)
Don't
Know
8
8
8
These questions ask about your use of electronic/information technologies.
14. Describe your use of the following electronic/information technologies for communicating
technical information. (Circle number)
Information Technologies
1 Audio tapes and cassettes ..... 1
2 Motion picture film ........ 1
3 Video tape ............ 1
4 Desktop/electronic publishing . . 1
5 Computer cassette/cartridge tapes . . 1
6 Electronic mail .......... 1
7 Electronic bulletin boards ...... 1
8 FAX or TELEX .......... 1
9 Electronic data bases ........ 1
10 Video conferencing ......... 1
11 Computer conferencing ....... 1
12 Micrographics & microforms .... 1
I already
use it
I don't use I don't use
it, but may it and doubtin the future if I will
2 3
2 3
2 3
2 3
2 3
2 3
2 3
2 3
2 3
2 3
2 3
2 3
42

15. Do you ever use electronic (computer) networks? (Circle number)
1 Yes, I personally use them
2 Yes, I use them but through an intermediary
3 No }4 No because I do not have access to electronic networks Go to Question 18.
5 No but may use them in the future
If you answered "no" to Question 15, please go to Question 18. If you answered "yes" to
Question 15, please continue to Question 16.
16. Do you use electronic networks for the following purposes? (Circle number)
1 To connect to geographically distant sites .........
2 For electronic mail ...................
3 For electronic bulletin boards or conferences ........
4 For electronic file transfer ................
5 To log into computers for such things as
computational analysis or to use design tools ........
6 To control equipment such as laboratoryinstruments or machine tools ...............
7 To access/search the library's catalogue ..........
8 To order documents from the library ...........
9 To search electronic (bibliographic) data bases .......
10 For information search and data retrieval .........
11 To prepare scientific and technical papers with
colleagues at geographically distant sites ..........
Yes No
1 2
1 2
1 2
1 2
1 2
1 2
1 2
1 2
1 2
1 2
1 2
17. Do you exchange electronic messages or files with: (Circle number)
Yes No
1 Members of your academic classes ............. 1 2
2 Other people in your academic community at
the SAME geographic site who are not in youracademic classes .................... 1 2
3 Other people in your academic community at a
DIFFERENT geographic site who are not in youracademic classes .................... 1 2
4 People outside of your academic community ........ 1 2
These questions ask about your use of libraries and library services as part of your
education.
18. During this current school term, about how many times have you used a library to meet
your engineering/science information needs?
number of times
If you answered "0" times to Question 18, please go to Question 20. If you answered "1 or
more" times to Question 18, please continue to Question 19.
43

19. During the current school term, how effective was the information obtained from the
library for meeting your engineering/science information needs? (Circle number)
Very Very Don't
Ineffective Effective Know
1 2 3 4 5 6 7 8
I Go toQuestion 21.
20. Which of the following statements best describes your reasons for not using a library during
this current school term? (Circle ALL that apply) Yes No
1 I had no information needs .................. 1 2
2 My information needs were more easily met
some other way ........................ 1 2
3 Tried the library once or twice before but
I couldn't find the information I needed ............ 1 2
4 The library is physically too far away ............. 1 2
5 The library staff is not cooperative or helpful .......... 1 2
6 The library staff does not understand my information needs 1 2
7 The library did not have the information I need ......... 1 2
8 I have my own personal library and do not need
another library ....................... 1 2
9 The library is too slow in getting the informationI need ........................... 1 2
10 We have to pay to use the library ............... 1 2
11 We are discouraged from using the library ........... 1 2
21. As part of your academic preparation, have you received or participated in the following
library activities? (Circle ALL that apply) Not Don't
Yes No Available Know
1 2 6 81 Library tour ..................
2 Library presentation as part of academic orientation 1 2
3 Library orientation as part of an engineering/
science course ................. 1 2
4 Library skill/use course (bibliographic instruction) 1 2
5 Library skill/use course in engineering/science
information resources and materials ....... 1 2
6 Library instruction for end-user searching of
electronic (bibliographic) data bases ....... 1 2
6 8
6 8
6 8
6 8
6 8
22. Which ONE of the following BEST characterizes your use of electronic (bibliographic)
data bases? (Circle ONLY ONE number)
1 I do all searches myself
2 I do most searches myself
3 I do half by myself and half through a librarian
4 I do most searches through a librarian
5 I do all searches through a librarian
6 I do not use electronic data bases
7 I do not have access to electronic data bases
44

These questions ask about the use and importance of information to engineering/science students.
23. How OFTEN during this current school term have you used the following information
sources to meet your engineering/science information needs? (Circle numbers)
Never Seldom Sometimes Frequently Always
1 Your personal collection of
information ........ 1 2 3 4 5
2 Other students ....... 1 2 3 4 5
3 Faculty members ...... 1 2 3 4 5
4 Library .......... 1 2 3 4 5
5 Librarian ......... 1 2 3 4 5
6 Your personal contacts within
industry ......... 1 2 3 4 5
7 Your personal contacts at
government laboratories . . . 1 2 3 4 5
NotAvailable
24. How OFTEN during this current school term have you used the following information
products to meet your engineering/science information needs?
(Circle numbers)
Never
1 Abstracts ......... 1
2 Conference/meeting
papers .......... 1
3 Journal articles ...... 1
4 Handbooks ........ 1
5 Textbooks ........ 1
6 Computer programs anddocumentation ...... 1
7 Bibliographic, numeric,
factual data bases ..... 1
8 Theses/dissertations .... 1
9 Technical reports ..... 1
10 Audio/visual materials . . 1
11 Foreign language technical
reports .......... 1
12 Technical translations 1
13 Patents .......... 1
14 Industry technical reports 1
15 Drawings/specifications 1
16 Preprints or deposited
manuscripts ........ 1
17 Informal information products
e.g., vendor/supply catalogs,company literature, trade
journals/magazines) .... 1
Not
Seldom Sometimes Frequently Always Available
2 3 4 5 6
2 3 4 5 6
2 3 4 5 6
2 3 4 5 6
2 3 4 5 6
2 3 4 5 6
2 3 4 5 6
2 3 4 5 6
2 3 4 5 6
2 3 4 5 6
2 3 4 5 6
2 3 4 5 6
2 3 4 5 6
2 3 4 5 6
2 3 4 5 6
2 3 4 5 6
2 3 4 5 6
45

25. How IMPORTANT are the following information sources in meeting your engineering/science information needs? (Circle numbers)
Very Very
Unimportant Important1 Your personal collection of
information .......... 1 2 3 4 5 6 7
2 Other students ........ 1 2 3 4 5 6 7
3 Faculty members ....... 1 2 3 4 5 6 7
4 Library ............ 1 2 3 4 5 6 7
5 Librarian ........... 1 2 3 4 5 6 76 Your personal contacts within
industry ........... 1 2 3 4 5 6 77 Your personal contacts at
government laboratories .... 1 2 3 4 5 6 7
Not
Available
26. How IMPORTANT are the following information products in meeting your engineering/science information needs? (Circle numbers)
Very
Unimportant
Very
Important
1 Abstracts .......... 1 2 3 4 5 6 7
2 Conference/meeting papers 1 2 3 4 5 6 7
3 Journal articles ........ 1 2 3 4 5 6 7
4 Handbooks ......... 1 2 3 4 5 6 7
5 Textbooks .......... 1 2 3 4 5 6 76 Computer programs and
documentation ........ 1 2 3 4 5 6 77 Bibliographic, numeric,
factual data bases ...... 1 2 3 4 5 6 7
8 Theses/dissertations ..... 1 2 3 4 5 6 7
9 Technical reports ....... 1 2 3 4 5 6 7
10 Audio/visual materials .... 1 2 3 4 5 6 711 Foreign language technical
reports ........... 1 2 3 4 5 6 7
12 Technical translations ..... 1 2 3 4 5 6 7
13 Patents ........... 1 2 3 4 5 6 7
14 Industry technical reports 1 2 3 4 5 6 7
15 Drawings/specifications .... 1 2 3 4 5 6 716 Preprints or deposited
manuscripts ......... 1 2 3 4 5 6 717 Informal information products
(e.g., vendor/supply catalogs,company literature, tradejournals/magazines) ...... 1 2 3 4 5 6 7
Not
Available
8
8
8
8
8
8
8
8
8
8
8
8
8
8
8
46

27. Do you use the following technical reports in meeting your engineering/science
information needs? (Circle numbers)Don't
1 AGARD reports .................
2 British ARC and RAE reports ...........
3 Dutch NLR reports ................
4 ESA reports ...................
5 Indian NAL reports ...............
6 French ONERA reports ..............
7 German DFVLR, DLR, and MBB reports ......
8 Japanese NAL reports ..............
9 Russian TsAGI reports ..............
10 U.S. NASA reports ................
Have
Yes No Access
1 2 6
1 2 6
1 2 6
1 2 6
1 2 6
1 2 6
1 2 6
1 2 6
1 2 6
1 2 6
28. Think of the most technically challenging assignment you have worked on this current
school term. What steps did you follow to obtain the information you needed to complete
this assignment? Please sequence these items (e.g., _1, _2, _3, _4, _5) and mark an X__beside the step(s) you DID NOT USE.
Sequence
Used my personal store of technical information
__ Spoke with other students
Spoke with faculty members
__. Used literature resources (e.g., conference papers, journal articles, technical reports)
Spoke with a librarian
Used literature resources found in a library
Used none of the above steps
__ Searched (or had someone search for me) an electronic (bibliographic) database in the library.
These questions will be used to determine whether students with different back-grounds and from different countries have different technical communicationpractices.
29. What is your gender? (Circle number)
1 Female
2 Male
30. What is your educational status? (Circle number)
1 Freshman
2 Sophomore
3 Junior
4 Senior
5 Graduate
6 Other (Please specify)
47

31. Is your education primarily as:
1 An engineer
2 A scientist
3 Something else
(Please specify)
32. What is your native language?
Please specify
33. What is your native country?
Please specify
34. Are you a citizen of the country where you are attending school? (Circle number)
1 Yes
2 No
35. How well do you read the following languages? (Circle numbers)
Passably Fluently
1 English ............ 1 2 3 4 5
2 French ............ 1 2 3 4 5
3 German ............ 1 2 3 4 5
4 Japanese ........... 1 2 3 4 5
5 Russian ............ 1 2 3 4 5
6 Other (please specify)
Do not
Read This
Language
6
6
6
6
6
36. How well do you speak the following languages? (Circle numbers)
Passably Fluently
1 English ............ 1 2 3 4 5
2 French ............ 1 2 3 4 5
3 German ............ 1 2 3 4 5
4 Japanese ........... 1 2 3 4 5
5 Russian ............ 1 2 3 4 5
6 Other (please specify)
Do not
Speak This
Language
6
6
6
6
6
48
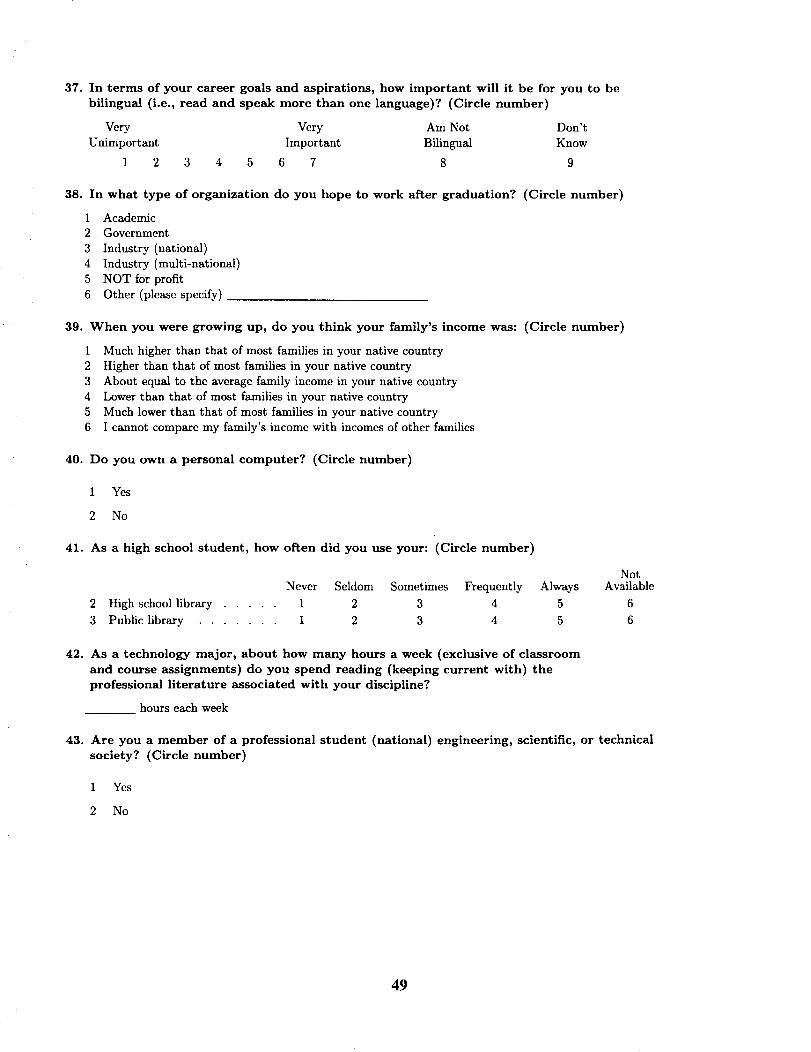
37. In terms of your career goals and aspirations, how important will it be for you to be
bilingual (i.e., read and speak more than one language)? (Circle number)
Very Very Am Not Don't
Unimportant Important Bilingual Know
1 2 3 4 5 6 7 8 9
38. In what type of organization do you hope to work after graduation? (Circle number)
1 Academic
2 Government
3 Industry (national)
4 Industry (multi-national)
5 NOT for profit
6 Other (please specify)
39. When you were growing up, do you think your family's income was: (Circle number)
1 Much higher than that of most families in your native country
2 Higher than that of most families in your native country
3 About equal to the average family income in your native country
4 Lower than that of most families in your native country
5 Much lower than that of most families in your native country
6 I cannot compare my family's income with incomes of other families
40. Do you own a personal computer? (Circle number)
1 Yes
2 No
41. As a high school student, how often did you use your: (Circle number)
Not
Never Seldom Sometimes Frequently Always Available
2 High school library ..... 1 2 3 4 5 6
3 Public library ....... 1 2 3 4 5 6
42. As a technology major, about how many hours a week (exclusive of classroom
and course assignments) do you spend reading (keeping current with) the
professional literature associated with your discipline?
hours each week
43. Are you a member of a professional student (national) engineering, scientific, or technical
society? (Circle number)
1 Yes
2 No
49

APPENDIX C: CODEBOOKS
INDIA
These questions ask about your career goals and aspirations.
1. To have a successful career, how important will it be for you to:
Have th e opportunity to explore
new ideas about technology or
systems
Very
Unimportant1 2
% %
3
%
Advance to a high-level staff
technical position
4
%
Have the opportunity to work on
complex technical problems
5
%
Work on projects that utilize the
latest theoretical results in
your specialty
6
%
Work on projects that require
learning new technical
knowledge
Very
Important7
%
Establish a reputation outside
your organization as an authority
in your field
0.0 0.0 5.1 0.0 12.8 17.9 64.1
Receive patents for your ideas
Publish articles in technical
journals
Communicate your ideas to others
in your profession through papers
delivered at professional society
meetings
5,0 2.5 7.5 10.0 30.0 25.0 20.0
Be evaluated on the basis of your
technical contributions
0.0 0.0 2.7 13.5 10.8 18.9 54.1
Become a manager or director
in your line of work
0.0 0.0 2.5 12.5 25,0 37.5 22.5
Plan and coordinate the work
of others
0.0 0.0 7.5 2.5 22.5 27.5 40.0
Advance to a policy-making
position in management
2.5 2.5 5.0 17.5 7.5 22.5 42,5
10.3 5.1 15.4 20.5 12.8 17.9 17.9
0.0 2.5 2.5 12.5 7.5 37.5 37.5
Plan projects and make decisions
affecting the organization
2.5 2.5 7.5 15.0 15.0 22.5 35.0
Be the technical leader of a group
of less experienced professionals
2.5 2.5 2.5 15.0 10.0 35.0 32.5
15.0 7.5 10.0 15.0 30,0 7.5 15.0
7.5 10.0 7.5 15.0 25.0 20.0 15.0
12.8 5.1 15.4 17.9 17.9 10.3 20.5
7.9 0.0 15.8 15.8 23.7 15.8 21.1
13.2 10.5 18.4 18.4 18.4 13.2 7.9
5O

India
These questions ask about your decision to choose a career in engineering or science.
2. How important were each of the following in making your career choice?
Your parents encouraged your
area of study/major
Very
Unimportant1 2 3 4
% % % %
5
%
Other family members encouraged
your area of study/major
6
%
Teachers encouraged your area
of study/major
Very
Important7
%
You feel that a career in your
major/area of study will lead to
financial security
5.0 17.5 20.0 12.5 0.0 15.0 22.5
YOU feel that a career in your
major/area of study will provide
a career with many rewarding
activities
15.0 22.5 7.5 15.0 12.5 5.0 7.5
Information on the career
opportunities available in your
major/area of study
12.5 10.0 10.0 10.0 7.5 15.0 25.0
10.0 5.0 10.0 15.0 15.0 17.5 12.5
0.0 2.5 5.0 12.5 10.0 25.0 35.0
10.0 2.5 2.5 22.5 12.5 20.0 30.0
NA
9
%
7.5
15.0
10.0
15.0
10.0
0.0
3. When did you first decide on your area of study/major?
While still in elementary school
While in high school (or equivalent)
When you started college (or equivalent)
After starting college (or equivalent)Other
2.5%
17.5%
30.0%
35.0%
15.0%
4. How well do your current feelings about the career opportunities in your major/area of study match with those you had when you
first decided on your career path?
I am more happy about my career choice now than when I first made itI feel about the same now as when I first made it
I am less happy about my career choice now than when I first made it
45.0%
42.5%
12.5%
51

India
These questions ask about the importance of certain skills for your professional success.
5. How important do you think it will be for you to:
Effectively communicate technical
information in writing
Effectively communicate technical
information orally
Have a knowledge and understanding
of engineering/science information
resources and materials
Be able to search electronic
(bibliographic) data bases
Know how to use a library that contains
engineering/science informationresources and materials
Effectively use computer, communication,
and information technology
Very Very
Unimportant Important1 2 3 4 5 6 7
% % % % % % %
0.0 0.0 2.5 2.5 5.0 30.0 60.0
0.0 2.5 2.5 7.5 10.0 25.0 52.5
0.0 0.0 2.5 5.0 5.0 30.0 57.5
3.0 3.0 12.1 15.2 24.2 24.2 18.2
0.0 0.0 2.6 6.1 10.3 28.2 53.8
0.0 0.0 2.5 2.5 7.5 17.5 70,0
The next group of questions asks about course work or instruction you might have received as part of your education or academic
preparation.
6. Have you received training or course work in:
Technical writing/communication
Speech/oral communication
Using a library that contains engineering/scienceinformation resources and materials
Using engineering/science informationresources and materials
Searching electronic (bibliographic) data bases
Using computer, communication, and information
technology
No Instruction
Yes No Available
1 2 8
% % %
36.8 52.6 10.5
23.1 61.5 15.4
33,3 48.7 17.9
43.6 38.5 17.9
17.9 61.5 20.5
64.1 25.6 10.3
52

India
7. If you received training or instruction in any of the following, was it helpful?
Technical writing/communication
Speech/oral communication
Using a library that containsengineering/science informationresources and materials
Using engineering/science informationresources and materials
Searching electronic (bibliographic)data bases
Using computer, communication, andinformation technology
Not Very No
Helpful Helpful Training1 2 3 4 5 6 7 10
% % % % % % % %
0.0 0.0 5.3 5.3 2.6 5.3 18.4 63.2
0.0 0.0 0.0 2.7 2.7 8.1 10.8 75.7
0.0 0.0 0.0 2.6 2.6 15.8 15.8 63.2
0.0 0.0 0.0 2.9 2.9 25.7 8.6 60.0
2.7 0.0 2.7 2.7 0.0 10.8 2.7 78.4
0.0 0.0 5.3 13.2 5.3 7.9 31.6 36.8
These next questions ask about your preparation of written technical communication as part of your education or academic preparation.
8. What percentage of your written technical communication involves collaborative writing?
0 percent 14.7%
1 through 25 percent 8.7%26 through 50 percent 35.3%
51 through 76 percent 17.6%
76 through 99 percent 8.7%100 percent 14.7%
9. If you do write as a member of a group, what percentage of your written technical communication is required to be collaborative?
0 percent 0.0%1 through 25 percent 16.0%
26 through 50 percent 44.0%51 through 75 percent 24.0%
76 through 99 percent 8.0%
100 percent 8.0%
10. In general, do you find writing as part of a group more or
Less productive than writing aloneAbout as productive as writing alone
More productive than writing alone
20.0%36.7%
43.3%
less productive than writing alone?
11. Do you use a computer to prepare written technical communication?
Never 5.1%
Sometimes 17.9 %
Frequently 23.1%
Always 53.8%
12. Which of the following best explains your reasons for non-use?
No or limited computer access 0.0%
Lack of knowledge/skill using a computer 50.0%Prefer not to use a computer 50.0%Other 0.0%
53

India
13. To what extent does lack of knowledge/skill about each of the following communication principles impede your ability to produce
written technical communication?
Does not Greatly
Impede Impedes
1 2 3 4 5 6 7
% % % % % % %
Defining the purpose of thecommunication 18.2 15.2 0.0 21.2 9.1 9.1 27.3
Assessing the needs of the reader 13.8 3.4 3.4 34.5 13.8 17,2 13.8
Preparing/presenting information
in an organized manner 22.9 14.3 2.9 14.3 8.6 5.7 31.4
Developing paragraphs (introductions,
transitions, and conclusions) 14,3 14.3 20.0 8.6 14.3 14.3 14.3
Writing grammaticallycorrect sentences 31.4 5,7 11.4 25.7 5.7 8,6 11,4
Notetaking and quoting 18.8 6.3 6.3 34.4 21,9 3.1 9.4
Editing and revising 16.1 6.5 16.1 12.9 19.4 12.9 16.1
These questions ask about your use of electronic/information technologies.
14. Describe your use of the following electronic/information technologies for communicating technical information.
I don't use I don't use
I already it, but may it and doubtuse it in the future if I will
1 2 3
% % %
Audio tapes and cassettes 15.8 50.0 34.2
Motion picture film 23.7 39.5 36.8
Video tape 41.0 38.5 20.5
Desktop/electronic publishing 32.4 56.8 10.8
Computer cassette/cartridge tapes 46.2 51,3 2.6
Electronic mail 48.7 46.2 5.1
Electronic bulletin boards 7.7 64.1 28.2
FAX or TELEX 17.9 64.1 17.9
Electronic data bases 33.3 56.4 10.3
Video conferencing 2.6 71,1 26.3
Computer conferencing 0.0 73.7 26.3
Micrographics & microforms 30.8 51,3 17.9
54

India
15. Do you ever use electronic networks?
Yes, I personally use them
Yes, I use them but through an intermediary
No
No, because I do not have access
No, but I may use them in the future
67.5%
5.0%
10.0%
7.5%
10.0%
16. Do you use electronic networks for the following purposes?
To connect to geographically distant sites
For electronic mail
For electronic bulletin boards or conferences
For electronic file transfer
To log into computers for such things as computational
analysis or to use design tools
To control equipment such as laboratory instruments
or machine tools
To access/search the library's catalogue
To order documents from the library
To search electronic (bibliographic) data bases
For information search and data retrieval
To prepare scientific and technical papers with
colleagues at geographically distant sites
Yes No
1 2
% %
32.1 67.9
71.4 28.6
16.7 83.3
78.6 21.4
80.8 19.2
22.2 77.8
46.4 53.6
14.3 85.7
50.0 50.0
42.9 57.1
25.0 75.0
17. Do you exchange electronic messages or files with:
Members of your academic classes
Other people in your academic community at the same
geographic site who are not in your academic classes
Other people in your academic community at a different
geographic site who are not in your academic classes
People outside your academic community
These questions ask about your use of libraries and library services as part of your education.
Yes No
1 2
% %
75.0 25.0
39.3 60.7
35.7 64.3
32.1 67.9
18. During this current school term, about how many times have you used a library to meet your engineering/science information needs?
0 times 0.0%
1 through 25 times 37.5%
26 through 50 times 29.2%
51 through 75 times 0.0%
More than 75 times 33.3%
55

India
19. During the current school term, how effective was the information obtained from the library for meeting your engineering/scienceinformation needs?
Very VeryIneffective Effective
1 2 3 4 5 6 7
% % % % % % %
0.0 0.0 10.0 7.5 25.0 25.0 32.5
21. As part of your academic preparation, have you received or participated in the following library activities?
Library tour
Library presentation as part of academic orientation
Library orientation as part of an engineering/science course
Library skill/use course (bibliographic instruction)
Library skill/use course in engineering/science
information resources and materials
Library instruction for end-user searching ofelectronic (bibliographic) data bases
Not
Yes No Available
1 2 6
% % %
7.5 15.0 77.5
10.8 21.6 67.6
2.9 29.4 67.6
10.8 37.8 51.4
16.2 29.7 54.1
8.8 35.3 55.9
22. Which one of the following best characterizes your use of electronic data bases?
do all searches myself
do most searches myself
do half by myself and half through a librarian
do most searches through a librarian
do all searches through a librarian
do not use electronic data bases
do not have access to electronic data bases
10.3%
20.5%
10.3%
5.1%
15.4%
28.2%
10.3%
56

India
These questions ask about the use and importance of information to engineering/science students.
23. How often during this current school term have you used the following information sources to meet your engineering/science
information needs?
24.
Not
Never Seldom Sometimes Frequently Always Available1 2 3 4 5 6
% % % % % %
Your personal collectionof information 0.0 2.5 10.0 60.0 27.5 0.0
Other students 0.0 12.5 77.5 7.5 2.5 0.0
Faculty members 2.6 15.4 38.5 33.3 10.3 0.0
Library 2.5 0.0 10.0 50.0 37.5 0.0
Librarian 64.1 20.5 10.3 0.0 0.0 5.1
Your personal contacts
within industry 35.0 17.5 32.5 2.5 0.0 12.5
Your personal contacts at
government laboratories 30.0 25.0 35.0 5.0 0.0 5.0
How often during this current school term have you used the following information products to meet your engineering/scienceinformation needs?
Not
Never Seldom Sometimes Frequently Always Available
1 2 3 4 5 6
% % % % % %
Abstracts 7.5 15.0 37.5 • 27.5 12.5 0.0
Conference/meeting papers 2.5 7.5 52.5' 27.5 10.0 0.0
Journal articles 0.0 0.0 15.0 45.0 40.0 0.0
Handbooks 5.1 20.5 53.8 17.9 2.6 0.0
Textbooks 0.0 5.0 15.0 50.0 30.0 0.0
Computer programs & documentation 10.0 25.0 40.0 17.5 5.0 2.5
Bibliographic, numeric, factualdata bases 32.5 30.0 27.5 7.5 0.0 2.5
Theses/dissertations 10.0 25.0 37.5 25.0 2.5 0.0
Technical reports 0.0 17.5 47.5 27.5 7.5 0.0
Audio/visual materials 46.2 30.8 20.5 0.0 0.0 2.6
Foreign language technical reports 82.5 10.0 5.0 0.0 0.0 2.5
Technical translations 57.5 35.0 7.5 0.0 0.0 0.0
Patents 83.8 8.1 8.1 0.0 0.0 0.0
Industry technical reports 35.9 28.2 30.8 2.6 2.6 0.0
Drawings/specifications 55.3 31.6 10.5 2.6 0.0 0.0
Preprints or deposited manuscripts 35.0 32.5 25.0 5.0 2.5 0.0
informal information products (e.g.,
vendor/supply catalogs, company
literature, trade journals/magazines) 35.0 30.0 27.5 5.0 2.5 0.0
5?

India
25. How important are the following information sources in meeting your engineering/science information needs?
Very Very Not
Unimportant Important Available1 2 3 4 5 6 7 8
% % % % % % % %
Your personal collection
of information 0.0 5.0 2.5 2.5 10.0 10.0 70.0 0.0
Other students 5.0 5.0 20.0 32.5 25.0 10.0 2.5 0.0
Faculty members 0.0 5.0 7.5 22.5 20.0 35.0 10.0 0.0
Library 0.0 0.0 0.0 5.0 17.5 30.0 47,5 0.0
Librarian 35.9 25.6 23.1 7.7 0.0 2.6 0.0 5.1
Your personal contacts
within industry 30.0 10.0 17.5 10.0 10.0 10.0 2.5 10.0
Your personal contacts at
government laboratories 27.5 5.0 15.0 27.5 15.0 5.0 5.0 0.0
26. How important are the following information products in
Very
Unimportant
1
%
Abstracts 5.0
Conference/meeting papers 0.0
Journal articles 0.0
Handbooks 7.5
Textbooks 0.0
Computer programs and
documentation 7.5 10.0
Bibliographic, numeric,
factual data bases 17.5 2.5
Theses/dissertations 5.0 7.5
Technical reports 2.6 7.7
Audio/visual materials 23.1 30.8
Foreign language
technical reports 42.5 25.0
Technical translations 37.5 22.5
Patents 47.5 20.0
Industry technical reports 23.1 15.4
Drawings/specifications 35.0 12.5
Preprints or deposited
manuscripts 27.5 15.0
Informal information products
(e.g., vendor/supply
catalogs, company literature,
trade journals/magazines) 27.5 20.0
meeting your engineering/science information needs?
Very Not
Important Available
2 3 4 5 6 7 8
% % % % % % %
5.0 15.0 22.5 20.0 12.5 20.0 0.0
5.0 5.0 22.5 25.0 22.5 20.0 0.0
0.0 2.5 5.0 7.5 22.5 62.5 0.0
7.5 17.5 15.0 32.5 12.5 7.5 0.0
7.5 5.0 10.0 15.0 17.5 45.0 0.0
30.0
30.0
17.5
10.3
10.3
10.0
15.0
12.5
20.5
25.0
20.0
17.5
7.5 22.5 12.5 10.0 0.0
17.5 12.5 10.0 5.0 5.0
17.5 27.5 15.0 10.0 0.0
12.8 28.2 15.4 23.1 0.0
12.8 10.3 5.1 5.1 2.6
7.5 2.5 0.0 5.0 7.5
10.0 5.0 5.0 5.0 0.0
2.5 2.5 5.0 5.0 5.0
12.8 12.8 7.7 7,7 0.0
10.0 5.0 7.5 2.5 2.5
10.0 15.0 7.5 5.0 0.0
7.5 12.5 5.0 10.0 0.0
58

India
27. Do you use the following technical reports in meeting your engineering/science information needs?
Don't
Have
Yes No Access
1 2 6
% % %
AGARD reports 55.0 30.0 15.0
British ARC and RAE reports 48.7 33.3 17.9
Dutch NLR reports 7.9 55.3 36.8
ESA reports 8.1 54.1 37.8
Indian NAL reports 74.4 25.6 0.0
French ONERA reports 28.9 42.1 28.9
German DFVLR, DLR, and MBB reports 15.8 50.0 34.2
Japanese NAL reports 7.9 50.0 42.1
Russian TsAGI reports 2.6 47.4 50.0
U.S. NASA reports 90.0 10.0 0.0
28. Think of the most technically challenging assignment you have worked on this current
obtain the information you needed to complete this assignment?
Used my personal store oftechnical information
Spoke with other students
Spoke with faculty members
Used literature resources
Spoke with a librarian
Used literature resources
found in a library
school term. What steps did you follow to
Did Not
Step Use
1 2 3 4 5 6 0
% % % % % % %
35.9 7.7 20.5 23.1 7.7 0.0 5.1
0.0 17.9 15.4 28.2 28.2 0.0- 10.3
28.2 23.1 25.6 17.9 2.6 0.0 2.6
20.0 37.5 22.5 7.5 10.0 0.0 2.5
0.0 0.0 0.0 0.0 2.7 8.1 89.2
17.5 17.5 15.0 17.5 30.0 0.0 2.5
These questions will be used to determine whether students with different backgrounds and from different countries have different
technical communication practices.
29. What is your gender?
Female 0.0%
Male 100.0%
30. What is your area of study/major?
EngineerScientist
Other
72.5%
20.0%
7.5%
31. What is your educational status?
Undergraduate student 0.0%
Master's student 40.0%
Doctoral student 60.0%
59
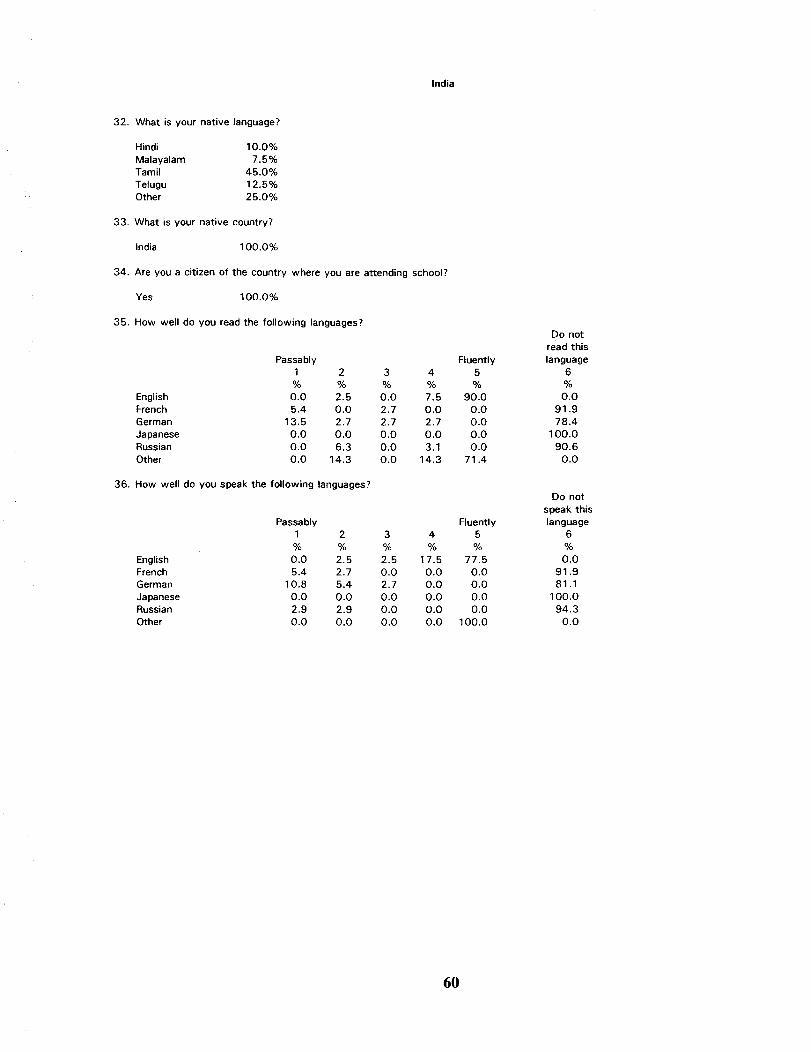
India
32. What is your native language?
Hindi 10.0%
Malayalam 7.5 %Tamil 45.0%
Tetugu 12.5%
Other 25.0%
33. What is your native country?
India 100.0%
34. Are you a citizen of the country where you are at-tending school?
Yes 100.0%
35. How well do you read the following languages?
Passably Fluently
1 2 3 4 5
% % % % %
English 0.0 2.5 0.0 7.5 90.0
French 5.4 0.O 2.7 O.O O.0
German 13.5 2.7 2.7 2.7 0.0
Japanese 0.0 O.0 0.0 0.0 0.0
Russian 0.0 6.3 0.0 3.1 0.0
Other O.0 14.3 O.O 14.3 71.4
36. How well do you speak the following languages?
Passably Fluently
1 2 3 4 5
% % % % %
English 0.0 2.5 2.5 17.5 77.5
French 5.4 2.7 0.0 0.0 0.0
German 10.8 5.4 2.7 0.O O.O
Japanese 0.0 0.0 0.0 0.0 0.0
Russian 2.9 2.9 0.0 O.0 0.0
Other 0.0 O.0 0.0 0.0 100.0
Do not
read this
language6
%
0.0
91.9
78.4
100.0
90.6
0.0
Do not
speak this
language6
%
O.0
91.9
81.1
100.0
94.3
0.0
60

India
37. In terms of your career goals and aspirations, how important will it be for you to be bilingual?
Very Very Am Not
Unimportant Important Bilingual1 2 3 4 5 6 7 8
% % % % % % % %
7.7 5.1 10.3 10.3 12.8 7.7 30.8 10.3
Don't
Know
9
%
5.1
38. tn what type of organization do you hope to work after graduation?
Academic 52.5%
Government 27.5 %
Industry (national) 5.0%
Industry (multi-national) 10.0%
Not for profit 0.0%
Other 5.0%
39. When you were growing up, do you think your family's income was:
Much more than most families in your native country
More than most families in your native country
About equal to the average family incomes in your native country
Lower than most families in your native country
Much less than most families in your native country
I cannot compare my family's income with other families
0.0%
27.5%
65.0%
5.0%
0.0%
2.5%
40. Do you own a personal computer?
Yes 2.5%
No 97.5%
41. As a high school student, how often did you use your:Not
Never Seldom Sometimes Frequently Always Available1 2 3 4 5 6
% % % % % %
High school library 5.1 10.3 33.3 23.1 2.6 25.6
Public library 5.0 15.0 40.0 25.0 0.0 15.0
42. As an aerospace engineering/science major, about how many hours a week (exclusive of classroom and course assignments) do
you spend reading the professional literature associated with your discipline?
0 hours 0.0%
1 through 5 hours 30.7%
6 through 10 hours 38.5%
11 through 25 hours 23.1%More than 25 hours 7.8%
61

JAPAN
These questions ask about your career goals and aspirations.
1. To have a successful career, how important will it be for you to:
Have the opportunity to explore
new ideas about technology or
systems
Very
Unimportant1 2
% %
3 4 5 6
% % % %
Advance to a high-level staff
technical position
Very
Important7
%
Have the opportunity to work on
complex technical problems
0.0 1.3 2.6 2.6 13.2 19.7 60.5
Work on projects that utilize thelatest theoretical results in
your specialty
0.0 2.7 9.5 14.9 27.0 23.0 23.0
Work on projects that require
learning new technical
knowledge
1.3 0.0 1.3 11.8 21.1 32.9 31.6
Establish a reputation outside
your organization as an authority
in your field
0.0 0.0 2.6 11.8 17.1 31.6 36.8
1.3 0.0 2.6 7.8 19.5 23.4 45.5
Receive patents for your ideas
6.8
Publish articles in technical
journals
12.2
Communicate your ideas to others
in your profession through papers
delivered at professional society
meetings
5.5 8.2 24.7 30.1 12.3 12.3
8.1 17.6 27.0 12.2 8.1 14.9
Be evaluated on the basis of yourtechnical contributions
8.1 2.7 9.5 28.4 25.7 16.2 9.5
Become a manager or director
in your line of work
3.9 3.9 5.3 15,8 23.7 25.0 22.4
Plan and coordinate the work
of others
1.3 2.6 10.4 14.3 31.2 16.9 23.4
Advance to a policy-making
position in management
7.5 4.5 14,9 29.9 19.4 16.4 7.5
Plan projects and make decisions
affecting the organization
17.8 6.8 20.5 31.5 12.3 9.6 1.4
Be the technical leader of a group
of less experienced professionals
18.9 6.8 14.9 27.0 13.5 14.9 4.1
8.3 1.4 9.7 27.8 19.4 27.8 5.6
11.3 8.5 19.7 21.1 18.3 16.9 4.Z
62

JAPAN
These questions ask about your decision to choose a career in engineering or science.
2. How important were each of the following in making your career choice?
Your parents encouraged yourarea of study/major
Other family members encouraged
your area of study/major
Teachers encouraged your area
of study/major
You feel that a career in your
major/area of study will lead to
financial security
You feel that a career in your
major/area of study will provide
a career with many rewarding
activities
Information on the career
opportunities available in your
major/area of study
Very
Unimportant1 2 3 4
% % % %
5
%
Very
Important NA6 7 9
% % %
36.4 19.5 9.1 7.8 7.8 1.3 2.6
40.3 24.7 2.6 3.9 2.6 1.3 1.3
37.7 16.9 7.8 6.5 3.9 1.3 0.0
22.1 5.2 18.2 26.0 14.3 2.6 5.2
2.6 0.0 2.6 10.4 6.5 26.0 60.6
10.4 5.2 13.0 22.1 18.2 7.8 16.9
15.6
23.4
26.0
6.5
1.3
6.5
3. When did you first decide on your area of study/major?
4.
In elementary school
Junior high school
Senior high school
Before the entrance of college
Right after the entrance of collegeAfter the entrance of college
10.4%
15.6%
40.3%
9.1%
6.5%
18.2%
How well do your current feelings about the career opportunities in your major/area of study match with those you had when you
first decided on your career path?
I am more happy about my career choice now than when I first made itI feel about the same now as when I first made it
I am less happy about my career choice now than when I first made it
13.0%
62.3%
24.7%
63

JAPAN
These questions ask about the importance of certain skills for your professional success.
5. How important do you think it will be for you to:
Very Very
Unimportant Important1 2 3 4 5 6 7
% % % % % % %
Effectively communicate technicalinformation in writing 0.(_ 0.0 2.6 6.6 23.7 21.1 46.1
Effectively communicate technical
information orally 0.0 2.6 2.6 5.3 22.4 22.4 44.7
Have a knowledge and understanding
of engineering/science informationresources and materials 0.0 0.0 0.0 2.6 19.5 24.7 53.2
Be able to search electronic
(bibliographic) data bases 0.0 4.2 9.7 13.9 25.0 25.0 22.2
Know how to use a library that contains
engineering/science information
resources and materials 0.0 0.0 5.3 20.0 26.7 17.3 30.7
Effectively use computer, communication,
and information technology 0.0 2.6 1.3 15.8 9.2 26.3 44.7
The next group of questions asks about course work or instruction you might have received as part of your education or academic
preparation.
6. Have you received training or course work in:
Technical writing/communication
Speech/oral communication
Using a library that contains engineering/science
information resources and materials
Using engineering/science informationresources and materials
Searching electronic (bibliographic) data bases
Using computer, communication, and information
technology
No Instruction
Yes No Available
1 2 8
% % %
10.5 73.7 15.8
13.2 71.1 15.8
10.5 73.7 15.8
9.3 76.0 14.7
11.7 74.0 14.3
43.4 44.7 11.8
64

JAPAN
7. If you received training or instruction in any of the following, was it helpful?
Technical writing/communication
Speech/oral communication
Using a library that contains
engineering/science informationresources and materials
Using engineering/science informationresources and materials
Searching electronic (bibliographic)data bases
Using computer, communication, andinformation technology
Not Very No
Helpful Helpful Training1 2 3 4 5 _ 7 10
% % % % % % % %0.0 1.3 0.0 1.3 2.7 1.3 4.0 89.3
0.0 0.0 2.7 4.0 2.7 2.7 2.7 85.3
0.0 0.0 1.3 2.7 2.7 1.3 2.7 89.3
0.0 0.0 2.7 2.7 2.7 0.0 4.0 88.0
1.3 0o0 2.6 2.6 5.3 0.0 1.3 86.8
1.4 1.4 5.5 2.7 13.7 6.8 9.6 58.9
These next questions ask about your preparation of written technical communication as part of your education or academic preparation.
8. What percentage of your written technical communication involves collaborative writing?
9.
0 percent 63.2%1 through 25 percent 14.7%
26 through 50 percent 7.4%51 through 75 percent 1.5%
76 through 99 percent 2.9%100 percent 10.3%
If you do write as a member of a group, what percentage
0 percent 0.0%1 through 25 percent 18.2%
26 through 50 percent 68.2%
51 through 75 percent 9.1%76 through 99 percent 4.6%
100 percent 0.0%
10. In general, do you find writing as part of a group
Less productive than writing alone
About as productive as writing aloneMore productive than writing alone
of your written technical communication is required to be collaborative?
more or less productive than writing alone?
24,1%
34.5%41.4%
11. Do you use a computer to prepare written technical communication?
Never 9.3%
Sometimes 30.7 %
Frequently 30.7 %Always 29 .3o/.
12. Which of the following best explains your reasons for non-use?
No or limited computer access
Lack of knowledge/skill using a computerPrefer not to use a computerNo need to use
Other
28.6%28.6%
0.0%42.9%
0.0%
65

JAPAN
13. To what extent does lack of knowledge/skill about each of the following communication principles impede your ability to producewritten technical communication?
Defining the purpose of the
communication
Assessing the needs of the reader
Preparing/presenting _mformation
in an organized manner
Developing paragraphs (introductions,
transitions, and conclusions)
Writing grammaticallycorrect sentences
Notetaldng and quoting
Editing and revising
Does not Greatly
Impede Impedes1 2 3 4 5 6 7
% % % % % % %
4.2 6.9 5.6 9.7 23.6 18.1 31.9
5.9 5.9 22.1 14.7 29.4 14.7 7.4
1.4 2.8 2.8 9.7 25.0 37.5 20.8
2.7 5.4 5.4 12.2 41.9 24.3 8.1
2.7 5.3 17.3 14.7 37.3 16.0 6.7
1.4 2.9 11.6 29.0 31.9 18.8 4.3
1.4 5.6 2.8 26.4 37.5 19.4 6.9
These questions ask about your use of electronic/information technologies.
14. Describe your use of the following electronic/information technologies for communicating technical information.
I don't use I don't use
I already it, but may it and doubt
use it in the future if I will
1 2 3
% % %
Audio tapes and cassettes 9.5 25.7 64.9
Motion picture film 2.7 20.0 77.3
Video tape 21.3 72.0 6.7
Desktop/electronic publishing 13.9 62.5 23.6
Computer cassette/cartridge tapes 31.5 35.6 32.9
Electronic mail 26.7 64.0 9.3
Electronic bulletin boards 20.0 62.7 17.3
FAX or TELEX 21.3 73.3 5.3
Electronic data bases 6.8 86.3 6.8
Video conferencing 0.0 66.2 33.8
Computer conferencing 0.0 70.3 29.7
Micrographics & microforms 5.3 60.0 34.7
66
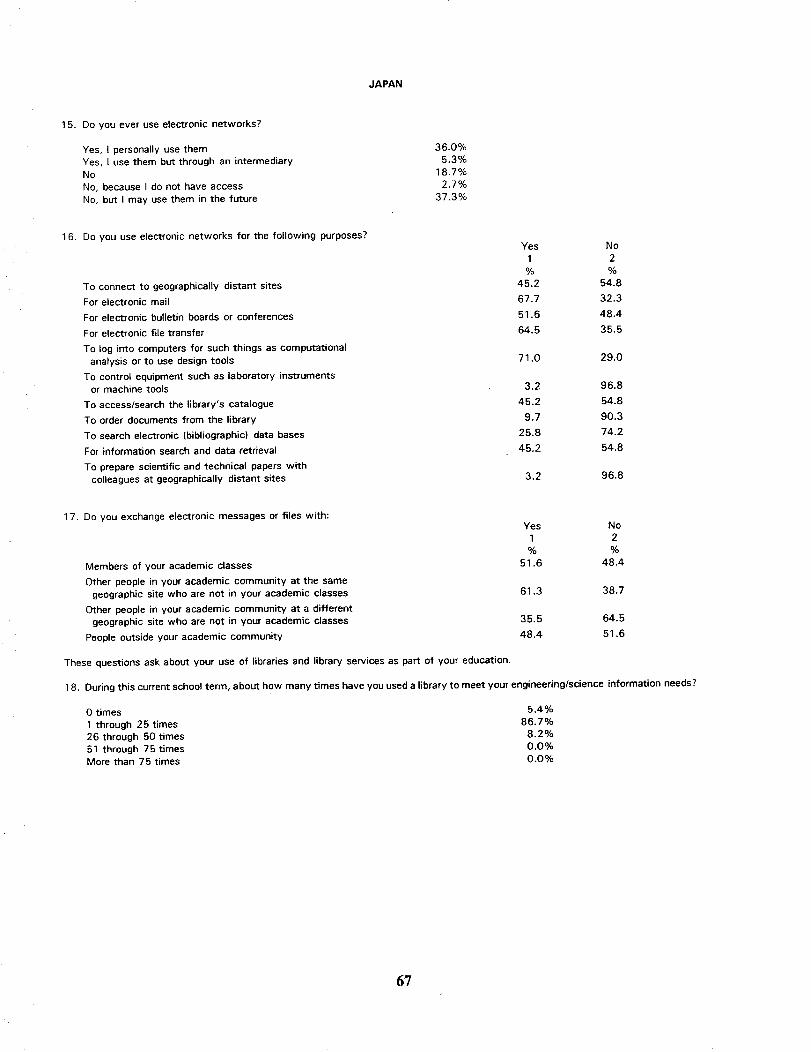
JAPAN
15. Do you ever use electronic networks?
Yes, I personally use them
Yes, I use them but through an intermediary
No
No, because I do not have access
No, but I may use them in the future
36.0%
5.3%
18.7%
2.7%
37.3%
16. Do you use electronic networks for the following purposes?
To connect to geographically distant sites
For electronic mail
For electronic bulletin boards or conferences
For electronic file transfer
To log into computers for such things as computational
analysis or to use design tools
To control equipment such as laboratory instrumentsor machine tools
To access/search the library's catalogue
To order documents from the library
To search electronic (bibliographic) data bases
For information search and data retrieval
To prepare scientific and technical papers with
colleagues at geographically distant sites
Yes No
1 2
% %
45.2 54.8
67.7 32.3
51.6 48.4
64.5 35.5
71.0 29.0
3.2 96.8
45.2 54.8
9.7 90.3
28.8 74.2
45.2 54.8
3.2 96.8
17. Do you exchange electronic messages or files with:
Members of your academic classes
Other people in your academic community at the same
geographic site who are not in your academic classes
Other people in your academic community at a different
geographic site who are not in your academic classes
People outside your academic community
These questions ask about your use of libraries and library services as part of your education.
Yes No
1 2
% %
51.6 48.4
61.3 38.7
35.5 64.5
48.4 51.6
18. During this current school term, about how many times have you used a library to meet your engineering/science information needs?
0 times 5.4%
1 through 25 times 86.7%
26 through 50 times 8.2%
51 through 75 times 0.0%
More than 75 times 0.0%
6?
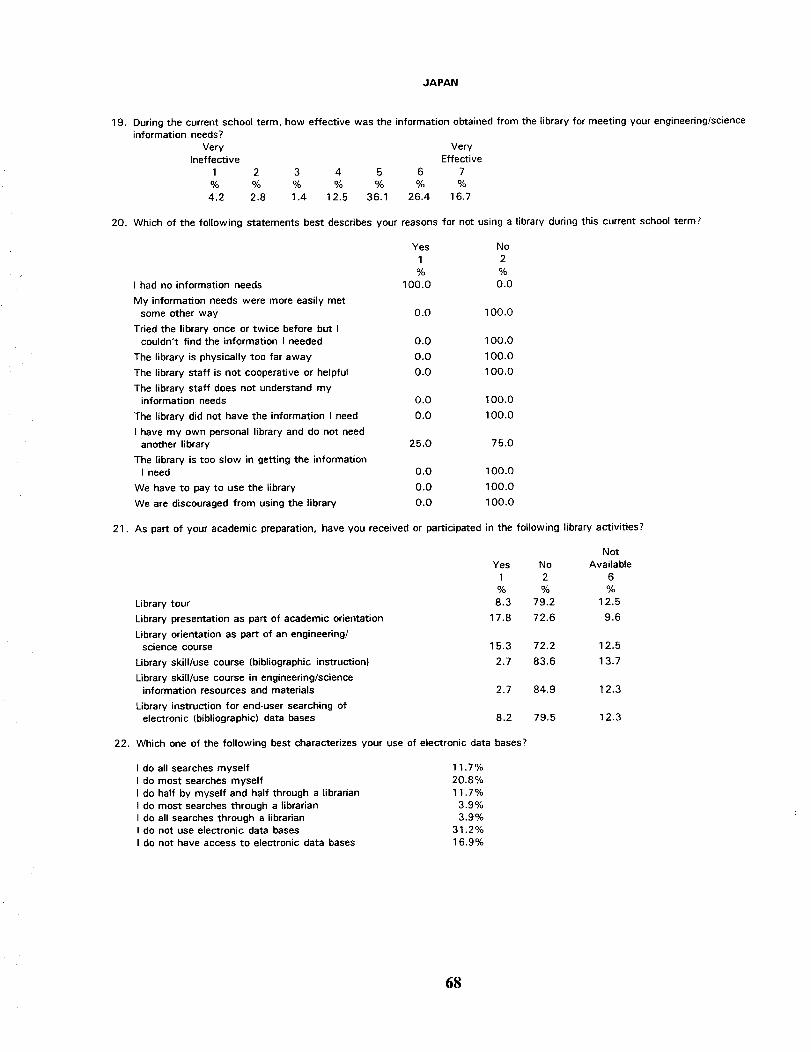
JAPAN
19. During the current school term, how effective was the information obtained from the library for meeting your engineering/scienceinformation needs?
Very Very
Ineffective Effective
1 2 3 4 5 6 7
% % % % % % %
4.2 2.8 1.4 12.5 36.1 26.4 16.7
20. Which of the following statements best describes your reasons for not using a library during this current school term?
Yes No
1 2
% %
I had no information needs 100.0 0.0
My information needs were more easily met
some other way 0.0 100.0
Tried the library once or twice before but Icouldn't find the information I needed 0.0 100.0
The library is physically too far away 0.0 100.0
The library staff is not cooperative or helpful 0.0 100.0
The library staff does not understand myinformation needs 0.O 100.0
The library did not have the information I need 0.0 100.0
I have my own personal library and do not need
another library 25.0 75.0
The library is too slow in getting the information
I need 0.0 100.0
We have to pay to use the library 0.0 100.0
We are discouraged from using the library 0.0 100.0
21. As part of your academic preparation, have you received or participated in the following library activities?
Library tour
Library presentation as part of academic orientation
Library orientation as part of an engineering/science course
Library skill/use course (bibliographic instruction)
Library skill/use course in engineering/scienceinformation resources and materials
Library instruction for end-user searching of
electronic (bibliographic) data bases
Not
Yes No Available
1 2 6
% % %
8.3 79.2 12.5
17.8 72.6 9.6
15.3 72.2 12.5
2.7 83.6 13.7
2.7 84.9 12.3
8.2 79.5 12.3
22. Which one of the following best characterizes your use of electronic data bases?
11.7%
20.8%
11.7%
3.9%
3.9%
31.2%
16.9%
do all searches myself
do most searches myself
do half by myself and half through a librarian
do most searches through a librarian
do all searches through a librarian
do not use electronic data bases
do not have access to electronic data bases
68

JAPAN
These questions ask about the use and importance of information to engineering/science students.
23. How often during this current school term have you used the following information sources to meet your engineering/science
information needs?Not
Never Seldom Sometimes Frequently Always Available
1 2 3 4 5 6
% % % % % %
Your personal collectionof information 3.9 7.8 15.6 40.3 31.2 1.3
Other students 10.4 27.3 31.2 27.3 3.9 0.0
Faculty members 6.5 20.8 42.9 23.4 5.2 1.3
Library 5.2 14.3 24.7 42.9 13.0 0.0
Librarian 55.8 27,3 11.7 5.2 0.0 0.0
Your personal contactswithin industry 55.8 18.2 9.1 0.0 0.0 1 6.9
Your personal contacts at
government laboratories 51.9 10.4 13.0 5.2 2.6 16.9
24. How often during this current school term have you used the following information products to meet your engineering/science
information needs?
Abstracts
Conference/meeting papers
Journal articles
Handbooks
Textbooks
Computer programs & documentation
Bibliographic, numeric, factual
data bases
Theses/dissertations
Technical reports
Audio/visual materials
Foreign language technical reports
Technical translations
Patents
Industry technical reports
Drawings/specifications
Preprints or deposited manuscripts
Informal information products (e.g.,
vendor/supply catalogs, company
literature, trade journals/magazines)
Not
Never Seldom Sometimes Frequently Always Available
1 2 3 4 5 6
% % % % % %
27.3 27.3 22.1 18.2 5.2 0.0
22.1 18.2 20.8 31.2 7.8 0.0
30.3 19.7 28.9 17.1 3.9 0.0
27.3 29.9 31.2 10.4 1.3 0.0
5.2 7.8 22.1 49.4 15.6 0.0
26.0 31.2 23.4 1 6.9 2.6 0.0
55.8 26.0 6.5 9.1 2.6 0.0
29.9 22.1 18.2 24.7 5.2 0.0
40.3 20.8 22.1 13.0 2.6 1.3
83.1 9.1 2.6 1.3 0.0 3.9
41.6 18.2 16.9 18.2 5.2 0.0
44.2 23.4 22.1 10.4 0.0 0.0
92.2 2.6 2.6 0.0 0.0 2.6
68.4 19.7 6.6 0.0 0.0 5.3
74.0 10.4 10.4 1.3 0.0 3.9
75.3 9.1 6.5 1.3 0.0 7.8
63.6 19.5 11.7 0.0 0.0 5.2
69

JAPAN
25. How important are the following information sources in meeting your engineering/science information needs?
Very Very Not
Unimportant Important Available1 2 3 4 5 6 7 8
% % % % % % % %
Your personal collection
of information 2.6 9.1 2.6 15.6 18.2 15.6 35.1 1.3
Other students 3.9 16.9 13.0 18.2 24.7 14.3 9.1 0.0
Faculty members 2.6 3.9 9.1 6.5 22.1 22.1 33.8 0.0
Library 5.2 5.2 5.2 14.3 15.6 19.5 35.1 0.0
Librarian 42.9 20.8 14.3 7.8 5.2 5.2 2.6 1.3
Your personal contacts \
within industry 33.8 14.3 3.9 5.2 2.6 9.1 3.9 27.3
Your personal contacts at
government laboratories 32.5 10.4 2.6 5.2 6.5 9.1 7.8 26.0
26. How important are the following information products in meeting your engineering/science information needs?
Very
Unimportant1 2
% %
Abstracts 24.0 6.7
Conference/meeting papers 14.7 8.0
Journal articles 17.3 16.0
Handbooks 22.7 13.3
Textbooks 5.3 5.3
Computer programs and
documentation 21.3 21.3
Bibliographic, numeric,factual data bases 37.3 12.O
Theses/dissertations 16.0 9.3
Technical reports 34.7 8.0
Audio/visual materials 60.0 9.3
Foreign language
technical reports 33.3 10.7
Technical translations 37.3 13.3
Patents 72.0 5.3
Industry technical reports 53.3 6.7
Drawings/specifications 52.0 14.7
Preprints or deposited
manuscripts 56.0 4.0
Informal information products
(e.g., vendor/supply
catalogs, company literature,
trade journals/magazines)
Very Not
Important Available
3 4 5 6 7 8
% % % % % %
8.0 16.0 14.7 10.7 18.7 1.3
6.7 16.0 13.3 18.7 22.7 0.0
6.7 13.3 17.3 14.7 14.7 0.0
12.0 26.7 8.0 13.3 4.0 0.0
12.0 13.3 20.0 13.0 30.7 O.0
10.7 21.3 8.0 6.7 10.7
17.3 14.7 5.3 6.7 4.O
10.7 13.3 14.7 18.7 16.0
6.7 16.0 14.7 6.7 12.0
8.0 6.7 4.0 1.3 1.3
6.7 9.3 13.3 12.0 14.7
2.7 17.3 9.3 8.0 10.7
5.3 8.0 1.3 0.0 1.3
6.7 12.0 8.0 4.0 1.3
8.0 9.3 5.3 2.7 0.0
O.0
2.7
1.3
1.3
9.3
O.0
1.3
6.7
8.0
8.0
8.0 13.3 1.3 0.0 4.0 13.3
48.0 10.7 9.3 14.7 2.7 1.3 1.3 1 2.0
70

JAPAN
27. Do you use the following technical reports in meeting your engineering�science information needs?
Don't
Have
Yes No Access
1 2 6
% % %
AGARD reports 16.9 76.6 6.5British ARC and RAE reports 11.7 81.8 6.5
Dutch NLR reports 2.6 87.0 10.4
ESA reports 11.7 80.5 7.8
Indian NAL reports 0.0 88.3 11.7
French ONERA reports 6.5 83.1 10.4
German DFVLR, DLR, and MBB reports 5.2 84.4 10.4
Japanese NAL reports 53.2 42.9 3.9
Russian TsAGI reports 1.3 87.0 11.7
U.S. NASA reports 64.9 32.5 2.6
28. Think of the most technically challenging assignment you have worked on this current school term. What steps did you follow to
obtain the information you needed to complete this assignment?
Did Not
Step Step Use1 2 3 4 5 6 7 0
% % % % % % % %
Used my personal store oftechnical information 63.6 15.2 7.6 7.6 3.0 0.0 0.0 3.0
Spoke with other students 4.6 26.2 21.5 13.8 16.9 3.:1 0.0 13.8
Spoke with faculty members 12.1 15.2 18.2 15.2 15.2 1.5 1.5 21.2
Used literature resources 15.2 22.7 1 3.6 19.7 4.5 0.0 0.0 24.2
Spoke with a librarian 0.0 1.5 0.0 0.0 4.4 4.4 0.0 89.7
Used literature resources
found in a library 1.5 18.2 36.4 18.2 6.1 0.0 0.0 19.7
Searched an electronic
database at the library 2.9 1.5 1.5 1.5 1.5 7.4 1.5 82.4
Used none of the above 13.0 0.0 0.0 0.0 0.0 0.0 0.0 87.0
These questions will be used to determine whether students with different backgrounds and from different countries have different
technical communication practices.
29. What is your gender?
Female 4.1%
Male 95.9%
30. What is your educational status?
Undergraduate 54.1%Graduate 37.8%
Other 8.1%
31. Is your education primarily as:
Engineer 97.3 %Scientist 2.7 %
Other 0.0%
71
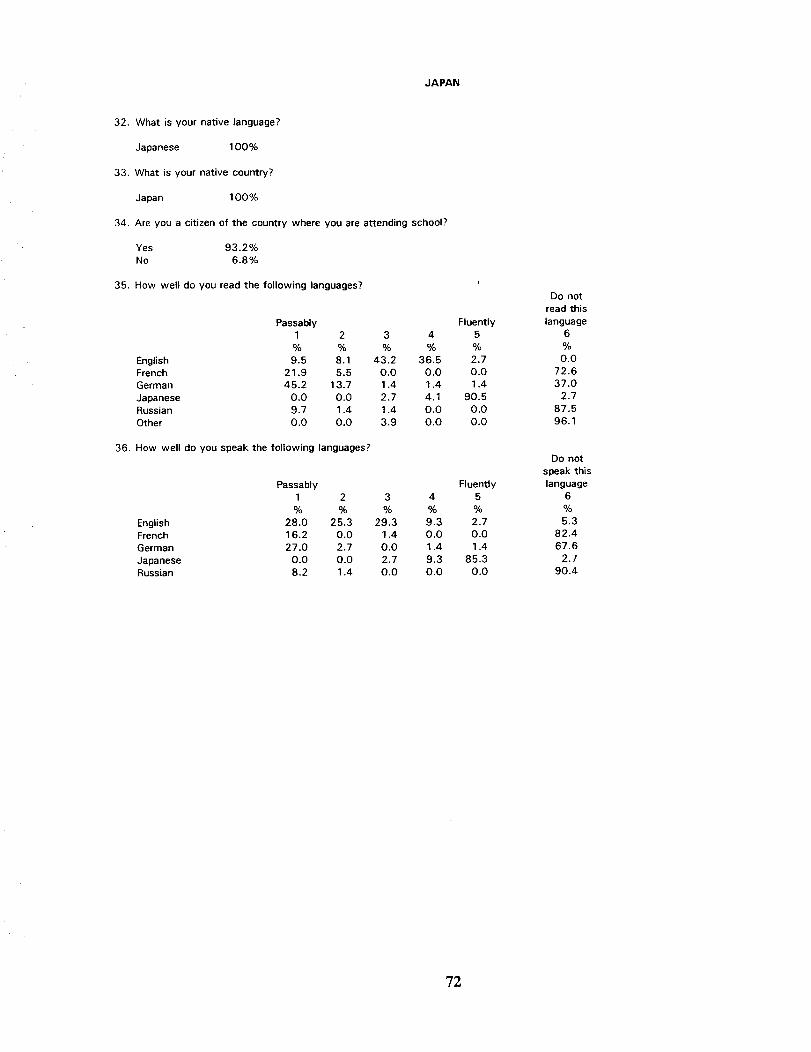
JAPAN
32. What is your native language?
Japanese 100%
33. What is your native country?
Japan 100%
34. Are you a citizen of the country where you are attending school?
Yes 93.2%
No 6.8%
35. How well do you read the following languages?
Passably Fluently
1 2 3 4 5
% % % % %
English 9.5 8.1 43.2 36.5 2.7French 21.9 5.5 O.0 0.O O.0
German 45.2 13.7 1.4 1.4 1.4
Japanese 0.0 0.0 2.7 4.1 90.5Russian 9.7 1.4 1.4 0.0 0.0
Other 0.0 0.0 3.9 0.O 0.0
36. How well do you speak the following languages?
Passably Fluently
1 2 3 4 5
% % % % %
English 28.0 25.3 29.3 9.3 2.7French 16.2 0.0 1.4 0.O 0.0
German 27.0 2.7 0.0 1.4 1.4
Japanese 0.0 0.0 2.7 9.3 85.3Russian 8.2 1.4 0.O 0.0 O.0
Do not
read this
language6
%
0.0
72.6
37.0
2.7
87.5
96.1
Do not
speak this
language
6
%
5.3
82.4
67.6
2.7
90.4
72

JAPAN
37. In terms of your career goals and aspirations, how important will it be for you to be bilingual?
Very Very Am Not
Unimportant Important Bilingual
1 2 3 4 5 6 7 8
% % % % % % % %
0.0 1.3 2.7 2.7 2.7 14.7 40.0 36.0
Don't
Know
9
%
0.0
38. In what type of organization do you hope to work after graduation?
Academic 35.1%
Government 2.6%
Industry (national) 29.9%
Industry (multi-national) 19.5%
Not for profit 5.2%Other 5.2%
39. When you were growing up, do you think your family's income was:
Much more than most families in your native country
More than most families in your native country
About equal to the average family incomes in your native country
Lower than most families in your native country
Much less than most families in your native country
I cannot compare my family's income with other families
40. Do you own a personal computer?
Yes 77.3%
No 22.7%
41. As a high school student, how often did you use your:
0.0%
22.7%
62;7%
9.3%
2.7%
2.7%
Not
Never Seldom Sometimes Frequently Always Available
1 2 3 4 5 6
% % % % % %
High school library 22.7 22.7 29.3 21.3 4.0 0.0
Public library 40.5 36.5 8.1 10.8 4.1 0.0
42. About how many hours a week do you spend reading technical literature (other than textbooks and homework assignments) for
the purpose of self-education?
0 hours 12.2%
1 through 5 hours 52.8%
6 through 10 hours 27.1%
11 through 25 hours 8.2%More than 25 hours 0.0%
43. Are you a member of a professional student (national) engineering, scientific, or technical society?
Yes 28.8%
No 71.2%
?3

RUSSIA
These questions ask about your career goals and aspirations.
1. To have a successful career, how important will it be for you to:
Very
Unimportant1 2
% %
Have the opportunity to explore
new ideas about technology or
systems 2.6 0.9
Advance to a high-level staff
technical position 15.9 8.8
Have the opportunity to work on
complex technical problems 3.7 2.8
Work on projects that utilize thelatest theoretical results in
your specialty 1.8 4.5
Work on projects that require
learning new technical
knowledge 3.6 6.3
Establish a reputation outside
your organization as an authority
in your field 4.3 6.1
Receive patents for your ideas 8.3 4.6
Publish articles in technical
journals 16.1 4.5
Communicate your ideas to others
in your profession through papers
delivered at professional society
meetings 7.9 4.4
Be evaluated on the basis of your
technical contributions 8.2 10.0
Become a manager or director
in your line of work 18.3 7.3
Plan and coordinate the work
of others 14.3 12.5
Advance to a policy-making
position in management 21.1 10.1
Plan projects and make decisions
affecting the organization 6.3 8.1
Be the technical leader of a group
of less experienced professionals 11.3 14.2
3
%
2.6
11.5
8.3
6.3
8.9
5.2
6.4
16.1
5.3
9.1
6.4
11.6
10.1
17.1
1 6.0
4
%
10.4
15.0
14.8
9.0
13.4
9.6
10.1
12.5
21.1
16.4
11.9
18.8
14.7
16.2
14.2
5
%
17.4
13.3
20.4
19.8
12.5
15.7
12.8
19.6
15.8
18.2
22.0
17.0
12.8
11.7
18.9
6
%
12.2
14.2
21.3
25.2
20.5
25.2
22.0
9.8
20.2
14.5
18.3
12.5
11.0
20.7
13.2
Very
Important
7
%
53.9
21.2
28.7
33.3
34.8
33.9
35.8
21.4
25.4
23.6
15.6
13.'_
20.2
19.8
12.3
74

RUSSIA
These questions ask about your decision to choose a career in engineering or science.
2. How important were each of the following in making your career choice?
Your parents encouraged your
area of study/major
Very
Unimportant1 2 3 4
% % % %
5
%
Other family members encouraged
your area of study/major
6
%
Teachers encouraged your area
of study/major
Very
Important7
%
You feel that a career in your
major/area of study will lead to
financial security
21.4 7.7 9.4 15.4 14.5 8.5 10.3
You feel that a career in your
major/area of study will provide
a career with many rewardingactivities
44.4 8.5 6.0 6.0 6.0 2.6 4.3
Information on the career
opportunities available in your
major/area of study
39.7 9.5 9.5 10.3 5.2 2.6 8.6
26.5 13.7 12.0 12.8 7.7 6.8 7.7
21.4 16.2 16.2 13.7 8.5 6.8 4.3
7.7 6.0 4.3 17.1 12.0 17.1 21.4
NA
9
%
12.8
22.2
14.7
12.8
12.8
14.5
3. When did you first decide on your area of study/major?
While still in elementary school
While in high school (or equivalent)
When you started college (or equivalent)
After starting college (or equivalent)
Other
11.2%
47.4%
17.2%
19.0%
5.2%
4. How well do your current feelings about the career opportunities in your major/area of study match with those you had when you
first decided on your career path?
I am more happy about my career choice now than when I first made it
I feel about the same now as when I first made it
I am less happy about my career choice now than when I first made it
25.2%
36.5%
38.3%
"/5
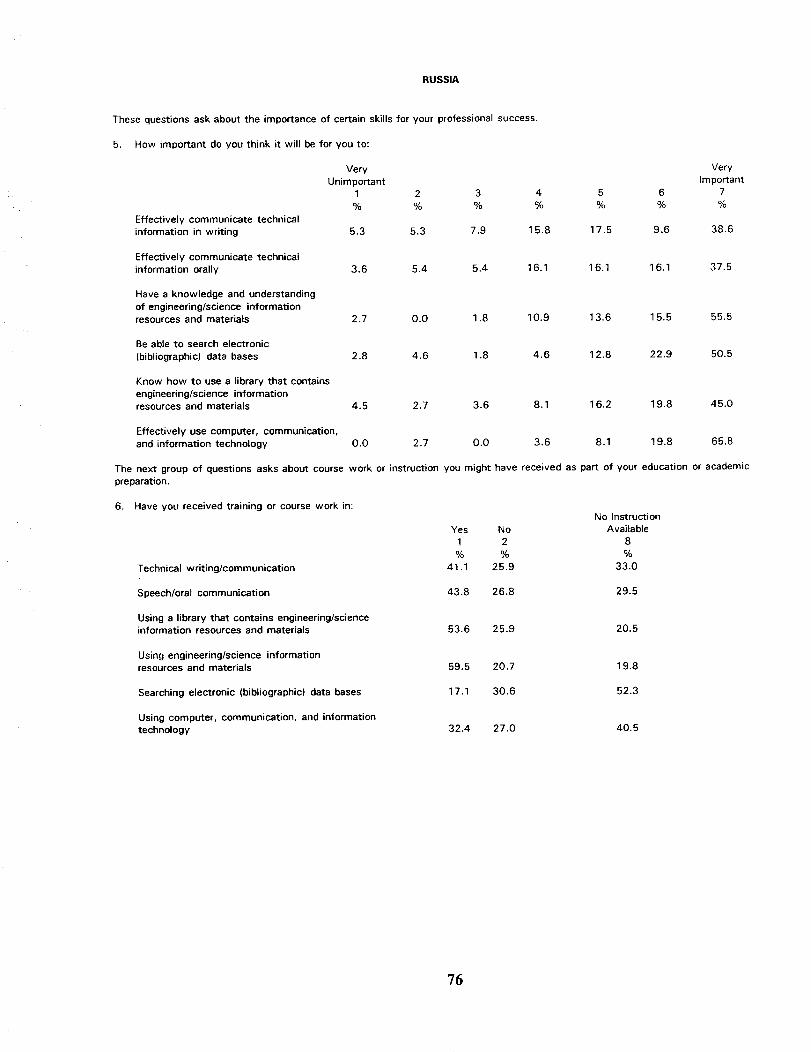
RUSSIA
These questions ask about the importance of certain skills for your professional success.
5. How important do you think it will be for you to:
Effectively communicate technical
information in writing
Effectively communicate technical
information orally
Have a knowledge and understanding
of engineering/science information
resources and materials
Be able to search electronic
(bibliographic) data bases
Know how to use a library that contains
engineering/science informationresources and materials
Effectively use computer, communication,
and information technology
Very Very
Unimportant Important1 2 3 4 5 6 7
% % % % % % %
5.3 5.3 7.9 15.8 17.5 9.6 38.6
3.6 5.4 5.4 16.1 16.1 16.1 37.5
2.7 0.0 1.8 10.9 13.6 15.5 55.5
2.8 4.6 1.8 4.6 12.8 22.9 50.5
4.5 2.7 3.6 8.1 16.2 19.8 45.0
0.0 2.7 0.0 3.6 8.1 19.8 65.8
The next group of questions asks about course work or instruction you might have received as part of your education or academic
• preparation.
6. Have you received training or course work in:
Technical writing/communication
Speech/oral communication
Using a library that contains engineering/science
information resources and materials
Using engineering/science information
resources and materials
Searching electronic (bibliographic) data bases
Using computer, communication, and information
technology
No Instruction
Yes No Available
1 2 8
% % %
41.1 25.9 33.0
43.8 26.8 29.5
53.6 25.9 20.5
59.5 20.7 19.8
17.1 30.6 52.3
32.4 27.0 40.5
76

RUSSIA
7. If you received training or instruction in any of the following, was it helpful?
Not
Helpful1 2 3 4
% % % %
Technical writing/communication 2.9 0.0 0.0 13.7
Speech/oral communication
Using a library that containsengineering/science informationresources and materials
Using engineering/science informationresources and materials
Searching electronic (bibliographic)data bases
Using computer, communication, and
information technology
5%
11.8
Very No
Helpful Training6 7 10
% % %
3.9 13.7 53.9
52.51.0 2.0 6.1 10.1 8.1 8.1 12.1
2.0 1.0 4.0 8.9 8.9 10.9 28.7
1.O 1.0 5.1 8.2 9.2 13.3 29.6
2.0 4.0 2.0 2.0 4.0 5.0 8.9
1.9 1.0 4.8 2.9 4.8 2.9 21.9
35.6
32.7
72.3
60.0
These next questions ask about your preparation of written technical communication as pa'rt of your education or academic preparation.
8. What percentage of your written technical communication involves collaborative writing?
0 percent 33.0%1 through 25 percent 18.1%26 through 50 percent 23.8%
51 through 75 percent 10.1%76 through 99 percent 10.1%
1O0 percent 4.5%
9. If you do write as a member of a group, what percentage of your written technical communication is required to be collaborative?
0 percent 3.6%1 through 25 percent 23.4%
26 through 50 percent 53.6%51 through 75 percent 7.2%
76 through 99 percent 5.4%
1O0 percent 7.1%
10. In general, do you find writing as part of a group more or
Less productive than writing alone 6.5%About as productive as writing alone 22.6%
More productive than writing alone 71.0%
less productive than writing alone?
11. Do you use a computer to prepare written technical communication?
Never 29.7%
Sometimes 43.6%
Frequently 17.8 %Always 8.9%
12. Which of the following best explains your reasons for non-use?
No or limited computer access 73.3%Lack of knowledge/skill using a computer 26.7%
Prefer not to use a computer 6.7%Other 13.3%
??

RUSSIA
13. To what extent does lack of knowledge/skill about each of the following communication principles impede your ability to produce
written technical communication?
Defining the purpose of thecommunication 15.8 2.1 5.3 7.4 14.7 43.2
Assessing the needs of the reader 15.0 11.3 10.0 13.8 18.8 15.0
Preparing/presenting information
in an organized manner 11.7 4.3 7.4 9.6 1 2,8 23.4 30.9
Developing paragraphs (introductions,
transitions, and conclusions) 22.7 9.3 13.4 9.3 10.3 16.5 18.6
Writing grammaticallycorrect sentences 24.5 6.4 11.7 9.6 14.9 13.8 19.1
Notetaking and quoting 23.7 8.6 17.2 14.0 12.9 15.1 8.6
Editing and revising 14.4 8.9 10.0 11.1 1 2.2 15.6 27.8
Does not Greatly
Impede Impedes
1 2 3 4 5 6 7
% % % % % % %
11.6
16.3
These questions ask about your use of electronic/information technologies.
14. Describe your use of the following electronic/information technologies for communicating technical information.
I don't use I don't use
I already it, but may it and doubt
use it in the future if I will
1 2 3
% % %
Audio tapes and cassettes 25.2 27.2 47.6
Motion picture film 19.6 36.3 44.1
Video tape 20.4 58.3 21.4
Desktop/electronic publishing 17.1 62.9 20.0
Computer cassette/cartridge tapes 45.2 46.2 8.7
Electronic mail 4.8 72.1 23.1
Electronic bulletin boards 4.8 66.3 28.8
FAX or TELEX 10.6 68.3 21.2
Electronic data bases 17,6 65.7 16.7
Video conferencing 2.9 56.7 40.4
Computer conferencing 1.0 63.5 35.6
Micrographics & microforms 13.5 49.0 37.5
78

RUSSIA
15. Do you ever use electronic networks?
Yes, I personally use them
Yes, I use them but through an intermediary
No
No, because I do not have access
No, but I may use them in the future
2.8%
17.9%
8.5%
37.7%
33.0%
16. Do you use electronic networks for the following purposes?
To connect to geographically distant sites
For electronic mail
For electronic bulletin boards or conferences
For electronic file transfer
To log into computers for such things as computational
analysis or to use design tools
To control equipment such as laboratory instruments
or machine tools
To access/search the library's catalogue
To order documents from the library
To search electronic (bibliographic) data bases
For information search and data retrieval
To prepare scientific and technical papers with
colleagues at geographically distant sites
Yes No
1 2
% %
15.8 84.2
21.1 78.9
5.3 94.7
78,9 21.1
80.0 20.O
35.0 65.0
47.4 52.6
26.3 73.7
26.3 73.7
50.0 50.0
15.8 84.2
17. Do you exchange electronic messages or files with:
Members of your academic classes
Other people in your academic community at the same
geographic site who are not in your academic classes
Other people in your academic community at a different
geographic site who are not in your academic classes
People outside your academic community
These questions ask about your use of libraries and library services as part of your education.
Yes No
1 2
% %
36.8 63.2
26.3 73.7
15.8 84.2
5.0 95.0
18. During this current school term, about how many times have you used a library to meet your engineering/science information needs?
0 times 24.5%
1 through 25 times 70.4%
26 through 50 times 2.8%
51 through 75 times 0.0%More than 75 times 1.9%
79

RUSSIA
19. During the current school term, how effective was the information obtained from the library for meeting your engineering/science
information needs?
Very Very
Ineffective Effective
1 2 3 4 5 6 7
% % % % % % %
8.9 2.5 3.8 7.6 29.1 15.2 32.9
20. Which of the following statements best describes your reasons for not using a library during this current school term?
Yes No
1 2
% %
65.2 34.8I had no information needs
My information needs were more easily met
some other way 78.3 21.7
Tried the library once or twice before but Icouldn't find the information I needed 54.5 45.5
The library is physically too far away 15.8 84.2
The library staff is not cooperative or helpful 54.5 45.5
The library staff does not understand my
information needs 60.0 40.0
The library did not have the information I need 72.7 27.3
I have my own personal library and do not need
another library 63.6 36.4
The library is too slow in getting the information
I need 31.6 68.4
We have to pay to use the library 0.0 100.0
We are discouraged from using the library 60.0 40.0
21. As part of your academic preparation, have you received or participated in the following library activities?
Library tour
Library presentation as part of academic orientation
Library orientation as part of an engineering/
science course
Library skill/use course (bibliographic instruction)
Library skill/use course in engineering/science
information resources and materials
Library instruction for end-user searching of
electronic (bibliographic) data bases
Not
Yes No Available
1 2 6
% % %
13.0 60.9 26.1
28.7 50.0 21.3
17.2 58.6 24.1
19.1 56.2 24.7
15.6 58.9 25.6
10.0 64.4 25.6
22. Which one of the following best characterizes your use of electronic data bases?
I do all searches myself
I do most searches myself
I do half by myself and half through a librarian
I do most searches through a librarian
I do all searches through a librarian
I do not use electronic data bases
I do not have access to electronic data bases
4.9%
4.9%
1.0%
1.9%
0.0%
14.6%
72.8%
80

RUSSIA
These questions ask about the use and importance of information to engineering/science students.
23. How often during this current school term have you used the following information sources to meet your engineering/science
information needs?
Never Seldom Sometimes Frequently Always
1 2 3 4 5
% % % % %
Your personal collectionof information 4.8 12.4 22.9 25.7 32.4
Other students 5.7 17.9 45.3 21.7 9.4
Faculty members 39.6 25.5 19.8 10.4 2.8
Library 15.1 25.5 21.7 17.0 20.8
Librarian 80.0 11.4 2.9 2.9 1.0
Your personal contacts
within industry 37.7 13.2 17.0 13.2 10.4
Your personal contacts at
government laboratories 39.6 12.3 11.3 12.3 13.2
24. How often during this current school term have you used the following information products to meet your
information needs?
Abstracts
Conference/meeting papers
Journal articles
Handbooks
Textbooks
Computer programs & documentation
Bibliographic, numeric, factualdata bases 58.5
Theses/dissertations 58.5
Technical reports 49.5
Audio/visual materials 53.8
Foreign language technical reports 41.1
Technical translations 35.2
Patents 69.8
Industry technical reports 58.1
Drawings/specifications 37.4
Preprints or deposited manuscripts 53.8
Informal information products (e.g.,
vendor/supply catalogs, company
literature, trade journals/magazines)
Never Seldom Sometimes Frequently Always1 2 3 4 5
% % % % %
67.3 6.7 14.4 -3.8 0.0
66.7 7.6 8.6 4.8 1.0
30.2 25.5 20.8 16.0 5.7
3.7 9.3 23.4 35.5 27,1
5.6 2.8 1 5.0 24.3 51.4
43.4 11,3 11.3 10.4 15.1
10.4 2.8 1.9 1.9
14.2 7.5 2.8 2.8
10.5 16.2 5.7 3.8
9.6 12.5 3,8 1.0
18.7 9.3 7.5 4.7
21,9 16.2 8.6 5.7
5.7 1.9 0.9 0.9
10.5 5.7 5.7 1.9
17.8 13.1 15.0 7.5
10.6 5.8 2,9 0.0
Not
Available
6
%
1.9
0.0
1.9
0.0
1.9
8.5
11.3
engineering/science
Not
Available
6
%
7.7
11.4
1.9
0.9
0.9
8.5
24.5
14.2
14.3
19.2
18.7
12.4
20.8
18.1
9.3
26.9
39.3 19.6 1 5.9 11.2 6.5 7.5
81

RUSSIA
25. How important are the following information sources in meeting your engineering/science information needs?
Very
Unimportant1 2
% %
Your personal collection
of information 7.5 8.4
Other students 6.6 8.5
Faculty members 17.8 15.9
Library 17.0 5,7
Librarian 54,7 17.0
Your personal contacts
within industry 25.2 6.5
Your personal contacts at
government laboratories 22.6 4,7
Very Not
Important Available
3 4 5 6 7 8
% % % % % %
11.2 13.1 13.1 9.3 34.6 2.8
13.2 !9.8 21.7 17.9 10.4 1.9
9.3 10.3 12.1 12.1 15.9 6.5
5.7 10.4 15.1 11.3 33.0 1.9
6.6 4.7 1.9 3.8 1.9 9.4
7.5 11.2 10.3 6.5 14.0 18.7
7.5 7.5 15.1 1.9 17.9 22.6
26. How important are the following information products in meeting your engineering/science information needs?
Abstracts
Conference/meeting papers
Journal articles
Handbooks
Textbooks
Computer programs and
documentation
Bibliographic, numeric,
factual data bases
Theses�dissertations
Technical reports
Audio/visual materials
Foreign language
technical reports
Technical translations
Patents
Industry technical reports
Drawings/specifications
Preprints or deposited
manuscripts
Informal information products
(e.g., vendor/supply
catalogs, company literature,
trade journals/magazines)
Very Very Not
Unimportant Important Available
1 2 3 4 5 6 7 8
% % % % % % % %
40.8 13.6 11.7 5.8 6.8 2.9 4.9 13.6
35.6 13.5 9.6 9.6 5.8 2.9 7.7 15.4
12.5 7.7 10.6 11.5 16.3 1 8.3 21.2 1.9
2.9 1.9 4.8 13.5 16.3 1 6.3 43.3 1.0
4.9 1.9 7.8 7.8 10.7 19.4 47.6 0.0
15.4 12.5 5.8 12.5 7.7 11.5 20.2 14.4
24.3 5.8 9.7 8.7 7.8 4.9 5.8 33.0
25.7 7.9 13.9 12.9 9.9 7.9 5.0 16.8
25.0 2.9 9.6 9,6 13.5 9.6 12.5 17.3
26.7 7.6 9.5 8.6 8.6 6.7 8.(_ 23.8
18.3 8.7 8.7 4.8 9.6 14.4 12.5 23.1
19.6 7.8 13.7 11.8 11.8 14.7 9.8 10.8
27.2 11.7 9.7 7.8 4.9 5.8 7.8 25.2
34.0 9.7 5.8 7.8 7.8 9.7 9.7 15.5
29.8 5,8 6.7 6.7 14.4 12.5 13.5 10.6
31.7 4.0 5.9 11.9 6.9 3.0 4.0 32.7
28.8 15.4 11.5 10.6 13.5 3.8 9.6 6.7
82

RUSSIA
27. Do you use the following technical reports in meeting your engineering/science information needs?
Don't
Have
Yes No Access
1 2 6
% % %
AGARD reports 2.0 20.8 77.2
British ARC and RAE reports 4.0 19.8 76.2
Dutch NLR reports 2.0 19.8 78.2
ESA reports 11.9 17,8 70.3
French ONERA reports 4.0 17.8 78.2
German DFVLR, DLR, and MBB reports 4.0 18.0 78.0
Japanese NAL reports 3.0 19.8 77.2
Russian TsAGI reports 47.1 29.8 23.1
U.S. NASA reports 21.6 16.7 61.8
28. Think of the most technically challenging assignment you have worked on this current school term. What steps did you follow to
obtain the information you needed to complete this assignment?
Did Not
Step Step Use
1 2 3 4 5 6 7 0
% % % % % % % %
Used my personal store oftechnical information 45.7 19.1 11.7 8.5 1.1 0.0 3.2 10.6
Spoke with other students 19.8 37.5 13.5 8.3 4.2 1.0 , 1.0 14.6
Spoke with faculty members 23.2 17.9 22.1 10.5 4.2 1.1 0.0 21.1
Used literature resources 2.1 10.5 14.7 17.9 2.1 3.2 1.1 48.4
Spoke with a librarian 0.0 2.3 0.0 2.3 1.1 1.1 0.0 93.1
Used literature resources
found in a library 2.2 8.6 20.4 17.2 12.9 3.2 1.1 34,4
Searched an electronic
database in the library 0.0 1,3 0,0 0.0 0.0 0.0 0.0 98.7
Used none of the above steps 0.0 ........................ 100,0
These questions will be used to determine whether students with different backgrounds and from different countries have different
technical communication practices.
29. What is your gender?
Female 13.0%
Male 87.0%
30. What is your area of study/major?
EngineerScientist
Other
89.2%
6.9%
3,9%
83

RUSSIA
31. What course are you studying? (special classes)
Lower classes 39.0%
Advanced classes 61.0%
32. What is your native language?
Russian 100.0%
33. What is your native country?
Russia 100.0%
34. Are you a citizen of the country where you are attending school?
Yes 94.4%
No 5.6%
35. How well do you read the following languages?
Passably Fluently
1 2 3 4 5
% % % % %
English 12.3 11.3 27.4 21.7 8.5French 12.9 3.0 4.0 2.0 2.0
German 10.9 3.0 7.9 4.0 3.0
Japanese 6.1 1.0 1.0 0.0 3.1Russian 1.9 0.0 0.0 0.0 93.3
Other 0.9 0.0 0.0 0.0 O.O
36. How well do you speak the following languages?
Passably Fluently
1 2 3 4 5
% % % % %
English 20.6 11.2 27.1 14.0 5.6French 11.8 5.9 2.9 1 .O 2.O
German 9.8 4.9 3.9 3.9 2.9
Japanese 6.1 3.0 0.0 0.0 2.0Russian 1.9 0.0 0.O 0.9 91.5
Other 0.9 0.0 0.0 0.0 0.0
Do not
read this
language6
%
18.9
76.2
71.3
88.8
4.8
99.1
Do not
speak this
language6
%
21.5
76.5
74.5
88.9
5.7
99.1
84

RUSSIA
37. In terms of your career goals and aspirations, how important will it be for you to be bilingual?
Very Very Am Not
Unimportant Important Bilingual1 2 3 4 5 6 7 8
% % % % % % % %
1.9 0.0 1.9 5.8 7.7 17.3 48.1 12.5
Don't
Know
9
%
4.8
38. In what type of organization do you hope to work after graduation?
Academic 8.5%
Government 23.9%
Industry (national) 1 7.9%
Industry (multi-national) 23.9%
Not for profit 2.6%
Other 1 6.2%
39. When you were growing up, do you think your family's income was:
Much more than most families in your native country
More than most families in your native country
About equal to the average family incomes in your native country
Lower than most families in your native country
Much less than most families in your native country
I cannot compare my family's income with other families
40. Do you own a personal computer?
6.7%
8..6%
68.6%
11.4%
1.9%
2.9%
Yes 11.4%
No 88.6%
41. As a high school student, how often did you use your:
42.
Not
Never Seldom Sometimes Frequently Always Available1 2 3 4 5 6
% % % % % %
High school library 8.9 17.8 31.7 21.8 17.8 2.0
Public library 17.3 23.1 27.9 21.2 7.7 2.9
As an aerospace engineering/science major, about how many hours a week (exclusive of classroom and course assignments) do
you spend reading the professional literature associated with your discipline?
0 hours 7.2%
1 through 5 hours 38.1%
6 through 10 hours 25.8%
11 through 25 hours 1 6.5%
More than 25 hours 12.4%
43. Are you a member of a professional student (national) engineering, scientific, or technical society?
Yes 15.5%
No 84.5%
85

REPORT DOCUMENTATION PAGE Fo,'m_prov_OMB No. 0704-0188
Public reporting burden for this collention of information is estimated to average 1 hour per response, including the time for reviewing instructions, searching existing data sources,gathering and maintaining the data needed, and completing and reviewing the collection of information Send comments regarding this burden estimate or any other aspect of thiscellection of information, including suggestions for reducing _is burden, to Washington Headquarters Services. Directorate for Information Operations and Reports, 1215 JeffersonDavis Highway, Suite 1204, Arlington, VA 22202-4302, and to the Office of Management and Budget, Paperw_k Reduction Project (0704-0188), Washington, DC 20503.
1. AGENCY USE ONLY (Leave blank) 12. REPORT DATE
December 1994
4. TITLE AND SUBTITLE
The Technical Communication Practices of Aerospace Engineering andScience Students: Results of the Phase 4 Cross-National Surveys*
AUTHOR(S)
Thomas E. Pinelii, Laura M. Hecht, Rebecca O. Barclay, andJohn M. Kennedy
7. PERFORMINGORGANZATIONNAME(S)ANDADDRESS(ES)
NASA Langley Research CenterHampton, VA 23681-0001
9. SPONSORIING/MONITORINGAGENCYNAME(S)ANDADDRESS(ES)
National Aeronautics and Space AdministrationWashington, DC 20546-0001
i3. REPORT TYPE AND DATES COVERED
Technical Memorandum
5. FUNDING NUMBERS
WU 505-90
8. PERFORMING ORGANIZATION
REPORT NUMBER
10. SPONSORING/MONITORINGAGENCY REPORT NUMBER
NASA TM-109123
11. SUPPLEMENTARY NOTES
*Report number 28 under the NASA/DoD Aerospace Knowledge Diffusion Research Project. Thomas E. Pinelli:Langley Research Center, Hampton, VA; Laura M. Hecht: Indiana University, Bloomington, IN; Rebecca O.Barclay: Rensselaer Polytechnic Institute, Troy, NY; John M. Kennedy: Indiana University, Bloomington, IN.
12a. DISTRIBUTION/AVAILABlU'rY STATEMENT
Unclassified--Unlimited
Subject Category 82Availability: NASA CASI (301) 621-0390
12b. DISTRIBUTION CODE
13. ABSTRACT (Maximum 200 words)
This report describes similarities and differences between undergraduate and graduate aerospace engineering andscience students in the context of two general aspects of the educational experience. First, we explore the extent towhich students differ regarding the factors that lead to the choice of becoming an aerospace engineer or a scientist,current satisfaction with that choice, and career-related goals and objectives. Second, we look at the technicalcommunication skills, practices, habits, and training of aerospace engineering and science students. The reporteddata were obtained from a survey of students enrolled in aerospace engineering and science programs atuniversities in India, Japan, Russia, and the United Kingdom. The surveys were undertaken as part of the NASA/DoD Aerospace Knowledge Diffusion Research Project. Data are reported for the following categories: studentdemographics; skill importance, skill training, and skill helpfulness; collaborative writing; computer andinformation technology use and importance, use of electronic networks; use and importance of libraries and libraryservices; use and importance of information sources and products; use of foreign language technical reports; andforeign language (reading and speaking) skills.
14. SUBJECTTERMSKnowledge diffusion; Aerospace engineering and science students; Computer andinformation technology use; and Library use and importance
17. SECURITY CLASSIFICATION
OF REPORT
Unclassified
NSN 7540-01-280-5500
18. SECURITY CLASSIFICATION
OF THIS PAGE
Unclassified
19. SECURITY CLASSIFICATION
OF ABSTRACT
Unclassified
15. NUMBER OF PAGES
8616. PRICE CODE
A05
20. LIMITATION
OF ABSTRACT
Standard Form 298 (Rev. 2-89)
Prescribed by ANSI Std Z39-18298-102


![NASA - [Aerospace History 23] - The Eclipse Project.pdf](https://static.fdocuments.net/doc/165x107/55cf8d1e5503462b139235cf/nasa-aerospace-history-23-the-eclipse-projectpdf.jpg)
