NASA TECHNICAL NOTE NASA TN D-47'82 TECHNICAL NOTE N 00 hP m z c 4 VJ 4 z NASA TN D-47'82 c_ __....
33
- NASA TECHNICAL NOTE N 00 h P m z c 4 VJ 4 z NASA TN D-47'82 c_ __.- ci, j LUAN COPY: RETUR AFWL (WLIL-2) K IRTLAND AFB, M'd ULTRASONIC DETECTION AND MEASUREMENT OF FATIGUE CRACKS I N NOTCHED SPECIMENS by Stanley J. KZima a n d John C. Freche Leuis Resemch Center CZeveZand, Ohio N AT I o N A L AERONA UTI cs AND SPACE ADMINISTRATION WASHINGTON, D. C. SEPTEMBER 1968 i ,/ I https://ntrs.nasa.gov/search.jsp?R=19680025599 2019-05-24T20:07:12+00:00Z
Transcript of NASA TECHNICAL NOTE NASA TN D-47'82 TECHNICAL NOTE N 00 hP m z c 4 VJ 4 z NASA TN D-47'82 c_ __....

-- NASA TECHNICAL NOTE
N 00 hP m z c 4 VJ 4 z
N A S A T N D-47'82 c_ __.
ci,j
L UAN COPY: RETUR AFWL (WLIL-2)
KIRTLAND AFB, M'd
ULTRASONIC DETECTION A N D MEASUREMENT OF FATIGUE CRACKS I N NOTCHED SPECIMENS
by StanleyJ. KZima and John C. Freche
Leuis Resemch Center CZeveZand, Ohio
NAT Io N A L A E R O NA UTI cs A N D SPACE A D M I N I S T R A T I O N W A S H I N G T O N , D. C. SEPTEMBER 1 9 6 8 i,/ I
https://ntrs.nasa.gov/search.jsp?R=19680025599 2019-05-24T20:07:12+00:00Z

ERRATA
NASA Technical Note D-4782
ULTRASONIC DETECTION AND MEASUREMENT OF
FATIGUE CRACKS IN NOTCHED SPECIMENS
by Stanley J. Klima and John C. Freche
September 1968
Page 4, figure 2: The value for radius in millimeters should be 0. 250 instead of 0.025.
Pages 16 and 17, figure 5: The values for crack depth in millimeters in the curve labels should read as follows: 5(a), 0. 028 to 0.051; 5(b), 0.013 to 0. 104; 5(c), 0.025 to 0. 064; 5(d), 0. 66 to 0. 107; 5(e), 0.036 to 0. 102.
Page 16, figure 5(c): The values for crack depth in millimeters in the key should read 0.28, .51, .66.
NASA-Langley Issued 11-29-68
TECH LIBRARY KAFB. NM
013L395 - NASA TN D-4782
V' J P - -
ULTRASONIC DETECTION AND MEASUREMENT O F FATIGUE
CRACKS IN NOTCHED SPECIMENS d' -/--- 7 Y'
By Stanley J.f.Klima and John C:' Freche-,
Lewis Research Center Cleveland, Ohio
NATIONAL AERONAUTICS AND SPACE A D M V
For sale by the Clearinghouse for Federal Scientific and Technical Information Springfield, Virginia 22151 - C F S T I price $3.00
I

ABSTRACT
An ultrasonic technique was developed and used to observe the formation and growth of fatigue cracks in notched cylindrical specimens subjected to reversed axial fatigue loading. Fatigue curves showing cycles to initially detectable cracks as well as cycles to fracture were obtained for an aluminum-, a titanium-, and a cobalt-base alloy and for a maraging steel. Depth of initially detectable cracks ranged between approximately 0.0005 and 0.004 in. (0.013 and 0. 10 mm). Also obtained were curves relating ultrasonic system output voltage to crack depths up to 0.030 in. (0.76 mm) for three materials. These curves were used to demonstrate the capability of the device for monitoring crack growth.
ii
_ . .. .
ULTRASONIC DITECTION AND MEASUREMENT OF FATIGUE
CRACKS IN NOTCHED SPECIMENS*
by Stanley J. Klima and John C. Freche
Lewis Research Center
SUMMARY
An ultrasonic technique was developed and used to observe the formation and growth of fatigue cracks in notched cylindrical specimens subjected to reversed axial fatigue loading. Fatigue curves showing cycles to initially detectable cracks as well as cycles to f racture were obtained for an aluminum-, a titanium-, and a cobalt-base alloy and for a maraging steel. Curves relating system output voltage to crack depths up to about 0.030 inch (0.76 mm) were also obtained for three of the materials. The latter curves were used to demonstrate the capability of the device for monitoring fatigue crack growth.
The reflection method was used while the test was in progress to detect initial fatigue cracks, which ranged in depth from approximately 0.0005 to 0.004 inch (0.013and 0.10 mm) for the materials used. The cracks generally extended around the entire specimen circumference and were formed within approximately 10 to 40 percent of life to fracture, depending on material and cyclic s t ress . Curves of system output voltage versus crack depth for a given material were virtually the same regardless of cyclic stress level, but were different for different materials.
Fatigue cracks were generally transgranular for all materials. At stresses well above the fatigue limit, the fatigue macrocrack front advanced uniformly around the specimen circumference until a point of rapidly accelerated crack growth was reached. At lower stresses, near the fatigue limit of the notched specimen, the crack that caused fracture usually propagated from one side of the specimen.
* To be presented in par t at SESA Fall Meeting, San Francisco, Calif. , Oct. 28-Nov. 1, 1968.
INTRODUCTION
Fatigue involves the processes of crack initiation and propagation prior to fracture. Any method that can be used to detect small fatigue cracks nondestructively during the course of a fatigue test would be extremely useful as a research test tool. If the method could also be used to monitor fatigue crack growth, its usefulness would be even greater.
Methods for the detection of fatigue cracks are presently available. Generally, however, the use of each presents associated difficulties that a r e more or less severe, depending on the intended application. For example, when commonly used inspection methods, such as penetrating-liquid, magnetic-particle, and radiographic techniques, are applied to fatigue specimens, all require interruption of the fatigue test. Additional limitations a r e that the penetrating-liquid and magnetic-particle techniques can only be used to detect cracks at or near the surface and that X-ray techniques pose problems of safety and interpretation. Optical microscopy is probably the most positive means of measuring the s ize of fatigue cracks, but this method requires highly polished surfaces and generally involves terminating the tes t and sectioning the specimen before examination. A recent preliminary investigation (ref. 1) utilized microwave methods to detect machined grooves approximately 0.0001 inch (0.0025 mm) deep and 0 .8 inch (20.3 mm) long in the surface of an untested specimen. The investigators predicted that further development of the technique should permit the detection of even smaller cracks; however, they did not demonstrate the applicability of the technique to specimens while they were undergoing a fatigue test .
In order to detect fatigue cracks in a variety of materials accurately and without interruption of the fatigue test, an ultrasonic method was applied in a previous investigation (ref. 2) for the ear ly detection of fatigue cracks in center-notched sheet specimens. In that initial investigation, the reflection technique was used, and fatigue cracks ranging in length from 0.0005 to 0.005 inch (0.013 to 0. 13 mm) were detected while the tests were in progress. Another investigator (ref. 3) used ultrasonic surface waves to detect su r face flaws in bending fatigue specimens, but crack s izes were not determined. Still others (ref. 4) have applied ultrasonic inspection techniques to detect cracks 0. 003 to 0.004 inch (0.08 to 0. 10 mm) long in thin (0.039 in.) (1.0 mm) center-notched s teel sheet specimens that were tested in axial fatigue.
The ear l ier investigation (ref. 2) was limited to axial tension fatigue tests of sheet specimens, and the transducer design was therefore tailored for application to sheet specimens. In the present investigation, the transducer design was altered to permit application of the ultrasonic method to cylindrical (notched) specimens subjected to reversed axial fatigue loading. The reflection technique was employed during the test to detect fatigue cracks in 2014-T6 aluminum, 5 aluminum (A1)-2.5 tin(Sn)-titanium (Ti), a 300 grade maraging steel, and a cobalt-base alloy L-605. Fatigue curves were obtained
2
--
showing cycles to initially detectable cracks and cycles to fracture. Some specimens were removed from test, sectioned, and examined optically to relate crack length to system output voltage. The device was calibrated in te rms of output voltage as a function of crack depth for three materials over a range of stresses.
PRINCIPLES OF CRACK DETECTION BY ULTRASONIC
REFLECTION TECHNIQUE
The principles of ultrasonic wave propagation are described in detail in references 5 to 7. This section briefly reviews the theory involved in applying the reflection technique to the detection of fatigue cracks. The technique is s imilar to the use of radar in the detection of distant objects. Acoustic energy, in the form of high-frequency waves, is transmitted from a transducer into the test specimen. After transmission of each pulse of energy, the transducer acts as a receiver for energy reflected from any discontinuity in the specimen. The metal-air interface of a fatigue crack constitutes such a discontinuity. The low density of air and the relatively low velocity of ultrasonic waves in air result in an acoustic mismatch that causes the reflection of incident ultrasonic waves. The amount of energy reflected from a crack is directly related to the crack area, the intensity of the incident ultrasonic wave, and the orientation of the crack. In this report, crack s ize is discussed in te rms of the average depth of penetration around the entire circumference of the notched cylindrical specimen.
SYSTEM DESIGN AND OPERATION
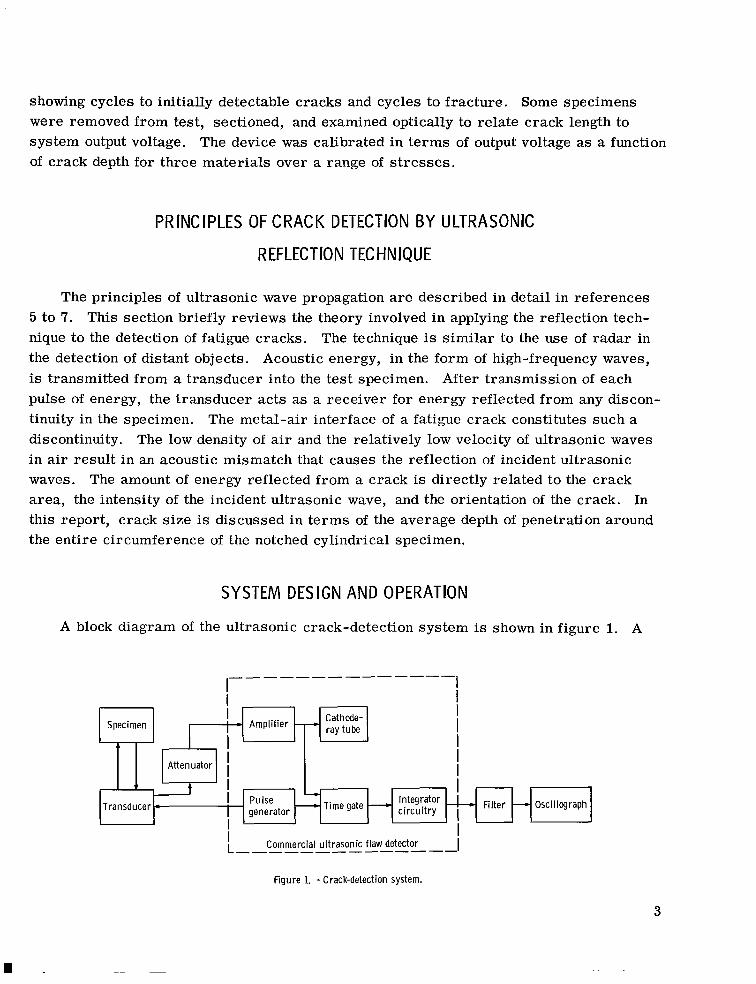
A block diagram of the ultrasonic crack-detection system is shown in figure 1. A
I I
Transducer = Fi l ter -Oscillograph
I Commercial ultrasonic flaw detector iL____---_----Figure 1. - Crack-detection system.
3
I I m . I. ,111 I. .111 I , . ....._.. ... . .., , ,
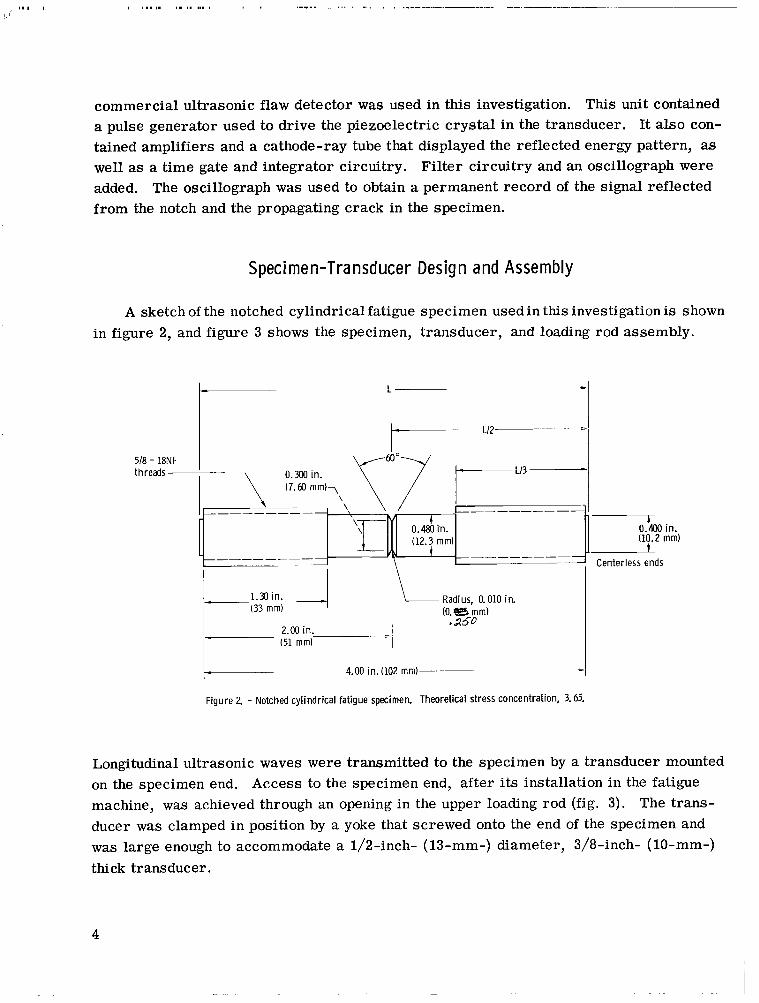
commercial ultrasonic flaw detector was used in this investigation. This unit contained a pulse generator used to drive the piezoelectric crystal in the transducer. It a lso contained amplifiers and a cathode-ray tube that displayed the reflected energy pattern, as well as a time gate and integrator circuitry. Filter circuitry and an oscillograph were added. The oscillograph was used to obtain a permanent record of the signal reflected from the notch and the propagating crack in the specimen.
Specimen-Transducer Design and Assembly
A sketch of the notched cylindrical fatigue specimen used in this investigation is shown in figure 2, and figure 3 shows the specimen, transducer, and loading rod assembly.
518 - 18NF threads
1
Centerless ends
1.Nin. _I -Radius, 0.010 in. (33 mm) (0.- mm)
a a502.00 in. (51 mm)
-
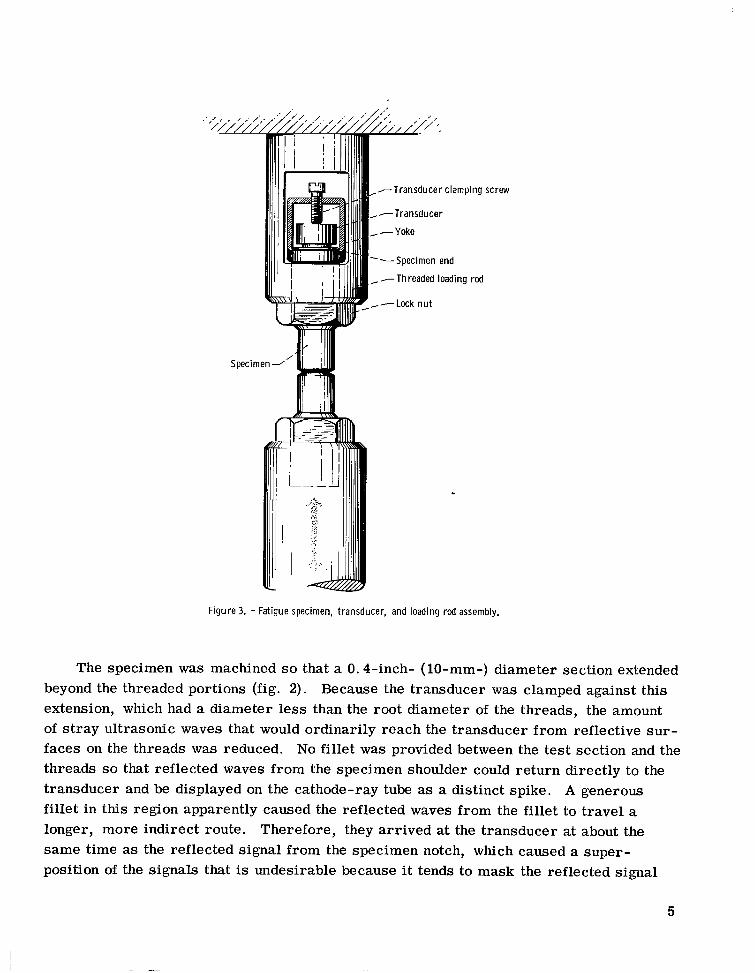
Longitudinal ultrasonic waves were transmitted to the specimen by a transducer mounted on the specimen end. Access to the specimen end, after its installation in the fatigue machine, was achieved through an opening in the upper loading rod (fig. 3). The transducer was clamped in position by a yoke that screwed onto the end of the specimen and was large enough to accommodate a 1/2-inch- (13-mm-) diameter, 3/8-inch- (lo-"-) thick transducer.
4
.---Transducer clamping sc:rew
.-Transducer
yoke
---Specimen end
- -Threaded loading rod
....p--Lock nut
Figure 3. - Fatigue specimen, transducer, and loading rod assembly.
The specimen was machined so that a 0.4-inch- (lo-"-) diameter section extended beyond the threaded portions (fig. 2). Because the transducer was clamped against this extension, which had a diameter less than the root diameter of the threads, the amount of s t ray ultrasonic waves that would ordinarily reach the transducer from reflective su r faces on the threads was reduced. No fillet was provided between the test section and the threads so that reflected waves from the specimen shoulder could return directly to the transducer and be displayed on the cathode-ray tube as a distinct spike. A generous fillet in this region apparently caused the reflected waves from the fillet to travel a longer, more indirect route. Therefore, they arrived at the transducer at about the same time as the reflected signal from the specimen notch, which caused a superposition of the signals that is undesirable because i t tends to mask the reflected signal
5
f rom the specimen notch. For the same reason it was necessary to position the specimen notch so that its distance from the transducer was not a multiple of the distance between any other strongly reflective surface and the transducer. Thus, secondary re flections caused by waves bouncing back and forth between the end of the specimen adjacent to the transducer and discontinuities such as the shoulder were not superimposed on the signal from the notch.
A coupling medium between the transducer and the fatigue specimen was provided to eliminate air from the interface and to allow the efficient transmission of ultrasonic energy. A mineral oil-calcium soap grease was used, but a wide choice of petroleum or silicone lubricants would probably be satisfactory. The specimen ends were polished with 600 grit abrasive paper to obtain a smooth flat surface and ensure a good fit between the transducer and the specimen.
Transducer Character ist ics
A transducer frequency of 7 .0 megahertz was chosen for this investigation. Theoretically, higher frequency transducers, because of their associated short wavelength, a r e sensitive to smaller flaws than a r e low-frequency (long wavelength) transducers. However, energy losses by attenuation a r e greater with short wavelengths than with long wavelengths. Therefore, a desirable compromise is to choose as high a frequency as possible without incurring excessive attenuation losses. Generally, this choice must be made experimentally.
Determination of the optimum frequency for a particular application can be hampered by apparent differences in energy levels produced by different transducers. In this investigation, for example, pairs of ?. 0-megahertz transducers were purchased from the same manufacturer on three different occasions (a pair at a time). Each pair provided a different level of reflected energy from the notch of the fatigue specimen. The pair that was the most sensitive in obtaining reflections from the specimen notch was used for the tests. A pair of 10.0-megahertz transducers purchased from the same supplier had approximately the same sensitivity as the least sensitive pair of 7. 0-megahertz transducers. This difference points out a difficulty likely to be encountered by investigators while selecting the proper transducer for a particular experiment.
Operation of System Elect r onics
Ultrasonic pulses were transmitted at the rate of 500 per second with a pulse time of about 1microsecond. Because a typical velocity for longitudinal waves in the specimens
6

used in this investigation was about 0 .2 inch (5 mm) per microsecond, sufficient time was available between pulses for all reflected signals to re turn to the drive crystal. These reflected pulses were reconverted to electrical signals by the transducer, amplified, and displayed on the cathode-ray tube.
The commercial ultrasonic equipment included a time gate and an integrator circuit (fig. 1). The gate allowed only the reflected signals occurring within a preselected time interval after each transmitted pulse to pass through to the integrator circuitry. Because the distance traveled by an ultrasonic pulse is proportional to time, the time gate may be interpreted as a "propagation-distance" gate. The output of the amplifier was gated for the specimen position at which fatigue cracking was expected to occur. Extraneous r e flections from the specimen-transducer interface and from within the specimen were blocked by this gate.
The integrator circuitry provided a dc voltage proportional to the signal that passed through the time gate. After minor fluctuations in the integrator output were removed by the filter, the resulting dc voltage was recorded on an oscillograph. Changes in the recorded voltages were proportional to changes in the amount of ultrasonic energy received.
MATERIALS AND FATIGUE-TEST PROCEDURE
Speci me n Materials
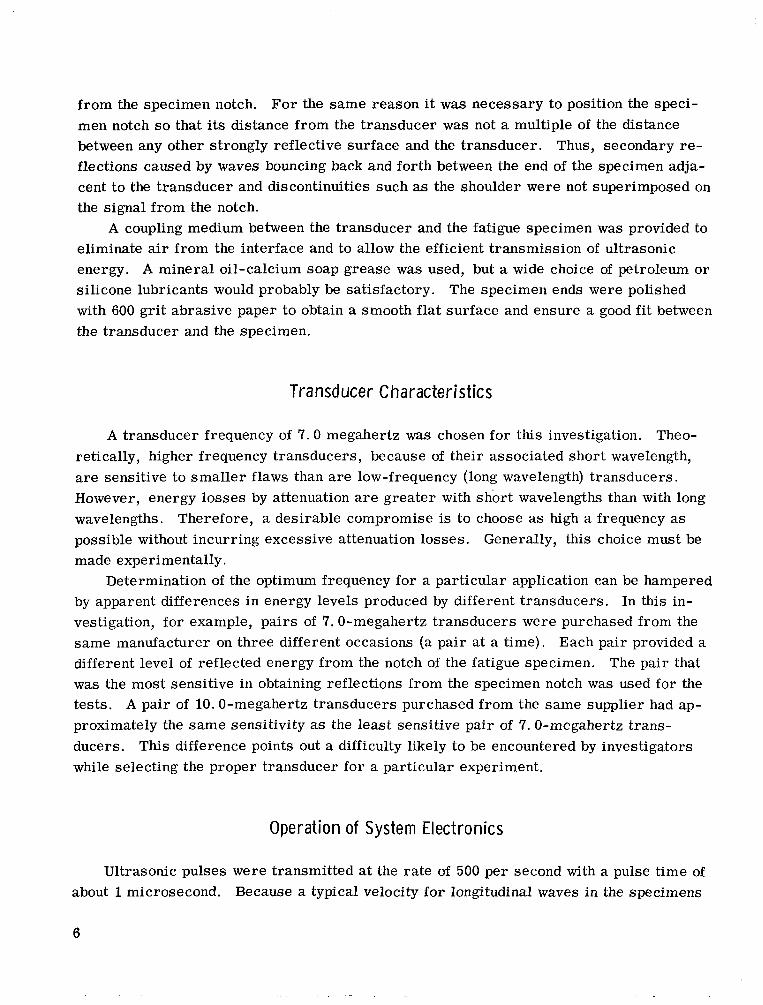
Specimens (fig. 2) were machined from 3/4-inch- (19-mm-) bar stock of four alloys - 2014-T6 aluminum, 5 aluminum (A1)-2. 5 tin (Sn)-titanium (Ti), a maraging &eel, and a cobalt-base alloy, L-605. The nominal composition of the alloys is given in table I. The condition of these materials and their tensile strengths obtained with the specimens used in this investigation are listed in table 11. All test specimens contained a circumferential notch having a theoretical s t r e s s concentration Kt of 3. 65 (ref. 8). The root of the notch was polished with a rotating 10-mil-diameter wire impregnated with abrasive to remove circumferential machining marks. Stress values were calculated on the basis of the minimum cross-sectional area bounded by the notch root. The maraging steel was tested in both the aged and the as-received conditions to determine the difference in response of the ultrasonic method to a material with the same composition but with different mechanical properties.
7
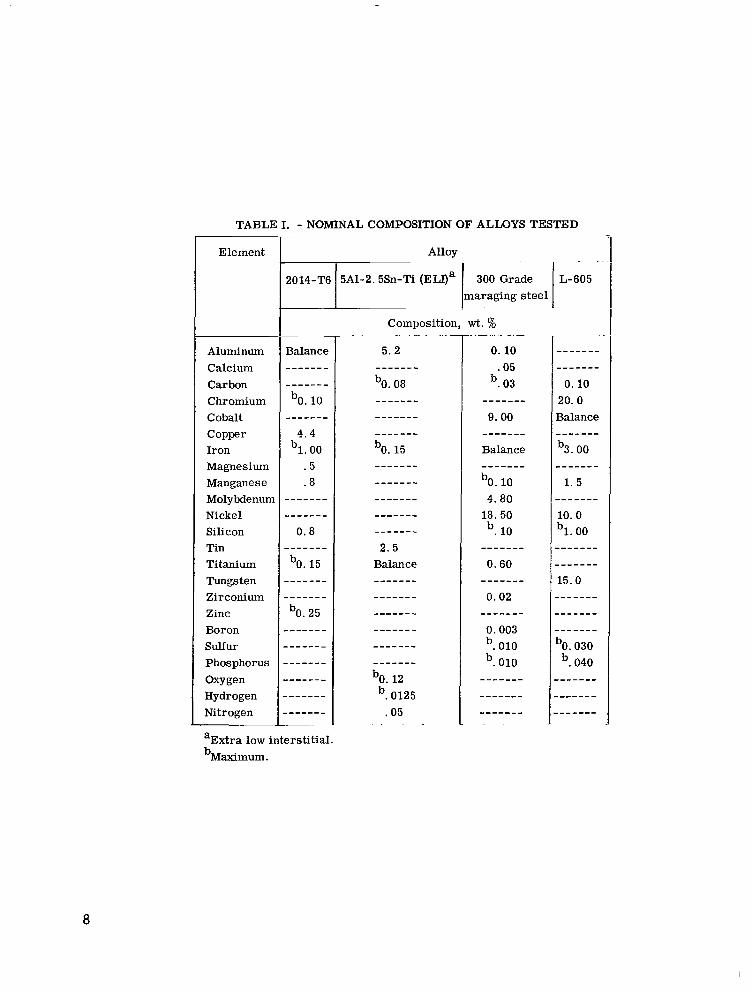
TABLE I. - NOMINAL COMPOSITION OF ALLOYS TESTED
Element Alloy . .
2014-T6 5A1-2.5Sn-Ti ( E a a I 300 Grade 1 L-605 lmaraging s teel 1-r
~ 4 .
Composition, wt. ’%
Aluminum Calcium Carbon Chromium Cobalt Copper Iron Magnesium Manganese Molybdenum Nickel Silicon Tin Titanium Tungsten Zirconium Zinc Boron Sul fur Phosphorus
Oxygen Hydrogen Nitrogen
aExtra low interstitial. ’Maximum.
8

TABLE IT. - TENSILE STRENGTH AND CONDITION OF ALLOYS TESTED
Material
2014-T6 Aluminum
5A1-2.5Sn-Ti
Maraging steel
Maraging steel
I Cobalt-base alloy L-605
Condition
T6 (artificially aged)
Annealed (as-received); Rockwell-C hardness, 30 to 33
Solution annealed at 1500' F (1088 K) for 3/4 h r and air cooled; aged at 900' F (756 K) for 3 hr and air cooled
Solution annealed at 1500' F (1088 K) for 3/4 hr and air cooled (asreceived)
Solution treated (as-received)
Fatigue Tests
Tensile strength of notched specimens
psi
97 400 672
213 400 1471
413 700 2852
253 500 1748
166 500 1148
Specimens were placed in a hydraulically actuated axial fatigue machine and subjected to reversed loading applied in a sinusodial pattern. The frequency of the load application varied between 0 .3 and 1 . 2 hertz, depending on the expected fatigue life to fracture. All tests were conducted in air at ambient temperatures.
Detection of I n i t i a l Cracks by Ultrasonic Method
The depth of cracks initially detectable by the ultrasonic reflection technique was less than 0.005 inch (0.13 mm) for all the materials considered. The transducer was positioned at one end of the specimen, and longitudinal waves traveled along the entire specimen length. The reflections of these waves from the notch were observed as a spike on the cathode-ray tube. The same reflected signal, after passing through the time gate, was also recorded on an oscillograph (fig. 1). The amplifier suppression (dc bias) was adjusted to reduce the notch signal to an output level so that an oscillograph recording at the start of the test was made near the middle of the chart, which left room to record either a decreasing o r an increasing signal.
9

m 0
0
m YI
V 8
1.Ultrasonic waves
I(a) Unloaded specimen. -U l t ra - (b) Cracked specimen in coh- (c) Cracked sDecimen in tension. Fewer
-=I none reflected by crack.
n5 Unloaded (y specimen ~
Recorded output voltage when m \ specimen at peak compres r> E-_-- \rr---------____ ___..-8
m B 2 /
/
Cracking starts r specimen at peak tensi le load-'Applied load cycles
(d) Level of output voltage at peak load application.
F
Figure 4. - Schematic i l lus t ra t ion of recorded output voltage and effects of cycl ic loading and crack formation. (ac < a0 ("9
Figure 4 schematically illustrates how the recorded output voltage was affected by an applied cyclic load as well as by crack formation and crack growth during the early part of a fatigue test of the particular specimen used in this investigation. The direction of the increasing reflected signal received by the transducer is toward the top of figure 4(d). The dashed line EF represents the level of output voltage recorded whenever the peak compressive load was applied to the specimen. The solid line ABCD represents the level of output voltage recorded whenever the peak tensile load was applied. Note that the solid line first decreases and then increases with an increasing number of applied load cycles. Because the output voltage at peak tensile load is of primary interest for the detection of cracks, this curve is discussed in detail.
A sketch of a longitudinal section in the region of the specimen notch at no-load condition prior to the fatigue test is shown in figure 4(a). The angle between the notch sur face nearest the transducer and a plane perpendicular to the direction of the ultrasonic waves is designated a0. The ultrasonic waves reflected from the notch, before the load is applied, provide an output voltage level that is about midway between points A and E on the two output voltage curves. Whenever the peak compressive load is applied, the
10
notch angle is reduced to aC(fig. 4(b)). Thus, the notch surface from which the incident waves are reflected becomes more nearly perpendicular to the direction of the incident ultrasonic waves, and the result is increased reflected energy over the no-load condition. The voltage level at the peak compressive load remains constant, even when cracks first appear, because the crack surfaces are so tightly squeezed together that transmission of ultrasonic waves across the interface is permitted. When the tensile load is applied, the notch angle is increased to some value greater than cyo and the output voltage level is correspondingly reduced from the no-load condition. As long as no cracks form, the output voltage at peak tensile load remains constant, as shown in the region A to B (fig. 4(d)). When tiny cracks (too small to reflect a significant amount of ultrasonic energy) form in the notch root, the notch angle apparently is further increased and probably causes the level of the reflected ultrasonic energy to be progressively reduced (region from B to C). The initial decrease in output voltage, point B, can therefore be used as an indication of initial cracking in the specimen. The voltage level used in this investigation as an indication of initial cracking was higher than point C but considerably lower than that of point B. Thus, by arbitrari ly choosing a smaller voltage decrease it is probable that smaller cracks could be detected with this apparatus. It should be emphasized that the only requirement to establish the presence of a crack is that the decrease in output voltage from point B exceed the minor fluctuations inherent in the instrumentation.
Continued crack growth results in (1) a decreased amount of reflected energy from the notch and (2) an increasing amount of reflected energy from the crack itself, and thus influences the recorded net output voltage. When point C is reached (fig. 4(d)), the crack surface a rea is large enough to reflect sufficient ultrasonic energy to overcome the effects of the increased angle cyt (fig. 4(c)), and the recorded output voltage increases (in a nonlinear fashion) until the specimen fractures.
Measurement of Large Cracks by Ultrasonic Method
The ultrasonic device was also used to measure cracks between 0.005 and 0.030 inch (0. 13 and 0.76 mm) deep. This measurement was accomplished with only one change made in the system; an attenuation unit was inserted between the transducer and the reflected signal input to the amplifier (fig. 1). The attenuation was variable from 0 to 42 decibels, and it permitted a ratio to be obtained between any two levels of reflected ultrasonic energy from the fatigue crack. The manner of obtaining this ratio can be illustrated by using the schematic output voltage t race of figure 4(d). In any test, the value of the lowest output voltage (point C) was arbitrari ly designated as the reference for all subsequent output voltage readings and was given a unit designation Inserting sufficient attenuation
11
I I 1111111111111II1 I I IllIIIII
brought the level of any subsequent recorded output voltage back to unity (i.e . , the level recorded at point C). The number of decibels required to achieve this result was noted. The ratio of output voltage to the reference voltage was determined by reference to a table provided by the manufacturer of the attenuator. Stopping the fatigue test, breaking the specimen, and then optically measuring the s ize of the fatigue crack corresponding to this rat io permitted the establishment of a relation between the crack depth or crack area and the normalized output voltage. When this procedure was repeated for several different crack depths and corresponding output voltage levels, a calibration curve for a given material was obtained. Such calibration curves may be used in subsequent tests of the particular material and specimen geometry to measure crack size without interruption of the fatigue test.
Optical Crack Measurement for Cal ibrat ion Purposes
Upon first detection of a crack, some specimens were removed from the fatigue machine and sectioned longitudinally for microscopic examination. The sections were polished and etched to better define the crack. The image of the area containing the crack was projected on a metallograph screen at a magnification of 500, and the crack image was measured to the nearest 0.010 inch (to the nearest 0.00002 in. or 0.0005 mm of actual crack depth). Four crack-depth measurements were made on each specimen at points 90' apart, and the average was used.
For the measurement of deeper cracks (up to 0.030 in. or 0.16 mm), specimens were first broken in tension, and the depth of the fatigue-crack portion was measured at a magnification of 10 with the use of a graduated eyepiece. The reported crack depths represent the average of 12 readings evenly spaced around the circumference of each specimen. If no crack existed at a particular measuring point, a crack length of zero was assigned to that reading s o that all 12 points would be included in the calculated average depth. This procedure was rarely necessary because in most cases, the crack front progressed uniformly around the specimen circumference.
RESULTS AND DISCUSSION
Fatigue Data
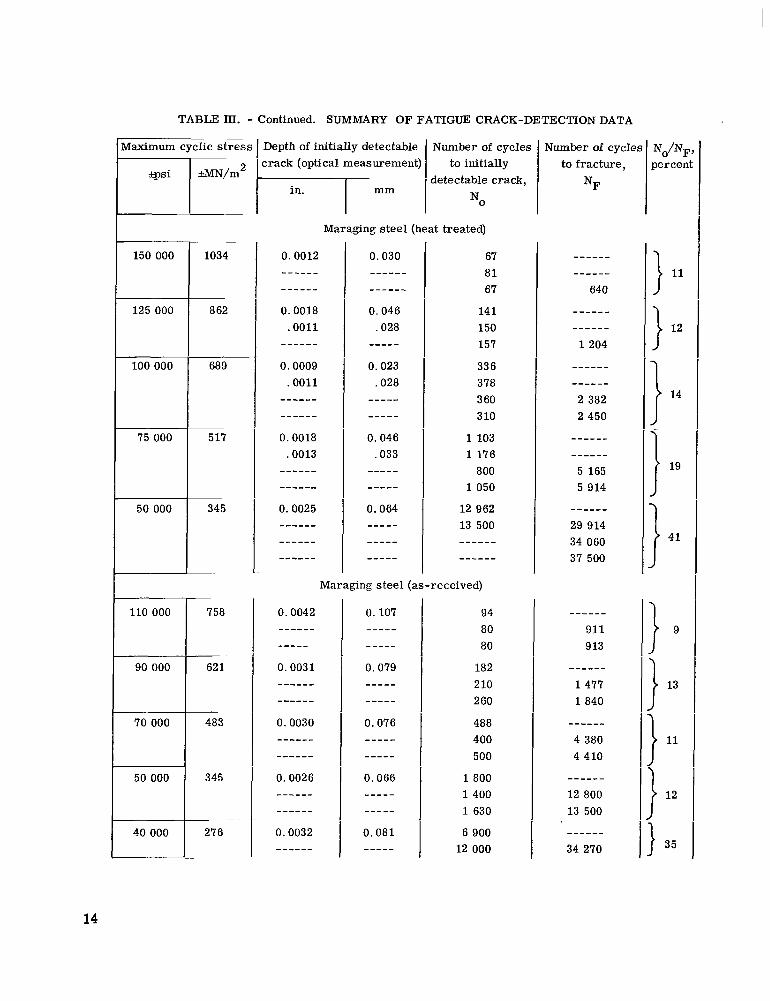
The fatigue data are given in table III. Fatigue curves showing cycles to initially detectable cracks and cycles to fracture are plotted in figure 5. The solid circles repre
12
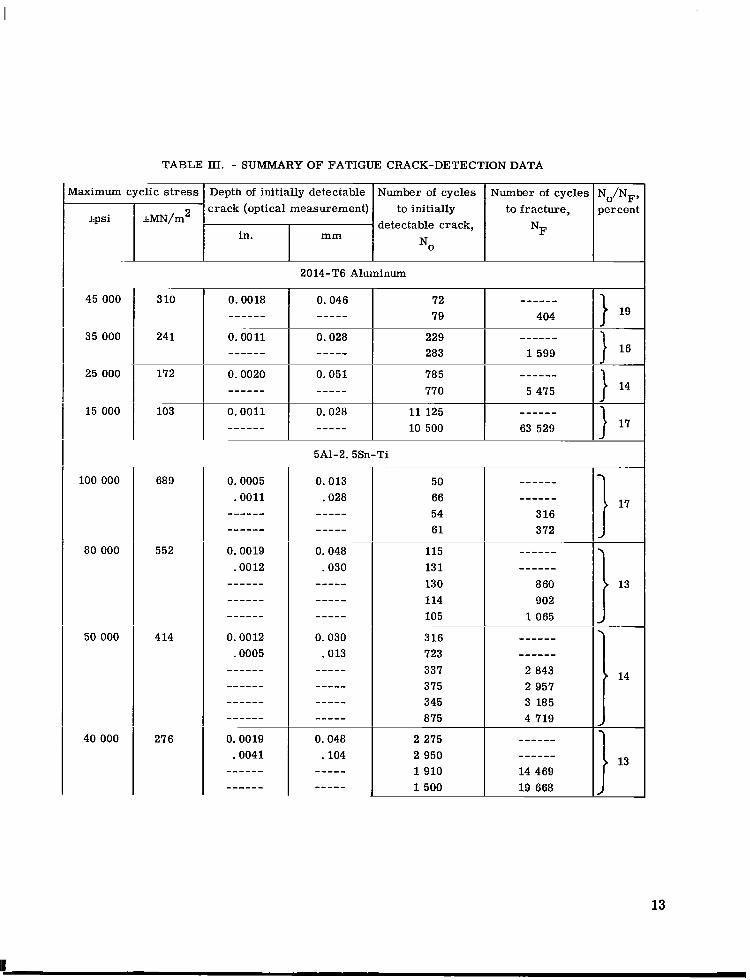
TABLE III. - SUMMARY OF FATIGUE CRACK-DETECTION DATA
vlaximum cyclic s t r e s s I Depth of initially detectable I Number of cycles I Number of cycles-1 crack (optical measurement) I to initially I to fracture,
*psi * m / m 2
~ ~
2014-T6 Aluminum ~
45 000 3 10
35 000 24 1
25 000 172
~
15 000 103
5A1-2.5Sn-Ti ~~
100 000 689 50 66 54 61
80 000 552 115 131 130 114 105
~
50 000 4 14 316 723 337 375 345 875
40 000 276 2 275 2 950 1 9 1 0 1 5 0 0
17
I
t 1 3
14
13
13
II ___
------ ------
TABLE III. - Continued. SUMMARY OF FATIGUE CRACK-DETECTION DATA
Maximum cyclic s t r e s s Depth of initially detectable Number of cycles [crack (optical measurement) to initially
I
150 000 1034
125 000 862
100 000 689
~
75 000 517
110 000
TiC--pLl158
70 000150 000 345
I detectable crack,
Maraging steel (heat treated)
67 81 67
141 150 157
336 378 360 310
1 103 1176 800
1050
12 962 13 500
Maraging stee1 (as -received)
94 80 80
182 210 260
488 400 500
1800 1400 1 630
6 900 12 000
No’NF percen
1l1
1l2
I l4j 19
I 35 14
------
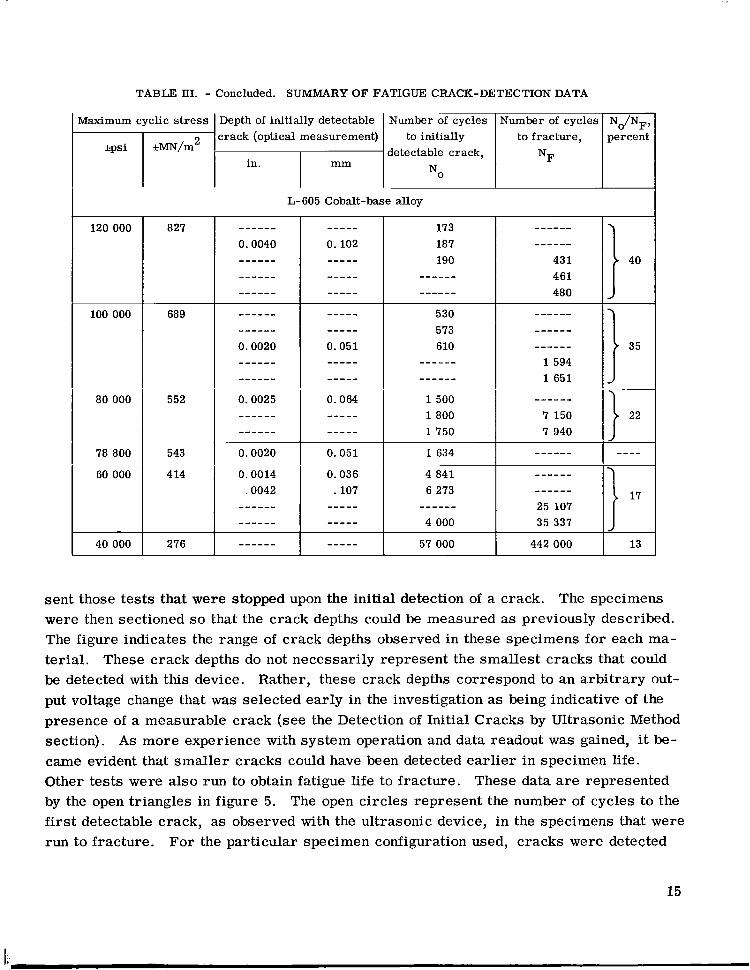
TABLE III. - Concluded. SUMMARY OF FATIGUE CRACK-DETECTION DATA
Maximum cyclic stress Depth of initially detectable Number of cycles crack (optical measurement) to initially
&-detectable crack. in.I I
80 000 552
L-605 Cobalt-base alloy
173 187 190
530 573 610
1500 1800 1750
0.0020
4 841 6 273
4 000
Number of cycles N0/NF! to fracture, percent
NF
I 40
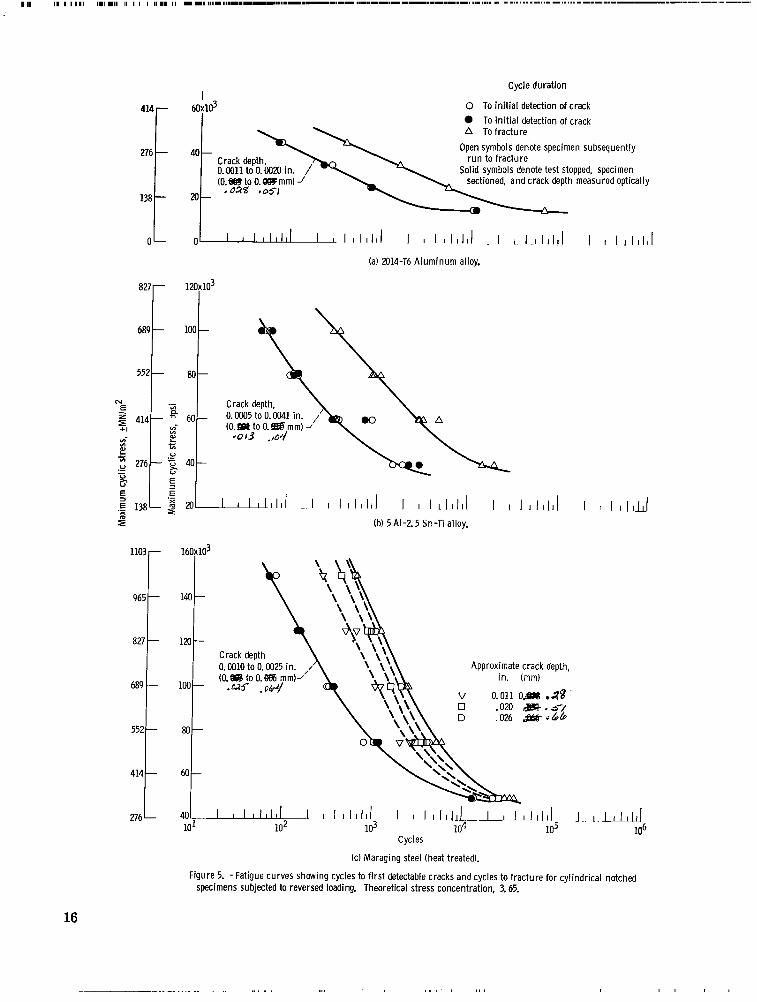
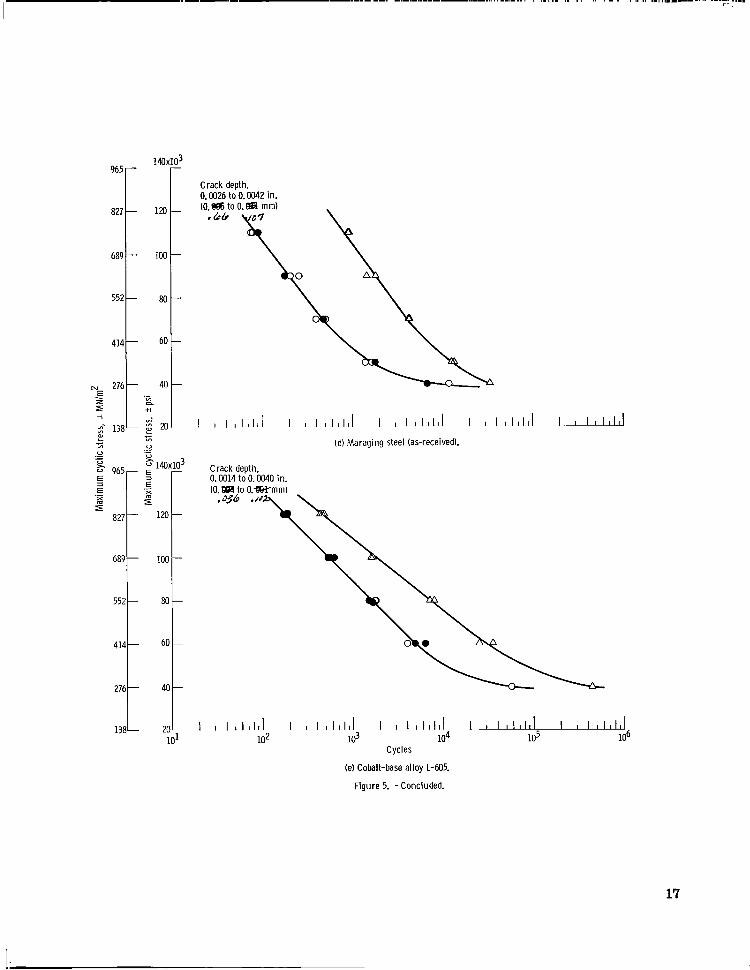
sent those tests that were stopped upon the initial detection of a crack. The specimens were then sectioned so that the crack depths could be measured as previously described. The figure indicates the range of crack depths observed in these specimens for each material. These crack depths do not necessarily represent the smallest cracks that could be detected with this device. Rather, these crack depths correspond to an arbitrary output voltage change that was selected early in the investigation as being indicative of the presence of a measurable crack (see the Detection of Initial Cracks by Ultrasonic Method section). As more experience with system operation and data readout was gained, it became evident that smaller cracks could have been detected earlier in specimen life. Other tests were also run to obtain fatigue life to fracture. These data a r e represented by the open triangles in figure 5. The open circles represent the number of cycles to the first detectable crack, as observed with the ultrasonic device, in the specimens that were run to fracture. For the particular specimen configuration used, cracks were detected
15
Cycle duration I
60x103 0 To init ial detection of crack To init ial detection of crack
A To fracture Open symbols denote specimen subsequently
"._I.. "lr... r u n to fracture+I 0.w11to 0. Solid symbols denote test stopped, specimen (0.- to 0. O B 1 . sectioned, and crack depth measured optically.02% ,061
0 L ol I I I l l ' l l l I L 1 1 1 1 1 1 l I I 1 1 1 1 1 1 1 . I I I . I I I I I l I I Ill1111
(a) 2014-T6 Aluminum alloy.
a-1 I I l l , l l l I I l ! 1 1 1 1 ! I I I I I I l l I ! 1 1 1 1 1 1 1
(b) 5Al-2.5 Sn-Ti alloy.
1103 r- 1 6 0 ~ 1 0 ~
-965
-827
Approximate crack depth, in. (mm)-689
v 0.011 om .280 .om 2224.57 D ,026 S c b b -552
-414
-276
Cycles
(c) Maraging steel (heat treated).
Figure 5. - Fatigue curves showing cycles to f irst detectable cracks and cycles to fracture for cylindrical notched specimens subjected to reversed loading. Theoretical stress concentration, 3.65.
16
.... ._ . .. ... ..
- - -_-.-.-- , .... ._ .. .. .. . .. . .. .. ._,,..I-.- -. .- -...,,r -I
-965 Crack depth.0.0026 to 0.0042 in.
827 - to.@% to 0 . a mm)
-689
-552
-414
276-E zI +I
2- 138- I I 1 1 1 1 1 1 1 I (u
x 0 965- Crack depth,5 0.0014 to 0. oo40 in. .-E (0.Wto 0.BBf-n" x
2 -827
-689
-552
-414
-276
138- I I 1 1 1 1 1 1 1 I 102
I 1 1 1 1 1 1 1 I I 1 1 1 1 1 1 1 I 1 1
(d) Maraging steel (as-received).
I 1 1 1 1 1 1 1 I I 1 1 1 1 1 1 l 1-Id 104 105 106
Cycles
(el Cobalt-base alloy L-605.
Figure 5. -Concluded.
17
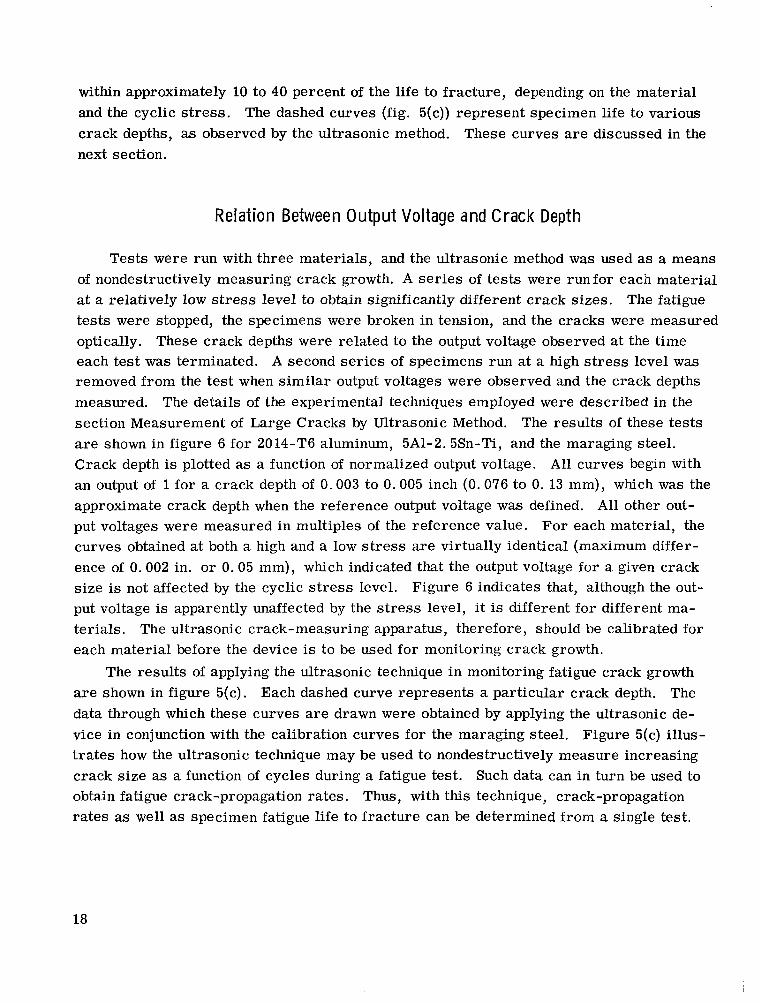
within approximately 10 to 40 percent of the life to fracture, depending on the material and the cyclic stress. The dashed curves (fig. 5(c)) represent specimen life to various crack depths, as observed by the ultrasonic method. These curves are discussed in the next section.
Relat ion Between Output Voltage and Crack Depth
Tests were run with three materials, and the ultrasonic method was used as a means of nondestructively measuring crack growth. A se r i e s of tes ts were runfor each material at a relatively low stress level to obtain significantly different crack sizes. The fatigue tests were stopped, the specimens were broken in tension, and the cracks were measured optically. These crack depths were related to the output voltage observed at the time each test was terminated. A second series of specimens run at a high s t r e s s level was removed from the test when s imilar output voltages were observed and the crack depths measured. The details of the experimental techniques employed were described in the section Measurement of Large Cracks by Ultrasonic Method. The results of these tests are shown in figure 6 for 2014-T6 aluminum, 5A1-2.5Sn-Ti, and the maraging steel. Crack depth is plotted as a function of normalized output voltage. All curves begin with an output of 1for a crack depth of 0.003 to 0.005 inch (0.076 to 0. 13 mm), which was the approximate crack depth when the reference output voltage was defined. All other output voltages were measured in multiples of the reference value. For each material, the curves obtained at both a high and a low s t r e s s are virtually identical (maximum difference of 0.002 in. o r 0.05 mm), which indicated that the output voltage for a given crack s ize is not affected by the cyclic s t r e s s level. Figure 6 indicates that, although the output voltage is apparently unaffected by the s t r e s s level, it is different for different materials. The ultrasonic crack-measuring apparatus, therefore, should be calibrated for each material before the device is to be used for monitoring crack growth.
The results of applying the ultrasonic technique in monitoring fatigue crack growth a r e shown in figure 5(c). Each dashed curve represents a particular crack depth. The data through which these curves are drawn were obtained by applying the ultrasonic device in conjunction with the calibration curves for the maraging steel. Figure 5(c) illustrates how the ultrasonic technique may be used to nondestructively measure increasing crack s ize as a function of cycles during a fatigue test. Such data can in turn be used to obtain fatigue crack-propagation rates. Thus, with this technique, crack-propagation ra tes as well as specimen fatigue life to fracture can be determined from a single test.
18
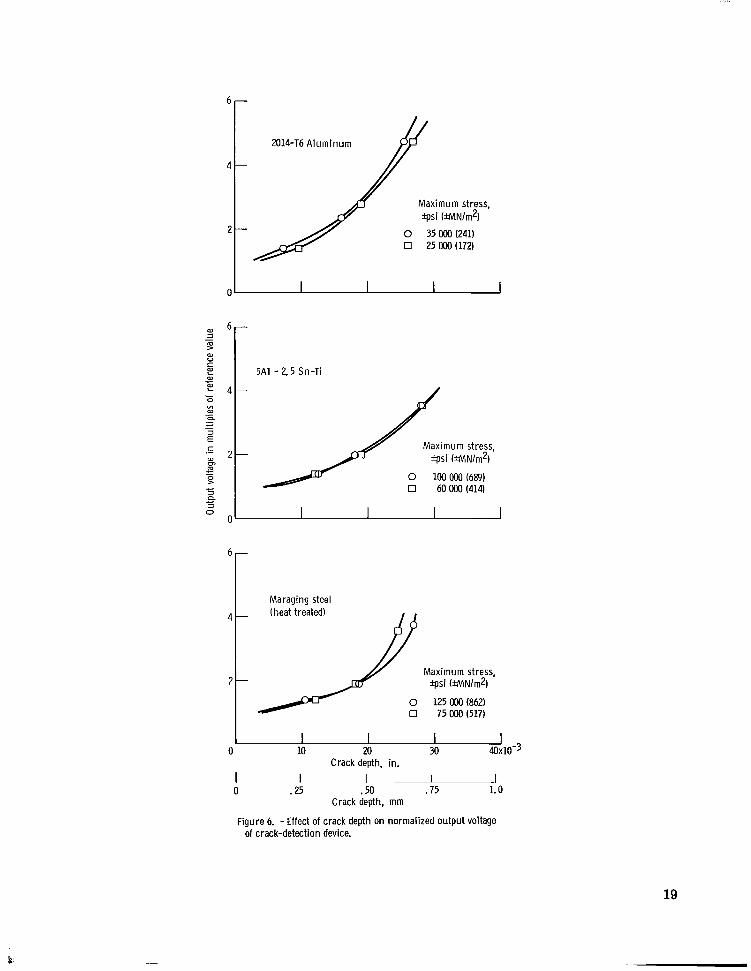
2014-T6 A luminum
Maximum stress,
0 35000 (241) 0 25 000 (172)
5A1- 2.5 Sn-Ti
Maximum stress,
0 1OOOOO(689) 0 60 OOO (414)
I Maraging steel
Maximum stress, +si ( N N l m 2 )
125 000 (862) 75 OOO (517)
I 0 10 20 u)
Crack depth, in. I I I I I 0 .25 .50 .75 1.0
Crack depth, mm
Figure 6. - Effect of crack depth on normalized output voltage of crack-detection device.
19
6

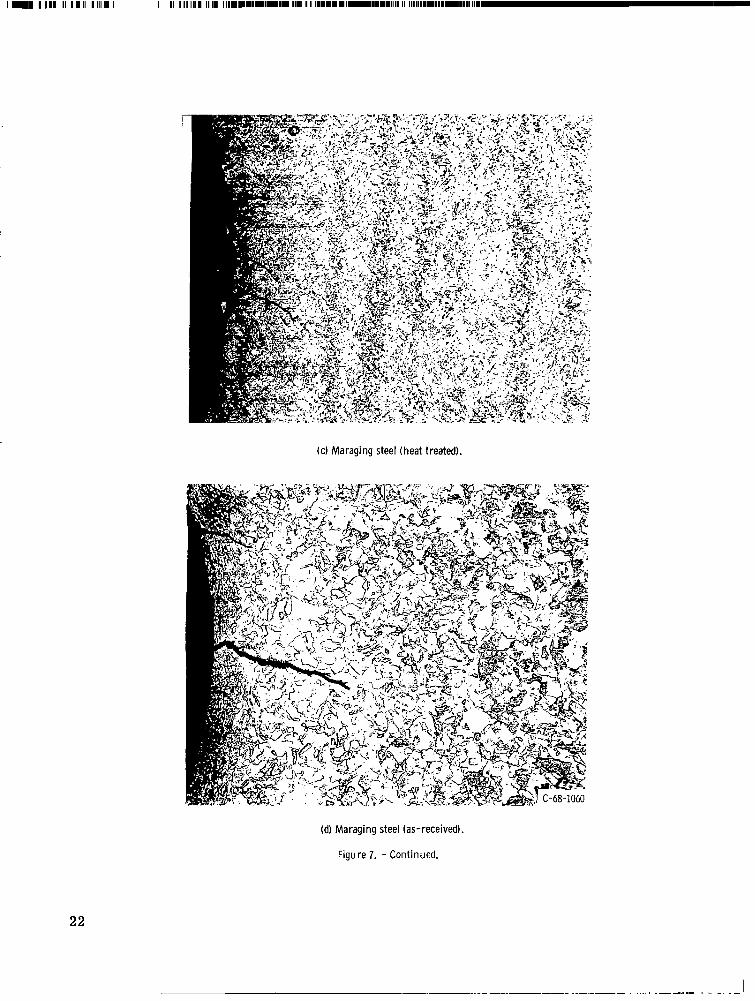
Metallographic Observations
Photomicrographs of longitudinal sections of specimens tested to the initial detection of cracks for each material are presented in figure 7. Cracks emanate from the root of the notch and progress toward the center of the specimen, and cracks are generally transgranular. In most specimens, several cracks developed which began at different points along the notch root radius, as shown in figure 7. This was most commonly observed in the 5A1-2. 5Sn-Ti alloy, the maraging steel, and the cobalt-base alloy L-605. Cracks were also observed to emanate from the notch root at many points around the circumference of a given specimen. As the test progressed, these small cracks grew, some of them joining together to form the crack that eventually caused fracture.
When the applied cyclic stresses corresponded to those on the inclined portion of the fatigue curve (above the fatigue limit of the notched specimens), the main crack extended all the way around the specimen circumference and was generally uniform in depth until very rapid crack growth occurred just pr ior to fracture. This uniform crack growth is illustrated in figure 8, which shows fracture surfaces of maraging s teel specimens tested to various stages of fatigue damage. This sequential se r ies of macrographs was obtained after the specimens were fatigue tested to various values of output voltage as indicated by the ultrasonic detection device. They'were then removed from the test and broken in tension. The fatigue-cracked portion of the fracture surface is clearly distinguishable in the figure as the lightly shaded area at the periphery of the 0.3-inch(7.6-mm-) diameter test section. The dark, rough region in the center of the specimen represents the tensile fracture. The fatigue crack is not as apparent in specimens that were not tested beyond the point of initial crack detection (fig. 8(a) and (b)). However, microscopic examination showed that the crack extended around the entire circumference and that the depth varied between 0.001 and 0.003 inch (0.025 and 0.076 mm) in both specimens shown. This represents a substantial variation, relative to the average crack depth of about 0.002 inch (0.050 mm). For larger cracks (figs. 8(c) - (h)), the crack depth was relatively uniform around the entire circumference. Note that the normalized output voltage for each specimen is the same for a given crack size, even though the number of applied cycles and the maximum cyclic s t r e s s level applied were different. These results indicate that the crack-detection system is sensitive to the crack a rea and independent of the way the crack was formed.
In figure 8, the main fatigue crack was shown to progress inward in a generally uniform manner around the entire circumference of the notched specimens when the applied cyclic s t resses were high. This was not the case, however, when the maximum cyclic s t r e s s level was low, that is, when the level was in the region near the fatigue limit. Figure 9 shows the fracture surfaces of two mara ing steel specimens tested at the relatively low s t r e s s level of *50 000 psi (345 MN/m B). One of the tests (fig. 9(a)) was
20

(a) 2014-T6 a l u m i n u m alloy.
(b) 5A1-2.5 Sn-Ti alloy.
F igure 7. - Mic rographs of tested fat igue specimens of each mater ia l showing f i r s t detectable cracks emanat ing f rom n o t c h root. Long i tud ina l sections.
2 1
- I mI I 111111 II II III I11111I I Ill I II11111 II 111 I11111II.II.IIIIIII.I 1111 II IIIIIIIIIIII.~1II111111 II 111111111111111111111~1
(c) Maraging steel (heat treated).
(d) Maraging steel (as-received).
F igure 7. - Continued.
22
. ..... -..._.. .. -. - _. I

(e) Cobalt-base alloy L-605.
Figure 7. - Concluded.
23
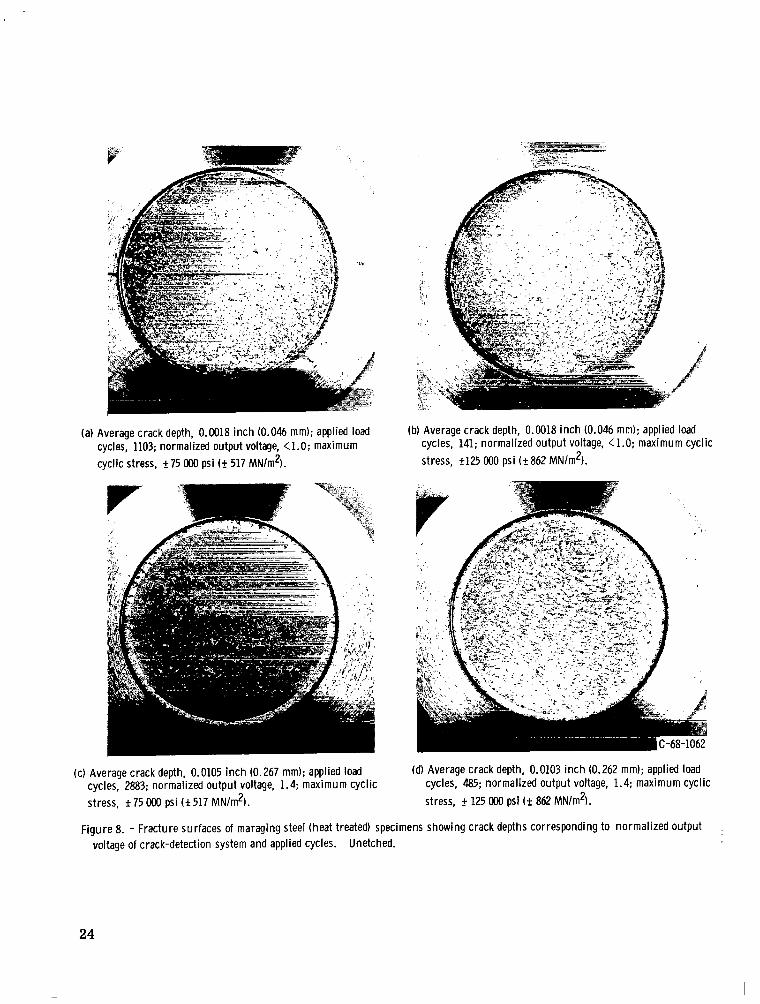
(a) Average crack depth, 0.0018 inch (0.046 mm); applied load (b) Average crack depth, 0.0018 inch (0.046 mm); applied load cycles, 1103; normalized output voltage, < L O ; maximum cycles, 141; normalized output voltage, <1.0; maximum cyclic
cyclic stress, f 75 OOO psi (t517 MN/m2). stress, t125 000 psi ( t 8 6 2 MN/m2).
(c) Average crack depth, 0.0105 inch (0.267 mm); applied load (d) Average crack depth, 0.0103 inch (0.262 mm); applied load cycles, 2883; normalized output voltage, 1.4; maximum cyclic cycles, 485; normalized output voltage, 1.4; maximum cyclic stress, t 7 5 OOO psi ( t 5 1 7 MN/m2). stress, f 125 OOO psi ( f 862 MN/m21.
Figure 8. - Fracture surfaces of maraging steel (heat treated) specimens showing crack depths corresponding to normalized output voltage of crack-detection system and applied cycles. Unetched.
24
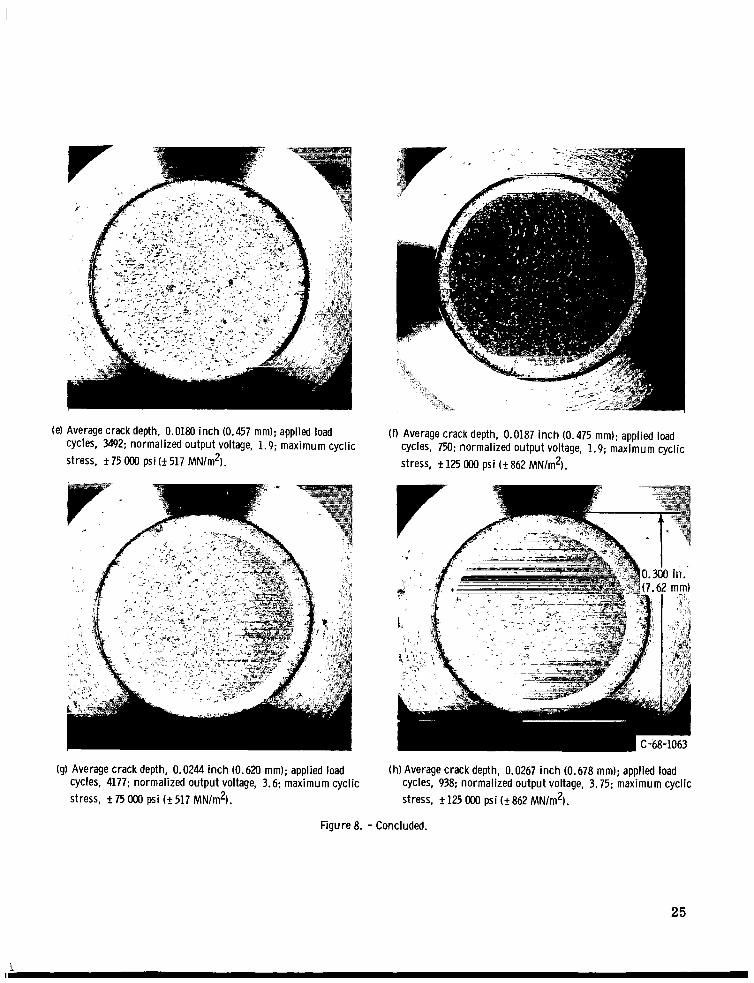
(e) Average crack depth, 0.0180 inch (0.457 mm); applied load (0 Average crack depth, 0.0187 inch (0.475 mm); applied load cycles, 3492; normalized output voltage, 1.9; maximum cyclic cycles, 750; normalized output voltage, 1.9; maximum cyclic stress, f 75 OOO psi (+ 517 MN/m2). stress, f 125 OOO psi (f 862 MN/m2).
(g) Average crack depth, 0.0244 inch (0.620 mm); applied load (h)Average crack depth, 0.0267 inch (0.678 mm); applied load cycles, 4177; normalized output voltage, 3.6; maximum cyclic cycles, 938; normalized output voltage, 3.75; maximum cyclic stress, f 75 OOO psi (f517 MN/m2). stress, f 125 000 psi ( t 8 6 2 MN/m2).
Figure 8. - Concluded.
25

(a) Fatigue test stopped after 31 4% Cycles.
(b) Fatigue tested to fracture (37 500 cycles).
Figure 9. - Fracture surfaces of maraging steel (heat treated) specimens tested near fatigue limit. Maximum cyclic stress, +!%IO00 psi (f345MN/m2).
26
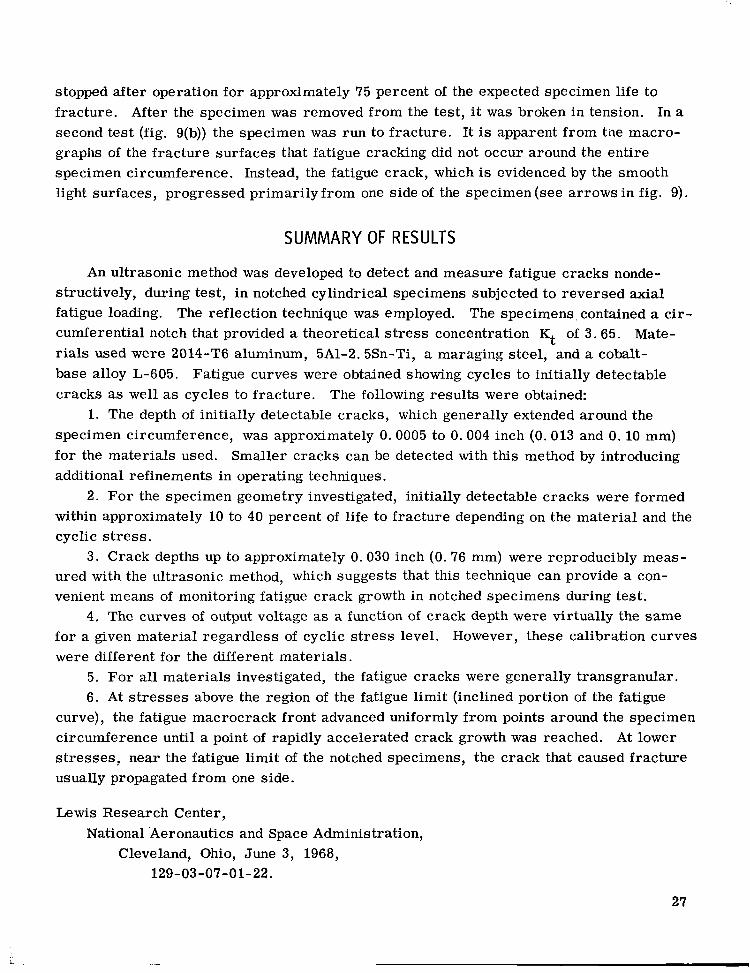
stopped after operation for approximately 75 percent of the expected specimen life to fracture. After the specimen was removed from the test, it was broken in tension. In a second test (fig. 9(b)) the specimen was run to fracture. It is apparent from the macro-graphs of the fracture surfaces that fatigue cracking did not occur around the entire specimen circumference. Instead, the fatigue crack, which is evidenced by the smooth light surfaces, progressed primarilyfrom one side of the specimen (see arrows in fig. 9).
SUMMARY OF RESULTS
An ultrasonic method was developed to detect and measure fatigue cracks nondestructively, during test, in notched cylindrical specimens subjected to reversed axial fatigue loading. The reflection technique was employed. The specimens. contained a circumferential notch that provided a theoretical s t r e s s concentration Kt of 3.65. Materials used were 2014-T6 aluminum, 5A1-2.5Sn-Ti, a maraging steel, and a cobalt-base alloy L-605. Fatigue curves were obtained showing cycles to initially detectable cracks as well as cycles to fracture. The following results were obtained:
1. The depth of initially detectable cracks, which generally extended around the specimen circumference, was approximately 0.0005 to 0.004 inch (0.013 and 0.10 mm) for the materials used. Smaller cracks can be detected with this method by introducing additional refinements in operating techniques.
2. Fo r the specimen geometry investigated, initially detectable cracks were formed within approximately 10 to 40 percent of life to f racture depending on the material and the cyclic s t r e s s .
3 . Crack depths up to approximately 0.030 inch (0.76 mm) were reproducibly measured with the ultrasonic method, which suggests that this technique can provide a convenient means of monitoring fatigue crack growth in notched specimens during test.
4. The curves of output voltage as a function of crack depth were virtually the same fo r a given material regardless of cyclic s t r e s s level. However, these calibration curves were different for the different materials.
5. For all materials investigated, the fatigue cracks were generally transgranular. 6. A t s t r e s ses above the region of the fatigue limit (inclined portion of the fatigue
curve), the fatigue macrocrack front advanced uniformly from points around the specimen circumference until a point of rapidly accelerated crack growth was reached. At lower s t resses , near the fatigue limit of the notched specimens, the crack that caused fracture usually propagated from one side.
Lewis Research Center, National .Aeronautics and Space Administration,
Cleveland, Ohio, June 3, 1968, 129-03 -07-0 1-22.
27
1.

REFERENCES
1. Feinstein, L.; and Hruby, R. J. : Surface Crack Detection by Microwave Methods. Presented at Sixth Symposium on Nondestruction Evaluation of Aerospace and Weapons Systems Components and Materials, San Antonio, Texas, Apr. 17-19, 1967.
2. Klima, Stanley J.; Lesco, Daniel J. ; and Freche, John C. : Ultrasonic Technique for Detection and Measurement of Fatigue Cracks. NASA T N D-3007, 1965.
3. Rasmussen, J. G. : Prediction of Fatigue Failure Using Ultrasonic Surface Waves. J. SOC.Nondestructive Testing, vol. 20, no. 2, Mar-Apr. 1962, pp. 103-110.
4. Rublev, Ya. A. ; and Danilov, Yu. S. : Ultrasonic Detection of Fatigue Cracks During Repeated Static Tests. Industrial Lab., vol. 29, Apr. 1964, pp. 1306-1309.
5. Hinsley, J. F. : Non-Destructive Testing. MacDonald and Evans, Ltd., London, 1959.
6. Carlin, Benson: Ultrasonic. Second ed., McGraw-Hill Book Co., Inc. , 1960.
7. Banks, B. ; Oldfield, G. E. ; and Rawding, H. : Ultrasonic Flaw Detection in Metals. Iliffe Books Ltd., London, 1962.
8. Anon.: Manual on Fatigue Testing. Spec. Tech. Publ. No. 91, ASTM, 1949, p. 33.
28 NASA-Langley, 1968 -32 E-4314
NATIONAL AND SPACE ADMINISTRATION POSTAGE AND FEES PAIDAERONAUTICS D. C. 20546 NATIONAL AERONAUTICS ANDWASHINGTON,
SPACE ADMINISTRATION OFFICIAL BUSINESS FIRST CLASS MAIL
POSTMASTER: If Undeliverable (Section 158 Postal Manual) Do Not Rerum
..
‘ T h e aeronautical and space activities of the United States shall be conducted so as to contribute . . . to the expansion of haman knowledge of phenomena in the atmosphere and space. T h e Administration shall provide for the widest practicable m d appropriate dissemination of inforiuation concerning its activities and the results thereof.”
- N A T I ~ N A L AERONAUTICSAND SPACE ACT OF 1958
NASA SCIENTIFIC AND TECHNICAL PUBLICATIONS
TECHNICAL REPORTS: Scientific and technical information considered important, complete, and a lasting contribution to existing knowledge.
TECHNICAL NOTES: Information less broad in scope but nevertheless of importance as a contribution to existing knowledge.
TECHNICAL MEMORANDUMS: Information receiving limited distribution because of preliminary data, security classification, or other reasons.
CONTRACTOR REPORTS: Scientific and technical information generated under a NASA contract or grant and considered an important contribution to existing knowledge.
TECHNICAL TRANSLATIONS: Information published in a foreign language considered to merit NASA distribution in English.
SPECIAL PUBLICATIONS: Information derived from or of value to NASA activities. Publications include conference proceedings, monographs, data compilations, handbooks, sourcebooks, and special bibliographies.
TECHNOLOGY UTILIZATION PUBLICATIONS: Information on technology used by NASA that may be of particular interest in commercial and other non-aerospace applications. Publications include Tech Briefs, Technology Utilization Reports and Notes, and Technology Surveys.
Details on the availability of these publications may be obtained from:
SCIENTIFIC AND TECHNICAL INFORMATION DIVISION
NATIONAL AERONAUTICS AND SPACE ADMINISTRATION Washington, D.C. PO546