
NASA Technical Memorandum FUTURE REGIONAL … technical memorandum 107669 / m--o/ future regional...
90
NASA Technical Memorandum 107669 / M-- o/ FUTURE REGIONAL TRANSPORT AIRCRAFT MARKET, CONSTRAINTS, AND TECHNOLOGY STIMULI (NASA-TM-107669) FUTURE REGIONAL TRANSPOPT AIRCRAFT MARKFT, CONSTRAINTS, AND TECHNOLOGY STIMULI (NASA) 89 p L N93-13025 Unclas G3/OI 0129297 W. Don Harvey and Brent Foreman October 1992 Nalional Aeronautics and Space Administration Langley Research Center Hampton, Virginia 23665-5225 https://ntrs.nasa.gov/search.jsp?R=19930003837 2018-06-22T13:46:27+00:00Z
Transcript of NASA Technical Memorandum FUTURE REGIONAL … technical memorandum 107669 / m--o/ future regional...

NASA Technical Memorandum 107669
/ M-- o/
FUTURE REGIONAL TRANSPORT
AIRCRAFT MARKET, CONSTRAINTS,
AND TECHNOLOGY STIMULI
(NASA-TM-107669) FUTURE REGIONAL
TRANSPOPT AIRCRAFT MARKFT,
CONSTRAINTS, AND TECHNOLOGY STIMULI
(NASA) 89 p
L
N93-13025
Unclas
G3/OI 0129297
W. Don Harvey and Brent Foreman
October 1992
Nalional Aeronautics andSpace Administration
Langley Research CenterHampton, Virginia 23665-5225
https://ntrs.nasa.gov/search.jsp?R=19930003837 2018-06-22T13:46:27+00:00Z


ABSTRACT
INTRODUCTION
TABLE OF CONTENTS
SYMBOLS
TRENDS AND FORECASTS
REGIONAL/COMMUTER TRANSPORT DEFINITION
MARKET FORECASTS AND INFLUENCES
WORLD ISSUESU.S. ISSUES
3
6
6
7
7
8
AIRCRAFTTRENDS
FLEET SIZEAIRCRAFT SIZEAND SPEED
OPERATING COSTS AND TECHNOLOGYINFLUENCES
10
1010
11
FUTURE MARKET FORCES
CONSTRAINTS AND STIMULIREGIONAL AIRCRAFT---NEW MARKET ISSUES
12
12
12
IMPACT OF TECHNOLOGY
ADVANCED TECHNOLOGY INFLUENCE ON DOC
TECHNOLOGY OPPORTUNITIES
ADVANCED WING DESIGNLAMINAR FLOW TECHNOLOGY
14
14
14
1617

HIGH-LIFT AERODYNAMICSPROPULSIONNOISE REDUCTIONMATERIALSAVIONICS AND CONTROL
1819212122
FUTURE MARKET SCENERIO 23
CONCLUDING REMARKS
REFERENCES
24
26
//

ABSTRACT
This report provides updated information on the current market and operatingenvironment and identifies interlinking technical possibilities for competitive future
commuter-type transport aircraft. The conclusions on the market and operatingenvironment indicate that the regional airlines are moving toward more modem andeffective fleets with greater passenger capacity and comfort, reduced noise levels,
increased speed, and longer range. This direction leads to a nearly "seamless"service and continued code-sharing agreements with the major carders. Whereasthe benefits from individual technologies may be small, the overall integration in
existing and new aircraft designs can produce improvements in direct operatingcost and competitiveness. Production costs are identified as being equally
Important as pure technical advances.
INTRODUCTION
In the National Aeronautics and Space Administration (NASA) authorization
hearings from Fiscal Year 1979, the U.S. Senate Committee on Commerce,Science, and Transportation reported a perceived problem in commuter-type airservice between smaller cities and connecting major hubs. NASA, in cooperation
with the Department of Transportation and the Civil Aeronautics Board, wasrequested to prepare a comprehensive report on technology improvements thatwould most likely increase the public use of commuter aircraft and to determinewhether NASA's research Could help manuf._ctUrerS solve these technical
problems. In December_1980,an Ad-Hoc:Subcomrnittee=6fNASA's AeronauticsAdvisory Committee reviewed the Study and provided its conclusions andrecommendations. A summary of these previous efforts and more recent updatedinformation are published in SAE 1982 Transactions, Section 3, Volume 91, entitled
"Advanced Technology for Future Regional Transport Aircraft" by Louis J. Williams
(ref. 1).
Since these previous studies, the U.S. regional airlines have experiencedphenomenal growth (ref. 2). Many have done so by sacrificing their identities inbecoming part of a major airline. These partnerships have grown so fast thatregionals, looking more like the majors, have been classified by the U.S.Transportation Department as airlines with less than $100 million in gross revenue.
Since deregulation in 1978, the regional airline industry has tripled in size (ref. 2).This apparent upheaval began in the 1980's, when airline deregulation generatedan intense climate of competition. Most of the major aidines at that time proceeded
to form partnerships with regionals and turned them into feeders to gain newmarkets and higher load factors. In 1989, 43 of the top 50 carriers used the two-letter designator code of a larger airline to list their flights. In total, there were 54
\\
\\
\
\

code-sharing agreements between regional and major airlines. Theserelationships vary from outright ownership by a major carrier (17 airlines) to partial
ownership (4 airlines) to pure marketing alliances devoid of ownership (33 airlines)(see refs. 2 through 6).
Prior to deregulation, most of the regionals were operating propeller-drivenaircraft that seated fewer than 40 passengers and could reach airports that wereless than 200 miles away and too small for the commercial jets of the major fleets.
The industry continued to add new, more sophisticated aircraft to the fleet, retiringthe older piston-powered aircraft. Thus, the total number of aircraft in scheduled
regional airline service rose from 1,265 in 1979 to 1,907 in 1989 with an averageaircraft seating capacity increase from 12.5 to 21.8 seats. The average trip lengthhas correspondingly increased from 123 to 181 miles. Passenger enplanementshave risen from 14 million in 1979 to 37.4 million in 1989. Revenue passengermiles increased to 6.77 billion in 1989 from 1.72 billion in 1979. One very important
consequence of deregulation was that carriers began to provide seamless or end-to-end service under the same brand name (code sharing).
Today's regional airlines in the United States, Europe, and elsewhere areidentified with the entrepreneurial spirit (refs. 7 and 8). While regionals are vital fortomorrow's Europe, they have in the past been severely tested by a lack of suitableaircraft for short, thinly-traveled routes and more recently by the regulatoryemissions and noise environment. Europe's aircraft manufacturers have risen to
the challenge and developed aircraft that are specifically designed to meet theeconomic and operating needs of regional airlines. Europe's aerospacemanufacturers dominate the world market for commuter aircraft, although
competition comes from the United States, Canada, and Brazil (refs. 9 and 10).
The introduction of new state-of-the-art technology aircraft offering amenities
similar to those found on large jet aircraft can contribute to greater public
acceptance and stimulate higher growth. Procurement of new aircraft plusincreased integration of service with the major airlines will lead to new opportunities
for the regional/commuter industry. However, while the regional jet conceptprovides the most obvious way to expand into new areas of growth, it may also bewhere the industry is most likely to come into competition or conflict with theirpartners, major airframe manufacturers (ref. 11), and environmental regulators.
By all accounts, the U.S. and foreign regionallcommuter airlines haveexperienced a growth trend (refs. 2-4). In the United States, this trend has outpaced
the growth of the major U.S. airlines. Forecasters predict that larger regional aircraftwill dominate the market by the turn of the century. There are about 25 different
regional aircraft with between 19 to 70 seats on the market today. In such acompetitive and expanding regional market, the viability of so many aircraft
2

programs is often doubted. Break-even points in terms of profit remains notoriouslyelusive, even though some American manufacturers have delivered over 200aircraft in the past. While in the late 1980's there were large regional aircraftpurchases, recent social and economic problems have dimmed what had been an
optimistic outlook for several production lines. U.S. manufacturers have beenexperiencing a turbulent time--with cost cutting, lay-offs, and production slowdownsdue to market uncertainty. On the other hand, both poor traffic and expensive fuel
could bring about failures among the operators of aircraft, rather than themanufacturers. Consequently, there has been a rather large negative shift in the
U.S. trade balance over the past i0 years for general aviation and commuteraircraft.
With this concern in mind, the NASA Langley Research Center initiated a
study in the fall to1989 to evaluate the current commuter aircraft market andoperating environment and to identify interlinking technical possibilities forcompetitive future commuter-type transports. Summary briefings on the results ofthis study have been presented to industry and their comments are incorporated inthe evaluations and findings herein. The purpose of this paper is to provide
updated information on commuter airline trends and forecasts, airline development,and technology opportunities. While the vastness of the subject is recognized, thepresent paper summarizes the factors that are believed to have a major impact onfuture regional/commuter transport aircraft and their operations.
SYMBOLS
a
c
CD
cd
CL
CI
Ag
M
R
speed of sound
chord
section drag coefficient
total drag coefficient
section lift coefficient
total lift coefficient
gust load factor
Mach number
unit Reynolds number
3

S
t
v
S
W
o_
8F
A
wing area
thickness
velocity
wing area
wing weight
angle of incidence
flap deflection
leading-edge sweep angle
C
DD
g
rain
tr
J_
max
chord
drag divergence
gust
minimum value
transition
normal to leading edge
maximum value
infinity
a/c
AR
ASM
aircraft
aspect ratio
available seat miles
4

ASNM available seat nautical miles
!i
;i
i ,
2 "
2'
¢
i?,
t
_
ATC air traffic control
CAD
CAM
CF
computer assisted design
computer assisted manufacturing
crossflow
CIM computer integrated manufacturing
DFVLR
dBA
DOC
Deutsche Forschungsanstalt fur Luft-undRaumfahrt
decibel
direct operating cost
EPNL effective perceived noise level
FAA Federal Aviation Administration
GAL gallon
GDP gross domestic product
HPT high pressure turbine
HSNLF high speed natural laminar flow
LP low pressure
LS low speed
LTPT
IJD
MAC
Low Turbulence Pressure Tunnel- . .___ - .- _ .
lift-to-drag-ratio
Mean aerodynamiC- chord
NACA National Adviso_ Committee on Aeronautics
NASA _ _ Nati()nal Aer0naiJt_Cs ahd Space Administration
5

NLF
NM
PAX
RPM
SHP
SFC
TE
TS
UHBR
natural laminar flow
nautical miles
passenger
revenue passenger miles or revolutions per minute
shaft horse power
specific fuel consumpton
trailing edge
Tollmien-Schlichting
ultra high bypass ratio
TRENDS AND FORECASTS
Regional/Commuter Transport Definition
As traffic grows, larger aircraft can be used at the same frequency, however, itis not generally within the operator's ability to match traffic growth and aircraft sizevariation requirements closely without acquiring new aircraft. Figure 1 is an attemptto show the growth in aircraft seating capacity for different types of aircraft thatincludes developed and stretched version and in-service and proposed newaircraft. The figure also illustrates a seating capacity gap between 100 and 200 that
apparently exists for in-service aircraft. The procurement of additional aircraft andincreased integration of service with major carriers can lead to new growthopportunities for the regional industry. From a fleet once made up of generalaviation-type aircraft, the future regional airline fleet will increasingly be made up ofa larger variety of more sophisticated aircraft. Thus, for purposes of this study, it wasdeemed necessary to define the future commuter transport aircraft.
Historically, the concept of short-haul or long-haul transports has had a rangeassociated with it that has increased with the passage of time and the advance of
technology. Inherently, there has also been an increase in speed associated withrange. In this context, there appears to be a real plateau in the near future for shod-haul transports.
The short-haul aircraft is one that is designed as the most efficient vehicle fora given short-stage length, while being capable of stage lengths that are 3 to 4
6

Lodd..I. sua=
the short-stage length with full passenger capacity (between 100 and 200passengers). A strictly short-haul aircraft, would gain on the short ranges by notbeing penalized with the full load range requirements but would, of course, notgenerallyY=ndfavor with the operator because of its inflexibility.
Feeder-type aircraft generally are smaller in size (between 50 and 100
passengers) but often are capable of stage lengths similar to that for short-haulaircraft. For this study, a regional/commuter transport is defined as an aircraft withflexibility that includes the capacity of performing a multi-hop operation withoutrefueling, thus minimizing ground time and requiring a high maximum landingweight greater than 95 percent of maximum takeoff weight.
Market Forecasts and Influences
A generally accepted forecast of the traffic for total world transports (ref. 12)
is shown in figure 2. The only world areas excluded are the Peoples Republic ofChina and domestic operations in the USSR. The overall trend (fig. 2) in revenue
passenger miles (RPM) suggests a steady decline in the average percentagegrowth per year although the historical and forecast annual growth continues tosteadily increase out to the year 2005. This world and U.S. forecast represents adoubling of traffic between 1990 and 2005. Obviously, the projection of demand isdependent on the gross domestic product (GDP) and airline fares. The projectedtrends in traffic for the United States, non-United States and world in figure 2 arebased on the annual GDP forecast growth rates (ref. 12) shown in figure 3.
Currently, the commuter market appears to have too many aircraft entrants,too many potential customers, and too few customer dollars. There are at least 20manufacturers from which about 500 airlines worldwide will order a forecast 3000
aircraft by the next decade.-.a, forecast growing Commuter�feeder market worldwide
(ref. 2--3) needs access to a reasonable choice of modern aircraft with a lowpurchase price and operating cost and with high passenger appeal. Satisfaction of
this need may only be met with fewer manufacturers with sufficient resources toinvest in a new development program with the potential of a reasonable retum.
; _ The goal of the Eurol_ean Economic Community (EEC) is to create a single
internal market by the end of 1992 (ref. 13). The European Regional AirlinesAssociation (ERA) (ref. 13) members include 42 airlines, 21 manufacturers, 20airports, and 33 other companies and organizations. This EEC goal would serve asa growth catalyst (fig. 3) and free movement of people, goods, and capital betweenthe already congested member states. Today, the European regional industry is in a
similar position as the U.S. regionals
7

were immediately following deregulation. Overall, European passenger traffic hasexperienced recent growth increases of nearly 17 percent per year (ref. 14). Thistrend is expected to continue with those whose regionals are entering similar code-
sharing agreements as those which exist in the United States. Currently, almost 70percent of ERA member airline operations link regional airports with the large hubs.Denial of access to Europe's hub airports would likely spell economic disaster forthe continent's regional aidines and airports (ref. 13).
Through the year 2000, the Asia Pacific rim countries (refs. 15 and 16) are
expected to lead the world in GDP growth, averaging more than 5 percent per year(fig. 4), according to Boeing (ref. 12) forecasts. Based on this economic growth,Boeing further predicts that by the end of the century, 12 percent of all Asians willtake at least one flight a year, compared with 6 percent today. Intraorient travel will
represent most of the traffic growth (increasing at about 8 percent per year). About40 million passengers are forecast to travel within the Pacific rim in 1993, up from17 million passengers in 1983. About 50 percent of this traffic is to be generated bynorthern Asian countries, primarily Japan. If this vibrant Asian market trendcontinues as predicted, a significant increase in aircraft orders and a largertransportation network will be required to meet demand.
The annual percentage changes in the U.S. regional and major airline traffic
growth (ref. 2) are shown in figure 4. Regional carriers flew 3.266 million hours in1989 compared to 1.390 million hours in 1979. They improved flight schedules,increased aircraft speed, and trip length for more frequent service. Figure 5 showshistorical and forecast passenger enplanements and RPM's for the U.S. regional
airlines (ref. 2). Enplanements are forecast to double by the year 2000 from the37.4 million in 1989. Similarly the RPM's are expected to double.
While growth in the regional airline industry seems to be robust, it is far below
that speculated by the industry following deregulation. "Hub-spoke" operationshave increased competition in a majority of city-pair markets, but at hubsdominated by one carrier, competition is reduced on dense, short-haul routes(ref. 2). The apparent additional traffic generated with a maturing market will
produce a diminishing percentage growth. Thus, in the absence of a pronouncedeconomic downturn, traffic in the next several years should show growth of around
5 percent per year (figs. 2-5), beyond which a downward trend in growth rate mightbe expected toward an anticipated domestic growth rate of around 3 to 5 percent.
Airport congestion, is already a serious problem and could get worse with the
projected traffic growth. If not remedied, this could have a depressive effect onairline growth. For example, if the market for regionals is restricted to its current role
of providing feed to the major airlines hubs, then the commuter industry growth
8

r
may become limited due to available slot competition. In general, code sharing witha major airline is accepted as a key to success. In 1989, the top 50 regionals in theUnited States carried over 96 percent of all regional traffic (ref. 2). Either directly orindirectly, the major airlines control almost 90 percent of regional traffic. It seemshighly probable that more major airlines will attempt to wholly own their feedercarriers in order to increase overall efficiency such as in the use of aircraft,
equipment, and terminal slots. However, opportunities for growth do exist. Routinedelays in the U.S. air transportation system, due to serious air terminal and airtraffic congestion, will increase public discontent with service through hub airports.Assuming that the hub and spoke system is here to stay, the regionals may be ableto experience dramatic growth by offering a wide scale substructure of point-to-point
routes that bypass congestion at connecting hub airports.
The increasing availability of larger, faster turboprop or jet aircraft with longer
range, will give the regional aidines the flexibility to efficiently take advantage ofpotential overall system problems. They may, for example, extend their service areawith longer spokes as feeders to hubs; accept routes that may be given up by majorairlines in favor of more profitable routes; and provide additional point-to-pointservice in order to free up capacity at hub airports.
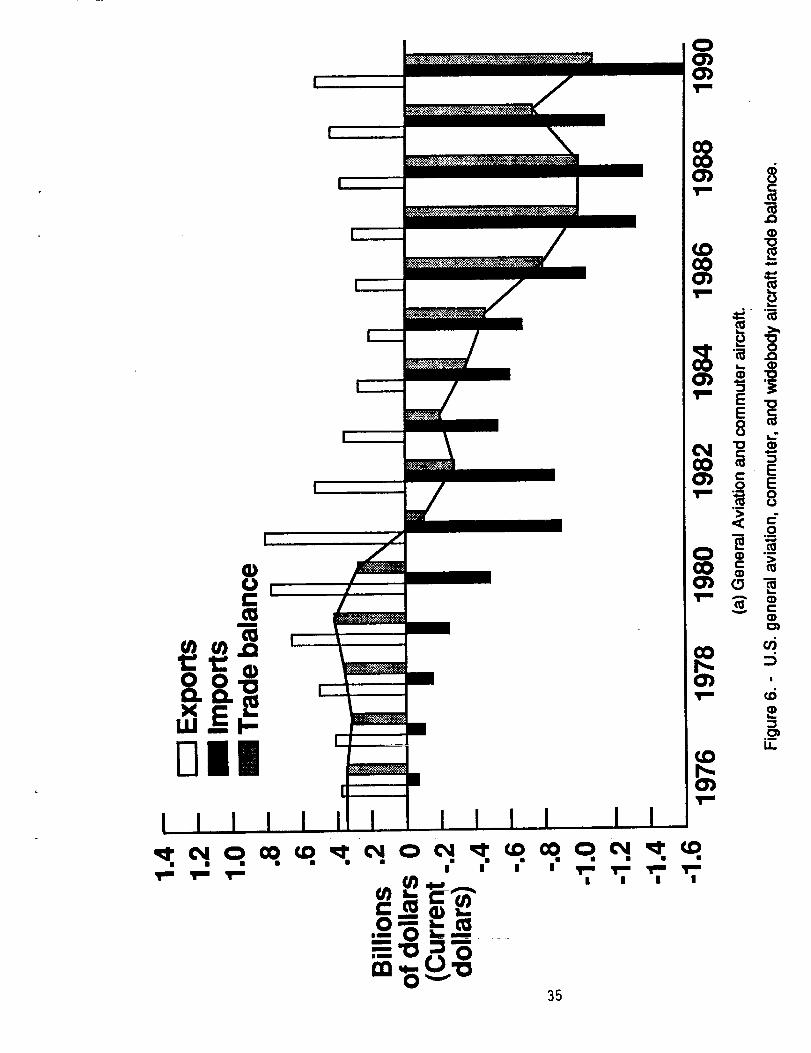
According to the U.S. Commerce Department's statistics, manufacturers in
the United States have in the past maintained a dominance in aircraft production,and consequently, trade balance (fig. 6a and b) that has served to offset the tradedeficit resulting from other industries. The total economic impact of commercialaviation (airline and airport operations, aircraft manufacturing, general aviation) inthe United States has been estimated by the Partnership for Improved Air Travel(PLAT) to be about $595 Billionin 1990 or5.6 percent of the gross national product(GNP). However, in future years this percentage for the wide-body aircraft tradesurplus for the United States may gradually decrease. The highly subsidized Airbus
consortium (ref. 17) has gained significant worldwide and U.S. market shares in thewide-body aircraft trade (projected to be around 30 percent of the world market).While the United States continues to hold a competitive edge in the wide-body(fig. 6b) trade (ref. 12), regional transports are produced almost exclusively outsidethe United States. The dramatic downtum in the U.S. trade balance since the early1980's for general aviation andCorn/nuters (fig. 6a) is believed to be due to the
combined shift in advanced commuter aircraft design and lower production costs toforeign nations and the liability insui'ance costs to the U.S. manufacturers of smallprivate aircraft.
• =
9

Aircraft Trends
The U.S. Regional Airlines Association (ref. 2) reported a total operational
fleet of 1,907 aircraft in 1989. Sixty-eight percent of the total fleet were turbopropaircraft which contributed about 85 percent of the 3.25 million total flying hours.Only 2.2 percent of the aircraft were jet powered. Figure 7 also compares the U.S.
historical and forecasted regional and major air carrier fleet (ref. 18).
In the most highly developed areas in the world (United States of America
and Europe), forecasters predict (refs. 12 and 17) lower traffic growth rates (about6.5 percent) than in the rest of the world, in some cases only half as much from 1990
to 2000. However, the projected commuter aircraft unit builds alone, required tohandle forecast world-wide traffic (fig. 2) by the year 2000 (ref. 2), adds up to a totalof around 14,700. Airplane retirement potential is growing rapidly as the world fleet
ages. Older airplanes (average age of about 15 years) are becoming moreexpensive to operate and maintain. Consequently, depending on retirement ageassumptions, an additional number of commuter aircraft will be required asreplacements. Boeing forecasts (ref. 12) over 3,500 commercial jet airplanes will beretired between 1991 and 2005.
Aircraft Size and Soeed
From the fleet once made up of predominately general aviation type aircraft,
the future regional airline fleet will be increasingly composed of larger, faster, andlonger-range aircraft. For example, Federal Aviation Administration (FAA) marketprojection (fig. 8) are that the average seating capacity of such aircraft is expected to
increase at an average annual rate of around 4 percent, rising from 19 in 1988 to 30in the year 2000. The number of aircraft with under 15 seats (1/3 of the U.S. fleet in
1989) continues to decline. The FAA projects that only about 150 (7 percent of total)of the current smallest regional aircraft will be in service by 2001. Continued salesgrowth iS expected in the medium-size aircraft (15-19 seats) over the next few years
and will account for about one-third of the U.S. fleet. The greatest growth in the fleetis projected to be in the 20-40 seat commuters, that accounted for 17 percent of the
total fleet compared to 8 percent for the larger aircraft. By the year 2000, these twolarger class aircraft are forecast to account for about 63 percent of the total fleet. Asof June 1990, the U.S. regional airlines alone had about 175 new aircraft on order
and 200 options with seating capacity that ranged from 29 to 107.
Based on a recent study, there currently appears to be a growing number of80 to 130 seat, all-new or derivative twinjet aircraft under consideration for servicein the regional market around 1996 (ref. 11). Manufacturers' worldwide estimate
10

this market to vary between 2,000 and 5,000 over the next 25 years, based on fleet
replacements and growth of city-pair routes. The value of this market has beenestimated by the manufacturers' to be between $60 to $150 billion.
A listing of some of the new or proposed regional aircraft being offered in the1990's is shown in figures 9a and b. As can be seen, these aircraft have a widerange of seating capacity while increased speed and range are also of importance.
However, of further significance is the foreign manufacturing dominance of thesenew aircraft being offered. Figure i 0-sun_-arizes the seating capacity, andfigure 11 cruise speed variations with range for in-service and new or modified
regional aircraft being offered. In general, the figures indicate the desire of regionalairlines to purchase faster airplanes with increased passenger capacity in an effortto reduce direct operating costs (DOC). This allows a faster turnaround time, withmore revenue passenger miles in a given day.
7
Figure 12 illustrates the block time variation with seats for several regionalaircraft based on a 500 nautical mile stage length. The results show that small jet-powered turbofan aircraft have block times which are about 30 minutes less than
the new generation turboprops. This reduced block time corresponds to about a20 percent decrease in trip time. As the airlines move to increase size and speed,the average stage length will increase in order to feed their code-sharing partners.The corresponding duration of passenger discomfort will discourage the use ofturboprops on the longer flights. While in the past, the turboprop engine was
considered more efficien t compared to turbofans for aircraft with small seatingcapacity, new demands have made the distinction less clear.
' _ Operating Costs and Technology Influences
In 1979, fuel cost was repoffed as the major contributor to the overall directoperating costs (DOC) for regional aircraft operators as shown in figure 13,cornpared to ownership (insurance and maintenance, etc.) in 1989. The results
shown for 1989 were taken from several different airline fleet operating datapresented in the November 1989 issue of Air Transport World (ref. 19). Theindividual fleet size used for the calculations consisted of: 8 Dash-7's; 11 CVR-580's; 13 F-27's; 12 Dash-8's; 5 Shorts'360's; and 12 EMB-120's. While the fuel
cost/gal has been significantly reduced Over the10-year spread indicated, the totalDOChas-neady doubled from TS._s_ea_:rnile to 14.75 cents/seat-mile primarilyinfluenced by increased costs due to ownership, maintenance, and crew. Assumingthe cost of fuel and crew do not experience radical increases, growth of the regionalaircraft-fleetwill De guided primarily by ownership costs.
:_ _ -_ _ ° _ -_-_I-_2:L__-_-I .....
Figure 14 compares the actua/DOC against seats for the previously
discussedindividual regional turboprop and jet fleet data with similar 1989 results
11

for wide-to-narrow body aircraft, taken from the March 1990 issue of Air TransportWorld (ref. 20). These larger aircraft fleets used in the calculations consisted of: 4B747-400's; 32 B747-200's; 4 A320's; 33 B757-200's; 62 B727-200's; 3 MD-87's;19 DC9-30's. Because of the combined smaller fleet and aircraft sizes, all of thenew aircraft suffer from a lack of economies of scale and schedule or utilization
inefficiency. This will not only affect operating costs directly but indirectly throughlower average daily utilization. The results (fig. 14) clearly indicate a gradualdecrease by a factor of 5 in DOC between 30-50 passenger (average DOC = 15
cents) and the 400 passenger (average DOC = 3 cents) aircraft. In terms ofrepresenting aircraft fuel efficiency, figure 15 summarizes the available seat-milesper gallon (ASM/GAL) against average stage length for a range of aircraftoperational data. The values of ASM/GAL shown (fig. 15) were obtained bymultiplying the seating capacity of each aircraft times the average stage lengthdivided by the gallons of fuel burned. The larger the value of ASM/GAL, thegreater the efficiency. It is clear from figure 15 that the larger jet aircraft with longstage lengths are the more fuel efficient. Thus, it seems that fuel prices still
represent a large element of DOC after ownership and will, therefore, continue to bea driving factor for the introduction of new technologies. _ : _:
To be competitive in the air transport market (fig. 16), it is mandatory toreduce the aircraft production costs through better and shorter design time,
manufacturing, and validation (ref. 21-22). The question often asked by the aircraftmanufacturers and the regional airlines industry was, "What do the aeronauticaldisciplines of propulsion, aerodynamics, airframe materials, avionics, and control
systems have to offer those who regard them from the aircraft production cost (non-recurring cost, market acceptance, return on investment) or the aidine operationalcost (ownership, crew, maintenance, fuel, landing fees, navigation costs)viewpoint ?". In other words, technology innovation will be tied to the ultimate goalof providing real benefits to the operators in terms of lower costs and increased
revenue potential, while ensuring safety factors (refs. 22 to 27).
When assessing the changes in direct operating costs as a result of applying
new technology, the results depend not only on the changes in weight, fuelconsumption, and maintenance, etc., but on the aircraft sales price. Figure 17(ref. 22) attempts to illustrate the estimated effect of applying an arbitrary 5 percentchange to several technologies on DOC. Obviously, all factors cannot be changed
equally and the integrated effect will influence overall improvements. The resultsare based on a 100-seat aircraft with high bypass ratio engines and a 500 nautical
mile range. However, the estimate (ref. 22) indicates that new technology
improvements providing reductions in drag, engine SFC, and structural weight willchange DOC between 2 to 3.5 percent. It is interesting to note that a change ofabout 3 percent in DOC can be realized from reduced flight time due to improved airtraffic control (ATC). On the other hand, the production costs have been reported torepresent a larger percentage (about 75 percent) of the initial price and of the cost
12

I
!
!
<,
5
of ownership (ref. 22) as shown in figure 18. Therefore, one of the most significantreductions in economics can result from improvements in production costs that areinfluenced by improved design methods, procurement, manufacturing techniques,
and batch size. Because of the interrelated benefits, resulting from all aspects ofadvanced technology and proper application to various aircraft, it is not reasonableto establish precise values for the worth of individual technologies.
_ FUTURE MARKET FORCES
Constraints and Stimuli
...._ As discussed previously, there are many factors that contribute to the marketpotential and direct operating costs and should be considered by the aircraftdeslgi_efand operator. Various constraints that will influence growth and
development are economics, fuel costs, airport congestion (fig. 19), environmentalfactors (figs. 20-22), and application of technology. Areas that may stimulate growthare electronic communications, advanced ground transportation systems, and tradebalance.
All of the above indicated constraints and stimuli are difficult to quantify andprioritize in advance. It is clear that a major political conflict or economical downturncould lead to a war or depression, but, on the other hand, no explosive economic
growth is anticipated worldwide. Therefore, it is understood that they are to beconsidered in the normal sense of growth and forecast.
Regional Aircraft -- New Market Issues
There are several unresolved issues facing industry as to how far can we goin improving aircraft technology in order to overcome the constraints of fuelconservation, noise and emissions, saturation of airspace and competition fromsurface transportation. To what extent can market requirements be met by applyingtechnology to derivative aircraft rather than new aircraft? If market requirementscannot be met, what kinds of new aircraft should be developed or what radical
changes to existing air-transport systems could be implemented? What newsystems might emerge before theend of the century? Will the regional jet reshapethe market? Do economics favor building a jet with fewer than 100 seats? Will new-
technology high-speed turboprops provide the same seat-mile operating cost as forsimilar jets when applied to air(raft With twice the seating capacity? Can theregional-jet l_eLlsed-toDyp-_._T'naibr hubs as a "high-density feeder" and reduce air
traffic .cp_rlgestion? Will more and more regional travel be linked to travel with themajor aid ines?-Wmthe regton-b.l-iftcTu_t_ Continue consolidation of carriers while
the market expands?
13

IMPACTOF TECHNOLOGY
Advanced Technology Influence on DOC
The design of an all new aircraft certainly offers a unique opportunity tointroduce the combined improvements from advanced technologies generated inthe various aeronautical disciplines while at the same time it can introduce high risk
to investors. A new design will require a large initial investment in non-recurringcosts which can only be recovered if the market accepts the product with itsbeneficial influences in sufficient numbers to ensure a timely return on investment.
Technology advances anticipated in the next several decades are expectedto represent a steadily improving state-of-the-art in all the major disciplines. Exceptfor possibly laminar flow wings, no radically new technology which has not alreadybegun in modest application is envisioned. Therefore, the aim will be to single outsome of the major areas where identified advanced technology developments(fig. 23) and future applications could contribute to overcoming the constraints andreducing costs. The main technology targets include aerodynamics, structures and
materials, propulsion, systems and equipment, active controls, flight deck, andnoise. The inter-relationship of these technologies is very important and thebeneficial gain is dependent on how the technologies are used to give the bestoverall result. A rough estimate of DOC can be determined based on evaluatingtechnology trade-offs while holding the target performance requirements constant(ref. 23) as follows:
1. ADOC (%) = 0.12A fuel + 0.35A Price + 0.15A MTOW
2. APdce ($) = 3.8 + 4.0 T/To + 2.5 S/So + 5.7 W/Wo
where T = SLST of the engine
S = severity factor on systems and landing gearW = airframe weight less enginesTo,Wo, So = reference conditions
A = change
Calculations were made without finance cost included and based on the ...........
assumption that the changes in fuel cost and airframe price with maximum takeoff
weight are strong functions of DOC changes. The airframe price changes (DPrice)were based on engine data, systems severity factor, and airframe weight lessengines. Fuel price and maximum takeoff weight are based on current price and
design weights. It should be emphasized that the DOC results calculated by this
approach are rough and simplified. It is especially difficult to estimate the
14

maintenance and airframe labor per flight hour based on weight which will tend toreduce the expected benefits.
Figure 24 is an attempt to estimate the influence of potential advancedtechnology applications on DOC for a market forecast new regional aircraft having
propfan engines, 100 passenger seating capacity, fuel at $1/US gal, 1500 block-hours/year, and 500 nautical miles stage. The most important result is that DOC canbe strongly influenced by advanced airframe technology. The most obviouscontribution comes from airframe cost reduction that is price dependent, with the
next being fuel and crew of nearly equal magnitude. Financial costs are notincluded. The following paragraphs list technology influences (See fig. 24) based
on detailed discussions presented later.
Crew--safety requirements will continue to demand a minimum of two crew.
Emphasis wiiibe placed on more efficient time utilization and reduced work load byactive control systems. A potential long range forecast will include an ergonomiccockpit. Computer integration and fully integrated displays will boost both groundand aircrew mobility and productivity. A maximum Influence of 20 percent isestimated.
Airframe--the production costs constitute a very large percentage of the initialcost and of the cost of ownership (depreciation, interest, etc.,). Reductions in
economics can stem from improvements in integrated design, manufacturing
techniques, production learning along with quality and market quantity. A maximuminfluence of about 40 percent is estimated.
Fuel-prices will continue to be a driving factor for the introduction of newtechnologies. To fully realize the potential fuel savings for next generation engineswill require an integrated design approach involving aircraft systems, aerodynamicsand structures. The potential gains will further be weighed against problems posed
by generated noise and vibration, blade retention, and limitations on size, speed,and aircraft configuration. A maximum influence of about 20 percent is estimated.
Maintenance--savings can be generat-ed_by computer'controlied digital
avionics_through centralized-fault detect_ondisplays, cabin intercomunication, data
reporting systems that can reduce maintenance training and tracking, engine andairframe spare parts orders that reduce overall turnaround time. A maximuminfluence of around 1i pement is estimated.
The above estimated individual technology influences on DOC can obviously
amount to millions of dollars in savings unless extra development and production
costs along with engine price for a new aircraft prohibit any improvement of returnon investment.
t5

Technology Opportunities
In general, recent technology developments have been directed towardapplication to large transport aircraft. However, these same developments mayhave potential application to future larger commuter aircraft design. Technology
opportunities subsequently follow.
Advanced Wina Desian
Numerous referenceable papers have been published in recent years on the
progress made in advanced wing design and their performance potential since thedevelopment of the supercriticai wing. This progress can be summed up in terms ofthe drag divergence Mach number variation with thickness-to-chord ratio as shownin figure 25. Obviously, a trade must be made between increased design cruisespeed due to thinner wings, and increases in thickness that permit use of higheraspect ratios with less weight penalty and increased lift-to-drag ratios. Some of thistechnology has been implemented in the design of advanced aircraft. In asimplified way, figure 26 is an attempt to show relative efficiency of advanced wingtechnology in terms of the equivalent improvement in wing thickness-to-chord ratio,lift coefficient, and Mach number normalized for the effects of wing sweep. The
ultimate goal is to achieve a relative efficiency of E = 1.0 for wing design through thefollowing well established and combined performance parameters:
(3) E = M.L + 0.86 (t/C)_L+ 0.12 CLL
where M_L = Mach number normal to leading edge
(t/C).L = thickness-to-chord ratio normal to leading edge
Cl .L = lift coefficient normal to leading edge
The constants in equation (3) are based on fairings of a large data base generated
over the years for individualized parameters (see for example ref. 22) that evolvedfrom advanced designs. A net change of M.L = 0.01 being equivalent to a net
change of around t/C.L = 1 percent is seen in figure 26 to be representative of the
progress over the past several decades. Finally, improvements in overallaerodynamic efficiency (ML/D) of around 15 percent have occurred over the past
15 years (refs. 22-23).
16

Laminar Flow Technoloav
The overall aerodynamic performance of an airplane is, in general,
characterized by the lift-to-drag ratio which is a strong function of the wing aspectratio. Historically the lift-to-drag-ratio seems to be leveling out. Thus, recent and
future technology efforts will continue to be directed toward achieving laminar flow(through natural or controlled means), giving the potential for large drag reductionsover the wings at cruise lift conditions (ref. 28). The advent of natural laminar flow
(NLF), laminar flow control (LFC) or hybrid combinations of NLF/LFC along withhigh lift devices have been a major factor driving new designs and should influenceDOC.
In the late 1970's, NASA began Weighing the benefits and costs of the
laminar flow technology. Design and testing of advanced airfoil concepts in theNLF and LFC class has grown steadily since then. A summary of the experimentalverification of design performance results is shown in terms of maximum lift
coefficient (CI)max (fig. 27) and minimum drag coefficient (Cd)min (fig. 28) variationwith chord Reynolds number Rc, for these latest NASA developed NLF airfoils (ref.
29). The results indicate reductions in drag as high as about 60 percent arepossible. This could result in increases of 15 percent in the lift-to-drag ratio. Offurther importance is that essentially no loss in the lift curve slope occurs whenboundary layer transition is fixed in the leading edge--only the drag increases to
that of an equivalent turbulent wing as expected (fig. 29). While these results_proved promising, much work remains to be done to establish practical design andfabrication solutions and Operational viability of this technology.
Analysis using both wind-tunnel and flight natural laminar flow (NLF)
experimental data as input to compressible boundary-layer stability codes (ref. 30)shows that instability (Tolmein-Schlichting waves, T-S or crossflow vortices, CF)builds up with increasing chord Re)'i_01ds number (Rc), leading-edge radius, and
wing-sweep angle (reL 31). The effect Of leading-edgesweep (A) on experimental
transition Reynolds number (Rtr_or the-se-d=atais shown in figure 30 for a range ofMach number and Rc. Correspondingly, the nominal limits of NLF in terms of Rcand sweep are shown in figure 31 and are based on expeirmental flight data andinfinite swept-wing computations (with a typical favorable pressure gradient) as
indicated by the line fairing_,. -S_bbp-induced crossflow effects become dominant
above about 15 degrees (figs. 30-31). A typical NLF wing with moderate sweep (12degrees), high aspect ratio (9-10) and low taper ratio is shown in figure 31 for short-haul aircraft. ................................................
From figures 30 and 31, it is assumed that NLF could be maintained over
50 percent chord of the upper and lower wing surfaces. NLF was assumed toextend over 80 percent of the span. Thus, based on the experimental laminar and
17

turbulent variations of total drag with Rc, shown in figure 32 for several high-speedairfoils of different thickness ratios (0.12 < t/c < 0.16) and lift coefficient of Ci = 0.6,
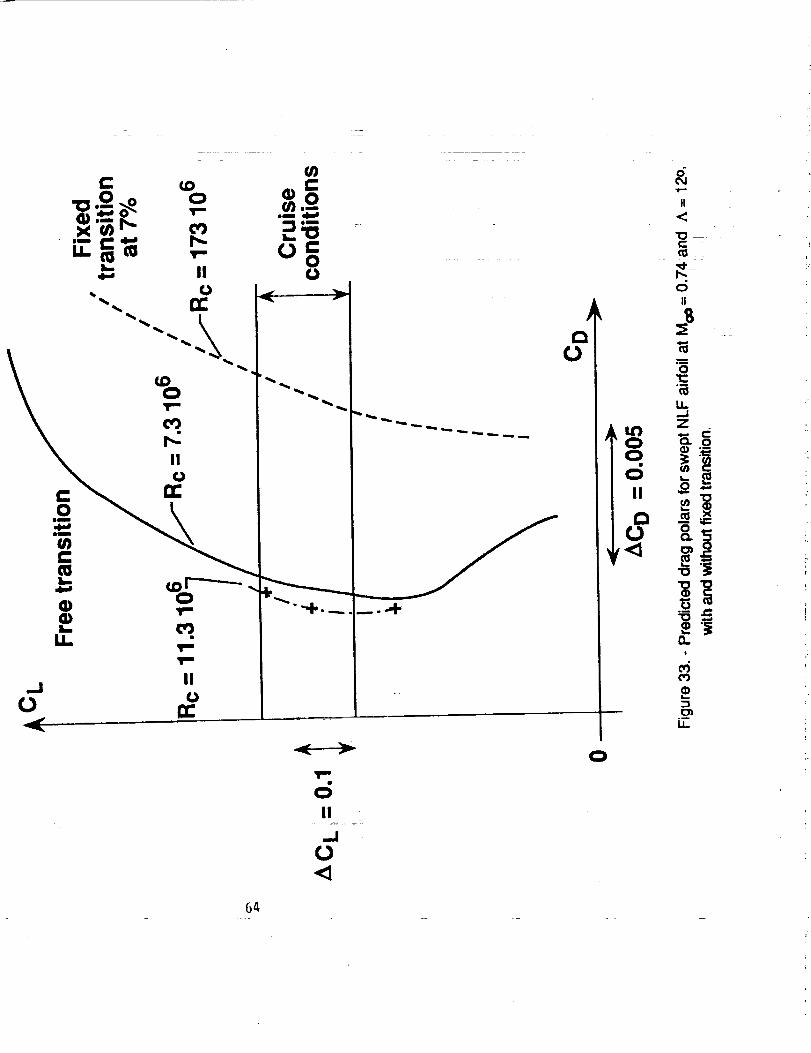
friction drag reductions of the order of 50 percent are anticipated. Figure 33 showsexample drag polars for a swept NLF airfoil concept with and without fixedtransition. Since the wing is expected to contribute about 50 percent of the total
aircraft friction and pressure drag, realization of this amount of NLF would saveabout 10 percent of the aircraft cruise drag. However, since the maintenance ofNLF is known to vary with lift coefficient, altitude, and speed, laminar flow is
expected to be lost at takeoff influencing the block fuel consumption.
It should be noted that, even with fixed transition on advanced technology
NLF wing designs, good performance characteristics have been demonstrated toexist for both wind-tunnel and flight tests (figs. 29 and 33). However, NLF wings are
known to exhibit earlier drag rise with Mach number than that for turbulent wings.Furthermore, the application of conventional leading-edge slat or flaps for high lift
will likely trip the flow, especially at low speeds.
Hiah Lift Aerodynamics
Equally important, are the low-speed characteristics and high-lift devicesrequired for improving takeoff and landing performance (L/D) while maintaining
weight and cost efficient systems to minimize ownership expenses. A comparisonof flight data for the variation in maximum lift coefficient with flap angle is shown infigure 34 (refs. 32-33) for several aircraft wing aspect ratios and trailing-edge flapconfigurations. Significant gains in maximum lift have been achieved through acombination of increased wing aspect ratio (AR) and advanced single slotted flapsystems relative to double slotted flaps on equal or lower aspect ratio wings.Experimental flight results and theoretical limits of maximum lift coefficient arecompared in figure 35. The data and theory diverge and indicate that an upper limitof maximum lift coefficient is being reached with unpowered flap systems as aspect
ratio is increased (ref. 34).
While the limited data (fig. 35) for upper surface blowing (USB) indicate
large gains can be made, the added complexity for such systems on commutersdoes not seem warranted at this time. Increased wing sweep tends to degrade
maximum lift coefficient for a given configuration complexity as shown in figure 36
(ref. 34). Therefore, current and future high-speed wing commuter designs willrequire careful integration of high-lift systems on swept wings.
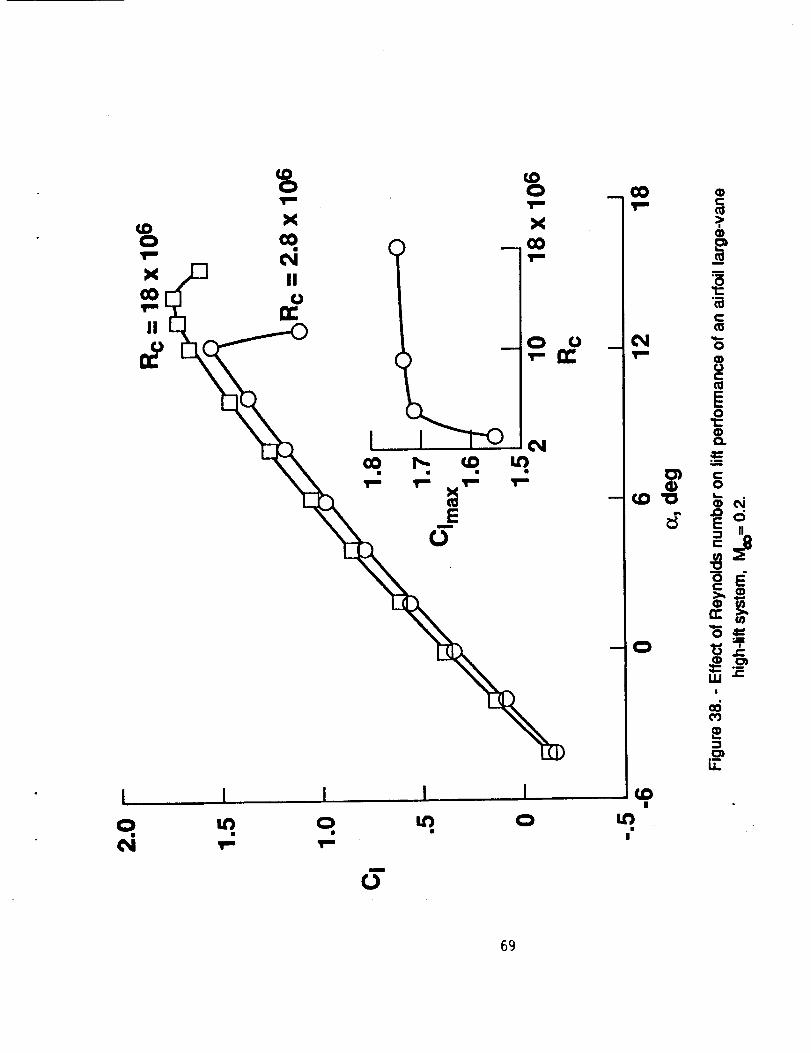
The potential performance improvement for a mechanical high-lift system is
shown in figure 37 by using results from a wing with aspect ratio AR=8, sweep angleof 35 degrees, and flap-angle settings from 0 to 60 degrees (ref. 34). The potential
18

performance gain over the range of conditions shown is seen to be that generatedby the shaded band bound by the polar envelope of the data and ideal trend.Consequently, the large gains to be made in UD are at higher values of lift (fig. 37)through improved understanding of the effects of compressibility (fig. 38), highReynolds number (fig. 39) (ref. 35-37), and three-dimensional flow.
: _-: _ i _
Fuel price increases in the early i970's inspired manufacturers to develop
the first high by-pass-ratio (HBPR) engines specifically for long-range transport
aircraft (ref. 38). The primary design objectives of the engines were improved fuelconsumption, reduced noise, reduced component weight penalty, higher turbine-inlet temperatures, and good operational and maintenance characteristics. As
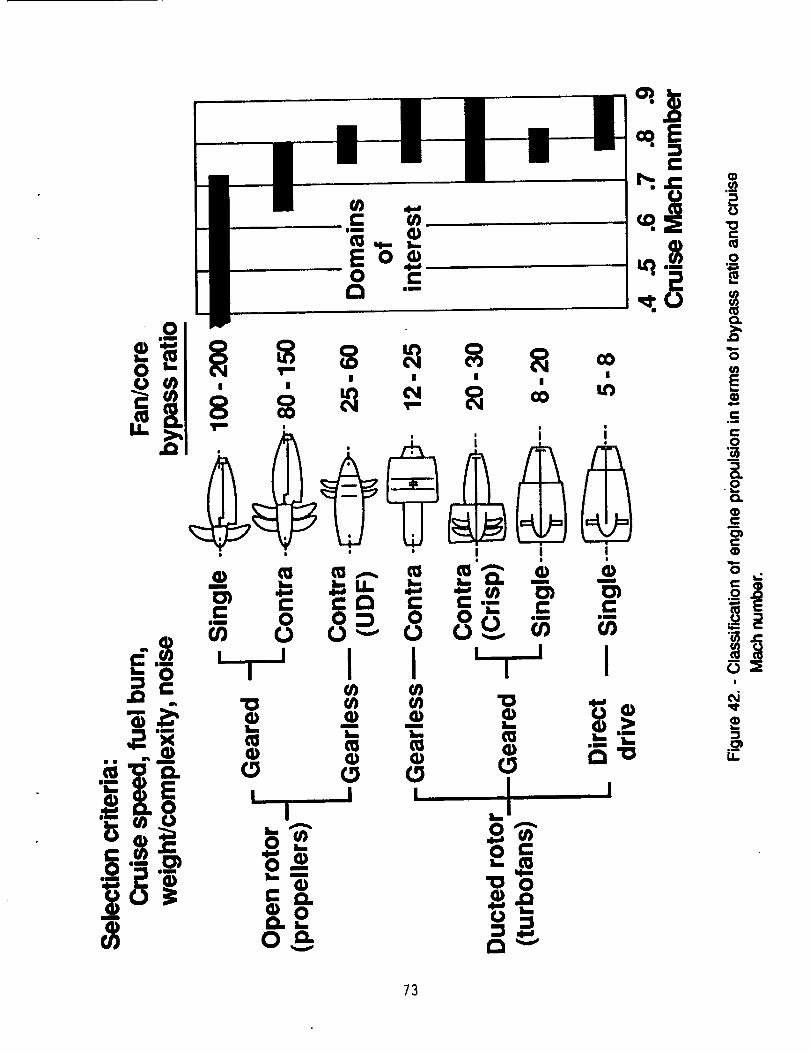
indicated by efficiency in figures 40 and 41 and classified in figure 42, future ultra-high by-pass-ratio (UHBPR) engines promise large fuel and propulsive efficiencyimprovements through lowered SFC (refs. 38 to 42). For current turbofans, thisanticipated improvement may be lost by excessive weights due to the fan shroudand thrust reversers along with associated drag effects. The open rotor (unductedfan or propfans) and advanced ducted fans promise improvements of the order of
25 to 40 percent reduced SFC depending on the comparable turbofan chosen.Based on the same core technology, counter-rotating propfans indicate fuel savings
of about 25 percent. These engines offer larger fuel savings and light weight, bothof which must be balanced against the constraints posed by noise, vibration, bladeretention, and limits on aircraft size, speed and configuration.
There appears to be an emerging international market for 80 to 120-seattransports (ref. 11) as illustrated in figure 1. Depending on size, speed, range, andutilization requirements, a single aircraft with advanced propulsion systems may not
outweigh the advantages of an aircraft family in this same market that integrates allaspects of new and proven technologies in the areas of aerodynamics, propulsionand structures if the fuel price remains nearly constanL This economic gap betweensmall and large aircraft is illustrated in figure 43 for new technology turboprops andjets (ref. 21). Individual design studies may very well indicate that, within the presentor near term economic conditions, the turbofan could offer the better solution in
terms of risk, development efforts, layout, and economics of a 80 to 120-seat aircraft.
The current prevailing wisdom regarding propulsion configurations for market
forecast for larger, longer range transports is that ducted ultra-high by-pass engineswill be required. This is supported by the continued high-cruise (0.82 < M < 0.85)speeds Of large airliners, trends toward similar higher speeds for commuters, wherethe efficiency of the unducted propfan is reduced (fig. 41). The maximum takeoff
thrust requirements projected for future high-speed commuters would be between10,000 and 20,000 pounds.
19

An important factor in the selection and optimization of engine installation forcommercial transport aircraft has always been the engine by-pass ratio. Improvedengine specific fuel consumption (SFC) or DOC can be achieved throughtechnology advances (ref. 38 to 42) in thermal and propulsive efficiency asindicated by the example in figure 44 which is for a turboprop (ref. 41). Thermal
efficiency requires increases in overall pressure ratio, turbine inlet temperatures,and component improvements. Propulsion efficiency may be improved throughincreased engine by-pass ratio with corresponding reductions in fan pressure ratio.Whereas a two-stage high pressure turbine (HPT) is optimum using SFC as thecriterion, a one-stage HPT shows up optimum on the DOC plot due to the savings ininitial cost and maintenance based on studies of advanced technology engines byGeneral Electric, Garrett, and Allison. Their results indicated that the advanced
ducted propfans would be about 25 percent more efficient than the same sizecurrent engines and around 8-16 percent better than a second generation ofengines. They are expected to weigh 10-20 percent less, cost within 10 percent,and require significantly less maintenance (fig. 45). At 100 nautical mile stagelengths, these improvements lead to 10-20 percent trip fuel reductions and6-20 percent reduction in DOC depending on engine baseline and size (fig. 46).The indicated improvements in DOC are, of course, dependent on fuel price andpressure ratio (ref. 41).
As fan pressure ratio is reduced (bypass ratio increase), the direct-driventurbofan has to accommodate a number of factors that can reduce engine efficiency
(fig. 47). Because the fan-tip speed reduces as diameter increases for a giventhrust, the LP-shaft speed drops. This will lead to an increase in LP-shaft torquewhich compromises the design. The LP turbine will require stages of increasingly
larger diameter to avoid unacceptable losses in efficiency. While the geared fancan overcome these problems, the gearbox inefficiency and installation penaltieshave to be taken into account (fig. 47).
Whether geared propfans or gearless UDF engines are considered in theaircraft design, the open rotors with helical-tip speeds greater than Mach 1 cancause more near-field noise than shrouded fans that tend to shield noise. This
constraint along with heavier and required larger diameter for the same thrust maylead to configurational repercussions (i.e., cg location) that negate fuel-flowbenefits.
Engine designs for significant SFC gains and aerodynamics for higher L/Dare becoming more complicated and more difficult to achieve. This is due toattendant compromises on other aspects of the technical balance sheet such asweight, cost, reliability, maintenance, etc., and also in part to the DOC, regulatoryand environment issues. Recent developments to meet forecast traffic demandssuggest that high-bypass-ratio engines are going to dominate well into the next
century (fig. 48) from reference 35. Even if UHB engines materialize in the near
20

J future, their rate of assimilation may be slow (ref. 40). The development ofadvanced high-temperature and light-weight materials, cost of replacement,
industry capacity, and economic and environmenta! (noise and emissions)conditions will tend to drive the rate of change.
Noise Reduction
While the commuters and wide-body types of the 1970's and 1980's, with low
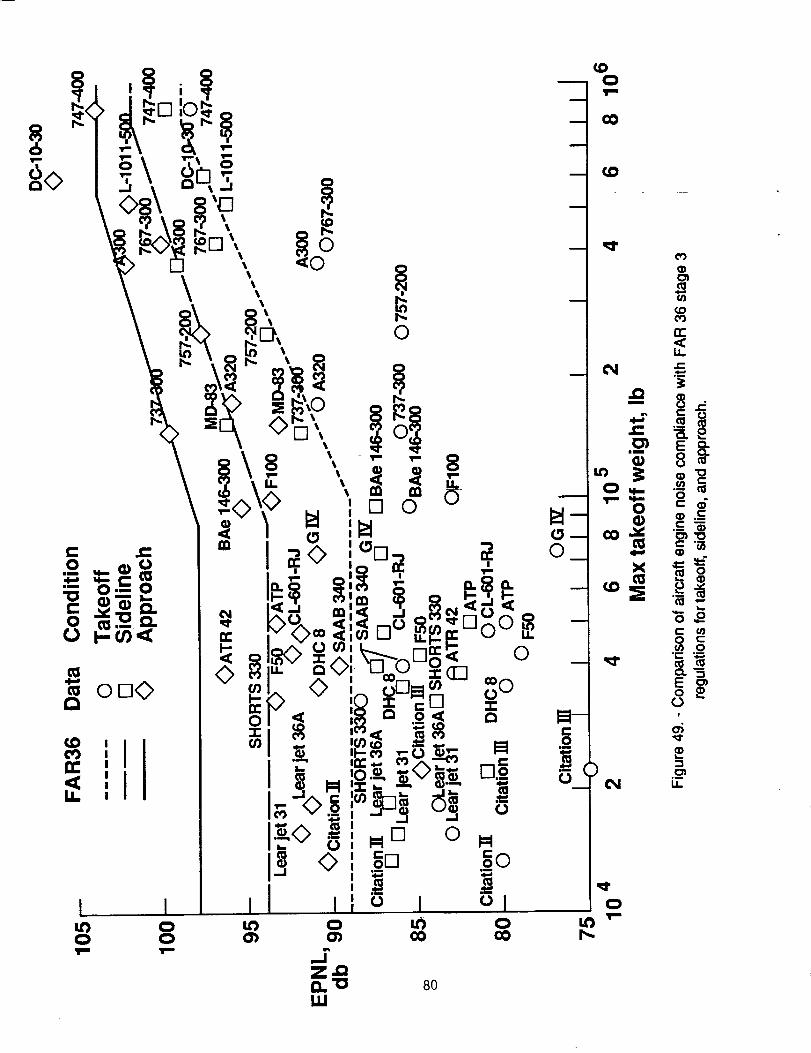
and high-bypass-ratio engines, satisfy the present noise requirements (FAR 36STAGE 3) as indicated by the data in figure 49 from reference 43, the narrow-bodytypes with old technology and noisy engines will be phased out of operation by theyear 2000 based on recent FAA regulations. Thus, under the ever-increasingimpact of public pressure, the introduction of new aircraft with advanced technology,quiet engines will become of primary importance.
Figure 50 (reference 44) is an illustration of noise source variation withbypass ratio for turbofans and propfans. While many feel that a technology "floor"has been reached for reducing noise, it is reasonable to expect that the absolutelevel will increase with the development of larger thrust engines required for aircrafteither under development or forecasted. However, there are those who feel that a
potential break-through may come from research in active noise suppression bysource frequency cancellation. Figure 51 shows noise reduction progress forconventional engines by comparing the noise footprint area of an advancedturboprop, typical twin turboprop, with the 90 EPNL noise level footprint of anadvanced turboprop (ref. 44).
Quiet, economic air-transport systems can be achieved only as a result of anintegrated approach by the engine, aerodynamic, and the airframe designer inclose liaison with the aircraft operator. Judgments will have to be made to obtainthe desired balance between noise and other major design parameters such asstrength, weight, performance, economics, airworthiness and reliability. Althoughnoise has become an increasingly important factor in determining the aircraft
configuration and its operation, the achievement of quieter aircraft must not becompromised for safety.
Materials
Weight reduction Continues to be one of the major objectives of airframe
manufa=urers. Reducing aircraft weight is one of the more effective ways ofreducing drag, increasing payload and consequently, reducing the DOC. Thus, the
development and application of advanced metallic materials and composites withembedded high-strength fibers has been progressive over the past several
21

decades. Figure 52 shows the anticipated materials distribution and corresponding
weight savings, resulting from their application (ref. 42), for an aircraft having thesame geometry. There has been an increasing application of better aluminumalloys, steels, and titanium for primary structures as also shown in the figure. The
application of composites such as glass fiber, Kevlar, and carbon fiber have steadilyfound their way on secondary structures and furnishings, and significant weightsavings are anticipated over the next decade from their use. There is considerablespeculation by U.S. manufacturers as to when composites will be introduced andaccepted into the primary structures of civil aircraft (ref 45-46), even though Airbus(A300-310 vertical tail and A320 empennage), Beech Starship, and several militaryaircraft are flying today with carbon fiber materials in their primary structure.
Materials that are combinations of aluminum alloy and layers of composites
and aluminum-lithium (AI-Li) have promise for considerable weight reduction, high
strength, and damage tolerance. Of major importance is that these materials mayoffer improvements in structural efficiency, without changes in conventional designand manufacturing techniques or maintenance. However, manufacturing costs, lifecycle fatigue, and inspection of such materials requires further research.
Avionics and Controls
One of the essential features of advanced aircraft is clearly going to be the
integration of computer technology that includes controllers and fully integrateddisplays. This technology will allow improved flight management by providing cabinintercommunications, a constant watch on systems and information on a need-to-
know basis (Automatic Flight System), and Air Traffic Control (ATC) functions.Integrated digital technology through computers will be crucial to fly-by-wireoperations with full authority engine control. Such systems will enhance safety byensuring that the aircraft will remain within its flight envelope, provide continuous
monitoring of required information useful for maintenance purposes, and providecentralized fault or malfunction display (fig. 53 ). The Heads Up Display (HUD)
system for example, allows Alaska Aidines to fly in fog conditions more often.There may be associated economic benefits due to overall reduced insurance feeswith the onboard backup safety systems. All of these advanced features, when
applied, can significantly increase the crew productivity.
Flight-path control systems (especially for approach and landing) have beeneffectively applied for many years. However, such technology continues to advancefrom the reliability and safety standpoint. When applied, more advanced systemsfor takeoff monitoring, thrust management and flight optimization will ultimately
result in better fuel economy for commuter aircraft.
22

Active controls technology may permit increases in the flight envelope,
speed, buffet limits, or allow different design configurations with weight savings, butstill requires extensive research before incorporation into civil aircraft. One of themajor complaints by commuter passengers continues to be that of "ride roughness."It can be shown (fig. 54) that the responses to the gust load factor (Dg) for various
existing fixed wing aircraft (GA, commuters, transports) varies adversely with wingloading (W/S), for constant lift coefficient and gust velocity. Application of activecontrols may result in optimum design with improved W/S.
Future Market Scenerio
With the 21st century just around the corner, the aviation industry finds itselfin a current mode of recovery and facing some hard facts for the future. Airport
congestion has joined the more traditional problems of safety, reliability,profitability, and environmental compatibility. Thus, the action of the above-mentioned constraints and stimuli will influence the forecast market traffic and sales
of regional or short haul aircraft.
Against this background and given the technology level of today's transports,it seems that the next generation of regional or commuter aircraft will be the product
of a gradual evolutionary process based on market needs, rather than revolutionaryor totally new designs, it appears unlikely that there will be massive change in airtransport technology as obvious as, for example, the jet engine. Thus, the followingsummary is offered.
1. The future worldwide forecast "short haul" market potential is large
(figs. 2 and 3).= .............. + .......... :
2. The major forecast expansion areas not currently covered by their own
aircraft production are Japan, China, Latin America, Africa, and the Middle East.
3. Implementation of new technology to reduce airframe manufacturers costs
and to reduce direct operating costs to operators will be the key requirement driving
aircraft design.
4. Problems forecast in air traffic control (ATC) saturation and airport
congestion require solutions and will greatly influence regional airlines operationsand future aircraft design.
5. _.Forecast for larger regional aircraft to handle traffic will require designers
and operators to meet more stringent environment regulations (pollution, noise,emissions) and to improve passenger ride quality.
23

6. While the regional airline provides the future method for thebusinessman's travel, new communications systems will enter the market and
provide competition.
7. The integrated effect from advancements made in aerodynamics,
propulsion, and structures will continue to be effective in meeting forecastchallenges.
CONCLUDING REMARKS
Both the U.S. and foreign commuter airline industry continues to experience
a growth trend, in the past decade, the regionals have experienced a tremendousincrease in revenue passenger miles (RPM) and number of aircraft used. The FAA
predicts that, by the year 2000, the number of RPMs will more than double. Thus,reasonably firm conclusions can be drawn on the way the market will developthrough the end of the century, with regard to developments in air transport systemsand aircraft, barring any major unpredictable international domestic or economicsituations. The conclusions on the market and operating environment clearly
interlink with technical possibilities and the development of future air transport
systems. Code-sharing agreements between small carders and the majors willcontinue to be essential for the survival of regional airlines.
The regional fleet market is clearly demanding not only a large replacementof older aircraft for more economic and environmentally efficient aircraft, but with80 to 130 seats due to forecast traffic. In fact, the smaller capacity in-service U.S.
aircraft may now be considered in the emerging higher capacity commuter class.Currently, the production of commuter type aircraft is almost exclusively outside ofthe United States. This has led to a trade inbalance for these type of aircraft. A
reversal in this trend requires the U.S. manufactures to enter the market in an
aggressive manner. The aircraft configurations under development or projected areexpected to provide substantial benefits to the operator, passenger, and thecommunity due to the incorporation of advancing technology. In general, the
regional aidines are moving toward more modern and effective fleets with greaterpassenger capacity and comfort, reduced noise levels, increased speed and longer
range.
Technology disciplines will continue to advance and be directed towardimproving both the economics and performance of aircraft. Whereas the benefitsfrom individual technologies may be small, the overall integration in existing andnew aircraft designs will continue to produce improvements in direct operating costs
and competitiveness. Since production costs are equally as important as pure
24

technical advances, research and development into means of improvingmanufacturing methods and production efficiency is paramount. Therefore,advances on a broad front are essential toremain competitive, especially in today'smarket.
..... _ _ ........ _ _ , _, ,_ ! _ _ ,
The problems of saturation of the airspace, the airport, and the supportingground facilities have emerged again and are forecast to worsen. It is, therefore, feltthat necessary studies and research be conducted in a timely manner so that weare prepared for the implications of the forecast explosive growth in the air traffic
system.
_25

REFERENCES
.
.
1
1
o
.
.
So
g
10.
11.
12.
13.
Williams, Louis J.: Advanced Technology for Future Regional TransportAircraft. SAE 1982 Transactions Sect. 3-Vol. 91. pp. 2481-2497.
1990 Annual Report of the Regional Airlines Association. Deborah C.McEIory, Editor. .............
Lopez, Ramon: U.S. Regionals See a Healthy Future. InteraviaAerospace Review, June 1990. pp. 462-463.
The Battle for Regional Power, Flight International, July 3-9, 1991,pp, 34-36.
Fotos, Christopher P.: Regional Airlines Must Strengthen Ties to MajorPartners in Next Decade. Aviation Week and Space Technology, June 17,1991. pp. 173-174.
Fotos, Christopher P.: Regionais Grapple With Era of Market Consolidation,Aviation Week and Space Technology, June 25, 1990. pp. 38-42
No Matter Who Owns Them, Feeders Need Entrepreneurial Spirit,L'Osservatore, Professional Pilot, January 1990. pp. 62-63
GUson, Charles: Regional Jet Wars, Flight International, July 3-9, 1991.pp. 32-35
Lyson, M. W.: Jets, Props and the Airline Customer, Commuter AirInternational, September 1990.
In Service Regional Aircraft Charts, Interavia Aerospace Review,June 1990.
Miller, Barry: Crowding Out the 100-Seat Market, lnteravia Aerospace
Review, August 1991, pp. 29-33
Current Market Outlook, Boeing Commercial Aircraft Group, the BoeingCompany, Seattle, Washington, DC, 1991.
Ambrose, Mike A.: Regionals are Vital for Tomorrow's Europe, Interavia
Aerospace Review, June 1990, pp. 458-460.
26

14. Europe: Regional Airlines Spread Their Wings, Aviation Week and Space
Technology, June 25, 1991 .......
15. Proctor, Paul: Strong Asian Economy Boosts Outlook for Airlines Industry,Aviation Week and Space Technology, May 27, 1991, pp. 85-87.
i
16. Asia-Pacific: The Projected Bright Spot for Sales, Aviation Week
and Space Technology, June 25, i 990, Advertiser Sponsored Market
Supplement, pp. 5-18.
17. Market Prospective for Civil Jet Aircraft, Airbus Industries (AL/CM-P
3120110190), November 1990.
18. FAA Aviation Forecasts-Fiscal Years 1989-2000, FAA-APO-89-1, March
1989.=
Aircraft Operating Data, Air Transport World, November 1989. pp. 138.19.
20.
21.
22.
23.
24.
25.
Aircraft Operating Data, Air Transport World, March 1990. pp. 146.
Hopkins, Harry: Family MatterS, Flight International, May 9-15, 1990.
pp. 38-39.
Brown, D. G. and K. S. Lawson: The Pay-Off for Advanced Technologyin Commercial Aircraft Design and Operation, Aeronautical Journal,
November 1976. pp. 4612-467.!
Fischer, B.: Configurational Repercussions of New Technologies in the
Design of a Regional Airliner, AIAA 89-2022.
Rek, Bron: Commuter Shop Window 1990, Interavia Aerospace Review, July
1990, pp. 4451-457.
Pilling, Mark: The 90-120 Seat Jet Race is on, Interavia Aerospace Review,
August 1990, pp. 1096-1098.
26. Moxon, Julian"
27.
28.
High Tech Commuter, Flight International, May 29 to
June 4, 1991, pp. 69-70.
Pilling, Mark: Where is the Profit in Building Regional PassengerAircraft? Interavia Aerospace Review, December 1990, pp. 635-639.
Natural, Laminar Flow and Laminar-Flow Control. NY Hussaini and R. W.
Barnwell (editors), Springer-Verlag, 1991.
_.27
j"

29.
30.
31.
32.
33.
34.
35.
36.
37.
38.
39.
40.
Harvey, W. D.; and Bobbitt, P. J.: Toward Lower Drag with Laminar Flow
Technology. ICAS-88-4.1.2, August 1988.
Malik, M. R.; and Orszag, S. A.: Efficient Computation of the Stability of Three-
Dimensional Compressible Boundary Layers. AIAA Paper 81-1277, June1981.
Harvey, W. D.; Harris, C. D. and Brooks, C. W.: Experimental Transition andBoundary-Layer Stability Analysis for a Slotted Swept Laminar Flow ControlAirfoil, Numerical and Physical Aspects of Aerodynamic Flows IV. Springer
-Verlay, Edited by Tuncer Cebeci, 1990, pp. 373-390.
Obert, E.: The Aerodynamic Development of the Fokker 100. ICAS-88-1.6.2,
pp. 807-826.
Eggleton, B.: R and D in the Evolution of the Dash 8 Fifth CanadianSymposium on Advanced Technology Light and General Aviation Aircraft.Ottawa, Canada. May 28-30, 1984.
Dillner, Bertil; May, Fred W.; and McMaster, John H.: Aerodynamic Issuesin the Design of High-Lift Systems for Transport Aircraft. AGARD-CP-365,
May 1984.
Morgan, H. L.; Ferris, J. C.; and McGhee, R. S." A Study of High-Uft Airfoilsat High Reynolds Numbers in the Langley Low-Turbulence Pressure Tunnel,NASA TM-89125, July 1987.
Mack, M. D.; and McMasters, J. H.: High Reynolds Number Testing in
Support of Transport Airplane Development (Invited Paper). AIAA 92-3982.
Valarazo, W. O.: High Lift Testing at High Reynolds Numbers (Invited Paper).AIAA-92-3986.
Fischer, B. and Klug, H.: Configuration Studies for a Regional Airliner UsingOpen-Rotor Ultra-High-Bypass-Ratio Engines, AIAA 89-2580.
Zimbrick, R. A. and Colehour, J. L.: Investigation of Very High Bypass Ratio
Engines for Subsonic Transports, J. Propulsion, Vol. 6, No. 4, pp. 490-496,
July-August 1990.
Peacock, N. J. and Sadler, J. H. R.: Advanced Propulsion Systems for Large
Subsonic Transports. AIAA 89-2499
28

41.
42.
43.
44.
r 45.
46.
Strack, W. C.: Propulsion Opportunities for Future Commuter Aircraft,
Eighteenth Joint Propulsion Conference, Cleveland, Ohio. June 21-23, 1982.
Robinson, P. and Brown, D. G." Short Haul Transport for the 1990's,
Aeronautical Journal, November 1979, pp. 413-436.
Janes - All the World's Aircraft (1984- 1992)
Brown, D. G, and Blythe, A. A.: Noise of Advanced Subsonic AirTransport Systems. Journal of Sound and Vibration (1975), 43(2)pp. 219-236. .......
Sweetman, Bill: Why Composites Wait inthe Wings. InteraviaAerospace Review, -Ap-ril1992; pp. 48-53.
.... ' =
Flint, Perry; and D0noghue, J. A.: Hidden Cost of High Tech. Air Transport
World. July 1992, pp. 22-30.
r
=
..... -= ±
29
I r

m m 0
_ ]oi_l ! I
o g0
¢'1
?
o _
_ •
.__
3O

I0
¢q)
A
00(_1
_ tnI"
LL
It)r,..(3),ira
31

!IiiiI_liii_I__"_._ ..... ..:_::-...-.,:_,,::. -'_,._ .... ._ ....
m
c_
, ......... i i
"0
w
_.._
"1_ '
gtr..
I I I I I I
_2

i _I I
.orr_
I
II
lll
I i I I
I
IllIll
ll
E
CO
Q.C
e-
!
O,j.-
|
33

-,on
_.o13."-m
mm
n',.a
I I'"
\\ \
\\ \,, _
I ! ! ! I
(/_ E 34
13.
o
(/)c
Ec
O,.¢..
3¢=
0')
¢=-¢=
=,-.o
!
L_
I.L.
mi--
m
'---'I I I I ! I I I I
• • • • • • am D in
•o _'o"6
3"0
8 _2
8 ,:
C
,-._
_ ,
.___
I I Ioo 0 c_ _
I l i I
35

%%
UC
m
_ ...... "_ _ _ _ .'-_._:":,
!
V
|
A 0
I1)
_" ui
*u
II | |
36

|I
I
II
EE0
m
i
q_
@Cli
c_
!
t_
-i
LL
.C
37

I=-
_0
I.==
I -= c_
ii_lm
Z _
38

3g

40

_-' Q.
o _B
_° _
III
!j..z
00
I I I
41
!
0"_
_ __
&
0

_, i I i ! i1 !1 !ii !1 !i
I 0
42

43

m_
44

I,I,I
I I I I I
0
0
45

__ _o
0 ',,@'
00
000
t,l')
II3
+,,,,,,,
,__++°+, +m,
_ ,_ _ .e'-l_
0 '
.__1.1.
00
0


oo
.C:
I I I I
o__mr_.CtJ 4B
n-._-=L "-'o °_o _
__. o
_._ _
1.1.1 mmI
.e
.__
0

ii
0.
°°!• ,,m _'b
!
TD
C_laid
I1
49

I
&Im
50

_, o_m
c C_
0 0
C
¢0)
L.
0
!
U.

Oi
o0
a.
C: OO *_"
lilmll
.'=1__oT-" U'I
CO
• CO
LI.I_O
O_1CO
:E-i
o
r-
O')
_J
X-1-
Oo-
O
OLL.CO
Q.E
fi
G)
OZ
O
:D
U.
_J
.-jCO
52

53

• • • •
54


I i
0
, I . I,......I I_ I .I
56
c lID.2 •
I_ -_._o
m _g
:
-- 2

57

=o.__ :_ oum_4d
Li. U.U.v(/) .J .J.J_.J Z ZZ:E
I I
-(_
-'It"
_D
_11''P
T-
X
E
O
58
m
(D
L
O
L_
.OE:3C
n
0C>.,
rr
]20r-
Ell=...E
0
!
E

Ein
U
59

I I -4 I
• | • • • • •
i
(.,)
z h
C_'!--'
cO
_o
0
t11
"0
q=
bU-
o_
L_
I I Ir,.. u)
I "=tO) Xl I I I I
0
1, I _! l
-0
_X
60 :

_D0T,I
xl
0
m
0 C_'0
D_
G
,in,,
x
z
6_

.c .J
Xl ! i I I 1
o
62
":: C_
X _A
_) ®]l
_E
o N
0

II II
=E =E
I
o.
II II
II
=E
[]
I I I _1
gq q _. .
a) c:
Ul E'r:
el.x_
0 ""
,i
"*- m
Ow
>I
e,i
0
Q0
63
-o .o__ o _ .o ,,
'-'- I: "_ r-. '- _
n o,, o I-.. -.J ci
,,,,,, rr I-" -I Z
\ "'_--1 I o
12. 0
.o-=_l,,_
tlL
J
'T"
IIO
I:l::
ciII
,,,,,IO<1
O
11.!
{,,)
i.,,
ii
64

Iin
coo)
I I I Io. _ o _.
rj65
In

C_I O CO
E..I
O
\
I I !
66
8
E E
=_ -_._
_ x'_
o._
I
u_c_
0

ll,(#'i
/ 'Y/J /,L ooo, o.I
_ #c,,i'_ / ,-,!o I
.,I II I __
C_ / ¢>muI I<_ / .,:, i":®i-
"i llnio 4 'I Iiol
I i I ID ._I i I I (_ c#)I I I I I , "o "," /
,_"_--a 0 _ -I_ + -__oi_I I I I I ,'i-l'o'a m _ / >.i I i ! , _ eli cli "_ eliI ! I i cu__ o,_ /It, ` ! I i i m_l_l... /
°'"' ' ' / /_1 _! I Il__):i_.2_l I , Io ' 5 i /
m. o m. q m. q o
i=,.i
0 67

¢D
i
4)io
I
/|
i!
t
I I I I I
6B
.Eel) {:__=._III
!
LT.
I i I I I (_I
• II • II
69

_JD
I ! L ,,-
L J. I J L
o-- 6_ e-
_E
(11
om
w.=l
o_lb
I
I"=
7O

imm
uOU 71

C
0U
U
I I°
_ 0I-=
4-wU
r_
0 0 0 0
.E__ c_.-_ _
m2_72
0
bo_
!
,__LI.
C
73

EE >, /_ -
u0
74

75

I
0CO
I
0ID
I I
0 0_" O4
.J=
m
e-uJ
o_o
o
o
I
u_
3
L_
76


im
"13
6m
a
O O4 _1"I I
8
/
o0 0r)m
d_ii 8
_o
(JD|
_o__Li.
r'_U3
CO|
O
|
r-t_
LL.
_3
|
O
o
o ._
r_ a.
rn _
• t-
_8
0. m
|
b:
IJ.
78

I I I I
_mIll 79
!
I
8O

oo® "
O0
0
I I I I
l i i i l l
-cO
OnZuj
81

°_
i_$ _" . __._.---
82

.__, _4
•->=iiee'_
00
83


0
A
I I I
_. el. _.'1 _ _
I-.
.4
t_ .-_
85

I Form ApprovedREPORT DOCUMENTATION PAGE OMaNo oTo_olaa
=IH |
Public repOrtina burden _or this _ollectlon of reformation _Seshmated 1o a_erage 1 hour Der resl_nse, including the t_me for reviewing nstructions, search ng P_isting data sour¢_s
gathering and maintammq the d_lta needed: and completing and reviewing the collection of reformation Send comments re_ard_ng tht$ burden estimate or any other a_pect of th_s
collection of information, including _uggL-_t=ons for reducing this burden to _h'ash=ngton Headquarters Ser_Kes, Director_tte to:" information Operatmon,, alld Reports, 12 !5 Jefferson
Oavl_, Highway, Suite t204, ArlingtOn, VA 22202-4302, dnd tC the Office of Management and Budget, Pape,work Redu_ion Project (0704-0188)= Washington, DE 2050],
I" AGENCYUSEONLY(LeavebIank) I2"REPORTDATEoctober1992 I 3"REPORTTYPEANDDATEScOVEREDTechnicalMemorandum4. TITLE AND SUBTITLE
Future Regional Transport Aircraft Market, Constraints,and Technology Stimuli
6. AUTHOR(S)
Wo Don Harvey and Brent Foreman
7. PERFORMINGORGANIZATIONNAME(S)ANDADORESS(ES)
NASA Langley Research CenterHampton, Virginia 23681-0001
9.SPONSORING/MONITORINGAGENCYNAME(S}ANDAODRESS(ES)
National Aeronautics and Space AdministrationWashington, DC 20546-0001
5. FUNDING NUMBERS
WU 505-69-20-01
B. PERFORMING ORGANIZATIONREPORT NLtMBER
10. SPON SORING ,' MONITORINGAGENCY REPORT NUMBER
NASA TM-107669
It. SUPPLEMENTARY NOTES
W. Don Harvey: Langley Research Center, Hampton, Virginia.Brent Foreman: Auburn Un]verslty, Auburn, Alabama.
12a. DISTRIBUTION /AVAILABILITY STATEMENT 12b. DISTRIBUTION CODE
Unclassified - Unlimited
Subject Category 01
I
I13' ABSTRACT (M_×lrnurn?O0 w_.,r,:t;) ..... : "
This report provides updated information on the current market and operatingenvironment and identifies interlinking technical possibilities for Competitive future
commuter-type transport aircraft. The conclusions on the market and operatingenvironment indicate that the regional aldines are moving towards more modernand effective fleets with greater passenger capacity and comfort, reduced noise
levels, increased speed and longer range. This direction leads to a needy"seamless" service and continued code-sharing agreements with the major carders.Whereas the benefits from individual technologies may be small, the overallintegration in existing and new aircraft designs can produce improvements in directoperating cost and competitiveness. Production CoSts are identified as beingequally impotent as pure technical advances.
I
14. SUBJECT TERMS
Commuter AircraftAircraft SystemsAir Transportation
17. SECURITY CLASSIFICATION JOF REPORT IUnclassified
NSN 7S,_O-O1-280-5500
18. SECURITY CLASSIFICATION IOF THIS PAGE IUnclassified
lg. SECURITY CLASSIFICATION
OF ABSTRACT
Unclassified
15. NUMBER OF PAGES
8816. PRICE CODE
A0520. LIMITATION OF ABSTRACT
Standard Form 298 (Rev 2-89)
Pr,.,;cr_b_d by AN'>_ S,d [_9.!B2')B I(12