
Narrowband Oscillations in the Upper Equatorial...
15
Narrowband Oscillations in the Upper Equatorial Ocean. Part I: Interpretation as Shear Instabilities J. N. MOUM, J. D. NASH, AND W. D. SMYTH College of Oceanic and Atmospheric Sciences, Oregon State University, Corvallis, Oregon (Manuscript received 17 February 2010, in final form 12 November 2010) ABSTRACT Extended measurements of temperature fluctuations that include the turbulence wavenumber band have now been made using rapidly sampled fast thermistors at multiple depths above the core of the Equatorial Undercurrent on the Tropical Atmosphere Ocean (TAO) mooring at 08, 1408W. These measurements include the signature of narrowband oscillations as well as turbulence, from which the temperature variance dissi- pation rate x T and the turbulence energy dissipation rate x are estimated. The narrowband oscillations are characterized by the following: d groupiness—packets consist of O(10) oscillations; d spectral peaks of up to two orders of magnitude above background; d a clear day–night cycle with more intensive activity at night; d enhanced mixing rates; d frequencies of 1–2 3 10 23 Hz, close to both the local buoyancy and shear frequencies, N/2p and S/2p, which vary slowly in time; d high vertical coherence over at least 30-m scales; and d abrupt vertical phase change (p/2 over ,20 m). The abrupt vertical phase change is consistent with instabilities formed in stratified shear flows. Linear sta- bility analysis applied to measured velocity and density profiles leads to predicted frequencies that match those of the observed oscillations. This correspondence suggests that the observed oscillation frequencies are set by the phase speed and wavelength of instabilities as opposed to the Doppler shifting of internal gravity waves with intrinsic frequency set by the local stratification N. 1. Introduction Because of the importance of turbulent heat and mo- mentum transports to the dynamics of the equatorial current system (Crawford and Osborn 1981; McCreary 1981), experiments to examine the nature of mixing in the central equatorial Pacific were conducted in 1984 (Tropic Heat), 1987 (Tropic Heat 2), 1991 [Tropical Instability Wave Experiment (TIWE)], and autumn 2008. From these experiments, we gained detailed glimpses into the complexity of small-scale processes within the equatorial current system. The intense diurnal cycle of mixing ex- tending beneath the mixed layer was first observed in 1984 (Moum and Caldwell 1985; Gregg et al. 1985) and later found (in 1987) to be associated with intermittently occurring bursts of oscillations with frequencies near the local buoyancy frequency (McPhaden and Peters 1992) and horizontal wavelengths of 150–250 m (Moum et al. 1992a). Recently, surprisingly intense subsurface mix- ing was observed above the core of the Equatorial Un- dercurrent (EUC) in association with tropical instability waves (Moum et al. 2009); this mixing does not cycle on a daily basis. There are several ways that narrowband oscillations (frequencies near N, 200-m wavelengths) may be gen- erated; candidates include shear instability in the strati- fied fluid above the EUC core (Sun et al. 1998; Mack and Hebert 1997; Smyth and Moum 2002), shear instabilities formed in the mixed layer when shear is enhanced by easterly wind intensifications (Skyllingstad and Denbo 1994), convectively driven eddies in the mixed layer (Gregg et al. 1985), and an obstacle effect associated with sheared flow over a perturbed mixed layer base Corresponding author address: J. N. Moum, College of Oceanic and Atmospheric Sciences, Oregon State University, COAS Ad- min. Bldg. 104, Corvallis, OR 97331-5503. E-mail: [email protected] VOLUME 41 JOURNAL OF PHYSICAL OCEANOGRAPHY MARCH 2011 DOI: 10.1175/2010JPO4450.1 Ó 2011 American Meteorological Society 397
Transcript of Narrowband Oscillations in the Upper Equatorial...

Narrowband Oscillations in the Upper Equatorial Ocean. Part I: Interpretationas Shear Instabilities
J. N. MOUM, J. D. NASH, AND W. D. SMYTH
College of Oceanic and Atmospheric Sciences, Oregon State University, Corvallis, Oregon
(Manuscript received 17 February 2010, in final form 12 November 2010)
ABSTRACT
Extended measurements of temperature fluctuations that include the turbulence wavenumber band have
now been made using rapidly sampled fast thermistors at multiple depths above the core of the Equatorial
Undercurrent on the Tropical Atmosphere Ocean (TAO) mooring at 08, 1408W. These measurements include
the signature of narrowband oscillations as well as turbulence, from which the temperature variance dissi-
pation rate xT and the turbulence energy dissipation rate �x are estimated.
The narrowband oscillations are characterized by the following:
d groupiness—packets consist of O(10) oscillations;d spectral peaks of up to two orders of magnitude above background;d a clear day–night cycle with more intensive activity at night;d enhanced mixing rates;d frequencies of 1–2 3 1023 Hz, close to both the local buoyancy and shear frequencies, N/2p and S/2p, which
vary slowly in time;d high vertical coherence over at least 30-m scales; andd abrupt vertical phase change (p/2 over ,20 m).
The abrupt vertical phase change is consistent with instabilities formed in stratified shear flows. Linear sta-
bility analysis applied to measured velocity and density profiles leads to predicted frequencies that match
those of the observed oscillations. This correspondence suggests that the observed oscillation frequencies are
set by the phase speed and wavelength of instabilities as opposed to the Doppler shifting of internal gravity
waves with intrinsic frequency set by the local stratification N.
1. Introduction
Because of the importance of turbulent heat and mo-
mentum transports to the dynamics of the equatorial
current system (Crawford and Osborn 1981; McCreary
1981), experiments to examine the nature of mixing in the
central equatorial Pacific were conducted in 1984 (Tropic
Heat), 1987 (Tropic Heat 2), 1991 [Tropical Instability
Wave Experiment (TIWE)], and autumn 2008. From
these experiments, we gained detailed glimpses into the
complexity of small-scale processes within the equatorial
current system. The intense diurnal cycle of mixing ex-
tending beneath the mixed layer was first observed in
1984 (Moum and Caldwell 1985; Gregg et al. 1985) and
later found (in 1987) to be associated with intermittently
occurring bursts of oscillations with frequencies near the
local buoyancy frequency (McPhaden and Peters 1992)
and horizontal wavelengths of 150–250 m (Moum et al.
1992a). Recently, surprisingly intense subsurface mix-
ing was observed above the core of the Equatorial Un-
dercurrent (EUC) in association with tropical instability
waves (Moum et al. 2009); this mixing does not cycle on a
daily basis.
There are several ways that narrowband oscillations
(frequencies near N, 200-m wavelengths) may be gen-
erated; candidates include shear instability in the strati-
fied fluid above the EUC core (Sun et al. 1998; Mack and
Hebert 1997; Smyth and Moum 2002), shear instabilities
formed in the mixed layer when shear is enhanced by
easterly wind intensifications (Skyllingstad and Denbo
1994), convectively driven eddies in the mixed layer
(Gregg et al. 1985), and an obstacle effect associated
with sheared flow over a perturbed mixed layer base
Corresponding author address: J. N. Moum, College of Oceanic
and Atmospheric Sciences, Oregon State University, COAS Ad-
min. Bldg. 104, Corvallis, OR 97331-5503.
E-mail: [email protected]
VOLUME 41 J O U R N A L O F P H Y S I C A L O C E A N O G R A P H Y MARCH 2011
DOI: 10.1175/2010JPO4450.1
� 2011 American Meteorological Society 397

(Wijesekera and Dillon 1991). It is possible that different
instability mechanisms occur at different times (or even
simultaneously). It is important for us to determine ex-
actly how these instabilities occur to make the link to the
next larger temporal and spatial scales, which is the way
we will improve mixing parameterizations.
We have recently demonstrated a new means of ob-
taining moored measurements of mixing (Moum and
Nash 2009) that consists of a pair of fast-response therm-
istors protruding from a pressure case attached to a moor-
ing cable. The instrument, which we call xpod, is vaned to
steer the thermistors into the flow, thus permitting mea-
surement of undisturbed turbulence. This has proven
successful at current speeds above 0.05 m s21. The tech-
nique is especially useful in the upper equatorial current
system, where strong currents prevail.
The purpose of these measurements is to obtain records
of mixing that are sufficiently long to evaluate the in-
terplay between mixing, waves, and the larger circulation
scales that affect interannual phenomena such as El Nino
and La Nina. Long time series are required because at-
tempts to parameterize mixing from the intensive but
short equatorial turbulence profiling experiments to date
have not been particularly successful (Zaron and Moum
2009). We suggest that this is partly because our limited
experiments have not measured the full range of equa-
torial mixing states.
A complementary set of objectives includes obtain-
ing a useful measure of the turbulent heat flux over long
time scales to allow estimates of the vertical divergence
and thus heating rates through the water column. In
this way, we anticipate determining the role that var-
iations in mixing have on the large-scale equatorial
current structure and particularly on the sea surface
temperature (SST).
Here we examine an 8-month record from four depths
above the core of the EUC with the intention of pointing
out the variety of states of mixing and how these are
related to narrowband oscillations, which are ubiquitous
in these time series. We are hesitant to refer to these
a priori as ‘‘internal waves,’’ because we wish to distin-
guish freely propagating internal gravity waves from
shear instability waves and hence use the term ‘‘oscil-
lation’’ to cover both phenomena.
We begin with a short description of the data (sec-
tion 2) and the background oceanographic conditions
during the deployment (section 3). We then take a closer
look at a 52-day portion of the record that most clearly
contains the narrowband signal in order to examine the
temperature variability and properties of the narrow-
band oscillations (section 4) and their relationship to
turbulence (section 5). A discussion follows in which we
argue that these observations are consistent with shear
instabilities, which prompts a linear stability analysis
(LSA) using observed currents and stratification, re-
sulting in the finding that the observed peak frequencies
of narrowband oscillations are determined by the phase
speeds and wavelengths of shear instabilities formed
above the EUC core (section 6). This is followed by a short
discussion (section 7) and a summary and conclusions
(section 8). In the companion paper (Smyth et al. 2011,
hereafter Part II), the computational method for the
LSA is presented, the computed instabilities are de-
scribed in greater detail, and a theory is advanced to
explain the narrowband character of the oscillations.
2. Details of the deployment
Five xpods were deployed on the Tropical Atmosphere
Ocean (TAO) mooring at 08, 1408W on 18 September
2006 at 29-, 39-, 49-, 59-, and 84-m depths (xpod depths
are shown on the image plots in Fig. 1). These were re-
covered on 30 May 2007, and a refurbished set of six
xpods were deployed on the replacement mooring. The
unit targeted for 84 m was damaged prior to deployment
and no data were recorded. All of the other units pro-
vided continuous data for the duration of the deploy-
ment. The xpods provided temperature at 10-Hz sample
rate and its derivative at 120 Hz. Using currents mea-
sured nearby and the cable motion as sensed by linear
accelerometers on board the xpods, the flow speed past
the sensors is determined. The temperature variance dis-
sipation rate xT is then computed as described by Moum
and Nash (2009). From this, we estimate the turbulence
kinetic energy dissipation rate �x1 and the turbulence
diffusion coefficient for heat KT.
The background temperature structure in the upper
100 m at 08, 1408W during the deployment was derived
from temperature measurements on the TAO mooring at
1, 5, 10, 13, 20, 25, 28, 40, 45, 48, 60, 80, and 100 m (Fig. 1b).
From these, an estimate of mixed layer depth was made
as the depth at which the temperature deviated from its
value at 1 m by 0.15 K (daily maxima of mixed layer
depths are shown in Fig. 1b). Wind stress (Fig. 1a) was
derived from wind speed measurements on the surface
float using bulk formulas (Fairall et al. 1996). A nearby
subsurface mooring with 150-kHz narrowband acoustic
Doppler current profiler (ADCP) at 270-m depth pro-
vided a measure of ambient currents in the upper 250 m
(zonal u and meridional y currents are shown in Figs. 1c,d,
and squared shear computed from these in Fig. 1e), aug-
mented by discrete measurements on the surface mooring
1 The subscript x is used to indicate that � is computed from
microscale temperature, not shear.
398 J O U R N A L O F P H Y S I C A L O C E A N O G R A P H Y VOLUME 41

in the upper 40 m, where sidelobe contamination affects
the ADCP measurement. The subsurface mooring is part
of the standard TAO project array at this location. Data
are provided as 15-min averages at 1-h intervals with 8-m
vertical bins.
The local buoyancy frequency N is computed in two
ways. A large-scale estimate is derived from temperature
and conductivity measurements on the TAO mooring.
The spacing of temperature sensors is given in the previous
paragraph. Conductivity sensors were spaced at 20-m
intervals in the 20–60-m depth range that includes our
xpods. These measurements were interpolated to 5-m
vertical spacing and density r was computed; from this,
N2 5 2grz/r, where rz is the local vertical density gra-
dient and g is the acceleration due to gravity. For the
purpose of this analysis, this estimate of N is used for
time-averaged, vertical profiles. An estimate of N that is
local in both time and space to our xpods and does not
require differencing measurements from independent
sensors (an operation that amplifies uncertainties in gra-
dients) is derived directly from xpod measurements of T.
Vertical pumping of the TAO mooring by surface gravity
waves acting on the surface float causes the xpods to
move vertically (nominally, 61.5 m) about their mean
depth on the mooring (Moum and Nash 2009). Here T
is fit to z over 2-min intervals from which the local ver-
tical gradient Tz is derived. From this follows NT2 5 gaTz,
where a is the thermal expansion coefficient of seawater.
The terms N and NT are compared in section 4. Because it
turns out that the contribution from salinity gradients is
small during the periods of greatest interest and because
NT provides a local estimate uncompromised by inter-
polation, we employ this value in combination with wave
displacement in section 4 to estimate wave energy. Here
NT is also used in the xpod estimate of xT and �x, as
prescribed by Moum and Nash (2009). Again, during the
periods of interest, xT and �x are found not to be biased
by our choice of N. Uses of N and NT are clearly distin-
guished in the figures and text to follow.
3. Background conditions
The variability in Fig. 1 reflects the great range of
equatorial motions. Deep mixed layers preceded the
FIG. 1. (a) Wind stress tw at 08, 1408W from mid-September 2006 to end of May 2007. (b) Temperature in upper
100 m (image color); daily maximum mixed layer depth (defined as the depth where temperature deviates from SST
by 0.15 K) is the white line. (c) Zonal velocity, (d) meridional velocity, and (e) squared shear. The xpod depths are
denoted by the short horizontal lines at both abscissa extrema of (b)–(e). The bar at the top of (a) refers to the time
period of further focus in the present analysis.
MARCH 2011 M O U M E T A L . 399
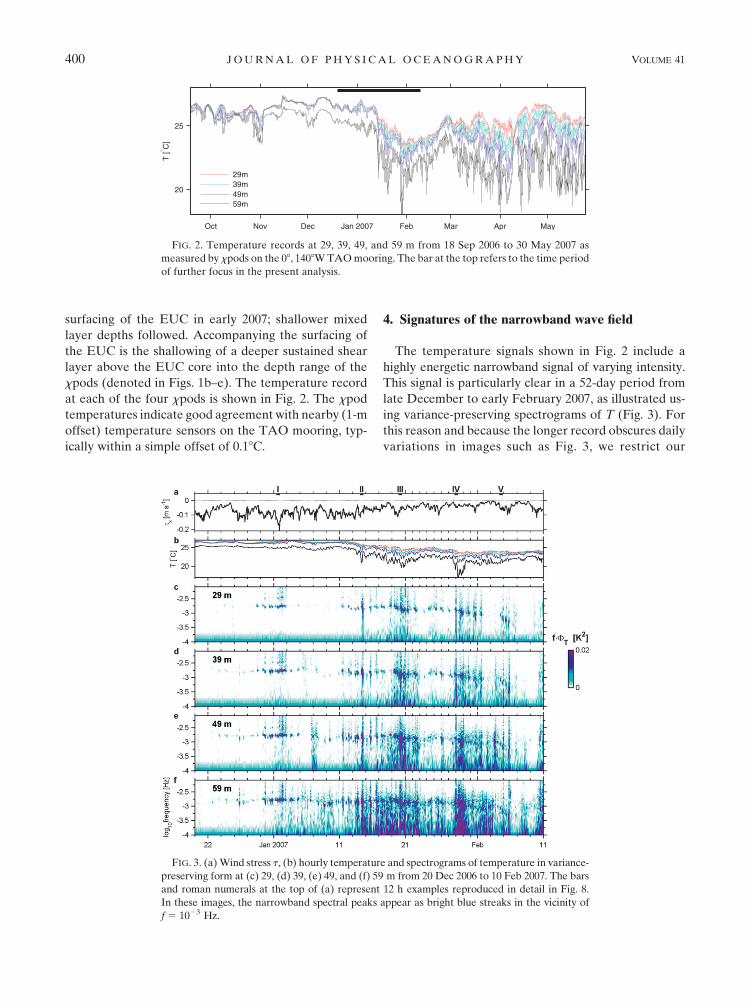
surfacing of the EUC in early 2007; shallower mixed
layer depths followed. Accompanying the surfacing of
the EUC is the shallowing of a deeper sustained shear
layer above the EUC core into the depth range of the
xpods (denoted in Figs. 1b–e). The temperature record
at each of the four xpods is shown in Fig. 2. The xpod
temperatures indicate good agreement with nearby (1-m
offset) temperature sensors on the TAO mooring, typ-
ically within a simple offset of 0.18C.
4. Signatures of the narrowband wave field
The temperature signals shown in Fig. 2 include a
highly energetic narrowband signal of varying intensity.
This signal is particularly clear in a 52-day period from
late December to early February 2007, as illustrated us-
ing variance-preserving spectrograms of T (Fig. 3). For
this reason and because the longer record obscures daily
variations in images such as Fig. 3, we restrict our
FIG. 2. Temperature records at 29, 39, 49, and 59 m from 18 Sep 2006 to 30 May 2007 as
measured by xpods on the 08, 1408W TAO mooring. The bar at the top refers to the time period
of further focus in the present analysis.
FIG. 3. (a) Wind stress t, (b) hourly temperature and spectrograms of temperature in variance-
preserving form at (c) 29, (d) 39, (e) 49, and (f) 59 m from 20 Dec 2006 to 10 Feb 2007. The bars
and roman numerals at the top of (a) represent 12 h examples reproduced in detail in Fig. 8.
In these images, the narrowband spectral peaks appear as bright blue streaks in the vicinity of
f 5 1023 Hz.
400 J O U R N A L O F P H Y S I C A L O C E A N O G R A P H Y VOLUME 41

attention to this 52-day period for the remainder of this
analysis. The narrowband signal is seen as a peak at
approximately 0.002 Hz at the beginning of January
2007, slightly greater than N/2p. The narrowband spec-
tral peak pulses at the diurnal period and decreases in
frequency throughout the month of February to ap-
proximately 1023 Hz. Averaged spectral amplitudes
over a two-day period (1–3 January 2007) are about
two orders of magnitude greater at frequencies be-
tween 1.5 and 2 3 1023 Hz than at background fre-
quencies (Fig. 4). Note that the frequencies of elevated
variance are the same for each depth and are not spe-
cifically linked to the local buoyancy frequency, which
varies considerably in depth (denoted by the vertical
dashed lines in Fig. 4).
The frequency at the amplitude maxima in Fig. 3 is
identified by finding the peak in each spectrum and re-
quiring it to have a minimum amplitude of 2.3 3 1023 K2;
we refer to the frequency at this peak as fNB. The result for
the xpod at 29 m is shown in Fig. 5a. The short-term
variability in fNB is significantly smaller than that in NT/2p,
and the two frequencies are practically uncorrelated (ac-
tually weakly correlated in a negative sense, r 5 20.25).
A comparison between N and NT is also seen in Fig. 5a.
Salinity gradients apparently occur with either sign (in-
terpolated to 29 m) in this record, destabilizing early in
the record when stratification is weak and stabilizing at
the end of the record. However, during the periods of
interest for this study (when fNB is well defined), the
effect of salinity gradient on N2 is reasonably small. We
believe the estimate of N2 from the coarsely spaced and
slowly sampled moored sensors is not particularly rele-
vant to local turbulence dynamics, making NT2 the rele-
vant stratification for use in the computation of xT.
The distinctive peak in temperature spectra suggests
that we can fairly reliably extract the narrowband sig-
nal by filtering. We define the perturbation temperature
signal T9 by high-pass filtering the temperature record
at 3 3 1024 Hz. A relative measure of the narrowband
displacement is then
z 5T9
Tz
, (1)
from which we estimate NT2 z2 as twice the available po-
tential energy associated with the narrowband oscilla-
tions, following Moum et al. (1992a).
A two-day example that shows the variability of the
narrowband signal and its relationship to the turbulence
is represented in Fig. 6. Unfortunately, the solar radia-
tion signal on the TAO mooring was incomplete for this
deployment. To indicate the time of the solar day, an
estimate of clear sky, shortwave radiation is shown in
Fig. 6a, as determined from a simple model.2 The du-
ration of narrowband bursts is several hours, most in-
tensely at night. These are typically accompanied by
high �x. Generally, �x is lower when narrowband oscil-
lations are absent. In the first energetic wave group (just
past midday on 1 January), the oscillations appear at all
depths at close to the same time. However, high �x is
observed first at the upper xpod and thence progres-
sively later with depth. The other oscillation groups seem
to show that both oscillations and turbulence appear at
the upper xpod first, following which they appear pro-
gressively later with increasing depth.
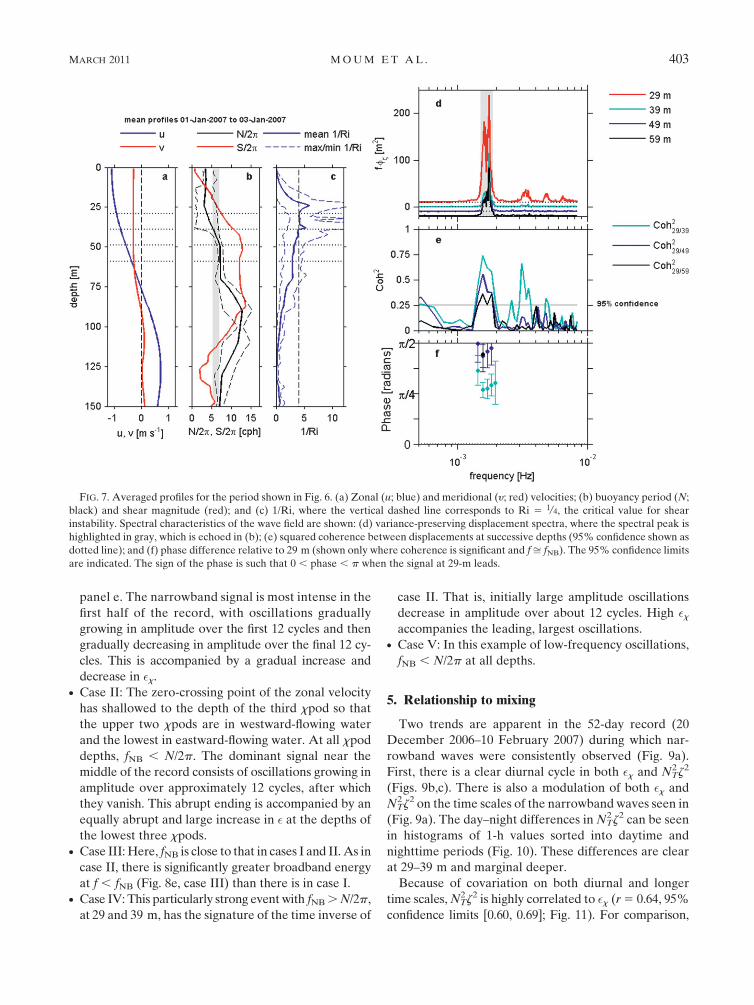
During the period of the measurements shown in Fig. 6,
the core of the EUC was about 125 m deep (Fig. 7a). The
four xpods were above the EUC core, in the westward-
flowing South Equatorial Current (SEC). The spectral
peak at fNB ’ 0.0017 Hz (Fig. 7d) is similar to the local
value of N/2p (6 cph) at 40–70 m (Fig. 7b), but fNB . N/2p
at 29 m. Oscillations are vertically coherent at all mea-
surement depths (Fig. 7e), with a strong vertical phase
dependence (Fig. 7f). The phase lag at 39 m is approxi-
mately p/4 relative to 29 m, and p/2 at 49 and 59 m (also
relative to 29 m), suggesting that the p/2 phase shift occurs
over a distance of Dz , 20 m. These results are similar to
FIG. 4. Temperature spectra (from 1 min data) at 29, 39, 49, and
59 m for the two-day period shown in Fig. 6. Vertical dashed lines
represent local buoyancy frequency, N/2p, at each depth.
2 JqSW 5 I0 sinv0(t 2 t0), when sinv0(t 2 t0) . 0, where I0 5
1100 W m22, v0 5 2p radians day21, and t0 5 140/360 1 1/4 days;
otherwise, JqSW 5 0.
MARCH 2011 M O U M E T A L . 401

those derived from towed thermistor chain measurements
nearby and along the equator in 1987 (Moum et al. 1992a).
The detailed structure of the narrowband oscillations
is diverse. Five 12-h examples from the period shown in
Fig. 3 are reproduced in Fig. 8 (each example is denoted
by a Roman numeral at left in Fig. 8, which is echoed in
Fig. 3). Over this time period, the mixed layer shallowed
from about 50 to 15 m and the zero-crossing point of
the zonal velocity (which separates the EUC from the
SEC) shallowed from about 70 to 35 m (Fig. 1). The
shallowing of the zero-crossing point of the zonal ve-
locity can be seen in Fig. 8a.
These examples were chosen because each is distin-
guished by a narrowband spectrum but with unique
characteristics that we note in turn.
d Case I: The xpods were all located in the westward-
flowing SEC. At 39–59 m, fNB ’ N/2p; at 29 m, fNB .
N/2p. For reference, the spectrum at 59 m (Fig. 8, case I,
panel e) is reproduced in gray in Fig. 8, cases II–V,
FIG. 5. (a) Time series of NT/2p (black line), fNB (symbols), and N/2p (gray line) at 29 m. Here
fNB corresponds to the spectral peaks in Fig. 3c. (b) NT/2p vs fNB.
FIG. 6. (a) Incoming shortwave radiation as determined from a clear-sky solar radiation model, (b) z (1-min
means), and (c) �x (1-min averages of 1-s spectral estimates) computed from the four xpods for the first two days of
January 2007. In (c), the dotted baselines represent �x 5 1029 m2 s23. In this and all plots, times are in UTC.
402 J O U R N A L O F P H Y S I C A L O C E A N O G R A P H Y VOLUME 41
panel e. The narrowband signal is most intense in the
first half of the record, with oscillations gradually
growing in amplitude over the first 12 cycles and then
gradually decreasing in amplitude over the final 12 cy-
cles. This is accompanied by a gradual increase and
decrease in �x.d Case II: The zero-crossing point of the zonal velocity
has shallowed to the depth of the third xpod so that
the upper two xpods are in westward-flowing water
and the lowest in eastward-flowing water. At all xpod
depths, fNB , N/2p. The dominant signal near the
middle of the record consists of oscillations growing in
amplitude over approximately 12 cycles, after which
they vanish. This abrupt ending is accompanied by an
equally abrupt and large increase in � at the depths of
the lowest three xpods.d Case III: Here, fNB is close to that in cases I and II. As in
case II, there is significantly greater broadband energy
at f , fNB (Fig. 8e, case III) than there is in case I.d Case IV: This particularly strong event with fNB . N/2p,
at 29 and 39 m, has the signature of the time inverse of
case II. That is, initially large amplitude oscillations
decrease in amplitude over about 12 cycles. High �xaccompanies the leading, largest oscillations.
d Case V: In this example of low-frequency oscillations,
fNB , N/2p at all depths.
5. Relationship to mixing
Two trends are apparent in the 52-day record (20
December 2006–10 February 2007) during which nar-
rowband waves were consistently observed (Fig. 9a).
First, there is a clear diurnal cycle in both �x and NT2 z2
(Figs. 9b,c). There is also a modulation of both �x and
NT2 z2 on the time scales of the narrowband waves seen in
(Fig. 9a). The day–night differences in NT2 z2 can be seen
in histograms of 1-h values sorted into daytime and
nighttime periods (Fig. 10). These differences are clear
at 29–39 m and marginal deeper.
Because of covariation on both diurnal and longer
time scales, NT2 z2 is highly correlated to �x (r 5 0.64, 95%
confidence limits [0.60, 0.69]; Fig. 11). For comparison,
FIG. 7. Averaged profiles for the period shown in Fig. 6. (a) Zonal (u; blue) and meridional (y; red) velocities; (b) buoyancy period (N;
black) and shear magnitude (red); and (c) 1/Ri, where the vertical dashed line corresponds to Ri 5 1/4, the critical value for shear
instability. Spectral characteristics of the wave field are shown: (d) variance-preserving displacement spectra, where the spectral peak is
highlighted in gray, which is echoed in (b); (e) squared coherence between displacements at successive depths (95% confidence shown as
dotted line); and (f) phase difference relative to 29 m (shown only where coherence is significant and fffi fNB). The 95% confidence limits
are indicated. The sign of the phase is such that 0 , phase , p when the signal at 29-m leads.
MARCH 2011 M O U M E T A L . 403

FIG. 8. (a) Averaged zonal (u; blue) and meridional (y; red) velocity profiles. (b) Averaged buoyancy frequency (N/2p; black) and shear
(S/2p; red) profiles. Averages were computed over (c) the 12-h time periods, which shows temperature at 29- (red), 39- (cyan), 49- (blue),
and 59-m (black) depths from the xpods, following the color convention introduced in Fig. 2. (d) �x. (e) Temperature spectra normalized
by the mean value of N at that depth. The gray spectral line reproduced in all of the plots is the 59-m spectrum from the first (upper) time
period. The gray vertical bars in (e) represent the peaks in the spectra and are reproduced in (b).
404 J O U R N A L O F P H Y S I C A L O C E A N O G R A P H Y VOLUME 41

the data points plotted in Fig. 9 of Moum et al. (1992a)
are also shown (r 5 0.83). The current xpod estimates
overlap the parameter space of the 1987 measurements
and extend it.
Lines of unity slope in Fig. 11 represent constant time
scales related to the decay of energy NT2 z2 by turbulence
dissipation, td ’ NT2z2/�. These suggest that the narrow-
band oscillations decay rapidly, on a time scale of O(1 h)
or a few oscillation periods. This would seem to be con-
sistent with the relatively few oscillations that compose
a group as well as the patchiness of the narrowband
signal.
6. Mechanistic interpretation
The narrowband signal that we have described from
these measurements has several distinctive characteristics.
The dominant frequency, fNB ’ 1–2 3 1023 Hz, varies
remarkably slowly in time (Fig. 3) and is similar in mag-
nitude to both N/2p and S/2p. At times, fNB . N/2p, al-
though it is not generally observed to be greater than the
maximum value of N above the EUC core (Fig. 8).
The oscillations typically appear in groups of about 10
before disappearing from the time series (Fig. 8). The
groups are associated with elevated mixing (Fig. 11).
Packets appear as both symmetric groups with largest
amplitudes and most-elevated mixing in the middle of the
group (Fig. 8, case I) and as highly asymmetric groups,
with largest amplitudes and most-elevated mixing at ei-
ther trailing or leading edge (Fig. 8, cases II and IV). If we
interpret the oscillations as propagating wave packets, it
is impossible to distinguish trailing from leading edge in
the time series data.
Signals are vertically coherent over the full depth range
of the measurements (29–59 m) and exhibit a change in
phase of p/2 over a vertical span #20 m. Both of these
characteristics were also observed in the towed thermis-
tor chain measurements of Moum et al. (1992a); only
the high coherence was detected in the moored obser-
vations of McPhaden and Peters (1992). Because of a
lack of confidence in relative timing between sensors,
McPhaden and Peters (1992) were unable to determine
whether vertical differences in phase at the frequencies of
the narrowband signal differed from 0.
FIG. 9. (a) Temperature spectrogram (variance preserving), (b) NT2 z2, and (c) �x at 29 m for the period 20 Dec
2006–10 Feb 2007. The time periods depicted in Fig. 8 are noted at the top of (a). (d) The histogram corresponds to
frequencies estimated from 155 unstable modes as determined from LSA applied to observed profiles of currents and
stratification as discussed in section 6a. The solid line in (d) is the temperature spectrum (variance-preserving form)
for the full period shown in (a).
MARCH 2011 M O U M E T A L . 405

In an introduction to the original set of papers describing
the narrowband phenomenon beneath the equatorial
mixed layer, Moum et al. (1992b) made two significant
points. They acknowledged the difficulty in making the
distinction between freely propagating internal gravity
waves and forced shear instabilities from the observa-
tions. They also recognized the importance of doing so,
primarily because of the potential for vertical redistri-
bution of momentum by vertically propagating internal
waves that would not exist in the case of short-lived shear
instabilities.
A number of hypotheses have been proposed to ex-
plain this narrowband signal beneath the equatorial
mixed layer in the form of internal waves. Wijesekera
and Dillon (1991) suggested that the interaction of
turbulent overturns in the nighttime mixed layer with
the mixed layer base in the highly sheared equatorial
current system might produce an internal wave field.
From two-dimensional simulations, Skyllingstad and
Denbo (1994) showed generation of internal waves in
the equatorial surface layer during periods of easterly
wind intensifications by shear instabilities generated
there. For the data presented here, the shear is gener-
ated by easterly winds. In fact, our data show instances
of enhancement of narrowband wave activity when east-
erly winds increase (cf. Figs. 3a,c). However, there are
enough counterexamples to indicate that, if easterly wind
intensification is a factor, it does not work in isolation.
More recently, Pham and Sarkar (2010) have used three-
dimensional simulations to show the generation and
growth of internal waves by energetic vortex tubes ejec-
ted from Kelvin–Helmholtz instabilities into the sheared
fluid above the core of the EUC.
At the same time, arguments have been made that the
narrowband signal is directly related to shear instabilities.
LSA using observed profiles of currents and density (Sun
et al. 1998) has shown the generation of shear instabilities
with wavelengths close to those observed by Moum et al.
(1992a). Most relevant may be the observation of the
;p/2 change in phase across the waves, which echoes
the results of Moum et al. (1992a) and is expected for
growing Kelvin–Helmholtz instabilities (Smyth and
Peltier 1989; Baines and Mitsudera 1994). We proceed
with this argument by applying LSA to the present data
and comparing LSA results with the properties of these
observations.
FIG. 10. Histograms of NT2 z2 at (a) 29-, (b) 39-, (c) 49-, and (d)
59-m depths. These were sorted into daytime (1800–0200 UTC)
and nighttime periods (0600–1400 UTC), which are represented by
light and dark gray shading, respectively.
FIG. 11. Comparison of NT2 z2 and �x at 29 m based on 1-h averages
over the 52-day period shown in Fig. 9. Yellow/red points plotted
represent the two-dimensional histogram; redder points occur more
frequently. The black dots represent estimates from measurements
in 1987 of � using the turbulence profiler, Chameleon, and a therm-
istor chain towed behind the ship (Moum et al. 1992a). The corre-
lation for the xpod data is noted at the top left, with 95% confidence
limits. The correlation for the 1987 data is 0.83.
406 J O U R N A L O F P H Y S I C A L O C E A N O G R A P H Y VOLUME 41

a. Comparison with textbook shear instability
Three rules of thumb arise from studies of the ideal-
ized shear instability case of the Kelvin–Helmholtz form
growing on a shear layer (e.g., Hazel 1972; Turner 1973):
1) the wavelength is about 7 times the thickness of the
shear layer;
2) the phase difference across the shear layer is near
p/2; and
3) the phase speed equals the speed of the background
flow where the shear is a maximum and the phase
shift is most rapid.
The observed p/2 phase shift (Fig. 7f) is consistent with
property 2 above. The thickness of the layer over which
this phase shift occurs provides an estimate for the thick-
ness of the shear layer that generated the instability. In this
example, the thickness is #20 m. For the purpose of rough
scaling, we use 20 m. If property 1 above is valid, the re-
sulting wavelength would be 7 times this, or l ffi 140 m.
This is within the range of wavelengths observed by
Moum et al. (1992a), although slightly smaller than the
150–250-m wavelengths that dominated the spectrum.
The phase velocity is likely to be negative because the
p/2 phase change of the disturbance occurs over the
depth range of the xpods, which is within the westward-
flowing SEC (Figs. 7a,b). To estimate this phase veloc-
ity, we use the observed frequency fNB 5 1.7 3 1023 Hz
(Fig. 7d). As defined above, fNB is an absolute value; the
actual frequency is negative. We therefore compute the
phase velocity as c 5 2lfNB 5 20.24 m s21. This is
within the range of the background velocity (Fig. 7a) in
agreement with the semicircle theorem (Howard 1961).
It is, however, significantly slower than the background
current in the depth range of the xpods where the phase
change is observed, contrary to property 3 above. This
discrepancy is addressed in section 6b.
In summary, the observed oscillations are consistent
with at least some of the well-known properties of Kelvin–
Helmholtz instability on a shear layer.
b. LSA of observed mean states
To expand on the results of section 6a, we have carried
out stability analyses of hourly averaged profiles of ve-
locity and stratification. The linear stability problem for
a viscous, diffusive, stratified, parallel shear flow was
solved in matrix form, as described in Part II.
Vertical profiles of current shear and stratification N2
were computed from the relatively coarsely resolved
measurements available from the TAO mooring (Fig. 1).
Underresolution of both shear and stratification means
that Ri is likely overestimated, as high-resolution mea-
surements show small Ri on vertical scales smaller than
the 5-m vertical samples and time scales shorter than the
1-h samples available (Moum et al. 2009). We assume
that the hourly averaged profiles represent a stationary,
parallel flow perturbed by infinitesimal disturbances,
whereas in fact the flow is continuously subjected to
large-amplitude perturbations. Despite these caveats,
the normal mode spectrum yields a testable prediction of
the fastest-growing disturbance.
The LSA yields growth rates and phase speeds as
functions of wavenumber. The mode corresponding to
the wavenumber where the growth rate is a maximum is
the one most likely to reach observable amplitude. The
predicted frequency is f 5 c/l, where c and l are the
phase velocity and wavelength of the fastest-growing mode.
This analysis was repeated for all hourly averaged pro-
files during the time period shown in Figs. 3 and 9, and
modes were selected according to criteria given in Part II.
The sum of these analyses delivered an ensemble of 155
instability events. It was usually not possible to correlate
a specific instability with an observed increase in narrow-
band signal. This is not surprising for several reasons. First
of all, as mentioned earlier, the input data are low res-
olution. Second, the velocity and density measurements
are not collocated. The temperature and conductivity
measurements used to compute the stratification were
obtained from the TAO surface mooring, which was de-
ployed typically at least 1 km from the subsurface moor-
ing that houses the acoustic Doppler current profiler
from which velocity profiles were obtained. Lateral in-
homogeneities in currents and stratification between
these two locations will contribute to both false positive
and false negative indications of instabilities. Third, any
observed instability must have had sufficient time to grow
to observable amplitude. During this time, it will have
propagated at speed c, which is typically 6¼ 0, meaning
that the instability was formed elsewhere. Again, lateral
inhomogeneities in currents and stratification will contrib-
ute to lack of agreement between observed and predicted
instabilities. In view of these unavoidable limitations, we
focus not on individual events but rather on the statistical
properties of the ensemble.
Properties of the 155 unstable modes are discussed in
detail in Part II and briefly reviewed here. Growth rates
range from 1 to 11 e-foldings per hour (for comparison,
a close look at Fig. 6b suggests that the growth rate of the
first large packet at midday on 1 January 2007 was ap-
proximately 2 e-foldings per hour). As expected from the
dominance of zonal shear, unstable modes were generally
zonally propagating, with phase velocities ranging from
21 m s21 in the SEC to 11 m s21 in the EUC. Negative
values were considerably more common, but values close
to the peak SEC velocity were rare because modes with
critical levels above 37.5-m depth (where the quality
MARCH 2011 M O U M E T A L . 407

of the TAO velocity measurements was diminished)
were rejected. Critical level depths extended nearly to
the depth of the EUC core. Although unstable modes
could in theory have wavelengths up to 7 times the depth
of the EUC core, or 700 m, computed modes all had l #
340 m. The computed range of wavelengths is consistent
with existing observations (Moum et al. 1992a; Lien et al.
1996).
For the purpose of direct comparison of the properties
of observed and predicted instabilities, we compare
d fNB with the apparent frequency f 5 c/l due to the
propagation of computed instabilities past our obser-
vation point;d the vertical phase dependence of the computed in-
stabilities with those observed; andd predicted wavelengths to estimated shear layer thick-
nesses, to assess consistency with our first rule of thumb.
1) FREQUENCIES OF SHEAR INSTABILITIES
The ensemble of frequencies determined for the 155
instabilities over the 52-day record shown in Fig. 9a is
represented by the histogram in Fig. 9d. Despite the fact
that the instabilities arise from a range of critical depths
zc above the core of the EUC, encompassing a range
of both c and l (Part II), the peak frequency of the
distribution is very close to that defined by the spectral
peak at frequency fNB 5 1.7 3 1023 Hz (Fig. 9d). Peak
frequencies of the observations and computed unstable
modes are both close in magnitude to N/2p (Fig. 5a) al-
though fNB is not temporally correlated with N (Fig. 5b).
2) VERTICAL PHASE DEPENDENCE
To illustrate the general vertical structure of the in-
stabilities, we computed composite amplitude and phase
profiles as follows: We compiled vertical displacement
eigenfunctions for 69 unstable modes selected by the
requirement that 1023 , j f j , 1022.7 Hz, representing
the frequency range of the narrowband instabilities (in-
dicated by the mode of the histogram in Fig. 9d). Each
vertical displacement eigenfunction was normalized by its
value at the critical level. The eigenfunctions were then
converted to polar form, and the amplitude and the tan-
gent of the phase were sorted into bins according to the
scaled vertical coordinate (z 2 zc)/l. The median and
quartiles were computed for each bin.
Results are shown in Fig. 12. The amplitude peak
clearly coincides with zc in Fig. 12a and the phase changes
by close to p/2 radians across the shear layer, in accord
with our second rule of thumb and the observed vertical
phase shift (Fig. 7f). Closer inspection of Fig. 12b reveals
that the phase shift actually occurs not over the whole
FIG. 12. (a) Amplitude and (b) phase of the vertical displacement eigenfunction corresponding to the 69 fastest-
growing modes with frequencies near to the peak frequency in Fig. 9d, as determined from a LSA using observed
currents and stratification from TAO mooring data at 08, 1408W. Amplitude is nondimensional and is defined up to an
arbitrary scaling factor. The vertical axis is depth referenced to the critical layer at which the fastest-growing mode
was found and nondimensionalized by its wavelength. Horizontal dashed lines identify a layer of thickness l/7 about
zc. Thick lines are mean values, and thin lines encompass 50% of the eigenfunctions.
408 J O U R N A L O F P H Y S I C A L O C E A N O G R A P H Y VOLUME 41

shear layer but over approximately the inner half of that
layer. We will show that this property resolves the phase
speed discrepancy noted in section 6a.
3) RELATIONSHIP BETWEEN WAVELENGTHS
AND SHEAR LAYER THICKNESSES
The shear layer thickness hs was determined for each
mode by fitting the shear magnitude to a function S0
sech2[(z 2 zc)/hs], where S0 is the shear at the critical
level. Figure 13 shows statistics of the shear layer thick-
ness and the wavelength for modes with frequencies in
the range 1023 , j f j , 1022.7. The median shear layer
thickness is 30 m. Combined with our previous observa-
tion that the phase shift occurs over half the shear layer,
the phase shift should typically occur over 15 m in ac-
cordance with the example shown in Fig. 7.
The median wavelength for this subsample of the un-
stable modes is 245 m, consistent with the observations of
Moum et al. (1992a). If we now recompute the phase
velocity of the mode shown in Fig. 7 using this wave-
length, we find c 5 20.42 m s21. This is within the range
of background flow speeds observed in the depth range
of the xpods. This improved agreement with linear theory
is thanks mainly to the refinement of our previous as-
sumption that the phase shift occupies the entire shear
layer.
The canonical model for shear layer instability is the
Kelvin–Helmholtz form, derived from hyperbolic-tangent
profiles of velocity and density (Hazel 1972), whence
comes the expectation that the wavelength is about 7
times the shear layer thickness. In our computed modes,
the mean value of l/hs is 7.4, the median value is 8.8,
and 75% of the values of l/hs lie within the range [6, 11]
(Fig. 13). Although it is likely that this ratio is altered
by the range of naturally occurring shear profiles that
spawn unstable modes (Part II), this result suggests that
the Kelvin–Helmholtz model provides a reasonable de-
scription of the observed instabilities.
In sum, the apparent frequencies of predicted shear
instabilities are close to fNB (and close to N/2p as well),
the predicted vertical phase dependence of p/2 across hs
echoes the observed phase shifts, and 92% of the com-
puted wavelengths are within a factor of 2 of 7hs.
7. Discussion
The LSA does not produce a preference for night-
time instabilities over daytime ones. Although this
might be considered to be inconsistent with our inter-
pretation of the narrowband signal (which has a strong
daily variation, at least above 40 m, as indicated by
Fig. 10) as shear instabilities, it may also be due to the
relatively coarse quality of the data used to perform
the LSA.
One of the great benefits of the TAO data is the long,
freely available time series from which we can test theories
such as ours. At the same time, we are pushing that data
beyond its intended use as it is not resolved finely enough,
either in time or in space, to adequately capture the true
variability of shear and stratification in equatorial flows.
This can be clearly seen by comparison to the richness
of small-scale variability shown in the measurements of
Moum et al. (2009). Perhaps of most concern is the lack of
high-quality data near the surface where the downward
migration of the mixed layer at night includes both the
highly stratified and highly sheared mixed layer base,
which is a potential instability trigger on a daily time scale.
Yet, despite the limitations of the data, we have found
that instabilities are predicted and that the properties
of these instabilities are consistent with the properties of
the observed narrowband oscillations. In a complemen-
tary future analysis, we will examine the well-resolved
FIG. 13. (a) Histogram of wavelengths nondimensionalized by the thickness of the shear layer hs in which they were found.
Only the 69 modes with absolute frequencies between 1023 and 1022.7 Hz were included. (b) Scatterplot of l vs hs.
MARCH 2011 M O U M E T A L . 409

measurements described by Moum et al. (2009) to de-
termine if LSA can define the daily variations.
A detailed one-to-one comparison of observed and
predicted instabilities is beyond the capability of the
data available from the TAO moorings (which do not
offer coincident velocity and density profiles). It may
also be generally impossible simply because practically
all instabilities (those characterized by c 6¼ 0) formed
in sheared flows such as these are not observed until
they have achieved observable amplitude. Hence, ob-
served shear instabilities must coincide with mean flow
conditions different from those in which they were
created.
8. Summary and conclusions
These measurements provide a depiction of the nar-
rowband oscillations at the equator that has not pre-
viously been available. They demonstrate the following
characteristics:
d The oscillations are groupy. They appear as groups of
O(10) individual oscillations (Fig. 8).d Spectral peaks at fNB are approximately two orders of
magnitude greater than at background frequencies,
even when computed over two-day periods.d fNB is similar in magnitude to N/2p, but these are not
correlated in time.d Daily variation in oscillation potential energy is great-
est at night and concentrated at the surface (Fig. 10).d Mixing is enhanced (Fig. 11).d There is high vertical coherence at fNB.d Finally, there exists strong vertical phase dependence
at fNB, typified by the abrupt p/2 phase shift in Fig. 7f.
At minimum, the observed abrupt vertical phase
change motivates our interpretation of these oscilla-
tions as shear instabilities. Together with previous anal-
yses (Sun et al. 1998; Smyth and Moum 2002) that have
shown instability wavelengths comparable to observed
wavelengths (Moum et al. 1992a), this has prompted the
computation of the properties of shear instabilities from
the available TAO data. From this analysis, we have
shown that the localized shear layers where instabilities
are formed are approximately l/7 in thickness, with ap-
parent frequencies comparable to fNB (Fig. 9d), further
supporting the case that the observed narrowband signal
is due to shear instability resembling the classic Kelvin–
Helmholtz form. This scenario differs from the model of
a Doppler-shifted wave field suggested by McPhaden and
Peters (1992).
These measurements support previous observations
demonstrating the short-lived nature of packets of
narrowband oscillations formed at night in the upper
equatorial thermocline (McPhaden and Peters 1992;
Moum et al. 1992a). The ratio NT2 z2/�x may be consid-
ered a time scale representing the decay of the energy
in the oscillations solely due to turbulence. This time
scale is O(1 h) (Fig. 11), and it corresponds roughly to
the observed duration of packets of O(10 periods) at
5 cph (in the reference frame of the fixed observer).
The suggestion has been that the combination of space–
time patchiness and high turbulence means these
packets are generated locally and decay locally (Moum
et al. 1992a). Our analysis indicates that the properties of
these oscillations are consistent with shear instabilities
formed from the hourly mean structure of currents and
stratification.
It seems that the observed narrowband signal in the
temperature record is consistent with locally generated
shear instabilities that do not propagate or advect very far
before breaking. The fact that fNB is near N/2p has to do
with propagation of the spatial structure of the instability
characterized by l at c past the measurement point, rather
than oscillation of a gravity wave at frequency N (Part II).
In Part II, we show that N is a natural scale because 1) the
dominant frequency of an ensemble of shear instabilities
scales with S and 2) S and N are closely related in this
near-critical Ri flow.
The strong variability in turbulence associated with
that of these narrowband oscillations contributes to large
variations in vertical mixing. It is important that we sam-
ple the full range of conditions to determine the com-
plete role of mixing in the equatorial heat balance. The
xpod measurements on TAO moorings are continuing
with this objective.
Acknowledgments. This work was funded by the
National Science Foundation (0424133, 0622922, and
0728375). Mike Neeley-Brown and Ray Kreth were re-
sponsible for construction of the xpods. Alexander Perlin
helped to organize and process the data. Numerous
NOAA personnel have aided this effort with their pro-
fessional handling of our instruments on deployment and
recovery. We are indebted to NOAA’s TAO Project
Office for continued support in xpod deployments and
recoveries and for the use of the mooring data from 08,
1408W.
REFERENCES
Baines, P. G., and H. Mitsudera, 1994: On the mechanism of shear
flow instabilities. J. Fluid Mech., 276, 327–342.
Crawford, W. R., and T. R. Osborn, 1981: Control of equatorial
currents by turbulent dissipation. Science, 212, 539–540.
Fairall, C., E. Bradley, D. Rogers, J. Edson, and G. Young, 1996:
Bulk parameterization of air-sea fluxes for Tropical Ocean–
Global Atmosphere Coupled–Ocean Atmosphere Response
Experiment. J. Geophys. Res., 101 (C2), 3747–3767.
410 J O U R N A L O F P H Y S I C A L O C E A N O G R A P H Y VOLUME 41

Gregg, M. C., H. Peters, J. C. Wesson, N. S. Oakey, and T. J. Shay,
1985: Intensive measurements of turbulence and shear in the
Equatorial Undercurrent. Nature, 318, 140–144.
Hazel, P., 1972: Numerical studies of the stability of inviscid parallel
shear flows. J. Fluid Mech., 51, 39–62.
Howard, L., 1961: Note on a paper of John W. Miles. J. Fluid Mech.,
10, 509–512.
Lien, R., M. J. McPhaden, and M. C. Gregg, 1996: High-frequency
internal waves at 08, 1408W and their possible relationship to
deep-cycle turbulence. J. Phys. Oceanogr., 26, 581–600.
Mack, A. P., and D. Hebert, 1997: Internal gravity waves in the
upper eastern equatorial Pacific: Observations and numerical
solutions. J. Geophys. Res., 102, 21 081–21 100.
McCreary, J. P., 1981: A linear stratified ocean model of the Equa-
torial Undercurrent. Philos. Trans. Roy. Soc. London, 298A,603–635.
McPhaden, M. J., and H. Peters, 1992: Diurnal cycle of internal
wave variability in the equatorial Pacific Ocean. J. Phys.
Oceanogr., 22, 1317–1329.
Moum, J. N., and D. R. Caldwell, 1985: Local influences on shear
flow turbulence in the equatorial ocean. Science, 230, 215–315.
——, and J. D. Nash, 2009: Mixing measurements on an equatorial
ocean mooring. J. Atmos. Oceanic Technol., 26, 317–336.
——, D. Hebert, C. A. Paulson, and D. R. Caldwell, 1992a: Tur-
bulence and internal waves at the equator. Part I: Statistics
from towed thermistors and a microstructure profiler. J. Phys.
Oceanogr., 22, 1330–1345.
——, M. J. McPhaden, D. Hebert, H. Peters, C. A. Paulson, and
D. R. Caldwell, 1992b: Internal waves, dynamic instabilities,
and turbulence in the equatorial thermocline: An introduction
to three papers in this issue. J. Phys. Oceanogr., 22, 1357–1359.
——, R.-C. Lien, A. Perlin, J. D. Nash, M. C. Gregg, and P. J. Wiles,
2009: Sea surface cooling at the equator by subsurface mixing
in tropical instability waves. Nat. Geosci., 2, 761–765.
Pham, H. T., and S. Sarkar, 2010: Internal waves and turbulence in
a stable stratified jet. J. Fluid Mech., 648, 297–324.
Skyllingstad, E. D., and D. W. Denbo, 1994: The role of internal
gravity waves in the equatorial current system. J. Phys. Oceanogr.,
24, 2093–2110.
Smyth, W. D., and W. Peltier, 1989: The transition between Kelvin-
Helmholtz and Holmboe instability: An investigation of the
overreflection hypothesis. J. Atmos. Sci., 46, 3698–3720.
——, and J. N. Moum, 2002: Waves and instability in an asym-
metrically stratified jet. Dyn. Atmos. Oceans, 35, 265–294.
——, ——, and J. D. Nash, 2011: Narrowband oscillations in the
upper equatorial ocean. Part II: Properties of shear instabilities.
J. Phys. Oceanogr., 41, 412–428.
Sun, C., W. D. Smyth, and J. N. Moum, 1998: Dynamic instability of
stratified shear flow in the upper equatorial ocean. J. Geophys.
Res., 103 (C5), 10 323–10 337.
Turner, J. S., 1973: Buoyancy Effects in Fluids. Cambridge Uni-
versity Press, 367 pp.
Wijesekera, H., and T. M. Dillon, 1991: Internal waves and mixing
in the upper equatorial ocean. J. Geophys. Res., 96 (C4),
7115–7125.
Zaron, E. D., and J. N. Moum, 2009: A new look at Richardson
number mixing schemes for equatorial ocean modeling. J. Phys.
Oceanogr., 39, 2652–2664.
MARCH 2011 M O U M E T A L . 411