Napping by modality: a happy medium between analytic and ...€¦ · Napping by modality: a happy...
19
Napping by modality: a happy medium between analytic and holistic approaches Pfeiffer & Gilbert*, Sensometrics 2008 Johann C. Pfeiffer and Chantal C. Gilbert Consumer & Sensory Sciences Department Campden & Chorleywood Food Research Association
Transcript of Napping by modality: a happy medium between analytic and ...€¦ · Napping by modality: a happy...
Napping by modality:
a happy medium between analytic
and holistic approaches
Pfeiffer & Gilbert*, Sensometrics 2008
Johann C. Pfeiffer and Chantal C. Gilbert
Consumer & Sensory Sciences Department
Campden & Chorleywood Food Research Association
Introduction: the Napping® method
• Projective mapping first introduced by Risvik et al. 1994.
• Napping® - elaborated by Pagès and colleagues, who
introduced the use of Multiple Factor Analysis (MFA) to
analyse the data.
• Synthesised method of data collection: assessors position
products on a two dimensional surface (e.g. large sheet of
Pfeiffer & Gilbert*, Sensometrics 2008
products on a two dimensional surface (e.g. large sheet of
paper) according to overall sensory similarities and
differences.
• Assessors are free to choose the various criteria used to
separate the products.
• Assessors often asked to enhance the map with
descriptive terms for each product (Ultra-Flash Profiling).
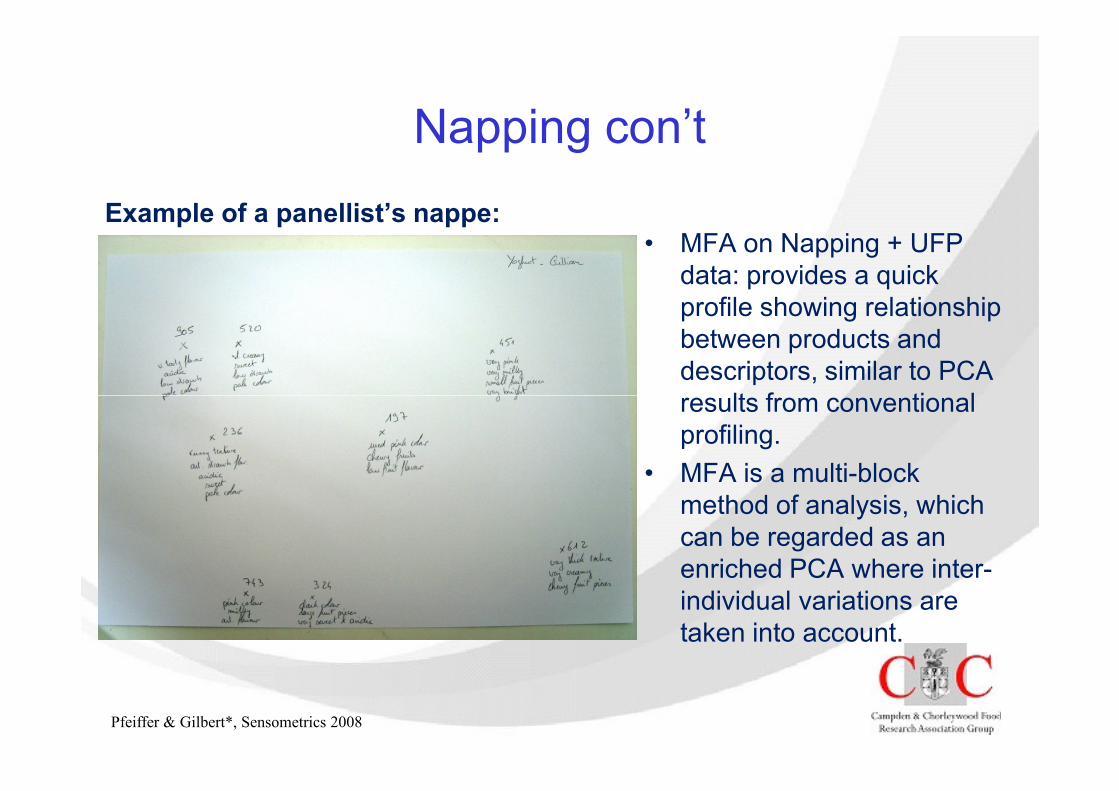
Napping con’t
• MFA on Napping + UFP
data: provides a quick
profile showing relationship
between products and
descriptors, similar to PCA
results from conventional
Example of a panellist’s nappe:
Pfeiffer & Gilbert*, Sensometrics 2008
results from conventional
profiling.
• MFA is a multi-block
method of analysis, which
can be regarded as an
enriched PCA where inter-
individual variations are
taken into account.
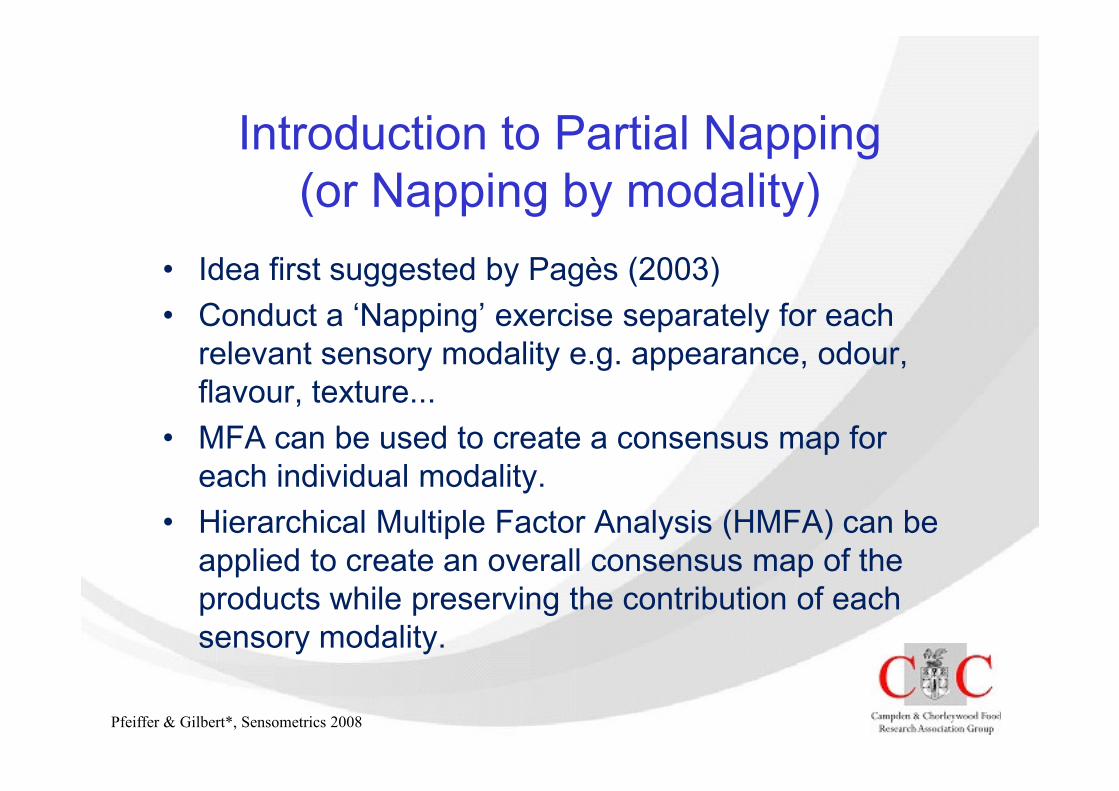
Introduction to Partial Napping
(or Napping by modality)
• Idea first suggested by Pagès (2003)
• Conduct a ‘Napping’ exercise separately for each
relevant sensory modality e.g. appearance, odour,
flavour, texture...
Pfeiffer & Gilbert*, Sensometrics 2008
flavour, texture...
• MFA can be used to create a consensus map for
each individual modality.
• Hierarchical Multiple Factor Analysis (HMFA) can be
applied to create an overall consensus map of the
products while preserving the contribution of each
sensory modality.
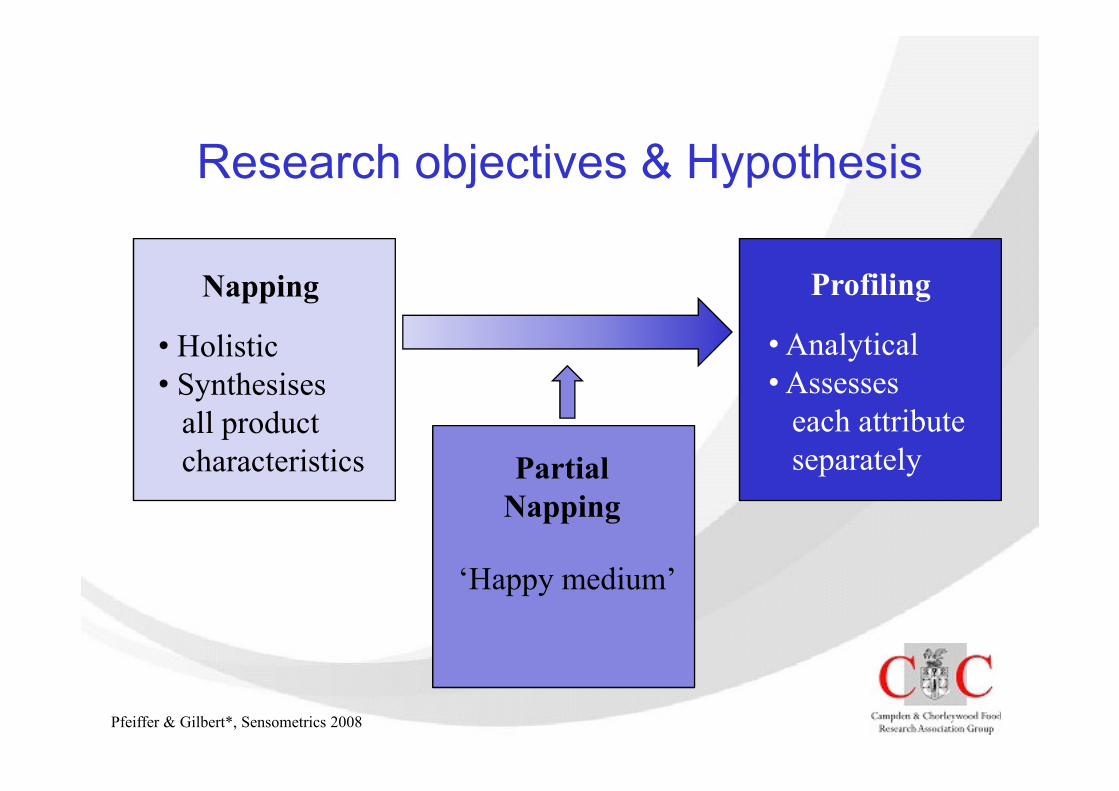
Research objectives & Hypothesis
Napping
• Holistic
• Synthesises
Profiling
• Analytical
• Assesses
Pfeiffer & Gilbert*, Sensometrics 2008
• Synthesises
all product
characteristics
• Assesses
each attribute
separatelyPartial
Napping
‘Happy medium’
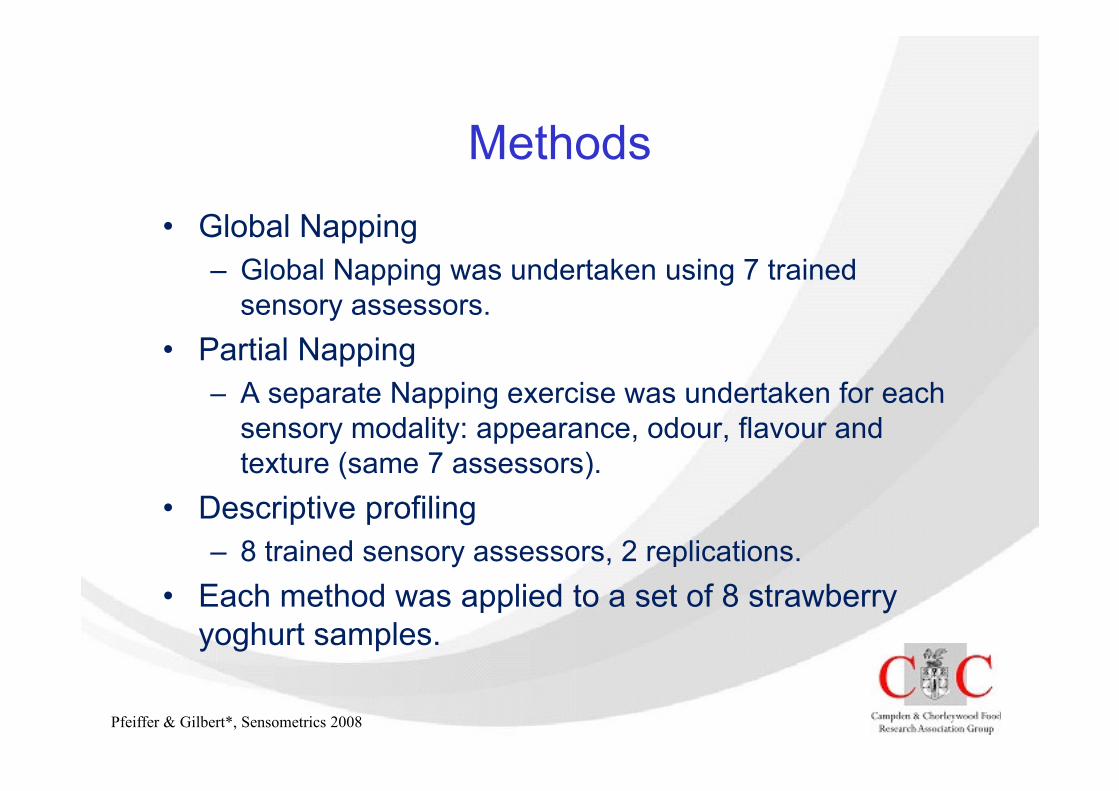
Methods
• Global Napping
– Global Napping was undertaken using 7 trained
sensory assessors.
• Partial Napping
– A separate Napping exercise was undertaken for each
Pfeiffer & Gilbert*, Sensometrics 2008
– A separate Napping exercise was undertaken for each
sensory modality: appearance, odour, flavour and
texture (same 7 assessors).
• Descriptive profiling
– 8 trained sensory assessors, 2 replications.
• Each method was applied to a set of 8 strawberry
yoghurt samples.
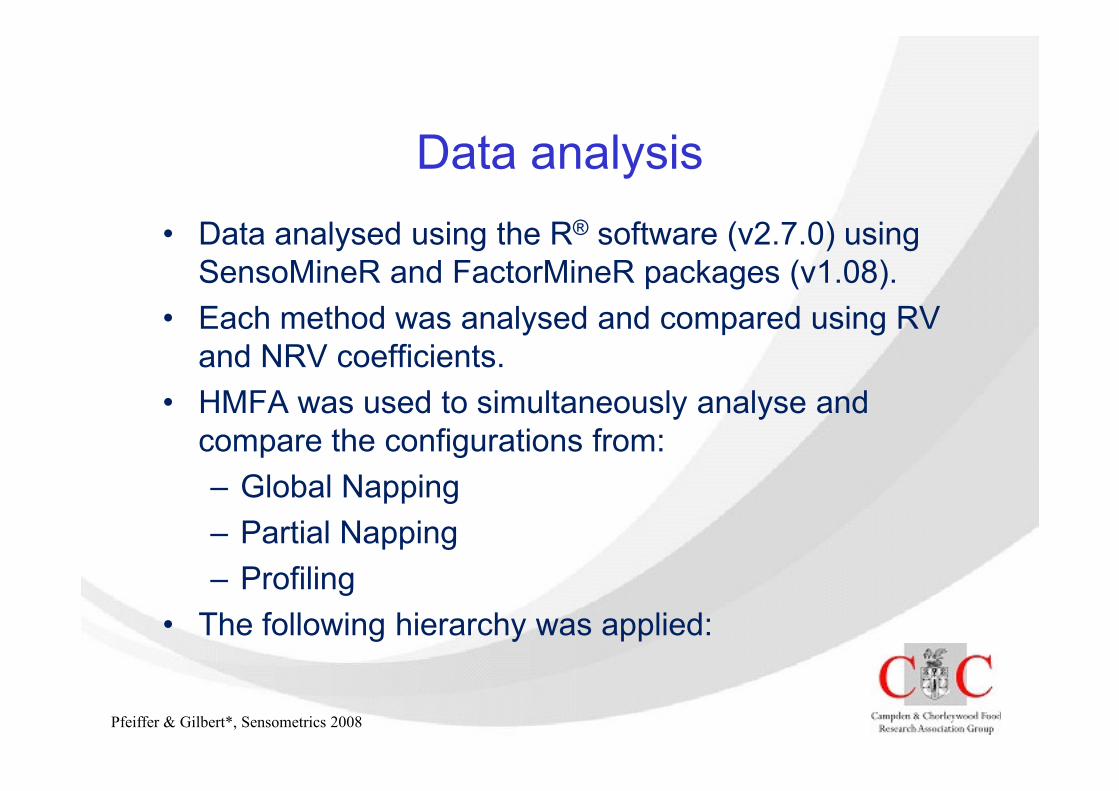
Data analysis
• Data analysed using the R® software (v2.7.0) using
SensoMineR and FactorMineR packages (v1.08).
• Each method was analysed and compared using RV
and NRV coefficients.
• HMFA was used to simultaneously analyse and
Pfeiffer & Gilbert*, Sensometrics 2008
• HMFA was used to simultaneously analyse and
compare the configurations from:
– Global Napping
– Partial Napping
– Profiling
• The following hierarchy was applied:
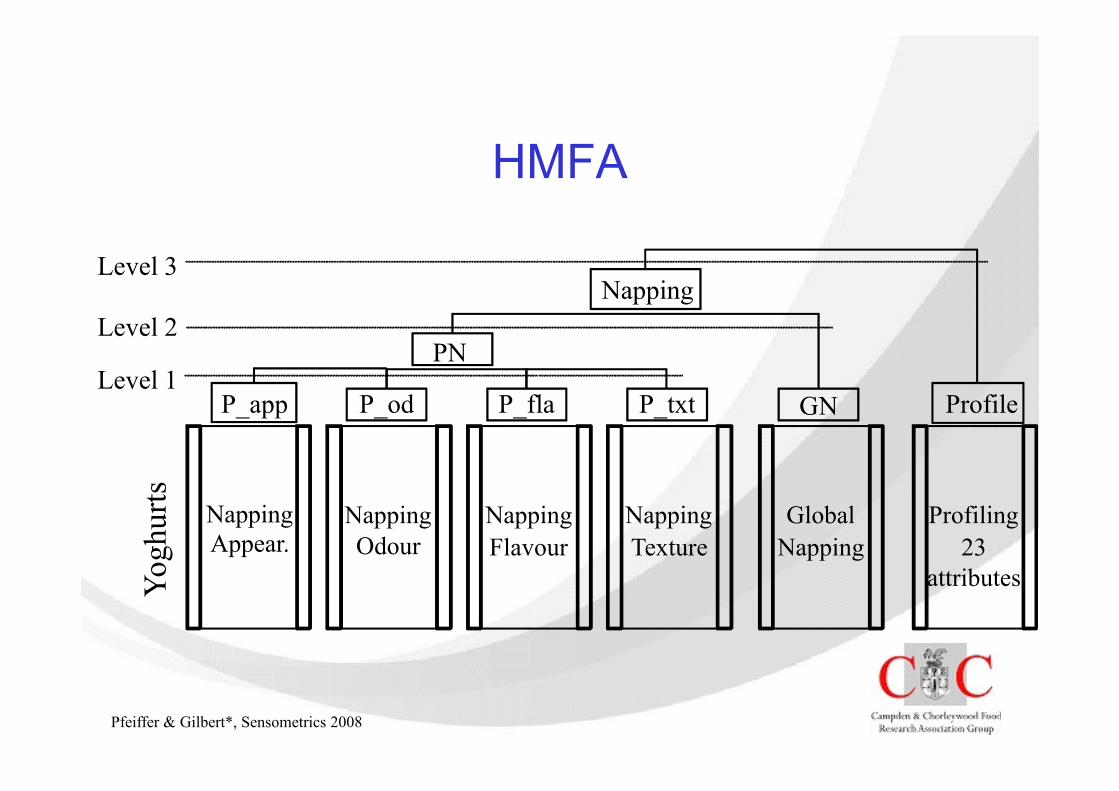
HMFA
Level 2
Level 1GN ProfileP_app P_od P_fla P_txt
PN
NappingLevel 3
Pfeiffer & Gilbert*, Sensometrics 2008
Global
Napping
GN
Profiling
23
attributes
Profile
Napping
Appear. Napping
Odour
Napping
Flavour
Napping
Texture
P_app P_od P_fla P_txt
Yoghurts
Results
Pfeiffer & Gilbert*, Sensometrics 2008
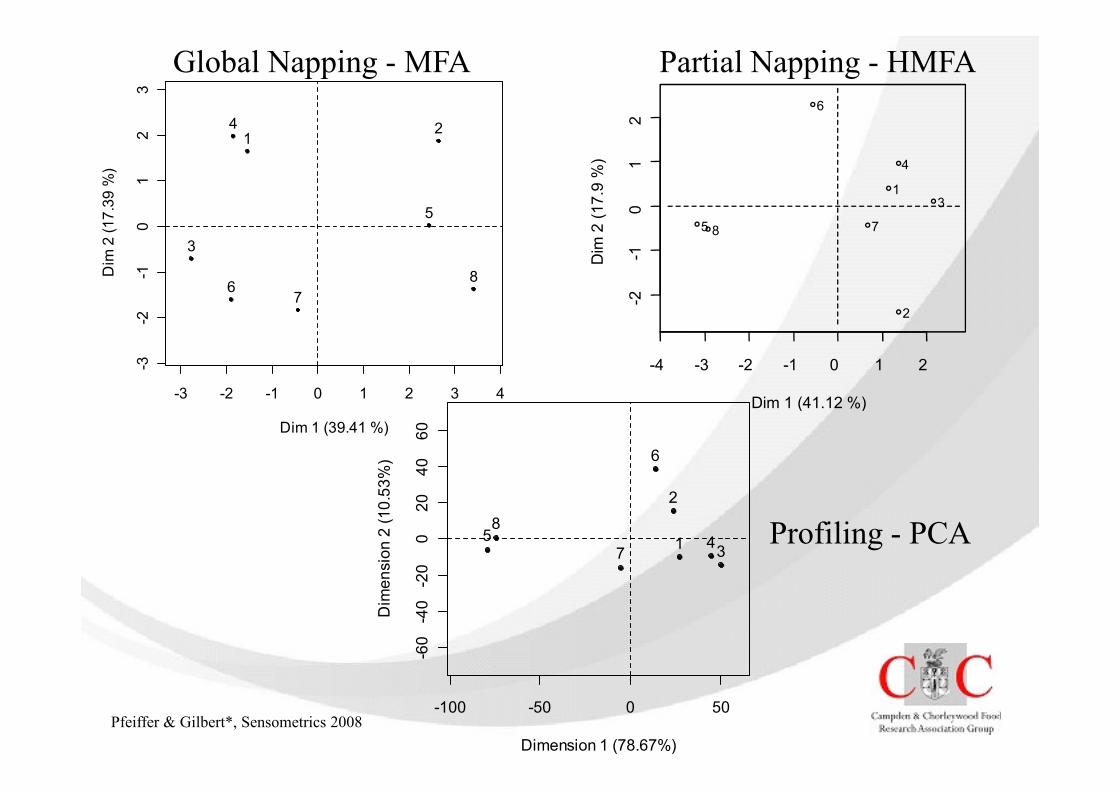
-4 -3 -2 -1 0 1 2
-2-1
01
2
Dim 1 (41.12 %)
Dim
2 (17.9
%)
1
2
3
4
5
6
78
Global Napping - MFA Partial Napping - HMFA
-3 -2 -1 0 1 2 3 4
-3-2
-10
12
3
Dim
2 (17.3
9 %
)
12
3
4
5
67
8
Pfeiffer & Gilbert*, Sensometrics 2008
Dim 1 (41.12 %)
-100 -50 0 50
-60
-40
-20
020
40
60
Dimension 1 (78.67%)
Dim
ensio
n 2
(10.5
3%
)
1
2
345
6
7
8Profiling - PCA
-3 -2 -1 0 1 2 3 4
Dim 1 (39.41 %)
01
2
Dim
2 (15.7
1 %
)
1
3
45
6
78
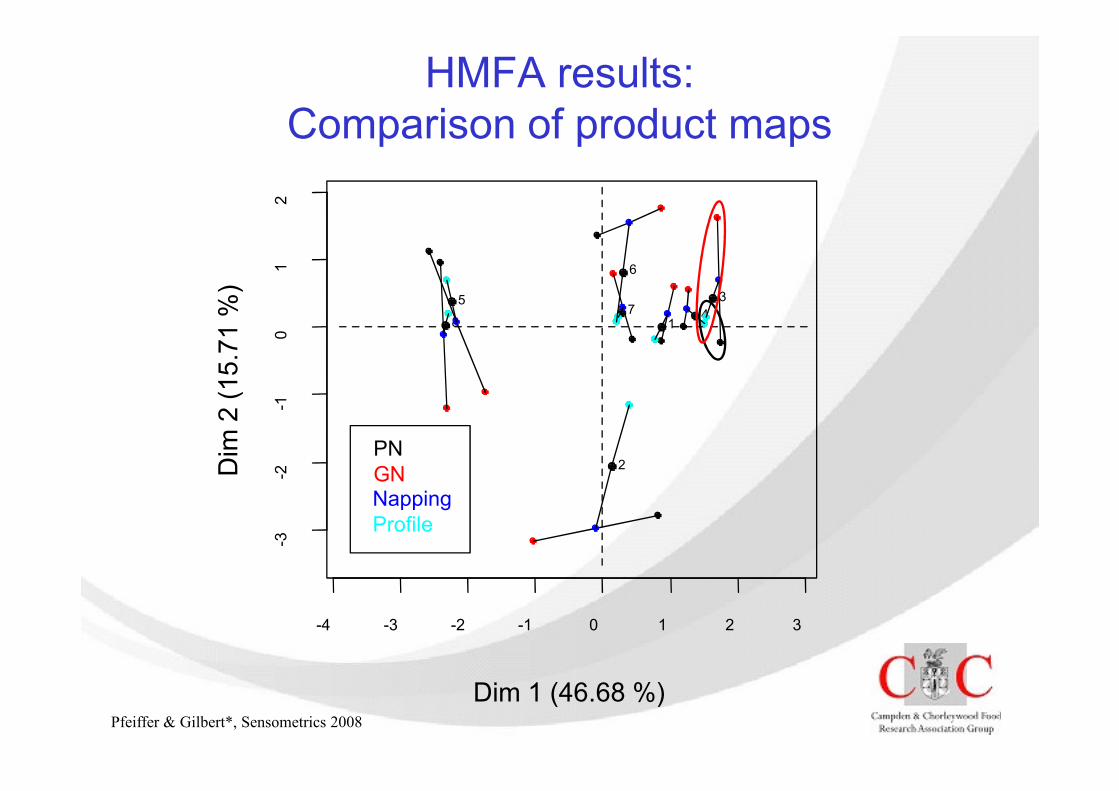
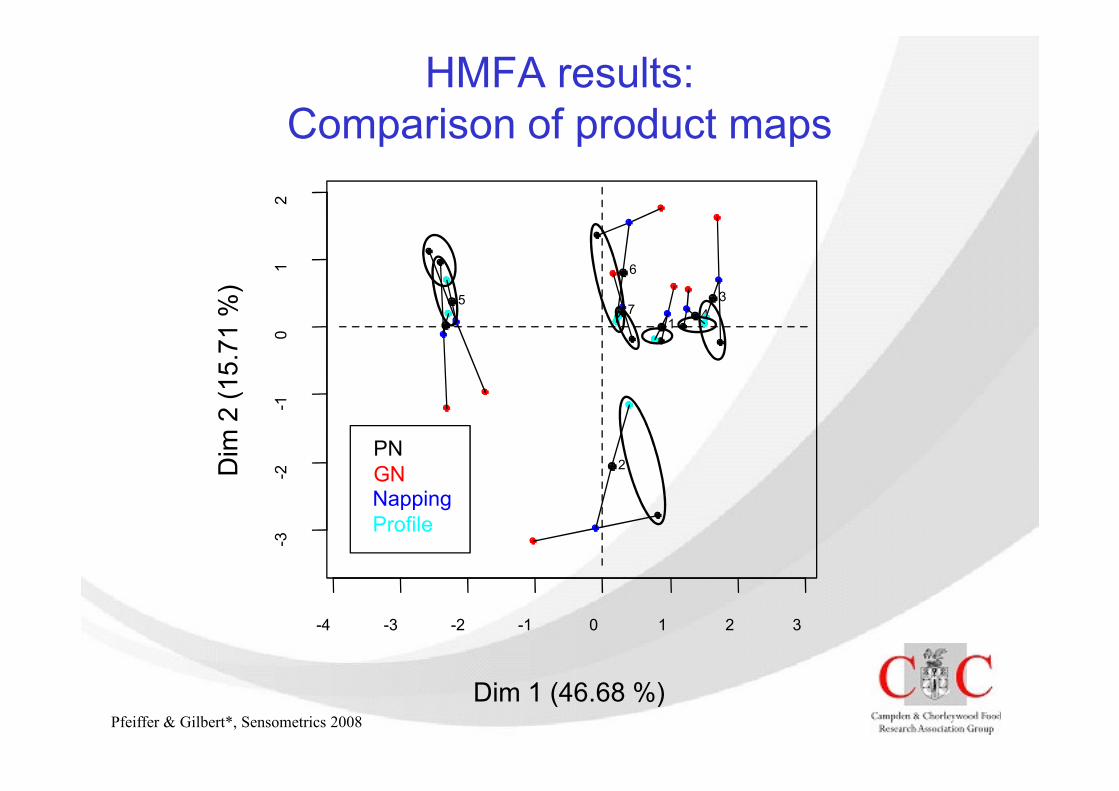
HMFA results:
Comparison of product maps
Pfeiffer & Gilbert*, Sensometrics 2008
-4 -3 -2 -1 0 1 2 3
-3-2
-1
Dim 1 (46.68 %)
Dim
2 (15.7
1 %
)
2PN
GNNapping
Profile
01
2
Dim
2 (15.7
1 %
)
1
3
45
6
78
HMFA results:
Comparison of product maps
Pfeiffer & Gilbert*, Sensometrics 2008
-4 -3 -2 -1 0 1 2 3
-3-2
-1
Dim 1 (46.68 %)
Dim
2 (15.7
1 %
)
2PN
GNNapping
Profile
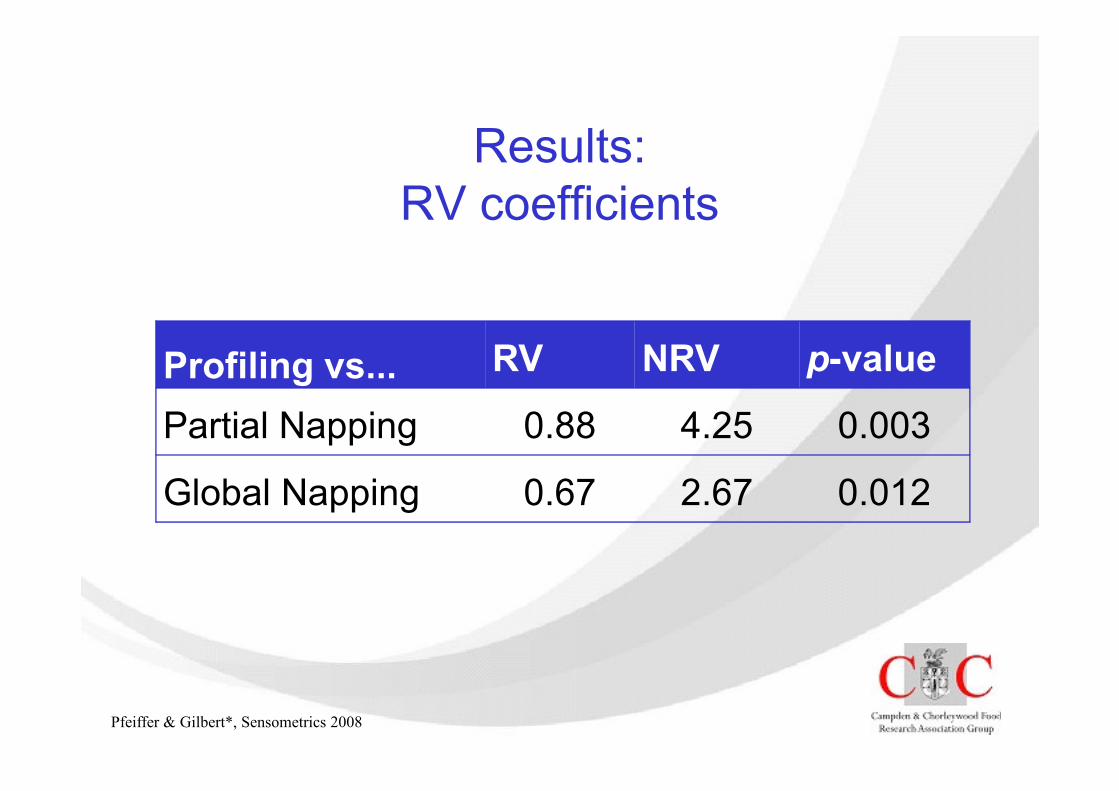
Results:
RV coefficients
Profiling vs... RV NRV p-value
Pfeiffer & Gilbert*, Sensometrics 2008
Partial Napping 0.88 4.25 0.003
Global Napping 0.67 2.67 0.012
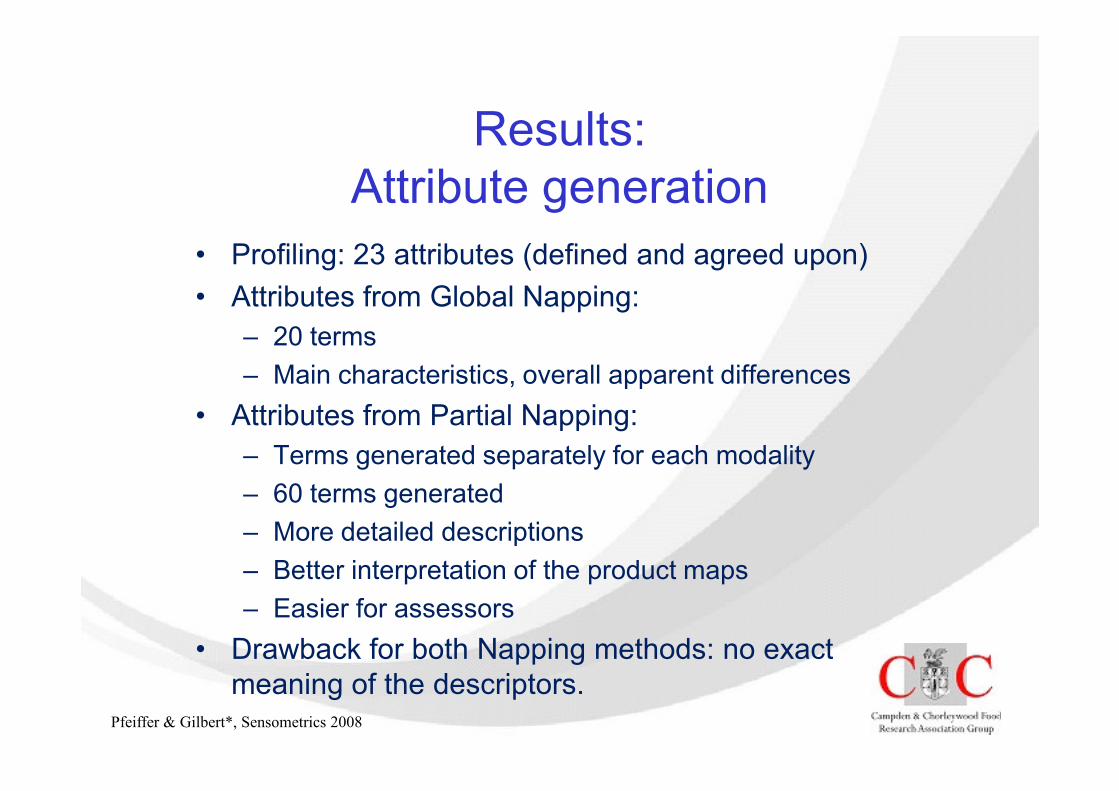
Results:
Attribute generation
• Profiling: 23 attributes (defined and agreed upon)
• Attributes from Global Napping:
– 20 terms
– Main characteristics, overall apparent differences
Pfeiffer & Gilbert*, Sensometrics 2008
• Attributes from Partial Napping:
– Terms generated separately for each modality
– 60 terms generated
– More detailed descriptions
– Better interpretation of the product maps
– Easier for assessors
• Drawback for both Napping methods: no exact
meaning of the descriptors.
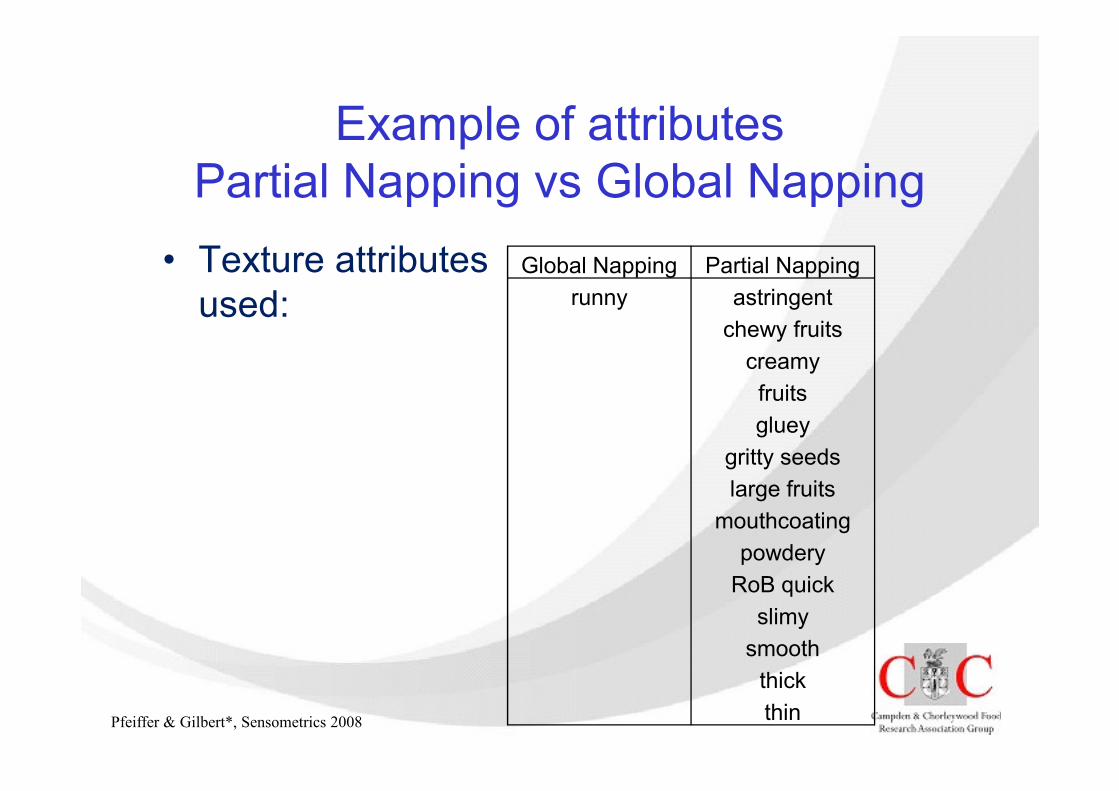
Example of attributes
Partial Napping vs Global Napping
• Texture attributes
used:
Global Napping Partial Napping
runny astringent
chewy fruits
creamy
fruits
Pfeiffer & Gilbert*, Sensometrics 2008
fruits
gluey
gritty seeds
large fruits
mouthcoating
powdery
RoB quick
slimy
smooth
thick
thin
Conclusions
• Partial Napping allowed the panellist to be more analytical in
their approach by focusing on each sensory dimension
separately.
• Attributes generated during the Partial Napping sessions
were more descriptive and allowed for easier interpretation
of results.
Pfeiffer & Gilbert*, Sensometrics 2008
of results.
• The sample space from Partial Napping was closer to the
space derived from descriptive profiling, compared to Global
Napping.
– This may be dependent on the product category; further
studies are underway to validate these results.
• Panellists found both the sample placement and the sample
descriptions easier for the Partial Napping technique.
Acknowledgement
Thank you to François Husson, Lucie Perrin,
Sébastien Lê and Jérôme Pagès for their
support with SensoMineR and FactoMineR
Pfeiffer & Gilbert*, Sensometrics 2008
support with SensoMineR and FactoMineR
software.
References
• Le Dien, S. and Pagès, J. (2003) Hierarchical Multiple Factor Analysis:
application to the comparison of sensory profiles. Food Quality and Preference,
14, 397-403.
• Pagès, J. (2003) Recueil direct de distances sensorielles: application à
l'évaluation de dix vins blancs du Val-de-Loire. Sciences des Aliments, 23, 679-
688.
• Pagès, J. (2005) Collection and analysis of perceived product inter-distances
Pfeiffer & Gilbert*, Sensometrics 2008
• Pagès, J. (2005) Collection and analysis of perceived product inter-distances
using multiple factor analysis: Application to the study of 10 white wines from the
Loire Valley. Food Quality and Preference, 16, 642-649.
• Pfeiffer, J.C. and Gilbert, C.C. (2008) Alternative approaches to conventional
sensory profiling for the acquisition of products’ perceptual maps: the Napping®
technique. CCFRA R&D report (in preparation).
• Risvik, E., McEwan, J. A., Colwill, J. S., Rogers, R. and Lyon, D. H. (1994)
Projective mapping: A tool for sensory analysis and consumer research. Food
Quality and Preference, 5, 263-269.

Thank you for your attention!
Questions?
Pfeiffer & Gilbert*, Sensometrics 2008
Questions?
Contact details:
+44 (0)1386 842256
www.campden.co.uk