Nanshin: Budget- Maximising Behavior, The Imperial ... · Nanshin: Budget- Maximising Behavior, The...
37
University of New England School of Economics Nanshin: Budget- Maximising Behavior, The Imperial Japanese Navy And The Origins Of The Pacific War by Brian Dollery, Zane Spindler and Craig Parsons No. 2003-8 Working Paper Series in Economics ISSN 1442 2980 http://www.une.edu.au/febl/EconStud/wps.htm Copyright © 2003 by Brian Dollery, Zane Spindler and Craig Parsons. All rights reserved. Readers may make verbatim copies of this document for non-commercial purposes by any means, provided this copyright notice appears on all such copies. ISBN 1 86389 839 5
Transcript of Nanshin: Budget- Maximising Behavior, The Imperial ... · Nanshin: Budget- Maximising Behavior, The...

University of New England
School of Economics
Nanshin: Budget- Maximising Behavior, The Imperial Japanese Navy And The Origins Of The Pacific War
by
Brian Dollery, Zane Spindler and Craig Parsons
No. 2003-8
Working Paper Series in Economics
ISSN 1442 2980
http://www.une.edu.au/febl/EconStud/wps.htm
Copyright © 2003 by Brian Dollery, Zane Spindler and Craig Parsons. All rights reserved. Readers may make verbatim copies of this document for non-commercial purposes by any means, provided this copyright notice appears on all such copies. ISBN 1 86389 839 5
2
Nanshin: Budget- Maximising Behavior, The Imperial Japanese Navy And The
Origins Of The Pacific War
Brian Dollery, Zane Spindler and Craig Parsons ∗∗∗∗∗∗∗∗
Abstract
Historians have established that inter-service rivalry over budget allocations between
the Imperial Japanese Navy and the Imperial Army played a crucial role in the
genesis of World War Two in the Pacific. The adoption of a nanshin (‘southward
advance’) strategy by the Navy may be explained as an attempt to maximize its
budget leading directly to the fateful attack on Pearl Harbor in 1941. To date, this
argument has been presented in the form of historical narrative without any
explanatory theoretical framework. The present paper seeks to place inter-service
budgetary rivalry within the context of public choice theory in an attempt to enhance
understanding of this historical perspective.
Key Words: Budget Maximization; Japanese Imperial Navy; Nanshin; Public Choice
∗∗∗∗∗∗∗∗ Brian Dollery is Professor of Economics at the School of Economics, University of New England, Zane Spindler is Professor of Economics at Simon Fraser University and Craig Parsons is Associate Professor of Economics at Yokohama National University. Contact information: School of Economics, University of New England, Armidale, NSW 2351, Australia. Email: [email protected].
3
1. INTRODUCTION
The origins of World War 2 in the Pacific are complex, multi-faceted and still not
well understood by scholars. Indeed, Dockrill (1994, p.3) has observed recently
that ‘historians could not even agree on when the war started or what it should be
called’. The analysis of the causes of the Pacific War began in earnest with the
judicial hearings of the International Military Tribunal for the Far East, more
commonly known as the Tokyo Trial, over the period 1946 to 1948, and
continues to the present time. Early efforts at explaining the origins of the conflict
were severely hampered by the classification of a good deal of the official
Japanese and Allied documentation, including crucial material gathered through
the Magic code-breaking system (Department of Defense, 1978). Contemporary
work remains handicapped by translation difficulties and significant errors in the
transcription of much of the decoded Magic documentation (Komatsu, 1999).
With some exceptions (Moriyama, 1990), historians have produced a
voluminous narrative literature largely devoid of theoretical frameworks as
organizing and explanatory tools. This literature presently has two main streams.
On the one hand, a number of scholars have argued that the outbreak of the
Pacific War was not simply an inevitable consequence of the expansion of the
‘China Incident’, but rather the result of complex power relations between
America, Great Britain, Italy, Japan and the Third Reich in a global context,
including the war in Europe (Hatano, 1991). On the other hand, another (mostly
Japanese) school of thought has contended that the pre-war decision-making
institutional structure in Japan played a significant role in the events leading up to
4
the attack on Pearl Harbor on 7 December 1941. In particular, ‘the increasing
influence of the military’s power resulted in a lack of national control, rather than
the establishment of a totalitarian control system, because the military’s power
itself had eventually fallen apart into various divisions’ (Komatsu, 1999, p. 359).
This paper falls squarely within the latter camp.
The significance of venomous inter-service rivalry between the Imperial
Japanese Navy and the Imperial Japanese Army over the size of their annual
budgetary allocations from the central government has been recognized as a key
causal factor in the Pacific War by a number of historians (see, especially,
Barnhart (1987), Frei (1991) and Schencking (1998; 1999)). Moreover, this
appears to have been explicitly acknowledged by Imperial Navy officers at the
time. For example, in 1934 when asked whether the Navy contemplated war with
the United States Navy, Admiral Suetugu Nobumasa replied: ‘Certainly, even this
is acceptable if it will get us a budget’ (Barnhart, 1987, p. 39). Similarly, shortly
after a key ministerial conference on 19 January 1939, Navy Captain Takagi
Sokichi assured delegates that they should not erroneously presume that ‘the
Navy, although prepared to use Britain and the United States as pretexts for a
budget, actually did not want to confront them’ (Asada, 1973, p. 246).
The implications of inter-service rivalry are perhaps at their most stark in
the context of the competing strategies developed by the Imperial Navy and the
Imperial Army prior to the Pacific War. Nanshu hokushin (defense in the south
and advance in the north) became the official doctrine of the Army, known as
hokushin-ron (school of thought for northward advance). Similarly, hokushu
5
nanshin (defense in the north and advance in the south), termed nanshin-ron
(school of thought for southward advance) became the standard naval strategy
(Frei, 1991, p.66). In essence, through its nanshin-ron policy, the Navy hoped to
seize the resource-rich British Burma, Malaya and Singapore, the Dutch East
Indies, French Indochina and the American Philippines, thereby easing the
drastic shortages of essential materials in Japan contingent upon the American
economic boycott. It understood that this meant war with both the British Empire
and the United States. However, it was hoped that this conflict would be short
lived. The adoption of a nanshu hokushin strategy meant that the Navy could lay
legitimate claim to the vast budgetary resources required to build a modern ‘blue-
water’ fleet of sufficient strength to defeat the Royal Navy and US Fleet.
By contrast, the Army sought a ‘holding strategy’ in the Pacific, with
conquest limited to the Netherlands East Indies (and possibly British Malaya),
thus averting war with America, providing the necessary access to strategic
resources, and allowing for a nanshu hokushin campaign aimed at the defeat of
China and an eventual attack on the Soviet Union. This would ensure that the
preponderance of budgetary funds would flow to the Army since the Navy would
not need a larger fleet. Needless to add, the Imperial Navy hotly contested this
plan ‘because the Anglo-Dutch naval presence was only token, the Navy saw no
role for itself in any advance limited to those countries’ possessions’ and thus
‘the fleet would not be positioned to demand the materials allocations for the
completion of current building plans, much less the initiation of new ones’
(Barnhart, 1987, p. 163).

6
Budgetary competition between the Imperial Army and the Imperial Navy
was further complicated by the existence of other public bureaucracies and
important interest groups in Japanese industry. Notwithstanding the steadily
increasing plethora of regulation, ‘Japan’s economy was by no means
government controlled’ (Barnhart, 1987, p. 172), despite the existence of a
national Planning Board. Industrial cartels represented by ‘control associations’
created under the aegis of the 1930 Major Industries Control Law exerted
significant influence on public decision making. However, the fact that the armed
services could appoint their own ministerial representatives to the Imperial
Cabinet and jeopardize the survival of a government by threatening to withdraw
their respective ministers gave them far more political power than their
counterparts in other public bureaucracies (Akira, 1987). Moreover, since steel
production was overwhelmingly nationalized, the critical annual question of steel
quotas was usually resolved in favor of the armed services to the cost of private
industry. Accordingly, competition for scarce resources from civilian public
bureaucracies and organized industry weakened during the 1930s, particularly
after the escalation of armed conflict following the China Incident in 1937. This is
reflected in dwindling budgets and falling steel allocations (Barnhart, 1987).
Despite the discovery of the importance of budgetary rivalry in Japan as a
critical factor in precipitating and shaping the Pacific War, economists and other
social scientists have ignored this dimension of the Second World War. This is
unfortunate since some of the theoretical approaches developed by economists
appear eminently suited to an analysis of budget-maximizing behavior, not least

7
the literature derived from the seminal work of Niskanen (1971).1 Moreover, an
examination of budgetary rivalry between the two Japanese armed services is of
interest to public choice economists in its own right. Analyses of budget-
maximizing behavior typically focus on the allocative inefficiencies deriving from
this conduct and the social costs they impose on the country in question (Mueller,
1989). However, in the context of the Pacific War, these costs were not only
incalculably higher for Japan, but were also catastrophic for many other
countries.
The paper itself is divided into four main parts. Section 2 provides a brief
synoptic review of the historical importance of inter-service budgetary rivalry in
Japan’s fatal decision to attack the United States and Great Britain. Section 3
presents a theoretical perspective by first introducing Niskanen's bureaucratic
theory and then developing alternative unique extensions, which could serve as a
basis for assessment and analysis of Imperial Army and Navy behavior. Section
4 then applies our theoretical perspective to the historical evidence of Japan's
government and bureaucratic behavior and the consequent Pacific War. The
paper ends with some brief concluding remarks in section 5.
2. HISTORICAL BACKGROUND
Although Japanese seafarers and settlers had a long history of engagement in
the south-west Pacific, modern interest in this region was ignited through the
publicity generated by naval training cruises through the area that began in 1875
1 Specifically, see Migue & Belanger (1974), Niskanen (1975, 1994), Orzechowski (1977), and Jackson (1982) for variations on the budget-maximizing theme.
8
(Frei, 1991). In particular, the populist geographical writings of Hattori Toru,
Suganuma Teifu and Shiga Shigetaka seem to have aroused a tremendous
interest in an almost mystical nan’yo, or South Seas, abundant in majestic
islands and unlimited natural resources. In the popular imagination ‘it was a
warm tropical paradise, a territory in which to gain personal achievements and
fulfill a sense of adventure’ and to nascent expansionists the nan’yo represented
‘the one area untouched by Western imperialists and thus the optimal place for
the new nation of Japan to acquire territories’ (Schencking, 1999, p. 769).
Shrewd Japanese naval propagandists were to turn this popular current to their
advantage.
The Imperial Japanese Navy was established as a separate and
independent force in 1872 with the founding of its own service ministry. However,
with the creation of an Army General Staff in 1878, and no naval equivalent, the
Navy ‘began to slip into a subordinate role, a position it occupied until the
beginning of the 1890s’ (Evans and Peattie, 1997, p. 8). An analogous Naval
General Staff was only founded in 1893. Nevertheless, the pivotal role played by
the Imperial Navy in the Sino-Japanese War (1894-5) and the Russo-Japanese
War (1904-5), where it destroyed both enemy fleets in decisive battles, brought
home to politicians and the public alike the importance of the Navy for the
defense of the home islands and the development of a Japanese empire.
Moreover, ‘war proved immensely profitable for the navy’ (Schencking, 1998,
p.312): whereas in 1890 the total naval budget represented only 64% of the
9
Army’s expenditure, by 1905 this had leapt to 127% of the Army’s outlays (Ono,
1922, pp. 18-24 and pp. 41-46).
The 1907 Imperial Defense Conference represented another significant
milestone in the Navy’s rivalry with the Army. Although this conference sought to
remedy bitter inter-service antagonism and develop a unified imperial defense
strategy, it generated the ironical outcome that each service could define its own
potential opponents. Inter-service rivalry thus emerged as the major beneficiary.
It also served to formalize the earlier rather inchoate and nebulous positions of
the two services. From henceforth nanshu hokushin, also known as hokushin-
ron, became the official doctrine of the Army. Similarly, hokushu nanshin,
sometimes termed nanshin-ron became the standard naval strategy. It is also
evident that nanshin-ron had become ‘a bureaucratic tool through which the navy
hoped to gain a larger share of military appropriations’ (Schencking, 1998, p.
317).
The budgetary impetus afforded the Navy by the 1907 Conference was
comparatively short lived. Longstanding suspicions about corruption in naval
armament acquisitions exploded in the so-called ‘Siemens Navy scandal’, with
damaging revelations of bribery, theft and blackmail involving naval officers
(Evans, 1978). This lead directly to the fall of the pro-Navy Yamamoto Cabinet
and the rescinding of the record naval budgetary allocation intended for the 1914
fiscal year. It was thus most fortuitous for naval leaders that the First World War
intervened.
10
Under the 1902 Anglo-Japanese Alliance, Japan declared war on
Germany. Even before the onset of hostilities the Imperial Navy had already
benefited when the Diet approved an extraordinary allocation to build ten
destroyers for use against the German East Asiatic Squadron. Despite explicit
orders from Navy Minister Yashiro Rokuro against aggressive conduct towards
German interests in the Pacific, in favour of the acquisition of German territories
in China, opportunistic naval commanders succeeded in capturing German
Micronesia north of the equator by October 1914. Separate garrisons were
rapidly consolidated under a unified and Navy-controlled Provisional South Seas
Defence Force that enabled the Imperial Navy to garner further public funds to
administer the new possessions. But the most important outcome for the Navy
from World War I lay in the fact that it could now provide concrete justification for
the need for a large and powerful ‘blue-water’ fleet. Moreover, operational plans
were revised to make Micronesian islands an integral ‘component of its strategy
to defeat its chief hypothetical enemy, the US Navy’ (Schencking, 1998, p. 326).
Nanshin had thus become the cornerstone of the Navy’s budgetary struggle with
its Army adversaries for public funds. Indeed, so successful had been the
Imperial Navy strategy during the war that by 1921 it had a budget almost twice
the size of the Army.
In the aftermath of World War I, all three great naval powers, Great Britain,
Japan and the United States, faced ambitious, and potentially ruinous, naval
construction programs. The Washington Treaty (1921-22) sought to thwart an
arms race and set tonnage and other limitations on its eight signatory states, with
11
a 6 to 10 ratio of capital ships between Japan and the two Anglo-Saxon powers.
The immediate effect of this much-hated Treaty for the Imperial Navy was the
immediate cancellation of its grandiose plans for expansion to an eight-battleship
fleet. Instead it had to be satisfied with six capital ships and then focussed
instead on the development of smaller vessels, marine aviation and submarines.
It is possible that the great Tokyo earthquake and fire of 1923 and the severe
economic depression later in the same decade might have spiked the
expansionary plans of the Navy even in the absence of the treaty.
The 1930 disarmament treaty signed in London had an even more
dramatic effect on the fortunes of the Navy. This agreement dealt with lighter
auxiliary naval vessels, a matter not covered in the Washington Treaty, and set
the ratio at 6.975 for Japan and 10 for the other two great naval powers. A
divisive and emotional debate ensued in Japan between the ‘treaty faction’,
which supported the treaty, and the ‘fleet faction’, that opposed the London
agreement. Incensed by the perceived ‘internationalism’ of the government,
extremists assassinated Prime Minister Hamaguchi thereby launching an
ongoing (and often violent) campaign by military hardliners against civilian and
service moderates (Akira, 1987).
The ascendancy of the ‘fleet faction’ from the mid-1930’s meant that a
nanshin policy now dominated the naval agenda. The successful conquest of
Manchuria by the Imperial Army in 1932, and the attendant public acclaim it
enjoyed, provided a spur to advocates of nanshin-ron in the Navy. Moreover,
abandonment of cooperation with the Anglo-American naval powers and the
12
subsequent uncertainties surrounding a reliable source of fuel oil for the Imperial
Navy added further urgency to the need for a ‘southward advance’ towards the
oil-rich Dutch East Indies. Similarly, the outbreak of the China War in the summer
of 1937, which soon spread from north to central China, not only plunged Japan
into full-scale hostilities, but also meant ‘the navy was loathe to let the army
monopolize the government funds and public support generated by the conflict’
(Peattie, 1996, p. 217). As a first step towards the realisation of its nanshin plans,
the Imperial Navy thus autonomously seized a number of islands off the coast of
China, including Hainan, which had strategic potential in any move southwards.
In sum, ‘by 1939, therefore, the “southward advance” and the expansion of the
Japanese fleet (and the resources needed for that expansion) had attained an
almost symbiotic relationship in the minds of the navy’s aggressive middle
echelon’ (Peattie, 1996, p. 219).
Fundamental differences still existed between the Army and the Navy on
the nature of any nanshin strategy. In line with its hokushin-ron doctrine, the
Imperial Army envisaged that any military operations towards the south would be
directed against the Dutch East Indies, or in the worst-case scenario, against
British and Dutch territories. Given the paucity of Anglo-Dutch naval forces in the
Pacific from 1940, it believed that this would enable Japan to secure access to oil
and other vital resources without recourse to war with the United States and its
powerful Pacific Fleet. The Army would thus be assured of sufficient budgetary
allocations to be able to pursue its ongoing campaign to defeat China and then
tackle the Soviet threat north of Manchuria. But this conception of Imperial
13
strategy held little promise for the Navy. If Japan could conquer the Netherlands
East Indies without the intervention of the British Empire and the American Fleet,
then the navy would become an under-funded observer of great land battles in
continental Asia without legitimate claims on national budgetary allocations.
Accordingly, after simulated staff exercises involving an attack on the Dutch East
Indies, the Naval General Staff concluded that since the United States was
already providing substantial military assistance to Britain in its war with
Germany, it would probably intervene alongside Britain in the Pacific. The
‘indivisibility’ of Britain and the United States thus became a cornerstone of any
‘southward advance’ on the part of naval strategists and formed the basis of the
decision to launch pre-emptive attacks on the American Philippines and Pearl
Harbor.
These differences were finally settled by compromise. The Navy agreed to
support the Army’s plans for the war in China and Tripartite Pact with Germany
and Italy that would minimize the threat of Soviet intervention in Manchuria. The
price it exacted was Army support for its nanshin strategy and an immediate and
drastic increase in its budget. The German invasion of the Soviet Union
heightened concerns in the Navy that the Imperial Army might use this as a
pretext for invading Russia. Rapid American military rearmament and the
imposition of further US economic boycotts complicated naval calculations.
Barnhart (1987, p. 214) has described the Navy’s dilemma as follows: ‘The
longer the [southward] advance could be delayed, the more warships could be
constructed for the imperial fleet and the more steel could be requisitioned to
14
build those warships’, but ‘too much delay, however, would be disastrous,
because it would give the Americans time to accomplish their own colossal naval
expansion program’. Moreover, in the light of its successful budgetary claims, it
could hardly argue that it would not be successful against Anglo-American naval
power in the Pacific. One way of resolving this dilemma was to embark on a
surprise attack upon the US Pacific Fleet in Hawaii and thereby even up the odds
in the subsequent naval war. The scene was thus set for the fateful attack on
Pearl Harbor and the resulting conflagration in the Pacific.
3. A THEORETICAL PERSPECTIVE
15
The public choice approach to the budgetary conflict between the Imperial Army
and the Imperial Navy involves modelling each as an optimising entity. The
innovator for this form of bureaucratic analysis was Niskanen (1971). While
Niskanen’s work has been both extended and criticized,2 his initial modelling
offers an interesting starting point for understanding how bureaucratic budget
maximization might drive the competition and cooperation between the Japanese
Army and Navy, and ultimately affect the nature of the Pacific War. Niskanen
also provided both a formal mathematical analysis (with arithmetic examples in
his original book) and a graphical analysis, which opened bureaucratic analysis
to the interest and understanding of economists, who previously had largely
ignored this field of study.
Here we will apply only the less formal, graphical analysis, which draws on
Niskanen’s (1971) methodology to explore his insights on competing bureaus as
well as others’ (Congleton 1980; Faith 1980) insights on cooperating bureaus.
Niskanen defined bureaus as non-profit organizations providing an output (Q) to
a sponsor in return for a periodic grant or budget (B). Bureaucrats are defined as
employees who cannot directly appropriate any bureaucratic surplus (an excess
of budget B over cost C), although their perquisites of office (salary, power,
prestige, etc.) are generally a monotonic function of budget size, giving them an
inherent interest in, and an identification with, budget size. Those bureaucrats,
who positively value such perquisites, will have an obvious incentive to maximize
2 Migue & Belanger (1974), Niskanen (1975, 1994), Orzechowski (1977) provided well cited critical extensions, Clark (1997), Duncombe, et.al. (1997), Fedeli (1999), and Wyckoff (1990) provide insightful modelling of bureaucratic micro decision-making, while Wintrobe (1998) also models the macro aspects of bureaucracies in authoritarian regimes.
16
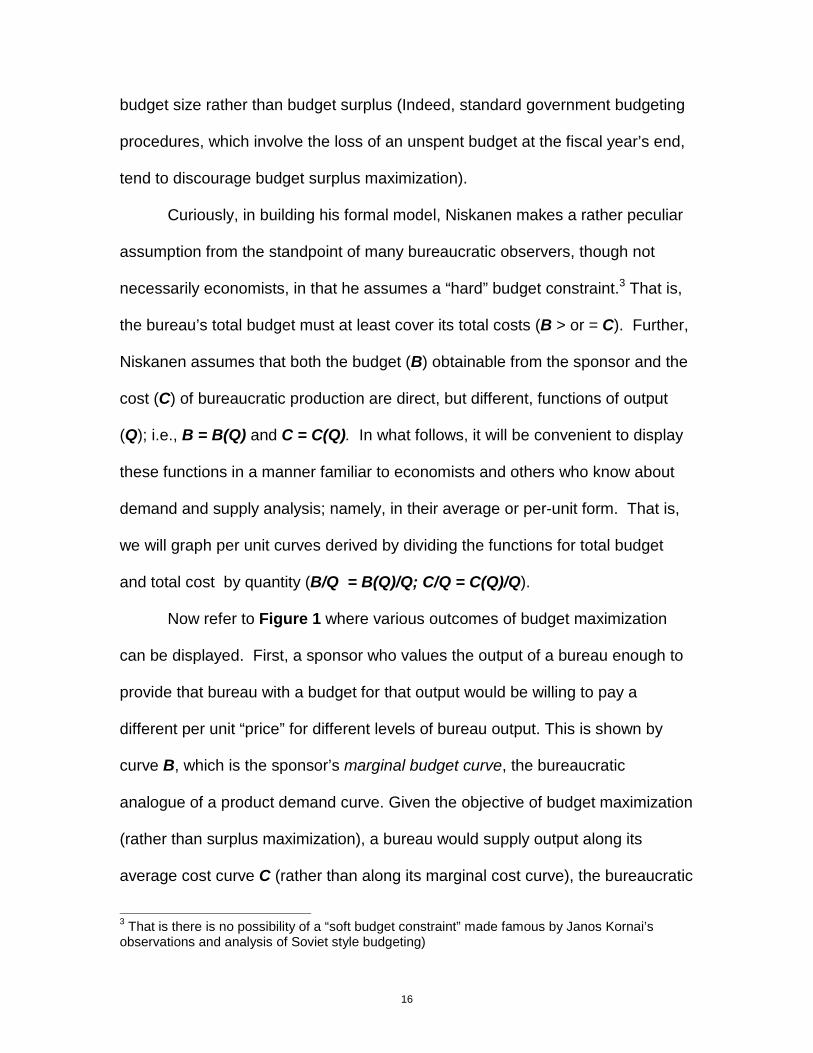
budget size rather than budget surplus (Indeed, standard government budgeting
procedures, which involve the loss of an unspent budget at the fiscal year’s end,
tend to discourage budget surplus maximization).
Curiously, in building his formal model, Niskanen makes a rather peculiar
assumption from the standpoint of many bureaucratic observers, though not
necessarily economists, in that he assumes a “hard” budget constraint.3 That is,
the bureau’s total budget must at least cover its total costs (B > or = C). Further,
Niskanen assumes that both the budget (B) obtainable from the sponsor and the
cost (C) of bureaucratic production are direct, but different, functions of output
(Q); i.e., B = B(Q) and C = C(Q). In what follows, it will be convenient to display
these functions in a manner familiar to economists and others who know about
demand and supply analysis; namely, in their average or per-unit form. That is,
we will graph per unit curves derived by dividing the functions for total budget
and total cost by quantity (B/Q = B(Q)/Q; C/Q = C(Q)/Q).
Now refer to Figure 1 where various outcomes of budget maximization
can be displayed. First, a sponsor who values the output of a bureau enough to
provide that bureau with a budget for that output would be willing to pay a
different per unit “price” for different levels of bureau output. This is shown by
curve B, which is the sponsor’s marginal budget curve, the bureaucratic
analogue of a product demand curve. Given the objective of budget maximization
(rather than surplus maximization), a bureau would supply output along its
average cost curve C (rather than along its marginal cost curve), the bureaucratic
3 That is there is no possibility of a “soft budget constraint” made famous by Janos Kornai’s observations and analysis of Soviet style budgeting)
analogue of a product supply curve. The way this curve is drawn in Figure 1, at
every per-unit budget-price, a budget-maximizing bureau would supply twice the
output that a profit or surplus maximizing firm or bureau would supply.
In contrast, a pr
supply curve would be
graphing simplicity, the
but, if drawn, would bis
B/Q
0
C C’
i j k m n
y'
Figur
B”
xofit-maximizing fi
given by its marg
relevant margina
ect the distance
a b c d
e 1: Compar
x’
y
17
rm’s (or s
inal (not
l cost cu
between
e f
B
ative B
z
urplus-maximiz
average) cost
rve is not draw
the vertical axi
g
ureau Bud
z’
ing bureau’s)
curve (For
n in Figure 1,
s and the average
h Q
B’
get Maximization
18
cost curve C). This unique modelling of bureaucratic overproduction, and, hence,
allocative inefficiency, was Niskanen’s key insight and analytical contribution
which launched an extensive literature on the economics and political economy
of bureaucracy. Even the severest critics of Niskanen’s modelling, concede that
their counter-modelling suggests bureaus will tend to be technically inefficient
even if and when they are allocationally efficient (since any surplus maximized
must be wasted by turning it into an excess budgetary cost). That is, the
literature consensus is that whether bureaucrats are utility maximisers, surplus
maximisers or budget maximisers, they tend to overcharge and/or overproduce.
It is that feature that makes the political economy of bureaucracy relevant for
understanding the process of bureau rivalry, expansion, and, possibly, collapse.
Having sketched these basics of budget-maximizing bureau analysis, we
can now explore the outcome under various circumstances of the bureaucratic
setting, such as whether a bureaucratic situation is one of monopoly, competing
duopoly, or cooperative duopoly and whether the sponsor’s review process
results in bureaus being “budget-takers” or ”budget-makers”.4 This 3 x 2
elementary classification scheme might yield six distinct cases, except that the
case of a budget-making, competing duopoly is analytically contradictory; to be
jointly budget-making, requires cooperation, not competition, at least not
competition vis-à-vis the sponsor. Thus, there are only five distinct cases to
analyse here: 1) Budget-taking monopoly, 2) budget-making monopoly, 3)
budget-taking, competing duopoly, 4) budget-taking, cooperative duopoly and 5)
4 The terms budget-taking and budget-making are directly analogous to the terms price-taking and price-making which some economists use to designate the absence or presence, respectively, of the power to determine all of the terms of exchange in the private market place.

19
budget-making, cooperating duopoly. Consideration of these five cases is
worthwhile as a basis for a comparison of bureaucratic forms that is novel to this
paper.
1) Budget-taking monopoly bureau: In this case, the sponsor sets the per-unit
budget. That might occur if sponsor officials cannot directly appropriate any
surplus arising from socially optimal bureaucratic production, but only indirectly
benefit from their constituents generally enjoying some “consumer surplus” from
government provision, and if sponsor officials have some alternative source of
information about bureaucratic production costs. In these circumstances, it may
be likely that sponsor officials have an incentive to get the best “deal” for their
constituents. That would involve not only closely monitoring the bureau to insure
supply at minimum cost, but also choosing an output level that leaves their
constituents with some “consumer surplus” from government provision. Given a
per-unit budget allocation, a bureau will offer an output determined by its average
cost curve C. The sponsor and bureau coordinate their budget and supply offers
at the point y in Figure 1 where curves B and C intersect. Output is at 0b and
average budget is at 0k; Total budget equals total cost as shown by area 0byk,
which measures both. While budget-maximizing bureau output is twice as high
(and the total budget is higher) as would occur with a profit-maximizing firm or a
surplus-maximizing bureau, this case still represents one of the more efficient
extremes of the bureaucratic form and provides a benchmark for what follows.
2) Budget-making monopoly bureau: This case represents the prototypical
Niskanen bureau, which is able to control the supply of information about its
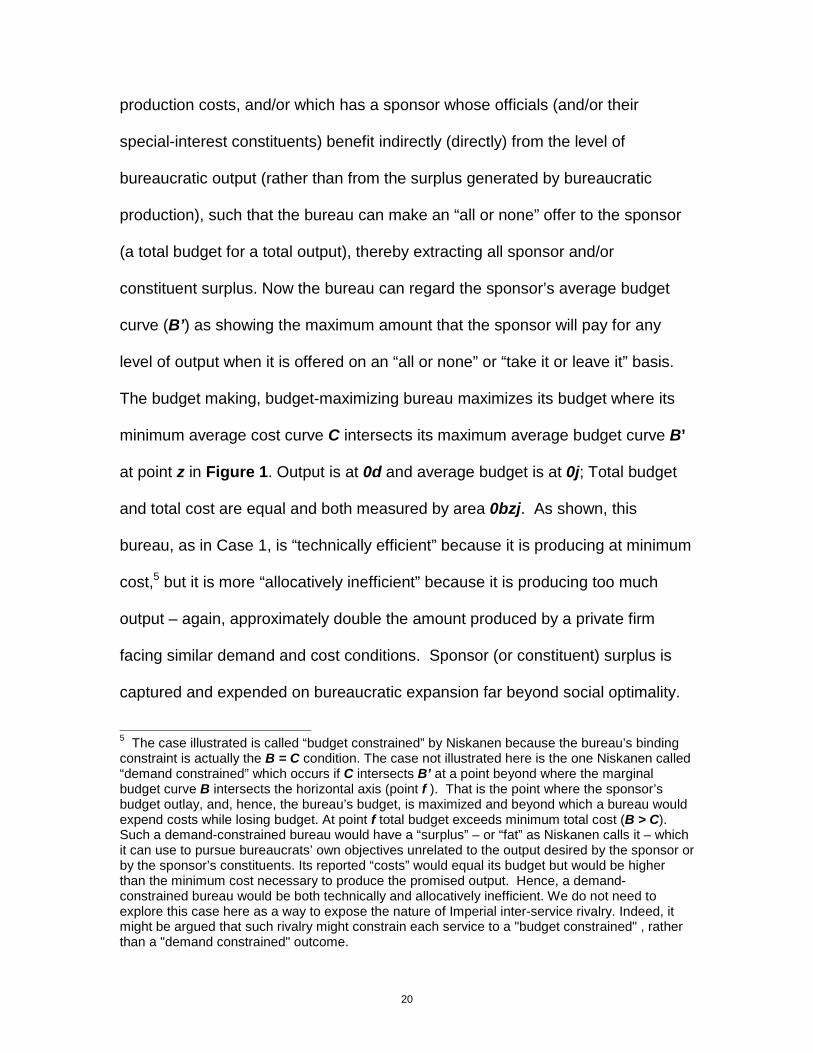
20
production costs, and/or which has a sponsor whose officials (and/or their
special-interest constituents) benefit indirectly (directly) from the level of
bureaucratic output (rather than from the surplus generated by bureaucratic
production), such that the bureau can make an “all or none” offer to the sponsor
(a total budget for a total output), thereby extracting all sponsor and/or
constituent surplus. Now the bureau can regard the sponsor’s average budget
curve (B’) as showing the maximum amount that the sponsor will pay for any
level of output when it is offered on an “all or none” or “take it or leave it” basis.
The budget making, budget-maximizing bureau maximizes its budget where its
minimum average cost curve C intersects its maximum average budget curve B’
at point z in Figure 1. Output is at 0d and average budget is at 0j; Total budget
and total cost are equal and both measured by area 0bzj. As shown, this
bureau, as in Case 1, is “technically efficient” because it is producing at minimum
cost,5 but it is more “allocatively inefficient” because it is producing too much
output – again, approximately double the amount produced by a private firm
facing similar demand and cost conditions. Sponsor (or constituent) surplus is
captured and expended on bureaucratic expansion far beyond social optimality.
5 The case illustrated is called “budget constrained” by Niskanen because the bureau’s binding constraint is actually the B = C condition. The case not illustrated here is the one Niskanen called “demand constrained” which occurs if C intersects B’ at a point beyond where the marginal budget curve B intersects the horizontal axis (point f ). That is the point where the sponsor’s budget outlay, and, hence, the bureau’s budget, is maximized and beyond which a bureau would expend costs while losing budget. At point f total budget exceeds minimum total cost (B > C). Such a demand-constrained bureau would have a “surplus” – or “fat” as Niskanen calls it – which it can use to pursue bureaucrats’ own objectives unrelated to the output desired by the sponsor or by the sponsor’s constituents. Its reported “costs” would equal its budget but would be higher than the minimum cost necessary to produce the promised output. Hence, a demand-constrained bureau would be both technically and allocatively inefficient. We do not need to explore this case here as a way to expose the nature of Imperial inter-service rivalry. Indeed, it might be argued that such rivalry might constrain each service to a "budget constrained" , rather than a "demand constrained" outcome.
21
The main net beneficiaries of bureaucratic supply may be the bureaucrats,
themselves, and whatever other of the bureau’s factor suppliers who may be
compensated in excess of their minimum supply price. That is, there may only be
a factor surplus.6
3) Budget-taking, competing duopoly bureaus: Actual competitive
bureaucratic supply may involve any number of bureaus offering identical
bureaucratic products. However, here we assume, for simplicity of exposition and
for development of an appropriate theoretical analogue, that there are only two
bureaus with identical costs of production C, which, when summed, yield curve
C’. Competition would likely reveal to the sponsor the true cost of bureaucratic
supply, so as in Case 1), the sponsor could choose to purchase from either
bureau on a per unit basis. Thus, the intersection of sponsor’s marginal budget
curve B with the bureaus’ joint supply curve C’ at point x’ would give the
equilibrium total output 0d, equally divided between each bureau as 0a and ac,7
and total budget (equals total cost) area 0cx’m, equally divided between each
bureau as 0axm and 0acm, respectively. Again, both bureaus are technically
efficient individually and jointly, but allocatively inefficient jointly, although less so
than in the previous case of the budget-making monopoly bureau because both
total output and total budget are lower in this case.8
6 In majoritarian governments, a high-demand constituency may prevail over a low-demand constituency to remain a net positive beneficiary while the latter becomes a net negative “beneficiary” (or sufferer) from bureaucratic production (Niskanen 1971, Chapter 14). 7 If the bureaus do not have identical cost functions, the lower (higher) cost bureau would produce a larger (smaller) proportion of the total output. 8 Niskanen (1971, p.161) concluded for his constant cost example that competition would not solve the problem of bureaucratic oversupply, although it might improve technical efficiency in the demand-constrained case. It our increasing cost example, there is a slight improvement in
22
4) Budget-taking, cooperative duopoly bureaus: Instead of competing directly
by supplying identical bureaucratic “products” that are essentially perfect
substitutes, bureaus may compete indirectly for budget allocations by tacitly or
explicitly supplying bureaucratic products that are imperfect substitutes or even
complements to the sponsor and/or the sponsor’s constituents. If there is only
tacit or implicit cooperation where bureaus spontaneously develop their individual
product niches, the sponsor may still have independent sources of information
that allow budget allocation along the sponsor’s marginal, rather than average,
budget curve. However, with imperfect substitutes or complements, the
sponsor’s marginal budget curve for both bureaucratic “products” would shift out.
We can show that in Figure 1 by assuming that both bureaus produce
complementary products that are equally valued by the sponsor. Now each
bureau’s output is valued the same along the same marginal budget curve B.
When we combine these marginal budget curves by adding them horizontally to
get the sponsor’s total demand, B’ is now the relevant curve whose intersection
with the bureaus’ joint supply curve at point y’ determines the equilibrium output
0e, average budget “price” 0k, and total budget (= total cost) 0ey’k. The two
bureaus’ individual outputs and budget shares are 0b and be, and 0byk and
bey’y, respectively. The efficiency of this outcome is similar in nature if not extent
to that of Case1); these bureaus are technically efficient but allocatively
inefficient relative to profit maximizing private duopolies without price-
discriminating power.
allocative efficiency from reduced oversupply. Niskanen did not consider the subsequent cases of cooperative bureaus; their graphing is unique to this paper.
23
5) Budget-making, cooperating duopoly: Finally, consider two bureaus that
not only consciously offer complementary bureaucratic “products”, but also
(perhaps with the sponsor’s tacit or explicit approval) collude to extract jointly the
maximum possible budget subject only to the total budget equals total cost
constraint. Again, this strategy involves an equilibrium position determined by
the intersection of the bureaus’ joint supply function C’ with the sponsor’s
average budget curve for the bureaus’ joint, complementary, outputs, shown in
Figure 1 as B”, at point z’. The two bureaus’ individual outputs and budget
shares are 0d and dg, and 0dzj and dgz’z, respectively. Total output 0g,
Average budget 0j, and total budget (= total cost) 0gz’j are all higher than when
bureaus are unable to pursue an “all or none” budget-maximization strategy with
their sponsor. The budget-constrained outcome here is again technically efficient
but allocatively inefficient (and to a much greater extent than previous cases)
relative to the social optimum and relative to profit maximizing private duopolies
with price-discriminating power.9 Again, as in Case 2, only the bureaucrats, other
factor suppliers, and, possibly, high-demand constituents10 are net beneficiaries.
4. The Perspective Applied
The theoretical perspective developed above can be used to analyse the inter-
service rivalry over budget allocations between the Imperial Japanese Navy and
the Imperial Army. Either the Navy or the Army might have offered the typical
“product” of any military organization, which, when arrayed on a continuum, could
be conceived as stretching from zero (no defense) through defense to conquest
9 See Fedeli (1999) for a more complex analysis of competing cooperating bureaucracies. 10 See footnote 6.
24
of varying levels, where the measurement metric might be area of territory
defended (conquered). In the case of an island nation like Japan, and given the
nature of army and navy production technicalities being either land or water
based, it is clear that it would not be natural for either of these bureaus to offer
identical products. That is, there is a natural product stratification determined by
both demand-side and supply-side realities.11
Thus, while there might be a rivalry, even intense, venomous, and deadly
rivalry, over budget allocations, the Imperial Army and Navy would not likely be
characterized as “competing bureaus” as defined and analyzed above. Rather,
they would more naturally be “cooperating bureaus” in terms of their products
being imperfect substitutes or direct complements. (Indeed, as observed in
Section 2, there was an Imperial Army and Imperial Navy compromise over
mutually supporting both Nanshin and Hokushin.) That symbiosis would also
make it likely for their bureaucrats to realize jointly the greater potential for
budget maximization in not only designing their products to maximize
complementarities, but also to collude to extract the maximum budget allocation
from the Japanese government.12 Indeed, with their own ministerial
representatives within the Imperial Cabinet, it would be possible for the Navy 11 After some point, defending an island requires a navy as well as army; conquest of other landmasses also requires both services. However, given the relative cost advantage of sea versus land (rail and road) transport during the 30’s and of conquering/defending geographical areas with lesser land densities, it is conceivable that nanshin would have been seen to dominate hokushin on the basis of standard benefit/cost criteria (given static assumptions about a US response). We will leave this speculation about relative costs of alternative production technologies for other investigators. 12 Budget-maximizing bureaus can further expand what is available by interacting directly with their sponsor’s constituents to increase the latter’s demand for specific bureaucratic services as well as for an overall increase in the size of the government’s budget. Military bureaus can pursue such budget expansion by forming allegiances with their suppliers (“The Military-Industrial Complex” lobby) and their customers (Patriots, nationalists, and imperialists).
25
and/or Army to collude directly with their “sponsor”, from which, for practical
purposes, they may have become indistinguishable as their bureaucratic growth,
and the Pacific War, progressed. For each bureau, it is as simple as x, y, & z.
That is, as simple as designing bureau products and cooperating to move
individually (and totally) from outcomes like those at point x (x’) to outcomes at
point z (z’) in Figure 1.
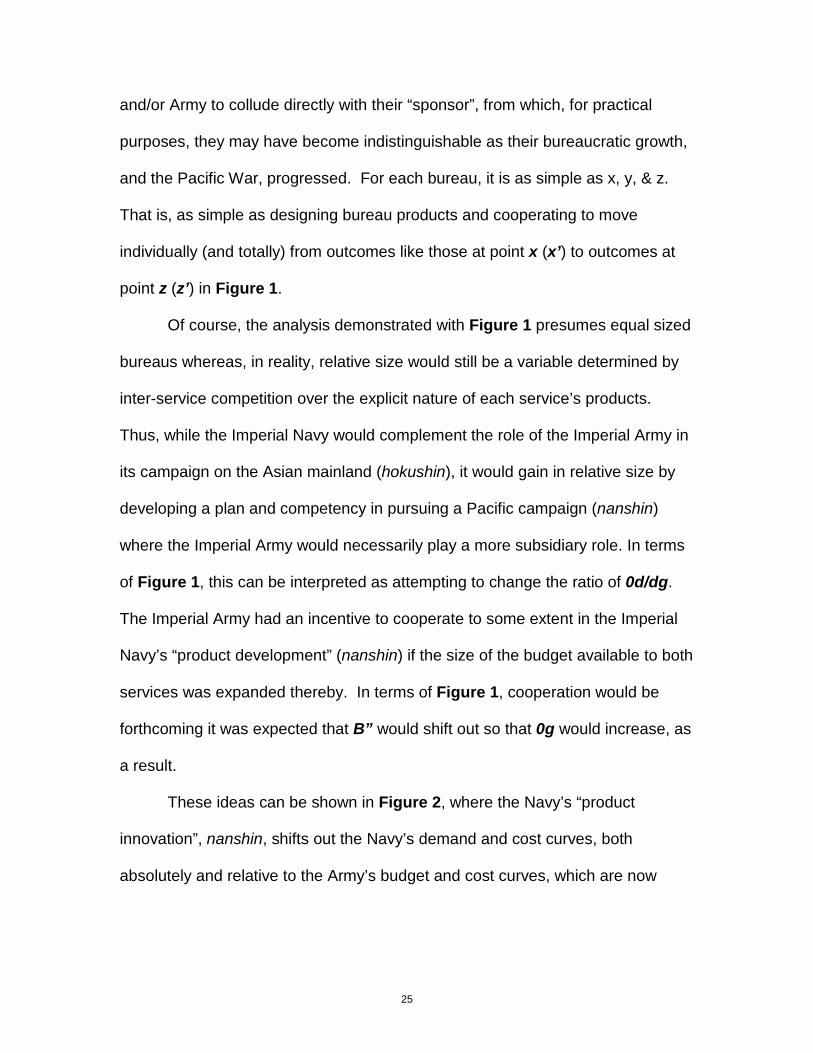
Of course, the analysis demonstrated with Figure 1 presumes equal sized
bureaus whereas, in reality, relative size would still be a variable determined by
inter-service competition over the explicit nature of each service’s products.
Thus, while the Imperial Navy would complement the role of the Imperial Army in
its campaign on the Asian mainland (hokushin), it would gain in relative size by
developing a plan and competency in pursuing a Pacific campaign (nanshin)
where the Imperial Army would necessarily play a more subsidiary role. In terms
of Figure 1, this can be interpreted as attempting to change the ratio of 0d/dg.
The Imperial Army had an incentive to cooperate to some extent in the Imperial
Navy’s “product development” (nanshin) if the size of the budget available to both
services was expanded thereby. In terms of Figure 1, cooperation would be
forthcoming it was expected that B” would shift out so that 0g would increase, as
a result.
These ideas can be shown in Figure 2, where the Navy’s “product
innovation”, nanshin, shifts out the Navy’s demand and cost curves, both
absolutely and relative to the Army’s budget and cost curves, which are now
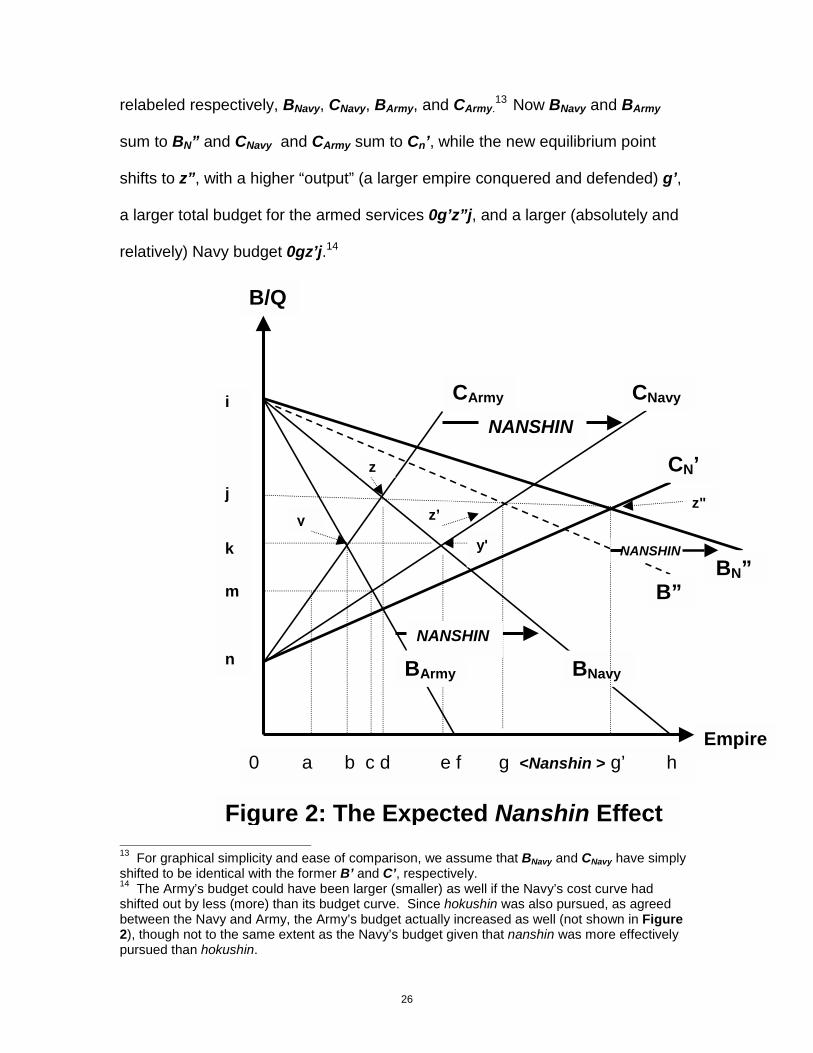
26
relabeled respectively, BNavy, CNavy, BArmy, and CArmy.13
Now BNavy and BArmy
sum to BN” and CNavy and CArmy sum to Cn’, while the new equilibrium point
shifts to z”, with a higher “output” (a larger empire conquered and defended) g’,
a larger total budget for the armed services 0g’z”j, and a larger (absolutely and
relatively) Navy budget 0gz’j.14
13 For graphical simplicity and ease of comparison, we assume that BNavy and CNavy have simplyshifted to be identical with the former B’ and C’, respectively. 14 The Army’s budget could have been larger (smaller) as well if the Navy’s cost curve had shifted out by less (more) than its budget curve. Since hokushin was also pursued, as agreed between the Navy and Army, the Army’s budget actually increased as well (not shown in Figure 2), though not to the same extent as the Navy’s budget given that nanshin was more effectively pursued than hokushin.
B/Q
0 a b c d e f g <Nanshin > g’ h
CArmy CNavy
BArmy BNavy
i j k m n
y'
B”
NANSHIN
NANSHIN
CN’
z"
yz
Empire
BN”
Figure 2: The Expected Nanshin Effect
z’
NANSHIN

27
The joint effects of "cooperative competition" between Nanshu hokushin
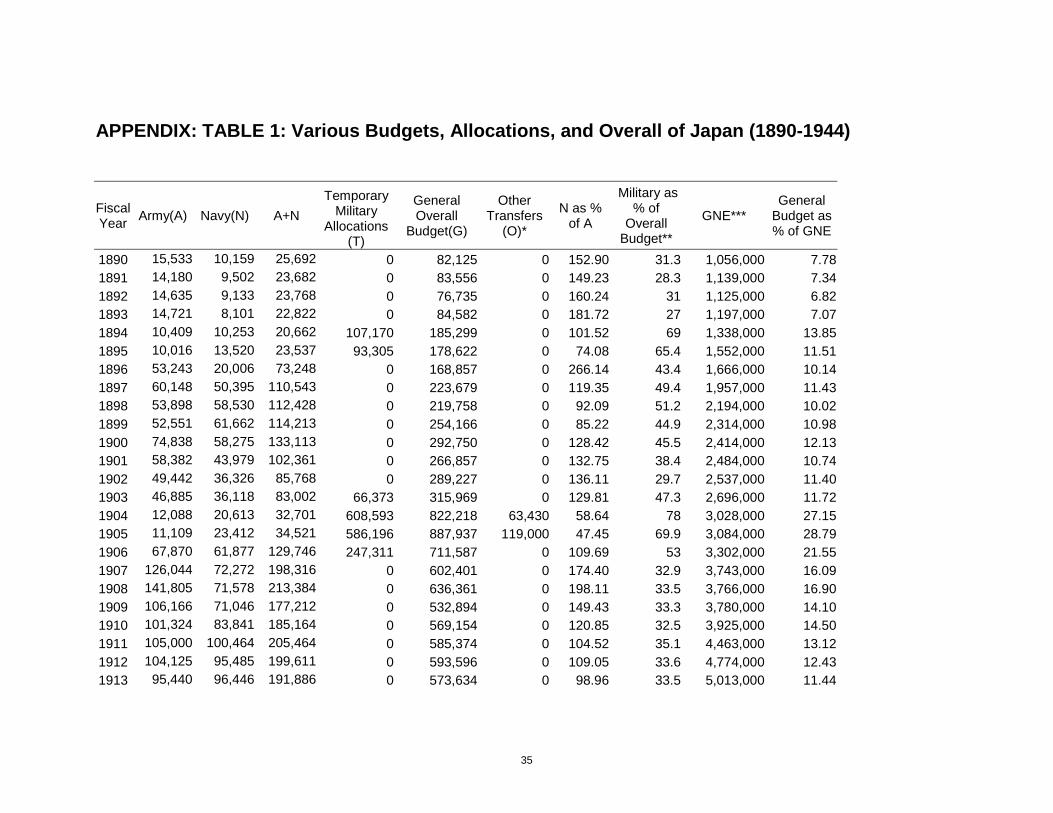
and hokushu nanshin ideologies can be illustrated by arranging available data
(given in the Appendix) to show in Figure 3 the rapid growth of both the Imperial
Navy's and the Imperial Army's budgets throughout the mid-1930s to early
1940s.
Figure 3: Army and Navy Budgets 1890-1944
0200000400000600000800000
1000000120000014000001600000
1890 1900 1910 1920 1930 1940
Year
(000
yen
)
"Min of Army""Min of Navy"
We might note from the "Military as a % of Overall Budget column in the
Appendix data, that these strategies enabled both military bureaucracies to out
compete other government bureaucracies for a share of the total budget.
Meanwhile, the government was out competing the private sector for its share of
the total economy.15 Imperial wars obviously well serve the interests of those
factor owners employed in the projection of Imperial force -- up to the point where
15 Unfortunately, we do not have complete data for GNE after 1940, but the government's share of the economy was increasing up to those war dates, so it may be a safe supposition that trend would continue until final defeat.
28
that force is met by a superior counterforce and/or otherwise absolutely
diminishing returns; then collapse ensues.
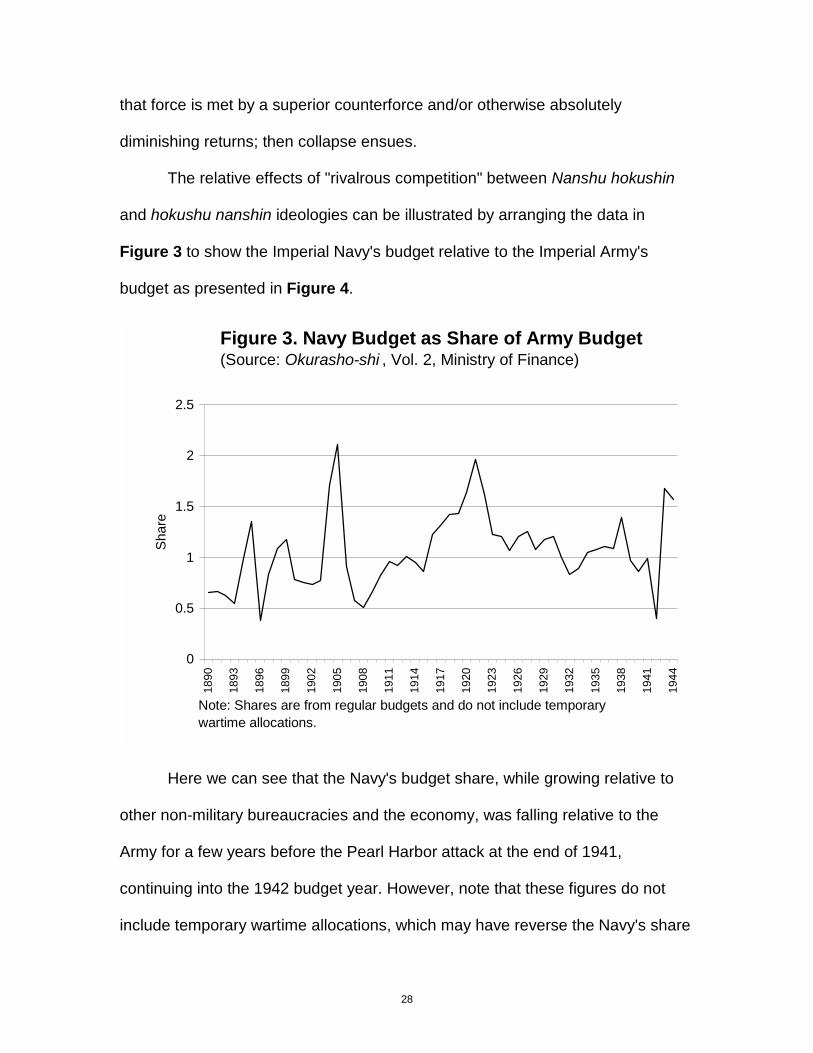
The relative effects of "rivalrous competition" between Nanshu hokushin
and hokushu nanshin ideologies can be illustrated by arranging the data in
Figure 3 to show the Imperial Navy's budget relative to the Imperial Army's
budget as presented in Figure 4.
Figure 3. Navy Budget as Share of Army Budget (Source: Okurasho-shi , Vol. 2, Ministry of Finance)
0
0.5
1
1.5
2
2.5
1890
1893
1896
1899
1902
1905
1908
1911
1914
1917
1920
1923
1926
1929
1932
1935
1938
1941
1944
Note: Shares are from regular budgets and do not include temporary wartime allocations.
Shar
e
Here we can see that the Navy's budget share, while growing relative to
other non-military bureaucracies and the economy, was falling relative to the
Army for a few years before the Pearl Harbor attack at the end of 1941,
continuing into the 1942 budget year. However, note that these figures do not
include temporary wartime allocations, which may have reverse the Navy's share
29
much sooner, indeed, even to finance the Pearl Harbor attack. Only in the 1943
budget year, with the oncoming U.S. response to Pearl Harbor, was the nanshin
strategy successful in earning the Navy a larger relative share. This budgetary
success continued into 1944 before being ended by Japan's surrender in 1945.
In the short run, Navy bureaucrats may have considered nanshin a very
effective bureaucratic strategy. Within this strategy, the attack on Pearl Harbor
was a tactical move to reverse the prior relative dominance of hokushin, and to
enhance and extend nanshin’s short run effect. Had the United States’ own
military bureaucracies not responded in a similar budget maximizing fashion,
Pearl Harbor (and nanshin) might also have been a successful long run tactic
(and strategy). Whether nanshin would have had long run viability without the
Pearl Harbor tactic is, no doubt, endlessly arguable. However, from a public
choice perspective, Pearl Harbor may have provided a key ingredient for special
interest budget competition by the U.S. military, in general, and the US Navy, in
particular – namely, a coalescing, general interest ideology for Pacific expansion
and domination.
In summary, with the resulting Pacific War, the share of both Imperial
armed services expanded not only in total, but also as a share of the total
government budget and of the Japanese economy. Thus, nanshin would have
been a very successful bureaucratic strategy (though not necessarily the most
successful national strategy) -- if only it had been sustainable. Unfortunately for
the long run viability of both Japanese bureaucracies, another nation’s military
bureaucracies were pursuing similar strategies in a world wide bureaucratic

30
competition (arguably) provoked by Japan’s inter-service rivalry within its unique
institutional environment.
5. CONCLUDING REMARKS
This paper does not contend that inter-service budgetary rivalry between the
Imperial Japanese Navy and the Imperial Army represented the only, or even the
most important, cause of World War Two in the Pacific. Many factors
undoubtedly played a contributory role (Akira, 1987). Nevertheless, Michael
Barnhart (1987) and many other historians have demonstrated that there is
substantial evidence to support the proposition that budget-maximizing behaviour
on the part of the Army and Navy not only helped precipitate the onset of the
Pacific War, but also decisively shaped its course. For instance, if the Navy had
not adopted a nanshin strategic philosophy as its chief means of contesting the
Army’s claims to budget allocations, then in counter-factual terms it is
conceivable that the pre-war oil and resource crisis could have been resolved
through the conquest of the Dutch East Indies alone. This would not have
necessitated an attack on Pearl Harbor and thus may not have involved conflict
with the United States. The nature and outcome of World War Two could
therefore have been very different.
Given the significance of budgetary competition between the two branches of the
Japanese armed forces, and that previously this competition has been examined
predominantly by scholars using historical narrative, it seems that the analytical
apparatus of public choice theory, specifically bureaucratic theory, can provide
31
additional explanatory power in understanding this dimension of the origins of the
Pacific War.
REFERENCES
Akira, I. (1987), The Origins of the Second World War, Longman, New York.
Asada, S. (1973), ‘The Role of the Japanese Navy’, in D. Borg and O. Shumpei
(eds.), Pearl Harbor as History, Columbia University Press, New York, pp.
246-247.
Barnhart, M. A. (1987), Japan Prepares for Total War: The Search for Economic
Security, 1919-1941, Cornell University Press, Ithica.
Breton, A. and Wintrobe, R. (1986), ‘The Bureaucracy of Murder Revisted’,
Journal of Political Economy, Vol. 94, Issue 3, pp. 905-926.
Casas-Pardo, J. and Puchades-Navarro, M. (2001), ‘ A Critical Comment on
Niskanen’s Model’, Public Choice, Vol. 107, pp. 147-167.
Clark, D.J. (1997), ‘Pressure and the Division of the Public Budget’, Public
Choice, Vol. 93, 179-195.
Congleton, R. (1980), ‘Competitive Process, Competitive Waste, and Institutions’,
in J.M. Buchanan, et.al., (eds.), Toward a Theory of the Rent-Seeking
Society, Texas A&M University Press, College Station, pp. 153-182.
Department of Defense. (1978), The ’Magic’ Background of Pearl Harbor, United
States Department of Defense, Washington.

32
Dockrill, S. (1994), From Pearl Harbor to Hiroshima: The Second World War in
Asia and the Pacific, 1941-45, Macmillan, Basingstoke.
Duncombe, W., Miner, J. and Ruggiero, J. (1997), ‘Empirical Evaluation of
Bureaucratic Models of Inefficiency’, Public Choice, Vol. 93, pp. 1-18.
Evans, D. C. (1978), The Satsuma Faction and Professionalism in the Japanese
Naval Officer Corps of the Meiji Period, 1868-1912, unpublished PhD
thesis, Standford University.
Evans, D. C. and Peattie, M. R. (1997), Kaigun: Strategy, Tactics and
Technology in the Imperial Japanese Navy, 1887-1941, Naval Press
Institute, Annapolis.
Faith, R. L. (1980) ‘Rent-Seeking Aspects of Bureaucratic Competition’, in J.M.
Buchanan, et.al., (eds.), Toward a Theory of the Rent-Seeking Society,
Texas A&M University Press, College Station, pp. 332-343.
Fedeli, S. (1999), ‘Competing Bureaus and Polititions: A Compliance Approach to
the Diversion of Public Funds’, Public Choice, Vol. 100, pp. 253-270.
Frei, H. P. (19991), Japan’s Southward Advance and Australia: From the
Sixteenth Century to World War II, University of Hawaii Press, Honolulu.
Hatano, S. (1989), ‘From the Sino-Japanese War to the Japanese-Anglo-
American War’, International Politics, 91, pp. 1-18.
Jackson, P.M. (1982) The Political Economy of Bureaucracy, Philip Allan, Oxford.
Katz, E., Nitzan, S., and Rosenberg, J. (1990), ‘Rent-seeking for Pure Public
Goods’, Public Choice, Vol. 65, pp. 49-60.
33
Komatsu, K. (1999), Origins of the Pacific War and the Importance of Magic,
Japan Library, Richmond.
Migue, J.L. and Belanger, G. (1974), ‘Toward a General Theory of Management
Discretion’, Public Choice, Vol. 17, pp. 27-43.
Moriyama, A. (1990), ‘Evasion of Decision-Making: The Diplomatic Policy of the
Second and Third Konoe Cabinets’, in World War II: Toward Pearl Harbor,
Kinsei-sha, Tokyo, pp. 15-31.
Mueller, D. C. (1989), Public Choice II, Cambridge University Press, Cambridge.
Niskanen, W. A. (1971), Bureaucracy and Representative Government, Aldine-
Atherton, Chicago.
Niskanen, W.A. (1975), ‘Bureaucrats and Politicians’, Journal of Law and
Economics, Vol. 18, pp. 617-643.
Niskanen, W.A. (1994), Bureaucracy and Public Economics, Edward Elgar,
Brookfield.
Ono, G. (1922), War and Armament Expenditures of Japan, Oxford University
Press, New York.
Orzechowski, W. (1977), ‘Economic Models of Bureaucracy: Survey and
Evidence’, in T.E. Borcherding (Ed.), Budgets and Bureaucrats: The
Sources of Government Growth, Duke University Press, Durham, pp. 229-
259.
Peattie, M. R. (1996), ‘Nanshin: “The Southward Advance”, 1931-1941, as a
Prelude to the Japanese Occupation of Southeast Asia’, in P. Duus, R. H.
34
Myers and M. R. Peattie (eds.), The Japanese Wartime Empire, 1931-
1941, Princeton University Press, Princeton, pp. 189-242.
Schencking, J. C. (1998), ‘Bureaucratic Politics, Military Budgets and Japan’s
Southern Advance: The Imperial Navy’s Seizure of German Micronesia in
the First World War’, War in History, 5(3), pp. 308-326.
Schencking, J. C. (1999), ‘The Imperial Japanese Navy and the Constructed
Consciousness of a South Seas Destiny, 1872-1921’, Modern Asian
Studies, 33(4), pp. 769-796.
Wintrobe, R. (1998), The Political Economy of Dictatorship, Cambridge University
Press, Cambridge.
Wyckoff, P.G. (1990), ‘The Simple Model of Slack-Maximizing Bureaucracy’,
Public Choice, Vol. 67, pp. 35-47.
35
APPENDIX: TABLE 1: Various Budgets, Allocations, and Overall of Japan (1890-1944)
Fiscal Year Army(A) Navy(N) A+N
Temporary Military
Allocations (T)
General Overall
Budget(G)
Other Transfers
(O)*
N as % of A
Military as % of
Overall Budget**
GNE*** General
Budget as % of GNE
1890 15,533 10,159 25,692 0 82,125 0 152.90 31.3 1,056,000 7.78 1891 14,180 9,502 23,682 0 83,556 0 149.23 28.3 1,139,000 7.34 1892 14,635 9,133 23,768 0 76,735 0 160.24 31 1,125,000 6.82 1893 14,721 8,101 22,822 0 84,582 0 181.72 27 1,197,000 7.07 1894 10,409 10,253 20,662 107,170 185,299 0 101.52 69 1,338,000 13.85 1895 10,016 13,520 23,537 93,305 178,622 0 74.08 65.4 1,552,000 11.51 1896 53,243 20,006 73,248 0 168,857 0 266.14 43.4 1,666,000 10.14 1897 60,148 50,395 110,543 0 223,679 0 119.35 49.4 1,957,000 11.43 1898 53,898 58,530 112,428 0 219,758 0 92.09 51.2 2,194,000 10.02 1899 52,551 61,662 114,213 0 254,166 0 85.22 44.9 2,314,000 10.98 1900 74,838 58,275 133,113 0 292,750 0 128.42 45.5 2,414,000 12.13 1901 58,382 43,979 102,361 0 266,857 0 132.75 38.4 2,484,000 10.74 1902 49,442 36,326 85,768 0 289,227 0 136.11 29.7 2,537,000 11.40 1903 46,885 36,118 83,002 66,373 315,969 0 129.81 47.3 2,696,000 11.72 1904 12,088 20,613 32,701 608,593 822,218 63,430 58.64 78 3,028,000 27.15 1905 11,109 23,412 34,521 586,196 887,937 119,000 47.45 69.9 3,084,000 28.79 1906 67,870 61,877 129,746 247,311 711,587 0 109.69 53 3,302,000 21.55 1907 126,044 72,272 198,316 0 602,401 0 174.40 32.9 3,743,000 16.09 1908 141,805 71,578 213,384 0 636,361 0 198.11 33.5 3,766,000 16.90 1909 106,166 71,046 177,212 0 532,894 0 149.43 33.3 3,780,000 14.10 1910 101,324 83,841 185,164 0 569,154 0 120.85 32.5 3,925,000 14.50 1911 105,000 100,464 205,464 0 585,374 0 104.52 35.1 4,463,000 13.12 1912 104,125 95,485 199,611 0 593,596 0 109.05 33.6 4,774,000 12.43 1913 95,440 96,446 191,886 0 573,634 0 98.96 33.5 5,013,000 11.44

36
1914 87,700 83,260 170,960 45,936 617,994 76,363 105.33 35.1 4,738,000 13.04 1915 97,791 84,377 182,168 30,527 595,450 18,348 115.90 35.7 4,991,000 11.93 1916 94,813 116,625 211,438 23,697 598,525 15,967 81.30 39.3 6,148,000 9.74 1917 123,437 162,435 285,872 34,800 731,007 38,817 75.99 43.9 8,592,000 8.51 1918 152,082 215,903 367,985 125,771 1,027,382 115,424 70.44 48.1 11,839,000 8.68 1919 220,268 316,419 536,687 149,030 1,319,358 0 69.61 51.8 15,453,000 8.54 1920 246,557 403,202 649,759 219,877 1,549,167 30,687 61.15 56.1 15,896,000 9.75 1921 246,979 483,590 730,568 108,747 1,598,603 0 51.07 52.5 14,886,000 10.74 1922 230,909 373,892 604,801 85,494 1,515,183 0 61.76 45.6 15,573,000 9.73 1923 223,927 275,144 499,071 28,462 1,549,513 0 81.39 34 14,924,000 10.38 1924 206,735 248,458 455,193 29,490 1,644,514 10,000 83.21 29.5 15,576,000 10.56 1925 214,805 229,003 443,808 1,831 1,526,819 0 93.80 29.2 16,265,000 9.39 1926 196,941 237,308 434,249 0 1,578,826 0 82.99 27.5 15,975,000 9.88 1927 218,104 273,536 491,640 0 1,765,723 0 79.74 27.8 16,293,000 10.84 1928 249,106 268,131 517,238 0 1,814,855 0 92.90 28.5 16,506,000 11.00 1929 227,255 267,665 494,920 0 1,736,317 0 84.90 28.5 16,286,000 10.66 1930 200,824 242,035 442,859 0 1,557,864 0 82.97 28.4 14,671,000 10.62 1931 227,488 227,129 454,617 0 1,476,875 0 100.16 30.8 13,309,000 11.10 1932 373,575 312,809 686,385 0 1,950,141 0 119.43 35.2 13,660,000 14.28 1933 462,645 409,975 872,620 0 2,254,662 0 112.85 38.7 15,347,000 14.69 1934 458,529 483,353 941,882 0 2,163,004 0 94.86 43.5 16,966,000 12.75 1935 496,559 536,378 1,032,937 0 2,206,478 0 92.58 46.8 18,298,000 12.06 1936 510,719 567,451 1,078,170 0 2,282,176 0 90.00 47.2 19,324,000 11.81 1937 591,475 645,365 1,236,840 2,034,298 4,742,320 1,136 91.65 69 22,823,000 20.78 1938 487,500 679,246 1,166,746 4,795,395 7,766,259 317,165 71.77 76.8 26,394,000 29.42 1939 825,076 803,535 1,628,610 4,844,296 8,802,943 535,187 102.68 73.5 31,230,000 28.19 1940 1,192,470 1,033,712 2,226,182 5,722,542 10,982,755 600,000 115.36 72.4 36,851,000 29.80 1941 1,515,250 1,497,375 3,012,625 9,487,023 16,542,832 1,078,083 101.19 75.6 n/a n/a 1942 56,454 22,617 79,071 18,753,150 24,406,382 2,623,244 249.61 77.2 n/a n/a 1943 678 1,139 1,816 29,818,452 38,001,015 4,369,250 59.53 78.5 n/a n/a 1944 728 1,145 1,874 73,493,554 86,159,861 7,205,642 63.58 85.3 n/a n/a

37
Source: Okurasho (Ministry of Finance), "Okurasho-shi, Volume 2" for all series except GNE estimates. * Transfers from General to other (non-military) Temporary accounts ** (A+N) divided by (G-O+T) and then converted into a percentage as is done in the original source. *** Gross National Expenditure estimates by Ohkawa, Takamatsu, Yamamoto in "Historical Statistics of Japan," Vol. 3, Japan Statistical Association. Other notes: units are in 1000s yen. General Military budget should be the sum of "Army" and "Navy" but sometimes differs due to rounding.