Nanoprobes: getting the most bang per photon · Nanoprobes: getting the most bang per photon....
41
Chris Jacobsen Department of Physics & Astronomy Stony Brook University, USA http://xray1.physics.sunysb.edu Nanoprobes: getting the most bang per photon
-
Upload
trinhthuan -
Category
Documents
-
view
221 -
download
0
Transcript of Nanoprobes: getting the most bang per photon · Nanoprobes: getting the most bang per photon....
Chris JacobsenDepartment of Physics & Astronomy
Stony Brook University, USAhttp://xray1.physics.sunysb.edu
Nanoprobes:getting the most bang per photon
Getting the most bang per photon
• Use the strongest contrast mechanism (for example, phase contrast).
• Use the most efficient optical system (scanning, or lensless).
• Make the sample as robust as possible (cryo).
• Extract your information from complex data.
2
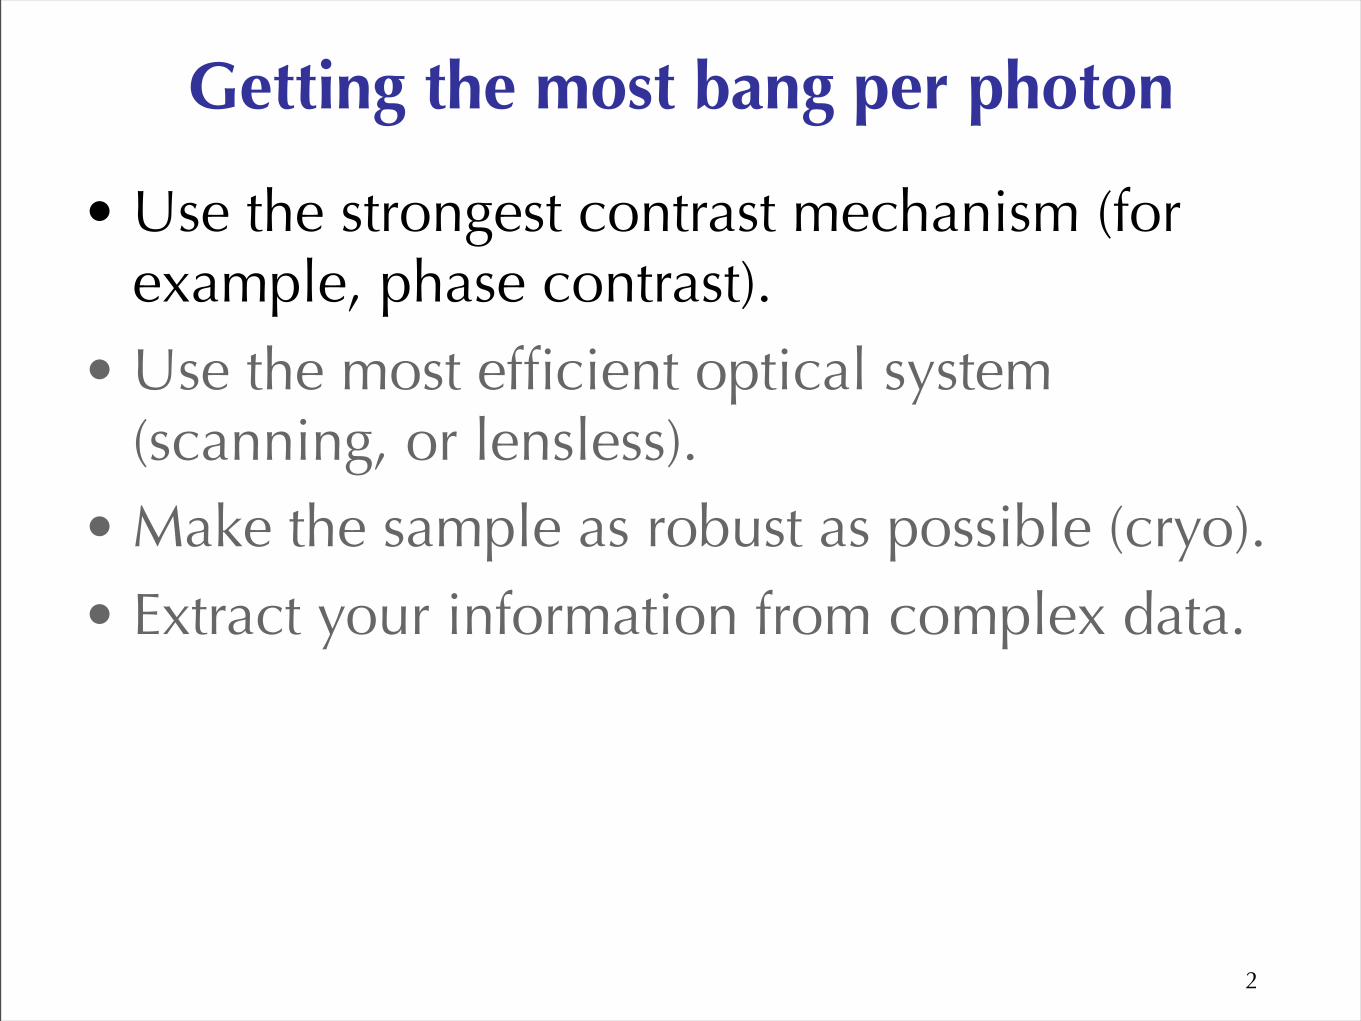
Röntgen tried refractive focusing, and failed...We now know that the x-ray refractive index goes like
Differs from n=1 by 10-3-10-6 so refractive focusing is very weak.Phase velocity is faster than light in vacuum!
Prisms refract x rays the opposite way from visible light!Phase is advanced rather than retarded! Total external reflection with critical angle
3
X-ray refractive index
4
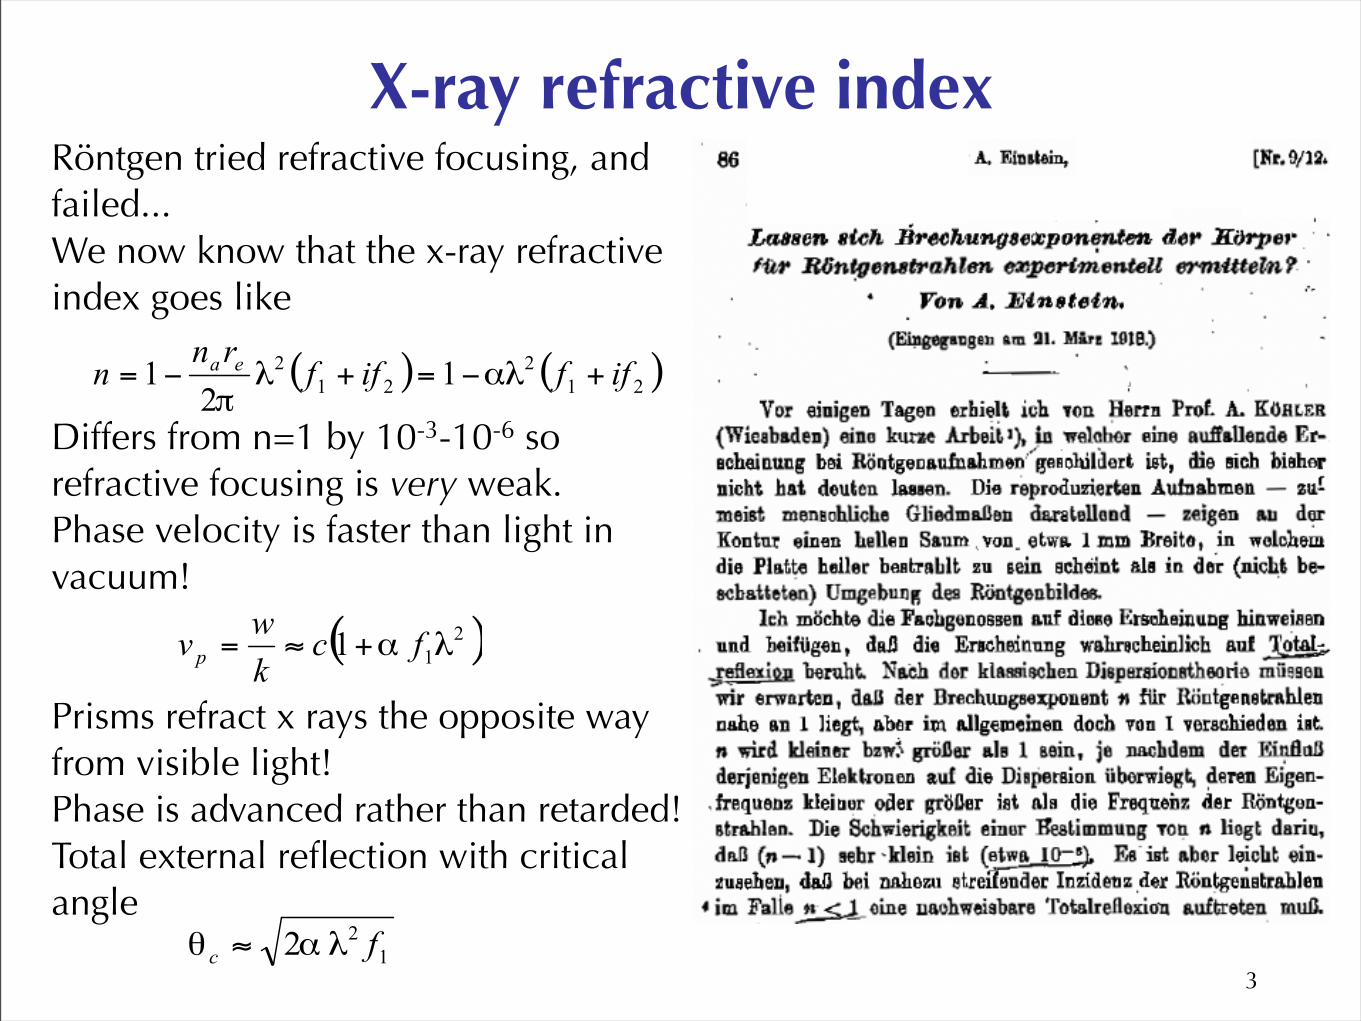
X-ray refractive index
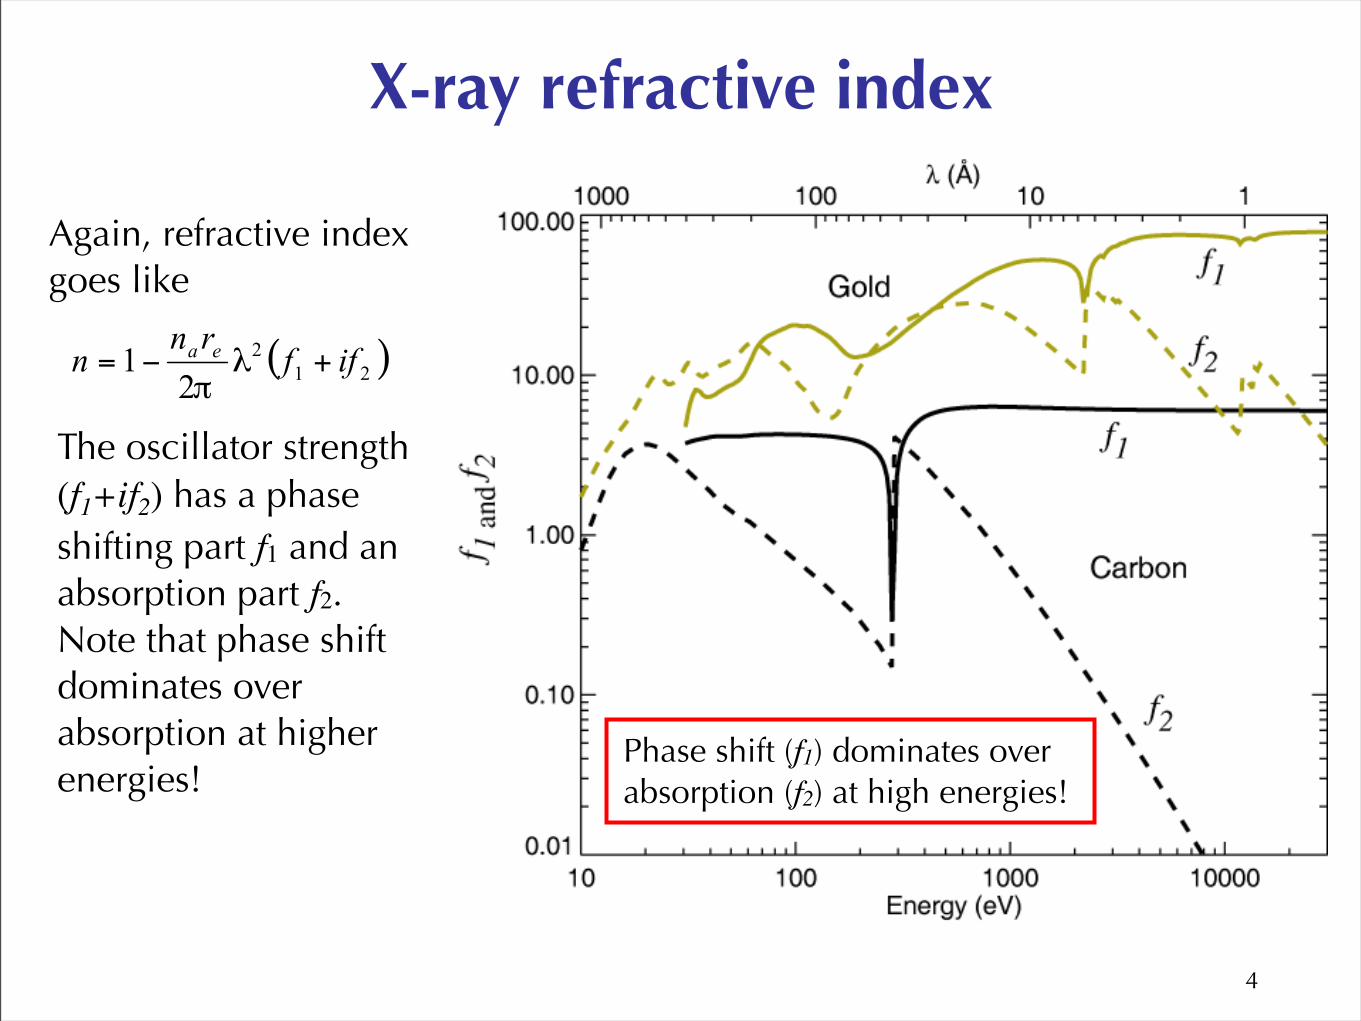
Again, refractive index goes like
The oscillator strength (f1+if2) has a phase shifting part f1 and an absorption part f2. Note that phase shift dominates over absorption at higher energies!
Phase shift (f1) dominates over absorption (f2) at high energies!
5
Scanning microscopes: contrast mode depends on detector
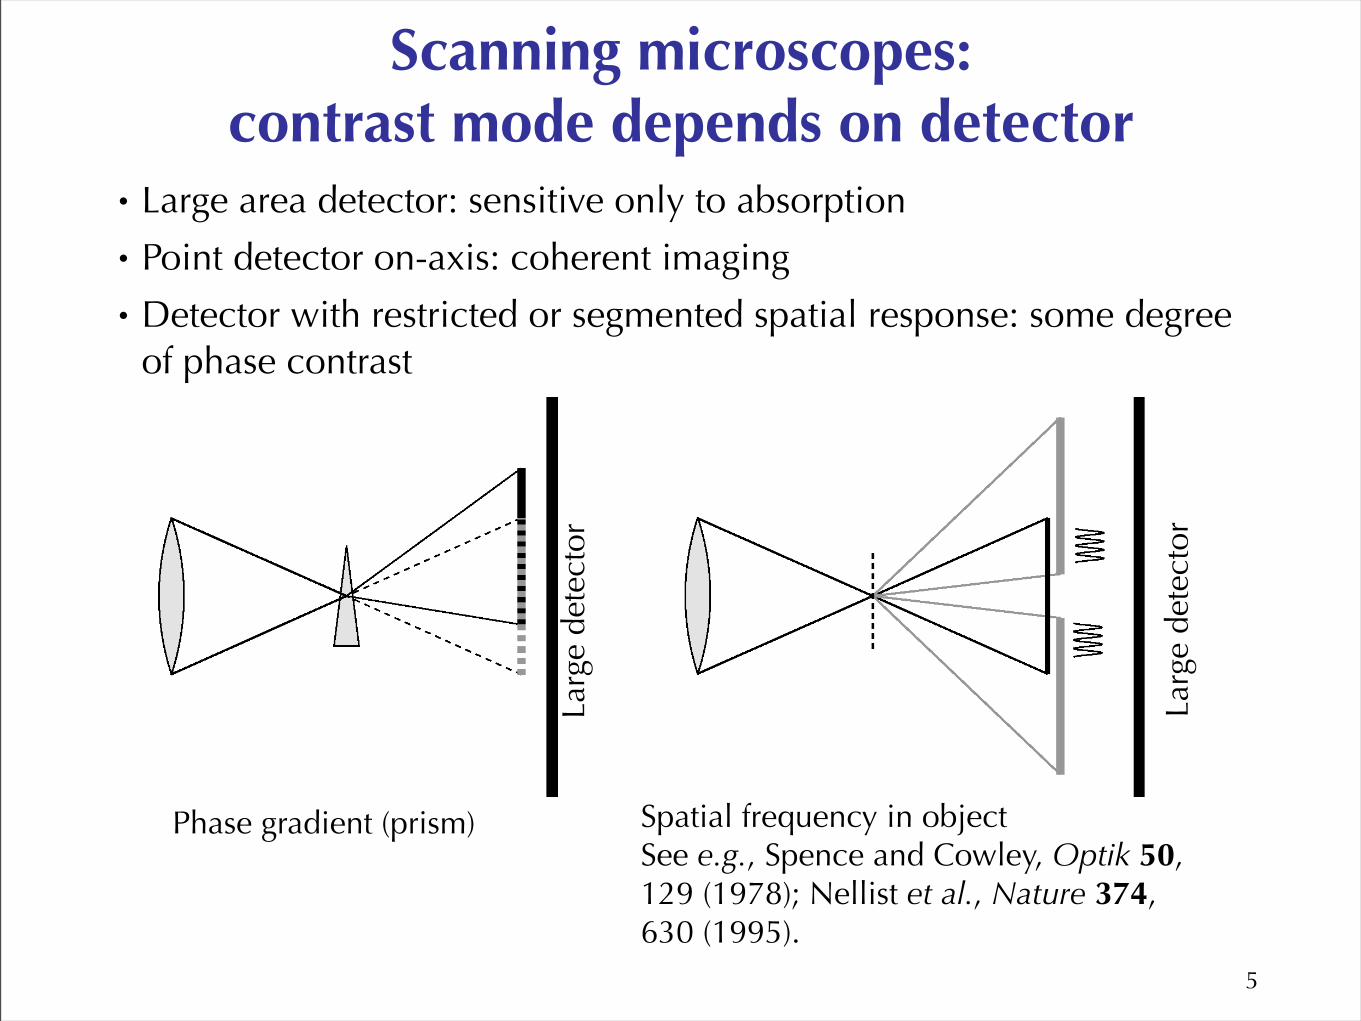
• Large area detector: sensitive only to absorption
• Point detector on-axis: coherent imaging
• Detector with restricted or segmented spatial response: some degree of phase contrast
Larg
e de
tect
or
Larg
e de
tect
or
Phase gradient (prism) Spatial frequency in objectSee e.g., Spence and Cowley, Optik 50, 129 (1978); Nellist et al., Nature 374, 630 (1995).
6
Scanning microprobes: CCD as the ultimate detector
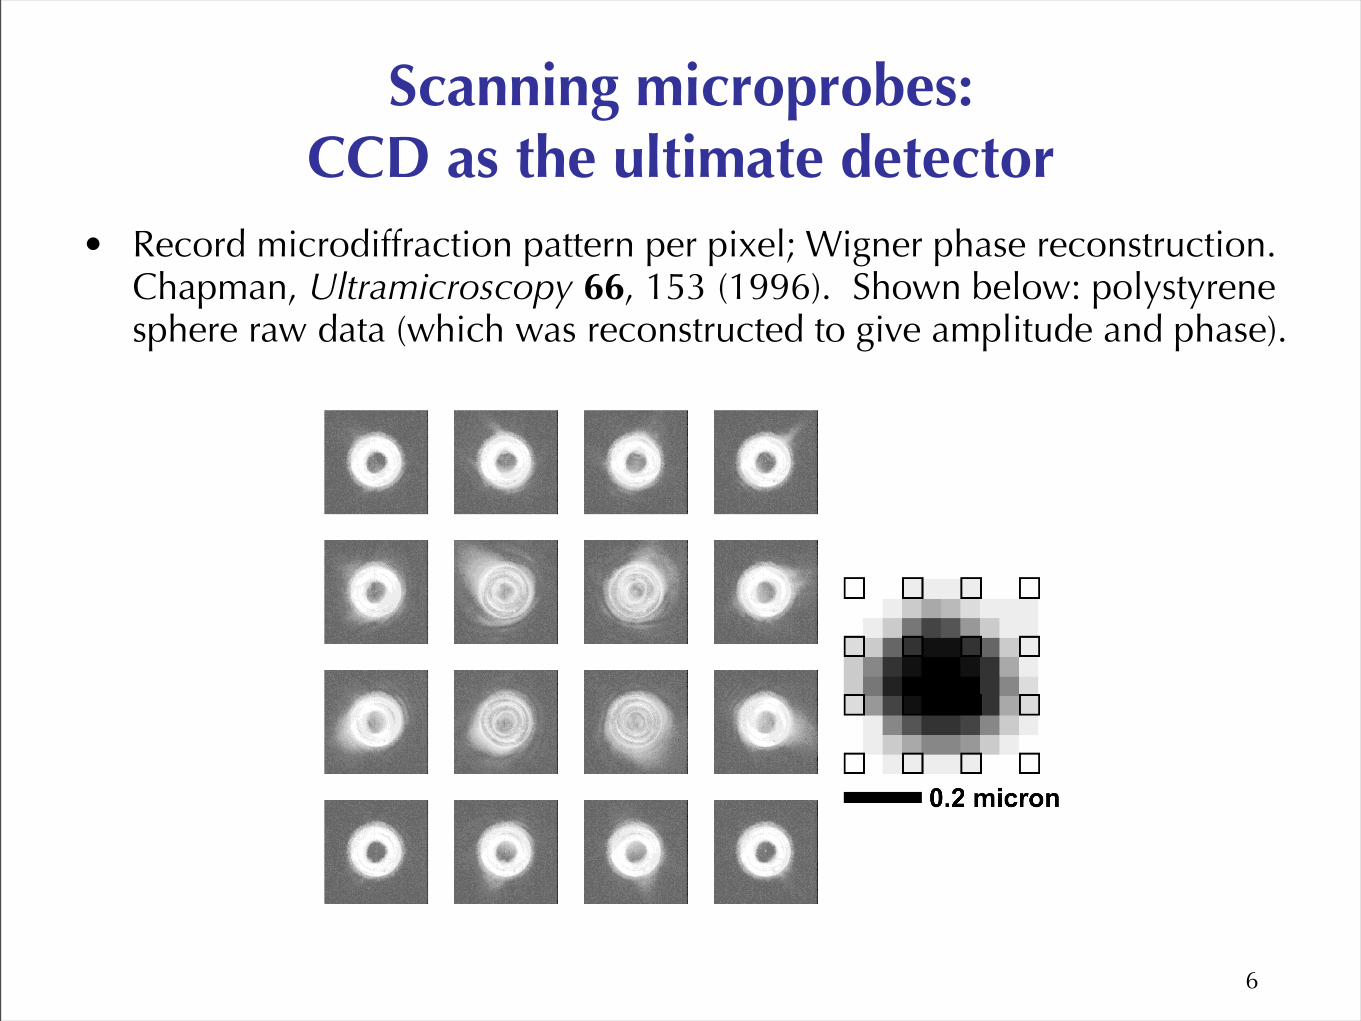
• Record microdiffraction pattern per pixel; Wigner phase reconstruction. Chapman, Ultramicroscopy 66, 153 (1996). Shown below: polystyrene sphere raw data (which was reconstructed to give amplitude and phase).
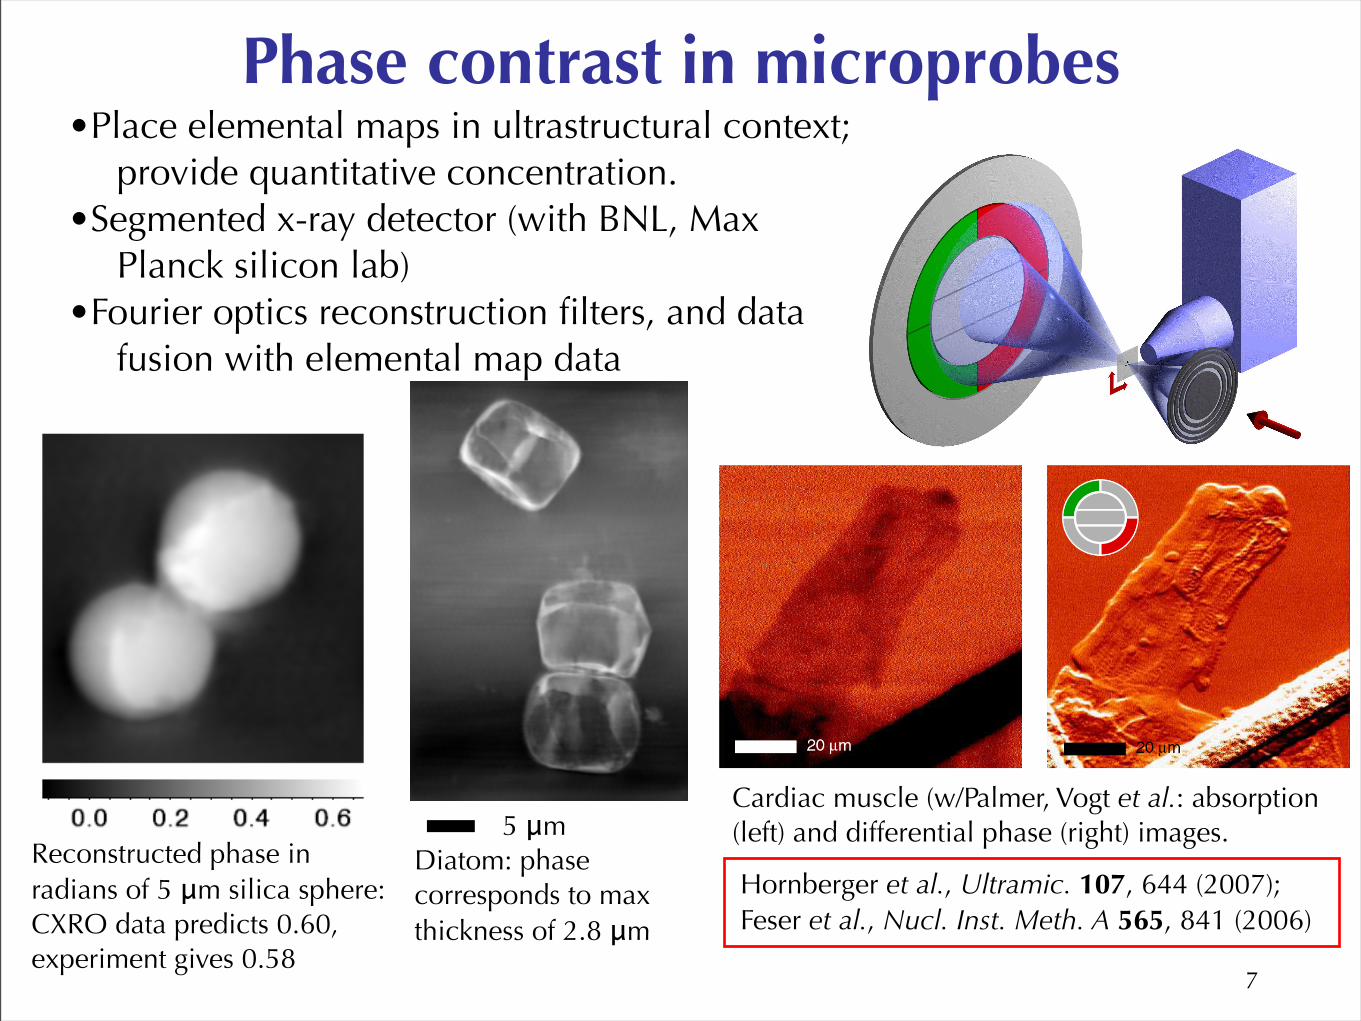
Phase contrast in microprobes•Place elemental maps in ultrastructural context;
provide quantitative concentration.•Segmented x-ray detector (with BNL, Max
Planck silicon lab)•Fourier optics reconstruction filters, and data
fusion with elemental map data
7
Reconstructed phase in radians of 5 μm silica sphere: CXRO data predicts 0.60, experiment gives 0.58
Diatom: phase corresponds to max thickness of 2.8 μm
5 μm Cardiac muscle (w/Palmer, Vogt et al.: absorption (left) and differential phase (right) images.
Hornberger et al., Ultramic. 107, 644 (2007); Feser et al., Nucl. Inst. Meth. A 565, 841 (2006)
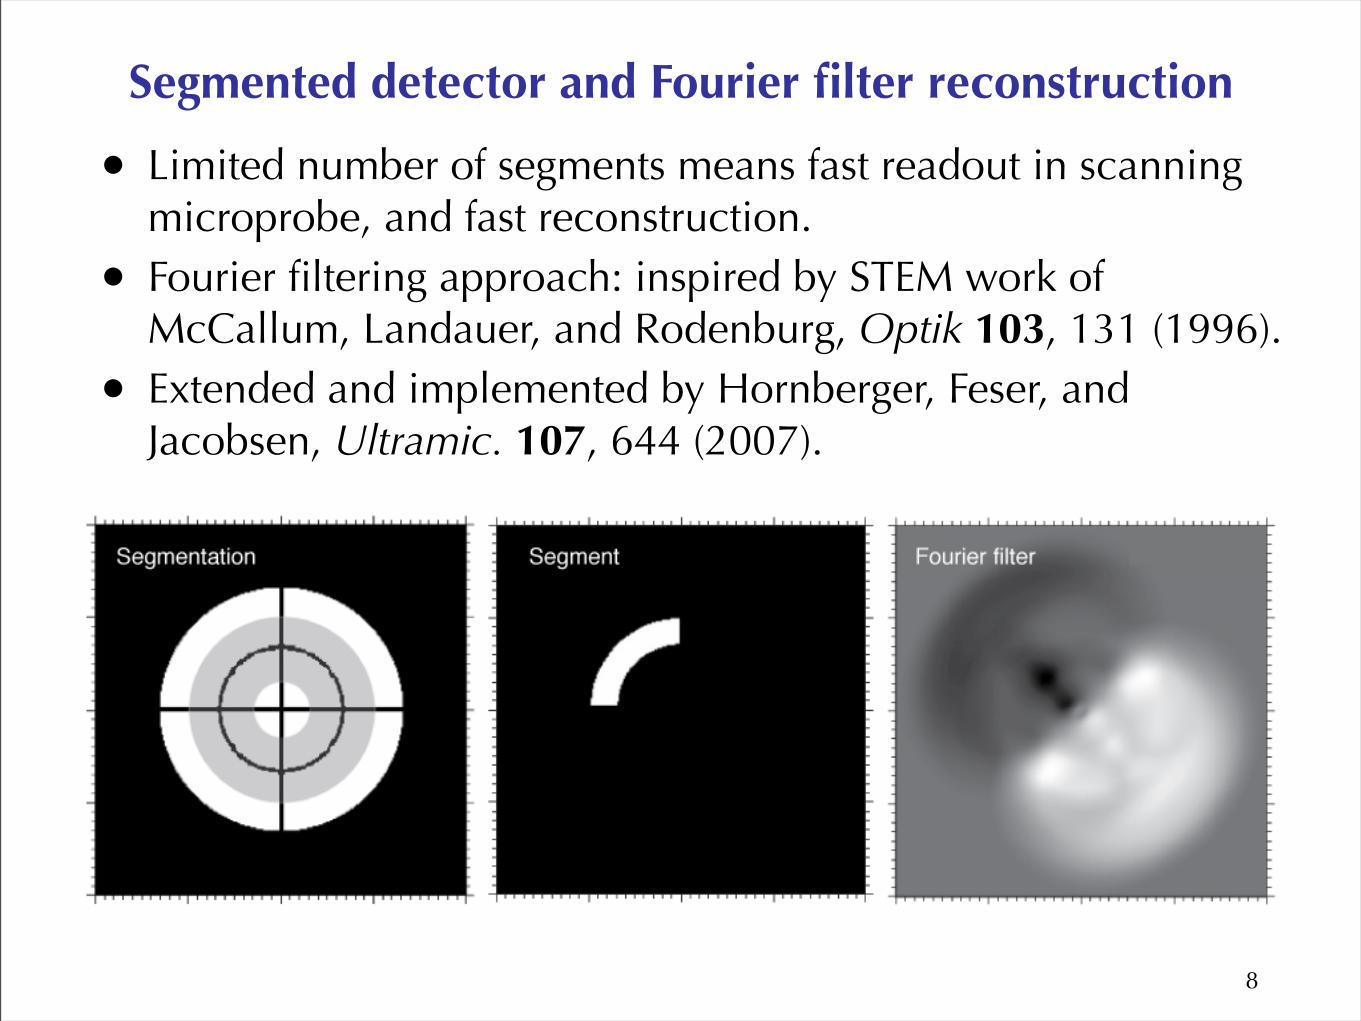
Segmented detector and Fourier filter reconstruction
• Limited number of segments means fast readout in scanning microprobe, and fast reconstruction.
• Fourier filtering approach: inspired by STEM work of McCallum, Landauer, and Rodenburg, Optik 103, 131 (1996).
• Extended and implemented by Hornberger, Feser, and Jacobsen, Ultramic. 107, 644 (2007).
8
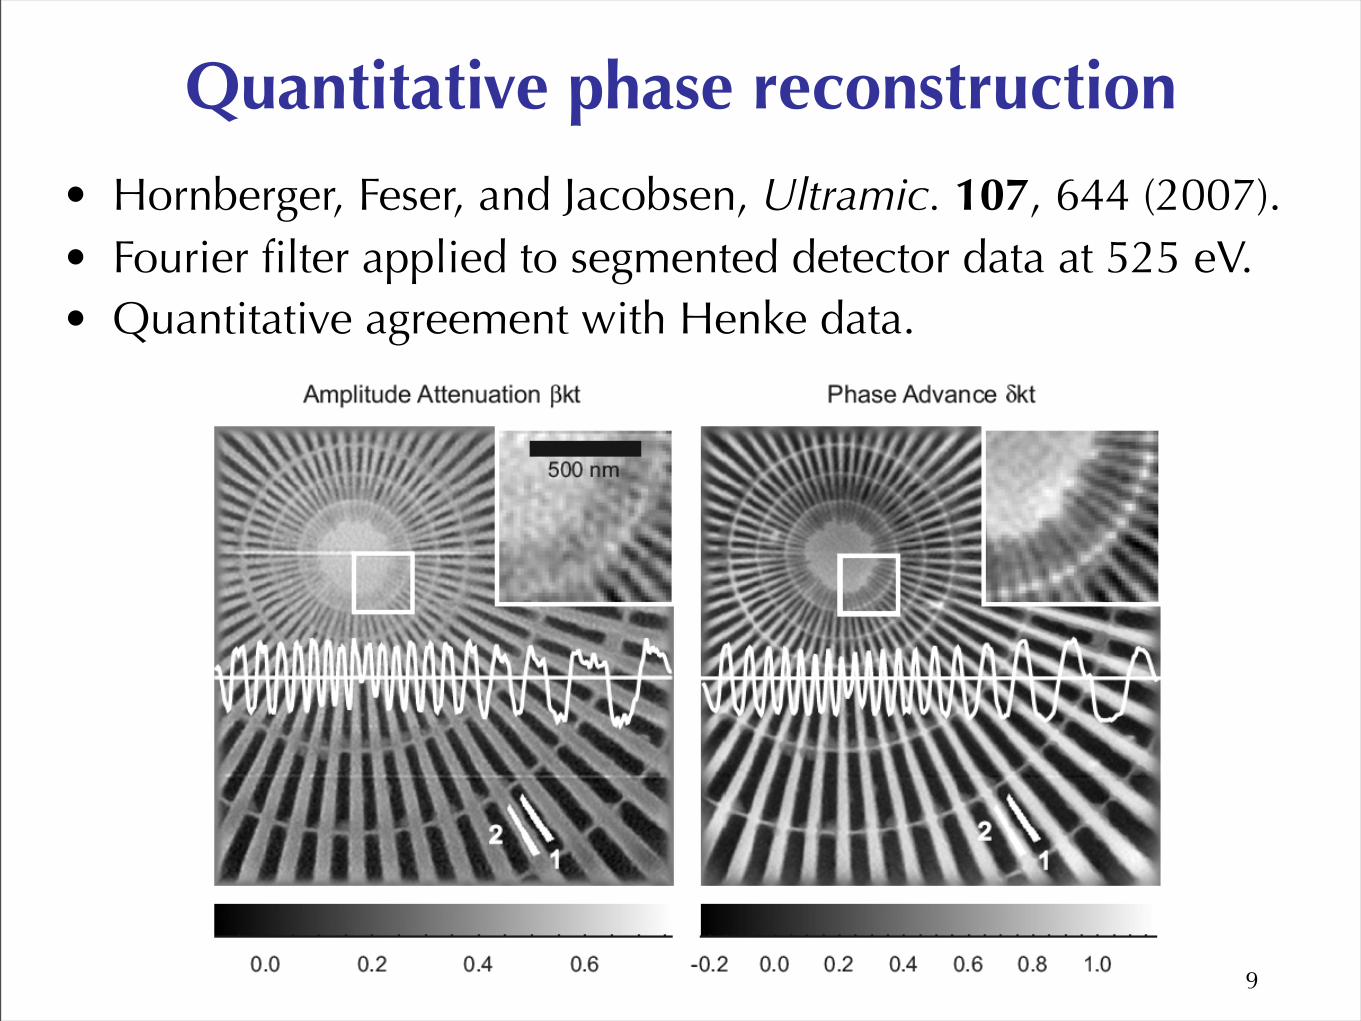
Quantitative phase reconstruction
• Hornberger, Feser, and Jacobsen, Ultramic. 107, 644 (2007).• Fourier filter applied to segmented detector data at 525 eV.• Quantitative agreement with Henke data.
9
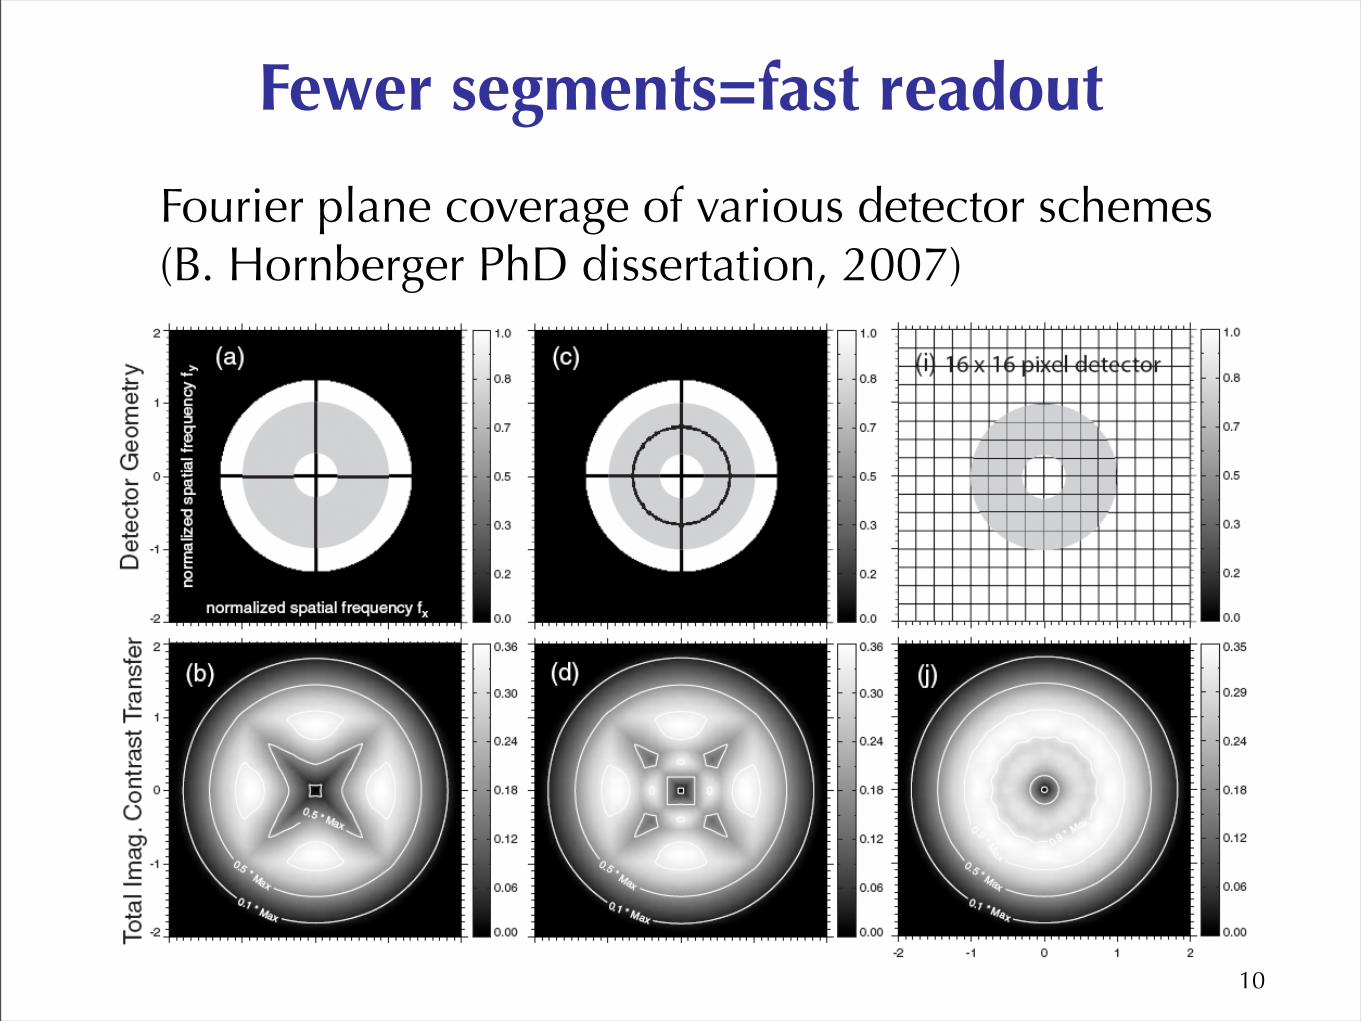
Fewer segments=fast readout
Fourier plane coverage of various detector schemes (B. Hornberger PhD dissertation, 2007)
10
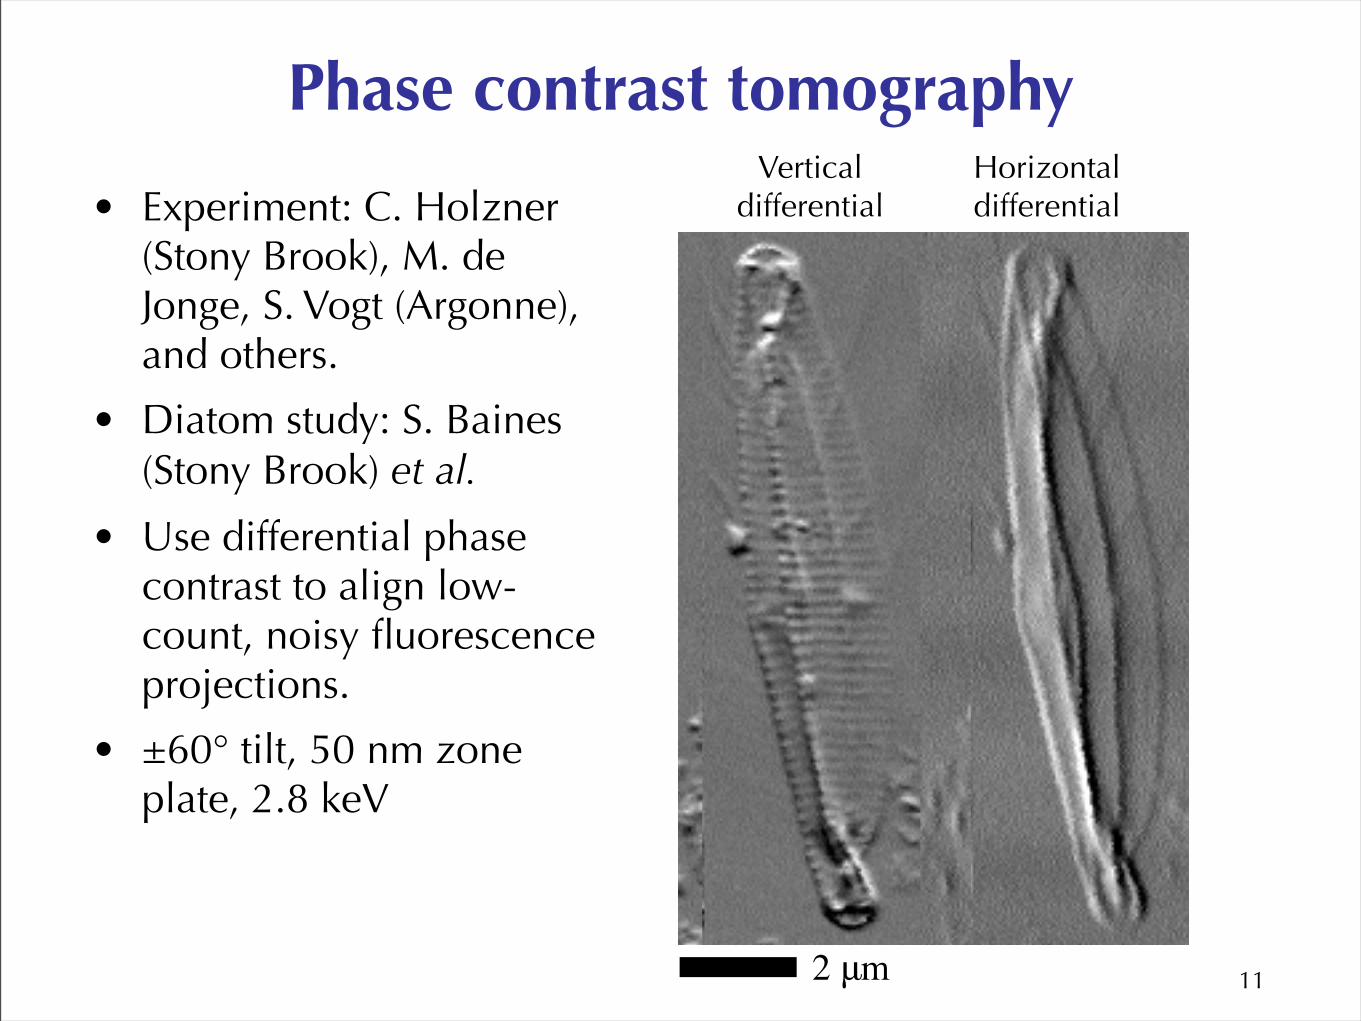
Phase contrast tomography
• Experiment: C. Holzner (Stony Brook), M. de Jonge, S. Vogt (Argonne), and others.
• Diatom study: S. Baines (Stony Brook) et al.
• Use differential phase contrast to align low-count, noisy fluorescence projections.
• ±60° tilt, 50 nm zone plate, 2.8 keV
112 μm
Vertical differential
Horizontal differential
12
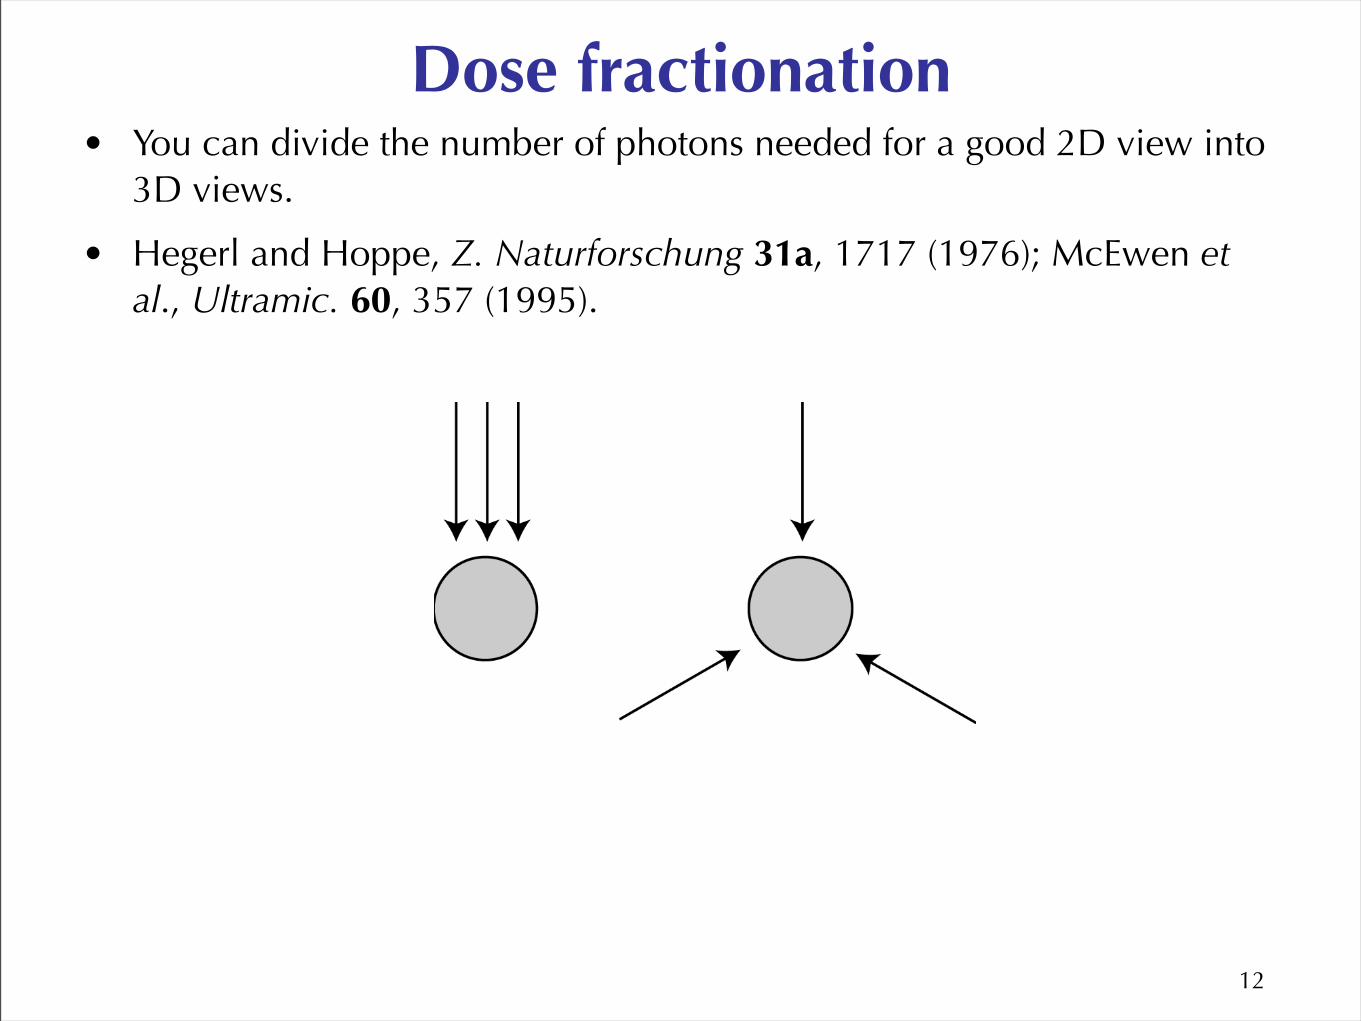
Dose fractionation• You can divide the number of photons needed for a good 2D view into
3D views.
• Hegerl and Hoppe, Z. Naturforschung 31a, 1717 (1976); McEwen et al., Ultramic. 60, 357 (1995).
Getting the most bang per photon
• Use the strongest contrast mechanism (for example, phase contrast).
• Use the most efficient optical system (scanning, or lensless).
• Make the sample as robust as possible (cryo).
• Extract your information from complex data.
13
14
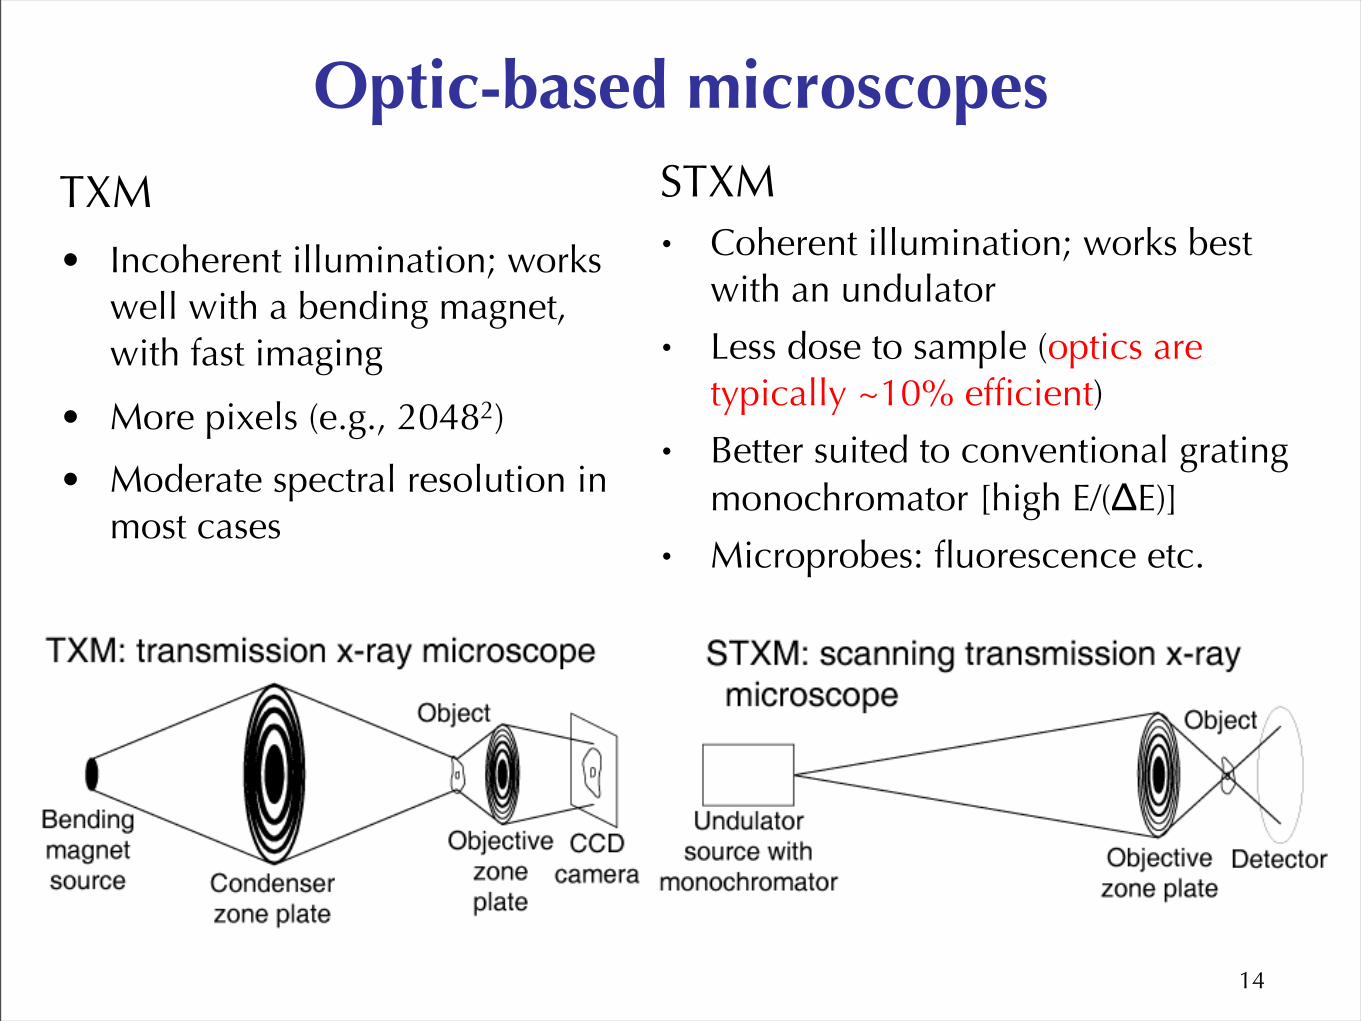
Optic-based microscopes
TXM• Incoherent illumination; works
well with a bending magnet, with fast imaging
• More pixels (e.g., 20482)
• Moderate spectral resolution in most cases
STXM• Coherent illumination; works best
with an undulator
• Less dose to sample (optics are typically ~10% efficient)
• Better suited to conventional grating monochromator [high E/(ΔE)]
• Microprobes: fluorescence etc.
15
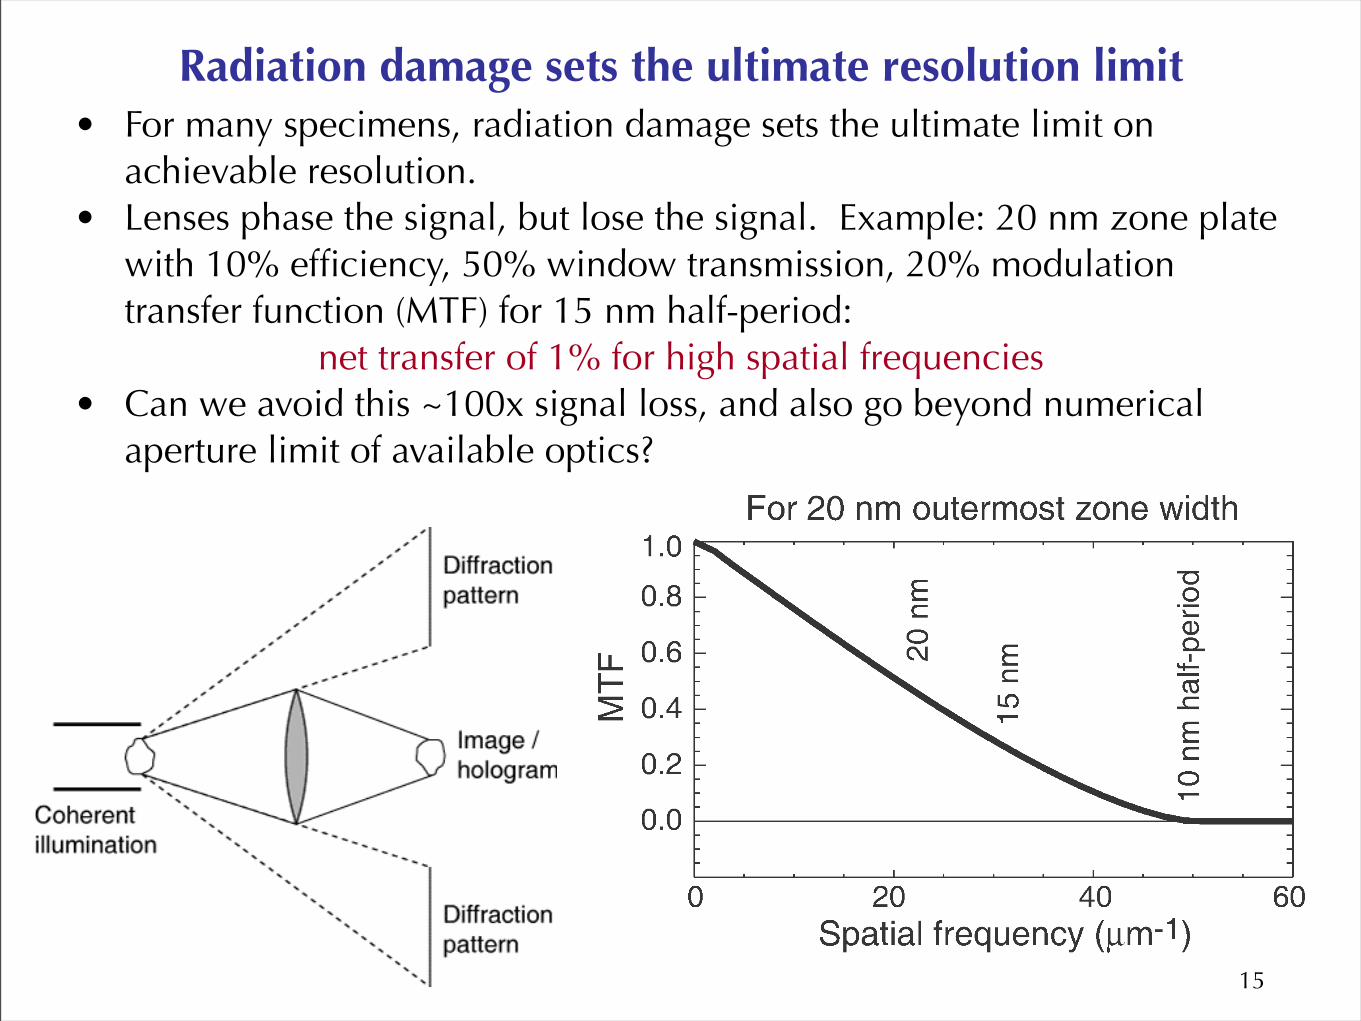
• For many specimens, radiation damage sets the ultimate limit on achievable resolution.
• Lenses phase the signal, but lose the signal. Example: 20 nm zone plate with 10% efficiency, 50% window transmission, 20% modulation transfer function (MTF) for 15 nm half-period:
net transfer of 1% for high spatial frequencies• Can we avoid this ~100x signal loss, and also go beyond numerical
aperture limit of available optics?
Radiation damage sets the ultimate resolution limit
16
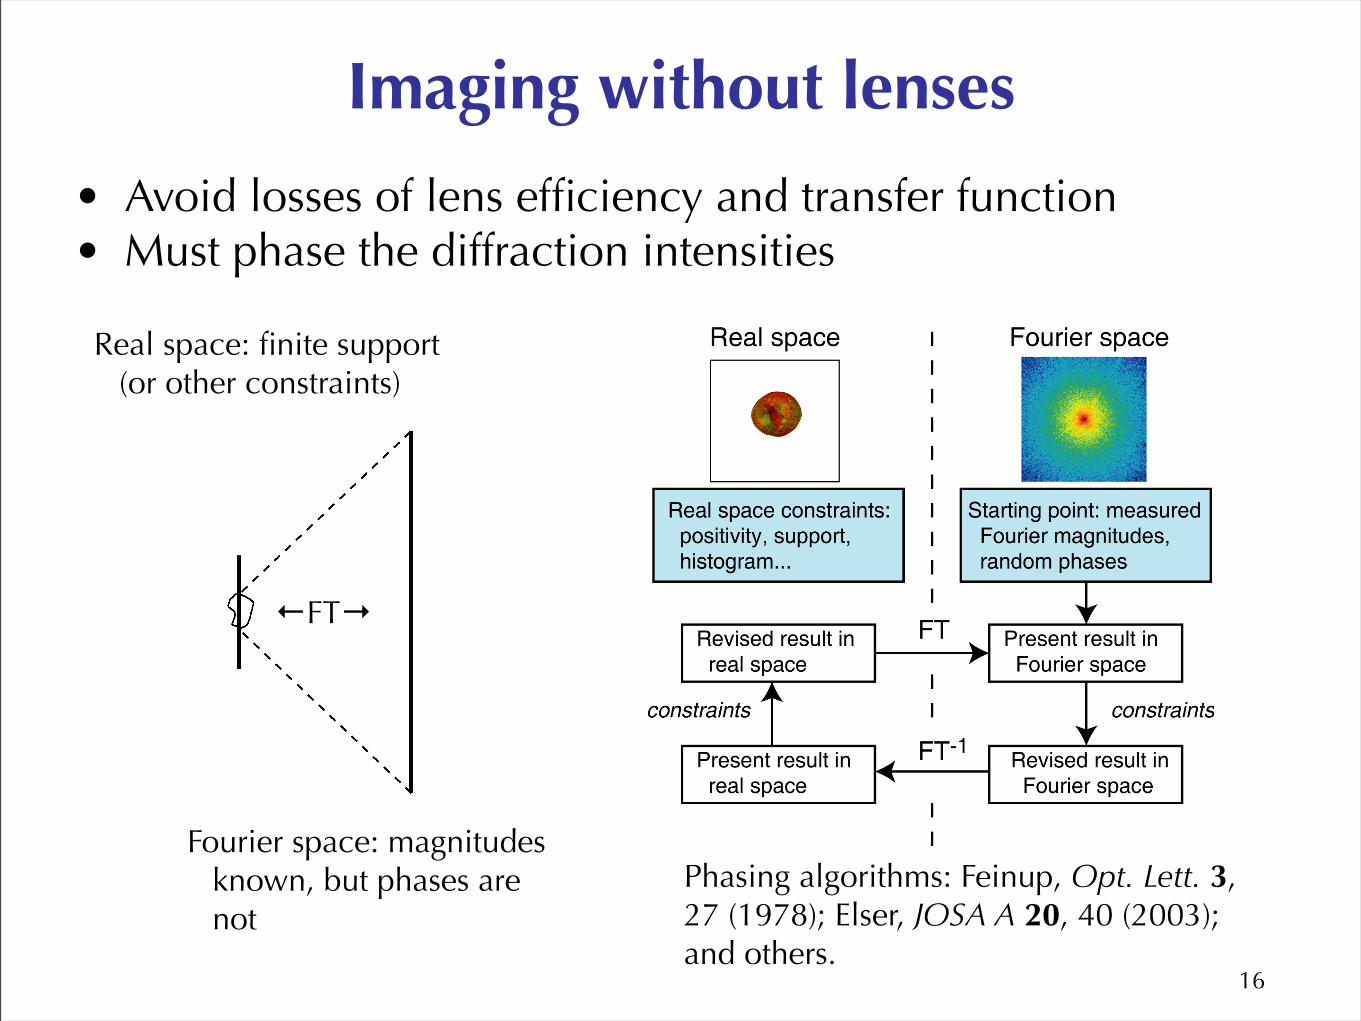
Imaging without lenses
• Avoid losses of lens efficiency and transfer function• Must phase the diffraction intensities
Phasing algorithms: Feinup, Opt. Lett. 3, 27 (1978); Elser, JOSA A 20, 40 (2003); and others.
Real space: finite support (or other constraints)
Fourier space: magnitudes known, but phases are not
←FT→
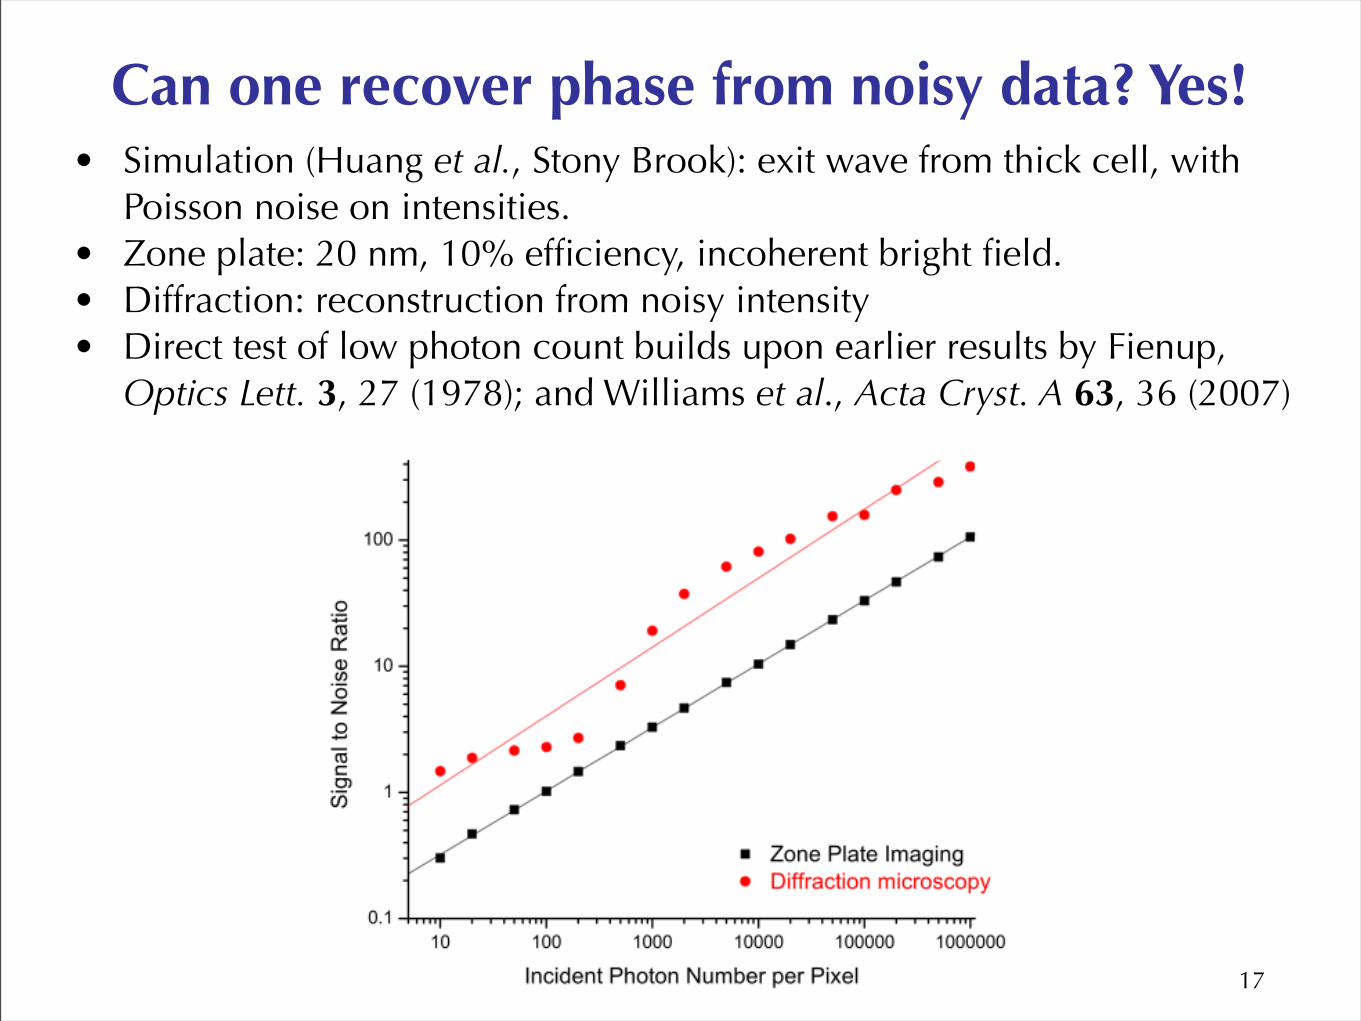
Can one recover phase from noisy data? Yes!
17
• Simulation (Huang et al., Stony Brook): exit wave from thick cell, with Poisson noise on intensities.
• Zone plate: 20 nm, 10% efficiency, incoherent bright field.• Diffraction: reconstruction from noisy intensity• Direct test of low photon count builds upon earlier results by Fienup,
Optics Lett. 3, 27 (1978); and Williams et al., Acta Cryst. A 63, 36 (2007)
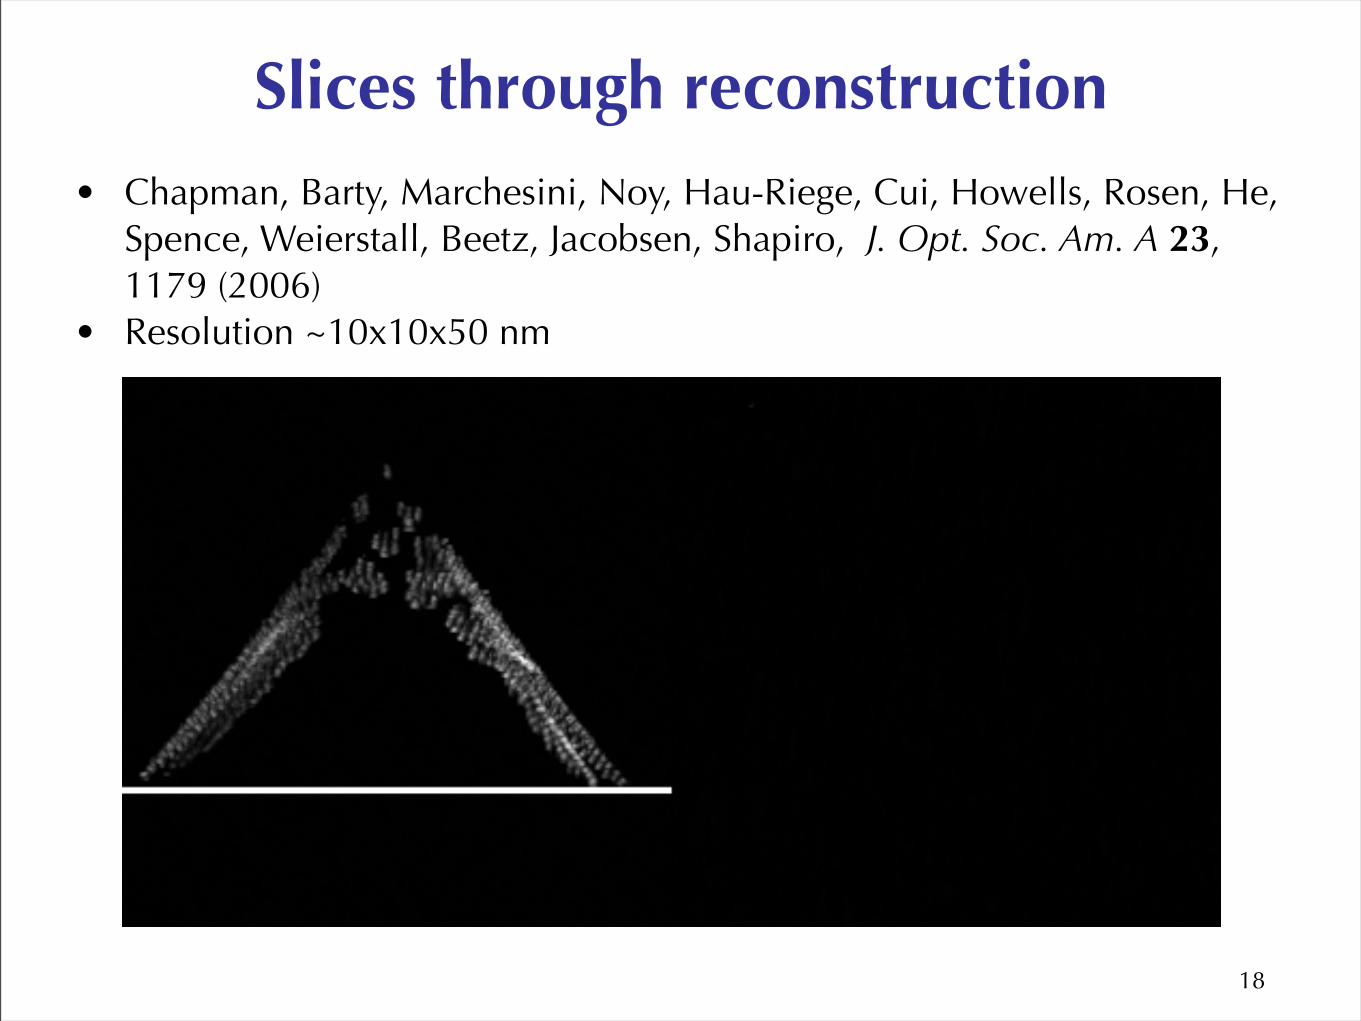
Slices through reconstruction• Chapman, Barty, Marchesini, Noy, Hau-Riege, Cui, Howells, Rosen, He,
Spence, Weierstall, Beetz, Jacobsen, Shapiro, J. Opt. Soc. Am. A 23, 1179 (2006)
• Resolution ~10x10x50 nm
18
19
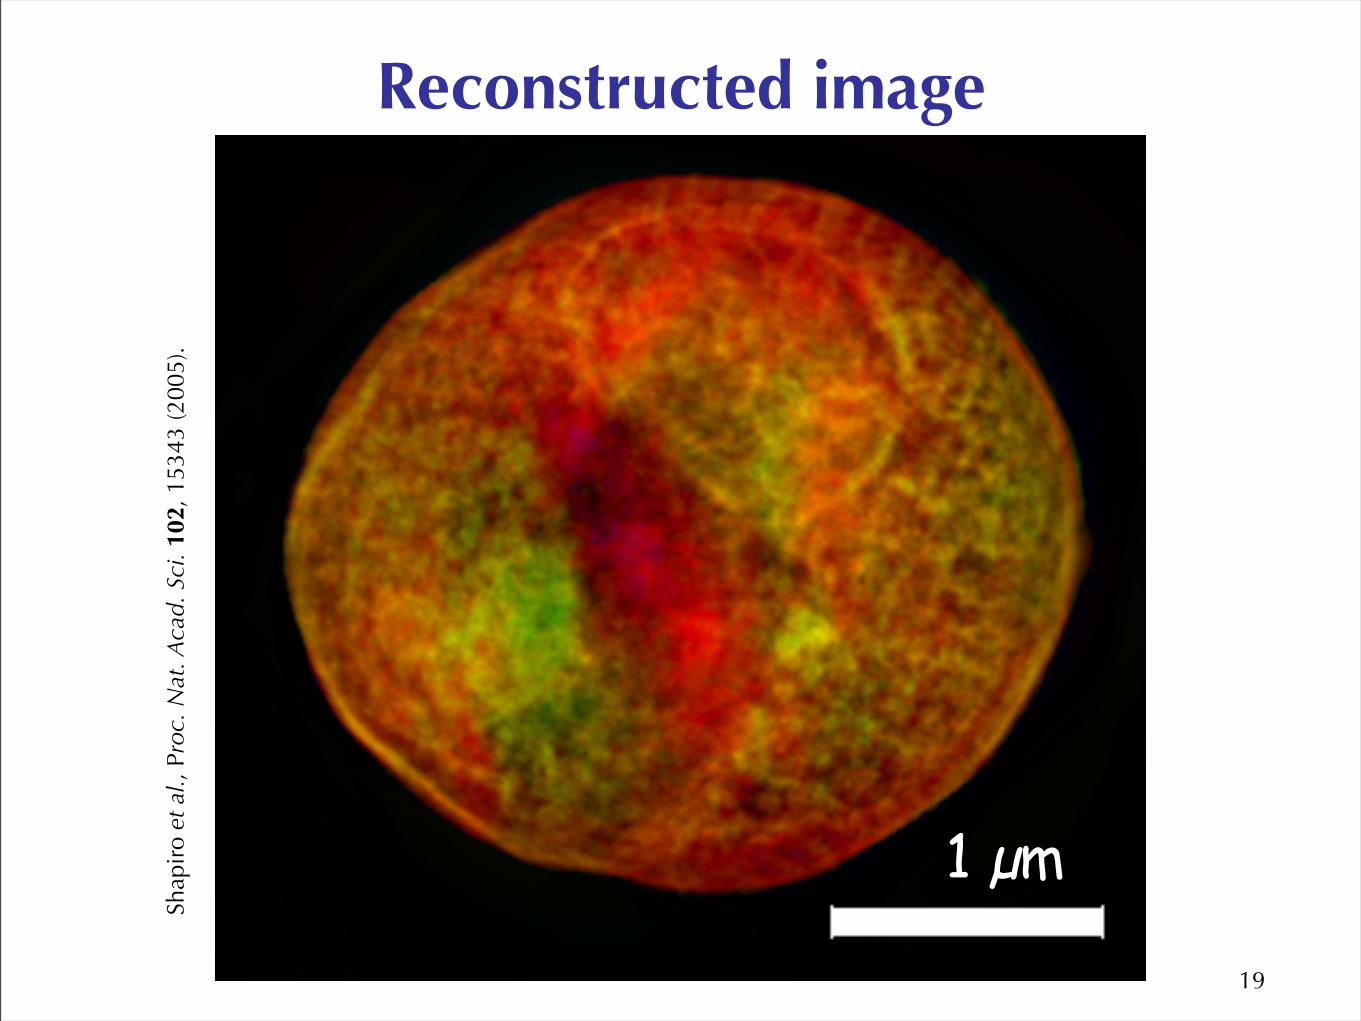
Reconstructed imageSh
apir
o et
al.,
Pro
c. N
at. A
cad.
Sci
. 102
, 153
43 (2
005)
.
1 µm
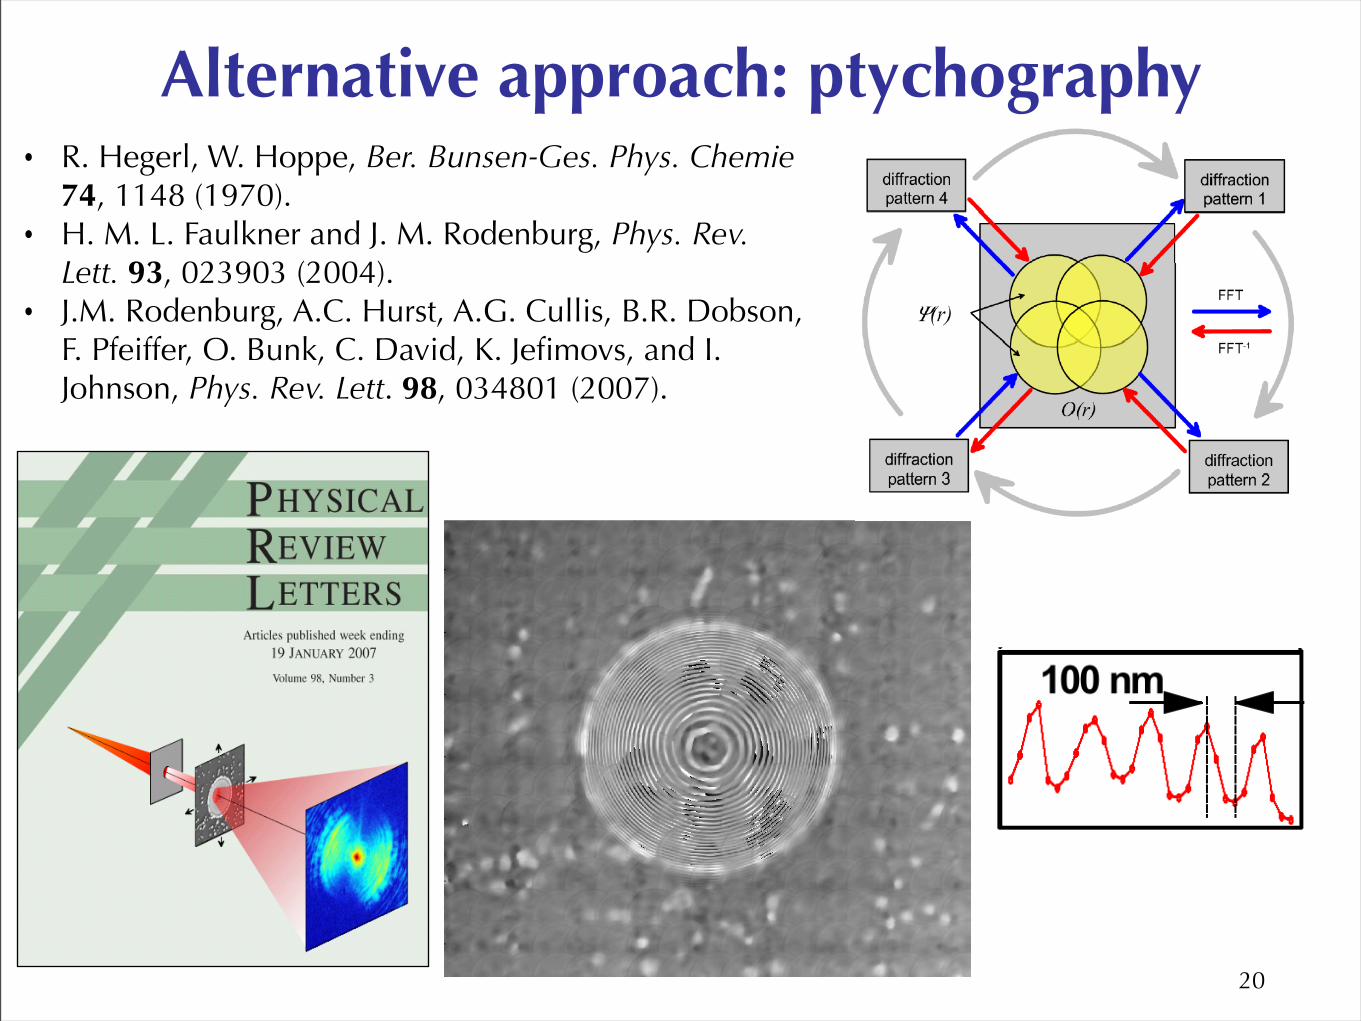
Alternative approach: ptychography• R. Hegerl, W. Hoppe, Ber. Bunsen-Ges. Phys. Chemie
74, 1148 (1970).• H. M. L. Faulkner and J. M. Rodenburg, Phys. Rev.
Lett. 93, 023903 (2004).• J.M. Rodenburg, A.C. Hurst, A.G. Cullis, B.R. Dobson,
F. Pfeiffer, O. Bunk, C. David, K. Jefimovs, and I. Johnson, Phys. Rev. Lett. 98, 034801 (2007).
20
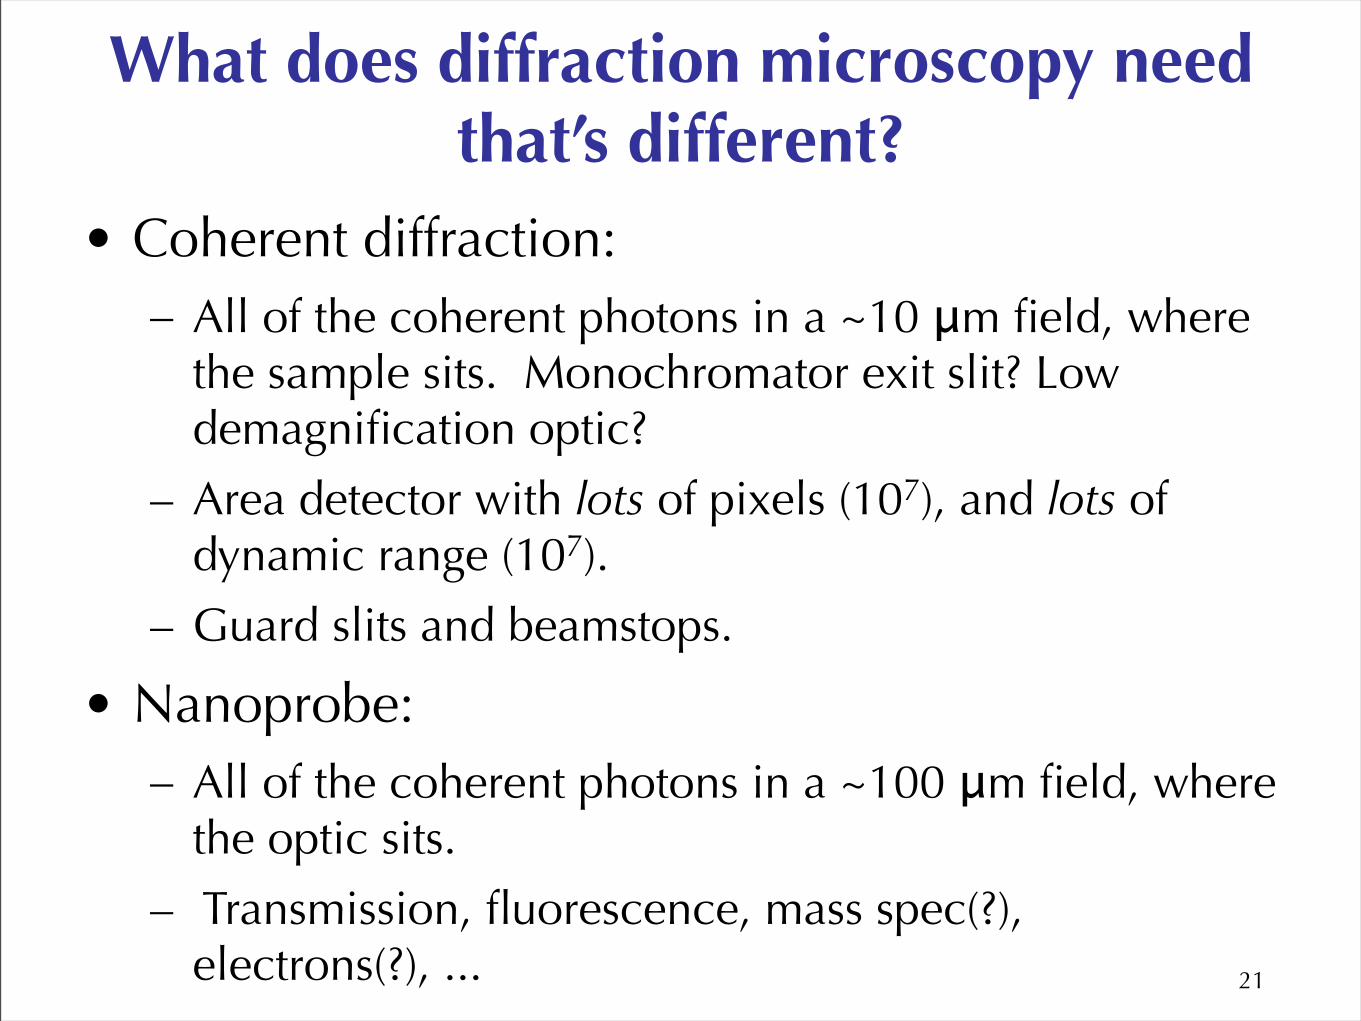
What does diffraction microscopy need that’s different?
• Coherent diffraction:– All of the coherent photons in a ~10 μm field, where
the sample sits. Monochromator exit slit? Low demagnification optic?
– Area detector with lots of pixels (107), and lots of dynamic range (107).
– Guard slits and beamstops.
• Nanoprobe:– All of the coherent photons in a ~100 μm field, where
the optic sits.
– Transmission, fluorescence, mass spec(?), electrons(?), ... 21
Getting the most bang per photon
• Use the strongest contrast mechanism (for example, phase contrast).
• Use the most efficient optical system (scanning, or lensless).
• Make the sample as robust as possible (cryo).
• Extract your information from complex data.
22
23
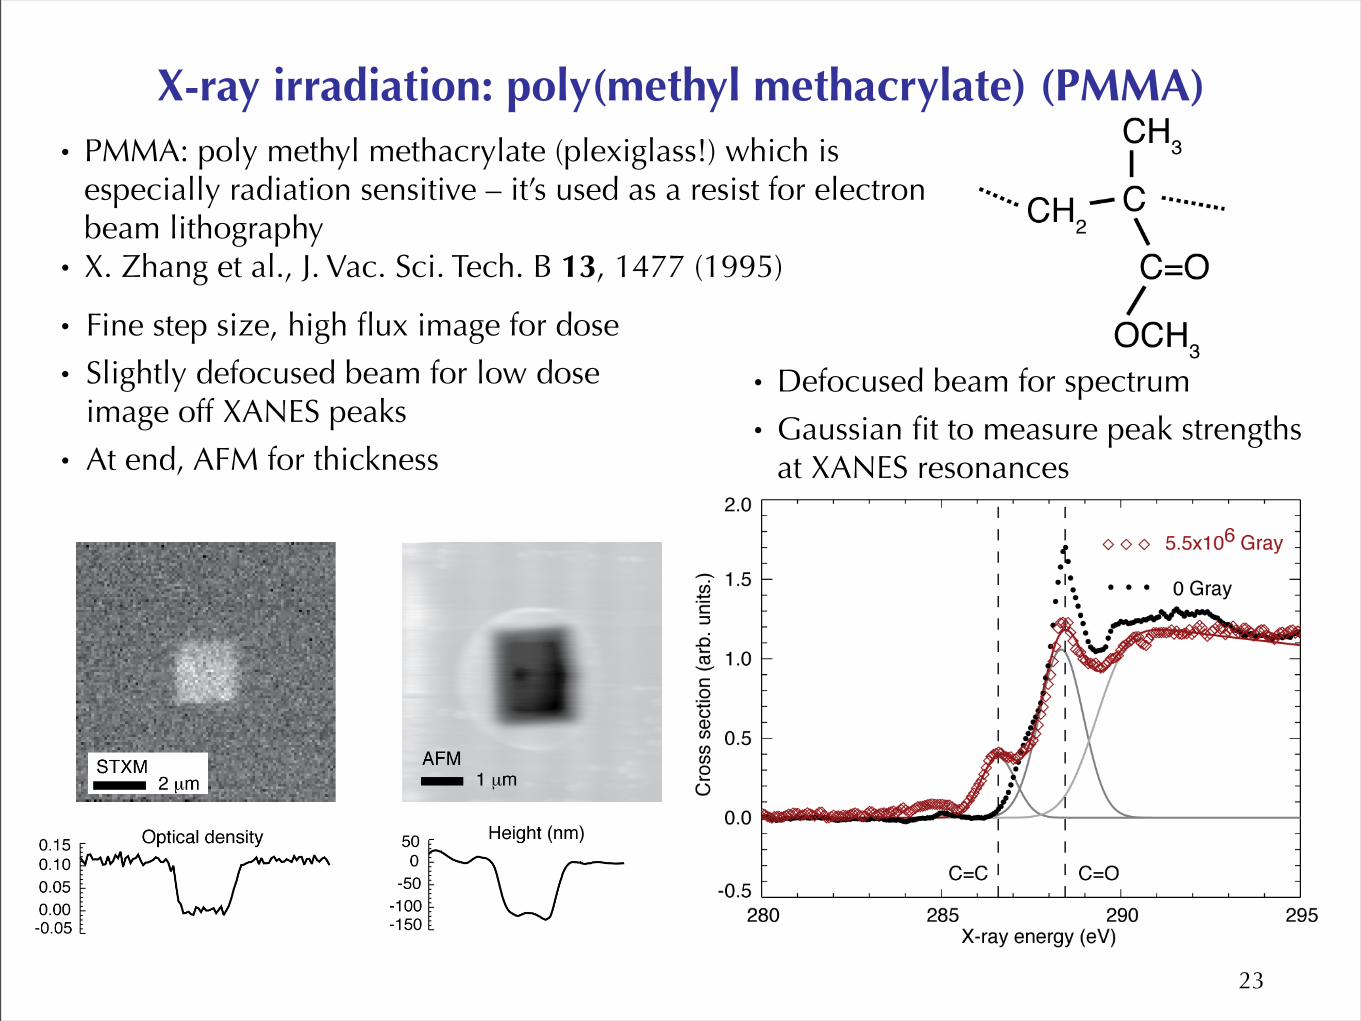
X-ray irradiation: poly(methyl methacrylate) (PMMA)
• Fine step size, high flux image for dose
• Slightly defocused beam for low dose image off XANES peaks
• At end, AFM for thickness
• Defocused beam for spectrum
• Gaussian fit to measure peak strengths at XANES resonances
• PMMA: poly methyl methacrylate (plexiglass!) which is especially radiation sensitive – it’s used as a resist for electron beam lithography
• X. Zhang et al., J. Vac. Sci. Tech. B 13, 1477 (1995)
24
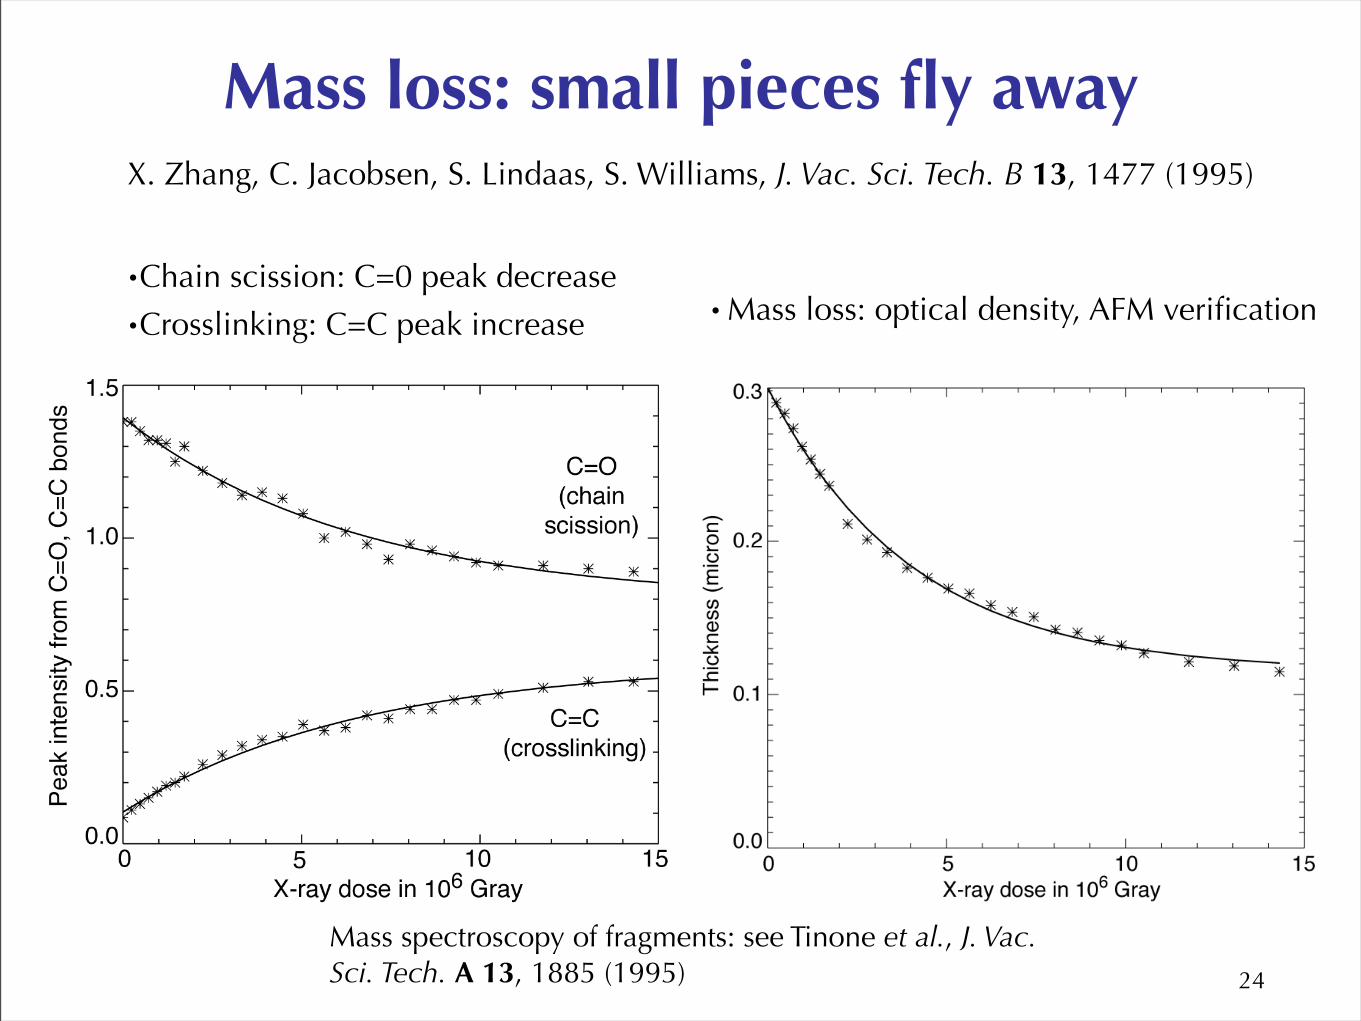
Mass loss: small pieces fly away
•Chain scission: C=0 peak decrease
•Crosslinking: C=C peak increase
X. Zhang, C. Jacobsen, S. Lindaas, S. Williams, J. Vac. Sci. Tech. B 13, 1477 (1995)
• Mass loss: optical density, AFM verification
Mass spectroscopy of fragments: see Tinone et al., J. Vac. Sci. Tech. A 13, 1885 (1995)
25
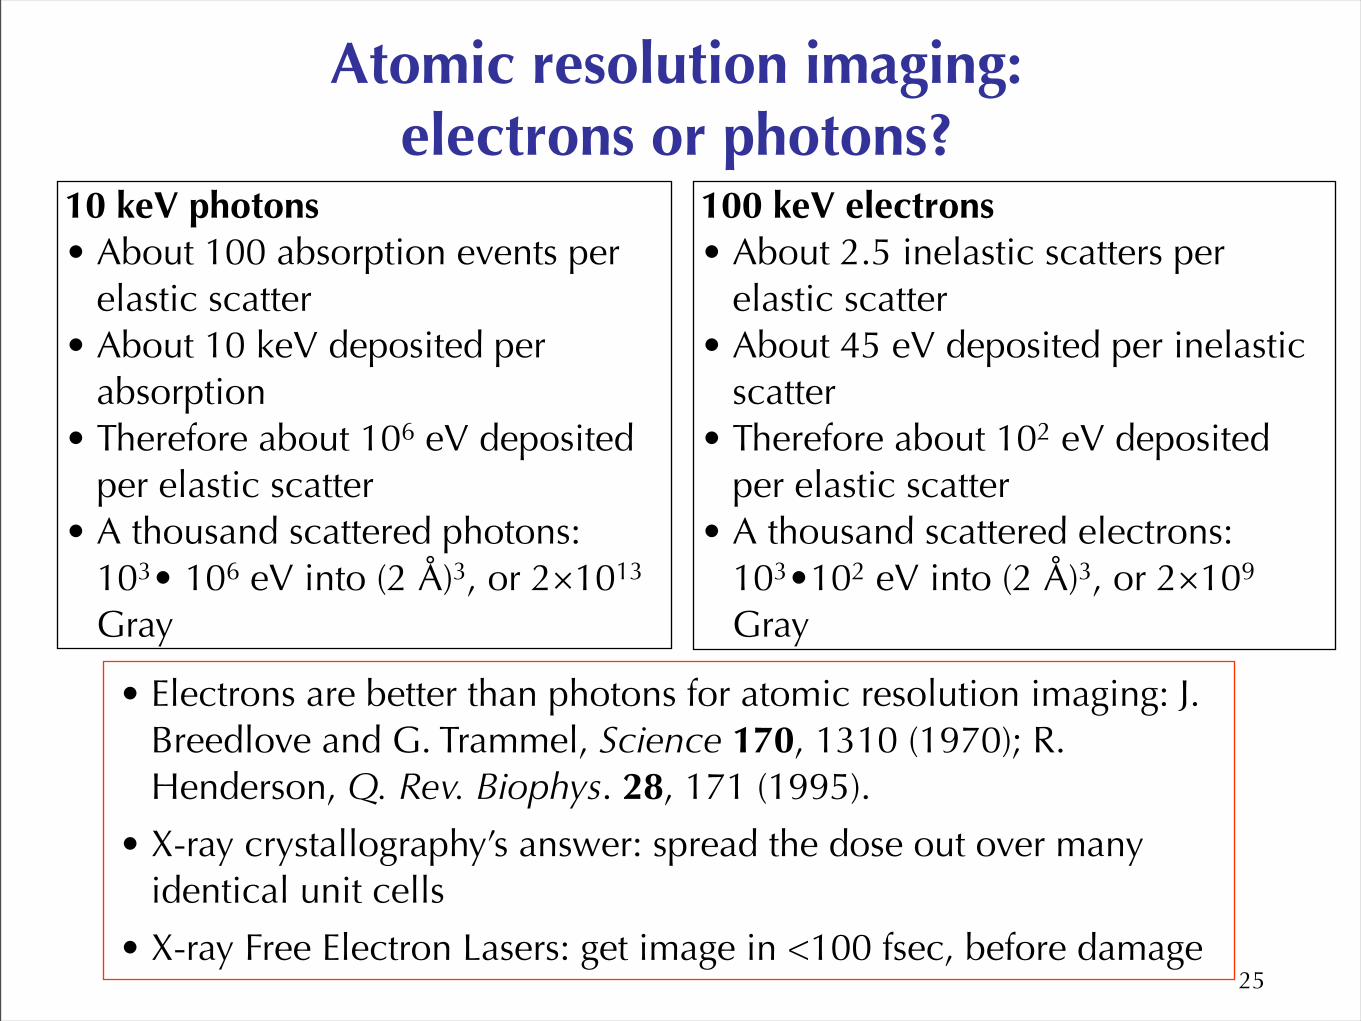
Atomic resolution imaging:electrons or photons?
100 keV electrons• About 2.5 inelastic scatters per
elastic scatter• About 45 eV deposited per inelastic
scatter• Therefore about 102 eV deposited
per elastic scatter• A thousand scattered electrons:
103•102 eV into (2 Å)3, or 2×10⁹ Gray
10 keV photons• About 100 absorption events per
elastic scatter• About 10 keV deposited per
absorption• Therefore about 106 eV deposited
per elastic scatter• A thousand scattered photons:
103• 106 eV into (2 Å)3, or 2×10¹³ Gray
• Electrons are better than photons for atomic resolution imaging: J. Breedlove and G. Trammel, Science 170, 1310 (1970); R. Henderson, Q. Rev. Biophys. 28, 171 (1995).
• X-ray crystallography’s answer: spread the dose out over many identical unit cells
• X-ray Free Electron Lasers: get image in <100 fsec, before damage
26
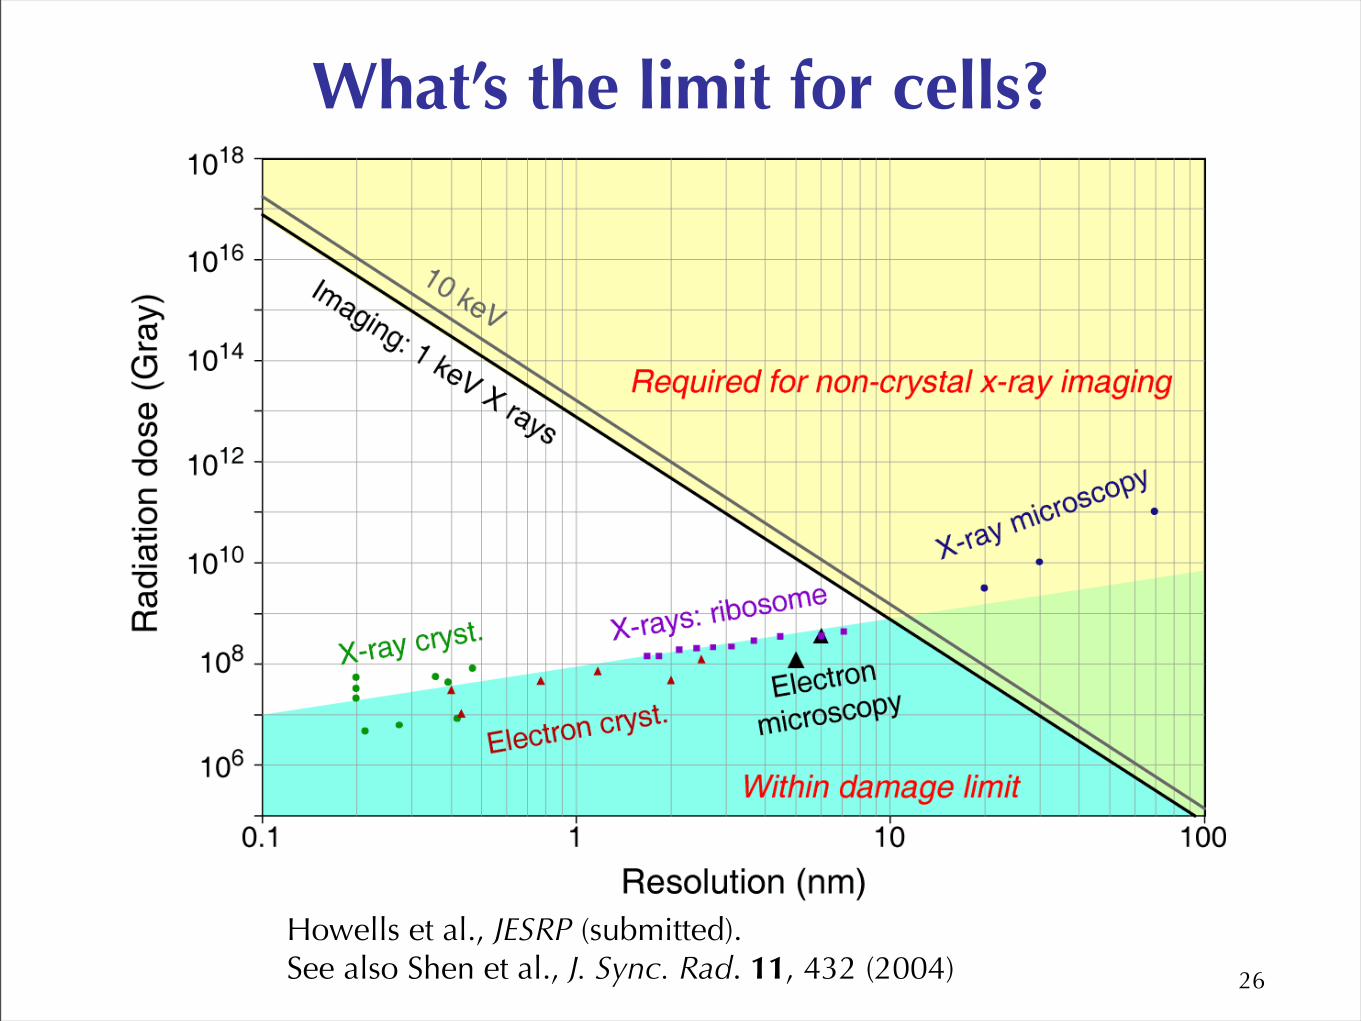
What’s the limit for cells?
Howells et al., JESRP (submitted). See also Shen et al., J. Sync. Rad. 11, 432 (2004)
27
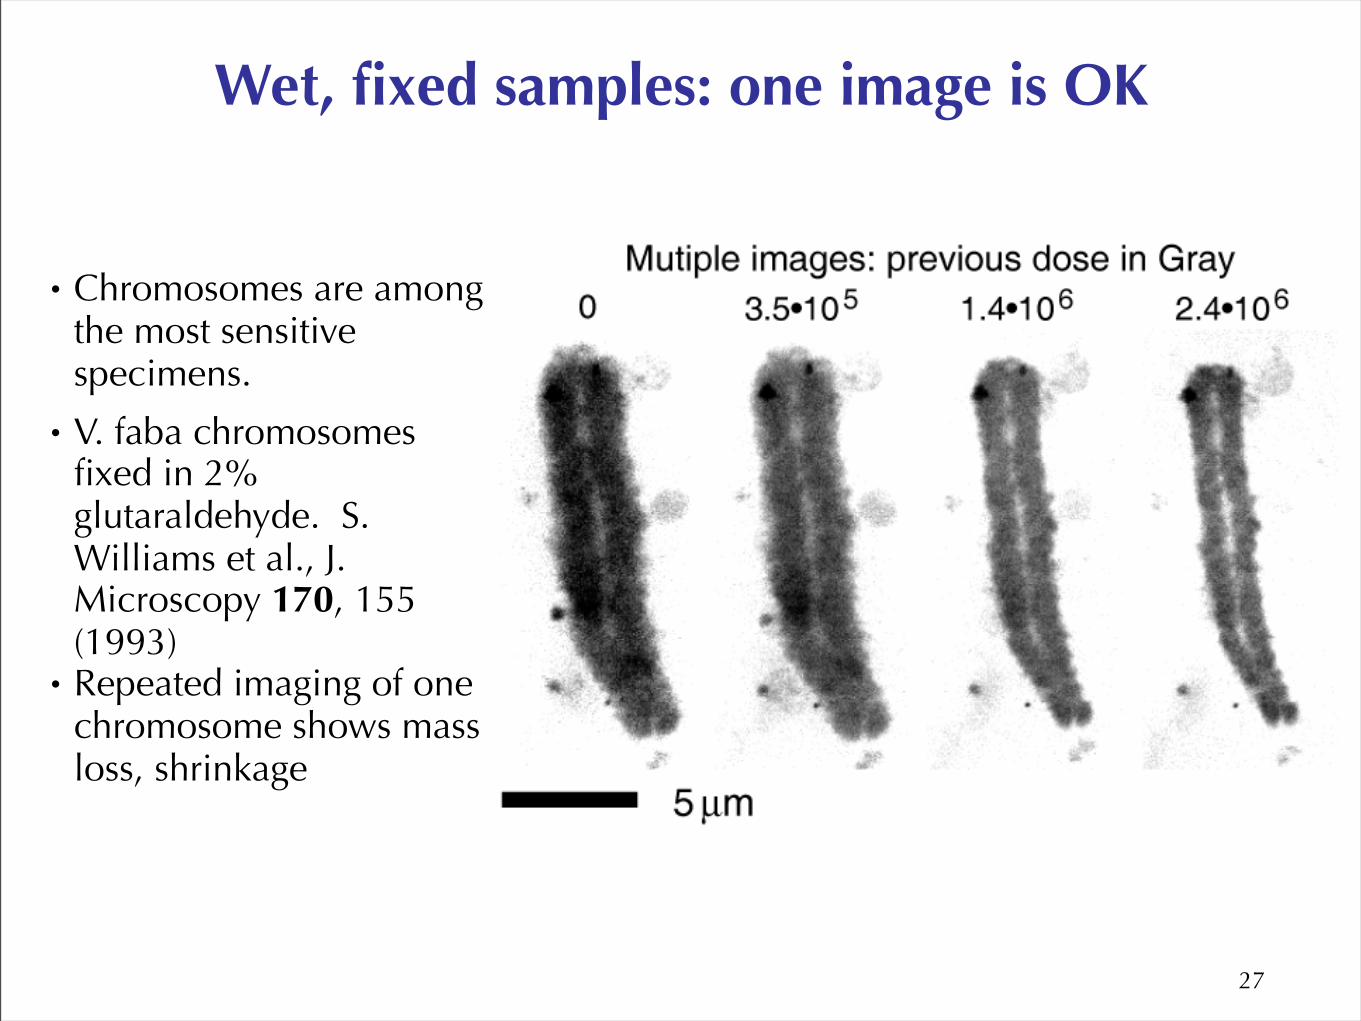
Wet, fixed samples: one image is OK
• Chromosomes are among the most sensitive specimens.
• V. faba chromosomes fixed in 2% glutaraldehyde. S. Williams et al., J. Microscopy 170, 155 (1993)
• Repeated imaging of one chromosome shows mass loss, shrinkage
28
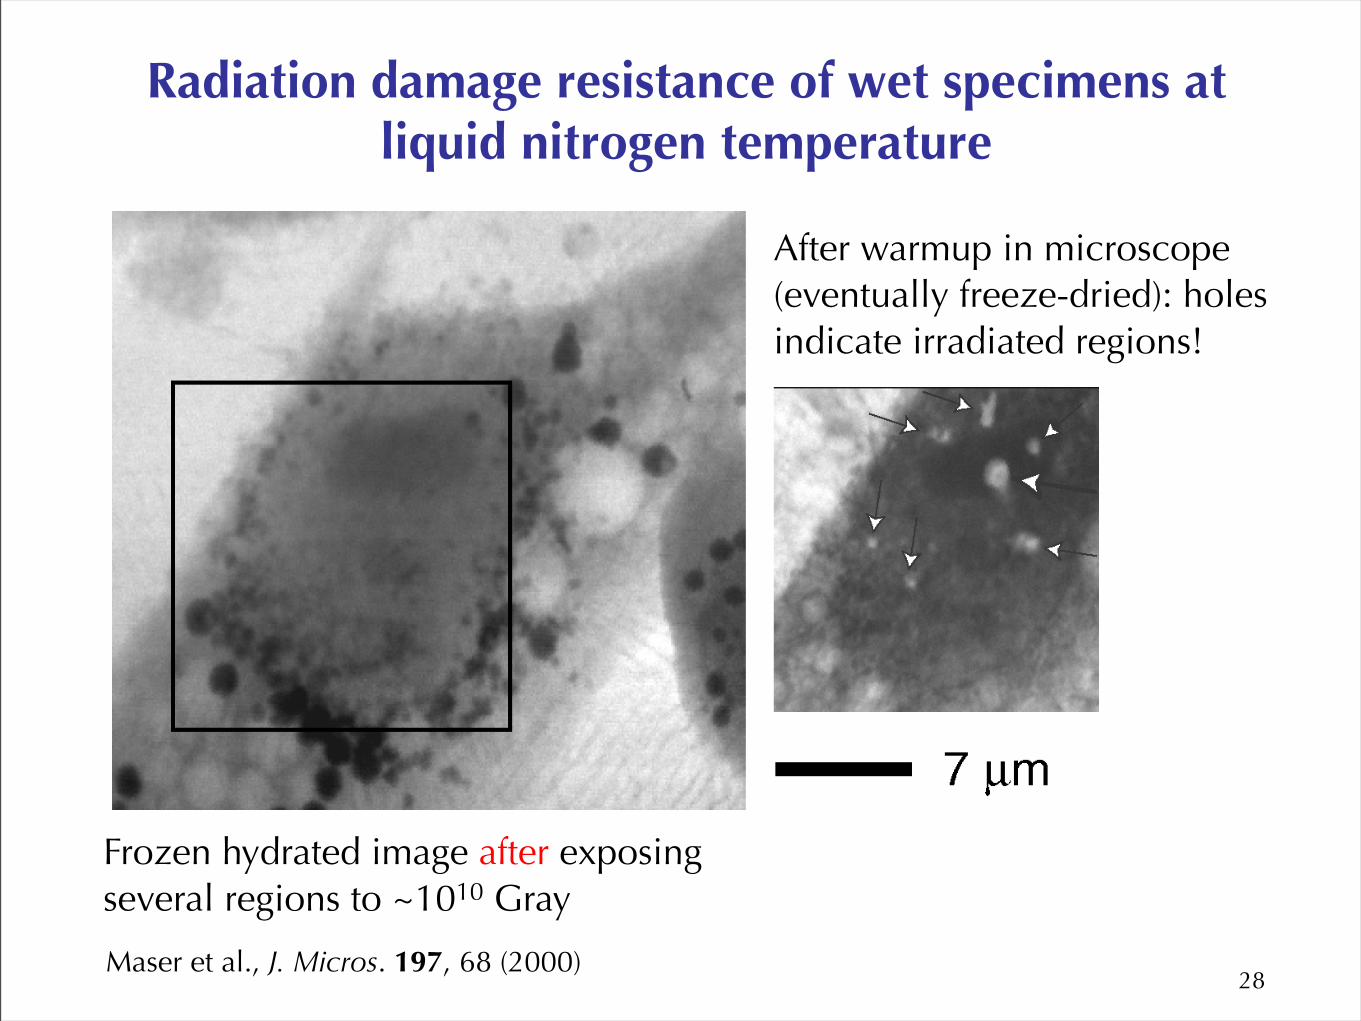
Radiation damage resistance of wet specimens at liquid nitrogen temperature
Frozen hydrated image after exposing several regions to ~1010 Gray
After warmup in microscope (eventually freeze-dried): holes indicate irradiated regions!
Maser et al., J. Micros. 197, 68 (2000)
Cryo specimen preparation• Ice crystals create a “Swiss cheese” effect above -135°C.
For hydrated samples: if you’re born cold, stay cold!
• Possible future approach: mount delicate sample in a cartridge once, and move cartridge from technique to technique.
• Evaluation of specimen quality: cryo light microscopy (gives new science opportunities!), lab x-ray source for checking for ice crystallization diffraction rings.
• Specimen preselection: indexing between cryo light microscope and x-ray/IR microscopes and nanoprobes.
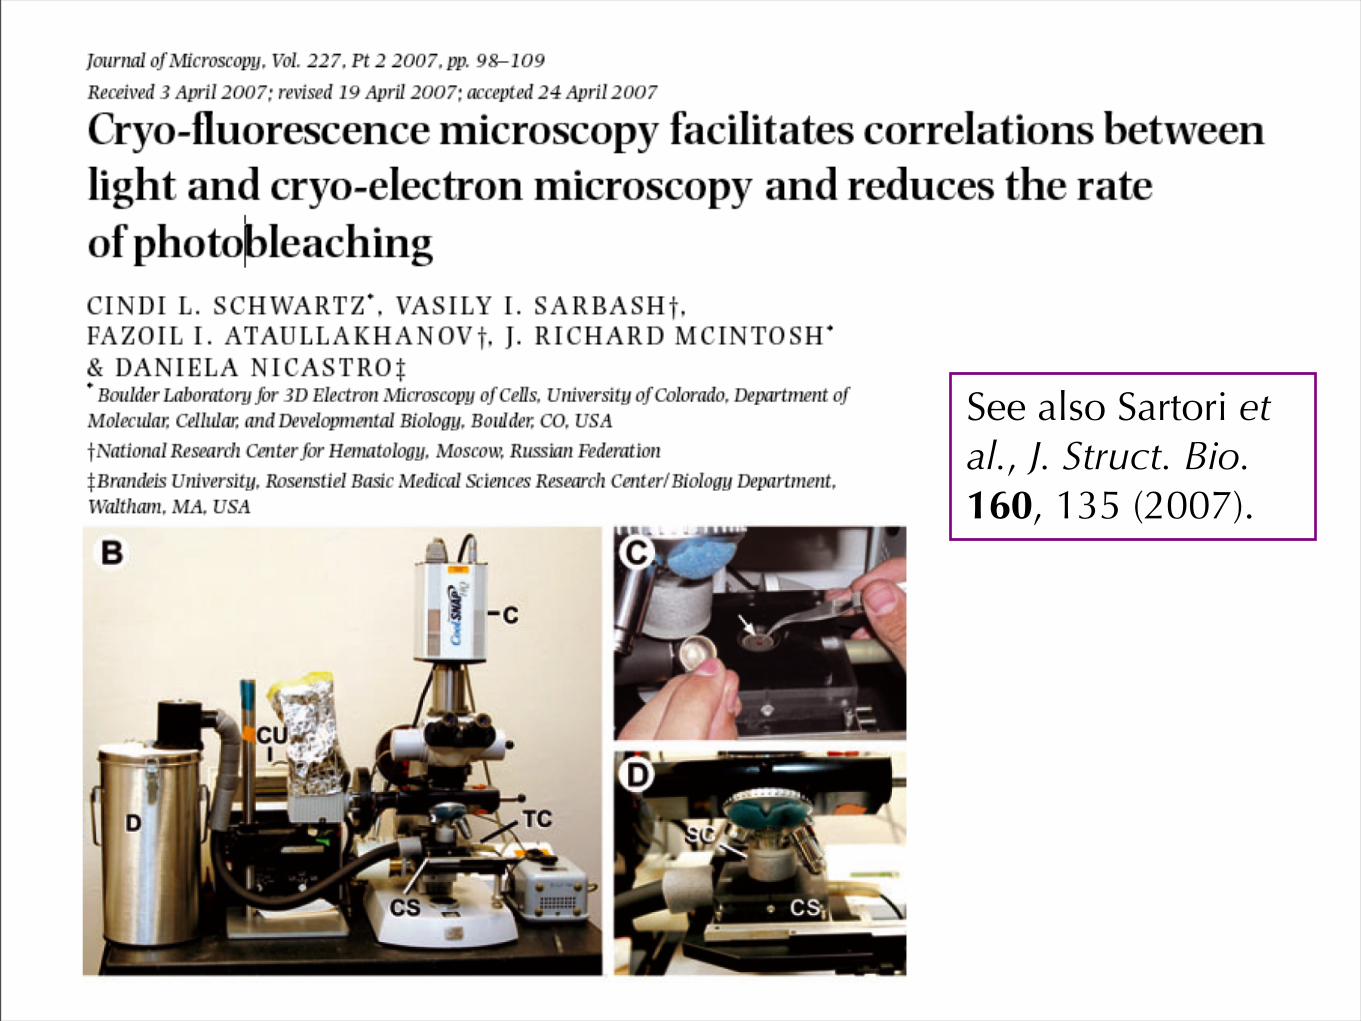
See also Sartori et al., J. Struct. Bio. 160, 135 (2007).
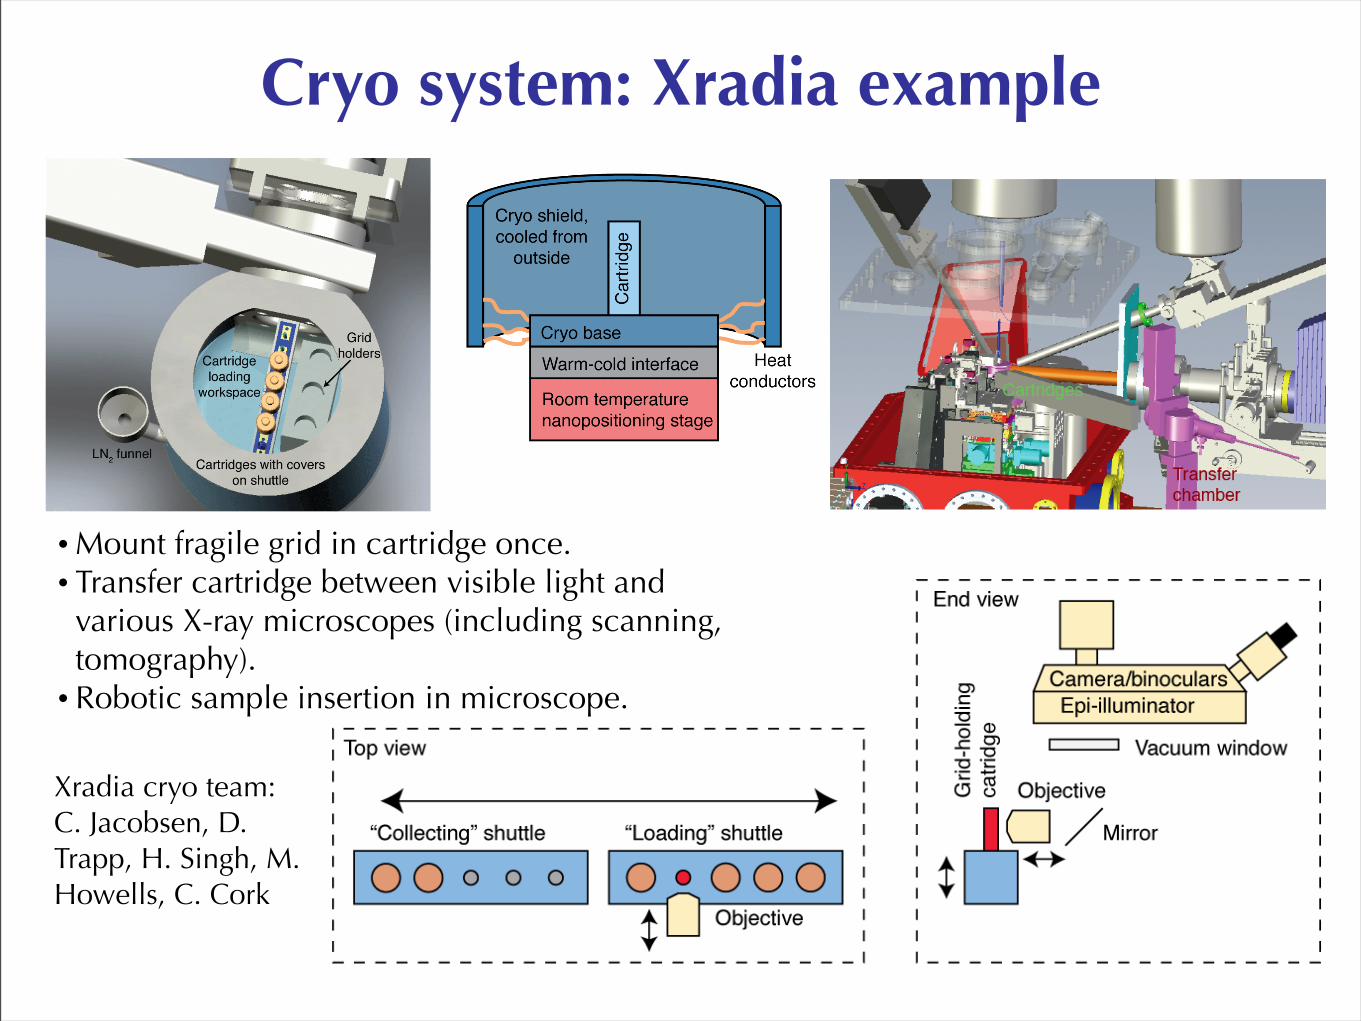
Cryo system: Xradia example
•Mount fragile grid in cartridge once.• Transfer cartridge between visible light and
various X-ray microscopes (including scanning, tomography).• Robotic sample insertion in microscope.
Xradia cryo team: C. Jacobsen, D. Trapp, H. Singh, M. Howells, C. Cork
Getting the most bang per photon
• Use the strongest contrast mechanism (for example, phase contrast).
• Use the most efficient optical system (scanning, or lensless).
• Make the sample as robust as possible (cryo).
• Extract your information from complex data.
32
33
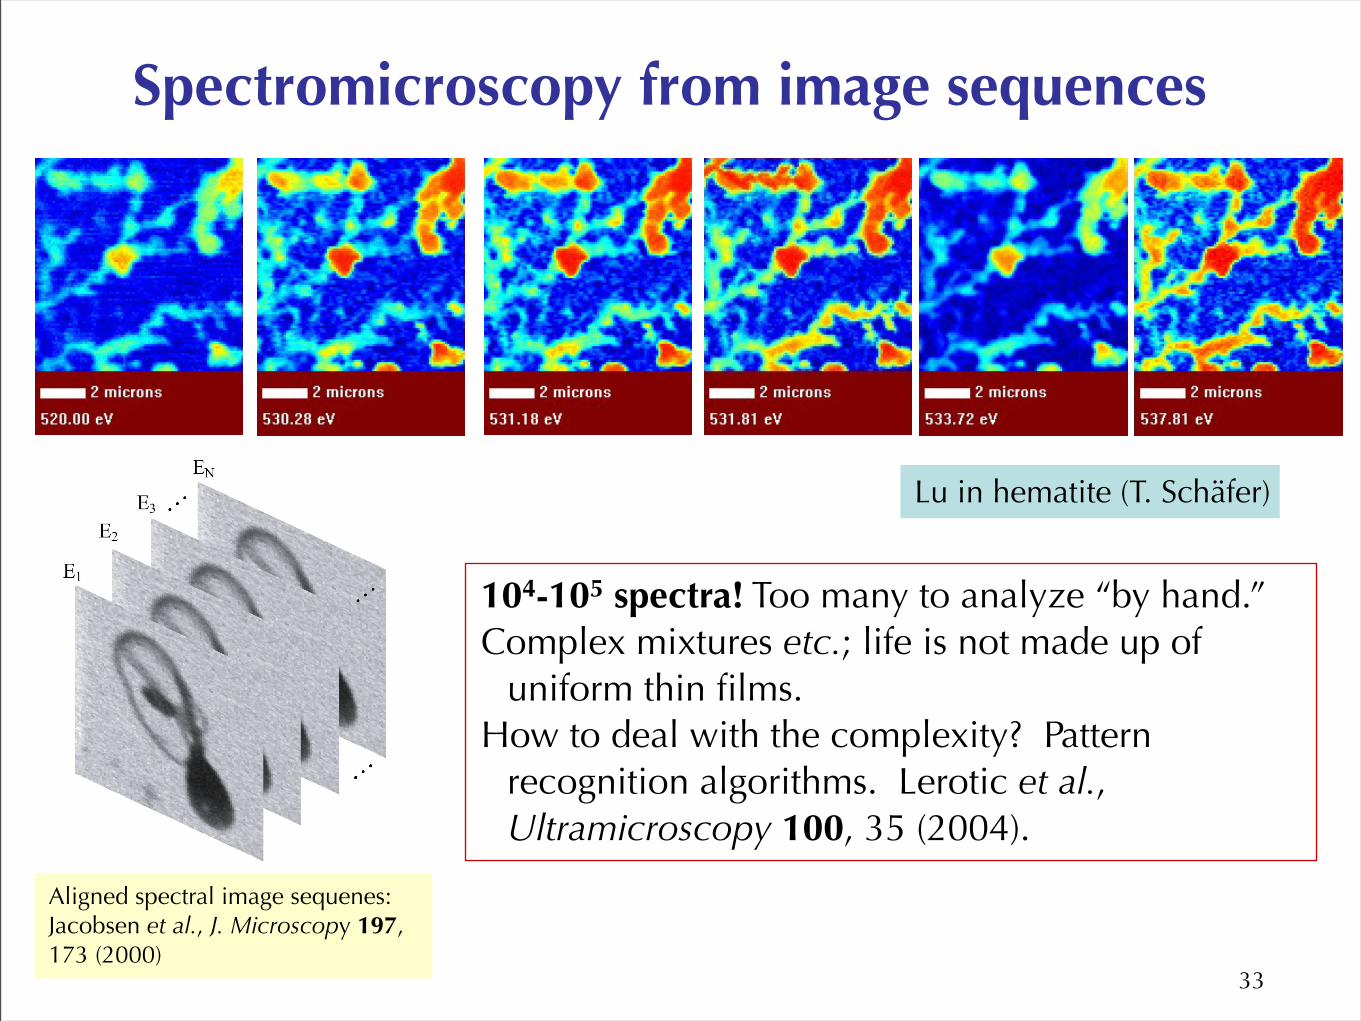
Spectromicroscopy from image sequences
Lu in hematite (T. Schäfer)
104-105 spectra! Too many to analyze “by hand.”Complex mixtures etc.; life is not made up of
uniform thin films.How to deal with the complexity? Pattern
recognition algorithms. Lerotic et al., Ultramicroscopy 100, 35 (2004).
Aligned spectral image sequenes: Jacobsen et al., J. Microscopy 197, 173 (2000)
34
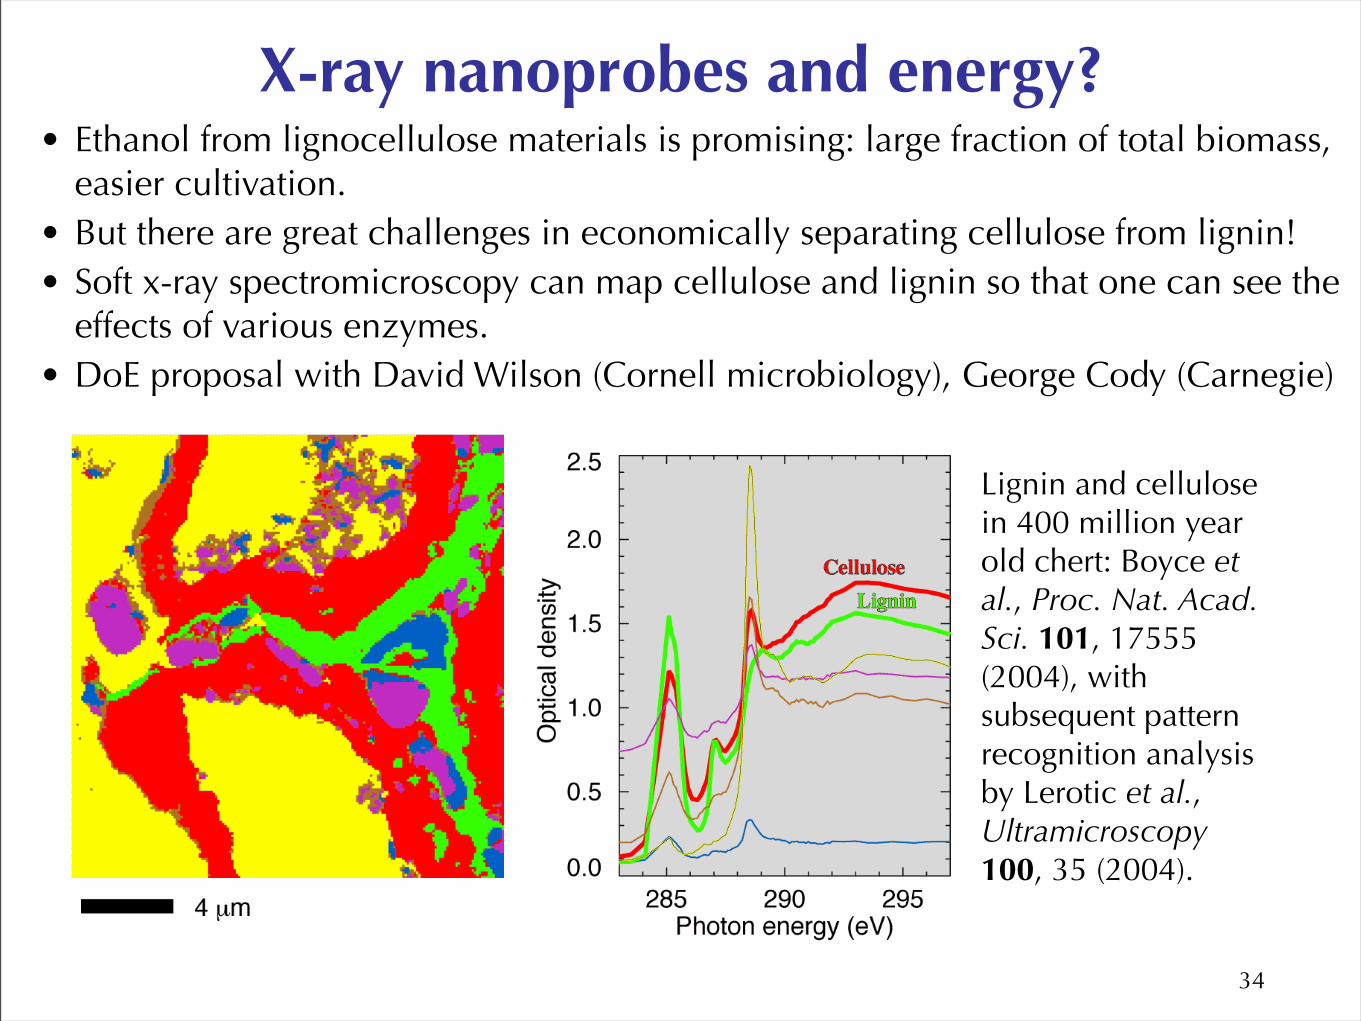
X-ray nanoprobes and energy?• Ethanol from lignocellulose materials is promising: large fraction of total biomass,
easier cultivation.• But there are great challenges in economically separating cellulose from lignin!• Soft x-ray spectromicroscopy can map cellulose and lignin so that one can see the
effects of various enzymes.• DoE proposal with David Wilson (Cornell microbiology), George Cody (Carnegie)
Lignin and cellulose in 400 million year old chert: Boyce et al., Proc. Nat. Acad. Sci. 101, 17555 (2004), with subsequent pattern recognition analysis by Lerotic et al., Ultramicroscopy 100, 35 (2004).
35
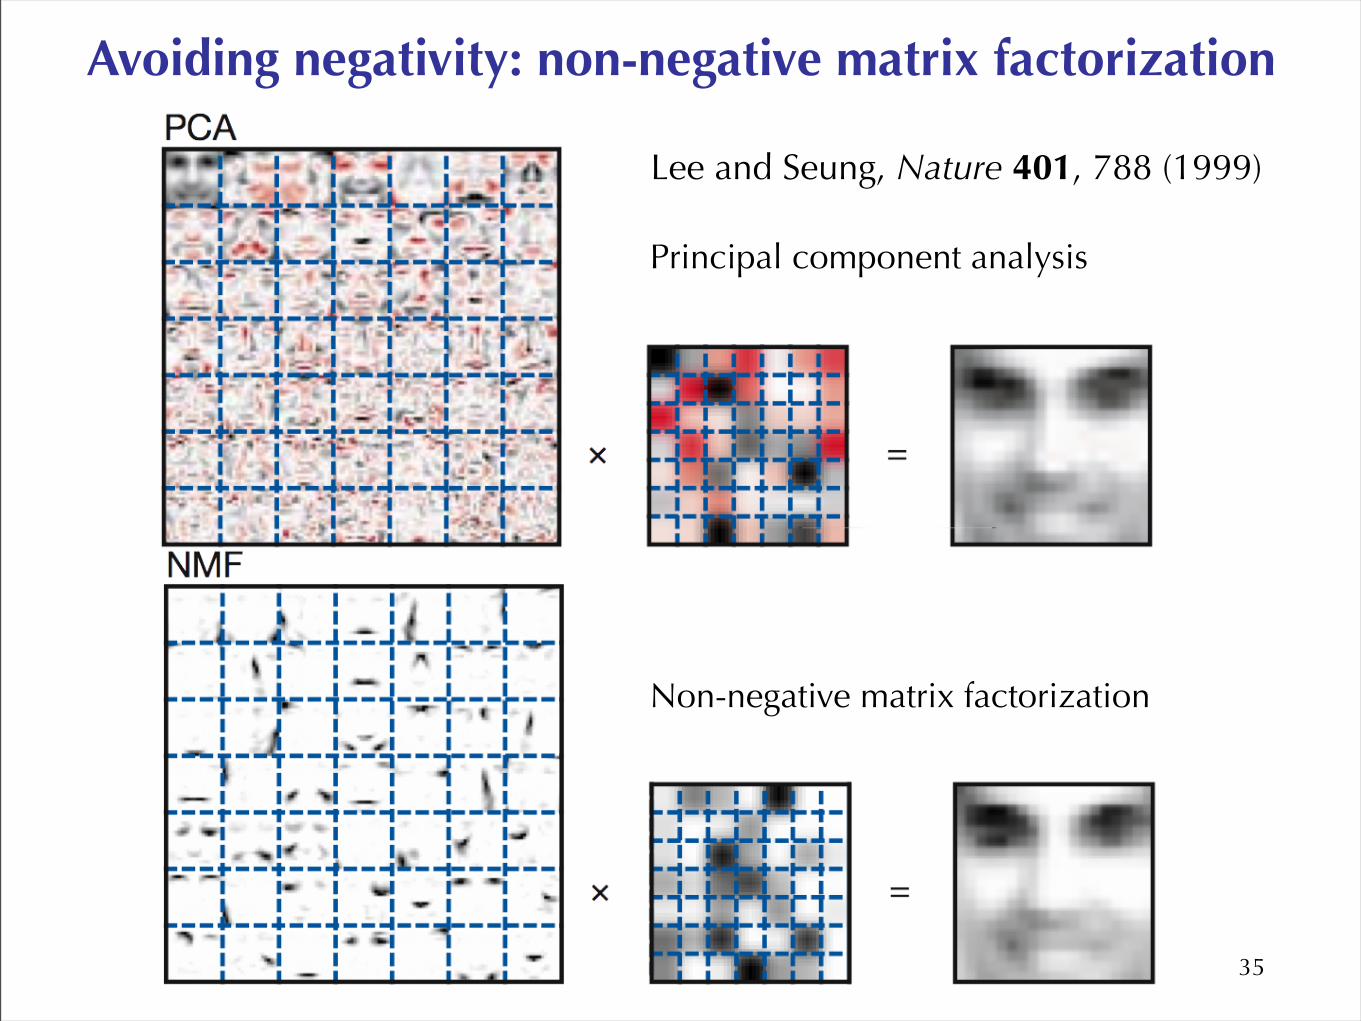
Avoiding negativity: non-negative matrix factorization
Principal component analysis
Non-negative matrix factorization
Lee and Seung, Nature 401, 788 (1999)
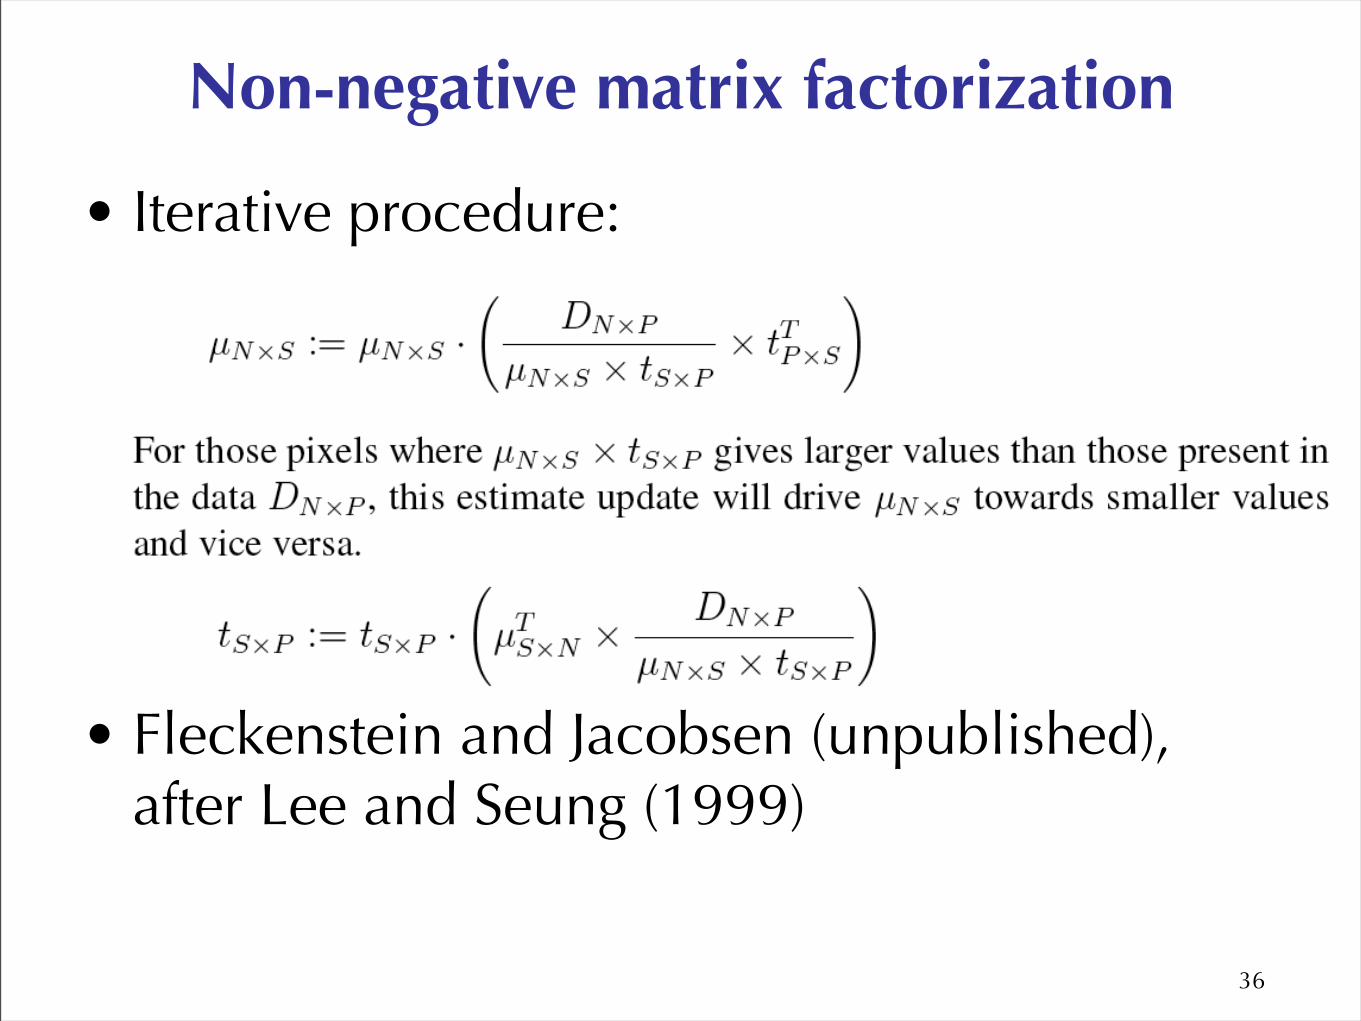
Non-negative matrix factorization
• Iterative procedure:
• Fleckenstein and Jacobsen (unpublished), after Lee and Seung (1999)
36
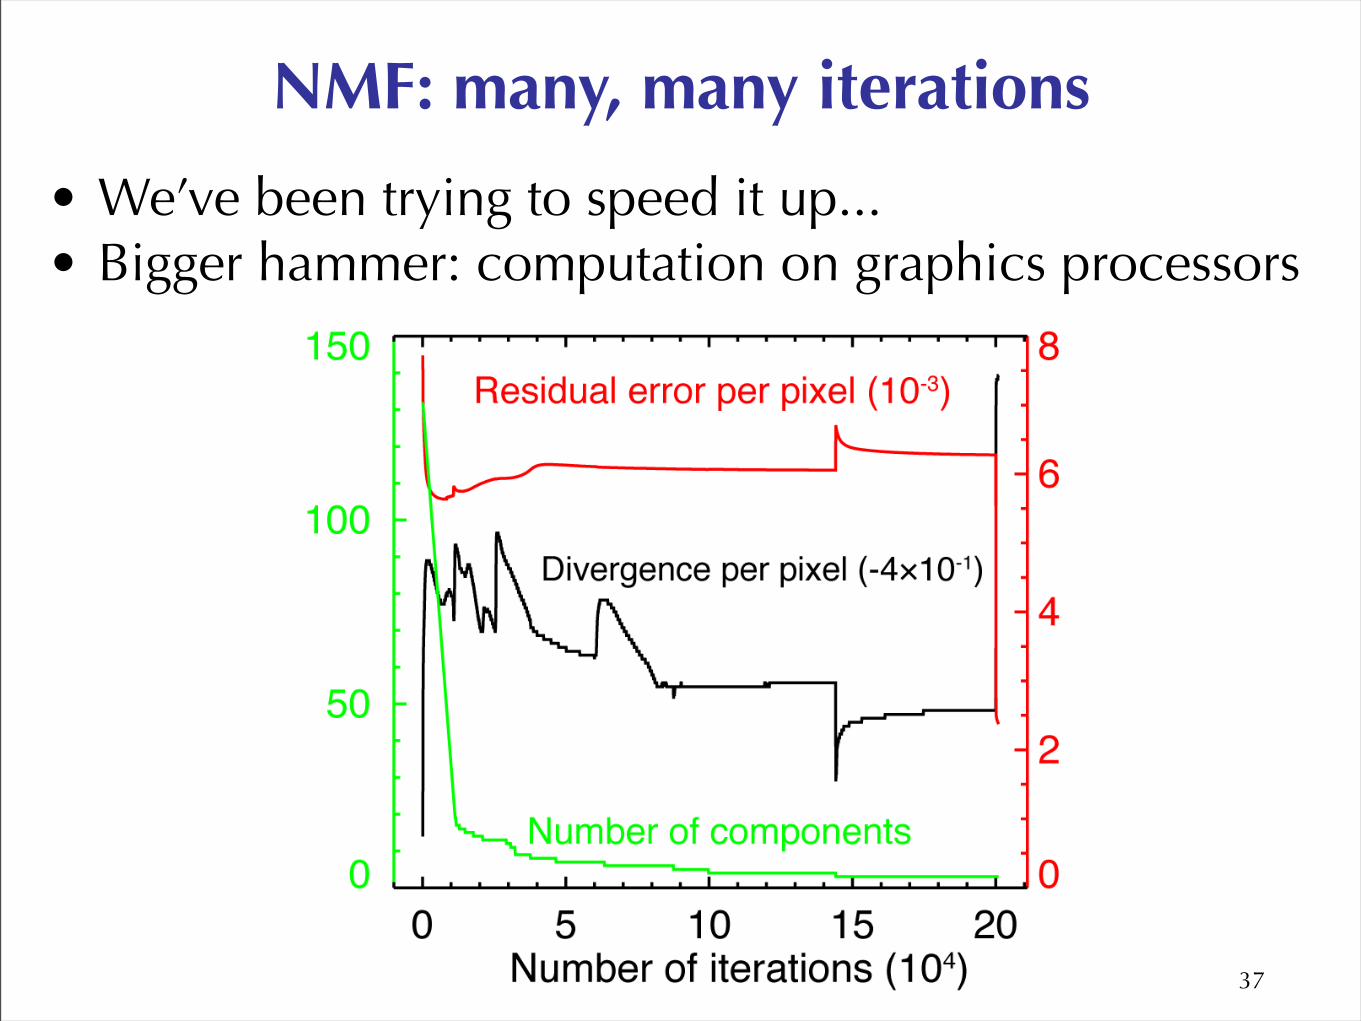
NMF: many, many iterations
• We’ve been trying to speed it up...• Bigger hammer: computation on graphics processors
37

Wood data: Michette, Phanopolous et al.
38
Getting the most bang per photon
• Use the strongest contrast mechanism (for example, phase contrast).
• Use the most efficient optical system (scanning, or lensless).
• Make the sample as robust as possible (cryo).
• Extract your information from complex data.
39
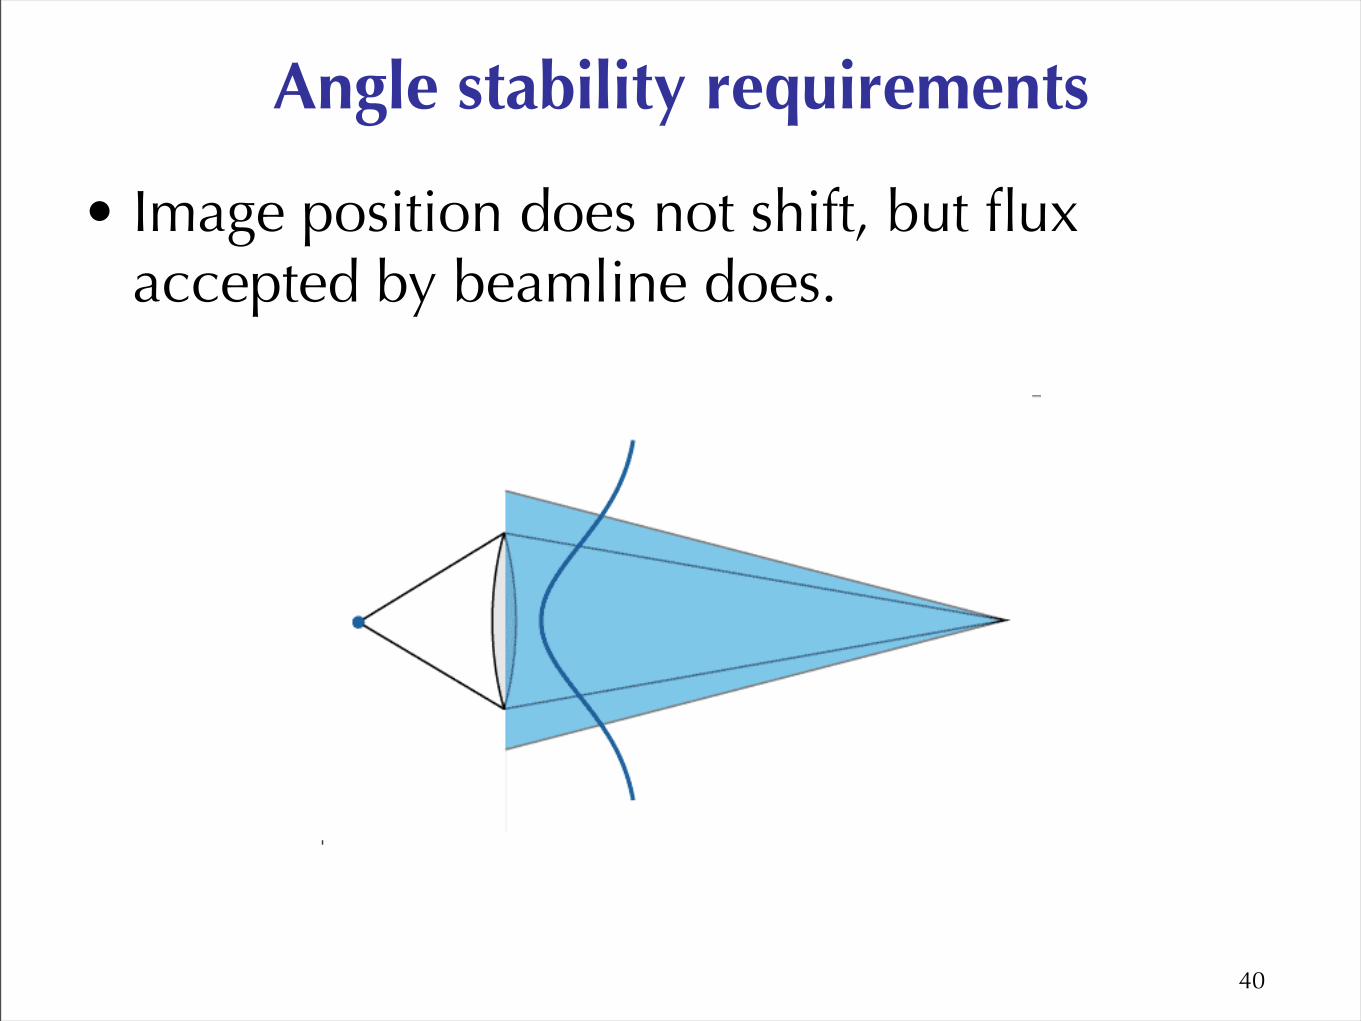
Angle stability requirements
• Image position does not shift, but flux accepted by beamline does.
40
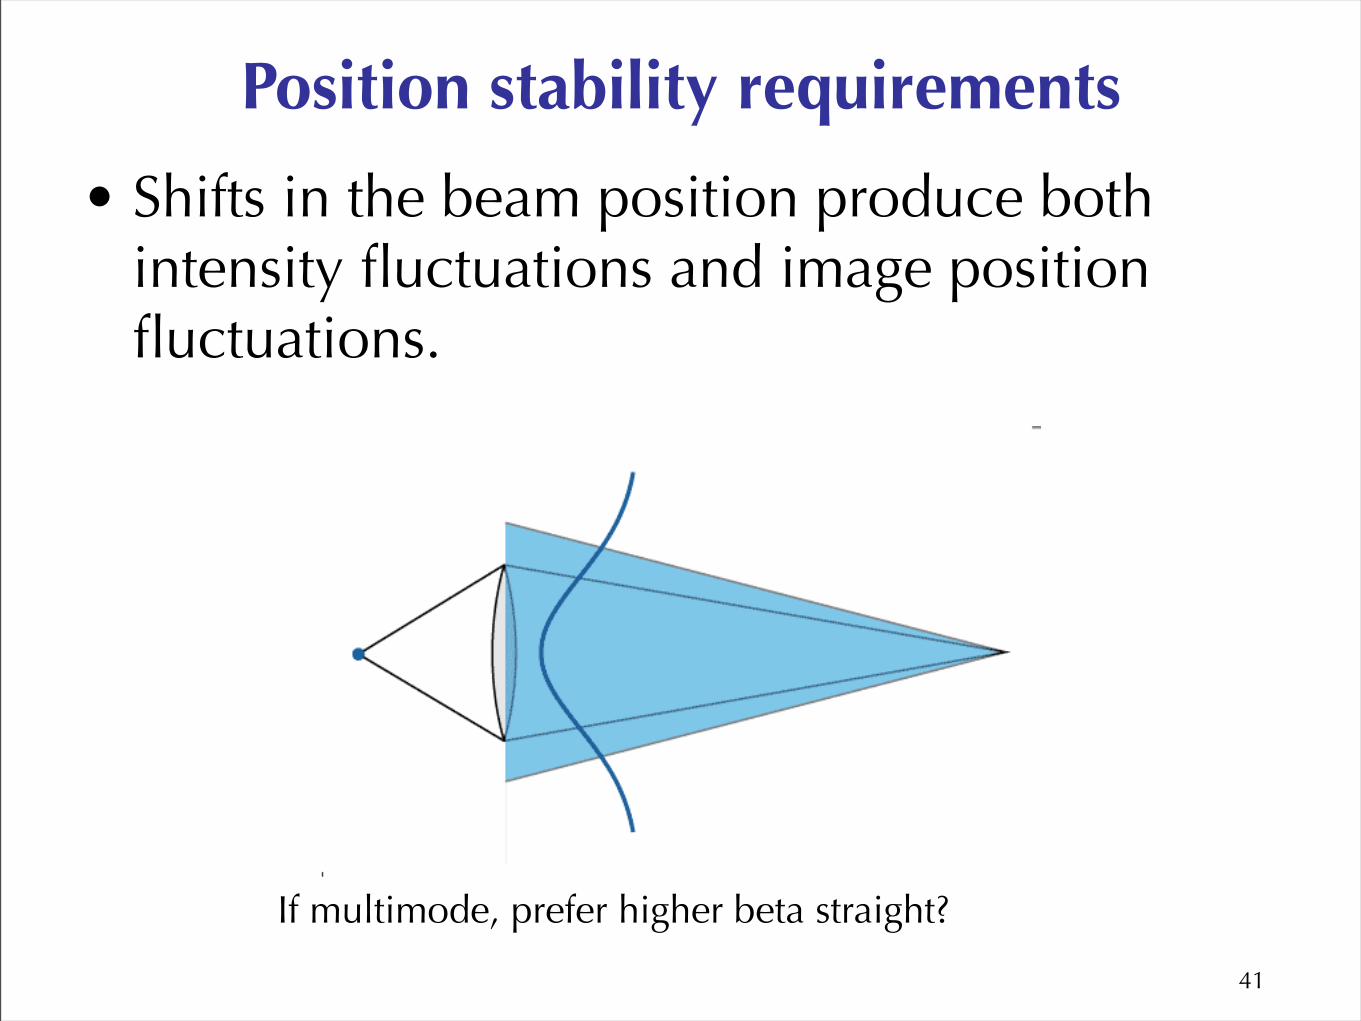
Position stability requirements
• Shifts in the beam position produce both intensity fluctuations and image position fluctuations.
41
If multimode, prefer higher beta straight?