Nanoparticles Loaded Biopolymer as Effective … PAPER Nanoparticles Loaded Biopolymer as Effective...
13
ORIGINAL PAPER Nanoparticles Loaded Biopolymer as Effective Adsorbent for Adsorptive Removal of Malachite Green from Aqueous Solution Nirav P. Raval 1 & Prapti U. Shah 1 & Nisha K. Shah 2 Received: 21 January 2016 /Accepted: 21 April 2016 /Published online: 12 May 2016 # Springer Science+Business Media Singapore 2016 Abstract In the present study, the biocompatible nanocom- posite (nickel oxide nanoparticles loaded chitin beads (NiO NPs/CH)) was synthesized, characterized by using scanning electron microscopy (SEM) and Fourier transform infrared (FT–IR) analysis and then study its prospective application towards adsorption of malachite green (MG) dye. Further, batch studies were conducted to evaluate the adsorption ca- pacity of nanocomposite, and the effects of various parame- ters, i.e., pH, adsorbate concentration, contact time, dosage of adsorbent and temperature, were investigated. The results re- vealed that the amount of MG adsorbed on the adsorbent increases with increasing initial dye concentration and by de- creasing temperature. The equilibrium MG adsorption data on NiO NPs/CH were best described by the Langmuir isotherm model. Besides, the adsorption kinetics followed pseudo- second-order rate equation. Thermodynamic parameters such as free energy of adsorption (ΔG°), enthalpy (ΔH°), and en- tropy (ΔS°) changes were calculated, and the results sug- gested that the adsorption process was spontaneous and exo- thermic in nature. Based on the results, it was concluded that the nanocomposite can be sustainably prepared and efficiently used for the adsorptive removal of MG from colored aqueous solutions. Keywords Nickel oxide . Chitin beads . Nanoparticles . Nanocomposite . Malachite green . Sustainably Introduction Malachite green (MG) is a water soluble cationic dye that appears as crystalline green powder and it belongs to triphe- nylmethane category. Though the use of this dye has been banned in several countries and not approved by US Food and Drug Administration, still it is extensively used for the dyeing of cotton, jute, paper, silk, wool, and leather products in many parts of the world. In addition, it is also used as an antiseptic and fungicidal for humans, and as anti-parasitical, antibacterial, and antifungal in aquaculture and commercial fish hatchery industries due to its low cost, ready availability, efficacy, and deficiency of proper substitute [1]. Due to its mutagenic and carcinogenic nature, it can cause severe effects on the nervous system, reproductive system, liver, brain, and kidney [2, 3]. Apart from causing undesirable health effects, the presence of even very low concentration of MG in the aqueous environment can color large water bodies which de- crease photosynthesis by obstructing light penetration and thereby inhibit the growth of aquatic life [4]. Hence, proper treatment of effluent containing MG dye is extremely neces- sary for the protection of environment and other living organisms. Many treatment technologies have been applied in order to decolorize MG from an aqueous medium such as coag- ulation–flocculation [5, 6], biodegradation [7], photocata- lytic degradation [8], sonochemical and sonophotocatalytic degradation [9–11], ozonation [12], and Fenton reagent [ 13 – 16 ]. Among all these techniques, adsorption is regarded as simple, economically manageable, and desir- able process for the treatment of industrial effluent due to its high efficiency and ability to separate a wide range of pollutants. Adsorption on activated carbon has been found to be an effective process for removal of dyes, but it was an expensive process as both regeneration and disposal of the * Nisha K. Shah [email protected] 1 Department of Environmental Science, School of Sciences, Gujarat University, Ahmedabad, Gujarat 380 009, India 2 Department of Chemistry, School of Sciences, Gujarat University, Ahmedabad, Gujarat 380 009, India Water Conserv Sci Eng (2016) 1:69–81 DOI 10.1007/s41101-016-0004-0
Transcript of Nanoparticles Loaded Biopolymer as Effective … PAPER Nanoparticles Loaded Biopolymer as Effective...
ORIGINAL PAPER
Nanoparticles Loaded Biopolymer as Effective Adsorbentfor Adsorptive Removal of Malachite Greenfrom Aqueous Solution
Nirav P. Raval1 & Prapti U. Shah1& Nisha K. Shah2
Received: 21 January 2016 /Accepted: 21 April 2016 /Published online: 12 May 2016# Springer Science+Business Media Singapore 2016
Abstract In the present study, the biocompatible nanocom-posite (nickel oxide nanoparticles loaded chitin beads (NiONPs/CH)) was synthesized, characterized by using scanningelectron microscopy (SEM) and Fourier transform infrared(FT–IR) analysis and then study its prospective applicationtowards adsorption of malachite green (MG) dye. Further,batch studies were conducted to evaluate the adsorption ca-pacity of nanocomposite, and the effects of various parame-ters, i.e., pH, adsorbate concentration, contact time, dosage ofadsorbent and temperature, were investigated. The results re-vealed that the amount of MG adsorbed on the adsorbentincreases with increasing initial dye concentration and by de-creasing temperature. The equilibriumMG adsorption data onNiO NPs/CH were best described by the Langmuir isothermmodel. Besides, the adsorption kinetics followed pseudo-second-order rate equation. Thermodynamic parameters suchas free energy of adsorption (ΔG°), enthalpy (ΔH°), and en-tropy (ΔS°) changes were calculated, and the results sug-gested that the adsorption process was spontaneous and exo-thermic in nature. Based on the results, it was concluded thatthe nanocomposite can be sustainably prepared and efficientlyused for the adsorptive removal of MG from colored aqueoussolutions.
Keywords Nickel oxide . Chitin beads . Nanoparticles .
Nanocomposite .Malachite green . Sustainably
Introduction
Malachite green (MG) is a water soluble cationic dye thatappears as crystalline green powder and it belongs to triphe-nylmethane category. Though the use of this dye has beenbanned in several countries and not approved by US Foodand Drug Administration, still it is extensively used for thedyeing of cotton, jute, paper, silk, wool, and leather productsin many parts of the world. In addition, it is also used as anantiseptic and fungicidal for humans, and as anti-parasitical,antibacterial, and antifungal in aquaculture and commercialfish hatchery industries due to its low cost, ready availability,efficacy, and deficiency of proper substitute [1]. Due to itsmutagenic and carcinogenic nature, it can cause severe effectson the nervous system, reproductive system, liver, brain, andkidney [2, 3]. Apart from causing undesirable health effects,the presence of even very low concentration of MG in theaqueous environment can color large water bodies which de-crease photosynthesis by obstructing light penetration andthereby inhibit the growth of aquatic life [4]. Hence, propertreatment of effluent containing MG dye is extremely neces-sary for the protection of environment and other livingorganisms.
Many treatment technologies have been applied in orderto decolorize MG from an aqueous medium such as coag-ulation–flocculation [5, 6], biodegradation [7], photocata-lytic degradation [8], sonochemical and sonophotocatalyticdegradation [9–11], ozonation [12], and Fenton reagent[13–16]. Among all these techniques, adsorption isregarded as simple, economically manageable, and desir-able process for the treatment of industrial effluent due toits high efficiency and ability to separate a wide range ofpollutants. Adsorption on activated carbon has been foundto be an effective process for removal of dyes, but it was anexpensive process as both regeneration and disposal of the
* Nisha K. [email protected]
1 Department of Environmental Science, School of Sciences, GujaratUniversity, Ahmedabad, Gujarat 380 009, India
2 Department of Chemistry, School of Sciences, Gujarat University,Ahmedabad, Gujarat 380 009, India
Water Conserv Sci Eng (2016) 1:69–81DOI 10.1007/s41101-016-0004-0

used carbon are often very difficult. Thus, it was a neces-sity to identify and develop easily available, economicallyviable, and highly effective adsorbent for efficient and fac-ile removal of dye.
In recent time, use of biopolymers is increasing for theremoval of dye from wastewater. Chitin (poly [β–(1→4)–2–acetamido–2–deoxy–β–D–glucopyranose]), a poly-mer of N–acetyl–D–glucosamine, is the most frequentlyfound natural biopolymer in the exoskeleton of marineinvertebrates such as shrimps, crabs, prawns, and lobsters.This biopolymer exhibits a high biodegradability, non-toxicity, and adsorption properties [17]. Nickel oxide(NiO) is an important transition metal oxide which canbe employed in various fields due to its chemical andthermal stability and environmental benignity [18].Composites and nanocomposites, refer to materialsconsisting of at least two phases with one dispersed inanother that is called matrix, have attracted increasingresearch attention. Composites of polymers and nanopar-ticles can provide many synergistic properties, which aredifficult to attain from individual components [19]. In thiscontext, nanocomposite of chitin, a natural biopolymer,and nickel oxide nanoparticle, an important transitionalmetal oxide, has been synthesized.
In developing countries due to the scarcity of the waterresources, it is essential to conserve the water. But on thecontrary for their growth, the industrial development isrequired and hence during the various industrial processes,immense quantity of wastewater is generated. If this waste-water is not treated properly and discharged, then it causespollution of the natural water streams. Thus, wastewaterreuse is an important strategy for conserving water re-sources. There are various advantages associated with thereuse of wastewater such as reduction in consumption offresh water, disposal problem which ultimately leads to thesecondary pollution of the receiving water bodies, as wellas associated treatment cost. In addition, properly treatedwastewater can also be used for various purposes like toiletflushing, cooling water, and other applications. But, for thereuse of wastewater, it should be properly treated withoutcreating more pollution.
Therefore, the aim of this study was to synthesize and char-acterize nickel oxide nanoparticles loaded chitin beads (NiONPs/CH) nanocomposite. To the best of our knowledge, therewas no previous literature report regarding the use of suchbiopolymer/nanoparticle composite for the removal of MGdye aqueous media. Thus, the application of nanocompositefor the removal of MG from aqueous solutions was investi-gated by the influence of different system variables, i.e., solu-tion pH, initial dye concentration, contact time between adsor-bate and adsorbent, adsorbent dosage, and temperature, andthe adsorption capacity of the nanocomposite for MG hasbeen evaluated as well as the equilibrium isotherms,
adsorption kinetics, and thermodynamics studies were alsoperformed.
Materials and Methods
MG dye, chitin powder, and other reagents used in thiswork were purchased from ACS Chemicals Pvt. Ltd.,Ahmedabad. All the chemicals were of analytical reagentgrade and used as such without further purification.Malachite green oxalate [C.I. = 42,000, CAS num-ber = 123333-61-9, λmax = 618 nm] has a chemical formulaof C52H54N4O12 with molecular weight of 927.00 g/mol.The molecular structures of MG (a) and chitin (b) are il-lustrated in Fig. 1. Deionized and distilled water were usedto prepare all solutions. The MG stock solution was pre-pared by dissolving an accurately weighed quantity of dyein deionized water and was subsequently diluted to therequired concentrations.
Synthesis of Adsorbent (NiO NPs Loaded CH Beads)
The adsorbent was prepared by the simple precipitation meth-od. In this method, initially, chitin solution was prepared bydissolving chitin powder in N,N-dimethylacetamide/5 % lith-ium chloride (LiCl) solvent system. In this viscous chitin so-lution, 0.5 g of nickel oxide nanoparticles, which were syn-thesized, purified, and characterized by previous reportedroutes [20, 21], was added. The solution was then stirred for1 h at 50 °C. After cooling, nickel oxide nanoparticle contain-ing chitin solution was added drop-wise into 100 mL of non-solvent coagulant, ethanol, to form spherical uniform beadsloaded with NiO NPs. The final product (NiO NPs/CH) nano-composite was filtered, rinsed several times with double-distilled water, and dried under vacuum. The dried adsorbentswere ground to fine powder for further characterization.
Fig. 1 Molecular structures of chitin (a) and malachite green oxalate (b)
70 Water Conserv Sci Eng (2016) 1:69–81
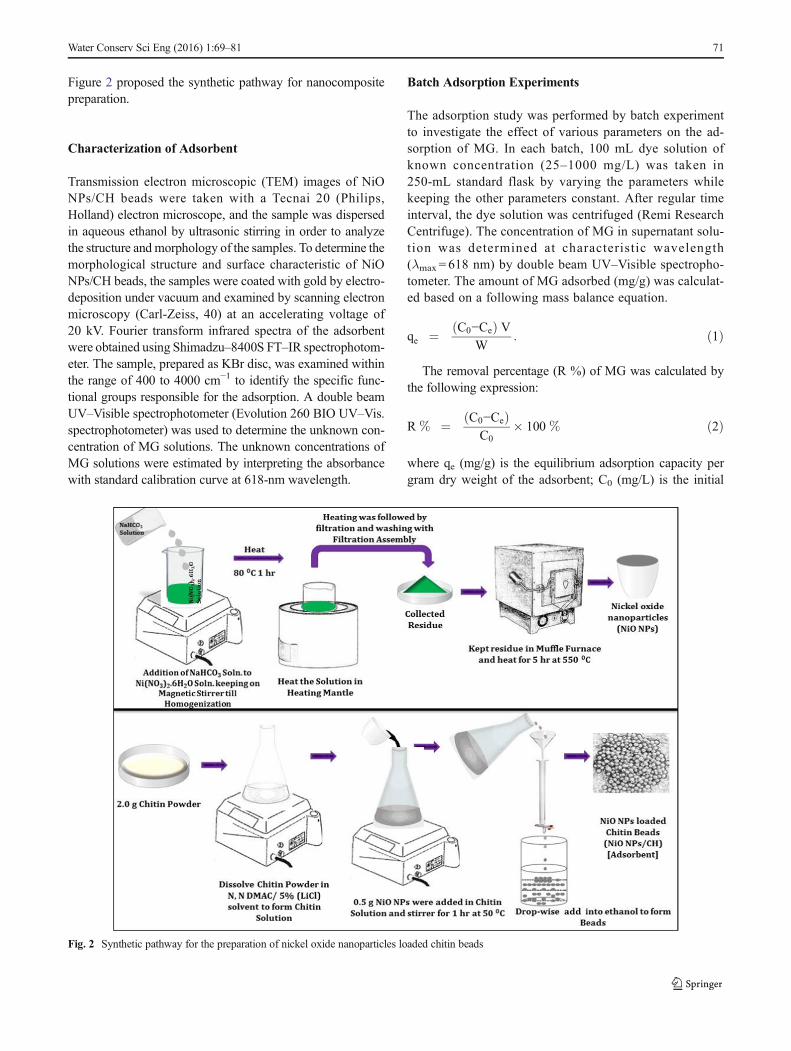
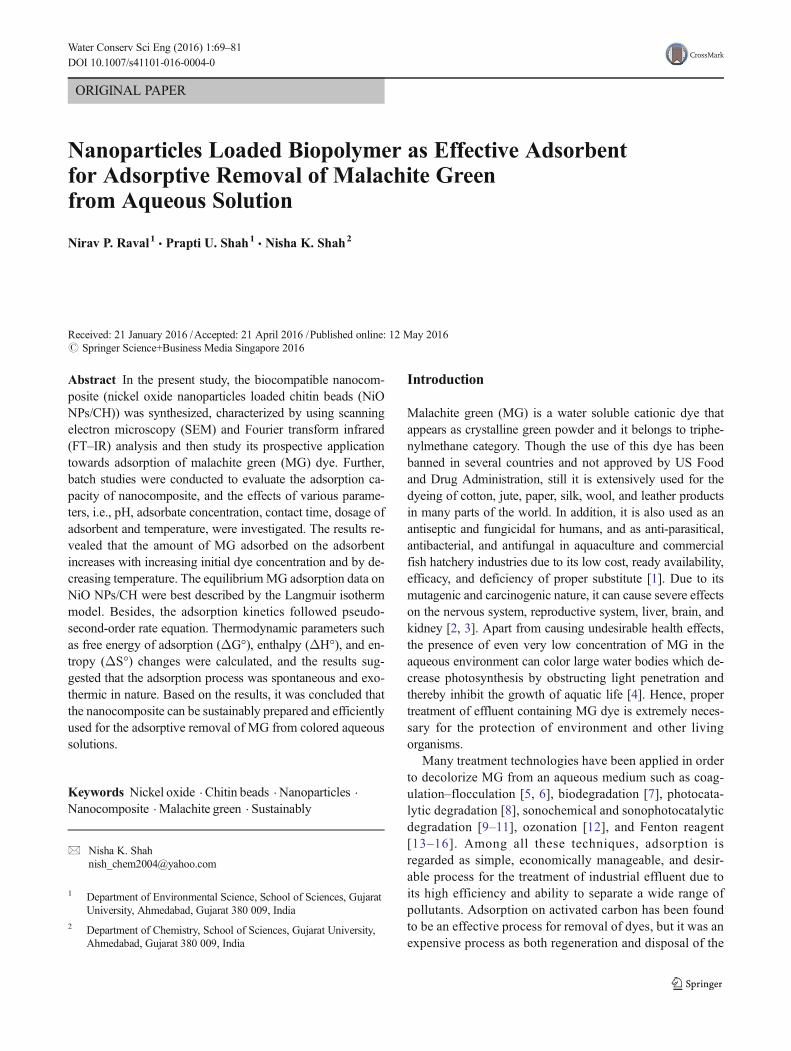
Figure 2 proposed the synthetic pathway for nanocompositepreparation.
Characterization of Adsorbent
Transmission electron microscopic (TEM) images of NiONPs/CH beads were taken with a Tecnai 20 (Philips,Holland) electron microscope, and the sample was dispersedin aqueous ethanol by ultrasonic stirring in order to analyzethe structure and morphology of the samples. To determine themorphological structure and surface characteristic of NiONPs/CH beads, the samples were coated with gold by electro-deposition under vacuum and examined by scanning electronmicroscopy (Carl-Zeiss, 40) at an accelerating voltage of20 kV. Fourier transform infrared spectra of the adsorbentwere obtained using Shimadzu–8400S FT–IR spectrophotom-eter. The sample, prepared as KBr disc, was examined withinthe range of 400 to 4000 cm−1 to identify the specific func-tional groups responsible for the adsorption. A double beamUV–Visible spectrophotometer (Evolution 260 BIO UV–Vis.spectrophotometer) was used to determine the unknown con-centration of MG solutions. The unknown concentrations ofMG solutions were estimated by interpreting the absorbancewith standard calibration curve at 618-nm wavelength.
Batch Adsorption Experiments
The adsorption study was performed by batch experimentto investigate the effect of various parameters on the ad-sorption of MG. In each batch, 100 mL dye solution ofknown concentration (25–1000 mg/L) was taken in250-mL standard flask by varying the parameters whilekeeping the other parameters constant. After regular timeinterval, the dye solution was centrifuged (Remi ResearchCentrifuge). The concentration of MG in supernatant solu-tion was determined at characteristic wavelength(λmax = 618 nm) by double beam UV–Visible spectropho-tometer. The amount of MG adsorbed (mg/g) was calculat-ed based on a following mass balance equation.
qe ¼ C0−Ceð Þ VW
: ð1Þ
The removal percentage (R %) of MG was calculated bythe following expression:
R % ¼ C0−Ceð ÞC0
� 100 % ð2Þ
where qe (mg/g) is the equilibrium adsorption capacity pergram dry weight of the adsorbent; C0 (mg/L) is the initial
Fig. 2 Synthetic pathway for the preparation of nickel oxide nanoparticles loaded chitin beads
Water Conserv Sci Eng (2016) 1:69–81 71
concentration of MG in the solution; Ce (mg/L) is the equilib-rium concentration of MG in the solution; V (mL) is the vol-ume of the dye solution; and W (mg) is the dry weight of thenanocomposite.
Desorption and Regeneration Experiments
In order to make the adsorption process economically morefeasible, the desorption efficiency and regeneration potentialof adsorbent were studied by repeated desorption/adsorptioncycles. Desorption studies were carried out by mixing 100 mgof the NiO NPs/CH beads with 100 mL of the dye solutions(100 mg/L). The mixture was shaken for 3 h at 120 rpm underroom temperature (35 °C). The composite was collected andwashed several times with distilled water to remove unab-sorbed MG. Further, MG-loaded beads were regenerated in100 mL of alcohol solution on a rotary shaker at 120 rpm; theconcentrations of MG in the elutes were determined to inves-tigate the desorption efficiency, and then it was washed withdistilled water until a neutral pH was obtained. The regener-ated adsorbent was reused in the next cycle of adsorptionexperiment.
Results and Discussion
Transmission Electron Microscope Study
The size and morphology of NiO nanoparticles integrated chi-tin beads have been identified by the transmission electronmicroscopic (TEM) studies as seen in Fig. 3. The TEM imageindicated the presence of dense agglomerates. The nanoparti-cles have a spherical shape with an average size of 25 nm, andtheir distribution was not uniform.
Scanning Electron Microscope Study
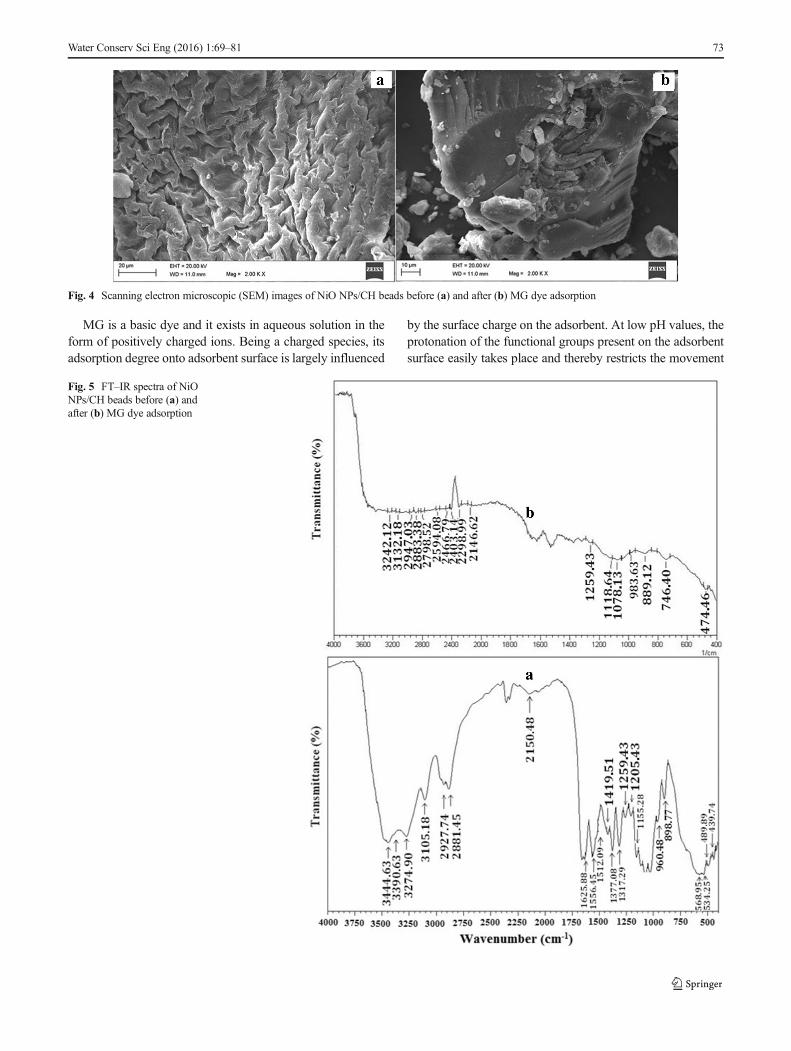
The results of the scanning electron microscopic (SEM) anal-yses of nanocomposite before (a) and after (b) MG adsorptionare illustrated in Fig. 4. The presence of nanoparticles in-creased the surface area of composite adsorbent, and thus,asymmetrical morphology and high number of aperture canbe observed before MG adsorption (Fig. 4a), which becomeseven, smooth, flat, and non-porous after dye adsorption asshown in (Fig. 4b). The difference in morphology of adsor-bent before and after adsorption of MG can be clearly studiedfrom the SEM analyses.
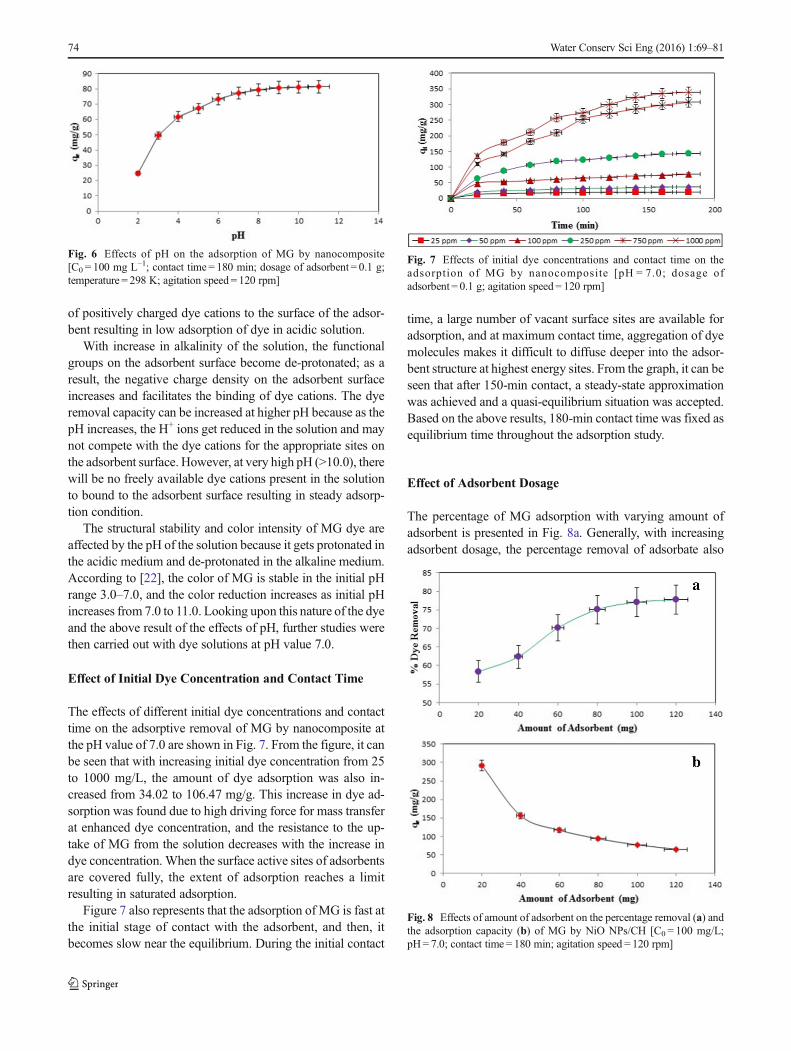
Fourier Transform Infrared Spectroscopic Study
FT–IR study was performed to in order to examine and iden-tify the surface groups of the adsorbent responsible for theadsorption of dye.
The FT–IR spectra of adsorbent (nickel oxide nanoparticlesloaded chitin beads) before (a) and after (b) dye adsorption areshown in Fig. 5. As shown in Fig. 5a, peaks observed aroundthe 3105.18 to 3444.63 cm−1 were attributed to stretchingvibration of hydroxyl groups of adsorbent which were shiftedand diminished to lower wave numbers after adsorption ofMG (Fig. 5b) and indicated the formation of hydrogen bondbetween adsorbate and –OH groups of adsorbent. The peak at2927.74 cm−1 shown in Fig. 5a was assigned to the C–Hstretching vibration of polymer backbone. There was a signif-icant decrease and shifting for this peak after MG adsorptionwhich reveals the interaction between adsorbent and dyecation.
Since, during the formation of composite (NiO NPs/CH),the interaction occurs between carbonyl oxygen of –NHCOCH3 group and metal ion (Ni). Hence, the characteris-tic peaks for the N–H bending vibration of the amide II bandand amide III band (located at 1556.45 and 1625.88 cm−1,respectively) reduced and shifted to lower wave numbers.The strong absorption band shown in Fig. 5a at 439.74 cm−1
was assigned to Ni–O stretching vibration. This was shiftedfrom 439.74 to 474.46 cm−1 and diminished due to the inter-action of nickel oxide with malachite green dye (Fig. 5b).
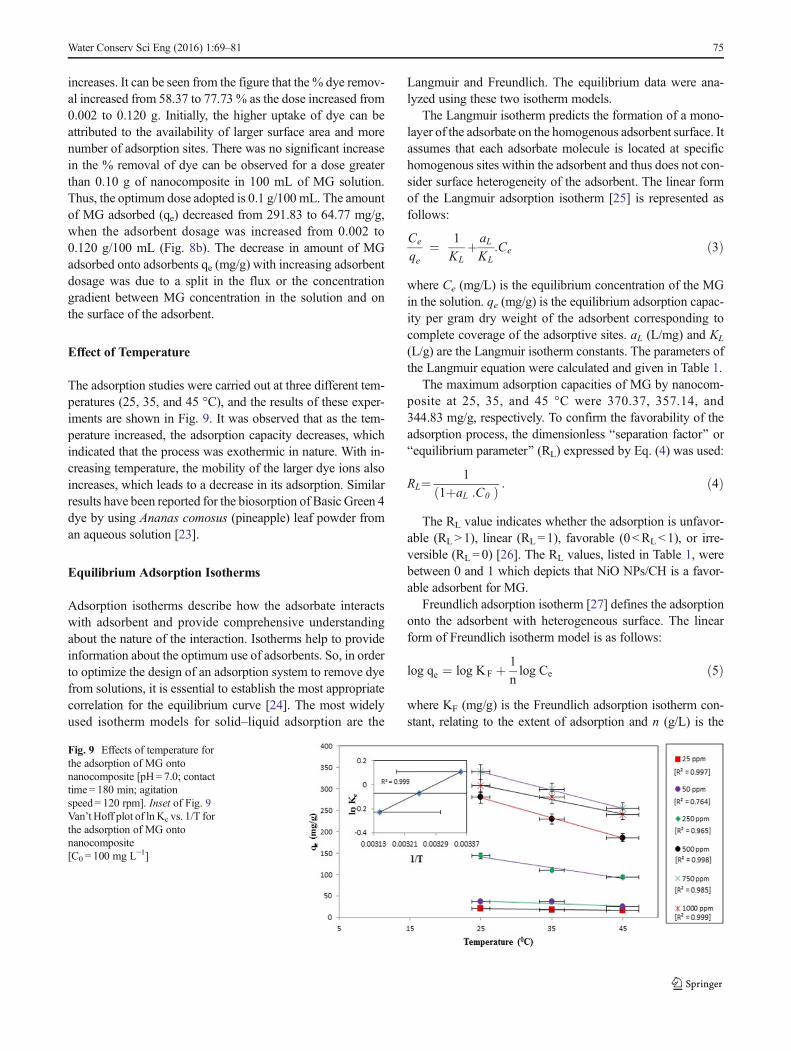
Effect of pH
The effect of initial pH on the adsorption of MG onto nano-composite was determined at different pH values (2.0–12.0)and the results are shown in Fig. 6. The initial pH of thesolution was adjusted by using 0.1 M HCl and 0.1 M NaOHsolutions after the addition of adsorbent. Other experimentalconditions such as initial dye concentration, contact time, tem-perature, and the amount of adsorbent were fixed at 100 mg/L,180 min, 298 K, and 0.1 g, respectively.Fig. 3 Transmission electron microscopic (TEM) image of NiO NPs/CH
72 Water Conserv Sci Eng (2016) 1:69–81
MG is a basic dye and it exists in aqueous solution in theform of positively charged ions. Being a charged species, itsadsorption degree onto adsorbent surface is largely influenced
by the surface charge on the adsorbent. At low pH values, theprotonation of the functional groups present on the adsorbentsurface easily takes place and thereby restricts the movement
Fig. 4 Scanning electron microscopic (SEM) images of NiO NPs/CH beads before (a) and after (b) MG dye adsorption
Fig. 5 FT–IR spectra of NiONPs/CH beads before (a) andafter (b) MG dye adsorption
Water Conserv Sci Eng (2016) 1:69–81 73
of positively charged dye cations to the surface of the adsor-bent resulting in low adsorption of dye in acidic solution.
With increase in alkalinity of the solution, the functionalgroups on the adsorbent surface become de-protonated; as aresult, the negative charge density on the adsorbent surfaceincreases and facilitates the binding of dye cations. The dyeremoval capacity can be increased at higher pH because as thepH increases, the H+ ions get reduced in the solution and maynot compete with the dye cations for the appropriate sites onthe adsorbent surface. However, at very high pH (>10.0), therewill be no freely available dye cations present in the solutionto bound to the adsorbent surface resulting in steady adsorp-tion condition.
The structural stability and color intensity of MG dye areaffected by the pH of the solution because it gets protonated inthe acidic medium and de-protonated in the alkaline medium.According to [22], the color of MG is stable in the initial pHrange 3.0–7.0, and the color reduction increases as initial pHincreases from 7.0 to 11.0. Looking upon this nature of the dyeand the above result of the effects of pH, further studies werethen carried out with dye solutions at pH value 7.0.
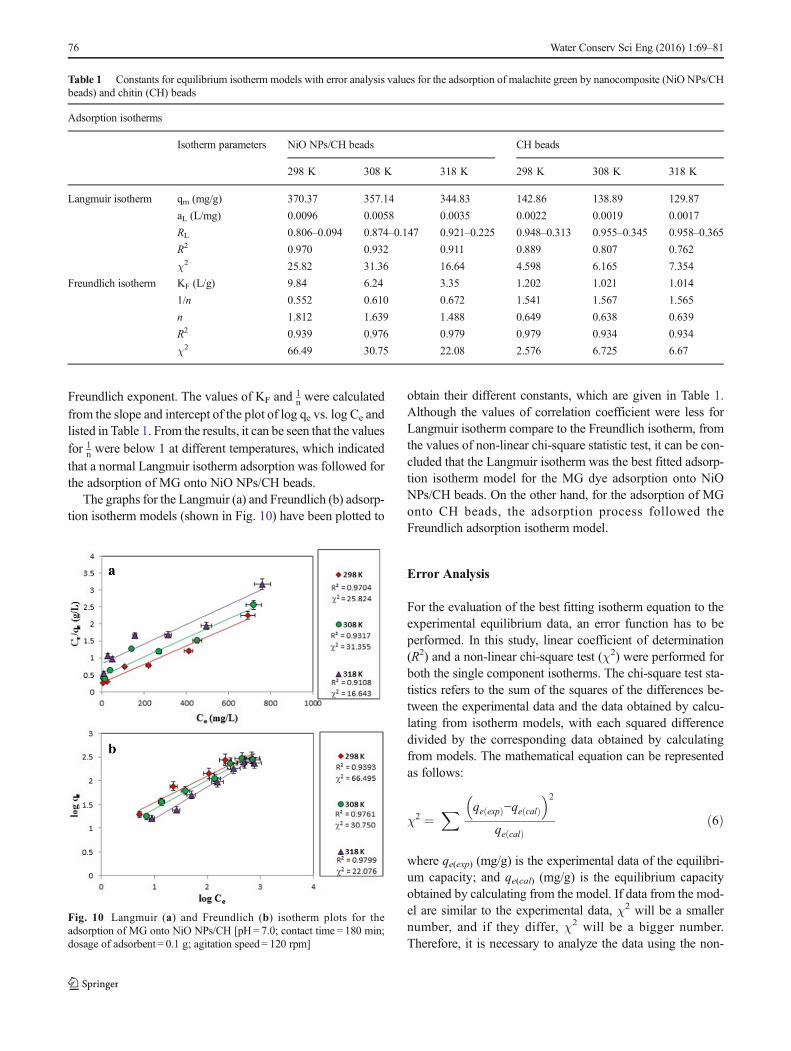
Effect of Initial Dye Concentration and Contact Time
The effects of different initial dye concentrations and contacttime on the adsorptive removal of MG by nanocomposite atthe pH value of 7.0 are shown in Fig. 7. From the figure, it canbe seen that with increasing initial dye concentration from 25to 1000 mg/L, the amount of dye adsorption was also in-creased from 34.02 to 106.47 mg/g. This increase in dye ad-sorption was found due to high driving force for mass transferat enhanced dye concentration, and the resistance to the up-take of MG from the solution decreases with the increase indye concentration. When the surface active sites of adsorbentsare covered fully, the extent of adsorption reaches a limitresulting in saturated adsorption.
Figure 7 also represents that the adsorption of MG is fast atthe initial stage of contact with the adsorbent, and then, itbecomes slow near the equilibrium. During the initial contact
time, a large number of vacant surface sites are available foradsorption, and at maximum contact time, aggregation of dyemolecules makes it difficult to diffuse deeper into the adsor-bent structure at highest energy sites. From the graph, it can beseen that after 150-min contact, a steady-state approximationwas achieved and a quasi-equilibrium situation was accepted.Based on the above results, 180-min contact time was fixed asequilibrium time throughout the adsorption study.
Effect of Adsorbent Dosage
The percentage of MG adsorption with varying amount ofadsorbent is presented in Fig. 8a. Generally, with increasingadsorbent dosage, the percentage removal of adsorbate also
Fig. 6 Effects of pH on the adsorption of MG by nanocomposite[C0 = 100 mg L−1; contact time = 180 min; dosage of adsorbent = 0.1 g;temperature = 298 K; agitation speed= 120 rpm]
Fig. 7 Effects of initial dye concentrations and contact time on theadsorption of MG by nanocomposite [pH = 7.0; dosage ofadsorbent = 0.1 g; agitation speed= 120 rpm]
Fig. 8 Effects of amount of adsorbent on the percentage removal (a) andthe adsorption capacity (b) of MG by NiO NPs/CH [C0 = 100 mg/L;pH= 7.0; contact time = 180 min; agitation speed = 120 rpm]
74 Water Conserv Sci Eng (2016) 1:69–81
increases. It can be seen from the figure that the % dye remov-al increased from 58.37 to 77.73 % as the dose increased from0.002 to 0.120 g. Initially, the higher uptake of dye can beattributed to the availability of larger surface area and morenumber of adsorption sites. There was no significant increasein the % removal of dye can be observed for a dose greaterthan 0.10 g of nanocomposite in 100 mL of MG solution.Thus, the optimum dose adopted is 0.1 g/100 mL. The amountof MG adsorbed (qe) decreased from 291.83 to 64.77 mg/g,when the adsorbent dosage was increased from 0.002 to0.120 g/100 mL (Fig. 8b). The decrease in amount of MGadsorbed onto adsorbents qe (mg/g) with increasing adsorbentdosage was due to a split in the flux or the concentrationgradient between MG concentration in the solution and onthe surface of the adsorbent.
Effect of Temperature
The adsorption studies were carried out at three different tem-peratures (25, 35, and 45 °C), and the results of these exper-iments are shown in Fig. 9. It was observed that as the tem-perature increased, the adsorption capacity decreases, whichindicated that the process was exothermic in nature. With in-creasing temperature, the mobility of the larger dye ions alsoincreases, which leads to a decrease in its adsorption. Similarresults have been reported for the biosorption of Basic Green 4dye by using Ananas comosus (pineapple) leaf powder froman aqueous solution [23].
Equilibrium Adsorption Isotherms
Adsorption isotherms describe how the adsorbate interactswith adsorbent and provide comprehensive understandingabout the nature of the interaction. Isotherms help to provideinformation about the optimum use of adsorbents. So, in orderto optimize the design of an adsorption system to remove dyefrom solutions, it is essential to establish the most appropriatecorrelation for the equilibrium curve [24]. The most widelyused isotherm models for solid–liquid adsorption are the
Langmuir and Freundlich. The equilibrium data were ana-lyzed using these two isotherm models.
The Langmuir isotherm predicts the formation of a mono-layer of the adsorbate on the homogenous adsorbent surface. Itassumes that each adsorbate molecule is located at specifichomogenous sites within the adsorbent and thus does not con-sider surface heterogeneity of the adsorbent. The linear formof the Langmuir adsorption isotherm [25] is represented asfollows:
Ce
qe¼ 1
KLþ aLKL
:Ce ð3Þ
where Ce (mg/L) is the equilibrium concentration of the MGin the solution. qe (mg/g) is the equilibrium adsorption capac-ity per gram dry weight of the adsorbent corresponding tocomplete coverage of the adsorptive sites. aL (L/mg) and KL
(L/g) are the Langmuir isotherm constants. The parameters ofthe Langmuir equation were calculated and given in Table 1.
The maximum adsorption capacities of MG by nanocom-posite at 25, 35, and 45 °C were 370.37, 357.14, and344.83 mg/g, respectively. To confirm the favorability of theadsorption process, the dimensionless Bseparation factor^ orBequilibrium parameter^ (RL) expressed by Eq. (4) was used:
RL¼ 1
1þaL :C0ð Þ : ð4Þ
The RL value indicates whether the adsorption is unfavor-able (RL>1), linear (RL=1), favorable (0<RL<1), or irre-versible (RL=0) [26]. The RL values, listed in Table 1, werebetween 0 and 1 which depicts that NiO NPs/CH is a favor-able adsorbent for MG.
Freundlich adsorption isotherm [27] defines the adsorptiononto the adsorbent with heterogeneous surface. The linearform of Freundlich isotherm model is as follows:
log qe ¼ log KF þ 1
nlog Ce ð5Þ
where KF (mg/g) is the Freundlich adsorption isotherm con-stant, relating to the extent of adsorption and n (g/L) is the
Fig. 9 Effects of temperature forthe adsorption of MG ontonanocomposite [pH= 7.0; contacttime = 180 min; agitationspeed= 120 rpm]. Inset of Fig. 9Van’t Hoff plot of ln Kc vs. 1/T forthe adsorption of MG ontonanocomposite[C0 = 100 mg L−1]
Water Conserv Sci Eng (2016) 1:69–81 75
Freundlich exponent. The values of KF and 1n were calculated
from the slope and intercept of the plot of log qe vs. log Ce andlisted in Table 1. From the results, it can be seen that the valuesfor 1
n were below 1 at different temperatures, which indicatedthat a normal Langmuir isotherm adsorption was followed forthe adsorption of MG onto NiO NPs/CH beads.
The graphs for the Langmuir (a) and Freundlich (b) adsorp-tion isotherm models (shown in Fig. 10) have been plotted to
obtain their different constants, which are given in Table 1.Although the values of correlation coefficient were less forLangmuir isotherm compare to the Freundlich isotherm, fromthe values of non-linear chi-square statistic test, it can be con-cluded that the Langmuir isotherm was the best fitted adsorp-tion isotherm model for the MG dye adsorption onto NiONPs/CH beads. On the other hand, for the adsorption of MGonto CH beads, the adsorption process followed theFreundlich adsorption isotherm model.
Error Analysis
For the evaluation of the best fitting isotherm equation to theexperimental equilibrium data, an error function has to beperformed. In this study, linear coefficient of determination(R2) and a non-linear chi-square test (χ2) were performed forboth the single component isotherms. The chi-square test sta-tistics refers to the sum of the squares of the differences be-tween the experimental data and the data obtained by calcu-lating from isotherm models, with each squared differencedivided by the corresponding data obtained by calculatingfrom models. The mathematical equation can be representedas follows:
χ2 ¼X qe expð Þ−qe calð Þ
� �2
qe calð Þð6Þ
where qe(exp) (mg/g) is the experimental data of the equilibri-um capacity; and qe(cal) (mg/g) is the equilibrium capacityobtained by calculating from the model. If data from the mod-el are similar to the experimental data, χ2 will be a smallernumber, and if they differ, χ2 will be a bigger number.Therefore, it is necessary to analyze the data using the non-
Table 1 Constants for equilibrium isotherm models with error analysis values for the adsorption of malachite green by nanocomposite (NiO NPs/CHbeads) and chitin (CH) beads
Adsorption isotherms
Isotherm parameters NiO NPs/CH beads CH beads
298 K 308 K 318 K 298 K 308 K 318 K
Langmuir isotherm qm (mg/g) 370.37 357.14 344.83 142.86 138.89 129.87
aL (L/mg) 0.0096 0.0058 0.0035 0.0022 0.0019 0.0017
RL 0.806–0.094 0.874–0.147 0.921–0.225 0.948–0.313 0.955–0.345 0.958–0.365
R2 0.970 0.932 0.911 0.889 0.807 0.762
χ2 25.82 31.36 16.64 4.598 6.165 7.354
Freundlich isotherm KF (L/g) 9.84 6.24 3.35 1.202 1.021 1.014
1/n 0.552 0.610 0.672 1.541 1.567 1.565
n 1.812 1.639 1.488 0.649 0.638 0.639
R2 0.939 0.976 0.979 0.979 0.934 0.934
χ2 66.49 30.75 22.08 2.576 6.725 6.67
Fig. 10 Langmuir (a) and Freundlich (b) isotherm plots for theadsorption of MG onto NiO NPs/CH [pH=7.0; contact time = 180 min;dosage of adsorbent = 0.1 g; agitation speed= 120 rpm]
76 Water Conserv Sci Eng (2016) 1:69–81

linear chi-square test to confirm the suitable isotherm for thisadsorption system [28]. The results of the linear coefficient ofdetermination (R2) and a non-linear chi-square test (χ2) forboth the adsorption isotherms indicated that the adsorptionprocess of MG dye onto nanocomposite was homogenous innature, and Langmuir isotherm model appeared to be the bestfitted model. Whereas the adsorption process of MG dye ontoonly chitin beads was heterogeneous in nature, and Freundlichisotherm model appeared to be the best fitting model.
Adsorption Kinetics
The kinetics study is helpful to select the optimum operatingconditions for the full-scale batch process as well as it alsoprovides valuable insights into the reaction pathways and inturn controls the residence time of adsorbate uptake at thesolid-solution interface [29]. To investigate the adsorption ki-netics of MG onto the nanocomposite, the linear forms ofpseudo-first-order, pseudo-second-order, and intraparticle dif-fusion model were used.
The linear equations for the applied models were asfollows:
Pseudo-first-order model:
log qe−qtð Þ ¼ log qe –k1
2:303t: ð7Þ
Pseudo-second-order model:
t
qt¼ 1
k2qe2þ t
qe: ð8Þ
Intraparticle diffusion model:
qt¼Kidt1=2þI ð9Þ
where qe and qt (mg/g) are the amounts of dye adsorbed onadsorbent at equilibrium and at time t, respectively, and k1(min−1) and k2 (g/mg min) are the rate constants of pseudo-first-order and pseudo-second-order kinetic models. Kid is theintraparticle diffusion rate constant (mg/g min1/2) and I (mg/g)is the intercept.
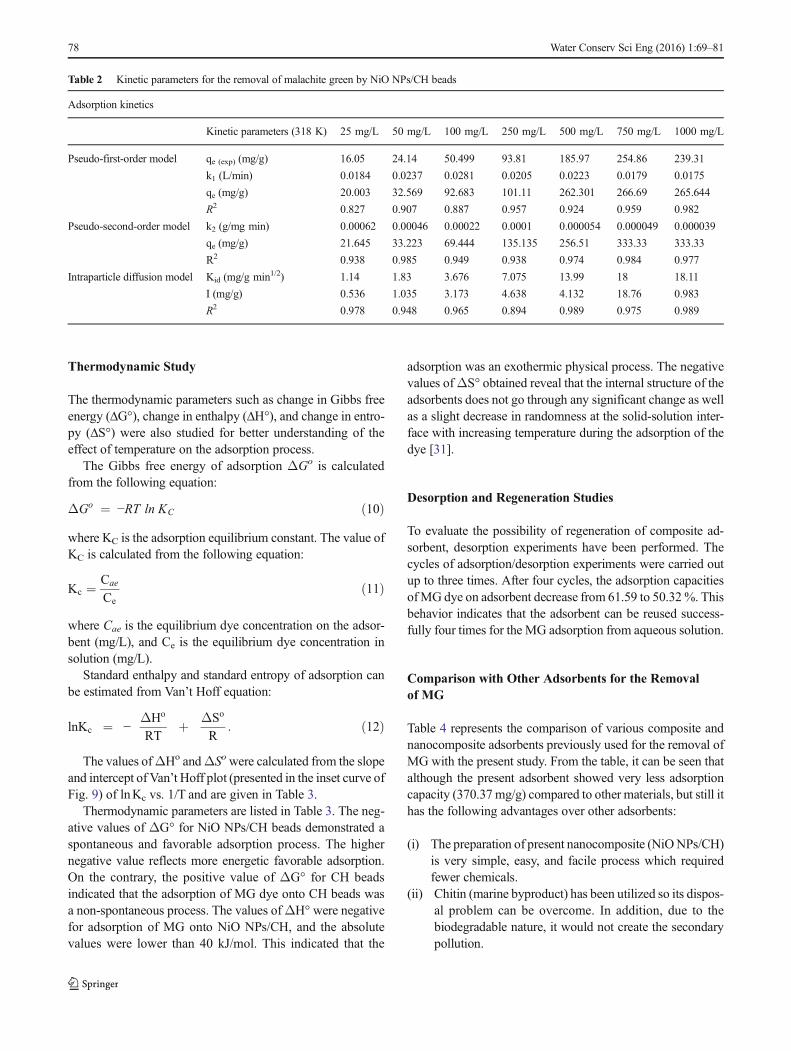
The straight line plots for the pseudo-first-order (a) andpseudo-second-order (b) models (shown in Fig. 11, respec-tively) have been represented to obtain the rate parameterswhich are given in Table 2. From the resulting data, it can beseen that the R2 value of the pseudo-second-order equation ishigher than that of the pseudo-first-order equation, indicatingthat experimental kinetic data for MG adsorption followed thepseudo-second-order rate model better than the other one. Asshown in Table 2, the values of the rate constant k2 decreasewith increasing initial MG dye concentration because higherdye concentration corresponds to higher surface loadingwhich decreases the diffusion efficiency.
The adsorbate species are most probably transported fromthe bulk of the solution into the solid phase throughintraparticle diffusion/transport process, which is often therate-limiting step inmany adsorption processes. The possibilityof intraparticle diffusionwas explored by using the intraparticlediffusion model, which is commonly expressed by Eq. (7).
The value of intercept (I), provides information about thethickness of the boundary layer, in the present study rangingfrom 0.53 to 4.638 indicated that the boundary layer effect wasnot so much efficient for the adsorption of MG onto nanocom-posite. In Fig. 11c, the plot of t1/2 vs. qt was linear in natureindicated that the intraparticle diffusion was involved in theadsorption process. It can also be seen that the linear portionsof curves do not pass through the origin which indicates thatthe intraparticle diffusion is not the sole rate controlling step forthe adsorption mechanism of MG onto nanocomposite. Fromthe above results, it may be concluded that surface adsorptionand intraparticle diffusion were concurrently operating duringthe adsorbate and adsorbent interactions [30].
Fig. 11 a Pseudo-first-order, b pseudo-second-order, and c intraparticlediffusion models for the adsorption of MG [pH = 7.0; dosage ofadsorbent = 0.1 g; temperature = 298 K; agitation speed= 120 rpm]
Water Conserv Sci Eng (2016) 1:69–81 77
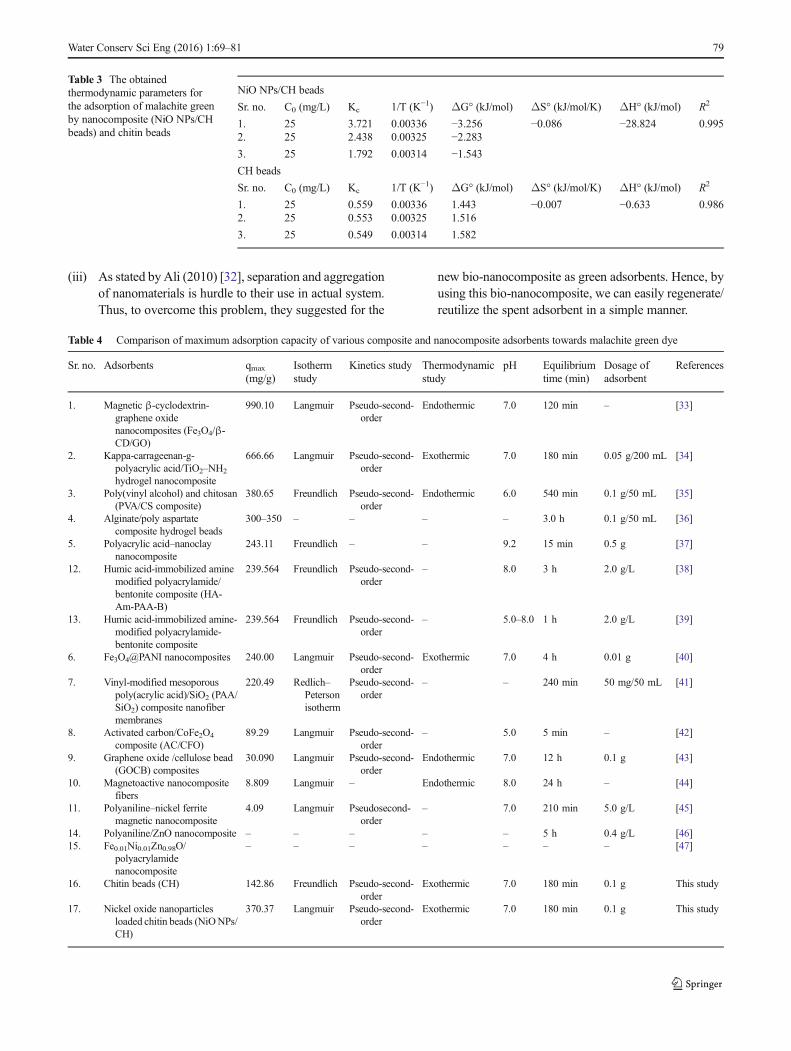
Thermodynamic Study
The thermodynamic parameters such as change in Gibbs freeenergy (ΔG°), change in enthalpy (ΔH°), and change in entro-py (ΔS°) were also studied for better understanding of theeffect of temperature on the adsorption process.
The Gibbs free energy of adsorption ΔGo is calculatedfrom the following equation:
ΔGo ¼ −RT ln KC ð10Þ
where KC is the adsorption equilibrium constant. The value ofKC is calculated from the following equation:
Kc ¼ Cae
Ceð11Þ
where Cae is the equilibrium dye concentration on the adsor-bent (mg/L), and Ce is the equilibrium dye concentration insolution (mg/L).
Standard enthalpy and standard entropy of adsorption canbe estimated from Van’t Hoff equation:
lnKc ¼ −ΔHo
RTþ ΔSo
R: ð12Þ
The values ofΔHo andΔSowere calculated from the slopeand intercept of Van’t Hoff plot (presented in the inset curve ofFig. 9) of lnKc vs. 1/T and are given in Table 3.
Thermodynamic parameters are listed in Table 3. The neg-ative values of ΔG° for NiO NPs/CH beads demonstrated aspontaneous and favorable adsorption process. The highernegative value reflects more energetic favorable adsorption.On the contrary, the positive value of ΔG° for CH beadsindicated that the adsorption of MG dye onto CH beads wasa non-spontaneous process. The values ofΔH° were negativefor adsorption of MG onto NiO NPs/CH, and the absolutevalues were lower than 40 kJ/mol. This indicated that the
adsorption was an exothermic physical process. The negativevalues ofΔS° obtained reveal that the internal structure of theadsorbents does not go through any significant change as wellas a slight decrease in randomness at the solid-solution inter-face with increasing temperature during the adsorption of thedye [31].
Desorption and Regeneration Studies
To evaluate the possibility of regeneration of composite ad-sorbent, desorption experiments have been performed. Thecycles of adsorption/desorption experiments were carried outup to three times. After four cycles, the adsorption capacitiesofMG dye on adsorbent decrease from 61.59 to 50.32%. Thisbehavior indicates that the adsorbent can be reused success-fully four times for the MG adsorption from aqueous solution.
Comparison with Other Adsorbents for the Removalof MG
Table 4 represents the comparison of various composite andnanocomposite adsorbents previously used for the removal ofMG with the present study. From the table, it can be seen thatalthough the present adsorbent showed very less adsorptioncapacity (370.37 mg/g) compared to other materials, but still ithas the following advantages over other adsorbents:
(i) The preparation of present nanocomposite (NiONPs/CH)is very simple, easy, and facile process which requiredfewer chemicals.
(ii) Chitin (marine byproduct) has been utilized so its dispos-al problem can be overcome. In addition, due to thebiodegradable nature, it would not create the secondarypollution.
Table 2 Kinetic parameters for the removal of malachite green by NiO NPs/CH beads
Adsorption kinetics
Kinetic parameters (318 K) 25 mg/L 50 mg/L 100 mg/L 250 mg/L 500 mg/L 750 mg/L 1000 mg/L
Pseudo-first-order model qe (exp) (mg/g) 16.05 24.14 50.499 93.81 185.97 254.86 239.31
k1 (L/min) 0.0184 0.0237 0.0281 0.0205 0.0223 0.0179 0.0175
qe (mg/g) 20.003 32.569 92.683 101.11 262.301 266.69 265.644
R2 0.827 0.907 0.887 0.957 0.924 0.959 0.982
Pseudo-second-order model k2 (g/mg min) 0.00062 0.00046 0.00022 0.0001 0.000054 0.000049 0.000039
qe (mg/g) 21.645 33.223 69.444 135.135 256.51 333.33 333.33
R2 0.938 0.985 0.949 0.938 0.974 0.984 0.977
Intraparticle diffusion model Kid (mg/g min1/2) 1.14 1.83 3.676 7.075 13.99 18 18.11
I (mg/g) 0.536 1.035 3.173 4.638 4.132 18.76 0.983
R2 0.978 0.948 0.965 0.894 0.989 0.975 0.989
78 Water Conserv Sci Eng (2016) 1:69–81
(iii) As stated by Ali (2010) [32], separation and aggregationof nanomaterials is hurdle to their use in actual system.Thus, to overcome this problem, they suggested for the
new bio-nanocomposite as green adsorbents. Hence, byusing this bio-nanocomposite, we can easily regenerate/reutilize the spent adsorbent in a simple manner.
Table 3 The obtainedthermodynamic parameters forthe adsorption of malachite greenby nanocomposite (NiO NPs/CHbeads) and chitin beads
NiO NPs/CH beads
Sr. no. C0 (mg/L) Kc 1/T (K−1) ΔG° (kJ/mol) ΔS° (kJ/mol/K) ΔH° (kJ/mol) R2
1. 25 3.721 0.00336 −3.256 −0.086 −28.824 0.9952. 25 2.438 0.00325 −2.2833. 25 1.792 0.00314 −1.543CH beads
Sr. no. C0 (mg/L) Kc 1/T (K−1) ΔG° (kJ/mol) ΔS° (kJ/mol/K) ΔH° (kJ/mol) R2
1. 25 0.559 0.00336 1.443 −0.007 −0.633 0.9862. 25 0.553 0.00325 1.516
3. 25 0.549 0.00314 1.582
Table 4 Comparison of maximum adsorption capacity of various composite and nanocomposite adsorbents towards malachite green dye
Sr. no. Adsorbents qmax
(mg/g)Isothermstudy
Kinetics study Thermodynamicstudy
pH Equilibriumtime (min)
Dosage ofadsorbent
References
1. Magnetic β-cyclodextrin-graphene oxidenanocomposites (Fe3O4/β-CD/GO)
990.10 Langmuir Pseudo-second-order
Endothermic 7.0 120 min – [33]
2. Kappa-carrageenan-g-polyacrylic acid/TiO2–NH2
hydrogel nanocomposite
666.66 Langmuir Pseudo-second-order
Exothermic 7.0 180 min 0.05 g/200 mL [34]
3. Poly(vinyl alcohol) and chitosan(PVA/CS composite)
380.65 Freundlich Pseudo-second-order
Endothermic 6.0 540 min 0.1 g/50 mL [35]
4. Alginate/poly aspartatecomposite hydrogel beads
300–350 – – – – 3.0 h 0.1 g/50 mL [36]
5. Polyacrylic acid–nanoclaynanocomposite
243.11 Freundlich – – 9.2 15 min 0.5 g [37]
12. Humic acid-immobilized aminemodified polyacrylamide/bentonite composite (HA-Am-PAA-B)
239.564 Freundlich Pseudo-second-order
– 8.0 3 h 2.0 g/L [38]
13. Humic acid-immobilized amine-modified polyacrylamide-bentonite composite
239.564 Freundlich Pseudo-second-order
– 5.0–8.0 1 h 2.0 g/L [39]
6. Fe3O4@PANI nanocomposites 240.00 Langmuir Pseudo-second-order
Exothermic 7.0 4 h 0.01 g [40]
7. Vinyl-modified mesoporouspoly(acrylic acid)/SiO2 (PAA/SiO2) composite nanofibermembranes
220.49 Redlich–Petersonisotherm
Pseudo-second-order
– – 240 min 50 mg/50 mL [41]
8. Activated carbon/CoFe2O4
composite (AC/CFO)89.29 Langmuir Pseudo-second-
order– 5.0 5 min – [42]
9. Graphene oxide /cellulose bead(GOCB) composites
30.090 Langmuir Pseudo-second-order
Endothermic 7.0 12 h 0.1 g [43]
10. Magnetoactive nanocompositefibers
8.809 Langmuir – Endothermic 8.0 24 h – [44]
11. Polyaniline–nickel ferritemagnetic nanocomposite
4.09 Langmuir Pseudosecond-order
– 7.0 210 min 5.0 g/L [45]
14. Polyaniline/ZnO nanocomposite – – – – – 5 h 0.4 g/L [46]15. Fe0.01Ni0.01Zn0.98O/
polyacrylamidenanocomposite
– – – – – – – [47]
16. Chitin beads (CH) 142.86 Freundlich Pseudo-second-order
Exothermic 7.0 180 min 0.1 g This study
17. Nickel oxide nanoparticlesloaded chitin beads (NiONPs/CH)
370.37 Langmuir Pseudo-second-order
Exothermic 7.0 180 min 0.1 g This study
Water Conserv Sci Eng (2016) 1:69–81 79
Conclusions
The present study shows that the nickel oxide nanoparticlesloaded chitin beads (nanocomposite) can be easily preparedand further used as an adsorbent for the removal of MG fromaqueous medium. The characterization (TEM, SEM, and FT–IR) evinced that the availability of the larger surface and thepresence of functional groups made nanocomposite appropri-ate for MG dye adsorption. The results obtained from thestudy of various system variables indicated that the dye ad-sorption increases with increasing solution pH, initial dye con-centration, contact time, and dosage of adsorbent, and theoptimized values were 7.0, 100 mg/L, 180 min, and 0.1 g,respectively. From the non-linear chi-square statistic test, itcan be concluded that the Langmuir isotherm was the bestfitted adsorption isotherm model for the experimental data.The adsorption kinetics can be predicted by the pseudo-second-order kinetic model. Thermodynamic study manifest-ed that the adsorption process was exothermic, spontaneous,and physical in nature. All the results demonstrated that thenanocomposite could be promising and effective adsorbent.
Acknowledgments The authors gratefully acknowledge the financialassistance provided by the INSPIRE Programme under the AssuredOpportunity for Research Careers (AORC) scheme, funded by theDepartment of Science and Technology (DST) (Sanction Order No.:DST/INSPIRE Fellowship/2013/66). The authors are also thankful toDr. Ruchita Pal—Senior Technical Assistant from AdvancedInstrumentation Facility, Jawaharlal Nehru University, New Delhi, forthe SEM analysis.
References
1. Khataee AR, Dehghan G, Zarei M et al (2011) Neural networkmodeling of biotreatment of triphenylmethane dye solution by agreen macroalgae. Chem Eng Res Des 89:172–178. doi:10.1016/j.cherd.2010.05.009
2. Zhou Y, Min Y, Qiao H et al (2015) Improved removal of malachitegreen from aqueous solution using chemically modified celluloseby anhydride. Int J Biol Macromol 74:271–277. doi:10.1016/j.ijbiomac.2014.12.020
3. Shirmardi M, Mahvi AH, Hashemzadeh B et al (2013) The adsorp-tion of malachite green (MG) as a cationic dye onto functionalizedmulti walled carbon nanotubes. Korean J Chem Eng 30:1603–1608. doi:10.1007/s11814-013-0080-1
4. Méndez A, Fernández F, Gascó G (2007) Removal of malachitegreen using carbon-based adsorbents. Desalination 206:147–153.doi:10.1016/j.desal.2006.03.564
5. Man LW, Kumar P, Teng TT, Wasewar KL (2012) Design of ex-periments for malachite green dye removal from wastewater usingthermolysis – coagulation–flocculation. Desalination Water Treat40:260–271. doi:10.1080/19443994.2012.671257
6. Oladoja NA, Aliu YD (2009) Snail shell as coagulant aid in thealum precipitation of malachite green from aqua system. J HazardMater 164:1496–1502. doi:10.1016/j.jhazmat.2008.09.114
7. Khataee AR, Zarei M, Dehghan G et al (2011) Biotreatment of atriphenylmethane dye solution using a Xanthophyta alga: modeling
of key factors by neural network. J Taiwan Inst Chem Eng 42:380–386. doi:10.1016/j.jtice.2010.08.006
8. Saha S, Wang JM, Pal A (2012) Nano silver impregnation on com-mercial TiO2 and a comparative photocatalytic account to degrademalachite green. Sep Purif Technol 89:147–159. doi:10.1016/j.seppur.2012.01.012
9. Bejarano-Pérez NJ, Suárez-Herrera MF (2008) Sonochemical andsonophotocatalytic degradation of malachite green: the effect ofcarbon tetrachloride on reaction rates. Ultrason Sonochem 15:612–617. doi:10.1016/j.ultsonch.2007.09.009
10. Berberidou C, Poulios I, Xekoukoulotakis NP, Mantzavinos D(2007) Sonolytic, photocatalytic and sonophotocatalytic degrada-tion of malachite green in aqueous solutions. Appl Catal B Environ74:63–72. doi:10.1016/j.apcatb.2007.01.013
11. Moumeni O, Hamdaoui O (2012) Intensification of sonochemicaldegradation of malachite green by bromide ions. UltrasonSonochem 19:404–409. doi:10.1016/j.ultsonch.2011.08.008
12. Zhou X-J, Guo W-Q, Yang S-S et al (2013) Ultrasonic-assistedozone oxidation process of triphenylmethane dye degradation: ev-idence for the promotion effects of ultrasonic on malachite greendecolorization and degradation mechanism. Bioresour Technol128:827–830. doi:10.1016/j.biortech.2012.10.086
13. Bai C, Xiao W, Feng D et al (2013) Efficient decolorization ofmalachite green in the Fenton reaction catalyzed by [Fe(III)-salen]Cl complex. Chem Eng J 215–216:227–234. doi:10.1016/j.cej.2012.09.124
14. Chen F, Ma W, He J, Zhao J (2002) Fenton degradation of mala-chite green catalyzed by aromatic additives. J Phys Chem A 106:9485–9490. doi:10.1021/jp0144350
15. Karimi A, AghbolaghyM, Khataee A, Shoa Bargh S (2012) Use ofenzymatic bio-Fenton as a new approach in decolorization of mal-achite green. Sci World J 2012:e691569. doi:10.1100/2012/691569
16. Nidheesh PV, Gandhimathi R, Ramesh ST (2013) Degradation ofdyes from aqueous solution by Fenton processes: a review. EnvironSci Pollut Res 20:2099–2132. doi:10.1007/s11356-012-1385-z
17. Ravi Kumar MNV (2000) A review of chitin and chitosan applica-tions. React Funct Polym 46:1–27. doi:10.1016/S1381-5148(00)00038-9
18. Wei A, Liu B, Zhao H et al (2014) Synthesis and formation mech-anism of flowerlike architectures assembled from ultrathin NiOnanoflakes and their adsorption to malachite green and acid red inwater. Chem Eng J 239:141–148. doi:10.1016/j.cej.2013.10.079
19. Hussain F, Hojjati M, Okamoto M, Gorga RE (2006) Review arti-cle: polymer-matrix nanocomposites, processing, manufacturing,and application: an overview. J Compos Mater 40:1511–1575.doi:10.1177/0021998306067321
20. Wadhwani PM, Ladha DG, Panchal VK, Shah NK (2014)Enhanced corrosion inhibitive effect of p-methoxybenzylidene-4,4′-dimorpholine assembled on nickel oxide nanoparticles for mildsteel in acid medium. RSC Adv 5:7098–7111. doi:10.1039/C4RA13390K
21. Wadhwani PM, Panchal VK, Shah NK (2015) Newly synthesizedsalicylidene-4,4′-dimorpholine (SDM) assembled on nickel oxidenanoparticles (NiONPs) and its inhibitive effect onmild steel in 2 Nhydrochloric acid. Appl Surf Sci 331:373–387. doi:10.1016/j.apsusc.2015.01.105
22. Chowdhury S, Mishra R, Saha P, Kushwaha P (2011) Adsorptionthermodynamics, kinetics and isosteric heat of adsorption of mala-chite green onto chemically modified rice husk. Desalination 265:159–168. doi:10.1016/j.desal.2010.07.047
23. Chowdhury S, Chakraborty S, Saha P (2011) Biosorption of BasicGreen 4 from aqueous solution byAnanas comosus (pineapple) leafpowder. Colloids Surf B Biointerfaces 84:520–527. doi:10.1016/j.colsurfb.2011.02.009
24. Raval NP, Shah PU, Ladha DG et al (2015) Comparative study ofchitin and chitosan beads for the adsorption of hazardous anionic
80 Water Conserv Sci Eng (2016) 1:69–81
azo dye Congo Red from wastewater. Desalination Water Treat 57:9247–9262. doi:10.1080/19443994.2015.1027959
25. Langmuir I (1918) The adsorption of gases on plane surfaces ofglass, mica and platinum. J Am Chem Soc 40:1361–1403. doi:10.1021/ja02242a004
26. Shah PU, Raval NP, Shah NK (2015) Adsorption of copper from anaqueous solution by chemically modified cassava starch. J MaterEnviron Sci 6:2573–2582
27. Freundlich HM (1906) Over the adsorption in solution. J PhysChem 57:385–470
28. Unuabonah EI, Olu-Owolabi BI, Adebowale KO, Ofomaja AE(2007) Adsorption of lead and cadmium ions from aqueous solu-tions by tripolyphosphate-impregnated Kaolinite clay. ColloidsSurf Physicochem Eng Asp 292:202–211. doi:10.1016/j.colsurfa.2006.06.024
29. Ahmad R, Kumar R (2010) Adsorptive removal of congo red dyefrom aqueous solution using bael shell carbon. Appl Surf Sci 257:1628–1633. doi:10.1016/j.apsusc.2010.08.111
30. Santhi T, Manonmani S, Smitha T (2010) Removal of malachitegreen from aqueous solution by activated carbon prepared from theepicarp of Ricinus communis by adsorption. J Hazard Mater 179:178–186. doi:10.1016/j.jhazmat.2010.02.076
31. Mittal A,Mittal J, Malviya A, Gupta VK (2009) Adsorptive remov-al of hazardous anionic dye BCongo red^ from wastewater usingwaste materials and recovery by desorption. J Colloid Interface Sci340:16–26. doi:10.1016/j.jcis.2009.08.019
32. Ali H (2010) Biodegradation of synthetic dyes—a review. WaterAir Soil Pollut 213:251–273. doi:10.1007/s11270-010-0382-4
33. Wang D, Liu L, Jiang X et al (2015) Adsorption and removal ofmalachite green from aqueous solution using magnetic β-cyclodextrin-graphene oxide nanocomposites as adsorbents.Colloids Surf Physicochem Eng Asp 466:166–173. doi:10.1016/j.colsurfa.2014.11.021
34. Pourjavadi A, Doulabi M, Doroudian M (2014) Adsorption char-acteristics of malachite green dye onto novel kappa-carrageenan-g-polyacrylic acid/TiO2–NH2 hydrogel nanocomposite. J Iran ChemSoc 11:1057–1065. doi:10.1007/s13738-013-0374-6
35. Li X, Li Y, Zhang S, Ye Z (2012) Preparation and characterizationof new foam adsorbents of poly(vinyl alcohol)/chitosan compositesand their removal for dye and heavy metal from aqueous solution.Chem Eng J 183:88–97. doi:10.1016/j.cej.2011.12.025
36. Jeon YS, Lei J, Kim J-H (2008) Dye adsorption characteristics ofalginate/polyaspartate hydrogels. J Ind Eng Chem 14:726–731. doi:10.1016/j.jiec.2008.07.007
37. Sonawane SH, Chaudhari PL, Ghodke SA et al (2009) Ultrasoundassisted synthesis of polyacrylic acid-nanoclay nanocomposite and its
application in sonosorption studies of malachite green dye. UltrasonSonochem 16:351–355. doi:10.1016/j.ultsonch.2008.10.008
38. Anirudhan TS, Suchithra PS (2009) Adsorption characteristics ofhumic acid-immobilized amine modified polyacrylamide/bentonitecomposite for cationic dyes in aqueous solutions. J Environ Sci(China) 21:884–891
39. Anirudhan TS, Suchithra PS, Radhakrishnan PG (2009)Synthesis and characterization of humic acid immobilized-polymer/bentonite composites and their ability to adsorb basicdyes from aqueous solutions. Appl Clay Sci 43:336–342. doi:10.1016/j.clay.2008.09.015
40. Mahto TK, Chowdhuri AR, Sahu SK (2014) Polyaniline-functionalized magnetic nanoparticles for the removal of toxicdye from wastewater. J Appl Polym Sci 131:1–9. doi:10.1002/app.40840
41. Xu R, Jia M, Zhang Y, Li F (2012) Sorption of malachite green onvinyl-modified mesoporous poly(acrylic acid)/SiO2 compositenanofiber membranes. Microporous Mesoporous Mater 149:111–118. doi:10.1016/j.micromeso.2011.08.024
42. Ai L, Huang H, Chen Z et al (2010) Activated carbon/CoFe2O4composites: facile synthesis, magnetic performance and their poten-tial application for the removal of malachite green from water.Chem Eng J 156:243–249. doi:10.1016/j.cej.2009.08.028
43. Zhang X, Yu H, Yang H et al (2015) Graphene oxide caged incellulose microbeads for removal of malachite green dye fromaqueous solution. J Colloid Interface Sci 437:277–282. doi:10.1016/j.jcis.2014.09.048
44. Savva I, Marinica O, Papatryfonos CA et al (2015) Evaluation ofelectrospun polymer–Fe3O4 nanocomposite mats in malachitegreen adsorption. RSC Adv 5:16484–16496. doi:10.1039/C4RA16938G
45. Patil MR, Shrivastava VS (2014) Adsorption of malachite green bypolyaniline–nickel ferrite magnetic nanocomposite: an isothermand kinetic study. Appl Nanosci 1–8. doi: 10.1007/s13204-014-0383-5
46. Eskizeybek V, Sarı F, Gülce H et al (2012) Preparation of the newpolyaniline/ZnO nanocomposite and its photocatalytic activity fordegradation of methylene blue and malachite green dyes under UVand natural sun lights irradiations. Appl Catal B Environ 119–120:197–206. doi:10.1016/j.apcatb.2012.02.034
47. Kant S, Pathania D, Singh P et al (2014) Removal of malachitegreen and methylene blue by Fe0.01Ni0.01Zn0.98O/polyacryl-amide nanocomposi te using coupled adsorpt ion andphotocatalysis. Appl Catal B Environ 147:340–352. doi:10.1016/j.apcatb.2013.09.001
Water Conserv Sci Eng (2016) 1:69–81 81