Nanoparticles in food and beyond. Analytical methods and ...
72
Nanoparticles in food and beyond. Analytical methods and ‘omics for study of their occurrence and potential health effects. ERIK HUUSFELDT LARSEN, PH.D. LEADER OF NANO-BIOSCIENCE NATIONAL FOOD INSTITUTE TECHNICAL UNIVERSITY OF DENMARK E-MAIL: [email protected]
Transcript of Nanoparticles in food and beyond. Analytical methods and ...

Nanoparticles in food and beyond. Analytical methods and ‘omics for study of their occurrence and potential health effects.
ERIK HUUSFELDT LARSEN, PH.D.LEADER OF NANO-BIOSCIENCENATIONAL FOOD INSTITUTETECHNICAL UNIVERSITY OF DENMARK
E-MAIL: [email protected]

Nanoparticles
Particles having one or more dimensions in the size range of 1 to 100 nm. One nanometer (nm) is a billionth of a meter
107x 107x
0.1
1
10
100
1000
Nanoparticles in our daily lives?Diameter (nm)
Gold atom
Albumin
Carbon atom
Asbestos
Diesel exhaust
Clay
Virus
Particles with sizes betweenabout 1 and 100 nm (at leastin one dimension)
carbon nanotube
gold nanoparticles
fullerene
Engineered nanoparticles

Nanoparticles in food: benefits vs. safety
ANTIMICROBIAL PACKAGING
Degradable foils made with nano particlesthat limit bacteria.
TEXTURE
Food spreadabilityand stability improve
with nano-sizedcrystals and lipids for
better low-fat
ENHANCED NUTRIENT DELIVERY
Nano-encapsulatingimproves bioavailability of
vitamins, antioxidants, PUFs and other‘nutraceuticals’.
NEW UNKNOWNTOXIC EFFECTS
BECAUSE OF THE SMALL SIZE
UNKNOWN RISKS FOR THE CONSUMER
HEALTH
UNKNOWN RISKS FOR THE ENVIRONMENT

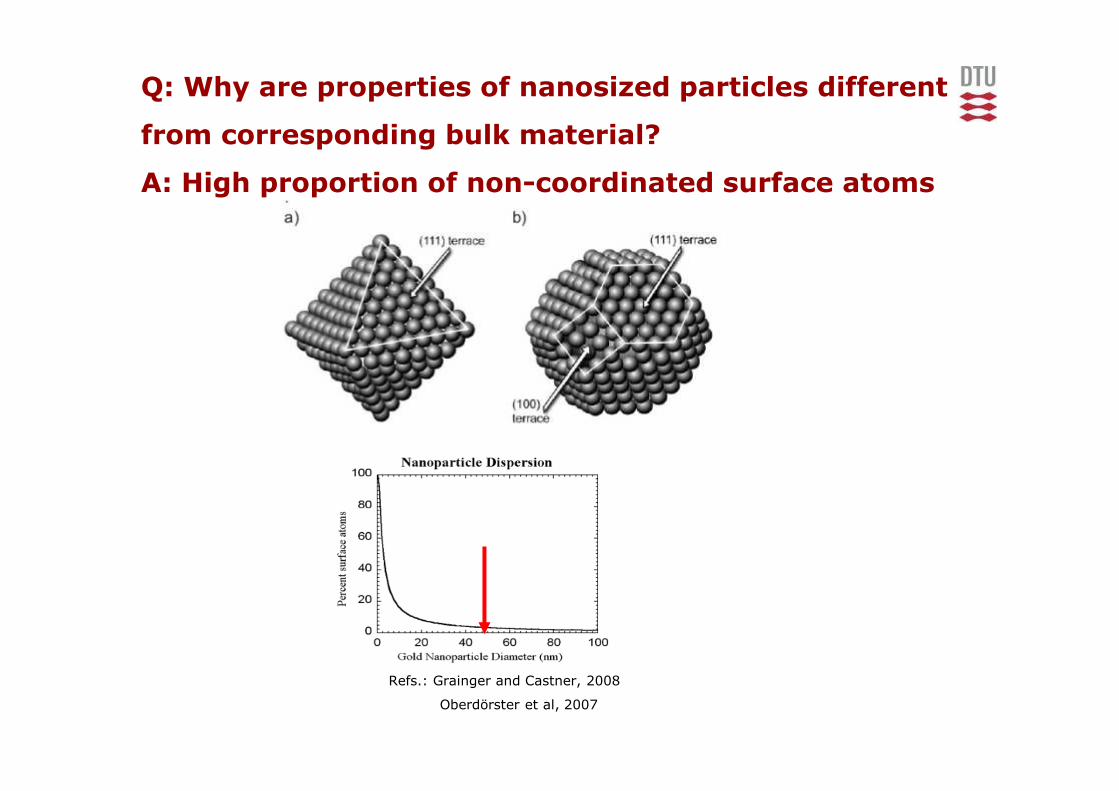
Refs.: Grainger and Castner, 2008
Oberdörster et al, 2007
Q: Why are properties of nanosized particles different
from corresponding bulk material?
A: High proportion of non-coordinated surface atoms
Catalytic activity
Redox activity (ROS formation)

Types of nanomaterial mentioned in 633 records of the Nano Inventory
Ref.: RIKILT and JRC, 2014. Inventory of Nanotechnology applications in the agricultural, feed and food sector. EFSA supporting publication 2014:EN-621, 125 pp.

Ref.: RIKILT and JRC, 2014. Inventory of Nanotechnology applications in the agricultural, feed and food sector. EFSA supporting publication 2014:EN-621, 125 pp.
Nanomaterials in agriculture,
feed and food applications

Challenges when working with nanoparticlesin food and biological matrices
primary particles
Aggregation
(irreversible)
Agglomeration
(reversible)
particle-surface interaction (adsorption, repulsion)
Dissolution
…speciation…
NPcore
(Bio)molecular
corona
Energy input

9
Dispersion methods (1)Standardization of the power delivered by probe sonication
27.5
27.0
26.5
26.0
25.5
25.0
Tem
pera
ture
(°C
)
00:0001-01-1904
00:01 00:02 00:03 00:04 00:05
Time (min)
Tip amplitude (µm): 180 135 90
linear fit
Set tip
amplitude
(in % or µm)
16
14
12
10
8
6
4
2
0
Del
iver
ed p
ower
(W
)
180160140120100806040200Tip amplitude (µm)
2520151050Input power (W)
Linear fita = 0 ± 0b = 0.0846 ± 0.0006
Probe sonicator calibration by
calorimetry*
*Taurozzi et al. 2011 Nanotoxicology 5:711-29.

10Metrics for nano-particle characterisationin relation to safety assessment
Variable Importance Method of analysis
Size distribution (by mass) Essential
Shape Essential
Composition Essential
Physico-chemical structure Essential
Agglomeration state Essential
Size distribution (by number) Essential
Surface area Valuable
Surface chemistry Valuable
Surface contamination Valuable
Porosity Valuable
Surface charge in suspension Valuable, but non-essen tial
Surface charge -powder Valuable, but non-essential
Crystal structure Valuable, but non-essential
AFFF-LS-
ICP-MS
Single particle ICP-MS, or TEM

Particle detection(fractogram)
Size determination(root mean square, hydrodynamic andgeometric radius)
Asymmetric flowfield flow
fractionation
(AF4)
Inductivelycoupled plasma
mass spectrometry(ICP-MS)
Optical detection(multi angle and
dynamic light scattering, UV and
fluorescence)
Particle separationaccording to their size(small NPs elute first)
Diffusion force vs. cross flow
Elemental detectionfor identification ofparticles
Quantification
0
100000
0 50 90 130 170 210 250
m/z
90Zr140Ce
138Ba
AFFF-MALS/DLS-ICP-MS platform forcharacterisation of nanoparticles in liquid suspension

12
0.2
Inlet OutletInjection
Principle of asymmetrical flow FFF
Adapted from Wyatt Europe
10 kDa membrane
Cross flow brings
LMW material to waste
0
20
6 VD
Vwtt xr ⋅⋅
⋅⋅=&
AFFF
Cell
25 cm
0.25 mm

Fraction collection for transmission electron microscopy (TEM)
100nm
DTU Food, Technical University of Denmark
Determination of Ag NP size distribution
1 2 3 4 5
1 2 3 4 5
Diameter determined bysize-calibration curve(polystyrene standardspheres)
Loeschner et. al, J. Chrom. A (2012)
43 nm
60 nm

AF4-ICP-MS of AgNPs in enzymaticallydigested chicken meat vs. pristine AgNPs
Proteinase K 1:5 40 min@37oC (60 µg enzyme/mg tissue)
� Significant nanofraction(~80%) recovered
� Formation of additional peaksred curve (0-5 min)
� Pre-elution (~ 2 min) in comparison to pristine AgNPs:
� Sizing by tR problematic �
Q: Does AgNP peak infractogram reflectdissolution (i.e. smallersize) or non-ideal fractionation behavior?
0 10 20 30 40
0
2
4
6
8
10
extr
a pe
aks
1 &
2
void
pea
k
nanoparticlepeak
AgNPs diluted with ultrapure water enzymatically digested meat
with AgNPs
Ag
mas
s co
ncen
tratio
n (n
g/m
l)
retention time (min)t0
Loeschner, et al., Anal., Bioanal. Chem. (2013), 405, 8185-8195.

Are silver NPs toxic in an animal model?
Is silver still in particleform?
Distribution withincells?
Have the particlesagglomerated?
Imaging by TEM/EDX ofthin tissue slices (50 – 100 nm).
Distribution in organs
Determination of Ag byICPMS in tissue followingashing with HNO3/HCl
Distribution withinorgans
Silver staining (as in photography) of tissueslices followed by light microscopy
http://ratguide.com/
28 days dosage via sonde in GI tract of:
AgNPs (14 nm o.d.), or
AgAc (dissolved silver; Ag+)
16
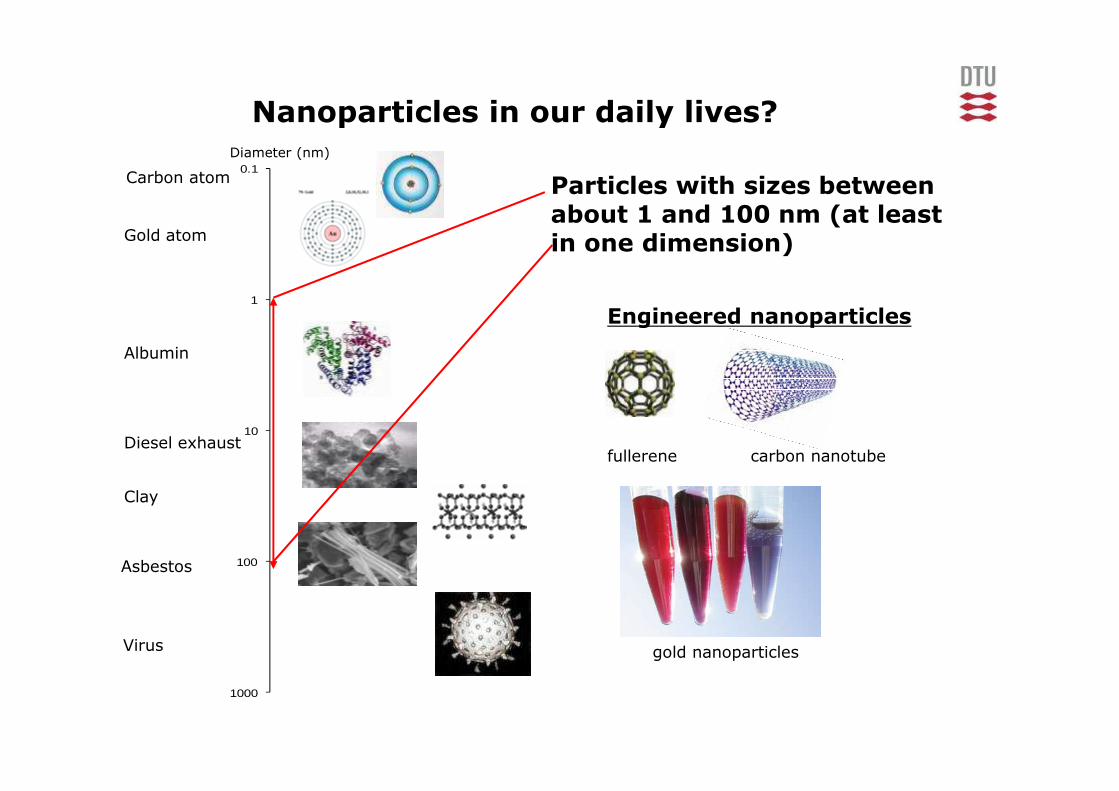
Ref.: Oberdörster et al (2007), Nanotoxicology, 1, 2-25
Toxicity of ENPs to cells by ROS-formation
Reactive oxygen species (ROS):
.O2- Superoxide
H2O2 Hydrogen peroxide
.OH Hydroxy radical
ROOH (lipid-)peroxide
Oxidative stress =
”Too much ROS”

Dynamic light scattering (DLS) andtransmission electron microscopy (TEM)
14 nm
50 nm AgNP + PVP
Stabilised silver nanoparticles
analysed by batch-mode DLS
• Approx. 10 % of Ag as Ag+
or clusters (12,5 kDa filter)
• Long-term stable (150 d)

Organ distribution of silver –silver nanoparticles vs. silver acetate
0
10.000
20.000
30.000
40.000
50.000
co
ncen
trati
on
of
Ag
(n
g/
g w
et
weig
ht)
Ag nanoparticles Ag acetate

Organ distribution of silver –silver nanoparticles vs. silver acetate
0
10.000
20.000
30.000
40.000
50.000
co
ncen
trati
on
of
Ag
(n
g/
g w
et
weig
ht)
Ag nanoparticles Ag acetate

Organ distribution of silver –silver nanoparticles vs. silver acetate
0
10.000
20.000
30.000
40.000
50.000
co
ncen
trati
on
of
Ag
(n
g/
g w
et
weig
ht)
Ag nanoparticles Ag acetate
0
1.000
2.000
3.000
4.000
5.000 Ag nanoparticles
Ag acetate
*
**
*
*
12.6 mg/kg bw/day
9.2 mg/kg bw/day
*p < 0.05

intestinal villus macrophage
Transmission electron microscopy (TEM)
Silver nanoparticle exposed rat: ileum
lysosome containing particles

Transmission electron microscopy (TEM)
Silver acetate exposed rat: ileum
lysosome containing particles particles in the basal lamina

intestinal villus particles in the basal lamina
Transmission electron microscopy (TEM)
Silver nanoparticle exposed rat: ileum

TEM+ energy dispersive X-ray spectroscopy (EDX)
What can we learn about the chemical
composition of AgNPs inside rat’s intestinal cells?
particles
bacground
particles
background
Energi (keV) Energi (keV)

Are silver NPs more harmful to rats than dissolved silver?
Reference: N. Hadrup et al, accepteret til: ” Archives of Toxicology” september 2011
Control
AgNPs
(9 mg Ag/kg bw/day)
AgAc
(9 mg Ag/kg bw/day)
NOAEL:
AgNPs:
= 9 mg Ag/kg bw/day
AgAc:
< 9 mg Ag/kg bw/day
Bodymass increase Relative mass of thymusBodymass decrease
Plasma alkaline phosphatase Plasma urea
NH3

Folie 25
NH3 Arch Toxicol. 2012 Apr;86(4):543-51. Niels Hadrup; 15.05.2012

Urine metabolome of rats following AgNP dosage:
Female rats group separately from their controls and from males
Female vehicle
Female high NP
Male vehicle
Male high NP
Females, 9 mg/kg b.w. as AgNPs
- 0.5 0.0 0.5 1.0 1.5 PC1
PC 2
0.5
0.0
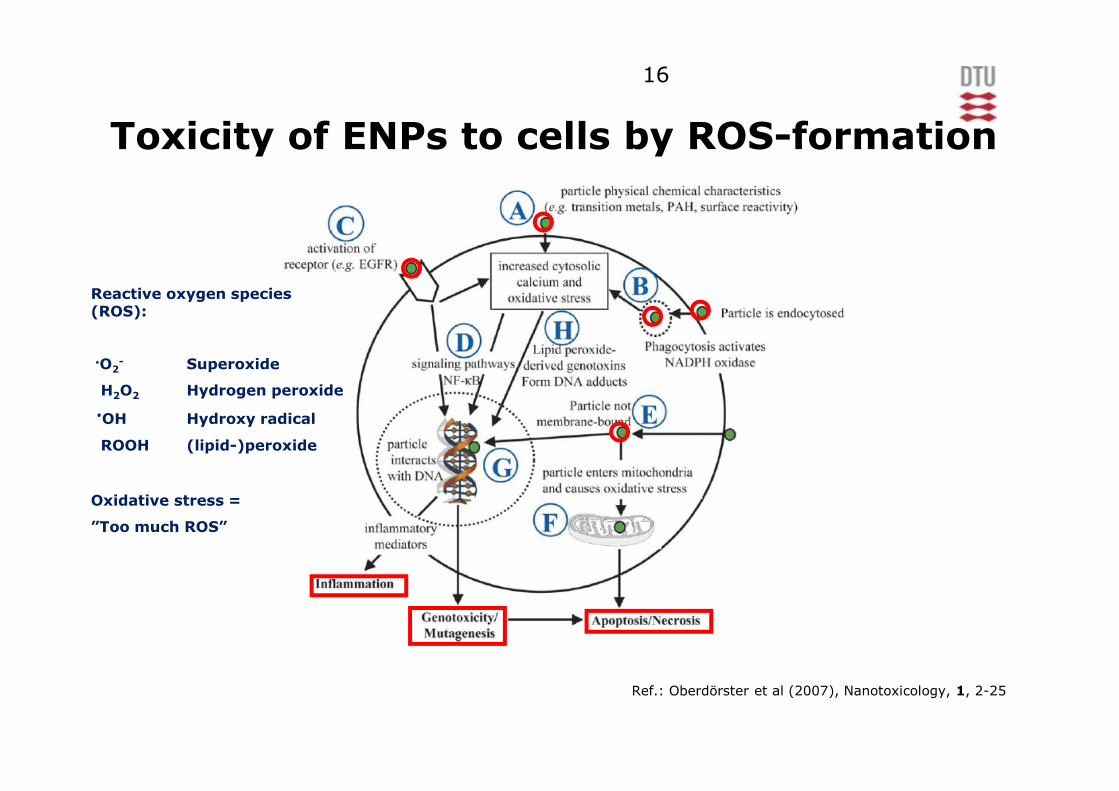
Female vehicle
Female low NP
Female mid NP
Female high NP
Female Ag-acetate
Urine metabolome of rats:
Female rats group separately from their controls, but not by dosage level nor by AgNPs vs. AgAc
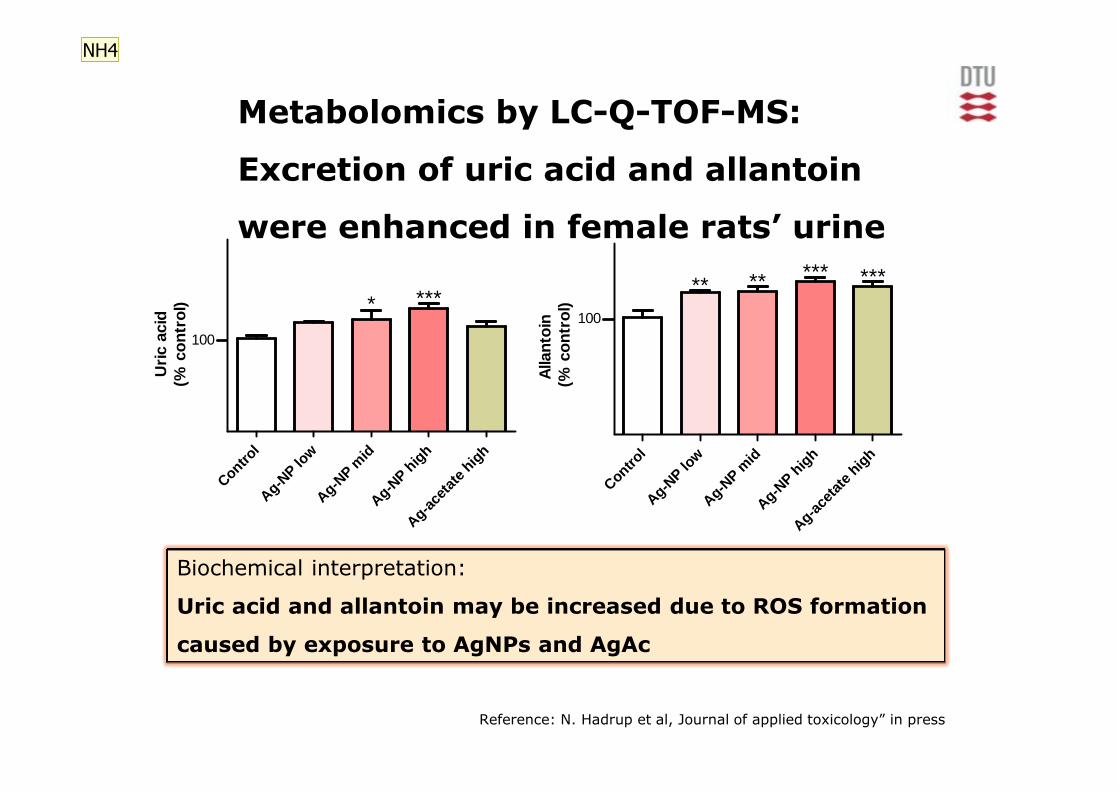
Control
Ag-NP lo
wAg-N
P mid
Ag-NP h
igh
Ag-ace
tate h
igh
Alla
ntoi
n (
% c
ontr
ol)
** ** *** ***
100
Contro
lAg-
NP low
Ag-NP m
idAg-
NP high
Ag-ac
etat e
high
Uric
aci
d(%
con
trol
) * ***
100
Reference: N. Hadrup et al, Journal of applied toxicology” in press
Metabolomics by LC-Q-TOF-MS:
Excretion of uric acid and allantoin
were enhanced in female rats’ urine
Biochemical interpretation:
Uric acid and allantoin may be increased due to ROS formation
caused by exposure to AgNPs and AgAc
NH4

Folie 28
NH4 Erik bemærk at med en mere konservativ statistik foreslået af revieweren så er AgAc ikke signifikant for Uric AcidNiels Hadrup; 15.05.2012

• A large and varied box of tools, and multidiciplinarycollaboration, were necessary in nanotoxicology studies
• AgNPs or AgAc were distributed equally in the rat
• Silver, irrespective of the dosage form, exists as nanoparticles (Ag2S and/or Ag2Se) in intestinal cells
• Our research indicated that the AgNPs are (partially)dissolved and re-deposit as NPs in the cells
• Toxicological experiments with rats indicated, thatAgNPs were equally or less toxic than AgAc for theinvestigated end-points
• 1000 $-question: Is it safe to recommend future use ofAgNPs in contact with food?
Summary…..
What’s next in food nanoscience?
� Scientific advancements
� Reference materials
� Advanced instrumentation
� Standardised dispersion methods of dry nanomaterials
� Sample preparation schemes
� EU legislation and new nano-definition

Food to be labelled with ”nano”
from 13/12-2014
The essentials about food labelling with ”nano”:
1. Engineered nanomaterial is intentionally producedand has one or more dimensions below 100 nm
2. The regulation foresees adaptation of the definitionin accordance with technical/scientific progress (cf. suggested number based size distribution)
3. Ingredients as engineered nanomaterialsshall be labelled with ”nano”
EU legislation and regulation?

Number-based size
distribution of AgNPs
By:
spICPMS or
EM-methods
COMMISSION RECOMMENDATION
of 18 October 2011
New definition of nanomaterial
based on number size distribution
100%

Conclusions
• The overview demonstrates:
• Physical interferences by matrix constituentsremain a challenge, and case-to-case adaptations of sample preparation are necessary
• Even lower LODs for nanoparticle size is needed
• NanoDefine and other EU projects will assist the EU Commission in etablishing and controlling newdefinition
• Silver nanoparticles exist inside rodents‘ tissues, possibly after dissolution and redeposition assulfide and selenide salts
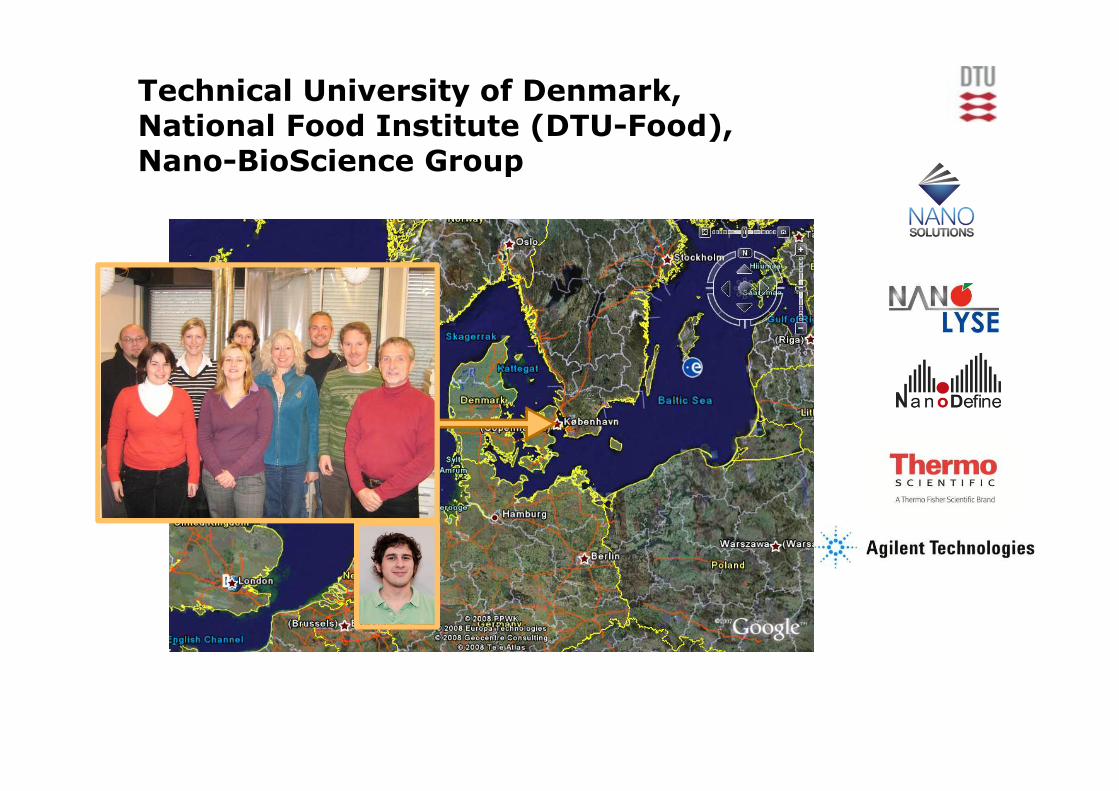
Technical University of Denmark, National Food Institute (DTU-Food), Nano-BioScience Group


Characterisation of seleniumnanoparticles stabilized with BSA –size determination methods
AFFF-MALS-ICP-MS
RMS - root mean square radius
freeBSA
0 10 20 30 40 50 600
1000
2000
2*R
MS
(nm
)
ICP
-MS
sig
nal (
cps)
90°
LS s
igna
l
retention time (min)
0.00
0.05
0
20
40
60
80
10 100 10000
5
10
15
20
25
volu
me
(%)
hydrodynamic diameter (nm)
Fractogram
50 nm
Transmission electron
microscopy
20nm
TEM Image
Dynamic light scattering
20
Size distribution

Resumé
• A large and varied box of tools and multidiciplinarycollaboration is necessary in nanotox studies
• AgNPs or AgAc are distributed equally in the rat
• Silver, irrespective of the dosage form, exists as nanoparticles in intestinal cells
• Our research indicates that the AgNPs are (partially)dissolved and re-deposit as NPs in the cells
• Toxicological experiments with rats indicate, thatAgNPs are equally or less toxic than AgAc for theinvestigated end-points
• 1000 $-question: Is it safe to recommend the use ofAgNPs in contact with food?

Conclusions:
• Feasible? Yes
• Partial dissolution of AgNPs
• More methods and measurementsneeded for full certification
Neat AgNP suspension
AgNPs in chicken meat
Reference materials

Advanced instrumentation
Analysis of TiO2 as Ti via Ti(NH3)x clusters using triple quad technology
Q1 Q2Cell Detector
9800 cps/ppb
10 ng/mL Ti ion sol.
Q1: m/z 46-50; Q3: m/z 148-152; Cell gas: 10% NH3 in He @ ca. 2 mL/min
Agilent technologies 8800

Pristine TiO2 NPs
in water
Mouse liver
IT admin.
Mouse liver
IV admin.
Discussion:
• New software provides easy data analysis, and results were:
• Same background equivalentdiameter (BED) in pristine and biological samples because of low background at m/z 150 (1-5 counts/dwell)
• No knowledge about NPs smaller than BED value
• Some agglomeration of TiO2 NPsin biological tissue rel. to pristineBED 53 nm
Enzymatic digestionspICP-QQQ-MS of TiO2
in mouse liver
Loeschner, et al., Anal., Bioanal. Chem. (2013), 405, 8185-8195.
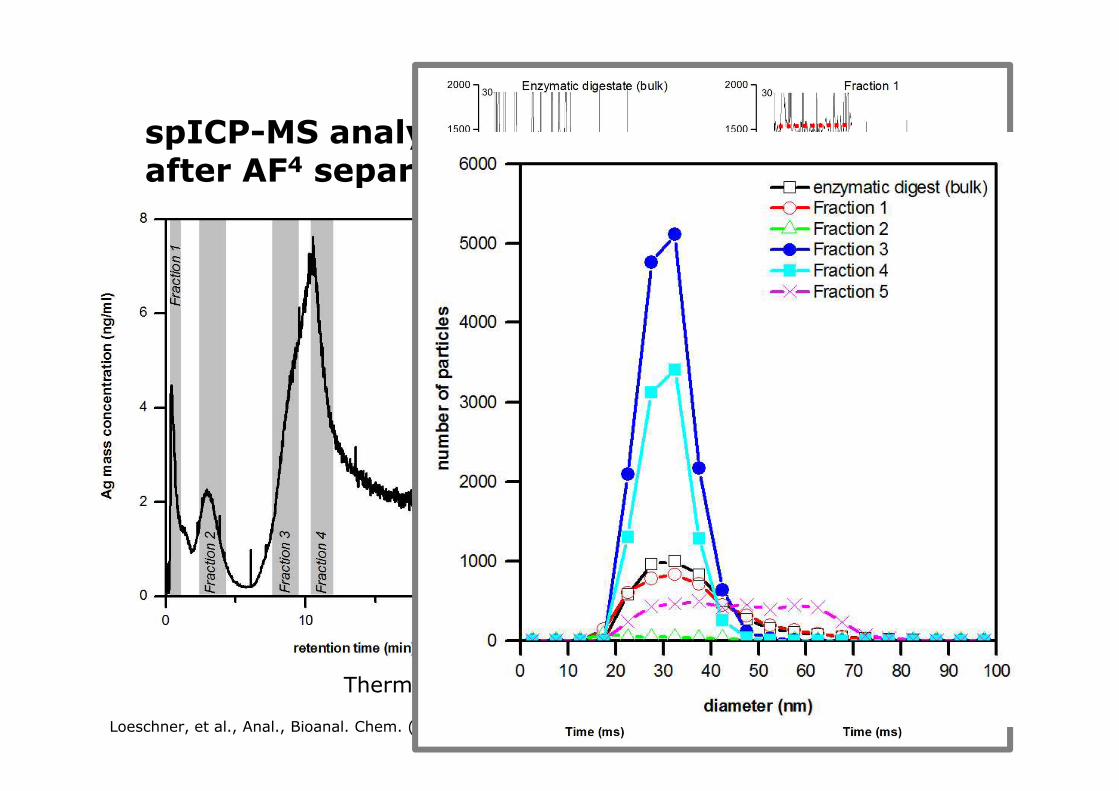
spICP-MS analysis of fractions collectedafter AF4 separation
Thermo Fischer iCAP Q ICP-Q-MS @ 3 ms/60 kdwells
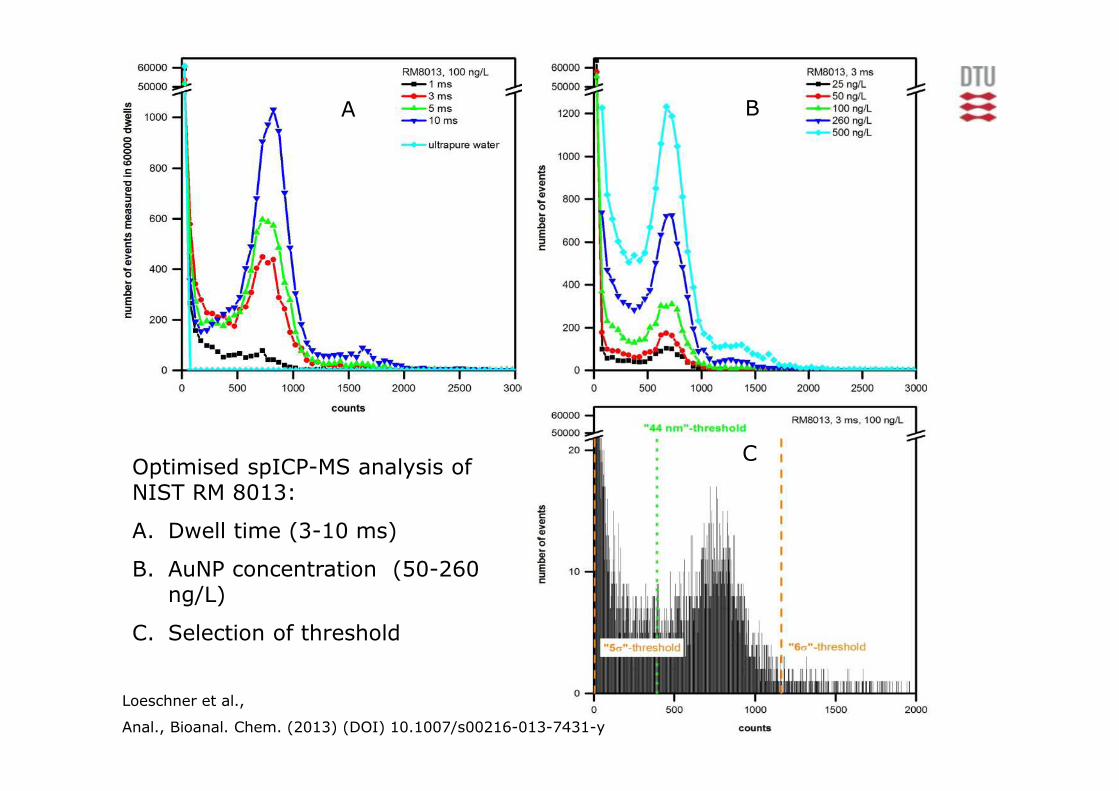
Loeschner et al.,
Anal., Bioanal. Chem. (2013) (DOI) 10.1007/s00216-013-7431-y
Optimised spICP-MS analysis ofNIST RM 8013:
A. Dwell time (3-10 ms)
B. AuNP concentration (50-260ng/L)
C. Selection of threshold
A B
C

AnimalAlkaline
(spICPMS)
Enzymatic
(spICPMS)
Aqua regia
(ICPMS)
1 3368 1794 4970
2 2875 633 3170
3 2144 1433 3922
Mean 2795 1287 4021
RSD (%) 15.6 32.7 15.9
Repeatability
RSD (%)13.0 19.6 17.2
Size and concentration of AuNPs in rat tissue determined by spICPMS after TMAH or enzymatic treatment
� Both sample preparation methods give same AuNP size distribution
� Alkaline sample preparation gives more accurate quantitative results
Number-based sizedistribution, o.d. (nm)
Quantitative results (ng Au/g)
Ref.: Loeschner, K., Brabrand, M., Sloth, J.J., and Larsen, E.H., Anal., Bioanal. Chem. (2013) (DOI) 10.1007/s00216-013-7431-y

Alkaline sample preparation in summary:
• The high content of solubilised organic matter impaired AF4 separation of Ag and Au NPs, but not their ICP-MS detection
• The solubilised organic matter hampered optical detection methods:UV, MALS or DLS, precluding direct sizing information
• The effective tissue solubilisation was however, succesful for ICP-MS detection in single particle mode

Determination of silver nanoparticle sizedistribution @ 1.0 mL/min cross flow
Calibration with size standards (polymer nanoparticles)
44nm
59nm
MALS not possible for sizing
because Ag is an absorbing
Nanoparticle and DLS is insensitive
Löschner et al., J. Chrom. A (In press)

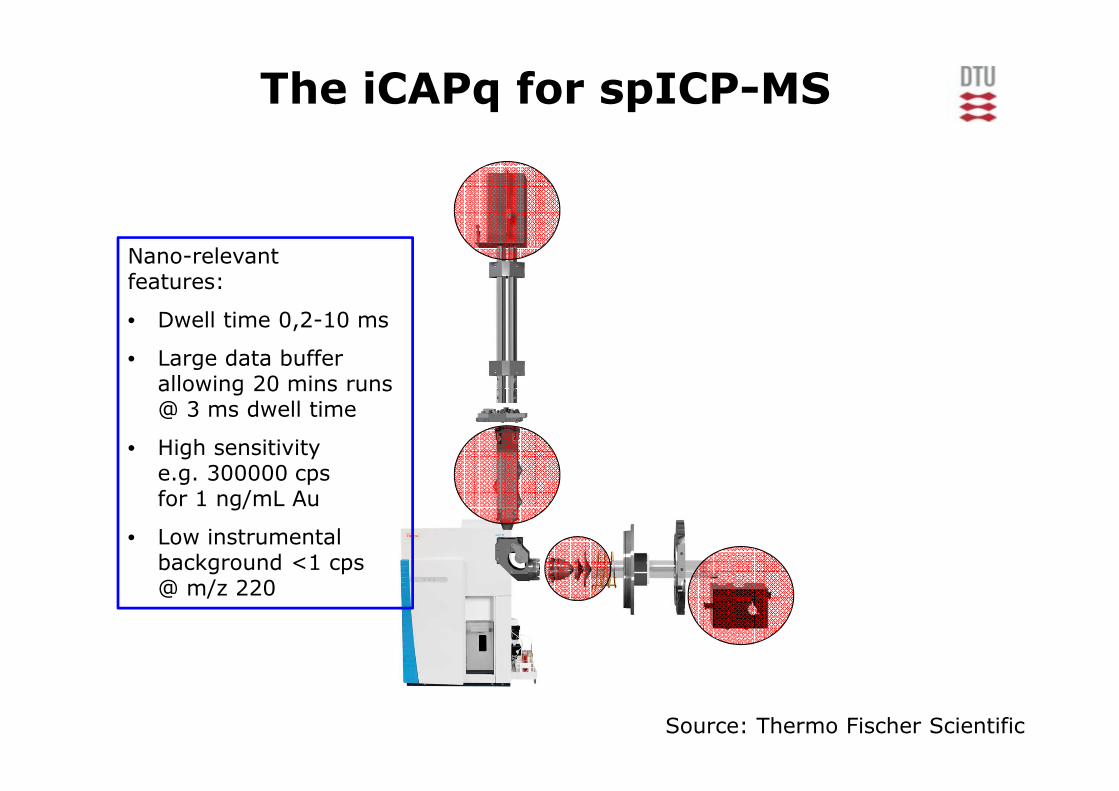
Nano-relevantfeatures:
• Dwell time 0,2-10 ms
• Large data bufferallowing 20 mins runs @ 3 ms dwell time
• High sensitivitye.g. 300000 cpsfor 1 ng/mL Au
• Low instrumental background <1 cps@ m/z 220
Source: Thermo Fischer Scientific
The iCAPq for spICP-MS
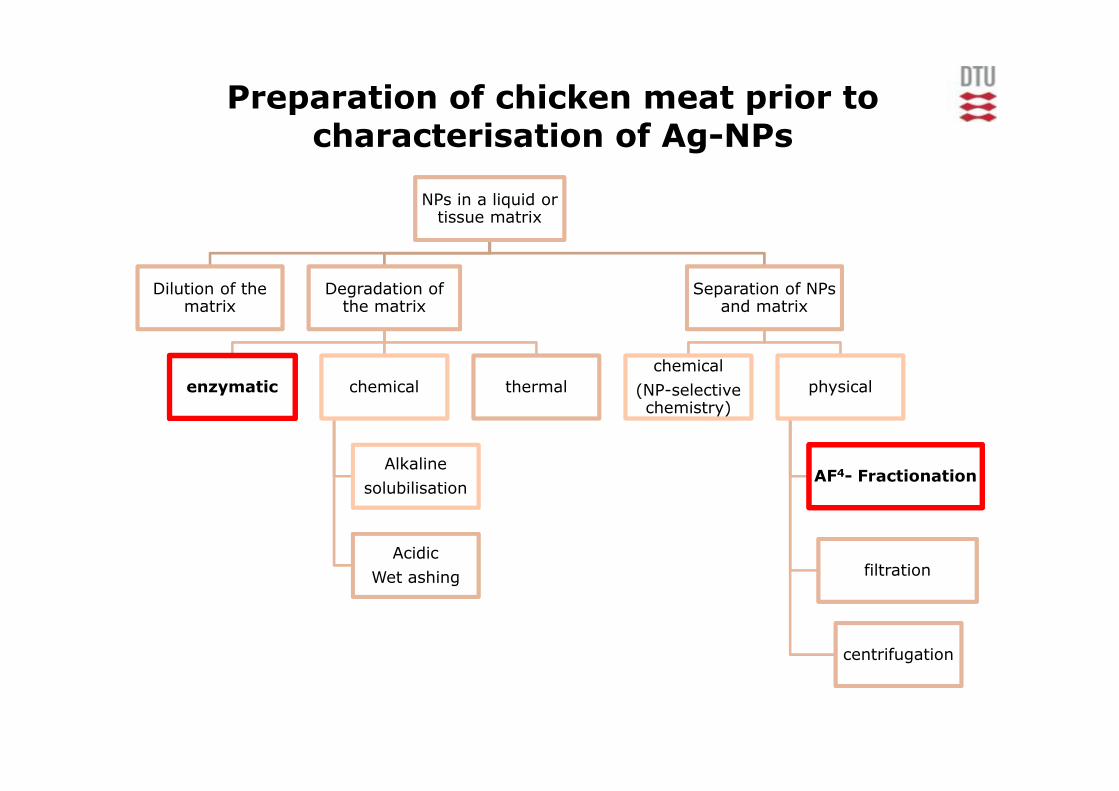
NPs in a liquid ortissue matrix
Separation of NPs and matrix
physical
AF4- Fractionation
filtration
centrifugation
chemicalchemical
(NP-selectivechemistry)
Degradation ofthe matrix
thermalchemical
Alkaline
solubilisation
Acidic
Wet ashing
enzymatic
Dilution of thematrix
Preparation of chicken meat prior tocharacterisation of Ag-NPs

Single particle-ICPMS, the principle
Nano-relevantfeatures:
• Dwell time 0,2-10 ms
• Large data bufferallowing 20 mins runs @ 3 ms dwell time
• High sensitivitye.g. 300000 cpsfor 1 ng/mL Au
• Low instrumental background <1 cps@ m/z 220
Source: Thermo Fischer Scientific
The iCAPq for spICP-MS

Particle “events” during short dwell timesin ICP-MS
3 ms Dwells
60000 dwells
Multiple
events
Single
event
Partial
event x %
Partial
event 100-x %
Duration of
an ion plume
is 200-500 us
6 ms 9 ms 12 ms

Time scan of Ag NPs in water. 50 ng/L; 3 ms dwell; cps at m/z 107 (silver)
0
10000
20000
30000
40000
50000
60000
70000
80000
90000
100000
0 3000 6000 9000 120001500018000210002400027000
Sig
nal hgt(
cps)
Time (ms)
Time scan
Each signal is calibrated by an external standard curve to getmass, which is converted to size by assumption of spherical shape of nanoparticle

AF4- ICP-MS of AgNPs in enzymaticallydigested chicken meat vs. pristine AgNPs
� Significant nanofraction(~80%) recovered
� Formation of additional peaksred curve (0-5 min)
� Pre-elution (~ 2 min) in comparison to pristine AgNPs:
� Sizing by tR problematic �
Q: Does AgNP peak infractogram reflectdissolution or non-ideal fractionation behavior of AgNPs?
0 10 20 30 40
0
2
4
6
8
10
extr
a pe
aks
1 &
2
void
pea
k
nanoparticlepeak
AgNPs diluted with ultrapure water enzymatically digested meat
with AgNPs
Ag
mas
s co
ncen
tratio
n (n
g/m
l)
retention time (min)t0
Loeschner, et al., Anal., Bioanal. Chem. (2013), 405, 8185-8195.

Summary….spICPMS
• Pros
– Easy and fast analysis with state-of.the-art ICP-MS equipment
– Accurate size and size distribution possible
– Fit for monitoring if EU recommended nanodefinition is complied with
– No losses on physical surfaces
• Cons
– Poor mass accuracy
– Method still in it’s infancy (need for dedicated sample preparation methods)
• Therefore:
– Future coupling of sp ICP-MS with separation technique such as FFF to improveNP size separation power
– Target of future coupled method:
• Food, feed and cosmetics monitoring
• Future legislative control of NPs


Agilent 8800 ICP-QQQ
55
Q1 Q2Cell Detector

56
Aim: To produce a stable aqueous suspension of the dry nanoparticles with same characteristics across laboratories
� Energy input required (e.g. by manual shaking/vortexing/milling/ultrasound bath/ultrasound probe)
� Preferably without using stabilisers
Standardisation of dispersion methods
Ball-milling with ZrO2
beads in diluted acetic acidUltrasound probe sonicationin Milli-Q water

NPs in a liquid ortissue matrix
Separation of NPs and matrix
physical
Fractionation
filtration
centrifugation
chemicalchemical
(NP-selectivechemistry)
Degradation ofthe matrix
thermalchemical
Alkaline
solubilisation
Acidic
Wet ashing
enzymatic
Dilution of thematrix
At the forefront of nano-research: Preparationof biological samples prior to NP characterisation

Refs.: Grainger and Castner, 2008
Oberdörster et al, 2007
Q: Why are properties of nanosized particles different
from corresponding bulk material?
A: High proportion of non-coordinated surface atoms
Catalytic activity
Redox activity (ROS formation)
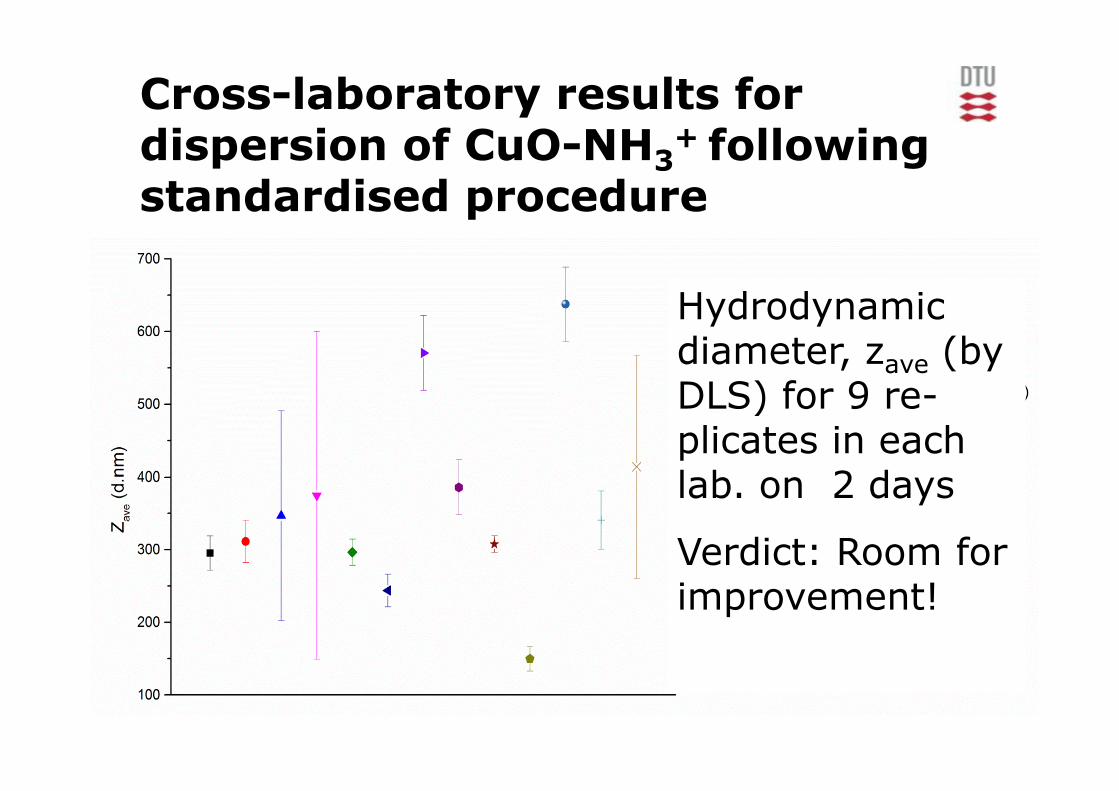
Hydrodynamicdiameter, zave (by DLS) for 9 re-plicates in eachlab. on 2 days
Verdict: Room for improvement!
Cross-laboratory results for dispersion of CuO-NH3
+ followingstandardised procedure
Refs.: Grainger and Castner, 2008
Oberdörster et al, 2007
Q: Why are properties of nanosized particles different
from corresponding bulk material?
A: High proportion of non-coordinated surface atoms

0
0.5
1
1.5
2
2.5
3
10 15 20 25 30 35 40 45
Retention Time (min)
Au/
Rh
- R
atio
• 10 and 60 nm AuNPs in PBS were injected in rats’ tail vein
• Alkaline dissolution of liver tissue following stabilisation of AuNPs with BSA
Aqueous Au-nanoparticlesuspension (10 and 60 nm) firststabilised with BSA and then treatedwith TMAH (pH 13)
TMAH extracts of liver homogenatecontaining 10 and 60 nm AuNPs
Recoveries were 86-123% but separation was unsuccessful
1060
Ref.: Schmidt et al. Anal. Chem. (2011)
AF4-ICP-MS of AuNPs in rat‘s liverdigested with TMAH

62
Dispersion methods (3)CuO NPs with -NH3
+or -COO-
Zave (nm) PDI ζ-potential (mV)
CuO core 1408 ± 69 0.617 14.0 ± 1.2
CuO-CH2-NH3+ 301 ± 5 0.313 27.7 ± 0.5
CuO- COO- 1224 ± 95 0.442 -6.5 ± 0,3

Before you start working…..
•Get the nanoparticles into a stable suspension, but how?
64
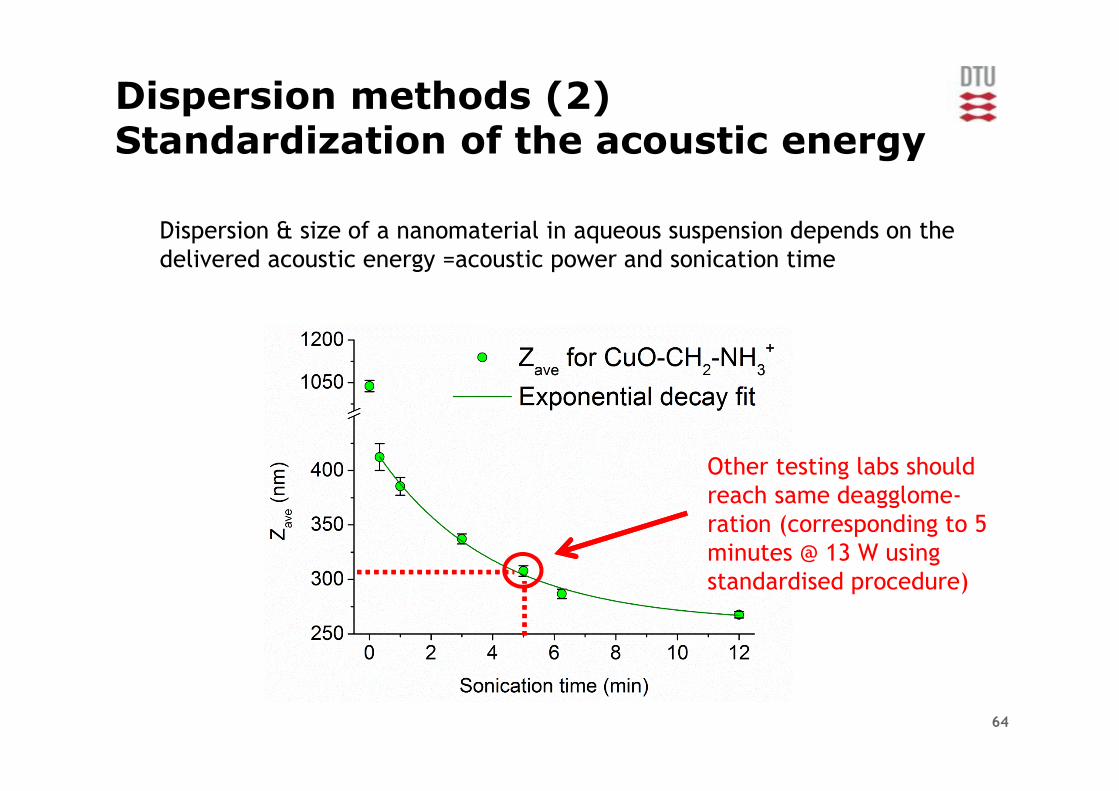
Dispersion methods (2)Standardization of the acoustic energy
Dispersion & size of a nanomaterial in aqueous suspension depends on the
delivered acoustic energy =acoustic power and sonication time
Other testing labs should
reach same deagglome-
ration (corresponding to 5
minutes @ 13 W using
standardised procedure)

Loeschner, et al., Anal., Bioanal. Chem. (2013), 405, 8185-8195.
spICP-MS analysis of fractions collectedafter AF4 separation
Thermo Fisher iCAP Q ICP-Q-MS @ 3 ms/60 kdwells

Q: Do the AgNPs dissolve during enzymaticdigestion at of chicken meat?
Techniques: spICP-MS and TEM
Slight change in particle number
size distribution after enzymatic
sample prep!
Loeschner, et al., Anal., Bioanal. Chem. (2013), 405, 8185-8195.

AnimalAlkaline
(spICPMS)
Enzymatic
(spICPMS)
Aqua regia
(ICPMS)
1 3368 1794 4970
2 2875 633 3170
3 2144 1433 3922
Mean 2795 1287 4021
RSD (%) 15.6 32.7 15.9
Repeatability
RSD (%)13.0 19.6 17.2
Size and concentration of AuNPs in rat tissue determined by spICPMSafter TMAH or enzymatic treatment
� Both sample preparation methods give same AuNP size distribution
� Alkaline sample preparation gives more accurate quantitative results
Number-based sizedistribution, o.d. (nm)
Quantitative results (ng Au/g)
Ref.: Loeschner, K., Brabrand, M., Sloth, J.J., and Larsen, E.H., Anal., Bioanal. Chem. (2013) (DOI) 10.1007/s00216-013-7431-y

AF4-DLS-ICP-MS fractogram of gold nanoparticles in aqueous suspension
0
0.2
0.4
0.6
0.8
1
1.2
1.4
1.6
1.8
2
10 15 20 25 30 35 40 45Retention Time (min)
Au/
Rh
- R
atio
0
10
20
30
40
50
60
70
80
90
100
Hyd
rody
nam
ic D
iam
eter
(n
m)
10 nm Au NPs
30 nm Au NPs
20 nm Au NPs
60nm Au NPs
AFFF mobile phase: 0.05% SDS
0 5 100
170000
17000
17000
17000
17000
Time (min)
Au Standard
Au NP 10 nm
Au
(cps
) Au NP 20 nm
Au NP 30 nm
Au NP 60 nm
Noise characteristics of ICP-MS detection of 0.5 ng/mL Au NPs @ 4 sizes (100 ms dwell time) and ionicstandard
Ref.: Schmidt et al. Anal. Chem. (2011)
Statement: Life is quite easywhen working with stable nanoparticles in aqueoussuspension
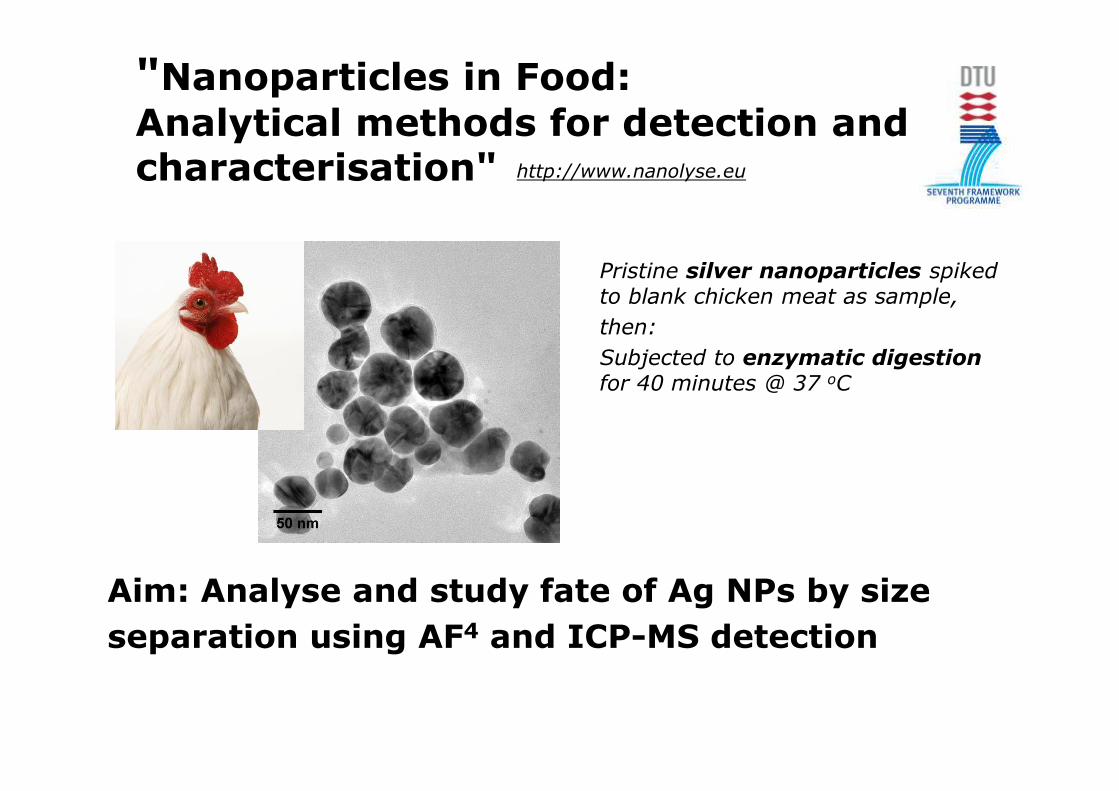
"Nanoparticles in Food: Analytical methods for detection andcharacterisation" http://www.nanolyse.eu
Pristine silver nanoparticles spikedto blank chicken meat as sample,
then:
Subjected to enzymatic digestionfor 40 minutes @ 37 oC
Aim: Analyse and study fate of Ag NPs by size
separation using AF4 and ICP-MS detection

Optimized AF4 fractionation of pristineAgNPs in aqueous suspension
For further details of AF4 optimisation see: Loeschner et. al, J. Chrom. A (2012)
Cross flow rate of carrier,
50 mM HN4HCO3 (mL/min)
1 mL/min for optimum selectivity and analysis time