Nanohybrids Based on Solid and Foam Polyurethanes
63
APPROVED: Witold Brostow, Major Professor Richard F. Reidy, Committee Member Samir Aouadi, Committee Member Sundeep Mukherjee, Committtee Member Nigel Shepherd, Chair of the Department of Materials Science and Engineering Costas Tsatsoulis, Interim Dean of the Toulouse Graduate School NANOHYBRIDS BASED ON SOLID AND FOAM POLYURETHANES Chong Bo, B.E. Thesis Prepared for the Degree of MASTER OF SCIENCE UNIVERSITY OF NORTH TEXAS May 2015
Transcript of Nanohybrids Based on Solid and Foam Polyurethanes

APPROVED:
Witold Brostow, Major Professor Richard F. Reidy, Committee Member Samir Aouadi, Committee Member Sundeep Mukherjee, Committtee Member Nigel Shepherd, Chair of the Department of
Materials Science and Engineering Costas Tsatsoulis, Interim Dean of the
Toulouse Graduate School
NANOHYBRIDS BASED ON SOLID AND FOAM POLYURETHANES
Chong Bo, B.E.
Thesis Prepared for the Degree of
MASTER OF SCIENCE
UNIVERSITY OF NORTH TEXAS
May 2015

Bo, Chong. Nanohybrids Based on Solid and Foam Polyurethanes. Master of Science
(Materials Science and Engineering), May 2015, 52 pp., 4 tables, 26 figures, references, 40
numbered titles.
Polymer nanocomposites are a going part of Materials Science and Engineering. These new
composite materials exhibit dimensional and thermal stability of inorganic materials and
toughness and dielectric properties of polymers. Development of nanocomposites become an
important approach to create high-performance composite materials.
In this study silica, fly ash, silica nanotubes and carbon black particles have been added to
modify polyurethane foam and thermoplastic polyurethanes. It has been found that the addition
of silica can diminish the size of foam bubbles, resulting in an increased stiffness of the material,
increase of the compressive strength, and greater resistance to deformation. However, the
uniformity of bubbles is reduced, resulting in increased friction of the material. Fly ash added to
the foam can make bubbles smaller and improve uniformity of cells. Therefore, the material
stiffness and compressive strength, resistance to deformation, and has little impact on the
dynamic friction of the material. Adding nanotubes make bubble size unequal, and the
arrangement of the bubble uneven, resulting in decreased strength of the material, while the
friction increases. After the addition of carbon black to the polyurethane foam, due to the special
surface structure of the carbon black, the foam generates more bubbles during the foaming
process changing the foam structure. Therefore, the material becomes soft, we obtain a flexible
polyurethane foam.
The results of mechanical properties determination of the thermoplastic polyurethane show

that adding particles may increase the stiffness and wear resistance of the thermoplastic
polyurethane, while the tensile properties of the material are reduced. This phenomenon may be
due to agglomeration of particles during the mixing process. Possibly the particles cannot be
uniformly dispersed in the thermoplastic polyurethane.

Copyright 2015
by
Chong Bo
ii

ACKNOWLEDGEMENTS
This thesis was prepared, under the distinguished Dr. Witold Brostow careful supervision.
I thank Dr. Witold Brostow for offering to me the opportunity to work and study in the LAPOM.
Dr. Witold Brostow rigorous scholarship, profound theoretical knowledge, excellent research
skills, a wealth of practical experience, also generous character, positive style of work that I will
never forget. I heartfeltly thank Dr. Witold Brostow for his care and guidance.
I thank my partner Yingji Wu for her help to me in this work. I am very honored to be
working with her. I also would like to thank the lab manager Nathalie Hnatchuk and my entire lab
including colleagues Gregory, Zachary and Thomas for their support and help during the work. In
interaction with them, I acquired much valuable knowledge, what is important for my research and
future work.
I want to thank my parents for their concern, encouragement and support over the years.
Thanks to my husband for staying with me. Family support has been my power source in my
progress.
iii

TABLE OF CONTENTS
Page
ACKNOWLEDGEMENT ............................................................................................................. iii
LIST OF TABLES ........................................................................................................................ vii
LIST OF FIGURES ..................................................................................................................... viii
CHAPTER 1 INTRODUCTION .....................................................................................................1
1.1 Purpose .....................................................................................................................1
1.2 Polymer Nanocomposites ........................................................................................2
1.2.1 Mixed Method ..............................................................................................3
1.2.2 Sol-Gel Method ............................................................................................3
1.2.3 Intercalation Method ....................................................................................4
1.2.4 In Situ Polymerization .................................................................................5
1.3 Rigid Polyurethane Foams .......................................................................................5
1.4 Polyurethane Foam + Inorganic Nanocomposites ...................................................6
1.4.1 Polyurethane Foam + Calcium Carbonate Nanocomposites .......................6
1.4.2 Polyurethane Foam / Silicate Nanocomposites............................................7
1.5 Application of Polyurethane Foam ..........................................................................7
1.6 Description of Thermoplastic Polyurethanes ...........................................................8
1.6.1 Thermoplastic Polyurethanes .......................................................................8
1.6.2 Classification of Thermoplastic Polyurethanes ...........................................8
1.7 Thermoplastic Polyurethane + Inorganic Nanocomposites .....................................9
1.7.1 Thermoplastic Polyurethane + Carbon Matrix Composites ........................9
1.7.2 Thermoplastic Polyurethane + Layered Silicate Nanocomposites ............10
iv

CHAPTER 2 SAMPLE PREPARATION .....................................................................................12
2.1 Material ..................................................................................................................12
2.1.1 Polyurethane Foam ....................................................................................12
2.1.2 Thermoplastic Polyurethanes .....................................................................12
2.1.3 Filler Particles ............................................................................................13
2.2 Polyurethane Foam Sample Preparation ................................................................13
2.2.1 Principle of Foaming Polyurethane Foam .................................................13
2.2.2 Polyurethane Foam Sample Preparation ....................................................14
2.3 Thermoplastic Polyurethane Sample Preparation ..................................................15
2.3.1 Structure and Principles of Thermoplastic Polyurethanes .........................15
2.3.2 Thermoplastic Polyurethanes Sample Preparation ....................................16
CHAPTER 3 EXPERIMENTAL TECHNIQUES.........................................................................18
3.1 Compression Testing .............................................................................................18
3.1.1 Compression Testing Procedure ................................................................18
3.1.2 Compression Testing Details .....................................................................19
3.2 Three Points Bending Testing ................................................................................19
3.2.1 Three Points Bending Test Principle .........................................................19
3.2.2 Three Points Bending Testing Details .......................................................21
3.3 Pin-on-Disk Tribometry .........................................................................................21
3.3.1 Pin-on-Disk Tribometry Principle .............................................................21
3.3.2 Pin-on-Disk Tribometry Details ................................................................21
3.4 Thermal Conductivity Test ....................................................................................22
3.4.1 Thermal Conductivity Test Principle .........................................................22
v

3.4.2 Thermal Conductivity Test Details ............................................................23
3.5 SEM .......................................................................................................................23
3.5.1 SEM Principle ............................................................................................23
3.5.2 SEM Detail.................................................................................................25
3.6 Tensile Testing .......................................................................................................25
3.6.1 Tensile Testing Principle ...........................................................................25
CHAPTER 4 RESULTS AND DISCUSSION ..............................................................................27
4.1 Testing of Polyurethane Foam ...............................................................................27
4.1.1 Volume Testing ..........................................................................................27
4.1.2 Compression Testing .................................................................................28
4.1.3 Three Points Bending .................................................................................35
4.1.4 SEM ...........................................................................................................38
4.1.5 Pin-on-Disk Tribometry .............................................................................40
4.1.6 Thermal Conductivity Results ...................................................................41
4.2 Thermoplastic Polyurethanes .................................................................................42
4.2.1 Tensile Testing ...........................................................................................42
4.2.2 Pin-on-Disk Tribometry .............................................................................45
CHAPTER 5 CONCLUSIONS .....................................................................................................47
REFERENCES ..............................................................................................................................48
vi

LIST OF TABLES
Page
Table 1 Properties of Polyurethane Foam ...........................................................................12
Table 2 Properties of Estane® CP80AS2 TPU ...................................................................13
Table 3 Particle Size of Four Types of Fly Ash ..................................................................30
Table 4 Components of the Four Types of Fly Ash ............................................................31
vii

LIST OF FIGURES
Page
Figure 1 Thermoplastic polyurethanes sample preparation .................................................15
Figure 2 Thermoplastic polyurethanes structure ..................................................................16
Figure 3 MTS Qtest/5 ...........................................................................................................19
Figure 4 Three points bending test .......................................................................................20
Figure 5 TPS 1500 Thermal Conductivity System ..............................................................23
Figure 6 Structural diagram of the scanning electron microscope (SEM) ...........................24
Figure 7 Tensile testing of thermoplastic polyurethane .......................................................26
Figure 8 Volume test result of polyurethane foams .............................................................27
Figure 9 Silica compression modulus ..................................................................................28
Figure 10 Fly ash compression modulus ................................................................................29
Figure 11 Monticello fly ash compression modulus ..............................................................32
Figure 12 Compression modulus of silica nanotubes and carbon black ................................33
Figure 13 Compression test result for 20% filler concentrations ...........................................34
Figure 14 Compression strength of polyurethane foam mix with 20 wt.% filler ...................34
Figure 16 Flexural modulus values from the three points bending tests ................................36
Figure 17 Break strain and break stress of three points bending test .....................................37
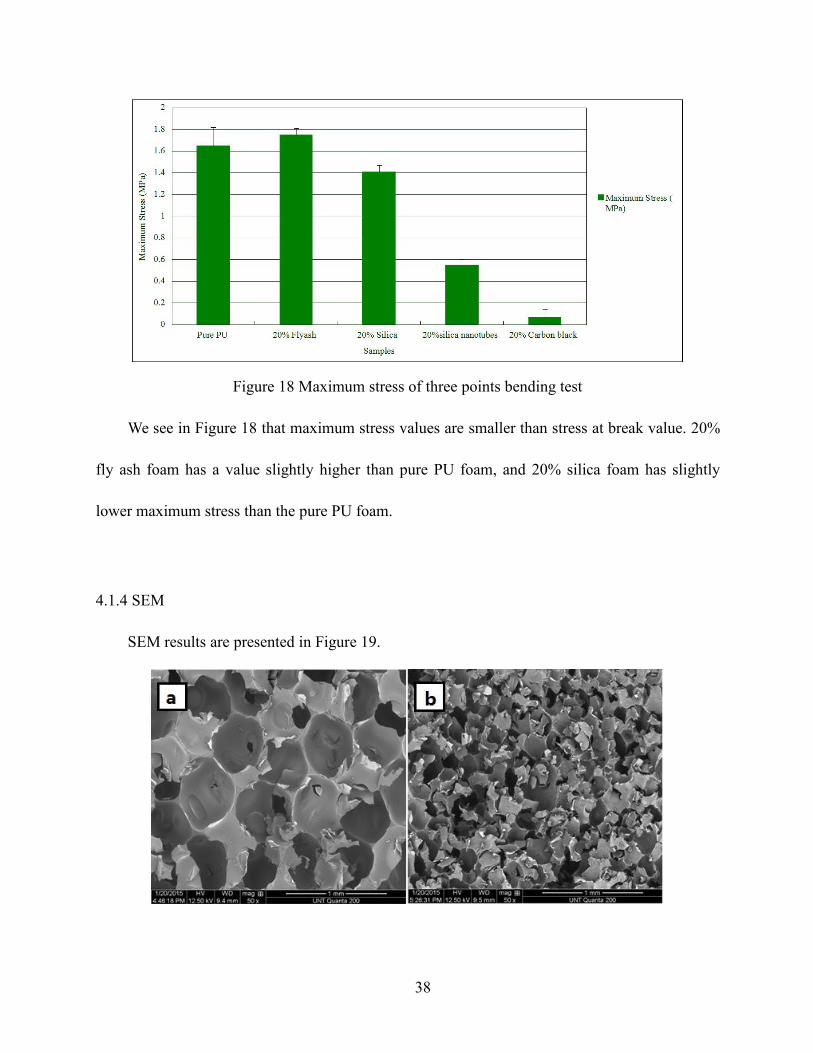
Figure 18 Maximum stress of three points bending test ........................................................38
Figure 19 Polyurethane rigid foam microstructure obtained by scanning electron microscopy (SEM) analysis at 50 times magnification .........................................39
Figure 20 Dynamic friction of polyurethane foam .................................................................40
Figure 21 Thermal conductivity of polyurethane foam..........................................................41
Figure 22 Tensile testing result for thermoplastic polyurethanes with 20% filler .................43
viii

Figure 23 Tensile modulus of thermoplastic polyurethane ....................................................43
Figure 24 Maximum stress of thermoplastic polyurethane ....................................................44
Figure 25 Break strain of thermoplastic polyurethane ...........................................................44
Figure 26 Dynamic friction of thermoplastic polyurethane ...................................................46
ix

1
CHAPTER 1
INTRODUCTION
1.1 Purpose
Polyurethanes are a class of large molecular compounds containing repeat carbamate group
in the main chain. They are composed of an organic diisocyanate or multi isocyanate with two
hydroxyl or polyhydroxy compounds.
Based on the variations of polyurethane components, polyurethanes (PUs) can have a wide
range of properties. Therefore, polyurethanes can be used in a wide range of applications.
Polyurethanes can be foams, coatings, adhesives, elastomers, and fibers. Rigid polyurethane
foams have good heat insulating properties, light weight, high specific strength, provide sound
insulation, are shockproof, provide electric insulation and more. Consequently, rigid PU foams
have applications in the freezer, piping, building, refrigerators, and transportation 1.
Thermoplastic polyurethanes (TPUs) are elastomers. They are different from rubbers
because TPUs do not have crosslinks. Therefore TPUs can change shape at high temperatures. As
elastomers, TPUs have significant advantages. They have a wide range of hardness, high
mechanical strength, cold resistance, oil resistance, and solvent resistance. TPUs main
applications include auto parts, cables, footwear, bags and more.
Although polyurethanes foams and TPUs have very good properties for many applications,
they also have some shortcomings in performance. For example,

2
PU foams do not have good mechanical properties. TPUs lack mechanical strength.
Therefore, there is a need to enhance their mechanical properties. Nanohybrids particles have
small sizes and large surface areas. When the particle sizes decrease, the surface energy and
surface tension increase. When the PU materials are modified by nanohybrids, the resulting
composites not only maintain the advantageous properties of polymeric materials but also can
have many beneficial properties of nanohybrids.
This thesis is focused on the polyurethanes modified by different types of nanohybrids
particles, enabling comparisons the several nanohybrids influence the rigid polyurethane foams
and TPUs.
1.2 Polymer Nanocomposites
Work on polymer nanocomposites has grown in recent years. In general, we are dealing less
than 100 nm particles of a dispersed phase in a composite material 2,3. Such composite materials
can well combine rigidity, dimensional and thermal stability of inorganic material and polymer
materials toughness and dielectric behavior. Preparation of nanocomposites has become an
important way to acquire high-performance composites. There are several ways to prepare
nanocomposites, including four commonly used methods 30.

3
1.2.1 Mixed Method
Mixed method refers to the preparation of various forms of nanoparticles first, and then the
nanoparticles are dispersed into the polymer matrix. An advantage of this method is stepwise
controlled morphology and size of nanoparticles. However, because the surface activity of nano
powders, and their strong tendency to self-aggregation when blending it, is difficult to ensure
uniform dispersion of nanoparticles in the matrix, so as to obtain the nano-composite material in
true sense. Thus, typically prior to mixing, a surface treatment of the nanoparticles or the
dispersant is preformed, in order to facilitate the particle dispersion in the matrix as uniform as
possible.
1.2.2 Sol-Gel Method
Using water-soluble salts or alcohol-soluble salt, the polymer is dissolved in water or in an
organic solvent to form a homogeneous solution. Hydrolysis or alcoholysis material reacts to
form nanoscale particles of an inorganic oxide, and a sol system. This is followed by conversion
of the sol into a gel by evaporation to dryness, with the inorganic nanoparticles uniformly
dispersed therein. Sol-gel prepared nanocomposites have the advantages of a low temperature
process, high purity, while high uniformity material can be prepared in large quantities. The
features can be controlled from the initial stage of the process to the material structure at the
nanometer scale, achieving good binding between the inorganic and the organic phases. The
biggest problem of the method is at the stage of the gel drying process, since volatilization of

4
solvent or water may result in material shrinkage or embrittlement. Further, the number of types
of nanocomposites can be prepared in this manner is limited 31.
1.2.3 Intercalation Method
Many inorganic compounds, such as clays silicates, phosphates, graphite, some metal
oxides, disulfides, trisulfide phosphorus complexes, have a typical layered structure. Polymer
monomers can be deposited into the inorganic material layer by in situ polymerization otherwise
polymer is directly deposited into the inorganic layer, thus obtaining organic or inorganic
nanocomposites. Depending on the specific implementation method, intercalation method can be
divided further into three methods:
(a) Intercalation polymerization: The organic monomer is deposited into the layer of
inorganic material with a layered structure, what leads to in situ polymerization of monomer in
the interlayer. During the polymerization, the inorganic layer spacing increases, becomes
independent of the thickness of the sheet-like nanoscale, and is uniformly dispersed in the
continuous phase polymer, thus obtaining organic - inorganic nanocomposites 32.
(b) Solution intercalation: The co-polymer and layered inorganic compounds are dispersed
in a solvent. Then the polymer in solution goes directly into the inorganic layer 33,34.
(c) Melt intercalation: The layered inorganic compounds with molten polymer blend.
Polymer is inserted directly into the inorganic layer to obtain polymers intercalated inorganic
nanocomposites 34.
5
1.2.4 In Situ Polymerization
In situ polymerization is performed so that nanoparticles are uniformly dispersed in a
polymer after polymerization under certain conditions, to directly obtain nano-composites 35.
This approach provides a polymer nano-template with a molecular structure containing to
polar groups, one of them a sulfonic acid group, plus an acid group shuttle. The polar groups can
strong bind with ionic bonds and coordination bond which are formed between metal ions of
strongly polar inorganic nanoparticles, thereby reducing the probability of collisions between
particles. While the polymer chains can prevent excessive accumulation of particles, at certain
location. These polar polymers containing an ionic group include ionomers, ion exchange resins,
the polar group-containing homopolymers, copolymers and more.
1.3 Rigid Polyurethane Foams
A porous polyurethane material contains a large number of fine pores forming main and
collateral channels. The resulting material is commonly known as "polyurethane foam".
According to the ratio of soft and hard PU constituents, we can have three types of foam: soft,
rigid and semi-hard 36.
Rigid polyurethane foams, are referred to as the PURFs, PURFs are a solid phase and gas
phase composite materials, wherein the solid phase is the continuous one providing, the main
mechanical structure in a closed cell structure gas container. The mechanical properties depend
mainly on the foam morphology. Pure PURFs show relatively low tensile and compression
6
strength. Value to further enhance the mechanical properties, commonly used are inorganic
particles, glass fiber and other material 4.
Rigid polyurethane foams form closed cell structures, have good heat insulation properties,
light weight, high specific strength, and other excellent characteristics. They provide sound
insulation, are shockproof, give electric insulation, heat resistance, cold resistance, and solvent
resistance 5. Such foams are widely used in refrigerators, freezers, cold storage box adiabatic
layers, refrigerated trucks and other insulation structures. Smaller amounts are used for
non-adiabatic applications, such as imitation wood packing materials, etc. In general, a
polyurethane hard bubble of low density is mainly used for thermal insulation materials; high
density polyurethane rigid foams can be used as structural materials.
Rigid polyurethane foams are generally at room temperature; the molding process is
relatively simple. According to the degree of construction mechanization, the processes can be
divided into manual and mechanical foaming. Foaming pressure can be either high or low. Press
molding can be divided into pouring foaming and spraying foaming 6.
1.4 Polyurethane Foam + Inorganic Nanocomposites
1.4.1 Polyurethane Foam + Calcium Carbonate Nanocomposites
Calcium carbonate is the filler often used in polymer modification, a cheap material 7.
Calcium carbonate surface hydroxyl groups can react with isocyanates. Thus the calcium
carbonate particles can be uniformly dispersed in the isocyanate, making it easier to play a
7
reinforcing role 8.
1.4.2 Polyurethane Foam / Silicate Nanocomposites
Add a small amount of dispersed nano-scale layered nano silicate, can significantly improve
the PURF foam heat resistance, strength, modulus and gas barrier properties. Montmorillonite,
garnet, rectories, meerschaum, talc and other nano-layered silicate are used. Silicates may be
well dispersed in the isocyanate and polyol, improving the mechanical properties of the PU
foams7.
1.5 Application of Polyurethane Foam
A rigid polyurethane foam, is composed of a rigid foam polyether polyol, and aggregation
of MDI (also known as black material). Such foams are widely used in refrigerators, spraying,
solar energy, devices heat pipelines, construction and other fields.
1.Freezing equipment and food industry: such as refrigerator, cold storage, refrigerated
trucks.
2.Industrial equipment such as tanks, pipelines and other industrial equipment that require
insulation.
3.Building materials: in developed countries in Europe and America, rigid polyurethane
foams account for about half of total consumption of hard foams.
4.Transportation: such as automobile roofs, interior decorations etc.

8
5.Imitation wood: high density (density 300-700kg/m3) rigid polyurethane foam or glass
fiber reinforced rigid foams also called imitation wood, have high strength, good toughness, and
easy formation by a simple process. One achieves a higher, strength than the natural wood.
6.Potting materials.
1.6 Description of Thermoplastic Polyurethanes
1.6.1 Thermoplastic Polyurethanes
Thermoplastic polyurethanes (TPUs) are elastomers different from other elastomers. TPUs
are elastic and melt-processable. TPUs can be processed by extrusion, injection molding, blow
molding, die-casting method 9, can be coated and colored and are suitable for a variety of
manufacturing methods. The process can be repeated without losing structural integrity after
processing. Moreover, TPUs have good mechanical properties, such as high tensile strength, high
elongation and resistance to oil, grease, solvent, abrasion. Since TPU has many excellent
properties, it has been applied in a variety of fields 10.
1.6.2 Classification of Thermoplastic Polyurethanes
There are three main chemical classes of TPU: polyester, polyether and polycaprolactone 11.
Polyester TPUs: they are compatible with PVC or other polar plastics materials, added in
order to increase the performance of the material. Such TPUs are oil resistant and abrasion
resistant 37.

9
Polyether TPUs: they are slightly lower in specific gravity than polyester and
polycaprolactone grades. This PU have good abrasion resistance, tear resistance and toughness at
low temperatures. Because they can resist microbes and also exhibit water resistance, Polyether
TPUs can be widely used in underwater environments 38.
Polycaprolactone TPUs: they exhibit high toughness and a relatively high resistance to
hydrolysis. They are an ideal raw material for hydraulic and pneumatic seals19.
1.7 Thermoplastic Polyurethane + Inorganic Nanocomposites
1.7.1 Thermoplastic Polyurethane + Carbon Matrix Composites
Currently in the preparation of thermoplastic polyurethane + carbon nanotube composites, a
common method is to use a strong acid for the surface modification of carbon-based materials 39.
Typically one applies nitric acid or mixed acid with carbon nanotubes subjected to oxidation
treatment to modify the surface properties. One so improves compatibility of the carbon
nanotubes and the polyurethane, and increases the filler dispersibility in the polymer matrix.
Meanwhile, after the acid treatment of carbon-based material, its surface may be added carboxyl
and hydroxyl reactive groups. These reactive groups can not only improve the interface
compatibility between the substrate, it can also participate in the reaction to form a chemical
bond composite 12.

10
1.7.2 Thermoplastic Polyurethane + Layered Silicate Nanocomposites
Layered silicates can be relatively easily dispersed in the TPUs. According to the study of
Bradley Finnigan 14, the layered silicate can enhance the rigidity of the thermoplastic
polyurethane, but decreases the tensile strength of the material. Asim Pattanayak 29. reported that
the layered silicate clay may enhance the thermal stability of the material, and to increase the
mechanical strength 40.
Rectories are an inter-layer structure of non-metallic minerals. They are layered silicates.
The inter-layer contains switchable hydrated cations. Rectories are one of the few natural mineral
materials with easy separation into nanometer microchips. After appropriate processing, rectories
interlayer structure can be separated into Nanoparticles of mica and montmorillonite 13. Rectories
enhancing the mechanical properties of the material, can keep the toughness of polymer
materials.
1.8 Application of Thermoplastic Polyurethanes
1.Footwear: shoes, sports shoes, air cushions, mountaineering shoes, snow shoes, golf
shoes, skating shoes, fabrics and lining joint material.
2.Apparel: snow clothes, windbreaker, jacket, cold proof raincoat, field service, paper
diapers, fabric composite materials (such as waterproof and moisture permeable).
3.medicine: operation clothes, hat, shoes, hospital mattresses, ice bags, bandages, plasma
bags, surgical dressing cloth, masks, the fabric and lining material, operation bed bags.
4.Military uses: the aircraft fuel tanks, weapons, tents, protection window sealed film bags,

11
life jackets and inflatable boats.
5.Sports: football surfaces and inner linings, inflatable beds, water bags, ski gloves
(waterproof bag), diving suits, ski jackets, swimwear, skis, trademarks, air bag, sport shirts, thin
clothing such as fabric and lining materials.
6.Industrial supplies: loudspeaker drum paper rubber edges, sound insulation materials,
fire-proof materials, fireproof clothes, fire service products, fireproof cloth and other fabrics and
lining composite material.
7.Other applications: mobile phone keys, the plastic inflatable toys, bed sheets, tablecloths,
shower curtains, furniture, cloth, aprons, pianos, keyboards, coated fabric and lining materials
and more.

12
CHAPTER 2
SAMPLE PREPARATION
2.1 Material
2.1.1 Polyurethane Foam
Polyurethane foam used was ‘Polyurethane Mix and Pour Foam’ purchased from Fibre
Glast. It has two liquid parts: #625(Diphenylmethane diisocyanate)and #624 (Polyol). Table I
shows their properties. After mixing two liquids for 60 seconds, the material will begin to react
and expand for several minutes. Before cure, the foam is expanded for 10 minutes. It can fill any
shape.
Table 1 Properties of Polyurethane Foam
2.1.2 Thermoplastic Polyurethanes
Estane® CP80AS2 TPU was used, and also Estane® CP80AS2 TPU which is a polyester
TPU. Both are compatible with PVC, oil resistant, abrasion resistant and are well suited for
blending process.

13
Table 2 Properties of Estane® CP80AS2 TPU
2.1.3 Filler Particles
In this study, I used several types of particles, including silica, silica nanotubes, carbon
black and fly ash. Silica used was MIN-U-SIL Fine Ground Silica, 10 micron maximum size,
purchased from US SILICA. Carbon black (surface area 350 m2/g) was purchased from
COLUMBIAN CHEMICALS COMPANY. Silica nanotubes, 30-70nm×1-3μm, was purchased
from SIGMA-ALDRICH. There are four types of fly ash: Rockdale Fly Ash, Monticello Fly Ash,
San Miguel Fly Ash, and Wansley Fly Ash.
2.2 Polyurethane Foam Sample Preparation
2.2.1 Principle of Foaming Polyurethane Foam
Rigid polyurethane foams are made by mixing two liquid parts, one is polyol and the other
one is isocyanate. Polyurethane foam rise is obtained by combining polyol component,

14
isocyanate component, water and foaming agent in two processes, foaming reaction and curing
reaction 15. In the foaming reaction, isocyanate component reacts with water and generates gas
by chemical reaction, thus achieving the foaming effect. The chemical reaction can be written as:
222 CONHOHNCO
The second process is the curing reaction, involving the amine group and isocyanate
component producing resin. The chemical reaction can be written as:
NHCONHNCONH2
OCONHNCOOH
From the above we can see the increase of water contents increase the carbon dioxide
production. Thus, we can obtain the polyurethane foam of different densities by adjusting the
dosage of water.
2.2.2 Polyurethane Foam Sample Preparation
In situ polymerization was used to modify the polyurethane foam. The polymerization
operation is very simple and easy to control. Preparation of polyurethane foams should follow
these steps:
1.Taking #625 mixed with particles in a cup, and putting #624.
2.Pouring the mixed solution into a mold, the mold is rectangular mold with width 2.6 inch,
length 2.6 inch and height of 3 inch.
3.Foaming. Let the solution foam for half an hour, until the foam has solidified and cooled

15
down.
4.Cutting into various shapes for various tests.
Figure 1 Thermoplastic polyurethanes sample preparation
2.3 Thermoplastic Polyurethane Sample Preparation
2.3.1 Structure and Principles of Thermoplastic Polyurethanes
A TPU is a multi-phase block copolymer that is created when three basic raw materials are
combined together in a specific way:
A polyol or long-chain diol;
A chain extender or short-chain diol;
A diisocyanate.

16
Figure 2 Thermoplastic polyurethanes structure
The polyols and the chain extender react with the diisocyanates through polyaddition to
form linear polyurethane. Flexible segments are created by the reaction of the polyol with the
diisocyanate. The combination of diisocyanate with short-chain diol produces the rigid
component 19.
Due to the structure of TPU, it is made up of block copolymer molecules with alternating
rigid and flexible segments. We have combination of flexible, elastic segments with a high
extensibility and low glass transition temperature.
2.3.2 Thermoplastic Polyurethanes Sample Preparation
Before making samples, thermoplastic polyurethanes should dry one night at 60°C in the
oven. After the drying, mixing into the cup and put them into a Brabender machine. The mixing
temperature is 200°C; one turns on rotors for 2 minutes. The speed is 50 RPM. The material
should be put into the machine slowly, and not put in too much at one time. After the mixing, one

17
closes the cover and keeps 200°C for 4 minutes. When the mixing process is finished, one turns
off the rotors, opens the cover and uses a small spade to take down the material before it
becomes cold. Since the mixed material is a big block, it needs to be cut to small pieces.
Then one put the small pieces of the material into the mold and uses compression molding
to form desired shapes. First, the mold is placed in the compression molding machine preheated
10 minutes; the preheating temperature is 200°C; Then 10 tons pressure is applied to the mold.
Second, the residual gas in the material is discharged by decreasing the pressure to 0 tons and
then increasing it again to 10 tons, repeated three times. After the gas has been discharge, the
mold is cooled down by water.

18
CHAPTER 3
EXPERIMENTAL TECHNIQUES
In the study of polymer modification by add particles, the range of applications of the
material and the mechanical properties required for the focus needs to be considered.
Characterizations of the compressive strength, flexural modulus, thermal conductivity, tensile
modulus, frictional behavior, and surface morphology, have to be taken into account.
Compression testing, three points bending testing, tensile testing and thermal conductivity
determination have been performed together with pin-on-disk tribometry. SEM was used to
observe surface morphology.
3.1 Compression Testing
3.1.1 Compression Testing Procedure
Compressive strength is a very important value for the materials. In the study of strength of
materials, the compressive strength correspond to the maximum pressure of the capacity of the
material withstand, when the material is unconfined. Compression test can provide the values for
the modulus of the compressive strength, compressive stress, and compressive strain. When
some materials withstand their compressive strength limit, they will fracture. Because some
materials deform irreversibly, in those cases, a given amount of deformation may be considered
as the compressive strength 16.

19
Figure 3 MTS Qtest/5
3.1.2 Compression Testing Details
MTS Qtest/5 machine be used for several types of testing. For example, three points
bending, compression test, tensile test and more. In the compression test, the sample size is:
width 2.6 inch, length 2.6 inch and height 1.0 inch. The specimen is put on the test table which is
the lower plate of the machine. The upper plate moves down until it touches the sample.
Compression continues until the sample is compressed by thirty percent.
3.2 Three Points Bending Testing
3.2.1 Three Points Bending Test Principle
With the demand for high-quality material continues to increase, three points bending test

20
has become an important test method in the production and research. Three points bending test is
used to define the material ability to resist17.
The three point bending test provides values for the modulus of elasticity, in bending fE ,
flexural stress f , flexural strain f and the flexural stress-strain response of the material.
Advantages of three-point bending test are easy prototyping and testing method is simple.
Disadvantages of three-point bending test are the results of the testing method are sensitive to
sample and loading geometry and strain rate.
Figure 4 Three points bending test
Flexural stress is used to measures the maximum force that a material with withstand before
it breaks 26. Calculation of the flexural stress f :
223bdFL
f
Flexural strain represents material unit deformation when subjected to bending moment.
Calculation of the flexural strain f :
26LDd
f
Flexural Modulus represents the slope of a stress vs. strain curve and is an indication of
material’s stiffness 18. Calculation of flexural modulus fE :

21
3
3
4bdmLE
f
ff
3.2.2 Three Points Bending Testing Details
In the three points banding test, the sample size is: width 2.0 cm, thickness 0.5 cm, length
10.0 cm.
3.3 Pin-on-Disk Tribometry
3.3.1 Pin-on-Disk Tribometry Principle
I used a NANOVEA pin-on-disk tribometer which performs rotational friction experiments,
the test reproduces the rotational motion found in many real-world tribology mechanisms. A pin
or ball tip is loaded onto a test sample with a precisely known weight and at a specific position
from the center of rotation. As the sample starts rotating, the tip creates a rotational wear track.
Dynamic friction is accurately measured during the test by the deflection of a load cell which is
precisely calibrated. Wear rates for the tip and the sample are calculated from the volume of
material lost during the test. Depth can be recorded during the test using an accurate LVDT or an
optical pen sensor attached to the loading arm. A wide variety of testing procedures included
varying radius and speeds 20.
3.3.2 Pin-on-Disk Tribometry Details
Polyurethane foams and polyurethane solid plastics have different properties. In order to

22
compare the particle impact for the two different species, the friction tests use same load weights
and same friction speeds for the foams and polyurethane plastics. The foam samples were cut to
width 2.0 cm, 2.0 cm length and 0.5 cm thickness Square sheet of (2.0×2.0 cm) of the plastics
sample were made width, thickness of 0.2 cm. Each sample was placed on the stand, a pin loaded
under the force of 2.0 N. The rotation speed was 500 revs/minute, the radius is 4mm, distance is
12.6 m, and the test time is 5 minutes.
3.4 Thermal Conductivity Test
3.4.1 Thermal Conductivity Test Principle
Needless to say, heat transfer occurs at a higher rate across materials of high thermal
conductivity than across materials of low thermal conductivity. Correspondingly, materials of
high thermal conductivity are widely used in heat sink applications while materials of low
thermal conductivity are used as thermal insulation. The thermal conductivity of a material
typically depends on temperature. The reciprocal of thermal conductivity is called thermal
resistivity 27.
23
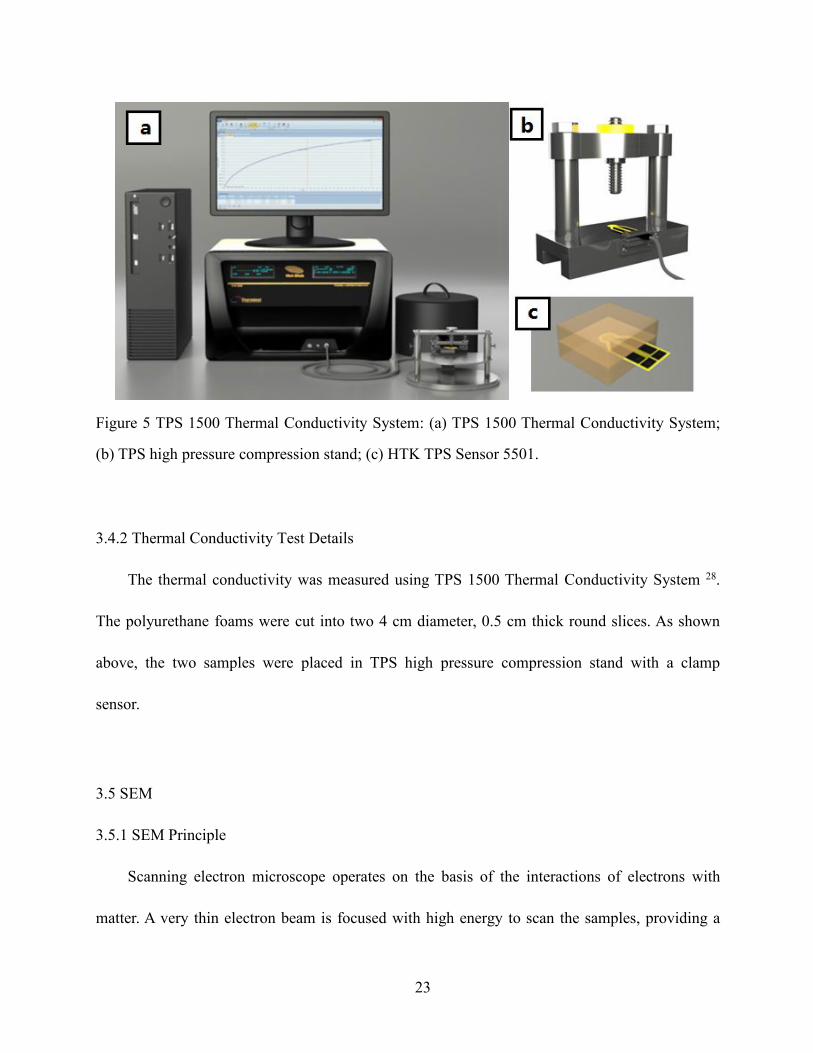
Figure 5 TPS 1500 Thermal Conductivity System: (a) TPS 1500 Thermal Conductivity System;
(b) TPS high pressure compression stand; (c) HTK TPS Sensor 5501.
3.4.2 Thermal Conductivity Test Details
The thermal conductivity was measured using TPS 1500 Thermal Conductivity System 28.
The polyurethane foams were cut into two 4 cm diameter, 0.5 cm thick round slices. As shown
above, the two samples were placed in TPS high pressure compression stand with a clamp
sensor.
3.5 SEM
3.5.1 SEM Principle
Scanning electron microscope operates on the basis of the interactions of electrons with
matter. A very thin electron beam is focused with high energy to scan the samples, providing a

24
variety of physical information. Processing this information, the image is enlarged and displayed
to show the appearance of the surface of the sample 21.
When a bunch of very thin and high energy incident electron is scanning the sample surface,
the area will be excited to produce secondary electrons, Auger electrons, characteristic X-ray and
X-ray continuum, backscattered electrons, transmission electrons, as well as in the visible,
ultraviolet, infrared light regions. At the same time, the beam can also produce electron-hole
pairs, lattice vibrations, and electronic oscillations 22.
Figure 6 Structural diagram of the scanning electron microscope (SEM)
In general, because metals are conductive and can provide their own pathway to the ground,
they do not require coatings before imaging in the SEM. However polymeric materials are not
conductive, hence they usually are coated with metals, to provide a pathway to the ground.

25
3.5.2 SEM Detail
In this situation, coating the polymeric sample is the first step for the imaging in the SEM.
The SEM Coating Unit E5100 is used to coat gold-platinum plasma to the surface of samples.
The samples are cut into 1.0 cm wide, 1.0 cm long and 0.5 cm thick specimens. After coating, the
sample surface will be conductive. Then the sample is placed in the SEM, the surface
morphology of the sample observed and imaged for enlargement of 50 times or 150 times.
3.6 Tensile Testing
3.6.1 Tensile Testing Principle
One measures material properties under tensile loads. It is one of the basic mechanical
properties of materials testing methods, mainly used to determine whether the material meets the
required standards or for research purposes 23. The sample is placed in a tensile tester; a pulling
force is applied to the sample ends, and deformation occurs until fracture. During this process,
the instrument records the elongation and force. The results include file material elastic limit,
elongation at break, modulus of elasticity, tensile strength, yield point and the tensile yield
strength 24.

26
Figure 7 Tensile testing of thermoplastic polyurethane: (a) thermoplastic polyurethane sample
change in the testing process; (b) a flat shoulder is used with serrated grips.
The elongation measurement is used to calculate the engineering strain, ε, using the
following equation:
0
0
0 LLL
LL
Here ΔL is the change in the length of the sample, L0 is the initial length, and L is the final
length, as seen in figure 7(a).
The force measurement is used to calculate the engineering stress, σ, defined by the
following equation:
0AFn
Here F is the tensile force and A0 is the nominal cross-section of the specimen. The speed
applied was 30 mm/min.

27
CHAPTER 4
RESULTS AND DISCUSSION
4.1 Testing of Polyurethane Foam
4.1.1 Volume Testing
The impact of particles on the polyurethane foam volume is an important factor affecting
the mechanical properties of the foam. Thus, the volume test is the first test for polyurethane
foam.
Figure 8 Volume test result of polyurethane foams; volume factor of the PU liquid before
foaming is 1.0.
We observe two kinds of behavior. Silica and fly ash added produce no significant changes
in the volume. Only when the concentration of silica is 20%, the volume of the foam decreased
slightly. This result can be explained as follows. The volume does not change with low
concentration of filler particles because they fill in the foam bubbles. This is how the particle
does not affect the volume of the foam.

28
By contrast, carbon black and silica nanotubes have a large impact on the volume of the
foams. With the increase of concentration of these fillers, we can see a rapid rise in the volume of
the foam. Apparently these two filler particles have an impact on the foam foaming process.
Because the size and nature of the carbon black particles surfaces, carbon black takes the
role of foaming agent in the foaming process. Addition of carbon black increases the generation
of air bubbles in the polyurethane foam. Possibly gases absorbed in PU contribute fine air
bubbles 25. With increasing carbon black concentration, the bubble generation during the reaction
increases, hence an increase in the volume of polyurethane foam.
4.1.2 Compression Testing
4.1.2.1 Effects of Silica on the Compression Modulus of Polyurethane Foam
The results are displayed in figure 9.
Figure 9 Silica compression modulus

29
Inspection of Figure 9 shows that offer initial addition of silica particles to polyurethane
foam, the compression modulus of the material decreases. However, when exceeding the silica
concentration of 5%, the compression modulus starts to increase. When the concentration of the
silica is 25%, the compression modulus decreases again. Thus, apparently first the silica perturbs
the cohesion in the polymer. Then silica particle provide reinforcement. At still higher
concentration, these particles agglomerate, hence the compression modulus decrease.
4.1.2.2 Effects of Fly Ash on the Compression Modulus of Polyurethane Foam
The results are presented in figure 10.
Figure 10 Fly ash compression modulus
We see in Figure 10 that, among the four types of fly ash, Monticello fly ash provides
highest compression modulus; in addition that strength increases with the increase of fly ash
concentration. For Rockdale Fly Ash and Wansley Fly Ash, the compression modulus of the

30
foam first decrease low concentration of fly ash. However, continued addition of fly ash, results
in increasing compression modulus. For the San Miguel Fly Ash, this has the lowest compression
modulus among the four of the fly ashes, the compressive modulus of the material first decreases
with the increase of filler concentration up to 5%, and then starts to increase up to 10%. A further
increase of the fly ash concentration seems to have a very small effect.
Fly ash is pulverized coal burning at high temperatures (1300 ~ 1500℃), then cooled,
providing spherical smooth surface particles. Depending on combustion conditions, fuel type,
and the way of ash collection, its chemical composition varies greatly. It is for this reason that
four types of fly ash have been investigated.
In Table 3 particle size of fly ash are listed.
Table 3 Particle Size of Four Types of Fly Ash
Sample d10 (um) d50 (um) d90 (um)BET Surface
Area (m2/g)
Monticello Fly Ash 4.1 60.4 212 5.4
Rockdale Fly Ash 0.8 2.1 4.7 2.7
San Miguel Fly Ash 13.9 96.9 249.6 0.8
Wansley Fly Ash 2.2 14.7 64.4 1.1
We recall that Monticello Fly Ash provides the highest compression modulus to PU foam.
Table III tell us that Monticello Fly Ash has the largest surface area of the four. Further,
Monticello Fly Ash particle size is smaller than Rockdale Fly Ash and Wansley Fly Ash. In

31
general, the size of the particle directly affects the size of the surface area. As in our materials,
the smaller the particle diameter has the greater the surface area. Monticello Fly Ash has a
relatively large particle diameter, but it has a relatively large surface area of the particles. The
main reason is that the particles contain voids, while voids increase the surface areas of the
particles. As for the San Miguel Fly Ash, it has the lowest compression modulus. Also, it has the
biggest particle size and the smallest surface area.
We see how the size of the particle surface area is one of the main factors affecting of the
compression modulus. As the filler surface area increases, the foam compression modulus also
increases. This is due to the relatively large surface area of the filler can be better combined with
the foam during the foaming process.
In Table 4 the compositions of fly ashes studied is provided.
Table 4 Components of the Four Types of Fly Ash
Content %
Fly Ashes Al2O3 SiO2 CaO Total
Monticello 19.3 66.1 14.5 100
Rockdale 26.6 61.7 11.7 100
San Miguel 18.9 74.4 6.7 100
Wansley 31.2 66.2 2.7 100
For the components of the fly ashes providing high compression modulus, namely

32
Monticello and Rockdale fly ashes, CaO content is higher than in other types of fly ash. We see
that Al2O3 and SiO2 contents are similar in the four type fly ashes, and there is not much
difference. Therefore, one cannot judge the impact on the compression modulus of these two
components.
Given the results reported above Monticello fly ash as the only one studied into the
following experiments.
Due to compression modulus of the addition of Monticello fly ash polyurethane foam
continues to grow. Therefore, subsequent experiments carried out for the foam. Increasing the
percentage of fly ash in the foam, and the production of the fly ash content of 25%, 30%, 40%,
and 60% of the samples for tested, results were as follows.
Figure 11 Monticello fly ash compression modulus
As shown, the increase in the percentage of fly ash, the compression modulus of the foam
continued to increase. When the concentration of the fly ash is increased to 40%, the pressure

33
measurement needed is more than the testing ability of the instrument, thus testing could not
continue.
4.1.2.3 Effects of Silica Nanotube or Carbon Black on the Compression Modulus of Polyurethane
Foams
Figure 12 Compression modulus of silica nanotubes and carbon black
After adding silica nanotubes and carbon black into the polyurethane foam, the foam
compression strength rapidly decline with increasing particle content.
4.1.2.3 Compression Modulus of Added 20% Particles Polyurethane Foam
In turn, result of adding 20 wt.% of several fillers, were studied. The results are displayed in
Figure 13. In the form of stress vs. Stain diagrams.

34
Figure 13 Compression test result for 20% filler concentrations
From Figure 14 we present compression modulus values for the same material as in figure
13.
Figure 14 Compression strength of polyurethane foam mix with 20 wt.% filler
We see in Figure 14 show that addition of fly ash provided the maximum compression
modulus. In other words, fly ash increases the rigidity of the polyurethane foam the most;

35
provide the highest resistance to deformation. Carbon black provides the lowest. Thus carbon
black is appropriate when soft and easily deformable foams are needed.
4.1.3 Three Points Bending
Figure 15 show the three points bending test results for 20 wt.% of particle concentration of
adding filler. Bending modulus, stress at break, strain at break and maximum stress value can be
obtained from these figure.
Figure 15 Three points bending test result of added 20% particles
The results in Figure 15 have been used to calculate the bending modulus values. The
results are displayed in Figure 16.

36
Figure 16 Flexural modulus values from the three points bending tests
Figure 16 we can see in that adding fly ash or silica particles to the foam results in higher
modulus than that of the pure polyurethane foam. In contrast, adding carbon black or silica
nanotube particles to the foam lowers the modulus. Fly ash provides the highest modulus, carbon
black the lowest.
Qualitatively flexural modulus reflects the material’s stiffness. Adding fly ash or silica
increase foam stiffness, and the foam texture becomes hard. Conversely, nanotubes or carbon
black added reduce the stiffness of the foam, and the texture becomes soft. In the case of the
addition of carbon black, the modulus is approaching 0 MPa, the foam texture becomes
extremely soft.
From Figure 17 we provide strain at break and stress at break values form bending tests.

37
Figure 17 Break strain and break stress of three points bending test
Consider Figure 17 of stress at break 20% fly ash and 20% silica does not differ much from
pure PU. The value for 20% fly ash is slightly higher than pure polyurethane; the value for silica
added is slightly lower. However, the stress at break for 20% silica nanotubes is lower.
In turn, considering the strain at break, all composites have lower value than the pure foam.
The largest decrease strain at break is by fly ash and silica. Therefore, addition of the filler
particles lowers deformation possible before material fracture.
Figure 16 shows no value for the strain at break of the carbon black. There was no fracture
during testing. Added carbon black not only increases the volume of the foam, but the texture
becomes very soft. Foam could not be broken during the test; it was not possible to obtain
quantitative data.
In Figure 18 we provide maximum stress values.
38
Figure 18 Maximum stress of three points bending test
We see in Figure 18 that maximum stress values are smaller than stress at break value. 20%
fly ash foam has a value slightly higher than pure PU foam, and 20% silica foam has slightly
lower maximum stress than the pure PU foam.
4.1.4 SEM
SEM results are presented in Figure 19.

39
Figure 19 Polyurethane rigid foam microstructure obtained by scanning electron microscopy
(SEM) analysis at 50 times magnification: (a) pure polyurethane rigid foam; (b) 20% silica; (c)
20% fly ash; (d) 20% silica nanotubes; (e) 20% carbon black;
Consider first pure PU. We see large bubbles while the distribution is very uniform. After
the addition of silica particles, bubbles become smaller but the shape becomes irregular. Adding
fly ash results in the bubbles, the bubble becomes smaller than in PU but larger than for silica,
relatively uniform. Silica nanotubes make bubbles somewhat smaller than in PU and varying
sizes, unevenly distributed. After the addition of carbon black, the foam structure has undergone
some changes. There are large bubbles, small bubble, bubbles joining to form ‘passages’, so that

40
the foam structure becomes loose.
4.1.5 Pin-on-Disk Tribometry
In Figure 20 dynamic friction values are displayed.
Figure 20 Dynamic friction of polyurethane foam
Figure 20 show that particles added result in dynamic friction increases. Silica nanotubes
provide the largest dynamic friction increase, up to about 0.65. Also, addition of silica and fly
ash fillers results in a dynamic friction increase, but compared to the silica nanotubes, the effect
is much smaller. Fly ash has little effect on the dynamic friction. Unfortunately, because carbon
black in polyurethane foam result in soft texture, it is not possible to determine the dynamic
friction.
We recall the SEM result; one sees a connection. Silica nanotubes cause the foam bubbles to
be unevenly distributed which corresponds to the highest dynamic friction. Fly ash has the

41
smaller bubbles than pure PU, and comparable dynamic friction. Thus the size of the bubble and
the size distribution are related to the dynamic friction. Smaller bubble sizes and uniform
distribution of the bubbles results in smaller dynamic friction values.
4.1.6 Thermal Conductivity Results.
Results are presented in Figure 21.
Figure 21 Thermal conductivity of polyurethane foam
In general, conductivity of the same material is related to the material structure, density,
also to external parameter such as humidity, temperature and pressure. With low moisture
content and at lower temperatures, the thermal conductivity is small. In general, the thermal
conductivity of solids is larger than for liquid, and for the liquid it is larger than for gases.
Because polyurethane rigid foam structure is closed-cell, it has good insulation properties.
As can be seen from the diagram, particles are added to increase the thermal conductivity of the

42
foam, in other words, filler particles reduce the thermal insulation properties of the foam. One
notes the larger impact of carbon black and silica on the thermal conductivity, while fly ash and
silica nanotubes provider smaller effects.
Carbon black and silica have higher thermal conductivities, while fly ash and the silica
nanotubes have relatively low conductivity values, but SNTs have a large effect on PU foams.
Due to closed-cell structure PU foams have good thermal insulators. The fillers change the
structure of the foams thus a cause for the increase in thermal conductivity. However, even with
filler particles in the sample, the thermal conductivities are still relatively low. Since the foam is
a good insulator, the thermal conductivity of the foam with added particles does not make much
impact
4.2 Thermoplastic Polyurethanes
4.2.1 Tensile Testing
The Stress vs. Strain are displayed in figure 22.

43
Figure 22 Tensile testing result for thermoplastic polyurethanes with 20% filler.
From Figure 22 one can be obtain tensile modulus, strain at break, and maximum stress
values. We will consider these parameters in turn. Tensile modulus values are presented in Figure
23.
Figure 23 Tensile modulus of thermoplastic polyurethane
Tensile modulus, also called Young's modulus, represent resistance of the material to tensile
deformation. Thus the larger the Young modulus the less easily is the material deformed.
Form the Figure 23, we see that fly ash does not change significantly. However with silica
and silica nanotubes, significant increases are seen. Carbon black provides a dramatic increase.
In Figure 24 the maximum stress values are shown with stress at break values.

44
Figure 24 Maximum stress of thermoplastic polyurethane
We see in Figure 24 that all fillers cause a decrease in the stress at break values. Apparently
the internal cohesion of the polymer is reduced.
Figure 25 Break strain of thermoplastic polyurethane
Addition of 20% fly ash, silica, silica nanotubes and carbon black cause a decrease in
elongation. Among them, the maximum impact on the elongation is carbon black; the elongation
drops to 400% from 1600%.

45
According to analysis of the polyurethane tensile test, added particles into the polyurethane
can increase the hardness of the polyurethane, but with the increase in material hardness, tensile
stretch properties of the polyurethane is gradually decreased. For example, after adding carbon
black polyurethane, which stretch the modulus increased significantly, which also shows an
increase in hardness of the material. However, the tensile stress and strain decreased, reflecting
the tensile properties of the material becomes low, and material is more easily broken.
When the filler particles are added into polyurethane, the reason of its tensile properties
deterioration may be related to the compatibility of interface between the particles and
polyurethane. Because the particles have not been surface-treated, interface compatibility
between particles is poor. In the mixing process, the particles tend to aggregate and cannot be
uniformly mixed with the polyurethane.
Interface compatibility of particles is one of the reasons than can cause tensile performance
degradation. The material mixing and molding are performed at high temperatures, what might
cause structural change.
4.2.2 Pin-on-Disk Tribometry
Dynamic friction values are presented in Figure 26
46
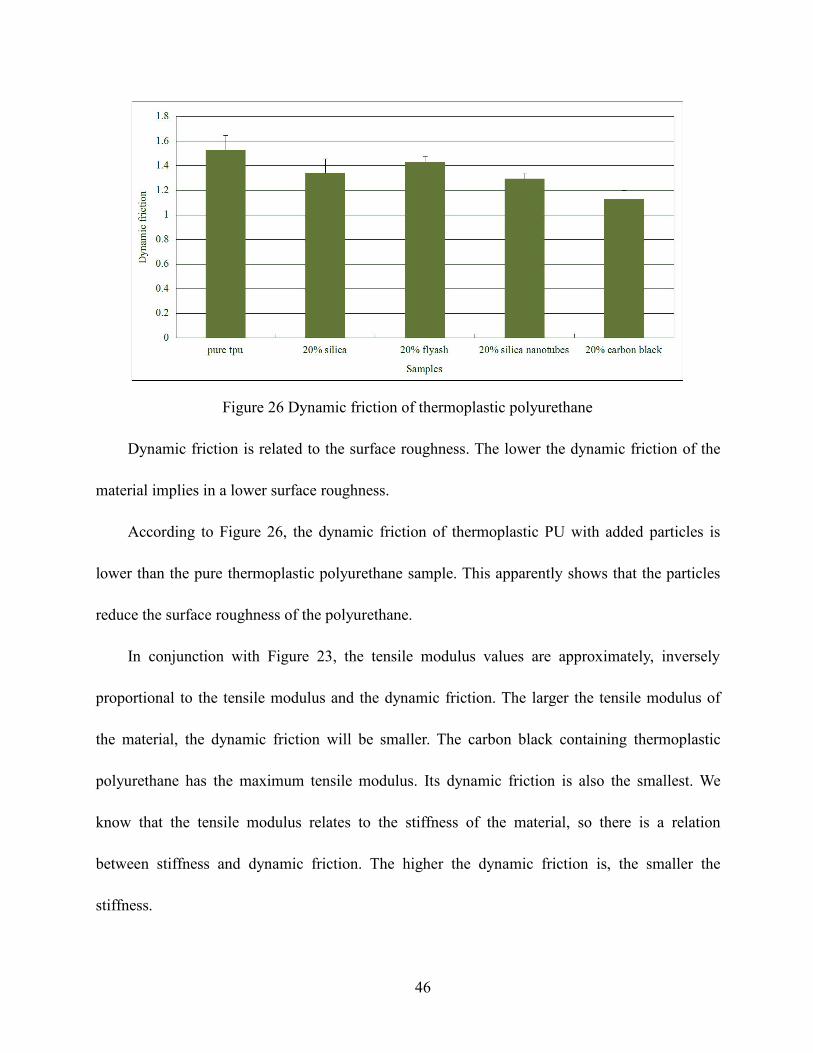
Figure 26 Dynamic friction of thermoplastic polyurethane
Dynamic friction is related to the surface roughness. The lower the dynamic friction of the
material implies in a lower surface roughness.
According to Figure 26, the dynamic friction of thermoplastic PU with added particles is
lower than the pure thermoplastic polyurethane sample. This apparently shows that the particles
reduce the surface roughness of the polyurethane.
In conjunction with Figure 23, the tensile modulus values are approximately, inversely
proportional to the tensile modulus and the dynamic friction. The larger the tensile modulus of
the material, the dynamic friction will be smaller. The carbon black containing thermoplastic
polyurethane has the maximum tensile modulus. Its dynamic friction is also the smallest. We
know that the tensile modulus relates to the stiffness of the material, so there is a relation
between stiffness and dynamic friction. The higher the dynamic friction is, the smaller the
stiffness.

47
CHAPTER 5
CONCLUSIONS
In this study, the use of silica, fly ash, silica nanotubes and carbon black were used to
modify polyurethane foams and thermoplastic polyurethane. In situ polymerization was used for
polyurethane foams, and blending method was used for thermoplastic polyurethane. Mechanical
properties of the samples were determined and surface morphologies observed. The following
conclusions can be formulated:
(1) Effects of filler particles: mechanical tests, and surface morphology observations show
that the addition of silica makes foam bubbles smaller, resulting in an increase in stiffness of the
material; the compression modulus increases, deformation is more difficult. However, since the
uniformity of the bubbles is reduced, the result is increased dynamic friction of the material. Fly
ash added to the foam makes bubbles smaller providing good uniformity of cells sizes. Effects of
adding silica nanotubes are: unequal bubble sizes and uneven spatial distribution of bubbles,
resulting in decreased strength of the material, thus the dynamic friction increases. As for carbon
black, there is a generation of more bubbles during the foaming process affecting the foam
structure. Therefore, the material becomes soft; one obtains flexible polyurethane foam.
(2) Effects of filler particles on thermoplastic polyurethane: the tensile properties are
reduced. This phenomenon may be due to agglomeration of particles occurs during the mixing
process, the particles cannot be uniformly dispersed in the thermoplastic polyurethane.

48
REFERENCES
1. Kim, S. H., et al. "Nanoclay reinforced rigid polyurethane foams." Journal of applied
polymer science 117.4 (2010): 1992-1997
2. Xu, WANG, et al. "Research and Advance of Polymeric Nano-composites." Plastics (2000).
3. Ying B, Chun-Xiao W, Liang Z, et al. "Effect Mechanisms of Carbon Nanotubes on the
Supercritical Foaming Behaviors and Mechanical Performance of Carbon Foam." Journal of
Inorganic Materials, 2011, 26(10):1020-1024.
4. Jianmin, Jia, and Guo Rui. "Research Progress of Polyurethane by Inorganic Nano-particles
Modification." China Leather (2010).
5. Chun-bai, YANG. "Research Progress in Rigid Polyurethane Foam." China Plastics
23.2(2009):12-15.
6. Sivertsen, Katrine. "Polymer foams." (2007).
7. Zongrong, Ying, et al. "Research Progress on Composite Modification of Rigid Polyurethane
Foams." Engineering Plastics Application 41.2(2013):111-115.
8. Ai, LU, et al. "Influences of Nano-CaCO_3 on Mechanical Properties of Rigid Polyurethane
Foam." China Plastics (2001).
9. Mao, Chung-Ling. "Thermoplastic polyurethane elastomer." U.S. Patent No. 4,124,572. 7
Nov. 1978.
10. Mishra, Ananta K., et al. "Structure–property of thermoplastic polyurethane–clay
nanocomposite based on covalent and dual-modified Laponite." Advanced Science Letters
4.1 (2011): 65-73.

49
11. HU Wei, et al. "Application of Thermoplastic Urethane Elastomer in Cable Sheathing."
Electric Wire & Cable (2010)
12. Paul, D. R., and L. M. Robeson. "Polymer nanotechnology: nanocomposites." Polymer
49.15 (2008): 3187-320
13. Wang Changxiu, Zhao Lianqiang, Chen Jimei, Mao Yan "APPLICATION OF THE
RECTORITE IN THE POLYMER NANOCOMPOSITES" (Hubei Celebrities Rectorite
Technology Co. Ltd. , Wuhan 430071 , China)[J]. Engineering Plastics Application, 2004.
14. Finnigan, Bradley, et al. "Morphology and properties of thermoplastic polyurethane
nanocomposites incorporating hydrophilic layered silicates." Polymer 45.7 (2004):
2249-2260.
15. Kirpluks, Mikelis, et al. "Rigid Polyurethane Foam Thermal Insulation Protected with
Mineral Intumescent Mat." Autex Research Journal 14.4 (2014): 259-269.
16. Fell, J. T., and J. M. Newton. "Determination of tablet strength by the
diametral‐compression test." Journal of Pharmaceutical Sciences 59.5 (1970): 688-691.
17. Junior, Sinval A. Rodrigues, Jack L. Ferracane, and Alvaro Della Bona. "Flexural strength
and Weibull analysis of a microhybrid and a nanofill composite evaluated by 3-and 4-point
bending tests." dental materials 24.3 (2008): 426-431.
18. "Activity 20 - Bendy Wafer". Salters Horners Advanced Physics for Edexcel AS Physics.
Essex, United Kingdom: Pearson Education. 2008.
19. "A guide to thermoplastic polyurethanes (TPU)." Huntsman Corporation. N.p., n.d. Web.
23 Apr. 2015.

50
20. Kennedy, D. M., and M. S. J. Hashmi. "Methods of wear testing for advanced surface
coatings and bulk materials." Journal of Materials Processing Technology 77.1 (1998):
246-253.
21. Todokoro, Hideo, and Tadashi Otaka. "Scanning electron microscope." U.S. Patent No.
5,389,787. 14 Feb. 1995.
22. Reed, Stephen Jervis Brent, and Stephen Jarvis Brent Reed. Electron microprobe analysis.
Vol. 2. Cambridge: Cambridge University Press, 1975.
23. Sharifishourabi, G., et al. "Tensile test machine for unsymmetrical materials." Experimental
Mechanics 54.4 (2014): 689-694.
24. Davis, Joseph R., ed. Tensile testing. ASM international, 2004.
25. qing, WU Shu, et al. "Influence of Carbon Black on Foaming Behavior of Polyurethane
Foam." China Plastics (2001).
26. "Chapter 4 Mechanical Properties of Biomaterials". Biomaterials - The intersection of
Biology and Material Science. New Jersey, United States: Pearson Prentice Hall
Bioengineering. 2008. p. 152.
27. Wu, Jhy-Wen, Wen-Fa Sung, and Hsin-Sen Chu. "Thermal conductivity of polyurethane
foams." International Journal of Heat and Mass Transfer 42.12 (1999): 2211-2217.
28. "Thermtest Thermal Conductivity & Thermal Diffusivity - TPS 3500 Thermal Conductivity
System." Thermtest Thermal Conductivity & Thermal Diffusivity - Welcome
29. Pattanayak, Asim, and Sadhan C. Jana. "Thermoplastic polyurethane nanocomposites of
reactive silicate clays: effects of soft segments on properties." Polymer 46.14 (2005):

51
5183-5193.
30. Gangopadhyay, Rupali, and Amitabha De. "Conducting polymer nanocomposites: a brief
overview." Chemistry of materials 12.3 (2000): 608-622.
31. Hench, Larry L., and Jon K. West. "The sol-gel process." Chemical Reviews90.1 (1990):
33-72.
32. Duguet, Etienne, Stéphanie Rey, and Josepha Maria Merida Robles. "Intercalation
Polymerization." Encyclopedia of Polymer Science and Technology (2004).
33. Paul, P. K., et al. "Preparation of polystyrene–clay nanocomposite by solution intercalation
technique." Bulletin of Materials Science 36.3 (2013): 361-366.
34. Shen, Zhiqi, George P. Simon, and Yi-Bing Cheng. "Comparison of solution intercalation
and melt intercalation of polymer–clay nanocomposites." Polymer43.15 (2002): 4251-4260.
35. Lee Jr, Henry L., and Jan A. Orlowski. "In situ polymerization." U.S. Patent No. 4,229,431.
21 Oct. 1980.
36. Allen, Mark P., and Roney J. Matijega. "Rigid polyurethane foams." U.S. Patent No.
6,541,534. 1 Apr. 2003.
37. Pita, V. J. R. R., E. E. M. Sampaio, and E. E. C. Monteiro. "Mechanical properties
evaluation of PVC/plasticizers and PVC/thermoplastic polyurethane blends from extrusion
processing." Polymer Testing 21.5 (2002): 545-550.
38. Stokes, K., and K. Cobian. "Polyether polyurethanes for implantable pacemaker
leads." Biomaterials 3.4 (1982): 225-231.
39. Zhang, Rui, et al. "Conductive network formation in the melt of carbon

52
nanotube/thermoplastic polyurethane composite." Composites Science and
Technology 69.10 (2009): 1499-1504.
40. LeBaron, Peter C., Zhen Wang, and Thomas J. Pinnavaia. "Polymer-layered silicate
nanocomposites: an overview." Applied clay science 15.1 (1999): 11-29.