Nanofilm Technologies International
17
C O N F I D E N T I AL Nanofilm Technologies International Limited Nanofilm Technologies International 1H 2021 Results Announcement 16 August 2021
Transcript of Nanofilm Technologies International

C O N F I D E N T I A L
Nanofilm Technologies International Pte LtdNanofilm Technologies International Limited
Nanofilm Technologies International1H 2021 Results Announcement
16 August 2021

Nanofilm Technologies International Limited
Results Overview1H 2021

18 18
23.7%18.5%
-50.0%
-30.0%
-10.0%
10.0%
30.0%
50.0%
-
20.00
40.00
60.00
80.00
100.00
120.00
140.00
1H 2020 1H 2021
PATMI (S$m)Margin (%)
2 | C O N F I D E N T I A L
Source: Company information(1) Adjusted EBITDA is reconciled from profit before income tax by adding back depreciation, amortization, net finance expenses, other professional fees, and other exceptional items(2) Refers to profit attributable to equity holders of the Company
PATMI –Down 3% YoY
Adjusted EBITDA –Flattish YoY
Revenue –24% YoY growth
64 76
3 2 11
19 78 97
-
20
40
60
80
100
120
140
1H 2020 1H 2021
AMBU NFBU IEBU
33 33
42.7%34.4%
-50.0%
-30.0%
-10.0%
10.0%
30.0%
50.0%
-
20.00
40.00
60.00
80.00
100.00
120.00
140.00
1H 2020 1H 2021
Adjusted EBITDA (S$m)Margin (%)
0%
(S$m) (S$m) (S$m)
(1) (2)
YoY (%) 41% 24% 63% 0% 62% -3%
1H2021 Top Line Growth Despite Supply Chain Disruptions
41 45
52.6%46.1%
-50.0%
-30.0%
-10.0%
10.0%
30.0%
50.0%
-
20.00
40.00
60.00
80.00
100.00
120.00
140.00
1H 2020 1H 2021
Gross Profit (S$m)Margin (%)
Gross Profit –9% YoY growth(S$m)
43% 9%
1H2021 growth ledby AMBU and IEBUdespite severe globalchip shortage
Partially offset bydecline in revenuefrom NFBU
Lowered margins impacted by costs totalling S$5.4m associated with newShanghai Plant 2 and equipment qualification costs, as well as higher newproduct introduction costs involving new projects yet to contributemeaningfully to revenue
Also partially impacted by product mix, where projects of lower averagemargins were executed in 1H2021

3 5 10
12 5
7 2
3 20 27
26.0% 28.3%
-
5
10
15
20
25
30
35
Total opex as % of revenue (%)
37 52
47.4%53.9%
-
10
20
30
40
50
60
70
80
90
100
D&A 2.3 3.0% 3.4 3.5%
R&D & Engineering (1) 4.6 5.9% 6.6 6.8%
Administrative (2) 10.0 12.9% 12.2 12.6%
Selling & Distribution (3) 3.3 4.2% 5.2 5.3%
3 | C O N F I D E N T I A L
Higher Expenses in Preparation for New Capacity & Peak PeriodExpenditure – Increase in % proportion to revenue primarily due to new Shanghai Plant 2, NPI(4) projects and indirect labour increases in line with business expansion plan
(in S$m)
Source: Company information(1) R&D & Engineering expense excludes Depreciation & Amortisation expenses(2) Administrative expense excludes Depreciation & Amortisation expenses(3) Selling & Distribution expense excludes R&D & Engineering and Depreciation & Amortisation expenses(4) NPI refers to New Product Introduction
1H 2020 1H 2021S$m % of revenue S$m % of revenue
Cost of Sales 37.0 47.4% 52.1 53.9%
(in S$m)

4 | C O N F I D E N T I A L
Cash conversion cycle(3)Trade payables turnover period(1)
Trade receivables turnover period(2)Inventory turnover period(1)
58 88
-
20
40
60
80
100
120
140
160
2020 1H 2021
121 97
-
20
40
60
80
100
120
140
160
2020 1H 2021
81 77
-
20
40
60
80
100
120
140
160
2020 1H 2021
144
86
-
20
40
60
80
100
120
140
160
2020 1H 2021
(in days) (in days)
(in days) (in days)
Source: Company information(1) Computed by multiplying the amount of inventories (trade payables) at the end of each period by the number of calendar days in the period and dividing the resulting figure by the cost of sales (cost of
inventories consumed and consumables used) in respect of that period(2) Computed by multiplying the amount of trade receivables at the end of each period by the number of calendar days in the period and dividing the resulting figure by the total revenue in respect of that
period(3) Sum of inventory turnover period and trade receivables turnover period less trade payables turnover period
Working Capital Changes Tracking Business Season

199 189
3 8
150
160
170
180
190
200
Total cash Current debt Non-currentdebt
Net cash
5 | C O N F I D E N T I A L
Source: Company information(1) Includes Construction-in-progress(2) Other capex spend includes office equipment, tools and supplies, and motor vehicles(3) Negative working capital denotes positive cash flows
Strong operating cash flowNet cash balance post repayment of S$40m loan as of 30 June 2021
(in S$m)
Capex spend on infrastructure and equipment paving wayfor long-term growth
(in S$m)
20 19
12 15
3 2
1H 2020 1H 2021
Equipment Land, Building & Renovation Others
30
49
(1)
(20)
4
4
1H 2020 1H 2021
Net OCF Working Capital Interest & Taxes
34
32
OCF before WC, interest
& taxes
(in S$m)
(1) (2)(1)
Strong Operating Cash Flow GenerationNet cash balance, well positioned to fund growth opportunities
(3)

Nanofilm Technologies International Limited
Segmental Information1H 2021

Source: Company information, numbers may not tie due to rounding (refer to results announcement)(1) Company also provides customised operating software, training, spare-parts, customer service and after-sales support to IEBU customers(2) Adjusted EBITDA is reconciled from profit before income tax by adding back depreciation, amortization, net finance expenses, other professional fees, and other exceptional items(3) Nanofabrication BU is a start up that was acquired in 2018(4) Based on Frost & Sullivan’s forecast of the growth in the global market size for nanoproducts to US$7.8 billion in 2023 (IMR)
7 | C O N F I D E N T I A L
Advanced Materials BU(“AMBU”)
Provides mission critical surfacesolutions based on vacuum coatingtechnologies and processes acrossmultiple industries & value chains
Nanofabrication BU(“NFBU”)(3)
Part of our value chain integrationand positions us to capture thenanoproducts (US$8bn) TAMopportunity(4)
Industrial Equipment BU(“IEBU”)
Manufactures turnkey equipmentsystems for AMBU and for sale toselected customers(1)
6476
20
30
40
50
60
70
80
90
1H 2020 1H 2021
3 2-
5
10
15
20
25
30
1H 2020 1H 2021
1119
-
5
10
15
20
25
30
35
40
45
50
1H 2020 1H 2021
Delivering Sustainable Growth Synergistic Technological Pillar Growing Order Book
29 28
45.9%37.2%
1H 2020 1H 2021
(in S$m)
(in S$m)
Rev
enue
Adju
sted
EB
ITD
A(2)
0 (1)
7.3%
-54.3%
1H 2020 1H 2021
4 6
33.8% 31.1%
1H 2020 1H 2021
Adjusted EBITDA Margin (%)
Focused on Execution to Deliver Sustainable Growth

64 76
29 28 -
10
20
30
40
50
60
70
80
90
100
1H 2020 1H 2021Revenue Adjusted EBITDA
8 | C O N F I D E N T I A L
Continuing increase in adoption of our surface solutions The increase of 18% YoY was driven by increased revenue contributions from 3C and
Automotive sub-segments Growth was still achieved despite supply chain disruptions caused by the global chip shortage 1H2021 EBITDA impacted by costs associated with equipment qualification costs incurred for
new Shanghai Plant 2, increase in NPI costs involving new projects yet to reach massproduction status and product mix changes
(in S$m)
Source: Company information
YoY growth18%
AMBU: Growth Achieved Despite Supply Chain Bottlenecks
EBITDA Margins46%
EBITDA Margins37%

Key Operating Data: AMBU
9 | C O N F I D E N T I A L
Source: Company information(1) Based on number of coating equipment at the end of the financial year/period which are utilised to fulfil revenue generating customer orders only, excludes coating equipment used for R&D activities(2) In-line coating equipment consists of several coating equipment and the capacity of an in-line coating equipment is approximately 4.5 coating equipment(3) Utilisation rate is calculated by dividing the average number of operating hours of our coating equipment and in-line coating system by the number of hours in a day (i.e. 24 hours)
Key performance indicators for AMBU
1H 2020
Equipment utilisation: Our long-term target optimal utilisation rate is ~80% with remaining un-utilizedtime catering for sufficient cycle switch between different customer projects execution, for maintenanceand unforeseen breakdowns
With the TOP of new Shanghai Plant 2 in Feb 2021, coating equipment has been progressivelyinstalled in 1H2021 and qualified in preparation for production. Given the increase in coatingequipment, the utilisation was 61% in 1H 2021, down from 73% in 1H 2020
Coating equipment (no.)(1) 122 186
In-line coating equipment (no.)(2) 4 4
Equipment utilisation (%)(3) 73% 61%
1H 2021

320
(1)(3)
(1)
1
3
5
7
9
1H 2020 1H 2021Revenue Adjusted EBITDA
NFBU: End-of-Life Project Impacted Revenue
10 | C O N F I D E N T I A L
(in S$m)
Source: Company information
48% YoY drop in the topline due to end of life of projects coupled with delay in securing new projects
Resultant negative adjusted EBITDA of S$0.9m in 1H2021
YoY drop48%
EBITDA Margins7%
EBITDA Margins-54%
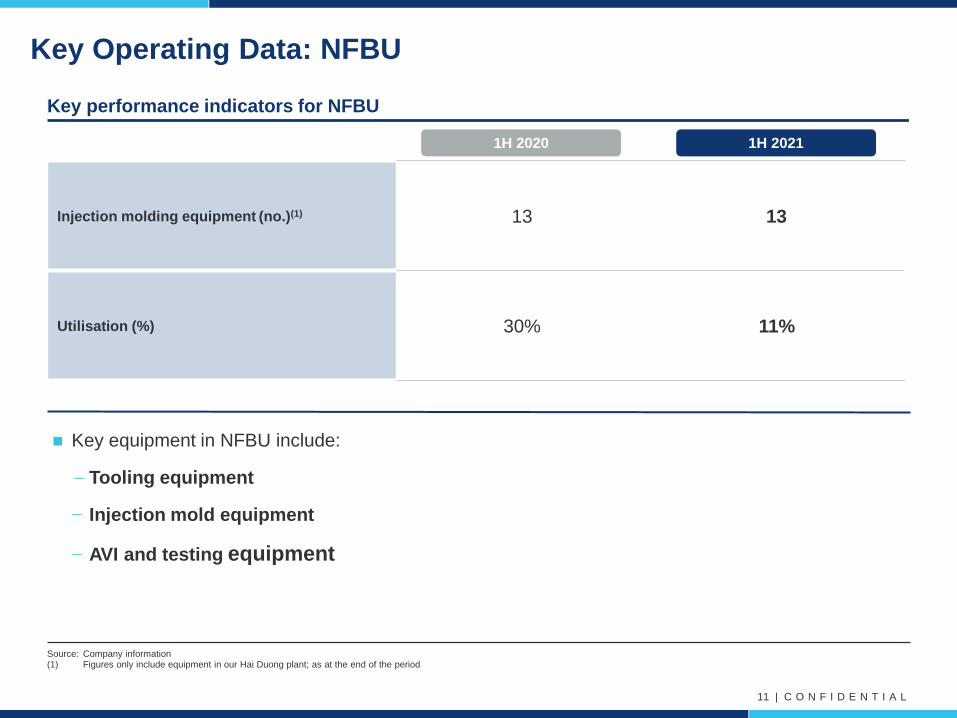
Injection molding equipment (no.)(1) 13 13
Utilisation (%) 30% 11%
11 | C O N F I D E N T I A L
Source: Company information(1) Figures only include equipment in our Hai Duong plant; as at the end of the period
Key performance indicators for NFBU
1H 2020 1H 2021
Key equipment in NFBU include:
−Tooling equipment
− Injection mold equipment
− AVI and testing equipment
Key Operating Data: NFBU

IEBU: Higher Demand with Returning & New Capex Spend from Customers
12 | C O N F I D E N T I A L
11
19
4 6-
5
10
15
20
25
30
1H 2020 1H 2021Revenue Adjusted EBITDA
(in S$m)
YoY growth came in at 81% driven by an increase in external sales of customized industrial equipmentto customers
Adjusted EBITDA of S$5.9m in 1H2021, up from S$3.5m (or 67%) in 1H2020
Source: Company information
YoY growth81%
EBITDA Margins34%
EBITDA Margins31%

13 | C O N F I D E N T I A L
Source: Company information(1) Includes in-line coating equipment, figures as at the end of the period
Key performance indicators for IEBU
In 1H 2021, IEBU continued to build for the production needs of the AMBU while the sales of coatingequipment remain selective to industries where coating services business model may not be feasible
During the period, IEBU saw an increase in external sales in line with the return of capex and newcapex spend from customers, particularly in the glass lens mold and precision engineering industries
Equipment produced (no.)(1) 23 16
Equipment sold (no.) 4 6
Equipment used internally (no.) 19 10
1H 2020 1H 2021
Key Operating Data: IEBU

Nanofilm Technologies International Limited
Outlook

Continue to increase sales to existing customers and grow
customer base
Leverage synergies across business segments to offer
customers integrated solutions
Ramp-up demonstrated share gains in new markets
Opportunistically enter new markets leveraging easily
adaptable nature of technology
Advanced Materials Market size 2023E: US$24.3bn(1)
Capturing greater share in Established End-Markets Future New Areas
Precision Engineering / HPLC Pumps / Valves
Printing and Imaging
Biomedical
3Cs
IoT Optics
Vertical & Horizontal Integration
Take-off in Recently Established End-Markets
FATP, Module / End Component New Applications• Automotive
• Fuel Cell –Sydrogen
• Optical lens
• Optical sensors
• FMCG
Automotive
Optical Lens Medical Lens & Devices
Value Chain Integration - Components TAM 2023E: US$423bn(1)
Optical Sensors
Source: Frost & Sullivan, Company Information.(1) Based on Frost & Sullivan’s forecast in its IMR
17 | C O N F I D E N T I A L
Outlook: Well-Positioned for Multiple Avenues of GrowthLeveraging Core Enabling Technologies in End-Market Applications and Value Chains of Strategic Partners to Achieve Sustainable Long-Term Growth
FMCG Personal grooming
Fuel Cell –Sydrogensuccessfully launched from Nanofilm

Nanofilm Technologies International Limited
Thank You