
Names, Expectations and Outcomesecon.duke.edu/~staff/wrkshop_papers/2004_Fall/Figlio.pdf ·...
29
Names, Expectations and the Black-White Test Score Gap David N. Figlio University of Florida and NBER Revised: November 2004 Incomplete Draft The author is grateful to the Florida Department of Health and to an anonymous school district for the data used in this analysis, and to the National Science Foundation and National Institutes of Child Health and Human Development for financial support. I appreciate the comments of Larry Kenny, Patrick Mason, Patrick McEwan, Kathleen Thomas and participants at the 2003 APPAM and SEA conferences and the NBER education program meeting, as well as seminar participants at Florida State University, Stanford University, University of British Columbia, University of California-San Diego, Universite de Montreal, University of Florida and University of Toronto. All errors are my own. 1
Transcript of Names, Expectations and Outcomesecon.duke.edu/~staff/wrkshop_papers/2004_Fall/Figlio.pdf ·...

Names, Expectations and the Black-White Test Score Gap
David N. Figlio University of Florida and NBER
Revised: November 2004
Incomplete Draft
The author is grateful to the Florida Department of Health and to an anonymous school district for the data used in this analysis, and to the National Science Foundation and National Institutes of Child Health and Human Development for financial support. I appreciate the comments of Larry Kenny, Patrick Mason, Patrick McEwan, Kathleen Thomas and participants at the 2003 APPAM and SEA conferences and the NBER education program meeting, as well as seminar participants at Florida State University, Stanford University, University of British Columbia, University of California-San Diego, Universite de Montreal, University of Florida and University of Toronto. All errors are my own.
1

Names, Expectations and the Black-White Test Score Gap
Blacks and Whites differ dramatically along a wide range of outcomes, and education is
no exception: The Black-White test gap exists at the beginning of school, and these gaps
expand as children get older. There is no shortage of explanations for this pattern (Jencks
and Phillips, 1998). In this paper I consider the role of teacher expectations in affecting
the Black-White test score gap. Recent experimental evidence (Bertrand and
Mullainathan, 2004) supports the notion that Blacks are differentially treated in the labor
market, even by firms that advertise equal opportunity. I investigate whether teachers
exhibit subtle biases as well. There is reason to believe that expectations matter: The
recent work on teacher grading standards (Betts, 1995; Betts and Grogger, 2003; Figlio
and Lucas, 2004) indicates that higher standards lead to improved student test scores.
The question of whether teachers treat Black and White children is not a new one.
Ferguson (1998) describes the field evidence from social psychology (e.g., Coates, 1972;
Feldman and Orchowsky, 1979; Rubovitz and Maehr, 1973; Taylor, 1979) that measures
differential perceptions of Black and White children. The consistent finding from this
literature is that teachers take Black students less seriously than they do Whites. But
there exist many questions regarding this field evidence: Are similar behaviors to the
one-time laboratory encounters found in the classroom, with frequent interaction and
feedback? And are results from the 1970s, in an era during which school racial
integration was taking place, still relevant several decades later?
2

This paper investigates the question of whether teachers treat children differentially on
the basis of factors other than observed ability, and whether this differential treatment in
turn translates into differences in student outcomes. Rather than look directly at whether
teachers differentially treat Black and White children, I instead investigate whether
teachers take cues from the names given to their students, and have systematically lower
expectations for students with names that are associated more with low socio-economic
status, names that are disproportionately given to Black children. I then relate these
naming differences to test score differences.
I utilize a detailed dataset from a large Florida school district to directly test the
hypothesis that teachers and school administrators expect less on average of children with
names associated with low socio-economic status, and these diminished expectations in
turn lead to reduced student human capital attainment. In these data I observe student test
scores as well as measures of teacher and school administrator expectations. Specifically,
I observe whether the student is labeled as gifted and whether that student was promoted
to the next grade level. While this label has a specific diagnostic definition, schools and
teachers have the flexibility to determine which students should be referred for potential
placement into the gifted program, so expectations could still play an important role in
this categorization. I use test score, gifted classification and transcript data for every
student in this Florida school district from 1994-95 through 2000-01. Because of
confidentiality restrictions, I cannot reveal the identity of the school district, but I can
report that my dataset includes information on ***** children in ***** families.
3

Most notable about my dataset is that I can compare the outcomes of classmates and
sibling pairs, as proxied by children sharing the same home address and phone number—
and for a large subset of the dataset I can identify siblingship with certainty using the
birth certificate. I exploit variation within a family and school in the attributes of names,
and directly compare how individual teachers differentially treat observationally-
equivalent students and how siblings with similar test scores but different types of names
are treated differently by teachers. I find that teachers tend to treat children differently
depending on their names, and that these same patterns apparently translate into large
differences in test scores. These results are consistent with the notion that teachers and
school administrators may subconsciously expect less of students with names associated
with low socio-economic status—names that are disproportionately given to Black
children--and these expectations may possibly become a self-fulfilling prophecy.
The magnitudes of these relationships are substantial: In the school district considered in
this analysis, the magnitude of the Black-White test score gap increases by 32 percent
between third grade and ninth grade. At the same time, the fraction of the test score gap
that can be explained by naming patterns increases from 5 percent in third grade to 16
percent in ninth grade, suggesting that names may play a role in explaining why the test
score gap rises, rather than falls, with increased school exposure.
What’s in a Name?
The premise of this paper is that teachers or other school administrators treat children
who are observationally similar differently depending on their names. In order to address
4

this question, I must first construct an agnostic index linking names to predicted socio-
economic status. I characterize a child’s name using three different measures—a
measure of the empirical prevalence of the name; an indicator of the “Blackness” of the
name, a la Fryer and Levitt (2004); and an indicator of the socio-economic status of the
name. This final measure is important because it allows one to distinguish between high-
socio-economic status and low-socio-economic-status names, independent of racial
associations with the name.
In order to measure the socio-economic status of a name, I use birth certificate data from
all children born in Florida between 1989 and 1996 to predict the probability that a
baby’s mother will be a high school dropout. I identify four attributes of a low socio-
economic status name: (1) the name begins with one of a number of prefixes, such as
“lo-“, “ta-“, and “qua-“; (2) the name ends with one of a number of suffixes, such as “-
isha” and “-ious”; (3) the name includes an apostrophe; and (4) the name has is
particularly long, with several low-frequency consonants. The easiest way to
characterize this fourth characteristic is to count the number of Scrabble points of the
name—I consider a name to have a high Scrabble score if its Scrabble value exceeds
twenty points.
Table 1 illustrates the attributes of families of children with the name attributes identified
above. I find that as a name increases in its number of identified attributes, its bearer is
more likely to be born to a high school dropout mother, a teenaged mother, unmarried
parents, and an impoverished family, and is more likely to be Black. Forty-one percent
5

of children with no identified attributes are Black, while 98 percent of children with three
or more attributes are Black. Thirty-two percent of mothers of children with no identified
attributes are high school dropouts, as opposed to 55 percent of mothers with three or
more attributes. Forty-seven percent of children with no identified attributes are born to
single parents, while 94 percent of children with three or more attributes are born to
single parents. “Black names”—names given more frequently to Blacks than to
Whites—have demographics similar to those associated with one identified attribute.
Interestingly, “deviant” spellings of popular names, such as “Ashlee”, share similar
socio-economic status to those with no identified attributes, but are considerably less
likely to be given to Black children.
This paper exploits within-family differences in the character of the names given to
children. Therefore, it is necessary that there exist considerable variation in the attributes
of names within a family. It is important to note from Table 1 that, while the majority of
children with at least one low socio-economic-status name attribute are Black, 38 percent
are not, and while Blacks are overwhelmingly disproportionately represented among the
set of children with very low socio-economic-status names, Black children are still more
likely to be given common names typically given to Whites.
But do naming patterns vary within a family? Table 2 compares the names of successive
siblings within the same family. Overall, if the first sibling in a pair has a name with at
least one low-socio-economic status attribute, there is an 18 percent chance that the
succeeding sibling will also have a name with at least one of these attributes. If the first
6

sibling in a pair does not have a name with at least one of these attributes, there is a 12
percent chance that the next sibling will. Black families are more likely to give their
children names with low socio-economic status connotations, but are not overwhelmingly
so: Twenty-five percent of Black children who follow a sibling with at least one
identified attribute also have a similar name, while 16 percent of Black children who
follow a sibling with no identified attributes have a name identified as low socio-
economic status. Among Whites, 10 or 11 percent of next siblings have a measured low
socio-economic status name, regardless of whether the first sibling had this type of name.
Therefore, it appears as if there is considerable within-family variation in naming
patterns. Moreover, in results not presented in this table, I find that families, both Black
and White, are equally likely to transition from a low socio-economic status name to one
that has no identified characteristics as they are to transition away from a name with no
identified characteristics.
Table 2 also breaks down these same pattern by maternal education levels. While poorly-
educated Black women are the most likely to give their children names that I associate
with low socio-economic status (indeed, the relationship between children’s names and
poor education is by construction!) one still observes that, in every combination of
maternal education and race, there exists considerable within-family variation in the
observed attributes of names.
Obviously, my measure of name socio-economic status is imperfect, and it only singles
out 12 percent of all children as having low socio-economic status names. This is an
7

advantage, however, if one’s maintained assumption is that most names—even unique
names--do not provide a strong signal about status, and that teachers (and others in the
general population) form expectations about children in part based on how their names
look and sound. I would expect that this is particularly important when it comes to very
unusual names: Teachers may apply a mental “Frankfurter pornography test” when it
comes to names, and “know it when they see it.” While confidentiality restrictions
prevent me from describing the names that are extremely uncommon in the Florida data
set, I can identify names given at least ten times in the data to describe a hierarchy of
names’ expected socio-economic status, and present all regression results in terms of a
range of observed names—first I compare two marginally common names, one given
almost exclusively to White children (“Drew”) and one given almost exclusively to Black
children (“Dwayne”). Then I compare names along a hierarchy, from a name with one
identified attribute (“Damarcus”) to a name with two identified attributes (“Da’Quan”) to
a name with three or more identified attributes (none are observed with sufficient
frequency to name here.) Almost no White children are given names with two or more
observed attributes, but ten percent are given names with one of these attributes. Most
are sufficiently uncommon to name here, but some names given to at least ten White
children in my dataset include “Jazzmyn”, “Chloe’ ”, and “Zakery”.
Black families not only vary the attributes of the names that they give siblings, but they
also tend to give their children substantially different middle names from first names.
For instance, among Black children with first names with at least one identified attribute
of low socio-economic status, 18 percent have middle names that also have at least one
8

such attribute. Among Black children without any such attributes in their first names, 16
percent have middle names with at least one such attribute. White families give children
middle names with at least one attribute of low socio-economic status about seven
percent of the time, regardless of the attributes of the first name. Similar patterns are
apparent for Black families with regard to racially-identifiable naming more generally:
Among Black children with first names that are given at least three times as likely to
White children as to Black children, these same children have middle names that share
this attribute only 30 percent of the time, while they are nearly equally likely (27 percent)
to have middle names that are given to at least three times as many Black children as
White children. And while Black children who have names that are overwhelmingly
given to Black children (at least 95 percent of the time) have similar middle names 45
percent of the time, they also receive names that are overwhelmingly White (given 25 or
fewer percent of the time to Black children) 16 percent of the time. This widespread
pattern of name-mixing for a given child indicates a general parental desire to impart
cultural heritage on a child, while the widespread pattern of cross-sibling first name-
mixing in the Black community suggests that for many Black families issues other than
this desire for cultural heritage may prevail.1
Measuring Expectations and Student Outcomes
My measure of student outcomes is the student’s national percentile ranking on a
nationally-norm-referenced mathematics or reading examination such as the Stanford-8
or Iowa Test of Basic Skills (the precise test cannot be identified because it could identify
1 Unfortunately, my data from the school district do not have middle names, so I am unable to measure whether students’ middle names, which are generally not observed by teachers or school administrators, are associated with scholastic achievement or teacher expectations.
9

the district) in grades three through nine. In the 2000-01 school year, the state of Florida
instituted a statewide norm-referenced examination, the Stanford-9 examination.
Because I use national percentile rankings of each examination to measure test scores,
scores should be comparable across years and tests. Another benefit of the national
percentile ranking is that it is directly comparable across grade levels, a crucial point
since my identification comes from pairs of siblings. My basic estimating equation is
(Test NPR)ift = αf + β(Black name ratio)i + δ(Attribute index)i + λ(Name frequency)i +
γ(Birth order)i + η(Sex)i + θ(Data from vital records)i + εift ,
for student i in family f at time t. The coefficients α represent family fixed effects. For
all children born in Florida in 1989 or later, I also observe birth vital records—data taken
directly from the child’s birth certificate. For these students, I control for birth weight, a
measure of adequacy of prenatal care, an indicator for whether the mother had labor or
delivery complications, maternal and paternal age and education, parental marital status,
and an indicator for whether the father’s information is known. For students born outside
of Florida or before 1989, I include a flag representing missing birth vital records. Since
the variables of interest, the Black name propensity and the name attribute index, does
not vary for student i even though I typically observe more than one test score for each
child, I adjust the standard errors to account for clustering at the student level. I limit the
analysis to families in which all children in the same family are reported to have the same
race or ethnicity.
Ferguson (1998) describes a number of ways in which researchers have measured teacher
expectations toward Blacks and Whites in general. Typically, this research measures
10

expectations and perceptions based on teacher reports on factors such as academic ability.
In this paper, I measure teacher expectations empirically. I seek to have two separate
measures of teacher expectations that typically move together, but where a prediction of
low expectations would predict that they would move in opposite directions. Conditional
on test scores, I suggest that teachers have low expectations for a student if at once (1)
they are less likely to refer that student to the school’s gifted program and (2) they are
more likely to promote the student to the next grade.2 These two variables are very
highly positively correlated, so a prediction that they would move in opposite directions
is strong indeed. I therefore attempt to gauge whether teachers treat students with names
associated with low socio-economic status differently by estimating:
(Grade promotion)ift = αf + θ(Math and reading test score NPR)ift + β(Black name ratio)i
+ δ(Attribute index)i + λ(Name frequency)i + γ(Birth order)i + η(Sex)i
+ µ(Data from vital records)i + εift .
I estimate these models with a linear probability specification. Conditional on observed
test scores, an increased likelihood of grade promotion signifies lower academic
standards. Therefore, if teachers have lower expectations of students with low socio-
economic status names, one would expect the coefficient on δ to be positive.
As mentioned above, I also measure teacher expectations by looking at a student’s
propensity to be referred to the school’s gifted program. The procedures for identifying
a student as gifted begin at the teacher level, where the teacher submits a subjective
2 In a previous version of this paper, I included a student’s grades instead of promotion to the next grade. I characterize expectations using promotion because it is clearer and easier to interpret. However, the results presented herein are quite similar were I to replace promotion with student letter grades, conditional on test scores. These results are available upon request.
11

checklist of attributes of a gifted child. If teachers expect less of children with low socio-
economic status names, they may be less likely to refer them for further screening into
the gifted program, all else equal. I therefore estimate variants of the preceding equation,
using gifted placement as the dependent variable in place of the promotion variable. If
teachers have lower expectations of students with low socio-economic status names, one
would expect the coefficient on δ to be negative with respect to gifted placement. Given
that the correlation between gifted placement and grade-point average is positive and
strong, it is difficult to conceive of other stories besides teacher and school administrator
expectations that could explain why a student would simultaneously be more likely to be
promoted to the next grade while being less likely to be classified as gifted. For example,
while pride of racial and ethnic identity may lead a student to achieve high grades in
school, and therefore grade promotion, one would also expect that that child would be
more, rather than less, likely to be considered gifted by teachers and school
administrators.
I estimate two variants of gifted status specifications. In one set of specifications, I do
not control for lagged gifted status, while in a second specification I do. I carry out both
specifications in an attempt to measure whether children’s names influence the likelihood
that a child will be enrolled in the gifted program at any given time, as well as whether
names affect the year-to-year transitions into the gifted program. The results presented
herein are the first set of specifications; however, the results are quite similar if instead
the effect of names on gifted transitions is estimated. Those results are available on
request.
12

Results
I characterize names along three dimensions: the “Blackness” of the name, the popularity
of the name, and the index of a name’s socio-economic status, based on name attributes.
Table 3 presents estimates of the differential estimated effects of a child’s name on
reading and mathematics test scores, based on these three factors. In Table 3 I employ
two different ways of measuring the socio-economic status of a name—either based on
predicted maternal education levels (the left panel of results) or based on the number of
low socio-economic status attributes (the right panel of results) of the name.
As Table 3 makes apparent, certain attributes of names concentrated in the Black
community are related to diminished student test performance in mathematics and
reading. But the results suggest that it is not the “Blackness” of the name per se that
makes the difference: Holding constant family fixed effects, a boy with a name given
almost exclusively to Black boys (such as “Dwayne”) but with no identified low socio-
economic status attributes is estimated to have two-thirds to three-quarters of a national
percentile lower mathematics or reading scores than would a boy with a name observed
with equal frequency but given almost exclusively to White boys (such as “Drew”).3 But
all names with a high “Blackness” index are not created equal: A boy named “Damarcus”
is estimated to have 1.1 national percentile points lower math and reading scores than
would his brother named “Dwayne”, all else equal, and “Damarcus” would in turn have
three-quarters of a percentile ranking higher test scores than his brother named
“Da’Quan”. The upshot here is that while names associated with Black children tend to
3 I do not estimate name effects for specific names, but rather for name attributes, such as frequency of observation or fraction of the population with the given name who is Black. I identify name examples such as “Dwayne” and “Drew” simply to help fix ideas.
13

be associated with modestly lower test performance, the largest estimated negative
relationships between names and test scores occur with regard to low socio-economic
status. We observe virtually identical results regardless of whether I characterize names
using a socio-economic status index or merely count the number of low socio-economic
status attributes of the name. 4
While a non-trivial fraction of the holders of identified low socio-economic status names
are White, these names tend to be associated with minority students. Therefore, in the
second panel of Table 3 I restrict the analysis to minority students only. I find results that
are extremely similar to those reflecting the entire population. The estimated effect of
receiving a “Black” name per se is somewhat higher with regard to mathematics and
considerably lower with regard to reading, but the pattern persists that other attributes of
the name matter more than simply whether the name tends to be given more distinctly by
Black families.
On the veracity of using within-family variation
Like most sibling-pair comparisons, this paper is subject to the criticism that external
factors cause a family to assign names of different degrees of racial identifiability or
exhibited socio-economic status to their children. For instance, a family could have
undergone a substantial life change (e.g., different fathers for the pair of siblings) or
could be becoming progressively assimilated or alienated from society in general. To the
4 An alternative approach to controlling for family fixed effects is to directly estimate a model of sibling differences. Here, and elsewhere in the paper, the results of a sibling difference model are very similar to those reported in the text of the paper.
14

degree to which these alternate explanations hold water, they call into question whether
the results described in this paper are causal.
While it is impossible to fully take into account these potential external factors, I can take
steps to minimize the likelihood that these types of factors are driving my results. For
instance, with regard to the potential change in parental combinations, I restrict the
analysis to siblings who share the same father as a proxy (albeit an imperfect one) for
family stability. For families for whom all students are observed in the birth vital
records, I can measure this directly. For families where this is not the case, I measure
students as having the same father if they share a last name and whose fathers have the
same last name (I do not observe father’s first name in my data). I further restrict the
analysis to siblings born within two years of one another, in order to account for the fact
that intact families still trend over time.
I find results, reported in the third panel of Table 3, that are quite similar to those found
in the overall population of siblings. For instance, the estimated effect of receiving a
name of “Dwayne” vis-à-vis “Drew” is -0.52 percentile points (and not significant;
compare to -0.68 points) in mathematics and -0.76 percentile points (also not significant,
compare to -0.74 points) in reading. The estimated effect of receiving the name
“Da’Quan” versus the name “Dwayne” (combining two columns) is -1.66 points
(compare to -1.83 points) in mathematics and -2.46 points (compare to -1.95 points) in
reading; both comparisons are strongly statistically significant. Therefore, at least to a
15

first approximation, one can conclude that the sibling-pair comparisons described herein
are not being fundamentally driven by dramatically changing families.
As an even stronger test, I next restrict the analysis to the pairs of twins in my data; these
results are reported in the fourth panel of Table 3. Because the sample size is obviously
considerably lower and quite low and the observable variation in names, regardless of
race, is smaller than is seen among other sibling pairs (as families across the races tend to
give their twins similar-sounding names) the standard errors are four to five times the size
of those estimated using larger populations. But importantly, the signs of the estimated
effects of name attributes remain as before, and the estimated effects are actually
somewhat larger in the twins analysis than with the rest of the population. Indeed, the
estimated effects are sufficiently larger in the reading specifications that these results
remain statistically significant at conventional levels for reading. Among twins, low
socioeconomic status names are associated with significantly lower reading scores and
“Blacker” names per se are associated with lower mathematics scores. Therefore, even
among twins, for whom there exists the least variation in family conditions and home life,
children with different name attributes face different estimated outcomes.
Estimated effects of names on teacher expectations measures
In this paper I posit that a potential causal link between name attributes and low student
performance comes via low levels of teacher expectations. As mentioned above, I seek to
characterize teacher expectations using two variables that tend to trend together but that,
when conditional on test scores, are predicted to move in opposite directions when
16

capturing teacher expectations. Conditional on test scores, I measure teacher
expectations by looking at whether a student is referred to the gifted program (thought of
as high expectations) and whether a student is promoted to the next grade (thought of as
low expectations.) A pattern of results that would be consistent with the test score results
woud be to have lower socio-economic status names associated negatively with
(conditional) gifted referral and positively with (conditional) grade promotion.
In Table 4 I investigate these relationships, restricting the analysis to the set of siblings
born temporally near one another and sharing the same the same father, which is my
preferred specification.5 One observes mixed evidence with regard to the “Blackness” of
a name per se: Students given names associated more with Black families are more likely
to be promoted, conditional on their test scores, than are their siblings with more
homogenized names, but there is no relationship between the “Blackness” of a name per
se and conditional gifted status. But with regard to the measures of a names socio-
economic status, both sets of results are stronger, with “Damarcus” estimated to be 1.9
percentage points less likely to be referred to the gifted program than is his brother
“Dwayne” with identical test scores, but at the same time he is 1.4 percentage points
more likely to be promoted to the next grade than is “Dwayne.” This pattern of results is
consistent with a stronger relationship between test scores and a name’s socio-economic
status than with the “Blackness” of the name per se.
5 Just as the results for test scores are very similar between this specification and that drawn from the general population, so too are the results for teacher expectations measures. For instance, in the full population the estimated effect of being named “Damarcus” versus “Dwayne” is -0.17 in gifted (compare to -0.19 points in the table) and 0.015 for promotion (compare to 0.014 in the table.)
17

Asian families as an alternative group
Asian families also tend to mix children’s names between racially-identifiable and more
heterogeneous names. However, in the case of Asian families, I hypothesize that teachers
and school administrators take children with more Asian-sounding names more seriously
than they do Asian children who appear, by virtue of their names, to be more culturally
assimilated, and therefore have higher expectations for Asian children with distinctively
Asian names. One would expect, therefore, the exact opposite pattern of results with
regard to Asian families as is observed with regard to “Black” names or low socio-
economic status names.
While I have many fewer name-mixing Asian families in my dataset than I have name-
mixing Black or White families, it is still possible to investigate within-family
comparisons among Asian families. I observe strong evidence of differential
expectations for Asian children with distinctively Asian names vis-à-vis Asian children
with “Whiter” names. Specifically, I find that an Asian child with a name such as
“Vivek” is more likely to be referred to the gifted program, conditional on test scores,
and is more likely to have high mathematics test scores (for reading, the estimated result
is positive still but statistically insignificant) than an Asian child with a name such as
“Alex”. I find no relationship between name and promotion status within Asian families,
but this is due to the fact that there exists very little variation in promotion status within
Asian families. In sum, therefore, there exists additional circumstantial evidence that
teacher expectations may be influenced by student names and may in turn translate into
student test scores.
18

Do School Attributes Make a Difference?
The results presented in Tables 3 and 4 are mean effects. But are the results uniform
across school settings? Specifically, are teachers with more exposure to Black peers (or
Black students) less likely to make assumptions about students’ abilities and respond less
to naming differences? Table 5 presents results of model specifications that address this
question. In this table I estimate separate effects for schools with many Black teachers
versus schools with few Black teachers; I choose the tenth and ninetieth percentiles of the
distribution of the percentage of teachers who are Black to illustrate the patterns.6
I find that the racial breakdown of a school’s teachers does not affect the relationships
between the “Blackness” of a name per se and either student test scores or student gifted
status, but it does influence the relationship between the “Blackness” of a name and the
student’s propensity to be promoted to the higher grade: Holding all else constant,
including test scores and family fixed effects, “Dwayne” is 1.8 percentage points more
likely than his brother “Drew” to be promoted in a school with few Black teachers and is
only 0.6 percentage points more likely to be promoted in a school with many Black
teachers.
The patterns are more consistent with regard to a name’s socio-economic status.
“Damarcus”, for instance, is estimated to have 1.2 percentile rankings lower math scores
and 2.0 percentile rankings lower reading scores than his brother “Dwayne” in a 10th
6 The patterns are the same if I characterize schools on the basis of the racial composition of their student bodies.
19

percentile school, but in 90th percentile schools there is no test score result at all.
“Damarcus” is 2.5 percentage points less likely to be referred to the gifted program in a
school with few Black teachers than is his brother “Drew”, but the difference is one-tenth
that size and statistically insignificant in schools with many Black teachers. And
“Damarcus” is 1.6 percentage points more likely to be promoted in a school with few
Black teachers than is his brother “Drew”, an estimated effect twice the size as seen in
schools with many Black teachers. These results are consistent with an “exposure” story,
in which schools with many Black teachers tend to assign less weight to children’s names
than do schools where few faculty members are Black.
Conclusions
The persistence of the Black-White test score gap, and its widening over the course of the
school cycle, is an issue of significant public policy concern. This paper presents
evidence that a portion of these patterns could be due to the names given particularly
prevalently to Black children. Children with names associated with low socio-economic
status, and to a limited degree, with “Blackness” per se, tend to score lower on their
reading and mathematics tests, relative to their siblings with less race or class-identifiable
names.
I suggest that the mechanism through which this pattern comes about involves the
expectations of teachers and school administrators regarding children with race or class-
identifiable names. Children with names that are associated with low socio-economic
status are estimated to be promoted at higher rates than are like-scoring children with less
20

identifiable names, but they are also less likely to be called gifted. This pattern of results
is consistent with a story of low teacher expectations for students with names associated
with low socio-economic status.
The hypothesis that teacher expectations are responsible for these results is bolstered by
the evidence that my results are stronger in cases in which teachers have fewer Black
colleagues (or are less likely to be Black themselves) or have less exposure to Black
students than in cases where exposure is greater. The negative estimated effects of low
socio-economic status naming on test scores, as well as evidence of differential teacher
expectations, are smaller in schools with large numbers of Black teachers or students than
in schools with few Black teachers or students. It follows that in schools with larger
numbers of Black students and teachers, teachers perhaps form fewer preconceived
notions about children purely on the basis of their names, and do not adjust their
expectations based on names as much as they may in schools where contact with Black
students and peers is more limited.
This hypothesis is also bolstered by the finding that the opposite set of results are
observed in the instance of Asian families, for whom a racially-identifiable name may
signal attributes that are perceived to be associated with success. Asian children with
racially-identifiable names apparently face higher teacher expectations and also tend to
score higher on examinations.
21

Bertrand and Mullainathan (2004) report evidence of racial discrimination even in firms
that claim to take active non-discriminatory steps. I suspect that a similar phenomenon
occurs in education, as my findings indicate that teachers treat students within a race, and
even within a family, differently. This finding suggests a role for professional
development and teacher training; if teachers are more sensitive to the apparent tendency
to treat Black students differently based on their names, they may respond accordingly.
22

References – incomplete currently
Bertrand, Marianne and Sendhil Mullainathan, “Are Emily and Greg More Employable than Lakisha and Jamal? A Field Experiment on Labor Market Discrimination,” American Economic Review, 2004. Betts, Julian and Jeff Grogger, “The Effects of Grading Standards on Student Achievement, Educational Attainment, and Entry-Level Earnings,” Economics of Education Review, 2003. Ferguson, Ronald, “Teachers’ Expectations and the Test Score Gap,” in C. Jencks and M. Phillips, eds., The Black-White Test Score Gap,” Washington, DC: Brookings Institution Press, 1998. Figlio, David and Maurice Lucas, “Do Higher Grading Standards Affect Student Performance?” Journal of Public Economics, 2004. Fryer, Roland and Steven Levitt, “The Causes and Consequences of Distinctively Black Names,” Quarterly Journal of Economics, 2004. Lillard, Dean and Phillip DeCicca, “Higher Standards, More Dropouts? Evidence Within and Across Time,” Economics of Education Review, 2001.
23

Table 1: Attributes of Families Giving Children Low-Socio-Economic Status Names
Fraction of children with name attributes who: Name attribute Are born to
a mother who is a high school dropout
Are in poverty at the time of birth
Have married parents at the time of birth
Are born to a teenaged mother
Are Black
Name has no attributes of low socio-economic status
0.32 0.57 0.53 0.19 0.41
Name has 1 low SES attribute
0.38 0.68 0.37 0.28 0.62
Name has 2 low SES attributes
0.49 0.86 0.14 0.42 0.96
Name has 3+ low SES attributes
0.55 0.90 0.06 0.52 0.98
Name is given primarily to Blacks
0.41 0.76 0.27 0.30 0.90
Name has a “deviant” spelling of a common name
0.32 0.53 0.59 0.18 0.26
Notes: Data come from Florida birth vital records from 1989 through 1996. “Low-SES attributes” were determined based on regressions of maternal education on name attributes and are as follows: (1) name has a prefix associated with low socio-economic status, such as “lo-”, “ta-”, or “qua-”; (2) name has a suffix associated with low socio-economic status, such as “-ious” or “-isha”; (3) name has an apostrophe; and (4) name has a combination of length and low-frequency consonants (measured as 20 or more Scrabble points).
24

Table 2: Within-Family Transitions in Naming Attributes: Within Sibling Pairs: Probability that the Second Sibling Has One or More Low Socio-
Economic Status Name Attribute
All families Black families White families First child has no low-SES name attributes
0.12 0.16 0.10
First child has 1+ low-SES name attribute
0.18 0.25 0.11
Families with high school dropout mothers First child has no low-SES name attributes
0.12 0.17 0.10
First child has 1+ low-SES name attribute
0.19 0.26 0.11
Families with high school graduate mothers First child has no low-SES name attributes
0.11 0.15 0.10
First child has 1+ low-SES name attribute
0.17 0.25 0.11
Notes: Data come from Florida birth vital records from 1989 through 1996. “Low-SES attributes” were determined based on regressions of maternal education on name attributes and are as follows: (1) name has a prefix associated with low socio-economic status, such as “lo-”, “ta-”, or “qua-”; (2) name has a suffix associated with low socio-economic status, such as “-ious” or “-isha”; (3) name has an apostrophe; and (4) name has a combination of length and low-frequency consonants (measured as 20 or more Scrabble points). Siblings are matched based on material social security number.
25

Table 3: Name Attributes and Student Test Scores Estimated Relationship Between Changing Names and Student Test Scores
Within-Family Comparisons
Estimated effect of changing names, based on index of predicted socio-economic status of name
Estimated effect of changing names, based on the number of low-SES attributes of the name
Dwayne vs. Drew
Damarcus vs. Dwayne
Da’Quan vs. Damarcus
Lowest predicted SES vs. Da’Quan
Dwayne vs. Drew
Damarcus vs. Dwayne
Da’Quan vs. Damarcus
Math -0.684 (0.486)
-1.104 (0.411)
-0.731 (0.283)
-0.655 (0.254)
-0.672 (0.486)
-0.832 (0.332)
-0.787 (0.332)
Reading
-0.741 (0.425)
-1.174 (0.371)
-0.782 (0.256)
-0.702 (0.229)
-0.725 (0.425)
-0.903 (0.298)
-0.864 (0.297)
MINORITY STUDENTS ONLY Math -1.006
(0.609) -1.178 (0.670)
-0.760 (0.462)
-0.681 (0.414)
-1.004 (0.609)
-0.845 (0.520)
-0.769 (0.520)
Reading
-0.282 (0.525)
-1.079 (0.574)
-0.712 (0.395)
-0.639 (0.354)
-0.269 (0.526)
-0.825 (0.443)
-0.779 (0.443)
CHILDREN BORN TO SAME FATHER WITHIN TWO YEARS OF ONE ANOTHER Math -0.520
(0.588) -1.000 (0.492)
-0.664 (0.340)
-0.595 (0.304)
-0.507 (0.589)
-0.760 (0.396)
-0.723 (0.396)
Reading
-0.761 (0.512)
-1.472 (0.447)
-0.986 (0.308)
-0.884 (0.276)
-0.735 (0.512)
-1.150 (0.358)
-1.107 (0.357)
TWINS Math -4.105
(2.736) -1.772 (1.995)
-1.200 (1.377)
-1.075 (1.235)
-4.123 (2.736)
-1.612 (1.622)
-1.577 (1.620)
Reading
-1.814 (2.702)
-3.462 (1.910)
-2.403 (1.315)
-2.155 (1.179)
-1.834 (2.703)
-2.815 (1.555)
-2.833 (1.547)
Notes: Clustered standard errors are in parentheses beneath estimated name effects. The estimates reported above are based on the coefficient estimates on name frequency, “Black name index” (computed by observing the proportion of time in which the specific name is given to a Black child), and an indicator of the socio-economic status of the name—either based on maternal education (left four columns) or the number of low socio-economic status attributes (right three columns). Dwayne and Drew are observed with about the same frequency in the data, but Drew is almost exclusively White, while Dwayne is almost exclusively Black. Damarcus has one low-SES attribute and is also less prevalently observed in the data. Da’Quan is observed with the same approximate frequency as Damarcus but has two low-SES attributes. I cannot name the names with the lowest-predicted SES because they are all unique names. All regressions include family fixed effects, grade fixed effects, and year fixed effects. Regressions also include controls for sex, birth order, birth weight, adequacy of prenatal care, complications of labor and delivery, parental education, maternal age, and parental marital status at birth.
26

27
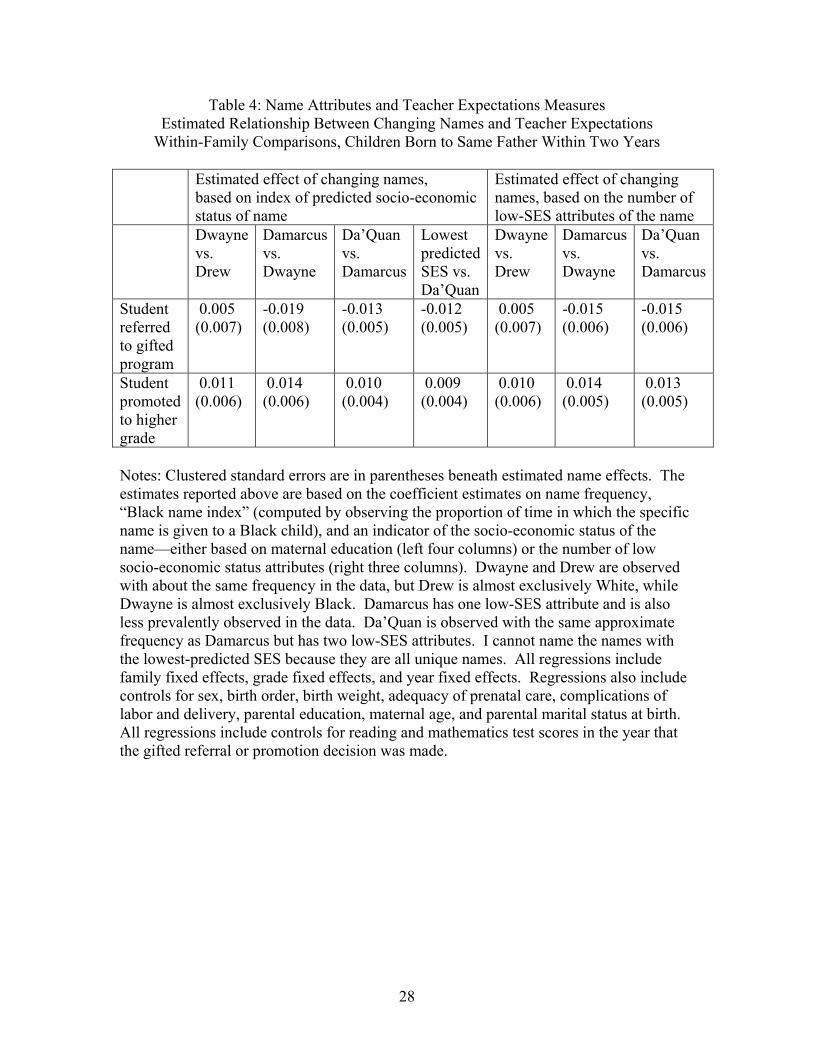
Table 4: Name Attributes and Teacher Expectations Measures Estimated Relationship Between Changing Names and Teacher Expectations
Within-Family Comparisons, Children Born to Same Father Within Two Years
Estimated effect of changing names, based on index of predicted socio-economic status of name
Estimated effect of changing names, based on the number of low-SES attributes of the name
Dwayne vs. Drew
Damarcus vs. Dwayne
Da’Quan vs. Damarcus
Lowest predicted SES vs. Da’Quan
Dwayne vs. Drew
Damarcus vs. Dwayne
Da’Quan vs. Damarcus
Student referred to gifted program
0.005 (0.007)
-0.019 (0.008)
-0.013 (0.005)
-0.012 (0.005)
0.005 (0.007)
-0.015 (0.006)
-0.015 (0.006)
Student promoted to higher grade
0.011 (0.006)
0.014 (0.006)
0.010 (0.004)
0.009 (0.004)
0.010 (0.006)
0.014 (0.005)
0.013 (0.005)
Notes: Clustered standard errors are in parentheses beneath estimated name effects. The estimates reported above are based on the coefficient estimates on name frequency, “Black name index” (computed by observing the proportion of time in which the specific name is given to a Black child), and an indicator of the socio-economic status of the name—either based on maternal education (left four columns) or the number of low socio-economic status attributes (right three columns). Dwayne and Drew are observed with about the same frequency in the data, but Drew is almost exclusively White, while Dwayne is almost exclusively Black. Damarcus has one low-SES attribute and is also less prevalently observed in the data. Da’Quan is observed with the same approximate frequency as Damarcus but has two low-SES attributes. I cannot name the names with the lowest-predicted SES because they are all unique names. All regressions include family fixed effects, grade fixed effects, and year fixed effects. Regressions also include controls for sex, birth order, birth weight, adequacy of prenatal care, complications of labor and delivery, parental education, maternal age, and parental marital status at birth. All regressions include controls for reading and mathematics test scores in the year that the gifted referral or promotion decision was made.
28

29
Table 5: Differential Teacher Expectations, by School Type Estimated Relationship Between Changing Names and Teacher Expectations,
By Fraction Black Teachers in the School
Dwayne vs. Drew Damarcus vs. Dwayne
Da’Quan vs. Damarcus
Lowest predicted SES vs. Da’Quan
10th percentile %black teachers
90th percentile %black teachers
10th percentile %black teachers
90th percentile %black teachers
10th percentile %black teachers
90th percentile %black teachers
10th percentile %black teachers
90th percentile %black teachers
Math test -0.508 (0.650)
-0.847 (0.957)
-1.207 (0.556)
-0.285 (1.095)
-0.804 (0.384)
-0.192 (0.753)
-0.721 (0.344)
-0.172 (0.675)
Reading test -1.077 (0.579)
-0.602 (0.802)
-2.026 (0.513)
0.283 (0.952)
-1.355 (0.354)
0.199 (0.654)
-1.215 (0.317)
0.178 (0.586)
Student referred to gifted program
0.006 (0.009)
0.005 (0.014)
-0.025 (0.009)
-0.002 (0.014)
-0.017 (0.006)
-0.001 (0.010)
-0.015 (0.006)
-0.001 (0.009)
Student promoted to higher grade
0.018 (0.007)
0.006 (0.011)
0.016 (0.007)
0.009 (0.013)
0.011 (0.005)
0.006 (0.009)
0.010 (0.004)
0.005 (0.008)
Notes: Clustered standard errors are in parentheses beneath estimated name effects. The estimates reported above are based on the coefficient estimates on name frequency, “Black name index” (computed by observing the proportion of time in which the specific name is given to a Black child), and an indicator of the socio-economic status of the name based on maternal education. Schools are stratified based on the fraction of teachers in the school who are Black. Dwayne and Drew are observed with about the same frequency in the data, but Drew is almost exclusively White, while Dwayne is almost exclusively Black. Damarcus has one low-SES attribute and is also less prevalently observed in the data. Da’Quan is observed with the same approximate frequency as Damarcus but has two low-SES attributes. I cannot name the names with the lowest-predicted SES because they are all unique names. All regressions include family fixed effects, grade fixed effects, and year fixed effects. Regressions also include controls for sex, birth order, birth weight, adequacy of prenatal care, complications of labor and delivery, parental education, maternal age, and parental marital status at birth. Student gifted referral and promotion regressions include controls for reading and mathematics test scores in the year that the gifted referral or promotion decision was made.