NAHMS Dairy Herd Management Practices Focusing on ... · PDF fileManagement Practices Focusing...
42
Dairy Herd Management Practices Focusing on Preweaned Heifers April 1991 - July 1992 United States Department of Agriculture Animal and Plant Health Inspection Service Veterinary Services National Dairy Heifer Evaluation Project July 1993
Transcript of NAHMS Dairy Herd Management Practices Focusing on ... · PDF fileManagement Practices Focusing...
Dairy HerdManagement Practices
Focusing onPreweaned Heifers
April 1991 - July 1992
United StatesDepartment ofAgriculture
Animal andPlant HealthInspectionService
VeterinaryServices
National Dairy Heifer Evaluation Project
July 1993
Acknowledgements
This report has been prepared from material received and analyzed by the U.S.Department of Agriculture (USDA), Animal and Plant Health Inspection Service(APHIS), Veterinary Services (VS), National Animal Health Monitoring System(NAHMS). Specimen analyses were performed by the National VeterinaryServices Laboratories in Ames, Iowa.
The National Dairy Heifer Evaluation Project was a cooperative effort between State andFederal animal health officials, university researchers, and CooperativeExtension Service (CES) personnel. NAHMS wants to thank the State and Federal Vet-erinary Medical Officers (VMO’s) who visited the farms and collected the data.
The roles of the producer, Area Veterinarian in Charge (AVIC), NAHMSCoordinator, Veterinary Medical Officer (VMO), Animal Health Technician (AHT), andNASS enumerator were critical in providing quality data for this report. Allparticipants are to be commended for their efforts, particularly the producers whose vol-untary efforts made the study possible.
Table of Contents
Executive Summary . . . . . . . . . . . . . . . . . . . . . . . . . . . . . . . . . . . . . . . . . 1
Overview . . . . . . . . . . . . . . . . . . . . . . . . . . . . . . . . . . . . . . . . . . . . . . . 3
Goals of the National Dairy Heifer Evaluation Project . . . . . . . . . . . . . . . . . . . . . . 4
General Dairy Report . . . . . . . . . . . . . . . . . . . . . . . . . . . . . . . . . . . . . . . . 5
A. Inventory . . . . . . . . . . . . . . . . . . . . . . . . . . . . . . . . . . . . . . . . 51. Number of steers, bulls, bull calves of any age . . . . . . . . . . . . . . . . . . 52. Number of beef cows and beef heifers . . . . . . . . . . . . . . . . . . . . . . . 53. Number of dairy cows and heifers . . . . . . . . . . . . . . . . . . . . . . . . . 54. Total cattle and calves on the operation . . . . . . . . . . . . . . . . . . . . . . 5
B. Dairy Calves Expected . . . . . . . . . . . . . . . . . . . . . . . . . . . . . . . . . 51. Number of dairy cows that will calve in 3 months . . . . . . . . . . . . . . . . . 52. Number of dairy heifers that will calve in 3 months . . . . . . . . . . . . . . . . 5
C. Dairy Herd Information . . . . . . . . . . . . . . . . . . . . . . . . . . . . . . . . 61. Operation description . . . . . . . . . . . . . . . . . . . . . . . . . . . . . . . . 62. Main breed of dairy herd . . . . . . . . . . . . . . . . . . . . . . . . . . . . . . 63. Percentage of dairy herd registered . . . . . . . . . . . . . . . . . . . . . . . . . 64. Rolling herd average for milk production . . . . . . . . . . . . . . . . . . . . . 65. Average length of time cows were dry . . . . . . . . . . . . . . . . . . . . . . . 66. Contributions to low milk production of cows culled from herd . . . . . . . . . 77. Average calving interval . . . . . . . . . . . . . . . . . . . . . . . . . . . . . . 78. Selling or removing all dairy calves within 24 hours . . . . . . . . . . . . . . . 79. Sale of heifer calves . . . . . . . . . . . . . . . . . . . . . . . . . . . . . . . . 710. Contracting out . . . . . . . . . . . . . . . . . . . . . . . . . . . . . . . . . . 7
D. Dairy Heifers . . . . . . . . . . . . . . . . . . . . . . . . . . . . . . . . . . . . . . 81. Newborn calves separated from mothers . . . . . . . . . . . . . . . . . . . . . . 82. First feeding of colostrum . . . . . . . . . . . . . . . . . . . . . . . . . . . . . 83. Assisting with first nursing . . . . . . . . . . . . . . . . . . . . . . . . . . . . . 84. Source of colostrum for hand feeding . . . . . . . . . . . . . . . . . . . . . . . 85. Amount of colostrum fed by hand in first 24 hours . . . . . . . . . . . . . . . . 86. Types of liquid feed fed after colostrum . . . . . . . . . . . . . . . . . . . . . . 97. Age at which calves are first offered grain, hay, and water . . . . . . . . . . . . . 98. Weaning calves from liquid ration . . . . . . . . . . . . . . . . . . . . . . . . . 99. Separating calves into groups . . . . . . . . . . . . . . . . . . . . . . . . . . . 910. Removing extra teats . . . . . . . . . . . . . . . . . . . . . . . . . . . . . . 1011. Dehorning . . . . . . . . . . . . . . . . . . . . . . . . . . . . . . . . . . . . 1012. Types of identification used . . . . . . . . . . . . . . . . . . . . . . . . . . . 1013. First calving: age and weight of heifers . . . . . . . . . . . . . . . . . . . . . 11
E. Births, Deaths, Illnesses . . . . . . . . . . . . . . . . . . . . . . . . . . . . . . . . 111. Most common illnesses of dairy heifer calves . . . . . . . . . . . . . . . . . . 112. Deaths: dairy heifer calves before weaning . . . . . . . . . . . . . . . . . . . 123. Deaths: dairy heifers from weaning to first calving . . . . . . . . . . . . . . . 12
F. Housing . . . . . . . . . . . . . . . . . . . . . . . . . . . . . . . . . . . . . . . . . 131. Facilities for heifers on liquid rations . . . . . . . . . . . . . . . . . . . . . . 132. Age of structures . . . . . . . . . . . . . . . . . . . . . . . . . . . . . . . . . . 133. Materials used for framing . . . . . . . . . . . . . . . . . . . . . . . . . . . . . 144. Materials used for exterior walls . . . . . . . . . . . . . . . . . . . . . . . . . 145. Materials used for flooring . . . . . . . . . . . . . . . . . . . . . . . . . . . . . 15
G. General Operation . . . . . . . . . . . . . . . . . . . . . . . . . . . . . . . . . . . 151. Person making day-to-day decisions . . . . . . . . . . . . . . . . . . . . . . . . 152. Formal education of operator . . . . . . . . . . . . . . . . . . . . . . . . . . . . 153. Ownership information . . . . . . . . . . . . . . . . . . . . . . . . . . . . . . 154. Record-keeping systems used . . . . . . . . . . . . . . . . . . . . . . . . . . . 165. Sources of information used for making health care decisions . . . . . . . . . . 166. Person responsibile for feeding and health care of preweaned heifers . . . . . . 17
Dairy Heifer Health Report . . . . . . . . . . . . . . . . . . . . . . . . . . . . . . . . . . . 17
A. Biosecurity . . . . . . . . . . . . . . . . . . . . . . . . . . . . . . . . . . . . . . . 171. Beef and dairy animals brought onto operation . . . . . . . . . . . . . . . . . 172. Animal types with physical contact with dairy cows . . . . . . . . . . . . . . 183. Washing of cows udders . . . . . . . . . . . . . . . . . . . . . . . . . . . . . . 184. Antiseptic application to navels of newborn calves . . . . . . . . . . . . . . . . 185. Hygiene of calf feeding utensils . . . . . . . . . . . . . . . . . . . . . . . . . . 196. Physical contact of heifer calves with other groups . . . . . . . . . . . . . . . . 19
B. Maternity Hygiene . . . . . . . . . . . . . . . . . . . . . . . . . . . . . . . . . . . 191. Where calves are born . . . . . . . . . . . . . . . . . . . . . . . . . . . . . . . 192. Calving area separate from dry cows . . . . . . . . . . . . . . . . . . . . . . . 193. Length of time dams spend in calving area prior to calving . . . . . . . . . . . . 204. Use of bedding . . . . . . . . . . . . . . . . . . . . . . . . . . . . . . . . . . 205. Cleaning of calving facilities . . . . . . . . . . . . . . . . . . . . . . . . . . . . 216. Use of lime in calving area . . . . . . . . . . . . . . . . . . . . . . . . . . . . 217. Length of time calf remains in calving area . . . . . . . . . . . . . . . . . . . . 22
C. Preweaning Hygiene . . . . . . . . . . . . . . . . . . . . . . . . . . . . . . . . . . 221. Housing calves after separation from dam . . . . . . . . . . . . . . . . . . . . 222. Square feet accessible to each calf in preweaning structures . . . . . . . . . . . 223. Number of preweaning calves and livestock in structures and outside areas . . . 224. Use of bedding . . . . . . . . . . . . . . . . . . . . . . . . . . . . . . . . . . . 235. Cleaning of preweaning facilities . . . . . . . . . . . . . . . . . . . . . . . . 236. Movement of hutches/individual shelters . . . . . . . . . . . . . . . . . . . . . 24
7. All-in/All-out operation . . . . . . . . . . . . . . . . . . . . . . . . . . . . . 248. Days facilities are empty between groups . . . . . . . . . . . . . . . . . . . . 25
D. Disease Agents . . . . . . . . . . . . . . . . . . . . . . . . . . . . . . . . . . . . 251. Health events involving the digestive system in heifers . . . . . . . . . . . . . 252. Health events involving the respiratory system in heifers . . . . . . . . . . . . 263. Health events involving the muscles, bones, or joints in heifers . . . . . . . . . 264. Health events involving the nervous system in heifers . . . . . . . . . . . . . 265. Health events involving the skin or eyes in heifers . . . . . . . . . . . . . . . 276. Health events involving the reproductive system in heifers . . . . . . . . . . . 277. Health events involving mastitis in freshened heifers . . . . . . . . . . . . . . 278. Other health events . . . . . . . . . . . . . . . . . . . . . . . . . . . . . . . . 27
E. Vaccination Practices . . . . . . . . . . . . . . . . . . . . . . . . . . . . . . . . . 281. Vaccinations routinely used in dry cows . . . . . . . . . . . . . . . . . . . . . 282. Vaccinations/injectable supplements routinely used in heifers . . . . . . . . . 283. Preventive practices used in heifers . . . . . . . . . . . . . . . . . . . . . . . 294. Services of off-farm consultants . . . . . . . . . . . . . . . . . . . . . . . . . 29
Dairy Heifer Management Report . . . . . . . . . . . . . . . . . . . . . . . . . . . . . . . . 30
A. Management . . . . . . . . . . . . . . . . . . . . . . . . . . . . . . . . . . . . . 301. Individuals who care for calves from birth to weaning . . . . . . . . . . . . . 302. Labor spent caring for heifers from birth to weaning . . . . . . . . . . . . . . 303. Visits by private practitioners . . . . . . . . . . . . . . . . . . . . . . . . . . 304. Resources for improving heifer management . . . . . . . . . . . . . . . . . . 30
B. Feed . . . . . . . . . . . . . . . . . . . . . . . . . . . . . . . . . . . . . . . . . 311. Feeds fed to calves 24 hours of age to weaning . . . . . . . . . . . . . . . . . 312. Calf age groups fed feedstuffs containing protein of animal origin . . . . . . . 31
Milk Replacer Quality and Management . . . . . . . . . . . . . . . . . . . . . . . . . . . . 32
A. Management Information . . . . . . . . . . . . . . . . . . . . . . . . . . . . . . 321. Percentage of feeding time by source of feed (milk) . . . . . . . . . . . . . . . 322. Amount fed at one feeding . . . . . . . . . . . . . . . . . . . . . . . . . . . . 323. How often fed . . . . . . . . . . . . . . . . . . . . . . . . . . . . . . . . . . . 324. Feeding practices during winter months . . . . . . . . . . . . . . . . . . . . . 335. Fed to calves individually . . . . . . . . . . . . . . . . . . . . . . . . . . . . 336. Water available to calf . . . . . . . . . . . . . . . . . . . . . . . . . . . . . . 337. Water temperature during milk replacer preparation . . . . . . . . . . . . . . . 338. Storage after mixing . . . . . . . . . . . . . . . . . . . . . . . . . . . . . . . 339. Refrigeration after mixing . . . . . . . . . . . . . . . . . . . . . . . . . . . . 33
B. Ingredient Information . . . . . . . . . . . . . . . . . . . . . . . . . . . . . . . . 341. Feed tag . . . . . . . . . . . . . . . . . . . . . . . . . . . . . . . . . . . . . . 34
C. Rennet Coagulation Test . . . . . . . . . . . . . . . . . . . . . . . . . . . . . . . 361. Results of test . . . . . . . . . . . . . . . . . . . . . . . . . . . . . . . . . . . 36
Executive Summary
A National study of preweaning heifer health and productivity, the National Dairy HeiferEvaluation Project (NDHEP), was conducted by the National Animal Health MonitoringSystem (NAHMS), USDA:APHIS:Veterinary Services, from April 1991 through July 1992representing herds of 30 or more milk cows and heifer-rearing operations in the participatingStates.
Two groups of dairy industry and health experts were assembled to make recommendationsfor implementation of the study: 1) the Dairy Advisory Group identified the replacementheifer as the area of largest informational need not currently being met through otheravenues, and 2) a Dairy Technical Group made recommendations as to the input and outputmeasures to be studied in reference to the replacement heifer. The study design wasdeveloped in collaboration with the National Agricultural Statistics Service (NASS) whoprovided list and area sampling frames. The sample was statistically designed to provideinferences about the national heifer population. NASS selected 3,346 operations in 28preselected States to contact as a subsample of their January 1, 1991, cattle surveyrespondents.
A general farm management and policy questionnaire was completed by 1,811 producersfrom 28 States whose operations qualified for the study and who agreed to continue. Datawere collected by enumerators of the National Association of State Departments of Agri-culture (NASDA). The 28 States represented 83 percent of U.S. milk cows; herds with 30or more milk cows in the participating States represented 78 percent of the U.S. milk cows.
• One-third (33.7 percent) of the producers allowed calves to receive first colostrumduring first nursing from the dam, 64.0 percent hand fed first colostrum from a bucketor bottle, and 2.3 percent force fed calves using an esophageal feeder.
• Of those that hand fed first colostrum, 73.9 percent of the producers fed less than 4quarts in the first 24 hours.
• Preweaned heifer calf death loss was 8.4 percent of those born alive or moved on theoperations.
Next, 1,177 producers were enrolled in the on-farm monitoring phase of the program ona staggered, monthly basis by State and federal Veterinary Medical Officers (VMO’s). In-formation on farm biosecurity measures, facility characteristics, disease history, routinepreventive/treatment practices and economics were collected via additional question-naires over a 3-month monitoring period for each operation. Each producer also
National Dairy Heifer Evaluation Project Executive Summary
USDA:APHIS:VS 1
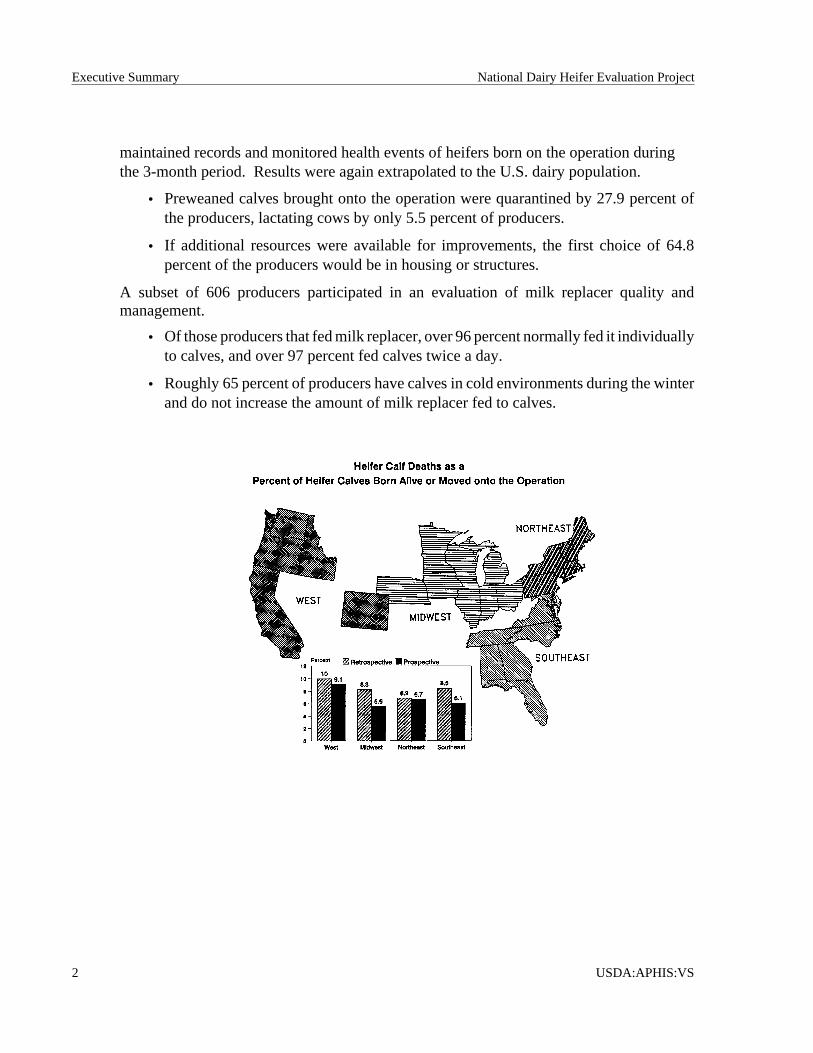
maintained records and monitored health events of heifers born on the operation duringthe 3-month period. Results were again extrapolated to the U.S. dairy population.
• Preweaned calves brought onto the operation were quarantined by 27.9 percent ofthe producers, lactating cows by only 5.5 percent of producers.
• If additional resources were available for improvements, the first choice of 64.8percent of the producers would be in housing or structures.
A subset of 606 producers participated in an evaluation of milk replacer quality andmanagement.
• Of those producers that fed milk replacer, over 96 percent normally fed it individuallyto calves, and over 97 percent fed calves twice a day.
• Roughly 65 percent of producers have calves in cold environments during the winterand do not increase the amount of milk replacer fed to calves.
Executive Summary National Dairy Heifer Evaluation Project
2 USDA:APHIS:VS
Overview
Part I of the National Dairy Heifer Evaluation Project (NDHEP) results,Dairy HerdManagement Practices Focusing on Preweaned Heifers, contains descriptive tables dividedinto four sections, named for the tool used to collect the data. The number of operationsresponding to each data collection tool is shown below.
• General Dairy Report (n = 1,811)
• Dairy Heifer Health Report (n = 1,177)
• Dairy Heifer Management Report (n = 1,123)
• Milk Replacer Quality and Management (n = 606)
The tables shown in this report are population estimates, such as averages and proportionswhich have been weighted so that inferences can be made to the National dairy heiferpopulation. The estimates are provided with a measure of variability called the standarderror and denoted by (+/-). Chances are 95 out of 100 that these survey estimates will bewithin plus or minus two standard errors of the average estimates derived from repeatingthe survey for all possible samples of the population. Estimates and standard errors havebeen rounded to the nearest tenth (0.1).
An order sheet for additional information on projects of the Center for Animal HealthMonitoring is included at the back of the booklet. A Technical Report containing details onthe methodology employed during the National Dairy Heifer Evaluation Project is alsoavailable.
Part II , Dairy Herd Morbidity and Mortality Focusing on Heifers from Birth to Weaning,expected within 6 months of the release of Part I, will present NDHEP information of calfmonitoring for clinical signs, treatments, and deaths. Part II will also contain laboratorytesting results forSalmonella,E. coli 0157:H7,Cryptosporidium, immunoglobulin, andselenium. Additional information will be results of heifer growth assessments.
If you have questions about this report contact the National Animal Health MonitoringSystem at:
Center for Animal Health MonitoringUSDA:APHIS:VS
555 South Howes, Suite 200Fort Collins, Colorado 80521
(303) 490-7800
National Dairy Heifer Evaluation Project Overview
USDA:APHIS:VS 3
Goals
• To provide cooperating producers and practitioners with an evaluation ofthe current status of certain heifer-rearing practices.
• To obtain estimates of health and productivity parameters on the Nationaldairy heifer population.
• To identify and quantitate the effect of factors contributing to the health,productivity, and profitability of dairy replacement heifers.
********Focus on the preweaned heifer.********
of the National Dairy Heifer Evaluation Project
Goals National Dairy Heifer Evaluation Project
4 USDA:APHIS:VS

General Dairy Report
A. Inventory (at the time of the interview)1. How many steers, bulls, and bull calves of any age (including bulls used for breeding and newbornbull calves)? Average Standard Error
14.1 (±0.8)2. How many are:
Average Standard Errora. beef cows (including beef heifers that have calved and cull beef cows,but not cull dairy cows)? 1.8 (±0.2)b. beef heifers (that have not calved)including newborns? 1.5 (±0.2)
3. How many are:a. dairy cows (including dairy heifers
that have calved)? 85.7 (±1.3)
i. being milked (including culls)? 72.5 (±1.2)
ii. dry? 13.2 (±0.3)b. dairy heifers (that have not calved)including newborns? 66.3 (±1.3)
i. newborn to weaning age? 8.5 (±0.3)ii. dairy heifers weaning age to4 months old? 9.5 (±0.3)
iii. 4 months to breeding age? 25.5 (±0.5)
iv. breeding age and older? 22.8 (±0.5)
4. The total cattle and calves on this operation is:169.4 (±2.9)
B. Dairy Calves Expected1. How many dairy cows will calve on this operation during the next 3 months (including anythat are not already here)? Average Standard Error
16.7 (±0.4)
2. How many dairy heifers will calve (during the next 3 months)Average Standard Error
7.1 (±0.2)
National Dairy Heifer Evaluation Project General Dairy Report
USDA:APHIS:VS 5
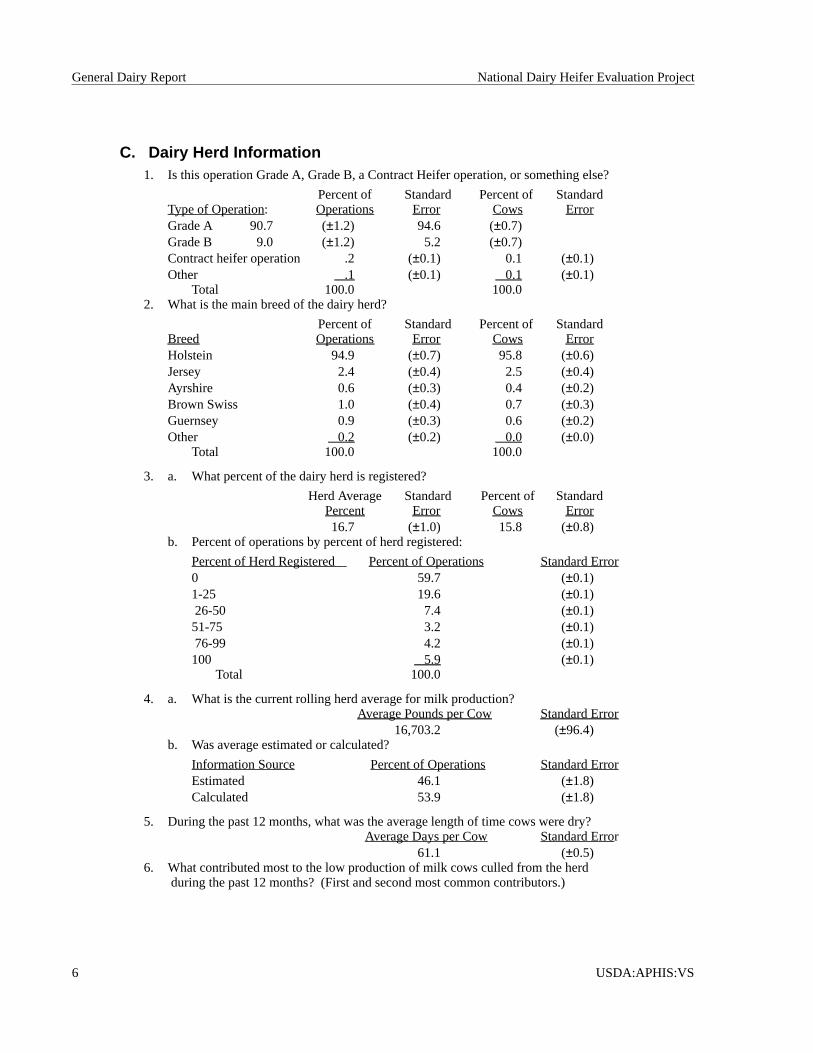
C. Dairy Herd Information1. Is this operation Grade A, Grade B, a Contract Heifer operation, or something else?
Percent of Standard Percent of StandardType of Operation: Operations Error Cows ErrorGrade A 90.7 (±1.2) 94.6 (±0.7)Grade B 9.0 (±1.2) 5.2 (±0.7)Contract heifer operation .2 (±0.1) 0.1 (±0.1)Other .1 (±0.1) 0.1 (±0.1)
Total 100.0 100.02. What is the main breed of the dairy herd?
Percent of Standard Percent of StandardBreed Operations Error Cows ErrorHolstein 94.9 (±0.7) 95.8 (±0.6)Jersey 2.4 (±0.4) 2.5 (±0.4)Ayrshire 0.6 (±0.3) 0.4 (±0.2)Brown Swiss 1.0 (±0.4) 0.7 (±0.3)Guernsey 0.9 (±0.3) 0.6 (±0.2)Other 0.2 (±0.2) 0.0 (±0.0)
Total 100.0 100.0
3. a. What percent of the dairy herd is registered?
Herd Average Standard Percent of StandardPercent Error Cows Error16.7 (±1.0) 15.8 (±0.8)
b. Percent of operations by percent of herd registered:
Percent of Herd Registered Percent of Operations Standard Error0 59.7 (±0.1)1-25 19.6 (±0.1)26-50 7.4 (±0.1)51-75 3.2 (±0.1)76-99 4.2 (±0.1)100 5.9 (±0.1)
Total 100.0
4. a. What is the current rolling herd average for milk production?Average Pounds per Cow Standard Error
16,703.2 (±96.4)b. Was average estimated or calculated?
Information Source Percent of Operations Standard ErrorEstimated 46.1 (±1.8)Calculated 53.9 (±1.8)
5. During the past 12 months, what was the average length of time cows were dry?Average Days per Cow Standard Error
61.1 (±0.5)6. What contributed most to the low production of milk cows culled from the herd
during the past 12 months? (First and second most common contributors.)
General Dairy Report National Dairy Heifer Evaluation Project
6 USDA:APHIS:VS
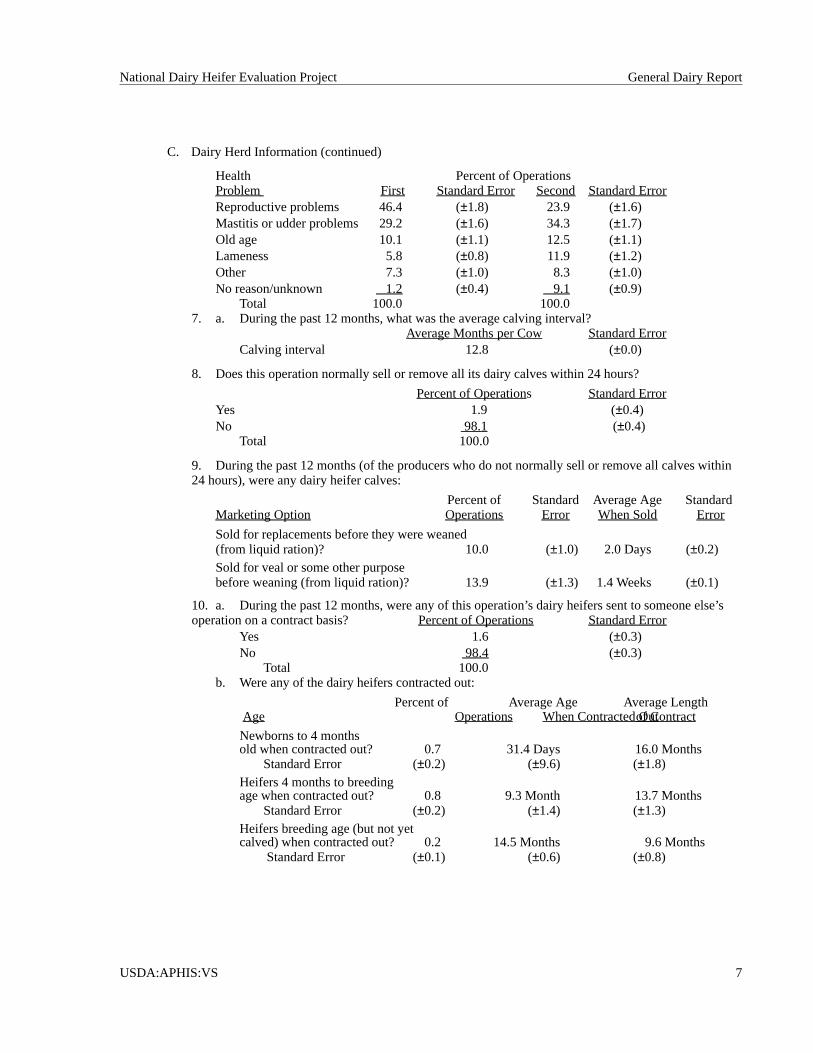
Health Percent of OperationsProblem First Standard Error Second Standard ErrorReproductive problems 46.4 (±1.8) 23.9 (±1.6)Mastitis or udder problems 29.2 (±1.6) 34.3 (±1.7)Old age 10.1 (±1.1) 12.5 (±1.1)Lameness 5.8 (±0.8) 11.9 (±1.2)Other 7.3 (±1.0) 8.3 (±1.0)No reason/unknown 1.2 (±0.4) 9.1 (±0.9)
Total 100.0 100.07. a. During the past 12 months, what was the average calving interval?
Average Months per Cow Standard ErrorCalving interval 12.8 (±0.0)
8. Does this operation normally sell or remove all its dairy calves within 24 hours?
Percent of Operations Standard ErrorYes 1.9 (±0.4)No 98.1 (±0.4)
Total 100.0
9. During the past 12 months (of the producers who do not normally sell or remove all calves within24 hours), were any dairy heifer calves:
Percent of Standard Average Age StandardMarketing Option Operations Error When Sold Error
Sold for replacements before they were weaned(from liquid ration)? 10.0 (±1.0) 2.0 Days (±0.2)Sold for veal or some other purposebefore weaning (from liquid ration)? 13.9 (±1.3) 1.4 Weeks (±0.1)
10. a. During the past 12 months, were any of this operation’s dairy heifers sent to someone else’soperation on a contract basis? Percent of Operations Standard Error
Yes 1.6 (±0.3)No 98.4 (±0.3)
Total 100.0b. Were any of the dairy heifers contracted out:
Percent of Average Age Average LengthAge Operations When Contracted Outof Contract
Newborns to 4 monthsold when contracted out? 0.7 31.4 Days 16.0 Months
Standard Error (±0.2) (±9.6) (±1.8)Heifers 4 months to breedingage when contracted out? 0.8 9.3 Month 13.7 Months
Standard Error (±0.2) (±1.4) (±1.3)Heifers breeding age (but not yetcalved) when contracted out? 0.2 14.5 Months 9.6 Months
Standard Error (±0.1) (±0.6) (±0.8)
C. Dairy Herd Information (continued)
National Dairy Heifer Evaluation Project General Dairy Report
USDA:APHIS:VS 7

D. Dairy Heifers1. How soon are newborn calves separated from their mothers?
Age Percent of Operations Standard Error0 Hours (before nursing) 28.0 (±1.7)Less than 12 hours 39.6 (±1.7)12-24 hours 22.0 (±1.4)More than 24 hours 10.4 (±1.0)
Total 100.0
2. How do baby calves get their first feeding of colostrum (the first milk produced after calf is born)?
Method of Delivery Percent of Operations Standard ErrorDuring first nursing 33.7 (±1.7)Hand feeding from bucket or bottle 64.0 (±1.7)Hand feeding using esophageal feeder 2.3 (±0.6)
Total 100.0
3. Does someone routinely assist the calves with their first nursing (from the mother)?
Percent of Operations Standard ErrorYes 40.8 (±2.9)No 59.2 (±2.9)
Total 100.0
4. What is the source of colostrum used in hand feeding?
Percent of OperationsSource Hand Feeding Standard ErrorFirst milk from mother 94.6 (±0.7)Pooled milk from several cows, exlcuding first calf heifers 2.3 (±0.4)Pooled milk from several cows, including first calf heifers 0.9 (±0.3)Stored milk from individual cows (not pooled) 1.9 (±0.5)Commercial colostrum substitute 0.3 (±0.2)
Total 100.0
5. How much colostrum is fed (by hand) during the first 24 hours?Percent of Operations
Source Hand Feeding Standard ErrorTwo quarts or less 25.6 (±1.8)More than two, but less than four quarts 48.2 (±2.1)Four or more quarts 26.2 (±1.9)
Total 100.0
General Dairy Report National Dairy Heifer Evaluation Project
8 USDA:APHIS:VS

6. What types of liquid feed are used after colostrum is fed?Liquid Feed Types Percent of Operations Standard ErrorMilk from cows recently calved 51.9 (±1.8)Whole milk from bulk tank 32.7 (±1.7)Mastitic or antibiotic milk
(discarded milk from sick cows) 37.7 (±1.7)Milk replacer 59.0 (±1.8)Fermented milk 3.3 (±0.6)Other 1.5 (±0.4)
7. On average, how old are the calves when first offered:
Average Age in Days Standard Errora. grain or other concentrated feeds? 9.7 (±0.4)
b. hay or other roughages? 23.0 (±0.7)
c. free choice of water? 25.8 (±0.9)
8. a. What determines when it’s time to wean calves (from liquid ration)?
Factor Percent of Operations Standard ErrorAge 43.0 (±1.8)Weight 26.4 (±1.6)Grain intake 26.9 (±1.5)Other 3.7 (±0.6)
Total 100.0b. What is the average age of calves at weaning (from liquid ration)?
Average Age in Weeks Standard Error7.9 (±0.1)
9. a. Are calves ever separated into groups?Percent of Operations Standard Error
Yes 79.8 (±1.4)No 20.2 (±1.4)
Total 100.0b. What is the main consideration for grouping the first time?
Percent of OperationsFactor That Group Calves Standard ErrorAge 48.0 (±2.0)Weight or size 47.4 (±2.0)Other 4.6 (±0.8)
Total 100.0
D. Dairy Heifers (continued)
National Dairy Heifer Evaluation Project General Dairy Report
USDA:APHIS:VS 9
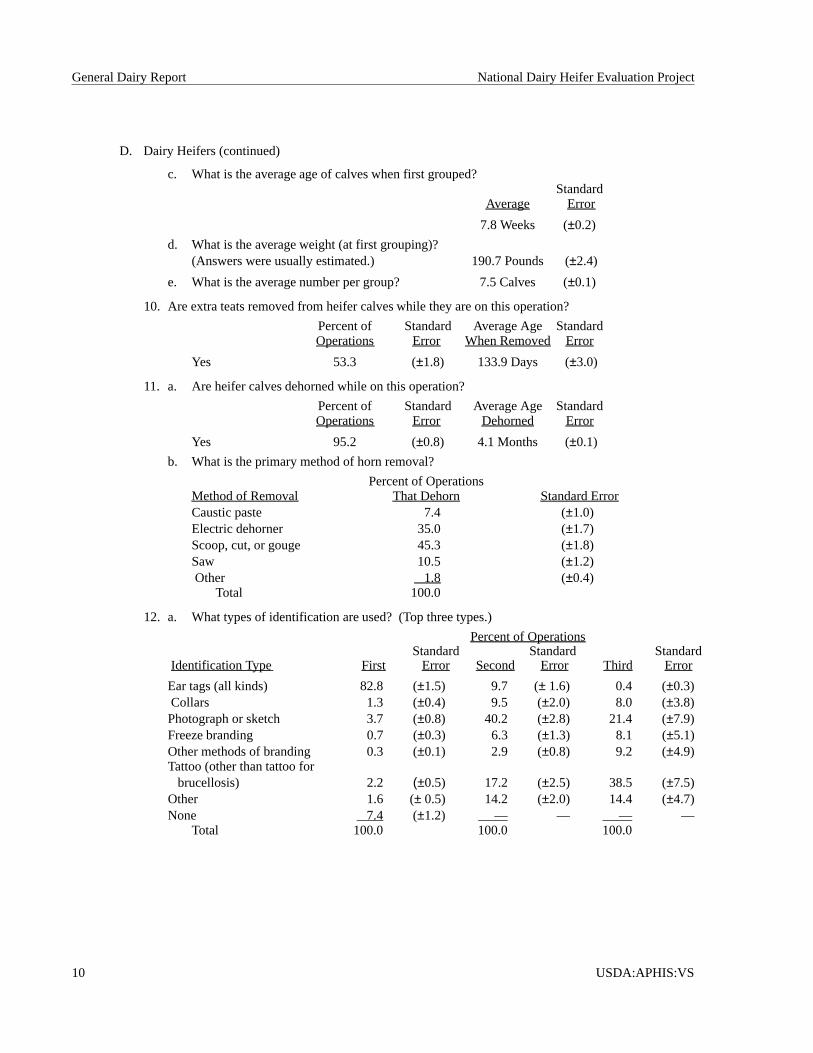
c. What is the average age of calves when first grouped?Standard
Average Error
7.8 Weeks (±0.2)
d. What is the average weight (at first grouping)?(Answers were usually estimated.) 190.7 Pounds (±2.4)
e. What is the average number per group? 7.5 Calves (±0.1)
10. Are extra teats removed from heifer calves while they are on this operation?
Percent of Standard Average Age StandardOperations Error When Removed Error
Yes 53.3 (±1.8) 133.9 Days (±3.0)
11. a. Are heifer calves dehorned while on this operation?
Percent of Standard Average Age StandardOperations Error Dehorned Error
Yes 95.2 (±0.8) 4.1 Months (±0.1)
b. What is the primary method of horn removal?
Percent of OperationsMethod of Removal That Dehorn Standard ErrorCaustic paste 7.4 (±1.0)Electric dehorner 35.0 (±1.7)Scoop, cut, or gouge 45.3 (±1.8)Saw 10.5 (±1.2)Other 1.8 (±0.4)
Total 100.0
12. a. What types of identification are used? (Top three types.)
Percent of OperationsStandard Standard Standard
Identification Type First Error Second Error Third Error
Ear tags (all kinds) 82.8 (±1.5) 9.7 (± 1.6) 0.4 (±0.3)Collars 1.3 (±0.4) 9.5 (±2.0) 8.0 (±3.8)Photograph or sketch 3.7 (±0.8) 40.2 (±2.8) 21.4 (±7.9)Freeze branding 0.7 (±0.3) 6.3 (±1.3) 8.1 (±5.1)Other methods of branding 0.3 (±0.1) 2.9 (±0.8) 9.2 (±4.9)Tattoo (other than tattoo for
brucellosis) 2.2 (±0.5) 17.2 (±2.5) 38.5 (±7.5)Other 1.6 (± 0.5) 14.2 (±2.0) 14.4 (±4.7)None 7.4 (±1.2) — — — —
Total 100.0 100.0 100.0
D. Dairy Heifers (continued)
General Dairy Report National Dairy Heifer Evaluation Project
10 USDA:APHIS:VS
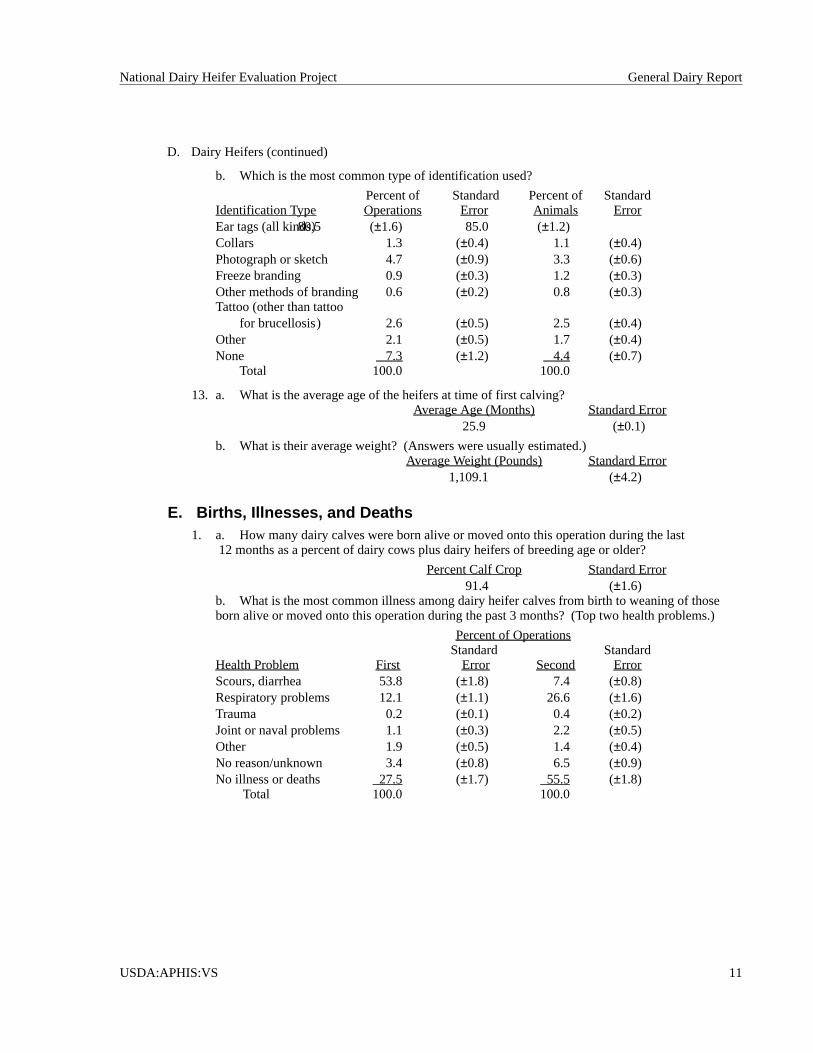
b. Which is the most common type of identification used?
Percent of Standard Percent of StandardIdentification Type Operations Error Animals ErrorEar tags (all kinds)80.5 (±1.6) 85.0 (±1.2)Collars 1.3 (±0.4) 1.1 (±0.4)Photograph or sketch 4.7 (±0.9) 3.3 (±0.6)Freeze branding 0.9 (±0.3) 1.2 (±0.3)Other methods of branding 0.6 (±0.2) 0.8 (±0.3)Tattoo (other than tattoo
for brucellosis) 2.6 (±0.5) 2.5 (±0.4)Other 2.1 (±0.5) 1.7 (±0.4)None 7.3 (±1.2) 4.4 (±0.7)
Total 100.0 100.0
13. a. What is the average age of the heifers at time of first calving?Average Age (Months) Standard Error
25.9 (±0.1)
b. What is their average weight? (Answers were usually estimated.)Average Weight (Pounds) Standard Error
1,109.1 (±4.2)
E. Births, Illnesses, and Deaths1. a. How many dairy calves were born alive or moved onto this operation during the last
12 months as a percent of dairy cows plus dairy heifers of breeding age or older?
Percent Calf Crop Standard Error91.4 (±1.6)
b. What is the most common illness among dairy heifer calves from birth to weaning of thoseborn alive or moved onto this operation during the past 3 months? (Top two health problems.)
Percent of OperationsStandard Standard
Health Problem First Error Second ErrorScours, diarrhea 53.8 (±1.8) 7.4 (±0.8)Respiratory problems 12.1 (±1.1) 26.6 (±1.6)Trauma 0.2 (±0.1) 0.4 (±0.2)Joint or naval problems 1.1 (±0.3) 2.2 (±0.5)Other 1.9 (±0.5) 1.4 (±0.4)No reason/unknown 3.4 (±0.8) 6.5 (±0.9)No illness or deaths 27.5 (±1.7) 55.5 (±1.8)
Total 100.0 100.0
D. Dairy Heifers (continued)
National Dairy Heifer Evaluation Project General Dairy Report
USDA:APHIS:VS 11
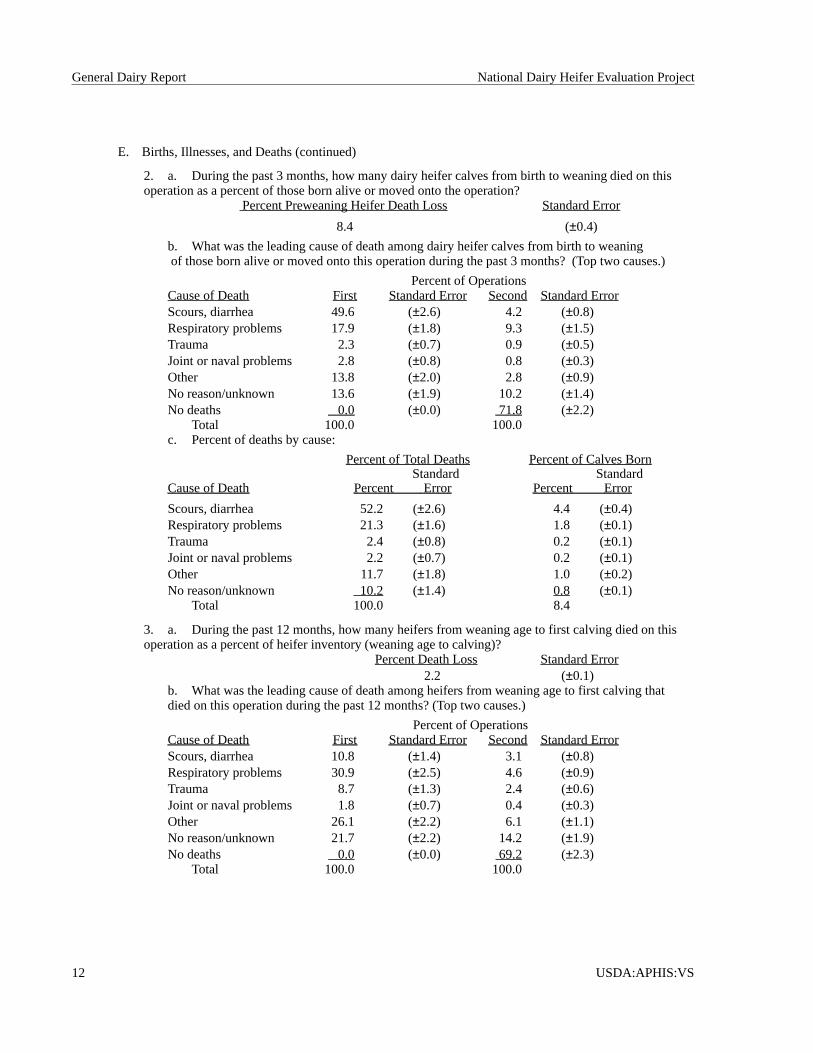
2. a. During the past 3 months, how many dairy heifer calves from birth to weaning died on thisoperation as a percent of those born alive or moved onto the operation?
Percent Preweaning Heifer Death Loss Standard Error
8.4 (±0.4)
b. What was the leading cause of death among dairy heifer calves from birth to weaningof those born alive or moved onto this operation during the past 3 months? (Top two causes.)
Percent of OperationsCause of Death First Standard Error Second Standard ErrorScours, diarrhea 49.6 (±2.6) 4.2 (±0.8)Respiratory problems 17.9 (±1.8) 9.3 (±1.5)Trauma 2.3 (±0.7) 0.9 (±0.5)Joint or naval problems 2.8 (±0.8) 0.8 (±0.3)Other 13.8 (±2.0) 2.8 (±0.9)No reason/unknown 13.6 (±1.9) 10.2 (±1.4)No deaths 0.0 (±0.0) 71.8 (±2.2)
Total 100.0 100.0c. Percent of deaths by cause:
Percent of Total Deaths Percent of Calves BornStandard Standard
Cause of Death Percent Error Percent Error
Scours, diarrhea 52.2 (±2.6) 4.4 (±0.4)Respiratory problems 21.3 (±1.6) 1.8 (±0.1)Trauma 2.4 (±0.8) 0.2 (±0.1)Joint or naval problems 2.2 (±0.7) 0.2 (±0.1)Other 11.7 (±1.8) 1.0 (±0.2)No reason/unknown 10.2 (±1.4) 0.8 (±0.1)
Total 100.0 8.4
3. a. During the past 12 months, how many heifers from weaning age to first calving died on thisoperation as a percent of heifer inventory (weaning age to calving)?
Percent Death Loss Standard Error2.2 (±0.1)
b. What was the leading cause of death among heifers from weaning age to first calving thatdied on this operation during the past 12 months? (Top two causes.)
Percent of OperationsCause of Death First Standard Error Second Standard ErrorScours, diarrhea 10.8 (±1.4) 3.1 (±0.8)Respiratory problems 30.9 (±2.5) 4.6 (±0.9)Trauma 8.7 (±1.3) 2.4 (±0.6)Joint or naval problems 1.8 (±0.7) 0.4 (±0.3)Other 26.1 (±2.2) 6.1 (±1.1)No reason/unknown 21.7 (±2.2) 14.2 (±1.9)No deaths 0.0 (±0.0) 69.2 (±2.3)
Total 100.0 100.0
E. Births, Illnesses, and Deaths (continued)
General Dairy Report National Dairy Heifer Evaluation Project
12 USDA:APHIS:VS
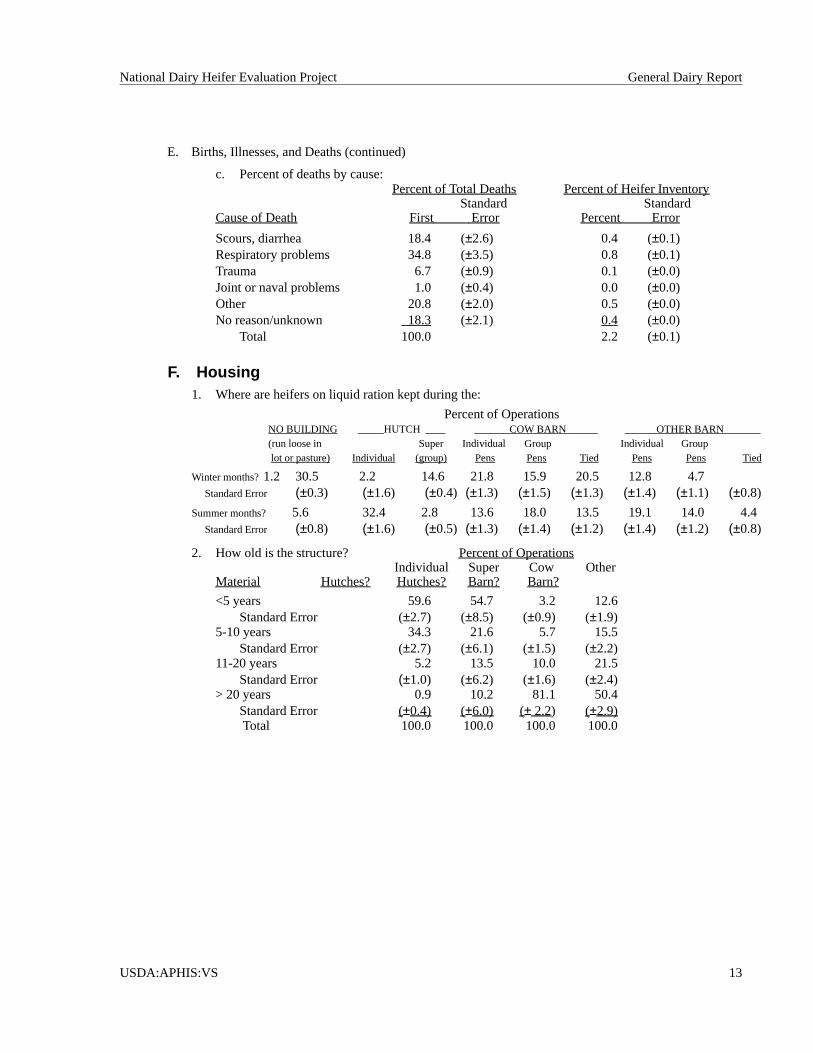
c. Percent of deaths by cause:Percent of Total Deaths Percent of Heifer Inventory
Standard StandardCause of Death First Error Percent Error
Scours, diarrhea 18.4 (±2.6) 0.4 (±0.1)Respiratory problems 34.8 (±3.5) 0.8 (±0.1)Trauma 6.7 (±0.9) 0.1 (±0.0)Joint or naval problems 1.0 (±0.4) 0.0 (±0.0)Other 20.8 (±2.0) 0.5 (±0.0)No reason/unknown 18.3 (±2.1) 0.4 (±0.0)
Total 100.0 2.2 (±0.1)
F. Housing1. Where are heifers on liquid ration kept during the:
Percent of OperationsNO BUILDING HUTCH COW BARN OTHER BARN(run loose in Super Individual Group Individual Grouplot or pasture) Individual (group) Pens Pens Tied Pens Pens Tied
Winter months?1.2 30.5 2.2 14.6 21.8 15.9 20.5 12.8 4.7Standard Error (±0.3) (±1.6) (±0.4) (±1.3) (±1.5) (±1.3) (±1.4) (±1.1) (±0.8)
Summer months? 5.6 32.4 2.8 13.6 18.0 13.5 19.1 14.0 4.4Standard Error (±0.8) (±1.6) (±0.5) (±1.3) (±1.4) (±1.2) (±1.4) (±1.2) (±0.8)
2. How old is the structure? Percent of OperationsIndividual Super Cow Other
Material Hutches? Hutches? Barn? Barn?
<5 years 59.6 54.7 3.2 12.6Standard Error (±2.7) (±8.5) (±0.9) (±1.9)
5-10 years 34.3 21.6 5.7 15.5Standard Error (±2.7) (±6.1) (±1.5) (±2.2)
11-20 years 5.2 13.5 10.0 21.5Standard Error (±1.0) (±6.2) (±1.6) (±2.4)
> 20 years 0.9 10.2 81.1 50.4Standard Error (±0.4) (±6.0) (± 2.2) (±2.9)Total 100.0 100.0 100.0 100.0
E. Births, Illnesses, and Deaths (continued)
National Dairy Heifer Evaluation Project General Dairy Report
USDA:APHIS:VS 13

3. What material is used in the framing for the:
Percent of OperationsIndividual Super Cow Other
Material Hutches? Hutches? Barn? Barn?
Wood 53.5 83.7 88.6 89.5Standard Error (±2.9) (±6.3) (± 1.7) (±1.7)
Concrete 0.0 0.0 9.1 3.3Standard Error (±0.0) (±0.0) (± 1.5) (±1.0)
Stone 0.0 0.0 0.5 1.4Standard Error (±0.0) (±0.0) (± 0.4) (±0.8)
Metal 4.0 12.1 1.8 5.4Standard Error (±0.9) (±6.1) (± 0.6) (±1.2)
Fiberglass/plastic 42.5 4.2 0.0 0.4Standard Error (±2.9) (±2.2) (± 0.0) (±0.3)Total 100.0 100.0 100.0 100.0
4. What material is used for the exterior walls of the:
Percent of OperationsIndividual Super Cow Other
Material Hutches? Hutches? Barn? Barn?
None 0.1 0.1 0.1 0.6Standard Error (±0.1) (±0.1) (± 0.1) (±0.2)
Wood 48.2 55.2 52.1 48.5Standard Error (±2.9) (±8.6) (± 2.8) (±2.9)
Concrete 0.0 1.0 26.1 10.9Standard Error (±0.0) (±1.0) (± 2.5) (±1.7)
Stone 0.0 0.0 7.1 2.9Standard Error (±0.0) (±0.0) (± 1.5) (±1.1)
Metal 7.3 39.6 14.3 36.0Standard Error (±1.5) (±8.7) (± 2.2) (±2.8)
Fiberglass/plastic 44.2 4.1 0.1 0.4Standard Error (±2.9) (±2.2) (± 0.1) (±0.2)
Asphalt/tar 0.2 0.0 0.2 0.7Standard Error (±0.2) (±0.0) (± 0.2) (±0.4)Total 100.0 100.0 100.0 100.0
F. Housing (continued)
General Dairy Report National Dairy Heifer Evaluation Project
14 USDA:APHIS:VS

5. What kind of floor is in the: Percent of OperationsIndividual Super Cow Other
Material Hutches? Hutches? Barn? Barn?
Wood 3.1 8.5 2.1 3.5Standard Error (±0.8) (±5.3) (± 0.7) (±0.8)
Concrete 5.5 14.1 90.5 75.4Standard Error (±1.7) (±5.4) (± 1.4) (±2.2)
Stone/gravel 14.5 16.1 1.6 2.7Standard Error (±2.0) (±5.6) (± 0.6) (±0.8)
Metal 0.5 1.3 0.5 0.1Standard Error (±0.2) (±1.3) (± 0.4) (±0.1)
Fiberglass/plastic 0.0 2.1 0.3 0.3Standard Error (±0.0) (±2.0) (± 0.3) (±0.3)
Dirt/sand 76.4 57.9 5.0 18.0Standard Error (±2.5) (±8.3) (± 0.9) (±2.0)Total 100.0 100.0 100.0 100.0
G. General Operation1. Who makes the day-to-day decisions for this operation?
Person(s) Percent of Operations Standard ErrorOne individual 72.7 (±1.5)Partners 26.0 (±1.4)Hired manager 1.3 (±0.4)
Total 100.0
2. What is the operator’s highest level of formal education?
Education Level Percent of Operations Standard ErrorGrade school 10.4 (±1.0)High school 59.5 (±1.8)Some college 13.3 (±1.0)BA or BS degree 9.5 (±1.1)Graduate school 1.3 (±0.3)Technical school 6.0 (±0.9)
Total 100.0
3. What type of business is this operation?
Business Type Percent of Operations Standard ErrorSole proprietorship 72.9 (±1.5)Partnership 23.6 (±1.5)Corporation 3.5 (±0.4)
Total 100.0
F. Housing (continued)
National Dairy Heifer Evaluation Project General Dairy Report
USDA:APHIS:VS 15
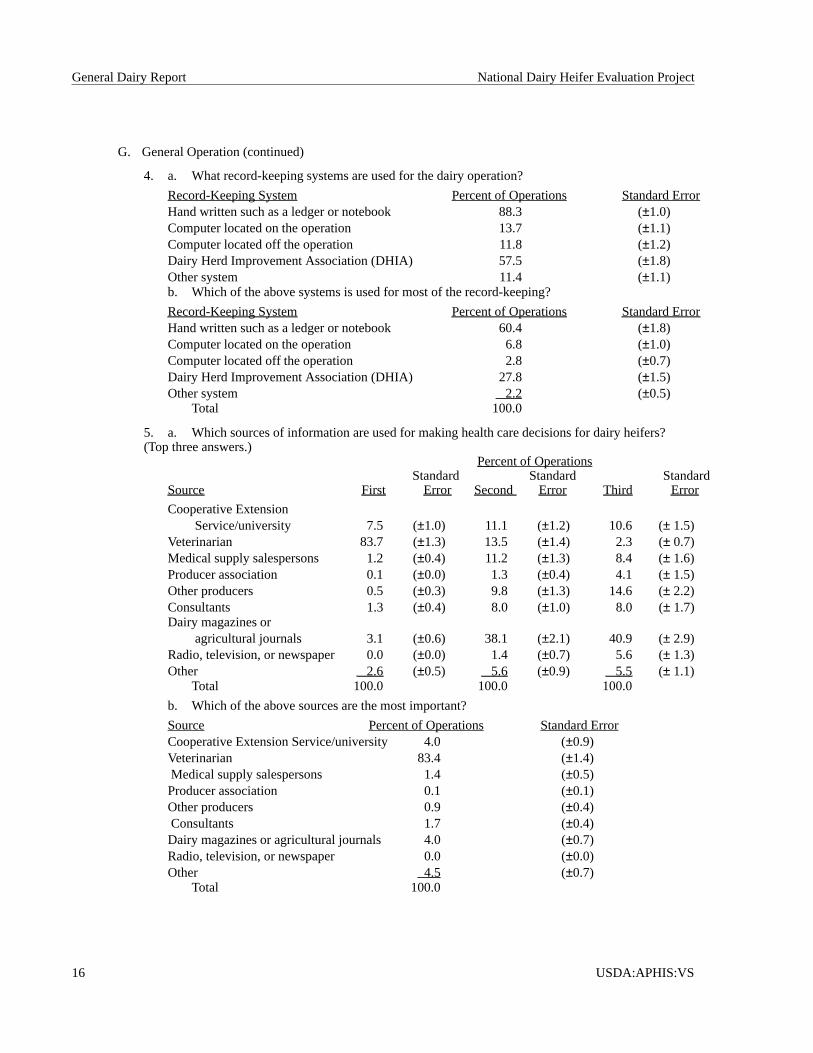
4. a. What record-keeping systems are used for the dairy operation?
Record-Keeping System Percent of Operations Standard ErrorHand written such as a ledger or notebook 88.3 (±1.0)Computer located on the operation 13.7 (±1.1)Computer located off the operation 11.8 (±1.2)Dairy Herd Improvement Association (DHIA) 57.5 (±1.8)Other system 11.4 (±1.1)b. Which of the above systems is used for most of the record-keeping?
Record-Keeping System Percent of Operations Standard ErrorHand written such as a ledger or notebook 60.4 (±1.8)Computer located on the operation 6.8 (±1.0)Computer located off the operation 2.8 (±0.7)Dairy Herd Improvement Association (DHIA) 27.8 (±1.5)Other system 2.2 (±0.5)
Total 100.0
5. a. Which sources of information are used for making health care decisions for dairy heifers?(Top three answers.)
Percent of OperationsStandard Standard Standard
Source First Error Second Error Third Error
Cooperative ExtensionService/university 7.5 (±1.0) 11.1 (±1.2) 10.6 (± 1.5)
Veterinarian 83.7 (±1.3) 13.5 (±1.4) 2.3 (± 0.7)Medical supply salespersons 1.2 (±0.4) 11.2 (±1.3) 8.4 (± 1.6)Producer association 0.1 (±0.0) 1.3 (±0.4) 4.1 (± 1.5)Other producers 0.5 (±0.3) 9.8 (±1.3) 14.6 (± 2.2)Consultants 1.3 (±0.4) 8.0 (±1.0) 8.0 (± 1.7)Dairy magazines or
agricultural journals 3.1 (±0.6) 38.1 (±2.1) 40.9 (± 2.9)Radio, television, or newspaper 0.0 (±0.0) 1.4 (±0.7) 5.6 (± 1.3)Other 2.6 (±0.5) 5.6 (±0.9) 5.5 (± 1.1)
Total 100.0 100.0 100.0
b. Which of the above sources are the most important?
Source Percent of Operations Standard ErrorCooperative Extension Service/university 4.0 (±0.9)Veterinarian 83.4 (±1.4)Medical supply salespersons 1.4 (±0.5)Producer association 0.1 (±0.1)Other producers 0.9 (±0.4)Consultants 1.7 (±0.4)Dairy magazines or agricultural journals 4.0 (±0.7)Radio, television, or newspaper 0.0 (±0.0)Other 4.5 (±0.7)
Total 100.0
G. General Operation (continued)
General Dairy Report National Dairy Heifer Evaluation Project
16 USDA:APHIS:VS
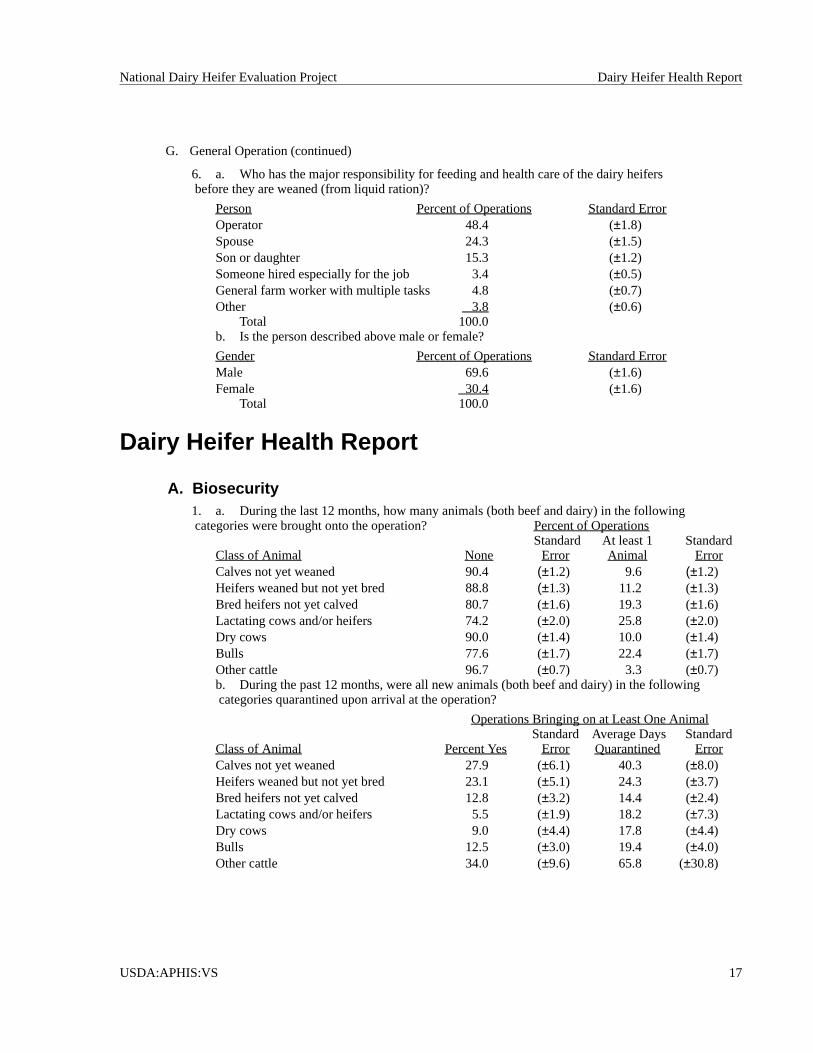
6. a. Who has the major responsibility for feeding and health care of the dairy heifersbefore they are weaned (from liquid ration)?
Person Percent of Operations Standard ErrorOperator 48.4 (±1.8)Spouse 24.3 (±1.5)Son or daughter 15.3 (±1.2)Someone hired especially for the job 3.4 (±0.5)General farm worker with multiple tasks 4.8 (±0.7)Other 3.8 (±0.6)
Total 100.0b. Is the person described above male or female?
Gender Percent of Operations Standard ErrorMale 69.6 (±1.6)Female 30.4 (±1.6)
Total 100.0
Dairy Heifer Health Report
A. Biosecurity1. a. During the last 12 months, how many animals (both beef and dairy) in the followingcategories were brought onto the operation? Percent of Operations
Standard At least 1 StandardClass of Animal None Error Animal ErrorCalves not yet weaned 90.4 (±1.2) 9.6 (±1.2)Heifers weaned but not yet bred 88.8 (±1.3) 11.2 (±1.3)Bred heifers not yet calved 80.7 (±1.6) 19.3 (±1.6)Lactating cows and/or heifers 74.2 (±2.0) 25.8 (±2.0)Dry cows 90.0 (±1.4) 10.0 (±1.4)Bulls 77.6 (±1.7) 22.4 (±1.7)Other cattle 96.7 (±0.7) 3.3 (±0.7)b. During the past 12 months, were all new animals (both beef and dairy) in the followingcategories quarantined upon arrival at the operation?
Operations Bringing on at Least One AnimalStandard Average Days Standard
Class of Animal Percent Yes Error Quarantined ErrorCalves not yet weaned 27.9 (±6.1) 40.3 (±8.0)Heifers weaned but not yet bred 23.1 (±5.1) 24.3 (±3.7)Bred heifers not yet calved 12.8 (±3.2) 14.4 (±2.4)Lactating cows and/or heifers 5.5 (±1.9) 18.2 (±7.3)Dry cows 9.0 (±4.4) 17.8 (±4.4)Bulls 12.5 (±3.0) 19.4 (±4.0)Other cattle 34.0 (±9.6) 65.8 (±30.8)
G. General Operation (continued)
National Dairy Heifer Evaluation Project Dairy Heifer Health Report
USDA:APHIS:VS 17

2. Do any of the following animals have physical contact with female dairy animals and/orcontact with their feed? (Physical contact = possible nose-to-nose contact or sniffing/touching/licking each other through a fence.)
Animal Types Percent of OperationsYes Standard ErrorChickens/other poultry 10.6 (±1.4)Horses 15.0 (±1.6)Pigs 5.5 (±1.0)Sheep 3.0 (±0.6)Goats 3.1 (±0.7)Beef cattle 17.3 (±1.7)Deer 56.1 (±2.2)
3. Are the cows’ udders washed prior to calving?Percent of Operations Standard Error
Yes 5.1 (±1.1)No 94.9 (±1.1)
Total 100.0
4. Is antiseptic routinely applied to the navels of newborn calves?
Percent of Operations Standard ErrorYes 46.6 (±2.3)No 53.4 (±2.3)
Total 100.0
A. Biosecurity (continued)
Dairy Heifer Health Report National Dairy Heifer Evaluation Project
18 USDA:APHIS:VS

5. With regard to the hygiene of calf feeding utensils (buckets, bottles, nipples, calf feeders, andesophageal feeders) for calves up to 2 weeks of age, which of the following best describes the practiceon the operation?
Practices Percent of Operations Standard ErrorUtensils are not shared between calves 15.5 (±1.6)Utensils are shared but not routinely rinsed or washedbetween calves 36.8 (±2.1)Utensils are shared and routinely rinsed with wateronly between calves 29.8 (±2.0)Utensils are shared and routinely washed and/orsantized between calves 17.9 (±1.7)
100.0
6. After separation from the dam, do heifer calves not yet weaned have physical contact with anyof the following groups? (Physical contact = possible nose-to-nose contact or sniffing/touching/licking each other through a fence.)
Age Groups Percent of Operations Yes Standard ErrorWeaned calves less than approximately 4 months of age 31.5 (±2.0)Calves from approximately 4 months of age to breeding 10.4 (±1.3)Bred heifers not yet calved 4.6 (±0.9)Adult cattle 10.2 (±1.3)
B. Maternity HygieneBUILDING NO BUILDING
Drylot PastureIndividual Multiple Tiestall or Individual Multiple Individual Multi.
Freestall Animal Area Animal Area Stanchion Animal Animal Animal Animal
1. For the next 3 months, where will calves be born?
Percent of OperationsLocation 4.8 44.7 16.4 29.9 1.6 13.5 2.7 36.5Stan. Error (±0.8) (±2.2) (±1.5) (±2.1) (±0.5) (±1.3) (±0.7) (±2.1)
2. Will the calving area be separate from the dry cows?
Percent of Operations YesYes 48.9 91.7 44.2 38.2 97.8 26.4 64.4 20.3Stan. Error (±8.6) (±1.9) (±5.0) (±4.3) (±1.5) (±4.6) (±13.5) (±2.6)
A. Biosecurity (continued)
National Dairy Heifer Evaluation Project Dairy Heifer Health Report
USDA:APHIS:VS 19
BUILDING NO BUILDINGDrylot Pasture
Individual Multiple Tiestall or Individual Multiple Individual Multi.Freestall Animal Area Animal Area Stanchion Animal Animal Animal Animal
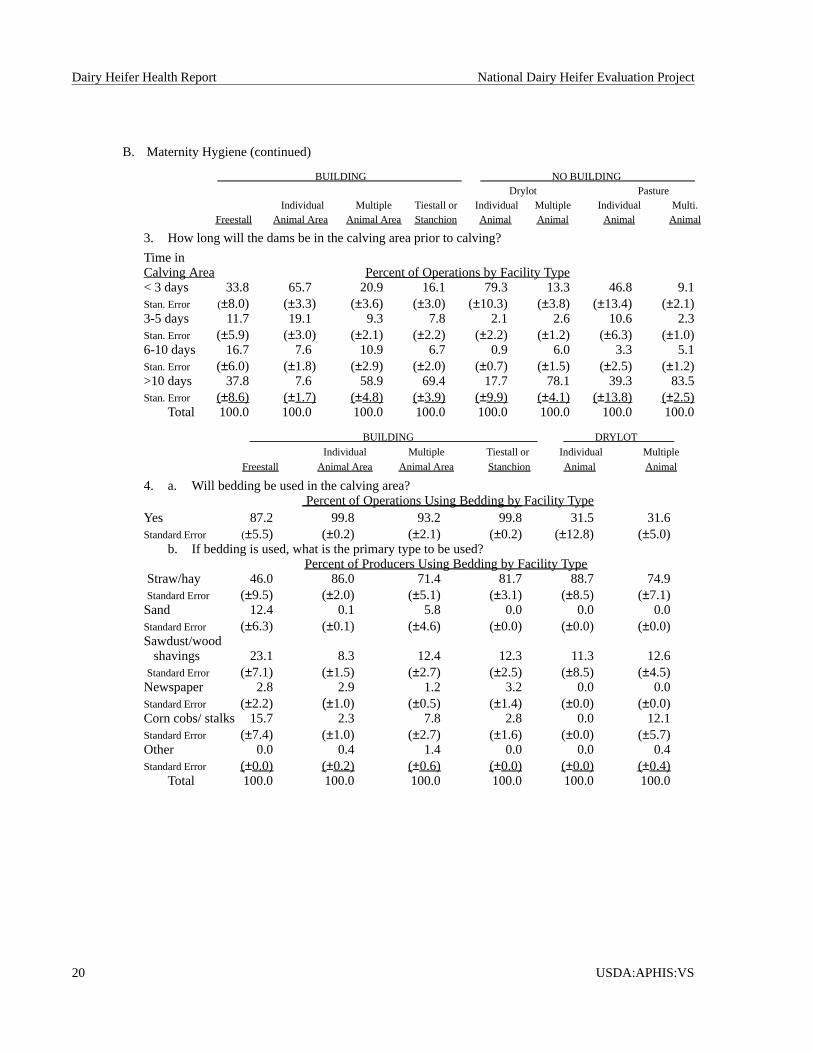
3. How long will the dams be in the calving area prior to calving?
Time inCalving Area Percent of Operations by Facility Type< 3 days 33.8 65.7 20.9 16.1 79.3 13.3 46.8 9.1Stan. Error (±8.0) (±3.3) (±3.6) (±3.0) (±10.3) (±3.8) (±13.4) (±2.1)3-5 days 11.7 19.1 9.3 7.8 2.1 2.6 10.6 2.3Stan. Error (±5.9) (±3.0) (±2.1) (±2.2) (±2.2) (±1.2) (±6.3) (±1.0)6-10 days 16.7 7.6 10.9 6.7 0.9 6.0 3.3 5.1Stan. Error (±6.0) (±1.8) (±2.9) (±2.0) (±0.7) (±1.5) (±2.5) (±1.2)>10 days 37.8 7.6 58.9 69.4 17.7 78.1 39.3 83.5Stan. Error (±8.6) (±1.7) (±4.8) (±3.9) (±9.9) (±4.1) (±13.8) (±2.5)
Total 100.0 100.0 100.0 100.0 100.0 100.0 100.0 100.0
BUILDING DRYLOT
Individual Multiple Tiestall or Individual Multiple
Freestall Animal Area Animal Area Stanchion Animal Animal
4. a. Will bedding be used in the calving area?Percent of Operations Using Bedding by Facility Type
Yes 87.2 99.8 93.2 99.8 31.5 31.6Standard Error (±5.5) (±0.2) (±2.1) (±0.2) (±12.8) (±5.0)
b. If bedding is used, what is the primary type to be used?Percent of Producers Using Bedding by Facility Type
Straw/hay 46.0 86.0 71.4 81.7 88.7 74.9Standard Error (±9.5) (±2.0) (±5.1) (±3.1) (±8.5) (±7.1)Sand 12.4 0.1 5.8 0.0 0.0 0.0Standard Error (±6.3) (±0.1) (±4.6) (±0.0) (±0.0) (±0.0)Sawdust/wood
shavings 23.1 8.3 12.4 12.3 11.3 12.6Standard Error (±7.1) (±1.5) (±2.7) (±2.5) (±8.5) (±4.5)Newspaper 2.8 2.9 1.2 3.2 0.0 0.0Standard Error (±2.2) (±1.0) (±0.5) (±1.4) (±0.0) (±0.0)Corn cobs/ stalks 15.7 2.3 7.8 2.8 0.0 12.1Standard Error (±7.4) (±1.0) (±2.7) (±1.6) (±0.0) (±5.7)Other 0.0 0.4 1.4 0.0 0.0 0.4Standard Error (±0.0) (±0.2) (±0.6) (±0.0) (±0.0) (±0.4)
Total 100.0 100.0 100.0 100.0 100.0 100.0
B. Maternity Hygiene (continued)
Dairy Heifer Health Report National Dairy Heifer Evaluation Project
20 USDA:APHIS:VS
BUILDING DRYLOT
Individual Multiple Tiestall or Individual Multiple
Freestall Animal Area Animal Area Stanchion Animal Animal
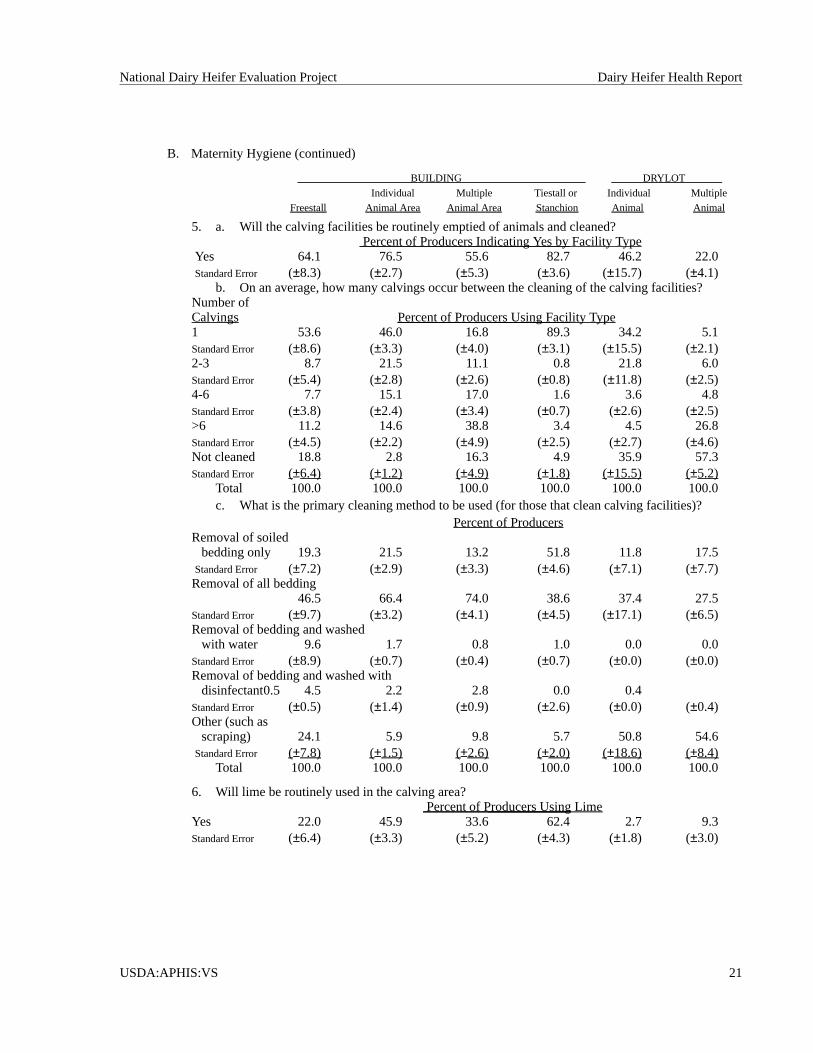
5. a. Will the calving facilities be routinely emptied of animals and cleaned?Percent of Producers Indicating Yes by Facility Type
Yes 64.1 76.5 55.6 82.7 46.2 22.0Standard Error (±8.3) (±2.7) (±5.3) (±3.6) (±15.7) (±4.1)
b. On an average, how many calvings occur between the cleaning of the calving facilities?Number ofCalvings Percent of Producers Using Facility Type1 53.6 46.0 16.8 89.3 34.2 5.1Standard Error (±8.6) (±3.3) (±4.0) (±3.1) (±15.5) (±2.1)2-3 8.7 21.5 11.1 0.8 21.8 6.0Standard Error (±5.4) (±2.8) (±2.6) (±0.8) (±11.8) (±2.5)4-6 7.7 15.1 17.0 1.6 3.6 4.8Standard Error (±3.8) (±2.4) (±3.4) (±0.7) (±2.6) (±2.5)>6 11.2 14.6 38.8 3.4 4.5 26.8Standard Error (±4.5) (±2.2) (±4.9) (±2.5) (±2.7) (±4.6)Not cleaned 18.8 2.8 16.3 4.9 35.9 57.3Standard Error (±6.4) (±1.2) (±4.9) (±1.8) (±15.5) (±5.2)
Total 100.0 100.0 100.0 100.0 100.0 100.0c. What is the primary cleaning method to be used (for those that clean calving facilities)?
Percent of ProducersRemoval of soiled
bedding only 19.3 21.5 13.2 51.8 11.8 17.5Standard Error (±7.2) (±2.9) (±3.3) (±4.6) (±7.1) (±7.7)Removal of all bedding
46.5 66.4 74.0 38.6 37.4 27.5Standard Error (±9.7) (±3.2) (±4.1) (±4.5) (±17.1) (±6.5)Removal of bedding and washed
with water 9.6 1.7 0.8 1.0 0.0 0.0Standard Error (±8.9) (±0.7) (±0.4) (±0.7) (±0.0) (±0.0)Removal of bedding and washed with
disinfectant0.5 4.5 2.2 2.8 0.0 0.4Standard Error (±0.5) (±1.4) (±0.9) (±2.6) (±0.0) (±0.4)Other (such as
scraping) 24.1 5.9 9.8 5.7 50.8 54.6Standard Error (±7.8) (±1.5) (±2.6) (±2.0) (±18.6) (±8.4)
Total 100.0 100.0 100.0 100.0 100.0 100.0
6. Will lime be routinely used in the calving area?Percent of Producers Using Lime
Yes 22.0 45.9 33.6 62.4 2.7 9.3Standard Error (±6.4) (±3.3) (±5.2) (±4.3) (±1.8) (±3.0)
B. Maternity Hygiene (continued)
National Dairy Heifer Evaluation Project Dairy Heifer Health Report
USDA:APHIS:VS 21
BUILDING NO BUILDINGDrylot Pasture
Individual Multiple Tiestall or Individual Multiple Individual Multi.Freestall Animal Area Animal Area Stanchion Animal Animal Animal Animal
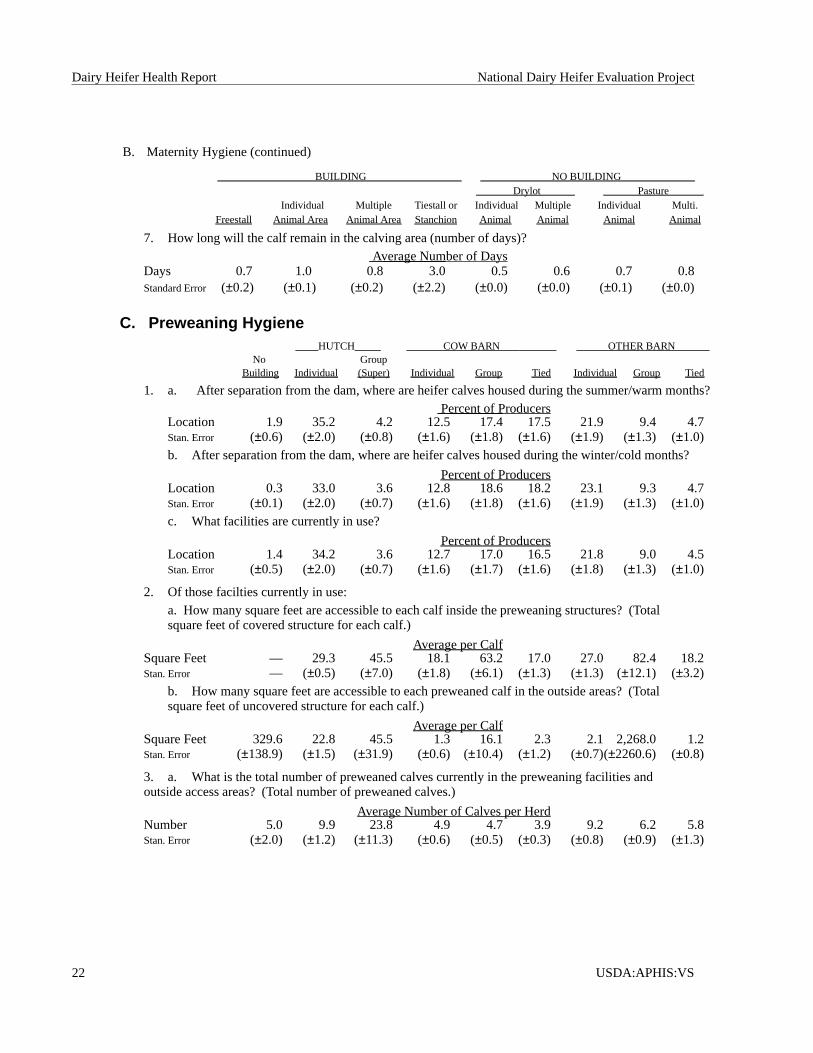
7. How long will the calf remain in the calving area (number of days)?Average Number of Days
Days 0.7 1.0 0.8 3.0 0.5 0.6 0.7 0.8Standard Error (±0.2) (±0.1) (±0.2) (±2.2) (±0.0) (±0.0) (±0.1) (±0.0)
C. Preweaning HygieneHUTCH COW BARN OTHER BARN
No GroupBuilding Individual (Super) Individual Group Tied Individual Group Tied
1. a. After separation from the dam, where are heifer calves housed during the summer/warm months?Percent of Producers
Location 1.9 35.2 4.2 12.5 17.4 17.5 21.9 9.4 4.7Stan. Error (±0.6) (±2.0) (±0.8) (±1.6) (±1.8) (±1.6) (±1.9) (±1.3) (±1.0)b. After separation from the dam, where are heifer calves housed during the winter/cold months?
Percent of ProducersLocation 0.3 33.0 3.6 12.8 18.6 18.2 23.1 9.3 4.7Stan. Error (±0.1) (±2.0) (±0.7) (±1.6) (±1.8) (±1.6) (±1.9) (±1.3) (±1.0)c. What facilities are currently in use?
Percent of ProducersLocation 1.4 34.2 3.6 12.7 17.0 16.5 21.8 9.0 4.5Stan. Error (±0.5) (±2.0) (±0.7) (±1.6) (±1.7) (±1.6) (±1.8) (±1.3) (±1.0)
2. Of those facilties currently in use:a. How many square feet are accessible to each calf inside the preweaning structures? (Totalsquare feet of covered structure for each calf.)
Average per CalfSquare Feet — 29.3 45.5 18.1 63.2 17.0 27.0 82.4 18.2Stan. Error — (±0.5) (±7.0) (±1.8) (±6.1) (±1.3) (±1.3) (±12.1) (±3.2)
b. How many square feet are accessible to each preweaned calf in the outside areas? (Totalsquare feet of uncovered structure for each calf.)
Average per CalfSquare Feet 329.6 22.8 45.5 1.3 16.1 2.3 2.1 2,268.0 1.2Stan. Error (±138.9) (±1.5) (±31.9) (±0.6) (±10.4) (±1.2) (±0.7)(±2260.6) (±0.8)
3. a. What is the total number of preweaned calves currently in the preweaning facilities andoutside access areas? (Total number of preweaned calves.)
Average Number of Calves per HerdNumber 5.0 9.9 23.8 4.9 4.7 3.9 9.2 6.2 5.8Stan. Error (±2.0) (±1.2) (±11.3) (±0.6) (±0.5) (±0.3) (±0.8) (±0.9) (±1.3)
B. Maternity Hygiene (continued)
Dairy Heifer Health Report National Dairy Heifer Evaluation Project
22 USDA:APHIS:VS
HUTCH COW BARN OTHER BARNNo Group
Building Individual (Super) Individual Group Tied Individual Group Tied
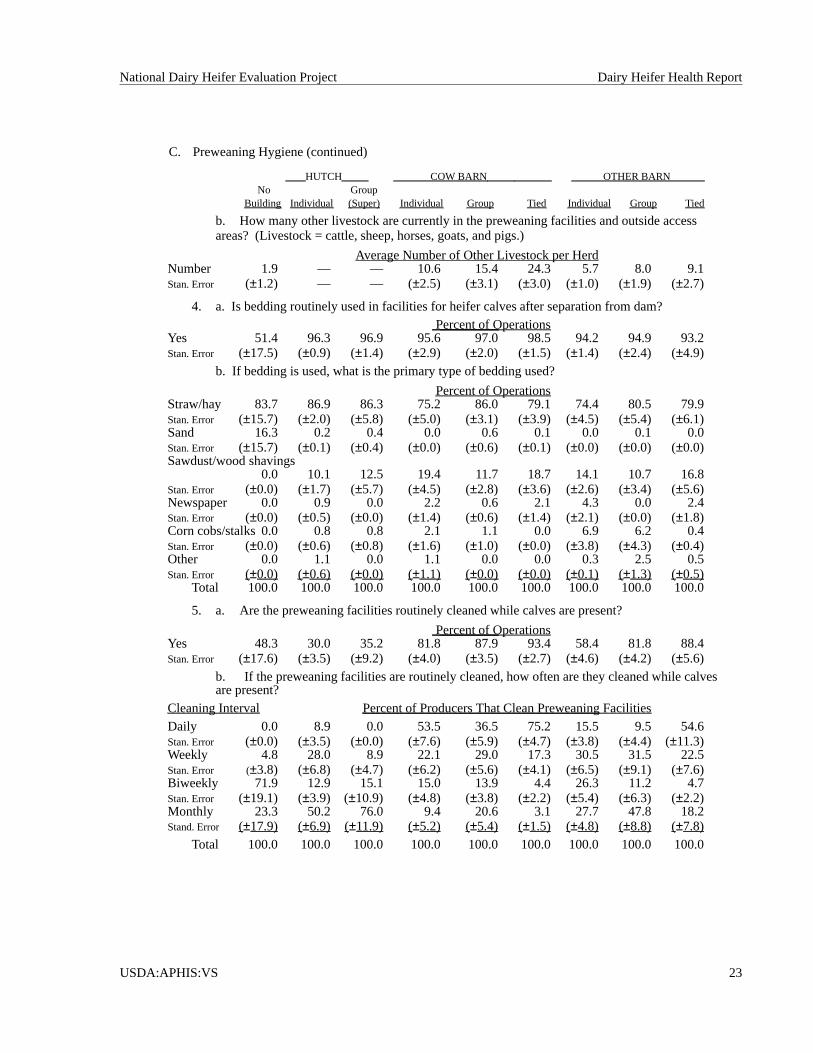
b. How many other livestock are currently in the preweaning facilities and outside accessareas? (Livestock = cattle, sheep, horses, goats, and pigs.)
Average Number of Other Livestock per HerdNumber 1.9 — — 10.6 15.4 24.3 5.7 8.0 9.1Stan. Error (±1.2) — — (±2.5) (±3.1) (±3.0) (±1.0) (±1.9) (±2.7)
4. a. Is bedding routinely used in facilities for heifer calves after separation from dam?Percent of Operations
Yes 51.4 96.3 96.9 95.6 97.0 98.5 94.2 94.9 93.2Stan. Error (±17.5) (±0.9) (±1.4) (±2.9) (±2.0) (±1.5) (±1.4) (±2.4) (±4.9)
b. If bedding is used, what is the primary type of bedding used?
Percent of OperationsStraw/hay 83.7 86.9 86.3 75.2 86.0 79.1 74.4 80.5 79.9Stan. Error (±15.7) (±2.0) (±5.8) (±5.0) (±3.1) (±3.9) (±4.5) (±5.4) (±6.1)Sand 16.3 0.2 0.4 0.0 0.6 0.1 0.0 0.1 0.0Stan. Error (±15.7) (±0.1) (±0.4) (±0.0) (±0.6) (±0.1) (±0.0) (±0.0) (±0.0)Sawdust/wood shavings
0.0 10.1 12.5 19.4 11.7 18.7 14.1 10.7 16.8Stan. Error (±0.0) (±1.7) (±5.7) (±4.5) (±2.8) (±3.6) (±2.6) (±3.4) (±5.6)Newspaper 0.0 0.9 0.0 2.2 0.6 2.1 4.3 0.0 2.4Stan. Error (±0.0) (±0.5) (±0.0) (±1.4) (±0.6) (±1.4) (±2.1) (±0.0) (±1.8)Corn cobs/stalks 0.0 0.8 0.8 2.1 1.1 0.0 6.9 6.2 0.4Stan. Error (±0.0) (±0.6) (±0.8) (±1.6) (±1.0) (±0.0) (±3.8) (±4.3) (±0.4)Other 0.0 1.1 0.0 1.1 0.0 0.0 0.3 2.5 0.5Stan. Error (±0.0) (±0.6) (±0.0) (±1.1) (±0.0) (±0.0) (±0.1) (±1.3) (±0.5)
Total 100.0 100.0 100.0 100.0 100.0 100.0 100.0 100.0 100.0
5. a. Are the preweaning facilities routinely cleaned while calves are present?
Percent of OperationsYes 48.3 30.0 35.2 81.8 87.9 93.4 58.4 81.8 88.4Stan. Error (±17.6) (±3.5) (±9.2) (±4.0) (±3.5) (±2.7) (±4.6) (±4.2) (±5.6)
b. If the preweaning facilities are routinely cleaned, how often are they cleaned while calvesare present?
Cleaning Interval Percent of Producers That Clean Preweaning FacilitiesDaily 0.0 8.9 0.0 53.5 36.5 75.2 15.5 9.5 54.6Stan. Error (±0.0) (±3.5) (±0.0) (±7.6) (±5.9) (±4.7) (±3.8) (±4.4) (±11.3)Weekly 4.8 28.0 8.9 22.1 29.0 17.3 30.5 31.5 22.5Stan. Error (±3.8) (±6.8) (±4.7) (±6.2) (±5.6) (±4.1) (±6.5) (±9.1) (±7.6)Biweekly 71.9 12.9 15.1 15.0 13.9 4.4 26.3 11.2 4.7Stan. Error (±19.1) (±3.9) (±10.9) (±4.8) (±3.8) (±2.2) (±5.4) (±6.3) (±2.2)Monthly 23.3 50.2 76.0 9.4 20.6 3.1 27.7 47.8 18.2Stand. Error (±17.9) (±6.9) (±11.9) (±5.2) (±5.4) (±1.5) (±4.8) (±8.8) (±7.8)
Total 100.0 100.0 100.0 100.0 100.0 100.0 100.0 100.0 100.0
C. Preweaning Hygiene (continued)
National Dairy Heifer Evaluation Project Dairy Heifer Health Report
USDA:APHIS:VS 23
HUTCH COW BARN OTHER BARNNo Group
Building Individual (Super) Individual Group Tied Individual Group Tied
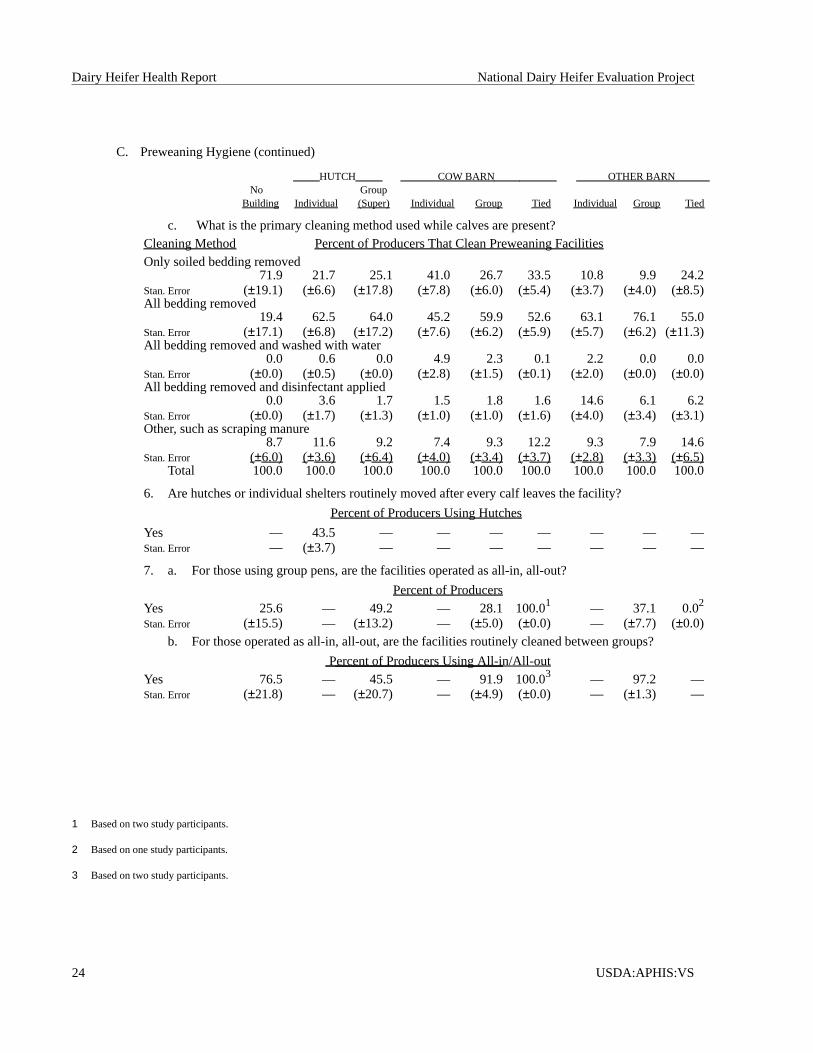
c. What is the primary cleaning method used while calves are present?Cleaning Method Percent of Producers That Clean Preweaning FacilitiesOnly soiled bedding removed
71.9 21.7 25.1 41.0 26.7 33.5 10.8 9.9 24.2Stan. Error (±19.1) (±6.6) (±17.8) (±7.8) (±6.0) (±5.4) (±3.7) (±4.0) (±8.5)All bedding removed
19.4 62.5 64.0 45.2 59.9 52.6 63.1 76.1 55.0Stan. Error (±17.1) (±6.8) (±17.2) (±7.6) (±6.2) (±5.9) (±5.7) (±6.2) (±11.3)All bedding removed and washed with water
0.0 0.6 0.0 4.9 2.3 0.1 2.2 0.0 0.0Stan. Error (±0.0) (±0.5) (±0.0) (±2.8) (±1.5) (±0.1) (±2.0) (±0.0) (±0.0)All bedding removed and disinfectant applied
0.0 3.6 1.7 1.5 1.8 1.6 14.6 6.1 6.2Stan. Error (±0.0) (±1.7) (±1.3) (±1.0) (±1.0) (±1.6) (±4.0) (±3.4) (±3.1)Other, such as scraping manure
8.7 11.6 9.2 7.4 9.3 12.2 9.3 7.9 14.6Stan. Error (±6.0) (±3.6) (±6.4) (±4.0) (±3.4) (±3.7) (±2.8) (±3.3) (±6.5)
Total 100.0 100.0 100.0 100.0 100.0 100.0 100.0 100.0 100.0
6. Are hutches or individual shelters routinely moved after every calf leaves the facility?
Percent of Producers Using Hutches
Yes — 43.5 — — — — — — —Stan. Error — (±3.7) — — — — — — —
7. a. For those using group pens, are the facilities operated as all-in, all-out?
Percent of ProducersYes 25.6 — 49.2 — 28.1 100.01 — 37.1 0.02
Stan. Error (±15.5) — (±13.2) — (±5.0) (±0.0) — (±7.7) (±0.0)b. For those operated as all-in, all-out, are the facilities routinely cleaned between groups?
Percent of Producers Using All-in/All-outYes 76.5 — 45.5 — 91.9 100.03 — 97.2 —Stan. Error (±21.8) — (±20.7) — (±4.9) (±0.0) — (±1.3) —
C. Preweaning Hygiene (continued)
Dairy Heifer Health Report National Dairy Heifer Evaluation Project
24 USDA:APHIS:VS
1 Based on two study participants.
2 Based on one study participants.
3 Based on two study participants.
HUTCH COW BARN OTHER BARNNo Group
Building Individual (Super) Individual Group Tied Individual Group Tied
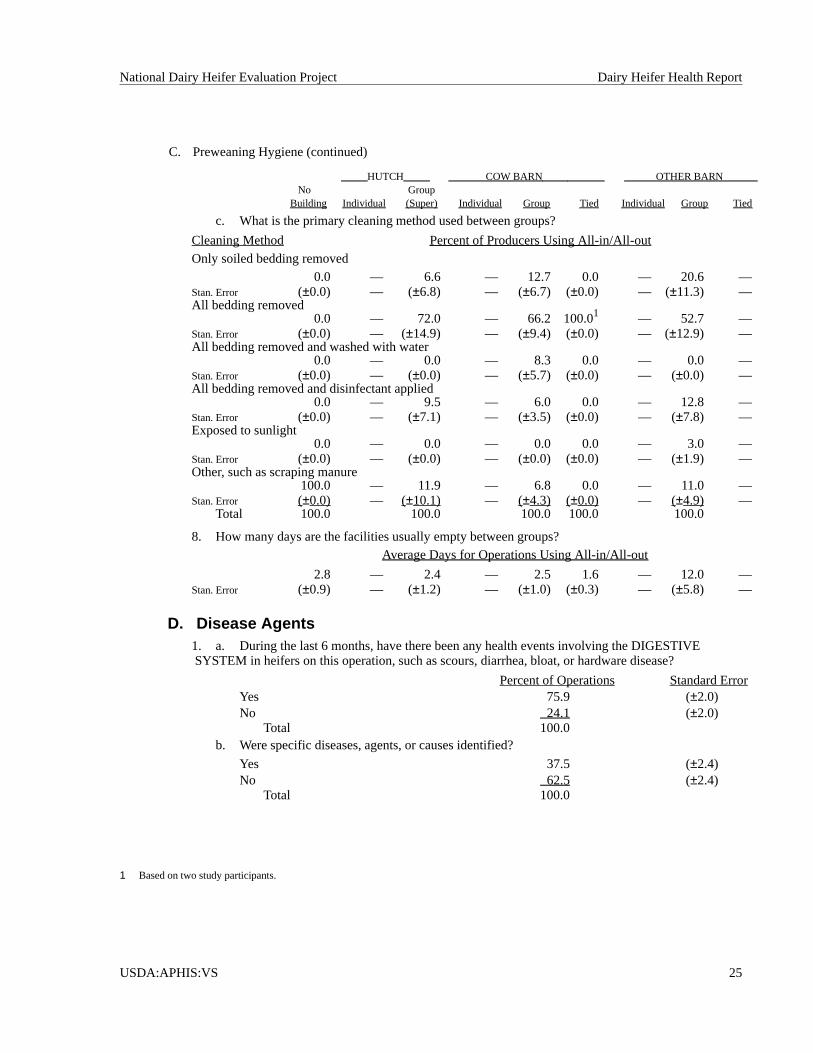
c. What is the primary cleaning method used between groups?
Cleaning Method Percent of Producers Using All-in/All-outOnly soiled bedding removed
0.0 — 6.6 — 12.7 0.0 — 20.6 —Stan. Error (±0.0) — (±6.8) — (±6.7) (±0.0) — (±11.3) —All bedding removed
0.0 — 72.0 — 66.2 100.01 — 52.7 —Stan. Error (±0.0) — (±14.9) — (±9.4) (±0.0) — (±12.9) —All bedding removed and washed with water
0.0 — 0.0 — 8.3 0.0 — 0.0 —Stan. Error (±0.0) — (±0.0) — (±5.7) (±0.0) — (±0.0) —All bedding removed and disinfectant applied
0.0 — 9.5 — 6.0 0.0 — 12.8 —Stan. Error (±0.0) — (±7.1) — (±3.5) (±0.0) — (±7.8) —Exposed to sunlight
0.0 — 0.0 — 0.0 0.0 — 3.0 —Stan. Error (±0.0) — (±0.0) — (±0.0) (±0.0) — (±1.9) —Other, such as scraping manure
100.0 — 11.9 — 6.8 0.0 — 11.0 —Stan. Error (±0.0) — (±10.1) — (±4.3) (±0.0) — (±4.9) —
Total 100.0 100.0 100.0 100.0 100.0
8. How many days are the facilities usually empty between groups?Average Days for Operations Using All-in/All-out
2.8 — 2.4 — 2.5 1.6 — 12.0 —Stan. Error (±0.9) — (±1.2) — (±1.0) (±0.3) — (±5.8) —
D. Disease Agents1. a. During the last 6 months, have there been any health events involving the DIGESTIVESYSTEM in heifers on this operation, such as scours, diarrhea, bloat, or hardware disease?
Percent of Operations Standard ErrorYes 75.9 (±2.0)No 24.1 (±2.0)
Total 100.0b. Were specific diseases, agents, or causes identified?
Yes 37.5 (±2.4)No 62.5 (±2.4)
Total 100.0
C. Preweaning Hygiene (continued)
National Dairy Heifer Evaluation Project Dairy Heifer Health Report
USDA:APHIS:VS 25
1 Based on two study participants.
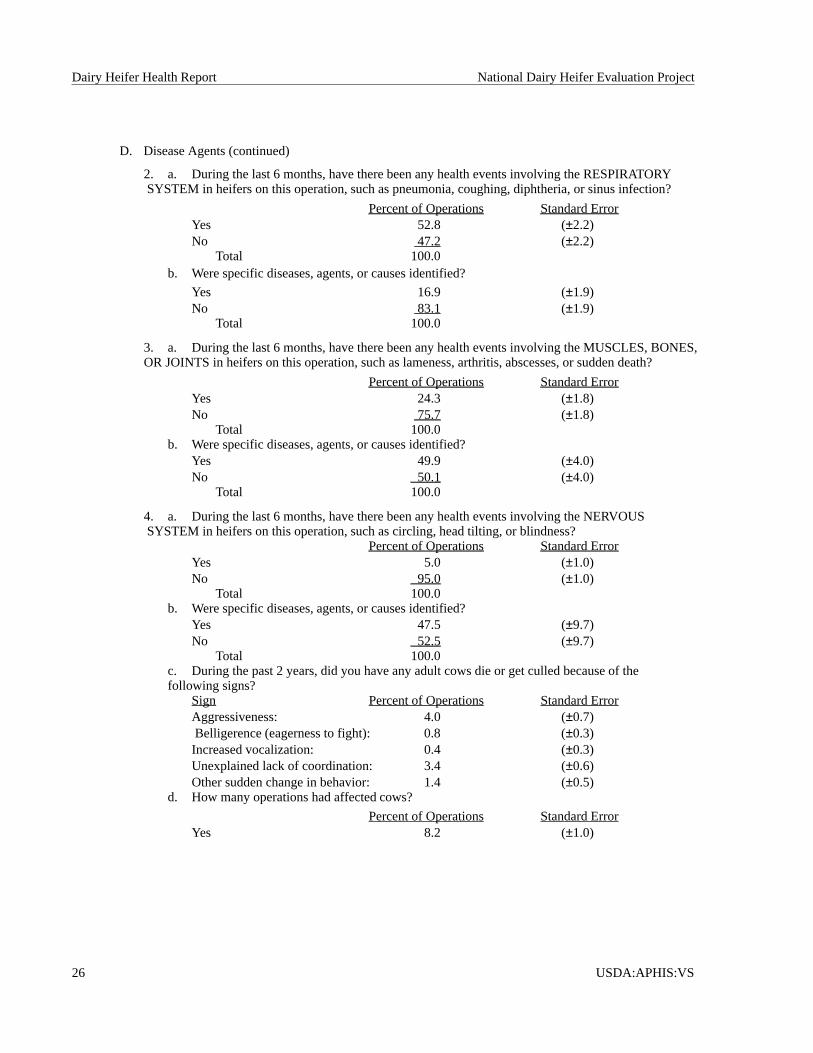
2. a. During the last 6 months, have there been any health events involving the RESPIRATORYSYSTEM in heifers on this operation, such as pneumonia, coughing, diphtheria, or sinus infection?
Percent of Operations Standard ErrorYes 52.8 (±2.2)No 47.2 (±2.2)
Total 100.0b. Were specific diseases, agents, or causes identified?
Yes 16.9 (±1.9)No 83.1 (±1.9)
Total 100.0
3. a. During the last 6 months, have there been any health events involving the MUSCLES, BONES,OR JOINTS in heifers on this operation, such as lameness, arthritis, abscesses, or sudden death?
Percent of Operations Standard ErrorYes 24.3 (±1.8)No 75.7 (±1.8)
Total 100.0b. Were specific diseases, agents, or causes identified?
Yes 49.9 (±4.0)No 50.1 (±4.0)
Total 100.0
4. a. During the last 6 months, have there been any health events involving the NERVOUSSYSTEM in heifers on this operation, such as circling, head tilting, or blindness?
Percent of Operations Standard ErrorYes 5.0 (±1.0)No 95.0 (±1.0)
Total 100.0b. Were specific diseases, agents, or causes identified?
Yes 47.5 (±9.7)No 52.5 (±9.7)
Total 100.0c. During the past 2 years, did you have any adult cows die or get culled because of thefollowing signs?
Sign Percent of Operations Standard ErrorAggressiveness: 4.0 (±0.7)Belligerence (eagerness to fight): 0.8 (±0.3)Increased vocalization: 0.4 (±0.3)Unexplained lack of coordination: 3.4 (±0.6)Other sudden change in behavior: 1.4 (±0.5)
d. How many operations had affected cows?
Percent of Operations Standard ErrorYes 8.2 (±1.0)
D. Disease Agents (continued)
Dairy Heifer Health Report National Dairy Heifer Evaluation Project
26 USDA:APHIS:VS
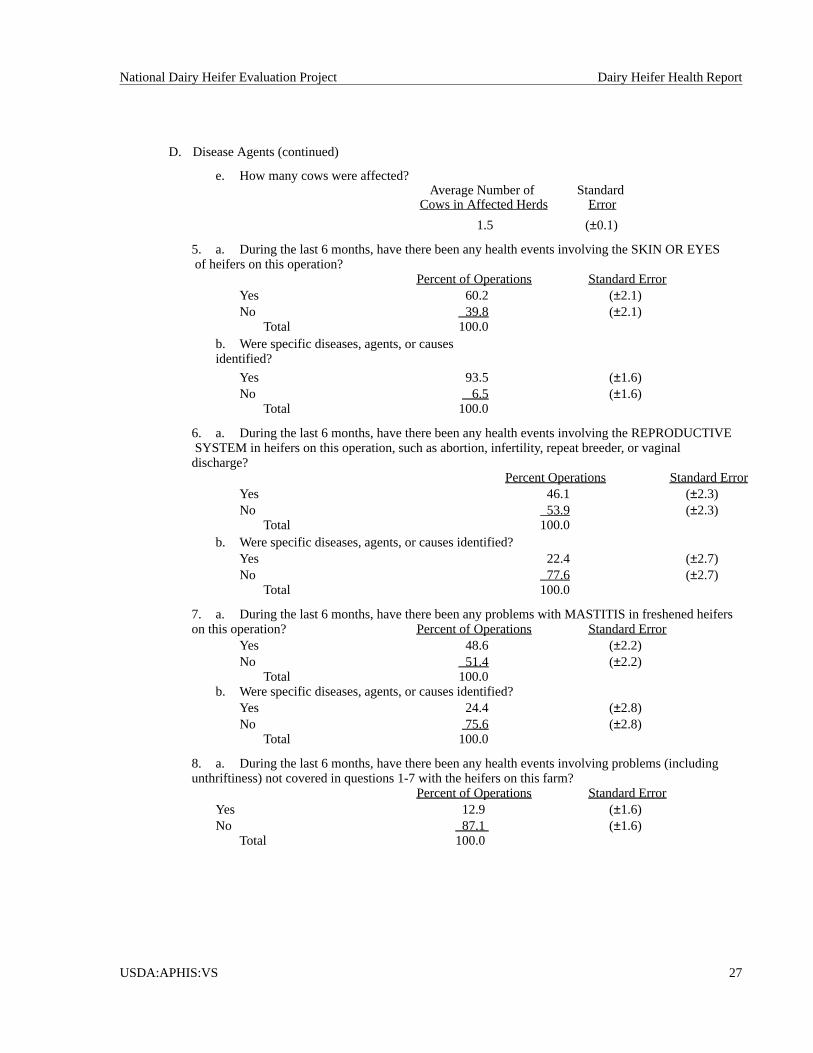
e. How many cows were affected?Average Number of Standard
Cows in Affected Herds Error
1.5 (±0.1)
5. a. During the last 6 months, have there been any health events involving the SKIN OR EYESof heifers on this operation?
Percent of Operations Standard ErrorYes 60.2 (±2.1)No 39.8 (±2.1)
Total 100.0b. Were specific diseases, agents, or causesidentified?
Yes 93.5 (±1.6)No 6.5 (±1.6)
Total 100.0
6. a. During the last 6 months, have there been any health events involving the REPRODUCTIVESYSTEM in heifers on this operation, such as abortion, infertility, repeat breeder, or vaginaldischarge?
Percent Operations Standard ErrorYes 46.1 (±2.3)No 53.9 (±2.3)
Total 100.0b. Were specific diseases, agents, or causes identified?
Yes 22.4 (±2.7)No 77.6 (±2.7)
Total 100.0
7. a. During the last 6 months, have there been any problems with MASTITIS in freshened heiferson this operation? Percent of Operations Standard Error
Yes 48.6 (±2.2)No 51.4 (±2.2)
Total 100.0b. Were specific diseases, agents, or causes identified?
Yes 24.4 (±2.8)No 75.6 (±2.8)
Total 100.0
8. a. During the last 6 months, have there been any health events involving problems (includingunthriftiness) not covered in questions 1-7 with the heifers on this farm?
Percent of Operations Standard ErrorYes 12.9 (±1.6)No 87.1 (±1.6)
Total 100.0
D. Disease Agents (continued)
National Dairy Heifer Evaluation Project Dairy Heifer Health Report
USDA:APHIS:VS 27
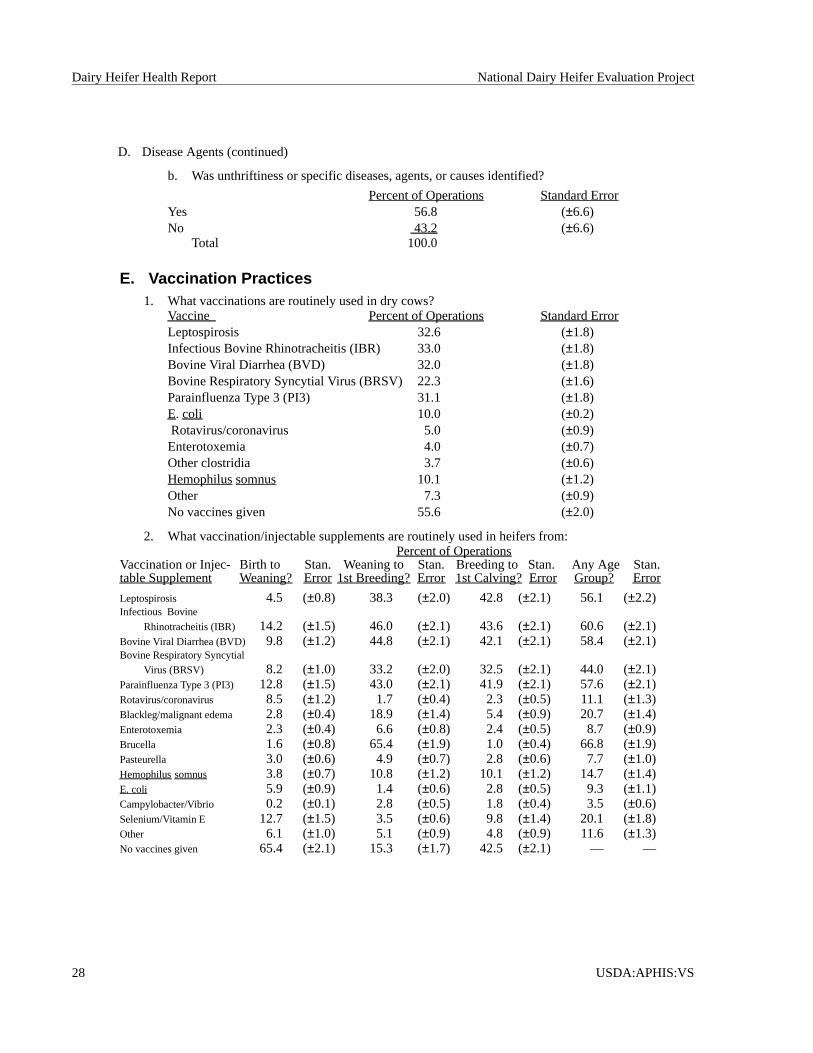
b. Was unthriftiness or specific diseases, agents, or causes identified?
Percent of Operations Standard ErrorYes 56.8 (±6.6)No 43.2 (±6.6)
Total 100.0
E. Vaccination Practices1. What vaccinations are routinely used in dry cows?
Vaccine Percent of Operations Standard ErrorLeptospirosis 32.6 (±1.8)Infectious Bovine Rhinotracheitis (IBR) 33.0 (±1.8)Bovine Viral Diarrhea (BVD) 32.0 (±1.8)Bovine Respiratory Syncytial Virus (BRSV) 22.3 (±1.6)Parainfluenza Type 3 (PI3) 31.1 (±1.8)E. coli 10.0 (±0.2)Rotavirus/coronavirus 5.0 (±0.9)Enterotoxemia 4.0 (±0.7)Other clostridia 3.7 (±0.6)Hemophilussomnus 10.1 (±1.2)Other 7.3 (±0.9)No vaccines given 55.6 (±2.0)
2. What vaccination/injectable supplements are routinely used in heifers from:Percent of Operations
Vaccination or Injec- Birth to Stan. Weaning to Stan. Breeding to Stan. Any Age Stan.table Supplement Weaning? Error 1st Breeding?Error 1st Calving?Error Group? Error
Leptospirosis 4.5 (±0.8) 38.3 (±2.0) 42.8 (±2.1) 56.1 (±2.2)Infectious Bovine
Rhinotracheitis (IBR) 14.2 (±1.5) 46.0 (±2.1) 43.6 (±2.1) 60.6 (±2.1)Bovine Viral Diarrhea (BVD) 9.8 (±1.2) 44.8 (±2.1) 42.1 (±2.1) 58.4 (±2.1)Bovine Respiratory Syncytial
Virus (BRSV) 8.2 (±1.0) 33.2 (±2.0) 32.5 (±2.1) 44.0 (±2.1)Parainfluenza Type 3 (PI3) 12.8 (±1.5) 43.0 (±2.1) 41.9 (±2.1) 57.6 (±2.1)Rotavirus/coronavirus 8.5 (±1.2) 1.7 (±0.4) 2.3 (±0.5) 11.1 (±1.3)Blackleg/malignant edema 2.8 (±0.4) 18.9 (±1.4) 5.4 (±0.9) 20.7 (±1.4)Enterotoxemia 2.3 (±0.4) 6.6 (±0.8) 2.4 (±0.5) 8.7 (±0.9)Brucella 1.6 (±0.8) 65.4 (±1.9) 1.0 (±0.4) 66.8 (±1.9)Pasteurella 3.0 (±0.6) 4.9 (±0.7) 2.8 (±0.6) 7.7 (±1.0)Hemophilussomnus 3.8 (±0.7) 10.8 (±1.2) 10.1 (±1.2) 14.7 (±1.4)E. coli 5.9 (±0.9) 1.4 (±0.6) 2.8 (±0.5) 9.3 (±1.1)Campylobacter/Vibrio 0.2 (±0.1) 2.8 (±0.5) 1.8 (±0.4) 3.5 (±0.6)Selenium/Vitamin E 12.7 (±1.5) 3.5 (±0.6) 9.8 (±1.4) 20.1 (±1.8)Other 6.1 (±1.0) 5.1 (±0.9) 4.8 (±0.9) 11.6 (±1.3)No vaccines given 65.4 (±2.1) 15.3 (±1.7) 42.5 (±2.1) — —
D. Disease Agents (continued)
Dairy Heifer Health Report National Dairy Heifer Evaluation Project
28 USDA:APHIS:VS
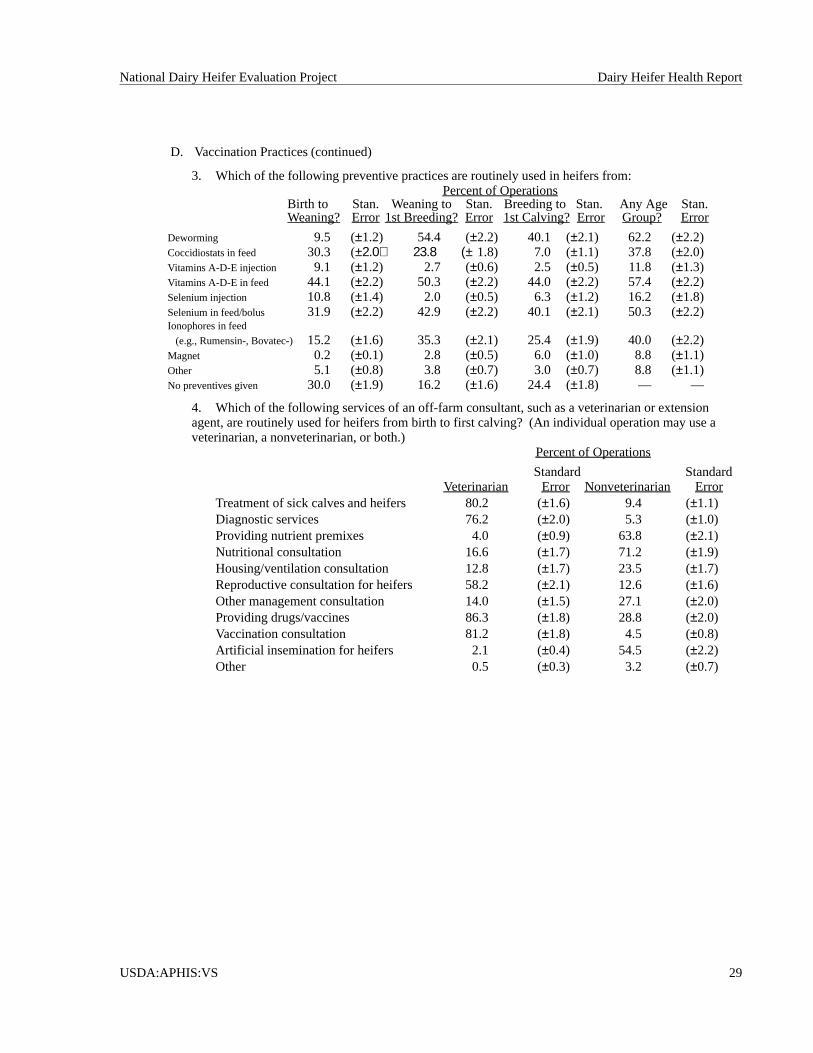
3. Which of the following preventive practices are routinely used in heifers from:Percent of Operations
Birth to Stan. Weaning to Stan. Breeding to Stan. Any Age Stan.Weaning? Error 1st Breeding?Error 1st Calving?Error Group? Error
Deworming 9.5 (±1.2) 54.4 (±2.2) 40.1 (±2.1) 62.2 (±2.2)Coccidiostats in feed 30.3 (±2.0) 23.8 (±1.8) 7.0 (±1.1) 37.8 (±2.0)Vitamins A-D-E injection 9.1 (±1.2) 2.7 (±0.6) 2.5 (±0.5) 11.8 (±1.3)Vitamins A-D-E in feed 44.1 (±2.2) 50.3 (±2.2) 44.0 (±2.2) 57.4 (±2.2)Selenium injection 10.8 (±1.4) 2.0 (±0.5) 6.3 (±1.2) 16.2 (±1.8)Selenium in feed/bolus 31.9 (±2.2) 42.9 (±2.2) 40.1 (±2.1) 50.3 (±2.2)Ionophores in feed
(e.g., Rumensin-, Bovatec-) 15.2 (±1.6) 35.3 (±2.1) 25.4 (±1.9) 40.0 (±2.2)Magnet 0.2 (±0.1) 2.8 (±0.5) 6.0 (±1.0) 8.8 (±1.1)Other 5.1 (±0.8) 3.8 (±0.7) 3.0 (±0.7) 8.8 (±1.1)No preventives given 30.0 (±1.9) 16.2 (±1.6) 24.4 (±1.8) — —
4. Which of the following services of an off-farm consultant, such as a veterinarian or extensionagent, are routinely used for heifers from birth to first calving? (An individual operation may use aveterinarian, a nonveterinarian, or both.)
Percent of Operations
Standard StandardVeterinarian Error Nonveterinarian Error
Treatment of sick calves and heifers 80.2 (±1.6) 9.4 (±1.1)Diagnostic services 76.2 (±2.0) 5.3 (±1.0)Providing nutrient premixes 4.0 (±0.9) 63.8 (±2.1)Nutritional consultation 16.6 (±1.7) 71.2 (±1.9)Housing/ventilation consultation 12.8 (±1.7) 23.5 (±1.7)Reproductive consultation for heifers 58.2 (±2.1) 12.6 (±1.6)Other management consultation 14.0 (±1.5) 27.1 (±2.0)Providing drugs/vaccines 86.3 (±1.8) 28.8 (±2.0)Vaccination consultation 81.2 (±1.8) 4.5 (±0.8)Artificial insemination for heifers 2.1 (±0.4) 54.5 (±2.2)Other 0.5 (±0.3) 3.2 (±0.7)
D. Vaccination Practices (continued)
National Dairy Heifer Evaluation Project Dairy Heifer Health Report
USDA:APHIS:VS 29
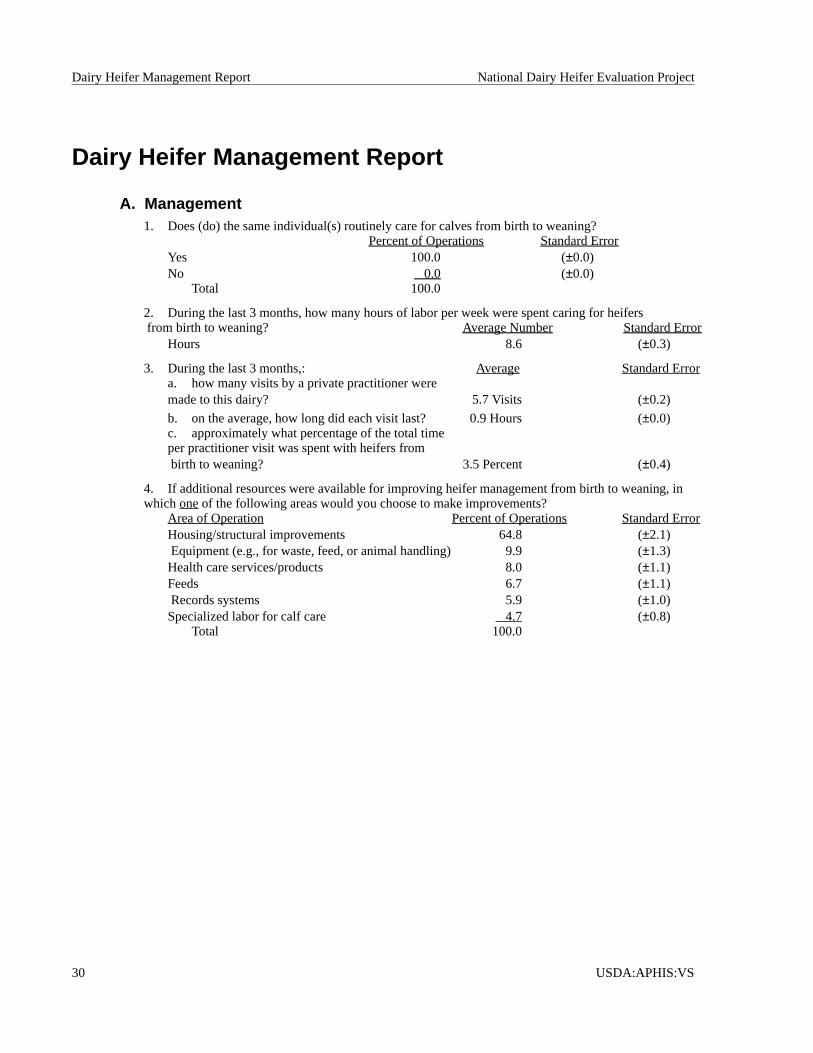
Dairy Heifer Management Report
A. Management1. Does (do) the same individual(s) routinely care for calves from birth to weaning?
Percent of Operations Standard ErrorYes 100.0 (±0.0)No 0.0 (±0.0)
Total 100.0
2. During the last 3 months, how many hours of labor per week were spent caring for heifersfrom birth to weaning? Average Number Standard Error
Hours 8.6 (±0.3)
3. During the last 3 months,: Average Standard Errora. how many visits by a private practitioner weremade to this dairy? 5.7 Visits (±0.2)
b. on the average, how long did each visit last? 0.9 Hours (±0.0)c. approximately what percentage of the total timeper practitioner visit was spent with heifers frombirth to weaning? 3.5 Percent (±0.4)
4. If additional resources were available for improving heifer management from birth to weaning, inwhichone of the following areas would you choose to make improvements?
Area of Operation Percent of Operations Standard ErrorHousing/structural improvements 64.8 (±2.1)Equipment (e.g., for waste, feed, or animal handling) 9.9 (±1.3)Health care services/products 8.0 (±1.1)Feeds 6.7 (±1.1)Records systems 5.9 (±1.0)Specialized labor for calf care 4.7 (±0.8)
Total 100.0
Dairy Heifer Management Report National Dairy Heifer Evaluation Project
30 USDA:APHIS:VS
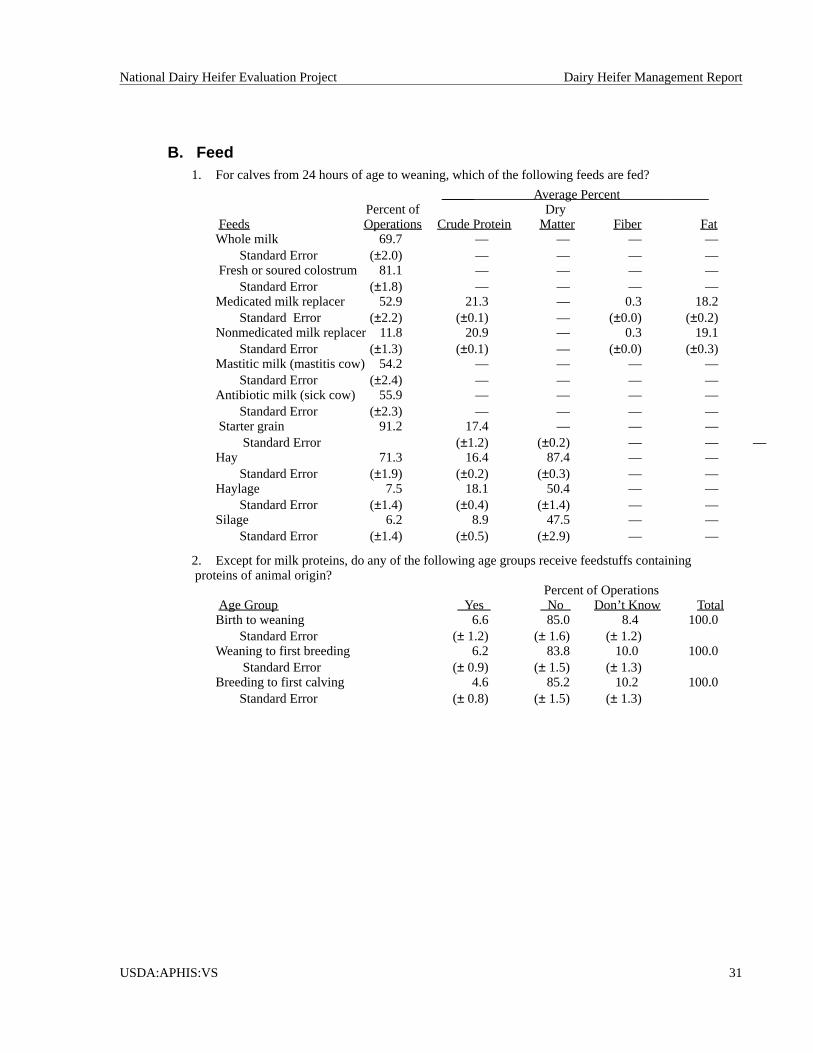
B. Feed1. For calves from 24 hours of age to weaning, which of the following feeds are fed?
Average PercentPercent of Dry
Feeds Operations Crude Protein Matter Fiber FatWhole milk 69.7 — — — —
Standard Error (±2.0) — — — —Fresh or soured colostrum 81.1 — — — —
Standard Error (±1.8) — — — —Medicated milk replacer 52.9 21.3 — 0.3 18.2
Standard Error (±2.2) (±0.1) — (±0.0) (±0.2)Nonmedicated milk replacer 11.8 20.9 — 0.3 19.1
Standard Error (±1.3) (±0.1) — (±0.0) (±0.3)Mastitic milk (mastitis cow) 54.2 — — — —
Standard Error (±2.4) — — — —Antibiotic milk (sick cow) 55.9 — — — —
Standard Error (±2.3) — — — —Starter grain 91.2 17.4 — — —
Standard Error (±1.2) (±0.2) — — —Hay 71.3 16.4 87.4 — —
Standard Error (±1.9) (±0.2) (±0.3) — —Haylage 7.5 18.1 50.4 — —
Standard Error (±1.4) (±0.4) (±1.4) — —Silage 6.2 8.9 47.5 — —
Standard Error (±1.4) (±0.5) (±2.9) — —
2. Except for milk proteins, do any of the following age groups receive feedstuffs containingproteins of animal origin?
Percent of OperationsAge Group Yes No Don’t Know TotalBirth to weaning 6.6 85.0 8.4 100.0
Standard Error (± 1.2) (± 1.6) (± 1.2)Weaning to first breeding 6.2 83.8 10.0 100.0
Standard Error (± 0.9) (± 1.5) (± 1.3)Breeding to first calving 4.6 85.2 10.2 100.0
Standard Error (± 0.8) (± 1.5) (± 1.3)
National Dairy Heifer Evaluation Project Dairy Heifer Management Report
USDA:APHIS:VS 31
Milk Replacer Quality and Management
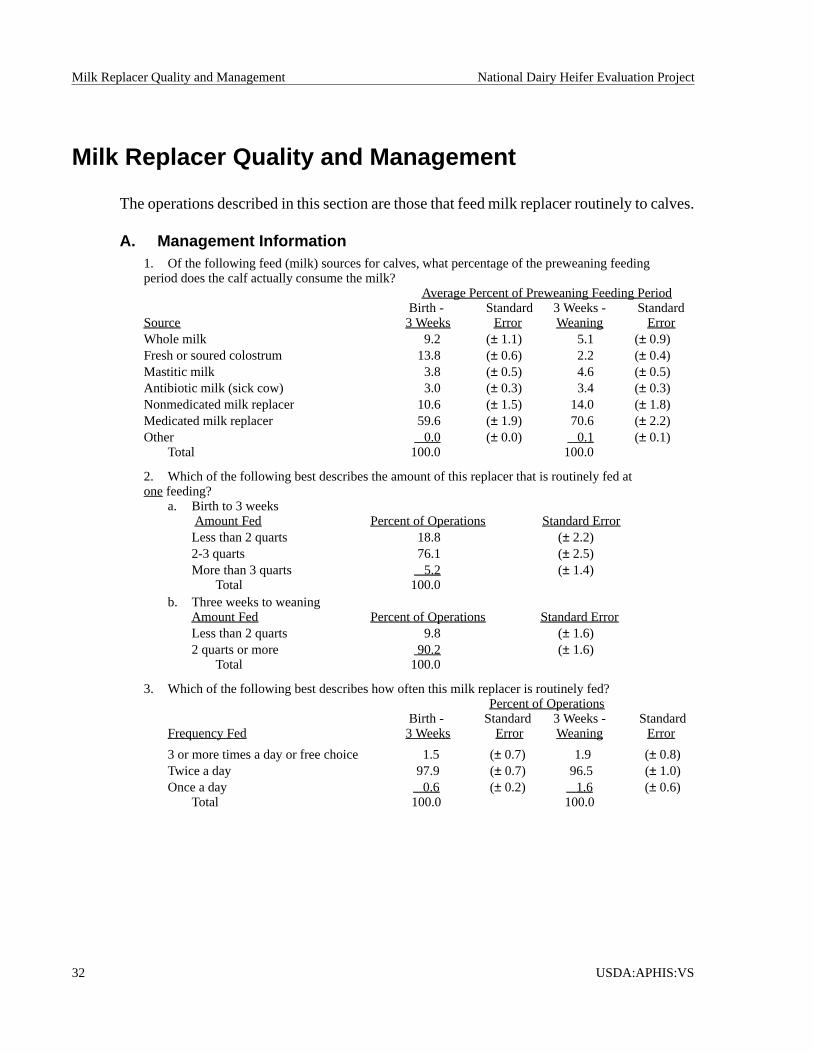
The operations described in this section are those that feed milk replacer routinely to calves.
A. Management Information1. Of the following feed (milk) sources for calves, what percentage of the preweaning feedingperiod does the calf actually consume the milk?
Average Percent of Preweaning Feeding PeriodBirth - Standard 3 Weeks - Standard
Source 3 Weeks Error Weaning ErrorWhole milk 9.2 (± 1.1) 5.1 (± 0.9)Fresh or soured colostrum 13.8 (± 0.6) 2.2 (± 0.4)Mastitic milk 3.8 (± 0.5) 4.6 (± 0.5)Antibiotic milk (sick cow) 3.0 (± 0.3) 3.4 (± 0.3)Nonmedicated milk replacer 10.6 (± 1.5) 14.0 (± 1.8)Medicated milk replacer 59.6 (± 1.9) 70.6 (± 2.2)Other 0.0 (± 0.0) 0.1 (± 0.1)
Total 100.0 100.0
2. Which of the following best describes the amount of this replacer that is routinely fed atone feeding?
a. Birth to 3 weeksAmount Fed Percent of Operations Standard ErrorLess than 2 quarts 18.8 (± 2.2)2-3 quarts 76.1 (± 2.5)More than 3 quarts 5.2 (± 1.4)
Total 100.0b. Three weeks to weaning
Amount Fed Percent of Operations Standard ErrorLess than 2 quarts 9.8 (± 1.6)2 quarts or more 90.2 (± 1.6)
Total 100.0
3. Which of the following best describes how often this milk replacer is routinely fed?Percent of Operations
Birth - Standard 3 Weeks - StandardFrequency Fed 3 Weeks Error Weaning Error
3 or more times a day or free choice 1.5 (± 0.7) 1.9 (± 0.8)Twice a day 97.9 (± 0.7) 96.5 (± 1.0)Once a day 0.6 (± 0.2) 1.6 (± 0.6)
Total 100.0 100.0
Milk Replacer Quality and Management National Dairy Heifer Evaluation Project
32 USDA:APHIS:VS
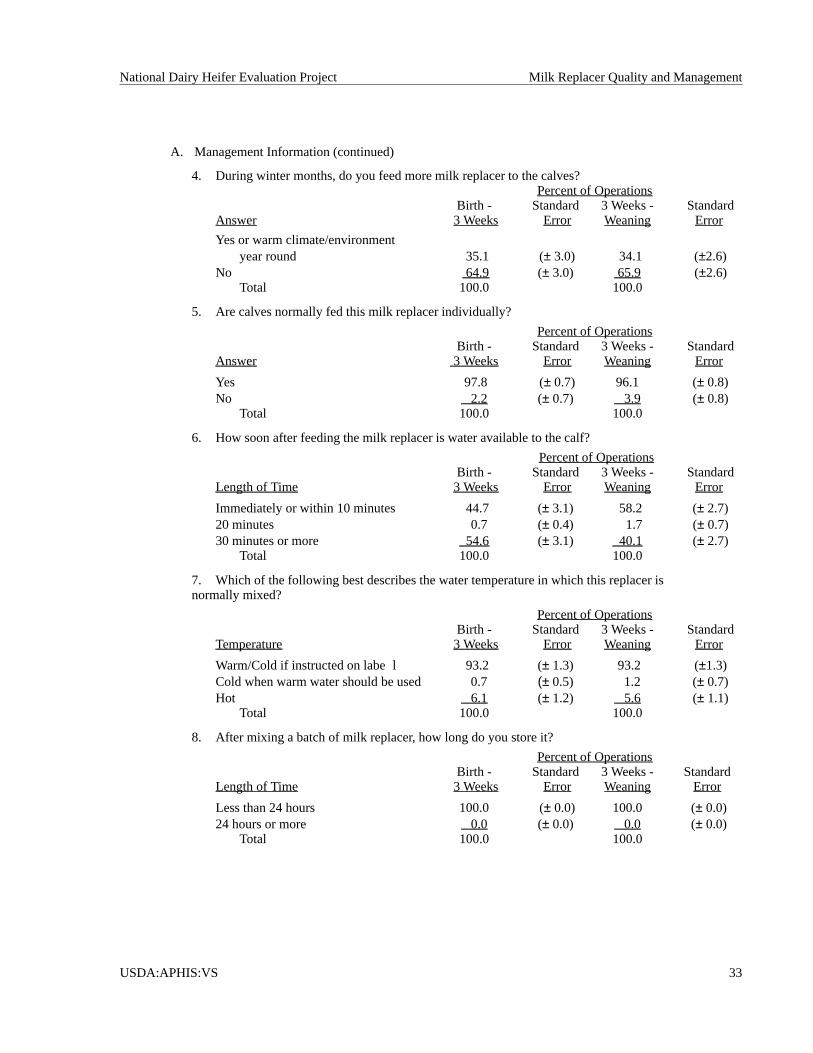
4. During winter months, do you feed more milk replacer to the calves?Percent of Operations
Birth - Standard 3 Weeks - StandardAnswer 3 Weeks Error Weaning Error
Yes or warm climate/environmentyear round 35.1 (± 3.0) 34.1 (±2.6)
No 64.9 (± 3.0) 65.9 (±2.6)Total 100.0 100.0
5. Are calves normally fed this milk replacer individually?
Percent of OperationsBirth - Standard 3 Weeks - Standard
Answer 3 Weeks Error Weaning Error
Yes 97.8 (± 0.7) 96.1 (± 0.8)No 2.2 (± 0.7) 3.9 (± 0.8)
Total 100.0 100.0
6. How soon after feeding the milk replacer is water available to the calf?
Percent of OperationsBirth - Standard 3 Weeks - Standard
Length of Time 3 Weeks Error Weaning Error
Immediately or within 10 minutes 44.7 (± 3.1) 58.2 (± 2.7)20 minutes 0.7 (± 0.4) 1.7 (± 0.7)30 minutes or more 54.6 (± 3.1) 40.1 (± 2.7)
Total 100.0 100.0
7. Which of the following best describes the water temperature in which this replacer isnormally mixed?
Percent of OperationsBirth - Standard 3 Weeks - Standard
Temperature 3 Weeks Error Weaning Error
Warm/Cold if instructed on labe l 93.2 (± 1.3) 93.2 (±1.3)Cold when warm water should be used 0.7 (± 0.5) 1.2 (± 0.7)Hot 6.1 (± 1.2) 5.6 (± 1.1)
Total 100.0 100.0
8. After mixing a batch of milk replacer, how long do you store it?
Percent of OperationsBirth - Standard 3 Weeks - Standard
Length of Time 3 Weeks Error Weaning Error
Less than 24 hours 100.0 (± 0.0) 100.0 (± 0.0)24 hours or more 0.0 (± 0.0) 0.0 (± 0.0)
Total 100.0 100.0
A. Management Information (continued)
National Dairy Heifer Evaluation Project Milk Replacer Quality and Management
USDA:APHIS:VS 33
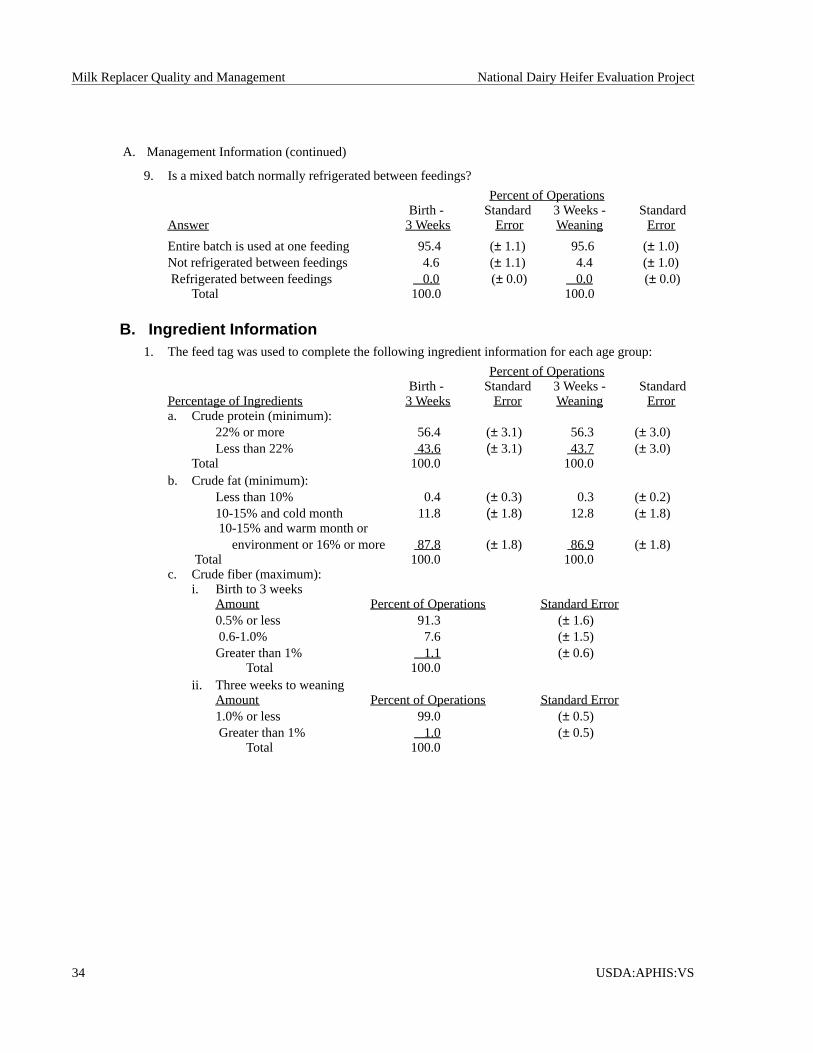
9. Is a mixed batch normally refrigerated between feedings?
Percent of OperationsBirth - Standard 3 Weeks - Standard
Answer 3 Weeks Error Weaning Error
Entire batch is used at one feeding 95.4 (± 1.1) 95.6 (± 1.0)Not refrigerated between feedings 4.6 (± 1.1) 4.4 (± 1.0)Refrigerated between feedings 0.0 (± 0.0) 0.0 (± 0.0)
Total 100.0 100.0
B. Ingredient Information1. The feed tag was used to complete the following ingredient information for each age group:
Percent of OperationsBirth - Standard 3 Weeks - Standard
Percentage of Ingredients 3 Weeks Error Weaning Errora. Crude protein (minimum):
22% or more 56.4 (± 3.1) 56.3 (± 3.0)Less than 22% 43.6 (± 3.1) 43.7 (± 3.0)
Total 100.0 100.0b. Crude fat (minimum):
Less than 10% 0.4 (± 0.3) 0.3 (± 0.2)10-15% and cold month 11.8 (± 1.8) 12.8 (± 1.8)10-15% and warm month or
environment or 16% or more 87.8 (± 1.8) 86.9 (± 1.8)Total 100.0 100.0
c. Crude fiber (maximum):i. Birth to 3 weeks
Amount Percent of Operations Standard Error0.5% or less 91.3 (± 1.6)0.6-1.0% 7.6 (± 1.5)Greater than 1% 1.1 (± 0.6)
Total 100.0ii. Three weeks to weaning
Amount Percent of Operations Standard Error1.0% or less 99.0 (± 0.5)Greater than 1% 1.0 (± 0.5)
Total 100.0
A. Management Information (continued)
Milk Replacer Quality and Management National Dairy Heifer Evaluation Project
34 USDA:APHIS:VS
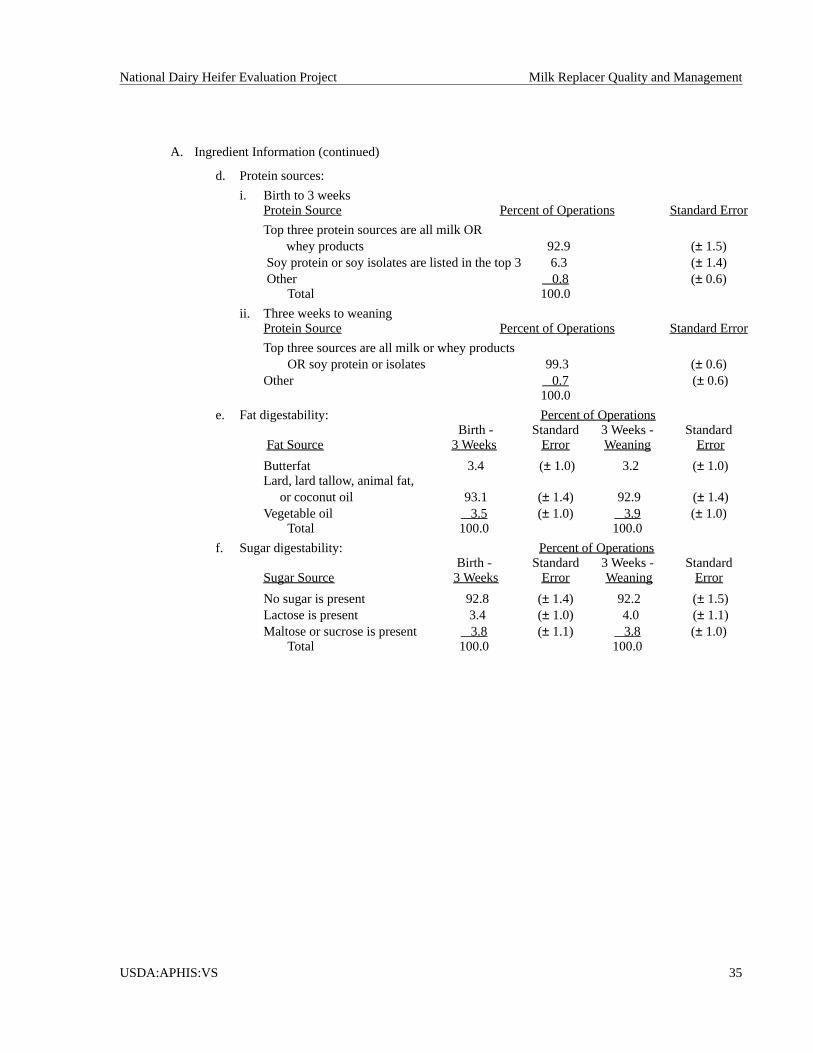
d. Protein sources:
i. Birth to 3 weeksProtein Source Percent of Operations Standard Error
Top three protein sources are all milk ORwhey products 92.9 (± 1.5)
Soy protein or soy isolates are listed in the top 3 6.3 (± 1.4)Other 0.8 (± 0.6)
Total 100.0
ii. Three weeks to weaningProtein Source Percent of Operations Standard Error
Top three sources are all milk or whey productsOR soy protein or isolates 99.3 (± 0.6)
Other 0.7 (± 0.6)100.0
e. Fat digestability: Percent of OperationsBirth - Standard 3 Weeks - Standard
Fat Source 3 Weeks Error Weaning Error
Butterfat 3.4 (± 1.0) 3.2 (± 1.0)Lard, lard tallow, animal fat,
or coconut oil 93.1 (± 1.4) 92.9 (± 1.4)Vegetable oil 3.5 (± 1.0) 3.9 (± 1.0)
Total 100.0 100.0
f. Sugar digestability: Percent of OperationsBirth - Standard 3 Weeks - Standard
Sugar Source 3 Weeks Error Weaning Error
No sugar is present 92.8 (± 1.4) 92.2 (± 1.5)Lactose is present 3.4 (± 1.0) 4.0 (± 1.1)Maltose or sucrose is present 3.8 (± 1.1) 3.8 (± 1.0)
Total 100.0 100.0
A. Ingredient Information (continued)
National Dairy Heifer Evaluation Project Milk Replacer Quality and Management
USDA:APHIS:VS 35
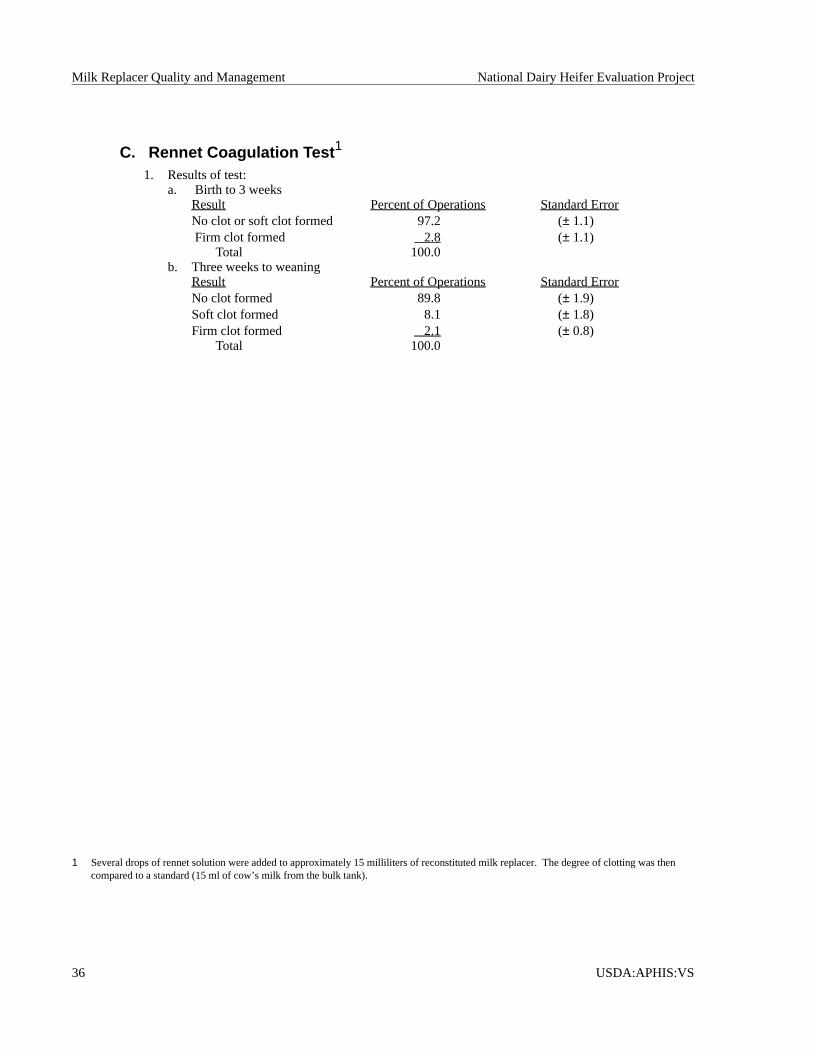
C. Rennet Coagulation Test 1
1. Results of test:a. Birth to 3 weeks
Result Percent of Operations Standard ErrorNo clot or soft clot formed 97.2 (± 1.1)Firm clot formed 2.8 (± 1.1)
Total 100.0b. Three weeks to weaning
Result Percent of Operations Standard ErrorNo clot formed 89.8 (± 1.9)Soft clot formed 8.1 (± 1.8)Firm clot formed 2.1 (± 0.8)
Total 100.0
Milk Replacer Quality and Management National Dairy Heifer Evaluation Project
36 USDA:APHIS:VS
1 Several drops of rennet solution were added to approximately 15 milliliters of reconstituted milk replacer. The degree of clotting was thencompared to a standard (15 ml of cow’s milk from the bulk tank).
National Animal Health Monitoring SystemUSDA:APHIS:VS
2150 Centre Ave., Bldg. B, MS 2E7Fort Collins, Colorado 80526-8117
(970) 494-7000
N129.0793