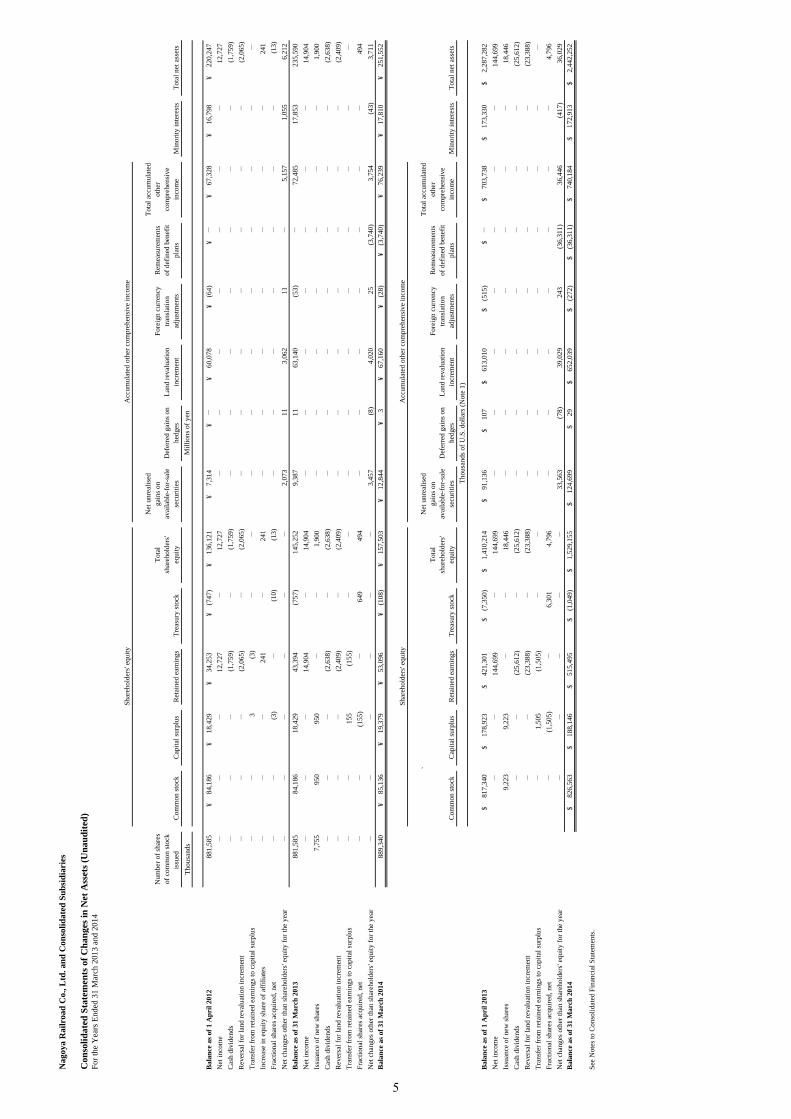
Nagoya Railroad Co., Ltd. and Consolidated Subsidiaries ... · For the Years Ended 31 March 2013...
11
Nagoya Railroad Co., Ltd. and Consolidated Subsidiaries Consolidated Balance Sheets (Unaudited) 31 March 2013 and 2014 Thousands of U.S. dollars Millions of yen (Note 1) 2013 2014 2014 ASSETS Current assets: Cash and cash equivalents ¥ 9,711 ¥ 13,405 $ 130,146 Short-term investments 712 993 9,641 Trade notes and accounts receivable 59,922 56,724 550,718 Inventories 67,890 62,459 606,398 Deferred tax assets 5,805 6,142 59,631 Others 19,897 20,337 197,447 Less, allowance for doubtful accounts (263) (317) (3,078) Total current assets 163,674 159,743 1,550,903 Property and equipment: Land 367,197 364,383 3,537,699 Buildings and structures 672,493 674,406 6,547,631 Machinery, equipment and vehicles 300,236 302,663 2,938,476 Other properties 60,337 61,126 593,456 Construction in progress 50,327 16,520 160,388 1,450,590 1,419,098 13,777,650 Less accumulated depreciation (629,596) (641,744) (6,230,524) Property and equipment, net 820,994 777,354 7,547,126 Investments and other assets: Investment securities 53,195 57,503 558,282 Investments in unconsolidated subsidiaries and affiliates 25,676 25,632 248,854 Deferred tax assets 12,807 10,905 105,874 Intangible assets 11,902 9,217 89,485 Other assets 16,575 16,182 157,107 Allowance for doubtful accounts (1,848) (1,857) (18,029) Total investments and other assets 118,307 117,582 1,141,573 Total assets ¥ 1,102,975 ¥ 1,054,679 $ 10,239,602 See Notes to Consolidated Financial Statements. 1
Transcript of Nagoya Railroad Co., Ltd. and Consolidated Subsidiaries ... · For the Years Ended 31 March 2013...

Nagoya Railroad Co., Ltd. and Consolidated Subsidiaries
Consolidated Balance Sheets (Unaudited)31 March 2013 and 2014
Thousands of U.S. dollars
Millions of yen (Note 1)2013 2014 2014
ASSETSCurrent assets: Cash and cash equivalents ¥ 9,711 ¥ 13,405 $ 130,146 Short-term investments 712 993 9,641 Trade notes and accounts receivable 59,922 56,724 550,718 Inventories 67,890 62,459 606,398 Deferred tax assets 5,805 6,142 59,631 Others 19,897 20,337 197,447 Less, allowance for doubtful accounts (263) (317) (3,078) Total current assets 163,674 159,743 1,550,903
Property and equipment: Land 367,197 364,383 3,537,699 Buildings and structures 672,493 674,406 6,547,631 Machinery, equipment and vehicles 300,236 302,663 2,938,476 Other properties 60,337 61,126 593,456 Construction in progress 50,327 16,520 160,388
1,450,590 1,419,098 13,777,650 Less accumulated depreciation (629,596) (641,744) (6,230,524) Property and equipment, net 820,994 777,354 7,547,126
Investments and other assets: Investment securities 53,195 57,503 558,282 Investments in unconsolidated subsidiaries and affiliates 25,676 25,632 248,854 Deferred tax assets 12,807 10,905 105,874 Intangible assets 11,902 9,217 89,485 Other assets 16,575 16,182 157,107 Allowance for doubtful accounts (1,848) (1,857) (18,029) Total investments and other assets 118,307 117,582 1,141,573
Total assets ¥ 1,102,975 ¥ 1,054,679 $ 10,239,602
See Notes to Consolidated Financial Statements.
1
Nagoya Railroad Co., Ltd. and Consolidated Subsidiaries
Consolidated Balance Sheets (Unaudited)31 March 2013 and 2014
Thousands of U.S. dollars
Millions of yen (Note 1)2013 2014 2014
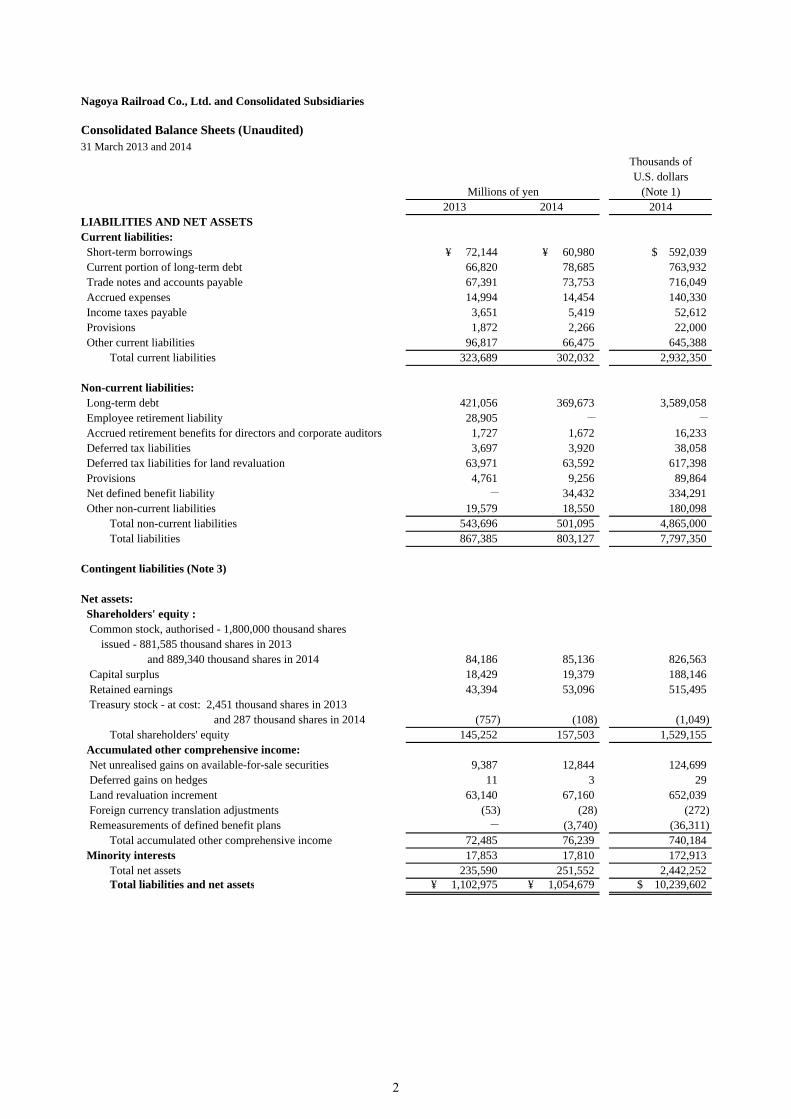
LIABILITIES AND NET ASSETSCurrent liabilities: Short-term borrowings ¥ 72,144 ¥ 60,980 $ 592,039 Current portion of long-term debt 66,820 78,685 763,932 Trade notes and accounts payable 67,391 73,753 716,049 Accrued expenses 14,994 14,454 140,330 Income taxes payable 3,651 5,419 52,612 Provisions 1,872 2,266 22,000 Other current liabilities 96,817 66,475 645,388 Total current liabilities 323,689 302,032 2,932,350
Non-current liabilities: Long-term debt 421,056 369,673 3,589,058 Employee retirement liability 28,905 - -
Accrued retirement benefits for directors and corporate auditors 1,727 1,672 16,233 Deferred tax liabilities 3,697 3,920 38,058 Deferred tax liabilities for land revaluation 63,971 63,592 617,398 Provisions 4,761 9,256 89,864 Net defined benefit liability - 34,432 334,291 Other non-current liabilities 19,579 18,550 180,098 Total non-current liabilities 543,696 501,095 4,865,000 Total liabilities 867,385 803,127 7,797,350
Contingent liabilities (Note 3)
Net assets: Shareholders' equity : Common stock, authorised - 1,800,000 thousand shares issued - 881,585 thousand shares in 2013 and 889,340 thousand shares in 2014 84,186 85,136 826,563 Capital surplus 18,429 19,379 188,146 Retained earnings 43,394 53,096 515,495 Treasury stock - at cost: 2,451 thousand shares in 2013 and 287 thousand shares in 2014 (757) (108) (1,049) Total shareholders' equity 145,252 157,503 1,529,155 Accumulated other comprehensive income: Net unrealised gains on available-for-sale securities 9,387 12,844 124,699 Deferred gains on hedges 11 3 29 Land revaluation increment 63,140 67,160 652,039 Foreign currency translation adjustments (53) (28) (272) Remeasurements of defined benefit plans - (3,740) (36,311) Total accumulated other comprehensive income 72,485 76,239 740,184 Minority interests 17,853 17,810 172,913 Total net assets 235,590 251,552 2,442,252 Total liabilities and net assets ¥ 1,102,975 ¥ 1,054,679 $ 10,239,602
2

Nagoya Railroad Co., Ltd. and Consolidated Subsidiaries
Consolidated Statements of Income (Unaudited)For the Years Ended 31 March 2013 and 2014
Thousands of U.S. dollars
Millions of yen (Note 1)2013 2014
Operating revenues (Note 4) ¥ 609,836 ¥ 627,797 $ 6,095,117
Operating expenses Transportation, other services and cost of sales 528,271 541,241 5,254,767 Selling, general and administrative expenses 49,237 49,478 480,369 Total operating expenses 577,508 590,719 5,735,136
Operating income 32,328 37,078 359,981
Other income (expenses): Interest and dividends income 1,139 1,283 12,456 Interest expenses (7,714) (6,824) (66,252) Equity in net earnings of affiliates 369 1,112 10,796 Impairment loss on fixed assets (6,249) (3,142) (30,505) Loss on sale or disposition of property and equipment (473) (1,347) (13,078) Gain on contributions for construction 4,479 38,635 375,097 Loss on reduction of property and equipment (4,171) (36,605) (355,388) Provision for loss on liquidation (1,985) (4,893) (47,505) Others, net 2,338 620 6,019 Other expenses, net (12,267) (11,161) (108,360) Income before income taxes and minority interests 20,061 25,917 251,621
Income taxes: Current 5,286 7,343 71,291 Deferred 893 2,539 24,650 Total income taxes 6,179 9,882 95,941
Income before minority interests 13,882 16,035 155,680
Minority interests in net income of consolidated subsidiaries 1,155 1,131 10,981
Net income ¥ 12,727 ¥ 14,904 $ 144,699
Per share: Net income: - Basic ¥ 14.48 ¥ 16.95 $ 0.16 - Diluted 13.88 15.69 0.15 Cash dividends 3.00 4.00 0.04
See Notes to Consolidated Financial Statements.
2014
3

Nagoya Railroad Co., Ltd. and Consolidated Subsidiaries
Consolidated Statements of Comprehensive Income (Unaudited)For the Years Ended 31 March 2013 and 2014
Thousands of U.S. dollars
Millions of yen (Note 1)2013 2014
Income before minority interests ¥ 13,882 ¥ 16,035 $ 155,680
Other comprehensive income: Net unrealised gains or losses on available-for-sale securities 1,900 3,410 33,107 Land revaluation increment 997 1,610 15,631 Foreign currency translation adjustments 11 26 252 Share of other comprehensive income of affiliates accounted for using the equity method 318 137 1,330 Total other comprehensive income 3,226 5,183 50,320
Comprehensive income 17,108 21,218 206,000
Comprehensive income attributable to: Owners of the parent 15,823 19,987 194,049 Minority interests 1,285 1,231 11,951 Total comprehensive income ¥ 17,108 ¥ 21,218 $ 206,000
See Notes to Consolidated Financial Statements.
2014
4
Nag
oya
Rai
lroa
d C
o., L
td. a
nd C
onso
lidat
ed S
ubsi
diar
ies
Con
solid
ated
Sta
tem
ents
of C
hang
es in
Net
Ass
ets (
Una
udite
d)Fo
r the
Yea
rs E
nded
31
Mar
ch 2
013
and
2014
Shar
ehol
ders
' equ
ityA
ccum
ulat
ed o
ther
com
preh
ensi
ve in
com
e
Num
ber o
f sha
res
of c
omm
on st
ock
issu
ed
Com
mon
stoc
kC
apita
l sur
plus
Ret
aine
d ea
rnin
gsTr
easu
ry st
ock
Tota
lsh
areh
olde
rs'
equi
ty
Net
unr
ealis
edga
ins o
nav
aila
ble-
for-
sale
secu
ritie
sD
efer
red
gain
s on
hedg
esLa
nd re
valu
atio
nin
crem
ent
Fore
ign
curr
ency
trans
latio
nad
just
men
ts
Rem
easu
rem
ents
of d
efin
ed b
enef
itpl
ans
Tota
l acc
umul
ated
othe
rco
mpr
ehen
sive
inco
me
Min
ority
inte
rest
sTo
tal n
et a
sset
sTh
ousa
nds
Mill
ions
of y
en
Bal
ance
as o
f 1 A
pril
2012
881,
585
¥
84,
186
¥
18,
429
¥
34,
253
¥
(747
)¥
1
36,1
21
¥
7,3
14
¥ -
¥
6
0,07
8 ¥
(6
4)¥
-
¥
6
7,32
8 ¥
1
6,79
8 ¥
2
20,2
47
Net
inco
me
-
-
-
12,7
27
-
12,7
27
-
-
-
-
-
-
-
12,7
27
Cas
h di
vide
nds
-
-
-
(1,7
59)
-
(1,7
59)
-
-
-
-
-
-
-
(1,7
59)
Rev
ersa
l for
land
reva
luat
ion
incr
emen
t-
-
-
(2
,065
)-
(2
,065
)-
-
-
-
-
-
-
(2
,065
)Tr
ansf
er fr
om re
tain
ed e
arni
ngs t
o ca
pita
l sur
plus
-
-
3 (3
)-
-
-
-
-
-
-
-
-
-
In
crea
se in
equ
ity sh
are
of a
ffili
ates
-
-
-
241
-
241
-
-
-
-
-
-
-
241
Frac
tiona
l sha
res a
cqui
red,
net
-
-
(3)
-
(10)
(13)
-
-
-
-
-
-
-
(13)
Net
cha
nges
oth
er th
an sh
areh
olde
rs' e
quity
for t
he y
ear
-
-
-
-
-
-
2,07
3 11
3,
062
11
-
5,15
7 1,
055
6,21
2 B
alan
ce a
s of 3
1 M
arch
201
388
1,58
5 84
,186
18
,429
43
,394
(7
57)
145,
252
9,38
7 11
63
,140
(5
3)-
72
,485
17
,853
23
5,59
0 N
et in
com
e-
-
-
14
,904
-
14
,904
-
-
-
-
-
-
-
14
,904
Is
suan
ce o
f new
shar
es7,
755
950
950
-
-
1,90
0 -
-
-
-
-
-
-
1,
900
Cas
h di
vide
nds
-
-
-
(2,6
38)
-
(2,6
38)
-
-
-
-
-
-
-
(2,6
38)
Rev
ersa
l for
land
reva
luat
ion
incr
emen
t-
-
-
(2
,409
)-
(2
,409
)-
-
-
-
-
-
-
(2
,409
)Tr
ansf
er fr
om re
tain
ed e
arni
ngs t
o ca
pita
l sur
plus
-
-
155
(155
)-
-
-
-
-
-
-
-
-
-
Fr
actio
nal s
hare
s acq
uire
d, n
et-
-
(1
55)
-
649
494
-
-
-
-
-
-
-
494
Net
cha
nges
oth
er th
an sh
areh
olde
rs' e
quity
for t
he y
ear
-
-
-
-
-
-
3,45
7 (8
)4,
020
25
(3,7
40)
3,75
4 (4
3)3,
711
Bal
ance
as o
f 31
Mar
ch 2
014
889,
340
¥
85,
136
¥
19,
379
¥
53,
096
¥
(108
)¥
1
57,5
03
¥
12,
844
¥
3
¥
67,
160
¥
(28)
¥
(3,7
40)
¥
76,
239
¥
17,
810
¥
251
,552
Shar
ehol
ders
' equ
ityA
ccum
ulat
ed o
ther
com
preh
ensi
ve in
com
e
Com
mon
stoc
kC
apita
l sur
plus
Ret
aine
d ea
rnin
gsTr
easu
ry st
ock
Tota
lsh
areh
olde
rs'
equi
ty
Net
unr
ealis
edga
ins o
nav
aila
ble-
for-
sale
secu
ritie
sD
efer
red
gain
s on
hedg
esLa
nd re
valu
atio
nin
crem
ent
Fore
ign
curr
ency
trans
latio
nad
just
men
ts
Rem
easu
rem
ents
of d
efin
ed b
enef
itpl
ans
Tota
l acc
umul
ated
othe
rco
mpr
ehen
sive
inco
me
Min
ority
inte
rest
sTo
tal n
et a
sset
s
`
Thou
sand
s of U
.S. d
olla
rs (N
ote
1)
Bal
ance
as o
f 1 A
pril
2013
$
817
,340
$
1
78,9
23
$
421
,301
$
(7
,350
)$
1
,410
,214
$
9
1,13
6 $
1
07
$
613
,010
$
(5
15)
$ -
$
7
03,7
38
$
173
,330
$
2
,287
,282
N
et in
com
e-
-
14
4,69
9 -
14
4,69
9 -
-
-
-
-
-
-
14
4,69
9 Is
suan
ce o
f new
shar
es9,
223
9,22
3 -
-
18
,446
-
-
-
-
-
-
-
18
,446
C
ash
divi
dend
s-
-
(2
5,61
2)-
(2
5,61
2)-
-
-
-
-
-
-
(2
5,61
2)R
ever
sal f
or la
nd re
valu
atio
n in
crem
ent
-
-
(23,
388)
-
(23,
388)
-
-
-
-
-
-
-
(23,
388)
Tran
sfer
from
reta
ined
ear
ning
s to
capi
tal s
urpl
us-
1,
505
(1,5
05)
-
-
-
-
-
-
-
-
-
-
Frac
tiona
l sha
res a
cqui
red,
net
-
(1,5
05)
-
6,30
1 4,
796
-
-
-
-
-
-
-
4,79
6 N
et c
hang
es o
ther
than
shar
ehol
ders
' equ
ity fo
r the
yea
r-
-
-
-
-
33
,563
(7
8)39
,029
24
3 (3
6,31
1)36
,446
(4
17)
36,0
29
Bal
ance
as o
f 31
Mar
ch 2
014
$
826
,563
$
1
88,1
46
$
515
,495
$
(1
,049
)$
1
,529
,155
$
1
24,6
99
$
29
$
652
,039
$
(2
72)
$
(36,
311)
$
740
,184
$
1
72,9
13
$
2,4
42,2
52
See
Not
es to
Con
solid
ated
Fin
anci
al S
tate
men
ts.
5

Nagoya Railroad Co., Ltd. and Consolidated Subsidiaries
Consolidated Statements of Cash Flows (Unaudited)For the Years Ended 31 March 2013 and 2014
Thousands ofU.S. dollars
Millions of yen (Note 1)2013 2014
Cash flows from operating activities: Income before income taxes and minority interests ¥ 20,061 ¥ 25,917 $ 251,621 Adjustments for: Depreciation and amortisation 39,448 38,857 377,252 Impairment loss on fixed assets 6,249 3,142 30,505 Gain on sale or disposition of property and equipment 955 2,686 26,078 Gain on contributions for construction (4,479) (38,635) (375,097) Decrease (increase) in trade notes and accounts receivable 2,410 (2,444) (23,728) Decrease in inventories 10,898 5,504 53,437 (Decrease) increase in trade notes and accounts payable (2,763) 9,864 95,767 Others, net 12,631 48,678 472,602 Subtotal 85,410 93,569 908,437 Interest and dividends received 1,358 1,587 15,408 Interest paid (7,855) (6,919) (67,175) Extra retirement benefits paid (172) (43) (417) Income taxes paid (5,436) (5,920) (57,476) Net cash provided by operating activities 73,305 82,274 798,777
Cash flows from investing activities: Purchases of property and equipment (43,004) (44,175) (428,883) Proceeds from sales of property and equipment 4,231 5,519 53,583 Proceeds for contributions for construction 11,467 12,467 121,039 Purchases of investments securities (763) (610) (5,922) Proceeds from sales or redemptions of investment securities 222 1,349 13,097 Payments for acquisition of subsidiaries' stock, net of cash acquired (581) - -
Collections of loans receivable 1,954 828 8,039 Others, net (585) (953) (9,253) Net cash used in investing activities (27,059) (25,575) (248,300)
Cash flows from financing activities: Increase in long-term debt 95,046 29,375 285,194 Repayment of long-term debt (87,093) (93,665) (909,369) Proceeds from issuance of bonds - 24,905 241,796 Net decrease in short-term borrowings (51,568) (10,716) (104,039) Dividends paid to shareholders (1,757) (2,627) (25,505) Dividends paid to minority shareholders (185) (258) (2,505) Others, net (18) (44) (427) Net cash used in financing activities (45,575) (53,030) (514,855) Effect of exchange rate changes on cash and cash equivalents 9 20 194 Net increase in cash and cash equivalents 680 3,689 35,816 Cash and cash equivalents at beginning of year 9,031 9,711 94,282 Increase in cash and cash equivalents from newly consolidated subsidiary - 5 48 Cash and cash equivalents at end of year ¥ 9,711 ¥ 13,405 $ 130,146
See Notes to Consolidated Financial Statements.
2014
6

Nagoya Railroad Co., Ltd. and Consolidated Subsidiaries Notes to Consolidated Financial Statements (Unaudited) For the Years Ended 31 March 2013 and 2014 1. Basis of consolidated financial statements
The accompanying consolidated financial statements of Nagoya Railroad Co., Ltd. (the “Company”) and its consolidated subsidiaries (together with the Company, the “Group”) have been prepared in accordance with the provisions set forth in the Japanese Financial Instruments and Exchange Act and its related accounting regulations, and in accordance with accounting principles generally accepted in Japan (“Japanese GAAP”), which are different in certain respects as to the application and disclosure requirements of the International Financial Reporting Standards.
The accompanying consolidated financial statements have been restructured and translated into English from the consolidated financial statements of the Company prepared in accordance with the accounting standard for financial reporting under Japanese GAAP and filed with the appropriate Local Finance Bureau of the Ministry of Finance as required by the Japanese Financial Instruments and Exchange Act. In preparing these consolidated financial statements, certain reclassifications have been made to the consolidated financial statements issued domestically in order to present them in a form that is more familiar to readers outside Japan. Certain supplementary information included in the statutory Japanese language consolidated financial statements, but not required for fair presentation, is not presented in the accompanying consolidated financial statements.
The consolidated financial statements are stated in Japanese yen, the currency of the country in which the Company is incorporated and operates. The translations of Japanese yen amounts into U.S. dollar amounts are included solely for the convenience of readers outside Japan, using the approximate rate prevailing at 31 March 2014, which was ¥103 to U.S. $1.00. Such translations should not be construed as a representation that the Japanese yen amounts have been, could have been or could in the future be converted into U.S. dollars at this or any other rate of exchange.
2. Significant accounting policies (a) Basis of consolidation
The accompanying consolidated financial statements include the accounts of the Company and its significant subsidiaries. Investments in significant unconsolidated subsidiaries and affiliated companies are accounted for using the equity method. Investments in unconsolidated subsidiaries and affiliated companies not accounted for using the equity method are stated at cost. There were no material changes in the scope of consolidated subsidiaries, unconsolidated subsidiaries and affiliated companies accounted for using the equity method for the year ended 31 March 2013 and 2014 from those for the years ended 31 March 2012 and 2013, respectively.
(b) Accounting changes
(Change in accounting policies with the amendment of law or regulation that is not distinguishable from change in accounting estimates) From the year ended 31 March 2013, in accordance with the amendment of the Corporation Tax Act of Japan, the Company and some of the consolidated subsidiaries have changed its depreciation method for property and equipment. Assets acquired on or after 1 April 2012 have been depreciated using the method prescribed in the amended Corporation Tax Act. The effect of this change in the depreciation method has been immaterial. (Adoption of new accounting standard for retirement benefits) Effective from the end of the fiscal year ended 31 March 2014, the Company has adopted the “Accounting Standard for Retirement Benefits” (Accounting Standards Board of Japan (“ASBJ”) Statement No.26, 17 May 2012) and “Guidance on Accounting Standard for Retirement Benefits” (ASBJ Guidance No.25, 17 May 2012), excluding those specified by paragraph 35 of the Accounting Standard for Retirement Benefits and paragraph 67 of the Guidance on Accounting Standard for Retirement Benefits. The Company has switched to recognising the
7

excess of retirement benefit obligations over pension assets as net defined benefit liability and booked previously unrecognised actuarial differences, unrecognised past service costs and unrecognised transitional obligation as net defined benefit liability. The Accounting Standards for Retirement Benefits and other accounting methods are applied in a transitional manner as stipulated in paragraph 37 of the Accounting Standards for Retirement Benefits. Consequently, the amount affected by this change is reflected in remeasurements of defined benefit plans in accumulated other comprehensive incomes as at the end of the consolidated fiscal year under review. As a result of such adoption, net defined benefit liability of ¥34,432 million were booked as of 31 March 2014. And also, accumulated other comprehensive incomes decreased by ¥3,740 million.
3. Contingent liabilities
At 31 March 2013 and 2014, the Group was contingently liable for guarantees of loans in the amounts of ¥1,131 million and ¥680 million ($6,602 thousand), respectively.
4. Segment information (1) General information about reportable segments
The reportable segments of the Company are those units for which separate financial statements can be obtained among the constituent units of the Company and which are regularly examined by the Board of Directors to determine the allocation of management resources and to assess business performance.
The Group is engaged in diversified business activities involving traffic, transport, real estate, leisure, distribution, equipment maintenance and the like. On the basis of the above activities, the Company’s reportable segments are as follows: “Traffic”; “Transport”; “Real Estate”; “Leisure and Services”; and, “Distribution”.
The business descriptions of the reportable segments are as follows.
-Traffic: business relating to railroads, buses and taxies -Transport: business relating to trucking and maritime transportation -Real Estate: real estate development, real estate leasing -Leisure and Services: business relating to hotels, restaurants, tourist facilities and travel -Distribution: department store operations, distributions of other merchandise sales
(2) Basis of measurement about reportable segment operating revenues, profit or loss, assets and other material
items
The accounting procedures applied to the reportable segments are basically the same as those described in Note 2, entitled the “Summary of Significant Accounting Policies.” Reportable segment income figures are on an operating income basis. Intersegment sales and transfers are based on the prevailing market prices.
8

(3) Information about reportable segment operating revenues, profit or loss, assets and other material items
Information about reportable segments as of and for the year ended 31 March 2013 was as follows.
Reportable segments
Traffic Transport Real Estate Leisure and
Services Distribution Others (*1) Total Adjustments
Consolidated financial
statements
Millions of yen For the year 2013:
Operating revenues:
External customers ¥ 154,547 ¥ 133,189 ¥ 86,623 ¥ 52,946 ¥ 129,510 ¥ 53,021 ¥ 609,836 ¥ - ¥ 609,836
Intersegment sales/transfer 2,328 489 6,697 850 12,974 18,879 42,217 (42,217) -
Total ¥ 156,875 ¥ 133,678 ¥ 93,320 ¥ 53,796 ¥ 142,484 ¥ 71,900 ¥ 652,053 ¥ (42,217) ¥ 609,836
Segment income (*2) 14,098 3,628 8,698 1,087 1,543 2,794 31,848 480 32,328
Segment assets (*3) 531,312 114,868 265,078 40,378 45,148 64,785 1,061,569 41,406 1,102,975
Other material items: Depreciation and amortisation
(*4) 19,893 5,534 5,919 1,687 1,185 5,883 40,101 (653) 39,448
Amortisation of goodwill 62 63 - 3 13 5 146 - 146Impairment losses on fixed assets 539 157 1,909 3,162 354 128 6,249 - 6,249
Increase in property and equipment and intangible assets
15,849 5,814 5,083 1,842 1,096 5,605 35,289 - 35,289
*1) “Others” is a business segment that is not considered a reportable segment. It includes the business of equipment maintenance, air
transportation, building maintenance, insurance agency and the like. *2) Segment income adjustment amounting to ¥480 million was treated as intersegment elimination. *3) Segment assets adjustment amounting to ¥41,406 million consisted of unallocated general corporate assets amounting to ¥72,395
million, net of intersegment elimination of ¥30,989 million. Such general corporate assets consisted mainly of cash, deposits and investment securities.
*4) Depreciation and amortisation adjustment amounting to ¥653 million was treated as intersegment elimination. 5) Segment income was reconciled to operating income in the accompanying consolidated statements of income.
9

Information about reportable segments as of and for the year ended 31 March 2014 was as follows.
Reportable segments
Traffic Transport Real Estate Leisure and
Services Distribution Others (*1) Total Adjustments
Consolidated financial
statements
Millions of yen For the year 2014:
Operating revenues:
External customers ¥ 156,626 ¥ 134,876 ¥ 89,907 ¥ 54,381 ¥ 135,380 ¥ 56,627 ¥ 627,797 ¥ - ¥ 627,797
Intersegment sales/transfer 2,383 484 6,585 1,423 14,617 19,521 45,013 (45,013) -
Total ¥ 159,009 ¥ 135,360 ¥ 96,492 ¥ 55,804 ¥ 149,997 ¥ 76,148 ¥ 672,810 ¥ (45,013) ¥ 627,797
Segment income (*2) 13,481 3,615 10,803 1,646 2,144 3,976 35,665 1,413 37,078
Segment assets (*3) 483,354 113,566 254,708 40,860 46,973 65,455 1,004,916 49,763 1,054,679
Other material items: Depreciation and amortisation
(*4) 19,372 5,533 5,870 1,516 1,201 5,980 39,472 (615) 38,857
Amortisation of goodwill - 66 1 21 22 6 116 - 116Impairment losses on fixed assets 547 10 1,629 498 314 144 3,142 - 3,142
Increase in property and equipment and intangible assets
14,487 4,962 7,329 1,606 1,307 7,663 37,354 - 37,354
Reportable segments
Traffic Transport Real Estate Leisure and
Services Distribution Others (*1) Total Adjustments
Consolidated financial
statements
Thousands of U.S. dollars For the year 2014:
Operating revenues:
External customers $ 1,520,641 $ 1,309,476 $ 872,883 $ 527,971 $ 1,314,369 $ 549,777 $ 6,095,117 $ - $ 6,095,117
Intersegment sales/transfer 23,136 4,699 63,932 13,815 141,913 189,524 437,019 (437,019) -
Total $ 1,543,777 $ 1,314,175 $ 936,815 $ 541,786 $ 1,456,282 $ 739,301 $ 6,532,136 $ (437,019) $ 6,095,117
Segment income (*2) 130,883 35,097 104,883 15,981 20,816 38,602 346,262 13,719 359,981
Segment assets (*3) 4,692,757 1,102,583 2,472,893 396,699 456,049 635,485 9,756,466 483,136 10,239,602
Other material items: Depreciation and amortisation
(*4) 188,078 53,719 56,990 14,718 11,660 58,058 383,223 (5,971) 377,252
Amortisation of goodwill - 641 10 204 213 58 1,126 - 1,126Impairment losses on fixed assets 5,311 97 15,815 4,835 3,049 1,398 30,505 - 30,505
Increase in property and equipment and intangible assets
140,651 48,175 71,155 15,592 12,689 74,398 362,660 - 362,660
*1) “Others” is a business segment that is not considered a reportable segment. It includes the business of equipment maintenance, air
transportation, building maintenance, insurance agency and the like. *2) Segment income adjustment amounting to ¥1,413 million ($13,719 thousand) was treated as intersegment elimination. *3) Segment assets adjustment amounting to ¥49,763 million ($483,136 thousand) consisted of unallocated general corporate assets
amounting to ¥78,000 million ($757,282 thousand), net of intersegment elimination of ¥28,237 million ($274,146 thousand). Such general corporate assets consisted mainly of cash, deposits and investment securities.
*4) Depreciation and amortisation adjustment amounting to ¥615 million ($5,971 thousand) was treated as intersegment elimination. 5) Segment income was reconciled to operating income in the accompanying consolidated statements of income.
10

5. Subsequent events On 17 March 2014 the Board of Directors of the Company resolved to issue bonds. Based on this resolution, the
Company determined to issue the 48th Series Unsecured Straight Bonds as shown below. The details are as follows: 1. Bonds : 48th Series Unsecured Straight Bonds 2. Total amount of issue : 15 billion yen 3. Issue value : 100 yen per face value of 100 yen 4. Coupon : 0.557% per annum 5. Payment date : 25 April 2014 6. Maturity date : 23 April 2021 7. Use of proceeds : Capital expenditure and repayment of borrowings
11