NADP Central Analytical Laboratory Wisconsin State...
85
NADP Central Analytical Laboratory Wisconsin State Laboratory of Hygiene Readiness Verification Report October 2018
Transcript of NADP Central Analytical Laboratory Wisconsin State...
NADP Central Analytical Laboratory
Wisconsin State Laboratory of Hygiene
Readiness Verification Report
October 2018

NADP Central Analytical Laboratory Readiness Verification Report
Page 1 of 85
National Atmospheric Deposition Program (NADP)
Central Analytical Laboratory (CAL)
Wisconsin State Laboratory of Hygiene (WSLH)
Readiness Verification Report
NADP Quality Assurance Advisory Group (QAAG)

NADP Central Analytical Laboratory Readiness Verification Report
Page 2 of 85
Contents 1.0 Introduction ................................................................................................................................................ 3
2.0 Purpose and Scope .................................................................................................................................... 3
3.0 Results ..................................................................................................................................................... 4
3.1 Analytical Detection Limits ....................................................................................................................... 4
3.1.1 NTN Detection Limits ....................................................................................................................... 4
3.1.2 AMoN Detection Limits ..................................................................................................................... 5
3.2 PCQA Interlaboratory Samples ................................................................................................................ 7
3.2.1 Bias ................................................................................................................................................ 7
3.2.2 Variability ........................................................................................................................................ 8
3.3 PCQA Mixed Natural Matrix Spikes .......................................................................................................... 9
3.3.1 Bias Determined from Spiked Natural Matrix Samples ....................................................................... 12
3.3.2 Precision Determined from Duplicate Spiked Natural Matrix Samples ................................................. 16
3.3.3 Variability Determined from Spiked Natural Matrix Samples ............................................................... 18
3.3.4 Analysis of Blanks .......................................................................................................................... 18
3.4 W-CAL Bias Relative to I-CAL ............................................................................................................. 21
4.0 Assessment of Supplies and Routine Laboratory Operations ........................................................................ 24
4.1 Supply Checks ..................................................................................................................................... 24
4.1.1 Wet-Deposition (NTN and AIRMoN) Supplies ................................................................................... 24
4.1.2 Ammonia Monitoring Network (AMoN) Supplies ................................................................................ 25
4.2 Low-Volume Samples ........................................................................................................................... 37
5.0 AMoN Colocated Sampler Study ................................................................................................................ 40
6.0 Summary and Conclusions ........................................................................................................................ 41
7.0 References .............................................................................................................................................. 43

NADP Central Analytical Laboratory Readiness Verification Report
Page 3 of 85
1.0 Introduction
This report presents the results of quality assurance (QA) studies conducted to verify the performance of
the Wisconsin State Laboratory of Hygiene (WLSH) as the new Central Analytical Laboratory (W-CAL)
for the National Atmospheric Deposition Program (NADP). A Readiness Verification Plan (RVP;
QAAG, March 16, 2018) was developed that details the objectives, study designs, and performance
assessment metrics for the QA studies. The overarching goal of the RVP QA studies was to ensure that
NADP data continue to be of sufficient quality to quantify trends in atmospheric chemistry, and
importantly, that potential step-changes in data, which could be introduced as a result of analytical
laboratory bias and variability, are identified, quantified, and minimized.
The QA studies presented herein were developed by the NADP Quality Assurance Advisory Group and
coordinated by the U.S. Geological Survey (USGS) external Precipitation Chemistry Quality Assurance
(PCQA) project. The former Central Analytical Laboratory at the University of Illinois, Prairie Research
Institute (I-CAL) played an important role in these studies by receiving, processing, and shipping natural
matrix samples received from the NADP National Trends Network (NTN) in its last few months of
operation for NADP, for inclusion in the RVP.
Coordination between the laboratories was crucial to the success of the QA studies. The I-CAL and W-
CAL coordinated chemical analyses of aliquots of the same samples (split samples) and in the analysis of
cleaned reusable sampling supplies. Both laboratories participated in a co-located sampler study for the
Ammonia Monitoring Network.
Nine additional laboratories engaged in low-ionic strength water-sample analysis participated in the QA
studies (Wetherbee and Martin, 2016b). These volunteer laboratories are participants in the PCQA inter-
laboratory-comparison program:
• Environment and Climate Change Canada, Science and Technology Branch, Downsview,
Ontario, Canada (ECST),
• Wood Group, Gainsville, Florida (WOOD),
• Cary Institute for Ecosystem Studies, Millbrook, New York (CIES),
• U.S. Forest Service Northern Research Station, Durham, New Hampshire (NRS),
• Norwegian Institute for Air Research, Kjeller, Norway (NILU),
• Asia Center for Atmospheric Pollution Research, Niigata-shi, Japan (ACAP),
• Universidad Nacional Autonoma de Mexico, Mexico City, Mexico (UNAM),
• RTI International, Research Triangle Park, North Carolina (RTI),
• Ontario Ministry of the Environment and Energy, Dorset, Ontario, Canada (MOEE),
The PCQA interlaboratory-comparison program has continuously evaluated the bias and variability of the
CAL’s analytical data since 1980 by comparing results of the analysis of NIST-traceable solutions and
natural matrix samples among the participants.
2.0 Purpose and Scope
This report presents a comprehensive assessment of analytical performance for the W-CAL, I-CAL and
other participating laboratories. Comparative performance is evaluated by quantifying the precision

NADP Central Analytical Laboratory Readiness Verification Report
Page 4 of 85
(variability) and accuracy (bias) of the results obtained from each laboratory. The performance
acceptance criteria (metrics) for each study are documented in the RVP and reiterated herein.
Performance was assessed for analysis of the National Trends Network (NTN) parameters: calcium,
magnesium, sodium, potassium, ammonium, chloride, bromide, nitrate, sulfate, pH, and specific
conductance, and orthophosphate, which is an official Atmospheric Integrated Research Monitoring
(AIRMoN) network analyte (but not an official analyte for NTN). In addition, a colocated sampler study
(between the I-CAL and W-CAL) was conducted to evaluate performance in every aspect of operation of
the Ammonia Monitoring Network (AMoN). RVP samples consisted of NTN precipitation samples,
spiked natural matrix samples, AMoN samples, NIST-traceable synthetic precipitation solutions, rinse
solutions for cleaned supplies, ultrapure (Type I) water blanks, and other supply quality-control (QC)
samples.
This report includes the following results.
• Detection Limits for I-CAL and W-CAL.
• Comparison of results for 30 natural precipitation samples (supplemented with potassium
bromide and potassium dihydrogen phosphate to ensure detection of potassium, bromide, and
phosphate) which were split between I-CAL, W-CAL, and four other participating laboratories.
• Comparison of results for 75 NTN precipitation samples split between I-CAL and W-CAL.
• Comparison of results for monthly PCQA performance-evaluation samples, consisting of both
NIST-traceable synthetic precipitation solutions, blended natural precipitation samples, and
deionized water blanks split between I-CAL, W-CAL, and nine other participating laboratories.
• Assessment of analytical precision for low-volume samples. These are samples where the
available volume is inadequate for standard processing and which are diluted to obtain sufficient
volume for analysis when appropriate.
• Analysis of new and reused supply blanks to determine cleanliness of supplies procured, cleaned,
and processed by W-CAL for NTN, AIRMoN, and AMoN.
• Analysis of ammonium extracted from passive ambient air samplers for AMoN for the collocated
study between I-CAL and W-CAL.
3.0 Results
3.1 Analytical Detection Limits
3.1.1 NTN Detection Limits
Table 1 provides a comparison of the I-CAL and W-CAL network MDLs for NTN and AMoN analytes.
Network MDLs are calculated from analyses of a prepared (MDL) solution with concentrations near the
expected MDLs that is processed through the sample collection systems. For example, the MDL solution

NADP Central Analytical Laboratory Readiness Verification Report
Page 5 of 85
is added to a clean NADP bucket or bag-lined bucket, then transferred to a clean 1-liter NADP sample
bottle, filtered into a clean 60-mL laboratory sample bottle, and then analyzed for the suite of NTN
analytes.
The I-CAL detection limits are calculated per U.S. Environmental Protection Agency (EPA) in 40 CFR
136.2 (pre-2017) as documented in the CAL Quality Assurance Plan Section B-4.2 (NADP, 2017). EPA
changed its MDL procedure in 2016, and published the new protocol in the Federal Register in 2017. This
new methodology is not reflected in this plan. For the purposes of this plan, that W-CAL and I-CAL
MDL calculations used the same formula (1).
MDLnetwork = t(99th, n-1) × b ; (1)
where: t(99th, n-1) = student’s t-statistic at the 99th percent confidence level and (n-1) degrees of
freedom; and
b = standard deviation of valid blank or low-concentration spike solution processed
through clean network supplies and sample-handling system (mg/L).
Because detection limits fluctuate, a maximum tolerance of +50 percent of the mean, I-CAL 2016-2017
NTN MDLs rounded to three significant figures was considered acceptable. The W-CAL should strive to
achieve a LD less than 1.5 times the 2015 LD (= 1.5 x 0.010 = 0.015 mg NH4+/L).
3.1.2 AMoN Detection Limits
The AMoN laboratory detection limit (LD) has been calculated annually from unexposed passive sampler
cores (i.e., “new core blanks”), extracted and analyzed at the CAL with each sampling batch. The AMoN
network detection limit (LN) has been calculated quarterly and annually (Table 2, see also CAL SOP DA-
4085) from values of valid travel blanks shipped to individual stations but not exposed per standard
AMoN field procedures. However, these detection limits were not used to qualify (flag) data. The
originally established MDL of 0.04961 has been used to flag AMoN data as less than the MDL since the
beginning of the program. In the future, network MDLs based on travel blanks will be calculated annually
and used to flag the data for the following year.
𝐿𝑁 = 𝑥�̅� + (2 × 𝑡(95th%,𝑛𝑡−1) × 𝜎𝑡) (2)
where: 𝐿𝑁 = annual AMoN detection limit, mg/L
𝑥�̅�= annual arithmetic mean of valid travel blank concentrations, mg/L
𝑡(95th%,𝑛𝑡−1) = student’s t-distribution at the 95th% confidence interval and
(nt – 1) degrees of freedom, unitless
nt = number of valid travel blanks deployed during the year
σt = standard deviation of annual valid travel blank concentrations, mg/L

NADP Central Analytical Laboratory Readiness Verification Report
Page 6 of 85
Table 1. Calculated network method detection limits (NMDLs) for National Trends Network (NTN) and Ammonia Monitoring Network (AMoN) samples and comparison to NTN 10th percentiles and Readiness Verification Plan (RVP) criteria.
Analyte
NTN MDL I-CAL (mg/L)
Lab MDL
W-CAL (mg/L)
NTN* MDL
W-CAL (mg/L)
NTN 10th
Percentiles (2014-2016)
(mg/L)
RVP Minimum Required
WCAL NTN MDL (mg/L) (+ 50% mean ICAL
NTN MDL, 2016-2017)
Calcium (Ca+2) 0.009 0.004 0.011 0.022 0.011
Magnesium (Mg+2) 0.002 0.002 0.004 0.005 0.003
Sodium (Na+) 0.003 0.003 0.002 0.009 0.004
Potassium (K+) 0.004 0.002 0.004 0.006 0.005
Chloride (Cl-) 0.005 0.006 0.005 0.023 0.006
Sulfate (SO4-2) 0.004 0.008 0.014 0.140 0.007
Nitrate (NO3-) 0.005 0.003 0.016 0.189 0.008
Ammonium (NH4+) - NTN 0.019 0.003 0.075 0.054 0.028 (using
0.008)
Orthophosphate (PO4-3) 0.005 0.004 0.012 No data 0.008
Bromide (Br-) 0.004 0.003 0.010 No data 0.006
Analyte
AMoN MDL I-CAL mg/L
AMoN MDL
W-CAL mg/L
Ammonium (NH4+) -
AMoN
0.118 0.119** Not applicable 0.229
Notes: The concept of a detection limit does not apply to measurements of pH, and is relatively unimportant for
measurement of specific conductance because it is used solely for quality control purposes.
*W-CAL has been using the “RVP Minimum Required NTN MDLs” as their QC limits for analytical assessment of blanks,
low level samples and supplies. The one exception is NH4+ which is being assessed using a lower MDL of 0.008 mg/L. W-
CAL NTN MDLs given above did not provide a strict enough assessment level and were produced in less than ideal
situations (early in the process, multiple solutions, limited and variable data, construction occurring etc.). W-CAL is in the
process of reevaluating NTN MDLs using a new MDL solution which is at slightly higher concentrations and in now
completed facilities.
**AMoN MDL is based on I-CAL 2017 travel blanks and will be used for 2018 data flagging. For comparison the MDL
calculated based on 3 months of WCAL travel blanks was 0.107 mg/L.

NADP Central Analytical Laboratory Readiness Verification Report
Page 7 of 85
Table 2. AMoN laboratory and network detection limits for I-CAL (2014 – 2016) and W-CAL (2018, this study).
Lab / Year Laboratory Detection Limit (LD) Network detection Limit (LN)
n NH4+, mg/L NH3, µg/m3 n NH4
+, mg/L NH3, µg/m3
I-CAL/2014 66 0.006 0.011 408 0.368 0.731
I-CAL/2015 68 0.010 0.019 562 0.183 0.363
I-CAL/2016 69 0.011 0.022 799 0.118 0.235
W-CAL/2018 34 0.016* 0.032* 651 0.119** 0.246**
*The W-CAL AMoN Lab MDL was calculated in the same way that I-CAL does using 34 core blank results. However, it should
be noted that W-CAL actually uses their analytical MDL of 0.008 mg/L as the Lab MDL to assess blanks and QC at the
analytical bench. The AMoN Lab MDL will not be used to flag data. It was not possible for the W-CAL to fully evaluate AMoN
network DLs within the confines of the RVP time constraints.
**AMoN Network MDL of 0.119 mg/L is based on ICAL 2017 travel blanks and will be used for 2018 data flagging.
3.2 PCQA Interlaboratory Samples
3.2.1 Bias
Four PCQA interlaboratory-comparison samples are shipped monthly to each of the 11 participating
laboratories. Results for these samples are compared to the median values (i.e. Most Probable Values, or
MPVs) obtained from the pooled data from all participating laboratories for each analyte. Bias with
respect to the MPVs provides an assessment of accuracy for all analytes, including hydrogen-ion
concentration (from pH) and specific conductance. For this evaluation, the MPVminusreported value
concentration differences were calculated, and then the f-pseudosigma of the concentration differences
were calculated as:
f-pseudosigma = (75th percentile – 25th percentile) / 1.349 (3)
The RVP acceptance criteria for W-CAL bias was established as within the range of +2 f-pseudosigma
from the MPVs. In addition, the median relative biases with respect to the MPVs were calculated in
milligrams per liter (mg/L) for most analytes, and in microequivalents per liter (Eq/L) for hydrogen-ion
concentrations calculated from pH. Control charts were plotted for each laboratory and each analyte. The
control charts include warning limits at +2 f-pseudosigma from the MPVs and control limits at +3 f-
pseudosigma from the MPVs (Appendix).
Over the period October 19, 2017 – May 1, 2018, the W-CAL reported results for 18 NIST-traceable
synthetic precipitation samples, 12 natural precipitation samples, and 2 blanks. The W-CAL reported
values outside the +2 f-pseudosigma warning limits for: [analyte (# of samples)] ammonium (1), chloride
(2), nitrate (2), bromide (1), and hydrogen ion (6). Values outside the +3 f-pseudosigma control limits
were reported for: magnesium (1), sodium (1), potassium (1), nitrate (1), sulfate (1), and hydrogen ion
(12). It should be noted that some of these samples were stored in a refrigerator for up to six months
before being analyzed, which might have affected the results. The control charted data (Appendix)
indicated less than +1 f-pseudosigma positive biases for calcium, magnesium, sodium, and potassium;
less than -1 f-pseudosigma negative biases for ammonium, chloride, and sulfate, and a strong positive bias
greater than +3 f-pseudosigma for hydrogen ion (pH measurements biased low).

NADP Central Analytical Laboratory Readiness Verification Report
Page 8 of 85
The RVP stipulated that W-CAL median relative bias values shall not exceed the following concentration
range stratified criteria (I-CAL QA Plan, Section 4.2.2 therein (NADP, 2014b)) as shown below.
Criteria concentrations
strata Concentration Range Bias goal
Low (W-CAL NTN MDL) to (10 x W-CAL NTN MDL) +1 I-CAL NTN MDL
Standard (10 x W-CAL NTN MDL) to (100 x W-CAL NTN MDL) +20 percent
High
All Hydrogen-ion concentrations, specific conductance > 10 uS/cm, and >100 x W-CAL NTN MDL +10 percent
Bias was evaluated using the median relative percent difference (RPD), calculated as:
RPDcr = {(CW-CAL – MPV)/ MPV × 100}; (4)
where: RPDcri = Relative Percent Difference for a specific concentration range (cri),
MPV = Most probable value (median) for the solution, and
CW-CAL = Concentration or specific conductance reported by W-CAL.
Table 3 shows the RPD results for each laboratory in the PCQA interlaboratory comparison for the
October 2017 – May 2018 period. None of the solutions tested had calcium, magnesium, chloride,
nitrate, or sulfate in the low-concentration range. The W-CAL median relative percent difference values
did not exceed any of the concentration range criteria, except for hydrogen-ion concentration, which had a
MRPD of 22 percent (Standard concentration range).
3.2.2 Variability
Variability was assessed using the f-pseudosigma ratios for each laboratory as follows.
1. MPVs for all solutions analyzed by all participating laboratories were calculated.
2. Next, the MPV-minus-reported value concentration differences were calculated, and
subsequently, the f-pseudosigma of the differences were calculated for each laboratory
(i.e. f-pseudosigma(W-CAL)).
3. The f-pseudosigma of the differences was also calculated for the results from all laboratories
combined (i.e. f-pseudosigma(overall)).
4. Finally, the f-pseudosigma ratio was calculated as:
f-pseudosigma ratio = f-pseudosigma(W-CAL) / f-pseudosigma(overall). (5)
An f-pseudosigma ratio less than 1.0 indicates lower variability than overall, and an f-pseudosigma ratio
greater than 1.0 indicates greater variability than overall. For this evaluation, an f-pseudosigma ratio less
than 1.25 was considered acceptable for the W-CAL. Table 4 shows the outcomes of the variability
assessment for the PCQA interlaboratory-comparison laboratories during the period October 2017 – May
2018. Shading in Table 4 identifies f-pseudosigma ratios greater than 1.25, which occurred for I-CAL
ammonium (1.46) and W-CAL hydrogen-ion (3.36) results. The f-pseudosigma ratios for all other

NADP Central Analytical Laboratory Readiness Verification Report
Page 9 of 85
analytes were less 1.0 for I-CAL and W-CAL. It is important to note that these samples were stored for up
to 5 months before W-CAL analyzed them. In some cases, this might have contributed to W-CAL’s pH
variability.
3.3 PCQA Mixed Natural Matrix Spikes
The I-CAL composited 30 precipitation samples from filtered excess volumes of NTN samples received
during the spring of 2018. Six, 1-Liter, geographically representative, composite samples were prepared
from samples received from each of the 5 regions shown in Figure 1. The 30, 1-Liter samples were
shipped to the PCQA laboratory, in Denver, Colorado, where they were spiked with potassium
dihydrogen phosphate (KH2PO4) and potassium bromide (KBr) to concentrations commonly observed in
NTN samples to ensure that concentrations of K+, Br-, and PO4-3 were above MDLs. Target spike
concentrations were: 0.002 – 0.021 mg K/L; 0.005-0.040 mg Br/L, and 0.005-0.032 mg PO4-3 /L. The
PCQA split these 30 natural matrix spiked samples into 60 mL sample bottles and shipped them to the I-
CAL, W-CAL, ECST, CIES, NRS, and WOOD laboratories for chemical analysis of the NADP analytes.
Split samples of these solutions were kept at the PCQA laboratory and were later used for evaluation of
the low-volume sample analyses (Sections 3.3.1 – 3.3.2).

NADP Central Analytical Laboratory Readiness Verification Report
Page 10 of 85
Table 3. Relative percent difference results for U.S. Geological Survey Precipitation Chemistry Project
Interlaboratory Comparison Program participating laboratories, October 2017 – May 2018.
[N, number of samples; most probable value (MPV) concentration ranges for Ca, Mg, Na, K, NH4, Cl, NO3, SO4, and Br: (1), less than
10 times the CAL laboratory’s minimum detection limit (MDL); (2), greater than 10 times the CAL MDL and less than 100 times the CAL
MDL; (3), greater than 100 times the CAL MDL; MPV ranges for specific conductance (SC): (1) less than 10 microsiemens per
centimeter (S/cm), (2) greater than 10 S/cm; N +1MDL, number of MPV-reported value differences greater than +1 CAL MDL;
N>20%, number of MPV-reported value differences greater than greater 20 percent relative percent difference (RPD); N>10%, number
of MPV-reported value differences greater than 10 percent RPD; boxes identify ICAL and WCAL analyses exceeding bias goals; -, no
data; see table 5 for laboratory identification]
Laboratory
N All
Range
1
N All
Range
2
N All
Range
3
N
+1MDL
(1)
N>20%
(2)
N>10%
(3)
N All
Range
1
N All
Range
2
N All
Range
3
N
+1MDL
(1)
N>20%
(2)
N>10%
(3)
N All
Range
1
N All
Range
2
N All
Range
3
N
+1MDL
(1)
N>20%
(2)
N>10%
(3)
ACAP 0 2 10 - 0 0 0 12 0 - 9 - 2 7 3 0 0 0
ICAL 0 6 21 - 0 0 0 27 0 - 0 - 2 16 9 0 0 0
CIES 0 6 24 - 0 19 0 30 0 - 0 - 2 18 10 2 4 6
ECST 0 6 24 - 0 0 0 30 0 - 0 - 2 18 10 0 0 0
MOECC 0 6 21 - 0 10 0 27 0 - 4 - 2 16 9 2 0 0
NILU 0 6 21 - 0 5 0 27 0 - 1 - 2 16 9 2 0 1
NRS 0 4 19 - 0 0 0 23 0 - 1 - 2 14 7 0 8 6
RTI 0 0 0 - - - 0 0 0 - . - 0 9 6 - 0 0
UNAM 0 6 21 - 6 12 0 27 0 - 19 - 2 15 10 2 3 1
WCAL 0 6 24 - 0 1 0 30 0 - 1 - 0 19 11 - 0 1
WOOD 0 4 19 - 0 0 0 23 0 - 0 - 2 14 7 0 0 0
ACAP 5 7 0 2 3 - 0 12 0 . 0 - 0 9 3 - 0 0
ICAL 9 18 0 0 0 - 4 23 0 0 0 - 0 18 9 - 0 0
CIES 9 21 0 4 9 - 4 26 0 0 0 - 0 20 10 - 0 0
ECST 9 21 0 0 0 - 4 26 0 0 0 - 0 20 10 - 0 0
MOECC 9 18 0 8 10 - 4 23 0 2 0 - 0 18 9 - 4 0
NILU 9 18 0 9 6 - 4 23 0 0 0 - 0 18 9 - 4 0
NRS 7 16 0 1 4 - 4 19 0 0 0 - 0 16 7 - 8 0
RTI 4 11 0 0 0 - 4 11 0 0 0 - 0 18 9 - 0 0
UNAM 7 20 0 7 16 - 4 23 0 2 2 - 0 17 10 - 10 2
WCAL 8 22 0 0 1 - 4 26 0 0 0 - 0 19 11 - 0 0
WOOD 7 16 0 0 2 - 4 19 0 0 0 - 0 16 7 - 0 1
ACAP 0 6 6 - 0 0 0 9 3 - 0 0 0 0 0 - - -
ICAL 0 12 15 - 0 0 0 19 8 - 0 0 14 3 0 0 0 -
CIES 0 12 18 - 0 1 0 19 11 - 0 0 16 4 0 3 0 -
ECST 0 12 18 - 0 0 0 19 11 - 0 0 0 0 0 - - -
MOECC 0 12 15 - 0 2 0 19 8 - 1 1 0 0 0 - - -
NILU 0 12 15 - 0 2 0 19 8 - 1 0 0 0 0 - - -
NRS 0 10 13 - 0 4 0 15 8 . 2 2 14 3 0 8 1 -
RTI 0 12 15 - 0 0 0 19 8 - 1 0 0 0 0 - - -
UNAM 0 12 15 - 0 0 0 17 10 - 0 0 0 0 0 - - -
WCAL 0 8 22 - 0 0 0 16 14 - 0 0 17 5 0 0 1 -
WOOD 0 10 13 - 0 0 0 15 8 - 0 0 0 0 0 - - -
ACAP 12 9 9 3 0 0
ICAL 27 14 21 6 0 0
CIES 30 30 21 9 10 6
ECST 30 17 0 0 - -
MOECC 27 20 21 6 0 0
NILU 27 13 21 6 0 0
UNAM 27 18 19 8 0 0
WCAL 30 26 18 12 0 0
WOOD 23 13 17 6 0 0
NO3 SO4 Br
H SC
Ca Mg Na
K NH4 Cl

NADP Central Analytical Laboratory Readiness Verification Report
Page 11 of 85
Table 4. Interquartile ranges and f-pseudosigma ratios for U.S. Geological Survey Precipitation Chemistry Project
Interlaboratory Comparison Program participating laboratories, October 2017 – May 2018.
[IQR, interquartile range of reported minus most probable value differences; mg/L, milligrams per liter; fps-ratio, f-pseusosigma ratio,
which is of IQR for each laboratory:IQR for all laboratories combined; shading identifies fps-ratios greater than 1.25 for ICAL and
WCAL.]
Table #. Preliminary results for U.S. Geological Survey Precipitation Chemistry Project Interlaboratory
Comparison Program, October 2017 – May 2018.
[IQR, interquartile range of reported minus most probable value differences; mg/L, milligrams per liter; fps-ratio, ratio of
IQR for each laboratory:IQR for all laboratories combined; shading identifies fps-ratios greater than 1 for ICAL and WCAL.]
IQR (mg/L) fps-ratio
IQR (mg/L) fps-ratio
IQR (mg/L) fps-ratio
IQR (mg/L) fps-ratio
Laboratory Calcium Magnesium Sodium Potassium
ACAP 0.007 0.48 0.003 0.83 0.006 0.52 0.010 1.58
ICAL 0.007 0.47 0.002 0.67 0.002 0.17 0.001 0.17
CIES 0.018 1.17 0.002 0.67 0.017 1.48 0.017 2.75
ECST 0.003 0.20 0.001 0.33 0.007 0.61 0.002 0.33
MOECC 0.045 2.97 0.005 1.50 0.008 0.7 0.016 2.58
NILU 0.017 1.10 0.006 1.83 0.018 1.57 0.005 0.83
NRS 0.014 0.93 0.003 0.83 0.047 4.04 0.009 1.42
RTI nd nd nd nd 0.003 0.26 0.004 0.67
UNAM 0.048 3.20 0.024 8.00 0.036 3.13 0.015 2.50
WCAL 0.008 0.50 0.002 0.67 0.006 0.52 0.002 0.33
WOOD 0.005 0.33 0.001 0.33 0.008 0.70 0.003 0.50
Nitrate Sulfate Chloride Bromide
ACAP 0.057 1.66 0.049 1.64 0.014 1.30 nd nd
ICAL 0.009 0.25 0.012 0.39 0.007 0.64 0.003 0.55
CIES 0.033 0.96 0.022 0.73 0.014 1.27 0.003 0.55
ECST 0.009 0.26 0.014 0.46 0.004 0.36 nd nd
MOECC 0.025 0.72 0.031 1.03 0.022 1.95 nd nd
NILU 0.059 1.71 0.056 1.88 0.017 1.50 nd nd
NRS 0.086 2.48 0.096 3.24 0.036 3.23 0.006 1.09
RTI 0.016 0.45 0.017 0.56 0.006 0.50 nd nd
UNAM 0.051 1.46 0.034 1.14 0.052 4.68 nd nd
WCAL 0.022 0.62 0.012 0.39 0.010 0.86 0.002 0.45
WOOD 0.022 0.62 0.024 0.81 0.009 0.77 nd nd
IQR (mg/L) fps-ratio
IQR
(Eq/L) fps-ratio
IQR
(s/cm) fps-ratio
Ammonium H-ion
Specific Conductance
ACAP 0.035 2.92 3.0628 2.30 0.6 1.00
ICAL 0.018 1.46 0.8925 0.67 0.4 0.67
CIES 0.007 0.58 5.5418 4.17 0.6 1.00
ECST 0.008 0.67 0.9244 0.70 nd nd
MOECC 0.017 1.42 0.9614 0.72 0.5 0.78
NILU 0.007 0.58 0.8314 0.63 0.5 0.83
NRS 0.007 0.58 nd nd nd nd
RTI 0.006 0.46 nd nd nd nd
UNAM 0.016 1.33 2.2694 1.71 0.5 0.90
WCAL 0.006 0.50 4.4644 3.36 0.4 0.58
WOOD 0.010 0.83 7.1517 5.38 0.3 0.50

NADP Central Analytical Laboratory Readiness Verification Report
Page 12 of 85
Figure 1. Five, color-coded geographic regions in the U.S.A. for which natural precipitation
samples were composited by the Central Analytical Laboratory at University of Illinois, spiked
and split by PCQA, and shipped to 6 laboratories for independent analysis.
3.3.1 Bias Determined from Spiked Natural Matrix Samples
Results for the spiked natural matrix samples were evaluated by calculating median relative concentration
percent differences for each concentration quartile, as determined from the participating laboratory-
pooled sample data (i.e. not the NTN quartiles) as follows.
MRPDcr = Median {(CReported– MPV)/ MPV × 100}; (6)
where: MRPDcri = Median Relative Percent Difference for a specific concentration range (cri). See
descriptions of concentration ranges below.
CRported = Concentration, pH or specific conductance reported by one of the 6 laboratories, and
MPV = Most probable value (median) calculated from the pooled laboratory data for a given
solution.

NADP Central Analytical Laboratory Readiness Verification Report
Page 13 of 85
For each analyte, the W-CAL MRPD was evaluated against the following goals derived from the
Guidelines for New NADP Equipment (NADP, 2016a) and the I-CAL QA Project Plan - QAPP (NADP,
2014b).
Criteria concentrations
strata Concentration Range Bias goal
MRPDcr1 (I-CAL NTN MDL) to (2 x I-CAL NTN MDL) +200 percent of I-CAL NTN MDL
MRPDcr2 (2 x I-CAL NTN MDL) to (10 x I-CAL NTN MDL), and specific conductance < 10 uS/cm
+20 percent
MRPDcr3 All Hydrogen-ion concentrations, specific conductance > 10 uS/cm, and >10 x I-CAL NTN MDL
+10 percent
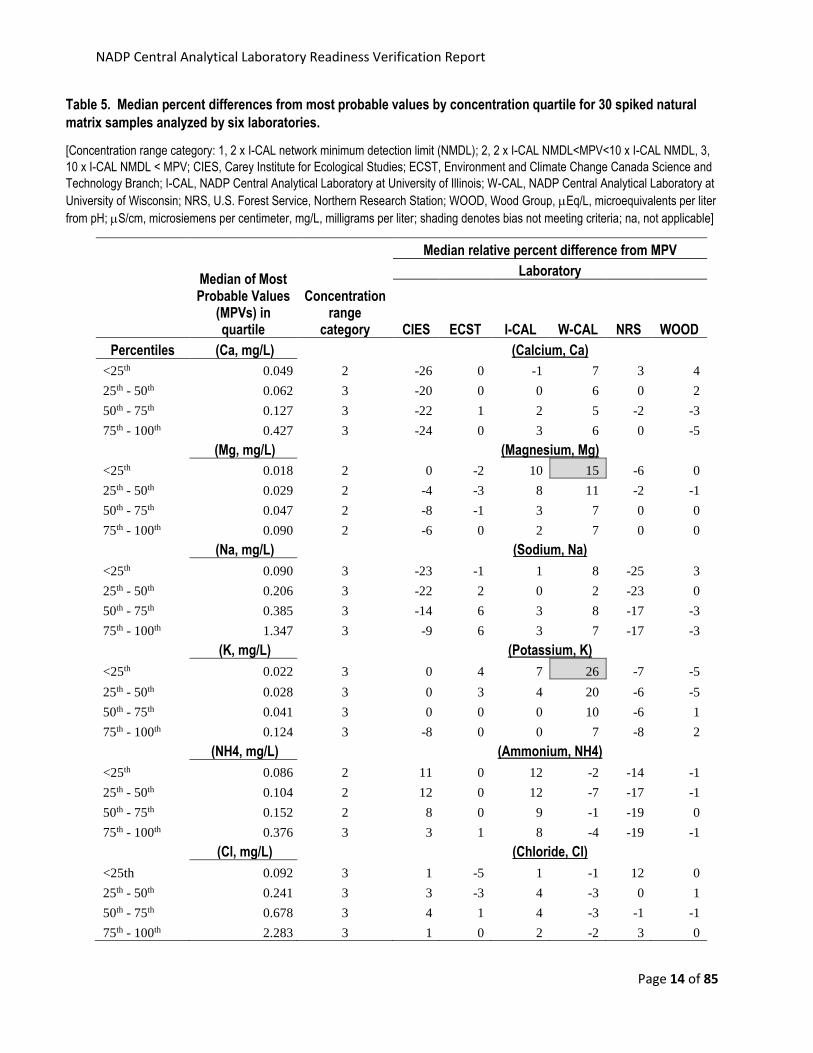
The results are summarized in Table 5 for the six participating laboratories. The W-CAL met the criteria
for acceptable bias for all analytes except for magnesium in concentration range 2, and potassium,
bromide, and hydrogen ion in concentration range 3. The I-CAL also met the criteria for acceptable bias
for all analytes except for bromide in concentration range 3 and orthophosphate in concentration range 1.
NADP Central Analytical Laboratory Readiness Verification Report
Page 14 of 85
Table 5. Median percent differences from most probable values by concentration quartile for 30 spiked natural
matrix samples analyzed by six laboratories.
[Concentration range category: 1, 2 x I-CAL network minimum detection limit (NMDL); 2, 2 x I-CAL NMDL<MPV<10 x I-CAL NMDL, 3,
10 x I-CAL NMDL < MPV; CIES, Carey Institute for Ecological Studies; ECST, Environment and Climate Change Canada Science and
Technology Branch; I-CAL, NADP Central Analytical Laboratory at University of Illinois; W-CAL, NADP Central Analytical Laboratory at
University of Wisconsin; NRS, U.S. Forest Service, Northern Research Station; WOOD, Wood Group, Eq/L, microequivalents per liter
from pH; S/cm, microsiemens per centimeter, mg/L, milligrams per liter; shading denotes bias not meeting criteria; na, not applicable]
Median of Most Probable Values
(MPVs) in quartile
Concentration
range category
Median relative percent difference from MPV
Laboratory
CIES ECST I-CAL W-CAL NRS WOOD
Percentiles (Ca, mg/L) (Calcium, Ca)
<25th 0.049 2 -26 0 -1 7 3 4
25th - 50th 0.062 3 -20 0 0 6 0 2
50th - 75th 0.127 3 -22 1 2 5 -2 -3
75th - 100th 0.427 3 -24 0 3 6 0 -5
(Mg, mg/L) (Magnesium, Mg)
<25th 0.018 2 0 -2 10 15 -6 0
25th - 50th 0.029 2 -4 -3 8 11 -2 -1
50th - 75th 0.047 2 -8 -1 3 7 0 0
75th - 100th 0.090 2 -6 0 2 7 0 0
(Na, mg/L) (Sodium, Na)
<25th 0.090 3 -23 -1 1 8 -25 3
25th - 50th 0.206 3 -22 2 0 2 -23 0
50th - 75th 0.385 3 -14 6 3 8 -17 -3
75th - 100th 1.347 3 -9 6 3 7 -17 -3
(K, mg/L) (Potassium, K)
<25th 0.022 3 0 4 7 26 -7 -5
25th - 50th 0.028 3 0 3 4 20 -6 -5
50th - 75th 0.041 3 0 0 0 10 -6 1
75th - 100th 0.124 3 -8 0 0 7 -8 2
(NH4, mg/L) (Ammonium, NH4)
<25th 0.086 2 11 0 12 -2 -14 -1
25th - 50th 0.104 2 12 0 12 -7 -17 -1
50th - 75th 0.152 2 8 0 9 -1 -19 0
75th - 100th 0.376 3 3 1 8 -4 -19 -1
(Cl, mg/L) (Chloride, Cl)
<25th 0.092 3 1 -5 1 -1 12 0
25th - 50th 0.241 3 3 -3 4 -3 0 1
50th - 75th 0.678 3 4 1 4 -3 -1 -1
75th - 100th 2.283 3 1 0 2 -2 3 0

NADP Central Analytical Laboratory Readiness Verification Report
Page 15 of 85
Table 5. Median percent differences relative to most probable values by concentration quartile for 30
spiked natural matrix samples analyzed by six laboratories – Continued.
Median of Most Probable Values
(MPVs) in quartile
Concentration
range category
Median Relative Percent Difference from MPV
Laboratory
CIES ECST I-CAL W-CAL NRS WOOD
Percentiles (Br, mg/L) (Bromide, Br)
<25th 0.017 2 -27 0 19 81
25th - 50th 0.023 2 -13 -10 13 33
50th - 75th 0.032 2 -11 -6 6 22
75th - 100th 0.041 3 -5 -31 45 4
(NO3, mg/L) (Nitrate, NO3)
<25th 0.286 3 5 1 3 -2 -10 -1
25th - 50th 0.363 3 4 0 4 -2 -13 0
50th - 75th 0.472 3 5 0 4 -2 -7 -1
75th - 100th 0.890 3 5 1 4 -2 -7 -1
(SO4, mg/L) (Sulfate, SO4)
<25th 0.197 3 -19 -1 -2 0 13 9
25th - 50th 0.288 3 -14 -1 1 0 1 5
50th - 75th 0.337 3 -9 -3 2 -1 16 3
75th - 100th 0.580 3 -2 -2 2 -1 14 1
(PO4, mg/L) (Orthophosphate, PO4)
<25th 0.010 1 16 6 0 -62
25th - 50th 0.014 2 0 0 0 -56
50th - 75th 0.024 2 4 1 -1 -51
75th - 100th 0.147 3 0 0 0 -62
(H-ion, Eq/L) (Hydrogen-ion, H-ion)
<25th 1.738 na -74 -19 0 1 95
25th - 50th 4.074 na -71 -3 0 5 91
50th - 75th 7.244 na -70 -12 0 7 64
75th - 100th 8.710 na -69 -14 0 17 58
(SC S/cm) (Specific Conductance, SC)
<25th 4.0 2 -14 4 -3 4
25th - 50th 5.2 2 -10 2 -1 2
50th - 75th 6.1 2 -12 2 -2 3
75th - 100th 13.8 3 -10 0 0 1

NADP Central Analytical Laboratory Readiness Verification Report
Page 16 of 85
3.3.2 Precision Determined from Duplicate Spiked Natural Matrix Samples
Precision, a measure of data reproducibility, was evaluated using duplicates of the natural precipitation
samples. Duplicate samples were included in the PCQA Interlaboratory-Comparison Program, and they
were also included in the spiked natural matrix samples. Fifteen sets of duplicate samples were analyzed
by W-CAL for this analysis.
Median absolute percent differences (MAPD) were calculated for the duplicate samples for 3
concentration ranges: Low, Standard, and High, as shown below.
MAPD = Median{|(C1 – C2)/((C1+C2)/2)| ×100} (7)
where: MAPD = Median Absolute Percent Difference, C1 = concentration of original sample, and
C2=concentration of duplicate sample.
Criteria concentrations
strata Concentration range
Acceptance criteria: Maximum median absolute percent difference
(MAPD), all strata
Low (I-CAL NTN MDL) to (10 x I-CAL NTN MDL)
20 percent for specific conductance, and 10 percent for
all other analytes
Standard (10 x I-CAL NTN MDL) to (100 x I-CAL NTN MDL) and specific conductance < 10 uS/cm
High All hydrogen-ion concentrations, specific conductance > 10 uS/cm, and >100 x I-CAL NTN MDL
The data were analyzed using two methods for bromide and orthophosphate due to the high number of
values less than the MDLs (i.e. “censored values”). The first method substituted the detection limits for
the censored values, and the second method eliminated samples with at least one result less than the
MDL.
The results are presented in Table 6. Acceptable W-CAL precision was observed with 10 percent MAPD
or less for all analytes in the standard concentration range, except for hydrogen ion (16.1 percent MAPD).
In the low concentration range, W-CAL precision was acceptable for ammonium, specific conductance,
and orthophosphate (by MDL substitution method), but not for potassium (23 percent MAPD for only 2
samples) and bromide (116 percent for MDL substitution method). No other analytes were present in the
low concentration range.

NADP Central Analytical Laboratory Readiness Verification Report
Page 17 of 85
Table 6. W-CAL Median and overall absolute percent differences for 15 replicate samples by concentration-
ranges.
[Ca+2, calcium; Mg+2, magnesium; Na+, sodium; K+, potassium; NH4+, ammonium; Cl-, chloride; Br-(sub), bromide with detection
limit substituted for values less than detection limit; Br-(del), bromide with values less than the detection limit excluded; NO3-,
nitrate; SO4-2, sulfate; PO4-3(sub), phosphate with detection-limit substituted for values less than detection limit; PO4-3(del) with
values less than the detection limit excluded; SC, specific conductance; H+, hydrogen ion concentration in microequivalents per
liter; MDL, minimum detection limit; <, less than; <, less than or equal]
In the high concentration range, W-CAL precision was acceptable for calcium, magnesium, sodium,
chloride, nitrate, and sulfate with MAPDs less than 3 percent. No other analytes were present in the high
concentration range. Overall, W-CAL precision was acceptable for most analytes except for hydrogen
ion. A MAPD of 18 percent was determined for hydrogen ion, which was also shown to have high
variability relative to the other laboratories in the PCQA inter-laboratory-comparison program samples
(Table 4).
Low Concentration Range Standard Concentration Range High Concentration Range All Samples
Analyte
Number of
values
< 10 x MDL
Median
absolute
percent
differences
for Values <
10 x MDL
Number of
values where
10 x MDL<
reported
values < 100 x
MDL
Median
absolute
percent
difference for
10 x MDL <
reported
values < 100 x
MDL
Number of
values
where 100 x
MDL <
reported
values
Median
absolute
percent
difference
where 100 x
MDL < reported
Values
Overall
median
absolute
percent
differences
Ca+2 12 9.1 3 1.2 5
Mg+2 8 34 7 2.9 4.1
Na+ 3 20 12 2.6 3.5
K+ 2 23 13 8.8 10
NH4+ 3 6.2 12 3.2 4.7
Cl- 5 4.8 10 0.2 0.9
Br- (sub) 10 116 5 8.7 10
Br- (del) 1 0 5 8.7 6.7
NO3- 13 1.4 2 1.6 1.4
SO4-2 6 1.1 9 0.8 1
PO4-3
(sub) 6 0 9 0.0 0
PO4-3
(del) 0 na 1 na 1 na 31
SC 15 1.9 1.9
H+ 14 16.1 1 na 18

NADP Central Analytical Laboratory Readiness Verification Report
Page 18 of 85
3.3.3 Variability Determined from Spiked Natural Matrix Samples
Variability of W-CAL results for the spiked natural matrix samples was compared against five other
laboratories using the f-pseudosigma ratio (fps-ratio) (Table 7). The results indicate that W-CAL’s data
exhibited lower variability than overall for all analytes except calcium (fps-ratio=1.5) and chloride (fps-
ratio=1.22). For the 30 spiked natural matrix samples, the W-CAL had an f-psuedosigma ratio of 0.68 for
hydrogen ion, indicating lower than overall variability for the six laboratories that participated in the
study. This is in contrast to the results for duplicate samples of the same solution (Table 6), for which W-
CAL data exhibited a MAPD of 18 percent determined for hydrogen ion concentrations.
3.3.4 Analysis of Blanks
The W-CAL analyzed four DI water blank samples as part of the RVP – two samples from the PCQA
Interlaboratory-Comparison program and two blank samples from the spiked natural matrix sample study.
As prescribed in the RVP, the W-CAL blank data should result in:
• More than 50 percent of the values at concentrations less than the W-CAL NTN MDLs, and
• Less than 10 percent of the values at concentrations greater than or equal to three times the W-
CAL NTN MDLs.
The blank data were analyzed with the Not Above Detection Analysis (NADA) package in the R-Project
system, which provided summary statistics for the data censored at the W-CAL’s NTN MDLs. The
Kaplan -Meier methods were used to generate the results shown in Table 8. The results indicate that
mean concentrations for calcium, magnesium, sodium, potassium, and chloride in the blanks were greater
than the W-CAL NTN detection limits. However, the RVP goals, as defined above, were achieved.
This is a very small set of blanks for determination of bias due to contamination. More blank data will be
available at the end of calendar year 2018 for a better assessment.

NADP Central Analytical Laboratory Readiness Verification Report
Page 19 of 85
Table 7. Summary of relative variability for six laboratories based on f-pseudosigma ratios calculated for analyses of 30 spiked natural precipitation matrix
samples.
[f-pseudosigma ratio, ratio of each laboratory’s f-pseudosigma (f-psig) and the f-psig calculated for all laboratories combined, where f-psig = interquartile range of reported-minus-most
probable values/1.349; f-pseudosigma ratios greater than 1 indicated higher variability than overall (shading) and vise-versa; Ca+2, calcium; Mg+2, magnesium; Na+, sodium; K+,
potassium; NH4+, ammonium; Cl-, chloride; Br-, bromide with detection limit substituted for values less than detection limit; NO3-, nitrate; SO4-2, sulfate; PO4-3, phosphate with detection-
limit substituted for values less than detection limit; SC, specific conductance; H+, hydrogen-ion concentration from pH; Carey Institute for Ecological Studies; ECST, Environment and
Climate Change Canada Science and Technology Branch; I-CAL, NADP Central Analytical Laboratory at University of Illinois; W-CAL, NADP Central Analytical Laboratory at University
of Wisconsin; NRS, U.S. Forest Service, Northern Research Station; WOOD, Wood Group]
f-pseudosigma ratios
Analytes
Laboratory Ca+2 Mg+2 Na+ K+ NH4+ Cl- Br- NO3
- SO4-2 PO4
-3 SC H+
CIES 5.75 2.00 0.94 3.33 0.67 1.11 0.17 0.62 0.36 0.92 1.23 3.23
ECST 0.25 1.00 0.94 0.33 0.22 0.67
0.23 0.36
0.41
ICAL 0.75 1.00 0.47 0.33 0.67 1.78 1.83 0.69 0.43 1.23 0.46 <0.10
NRS 1.00 1.00 2.00 0.67 1.33 1.67 0.5 1.92 3.5 0.85
WCAL 1.50 1.00 1.00 0.33 1.00 1.22 0.83 0.31 0.36 0.85 0.31 0.68
WOOD 1.00 0 0.53 0.33 0.22 0.44
0.31 0.5
0.46 2.33

NADP Central Analytical Laboratory Readiness Verification Report
Page 20 of 85
Table 8. Summary statistics for 4 blank samples analyzed by the Central Analytical Laboratory at the University of Wisconsin (W-CAL), January-May,
2018.
[Ca, calcium; Mg, magnesium; Na, sodium; K, potassium; NH4, ammonium; Cl, chloride; Br, bromide with values less than the detection limit excluded; NO3, nitrate; SO4, sulfate; PO4 phosphate with values less than the detection limit excluded; H, hydrogen ion concentration in microequivalents per liter; SC, specific
conductance; <, less than; %, percent; mg/L, milligrams per liter; Eq/L, microequivalents per liter; S/cm, microsiemens per centimeter; N>detection, number of analyses with reported values greater than detection limit; <, less than; Mean by KM, mean calculated by Kaplan-Meier method; Stdev by KM, standard deviation calculated by Kaplan-Meier method; Median by KM, median calculated by Kaplan-Meier method; na, not applicable]
Ca Mg NA K NH4 Cl Br NO3 SO4 PO4 H SC
Statistic (mg/L) (mg/L) (mg/L) (mg/L) mg/L mg/L mg/L mg/L mg/L mg/L Eq/L S/cm
N > detection
limit 2 2 2 2 0 1 0 0 0 0 4 4
Mean by KM 0.002 0.002 0.001 0.004 <0.008 0.007 <0.002 <0.007 <0.002 <0.001 3.212 1.38
Stdev by KM 0 0 0 0 0 0 0 0 0 0 0.347 0.1
Median by KM 0.002 na na na na na na na na na 3.091 1.35

NADP Central Analytical Laboratory Readiness Verification Report
Page 21 of 85
3.4 W-CAL Bias Relative to I-CAL
A more comprehensive assessment of W-CAL bias relative to I-CAL results was achieved by analysis of
natural matrix split samples (“split” samples). For this study, the I-CAL split 100 NTN samples received
from the NTN during the spring of 2018. The 100 samples were comprised of 20 samples from each of 5
geographic regions shown in Figure 1 to ensure that most precipitation regimes (and therefore
chemistries) across the NTN were represented. If one or more geographic regions produced insufficient
volume of precipitation in time for execution of this plan, then precipitation from other regions were
substituted. After I-CAL retained the sample volume that it needed for primary analysis, potential
reanalysis, and archive, the unfiltered sample volume remaining in the NTN bottles was shipped to W-
CAL for independent filtration and chemical analysis. Split samples sent to the W-CAL had at least 100
mL. The W-CAL analyzed 75 of the 100 samples; saving the other 25 for future studies.
For comparison of bias and variability of bromide and orthophosphate, no values were substituted for
results reported by each laboratory that were less than the NTN MDLs (censored values). Instead, median
relative differences, in original units, and absolute and relative percent differences were calculated only
for sample pairs with values greater than the NTN MDLs for both laboratories.
Concentration and specific-conductance differences were calculated from the paired results as the W-
CAL measurement minus the I-CAL measurement for each sample. The sign test for a median was
conducted on the differences to test the null hypothesis that the median difference is equal to zero (i.e. no
bias between the laboratories) at the 5 percent significance level (=0.05). The sign test results are
summarized in Table 9. Significant bias between the laboratories, as indicated by the sign test (=0.05),
was apparent for all analytes except magnesium, bromide, sulfate, and phosphate. However, median
relative differences (MRDs) were less than two times the I-CAL NTN MDLs for all analytes except
nitrate (-0.029 mg/L). The MRDs were positive for calcium, sodium, potassium, bromide, and phosphate,
indicating generally higher W-CAL concentrations for these analytes. The MRDs were negative for
ammonium, chloride, nitrate, sulfate, hydrogen ion, and specific conductance, indicating lower
concentrations and specific conductance for W-CAL. Therefore, the differences are small and thus not of
any practical significance.
Acceptance criteria for bias using MRPDs are given in Section 3.2.1. The MRPDs were between -10%
and +10% for all analytes except potassium (11.5%), bromide (21%) and hydrogen ion (-12.2%). The
MAPD values for bromide and phosphate are much larger, 33% and 66%, respectively, because the
reported values are near the detection limits. While W-CAL results for the PCQA samples and spiked
natural matrix samples indicated higher hydrogen-ion concentrations for W-CAL compared to I-CAL (i.e.
lower W-CAL pH), the results were reversed for the 75 split samples, whereby I-CAL tended to report
lower pH values than W-CAL (See Appendix, Figure A-3).
Bias was evaluated by calculating MRDs, MAPDs, and MRPDs for each quartile range of concentration
and specific conductance for the 75 split samples. The results in Table 10 show that the MRPD increases
with decreasing concentration for analytes commonly observed at concentrations near the MDLs, such as
magnesium, potassium, ammonium, and phosphate, which is expected, and also for hydrogen ion and
specific conductance. Bias was always less than 10 percent MAPD for calcium, sodium, chloride,
nitrate, sulfate, and specific conductance across the entire concentration range tested. With respect to
hydrogen ion, bias is larger for the lower quartiles than for the upper quartiles.

NADP Central Analytical Laboratory Readiness Verification Report
Page 22 of 85
Table 9. Overall median relative bias and sign test results for comparison of 75 NADP split samples analyzed by the former Central Analytical
Laboratory (ICAL) at the University of Illinois and current CAL at the University of Wisconsin (WCAL).
[Ca, calcium; Mg, magnesium; Na, sodium; K, potassium; NH4, ammonium; Cl, chloride; Br, bromide with values less than the detection limit excluded; NO3, nitrate; SO4, sulfate; PO4 phosphate with values less than the detection limit excluded; H, hydrogen ion concentration in microequivalents per liter; SC, specific
conductance; <, less than; %, percent; mg/L, milligrams per liter; Eq/L, microequivalents per liter; S/cm, microsiemens per centimeter; p>=|M|, sign test result indicating probability of incorrectly deciding that the median WCAL-ICAL concentration difference is zero when true; highlighted values indicate statistically significant difference between median difference and zero; APD, absolute percent difference; RPD, relative (to ICAL measurement) percent difference; differences were calculated as WCAL value minus ICAL value; N, number of samples with both WCAL and ICAL values above their respective detection limits ]
Ca Mg NA K NH4 Cl Br NO3 SO4 PO4 H SC
Statistic (mg/L) (mg/L) (mg/L) (mg/L) mg/L mg/L mg/L mg/L mg/L mg/L Eq/L S/cm
Median
Difference
(units) 0.005 0 0.004 0.003 -0.008 -0.009 0.0015 -0.029 -0.003 0.0005 -0.175 -0.3
p-value for
p>=|M| <0.0001 0.3742 <0.0001 <0.0001 0.0027 <0.0001 0.375 <0.0001 0.2954 1 0.0002 <0.0001
Median APD
(%) 4.7 6.2 3.9 12 7.3 5.9 33 5.2 3 66 10 6.1
Median RPD
(%) 3.9 0.0 3.7 12 -4.4 -3.7 21 -5.3 -0.3 0.3 -12 -5.1
N samples 75 71 73 74 73 75 8 75 75 31 75 75

NADP Central Analytical Laboratory Readiness Verification Report
Page 23 of 85
Table 10. Median relative differences and median absolute and relative percent differences for analytes in 75 NADP split samples analyzed by the former
Central Analytical Laboratory (CAL) at the University of Illinois and current CAL at the University of Wisconsin calculated by concentration quartiles.
[Ca, calcium; Mg, magnesium; Na, sodium; K, potassium; NH4, ammonium; Cl, chloride; Br, bromide with values less than the detection limit excluded; NO3, nitrate; SO4, sulfate; PO4 orthophosphate with values less than the detection limit excluded; SC, specific conductance; H, hydrogen ion concentration in microequivalents per liter; <,
less than; %, percent; mg/L, milligrams per liter; Eq/L, microequivalents per liter; S/cm, microsiemens per centimeter; p>=|M|, sign test result indicating probability of incorrectly deciding that the median WCAL-ICAL concentration difference is zero when true; highlighted values indicate statistically significant difference between median difference and zero; MRD, median relative difference; MAPD, median absolute percent difference; MRPD, median relative (to ICAL measurement) percent difference; differences were calculated as WCAL value minus ICAL value; nd, no data]
Ca Mg Na K
Quartile range MRD
(mg/L) MAPD MRPD MRD
(mg/L) MAPD MRPD MRD
(mg/L) MAPD MRPD MRD
(mg/L) MAPD MRPD
<25th Percentile -0.001 5.0 -2.6 -0.002 18 -20 0 3.1 0 0.002 17 15
25th Percentile - Median 0.003 3.1 2.6 -0.002 7.6 -7.9 0.001 4.3 4.2 0.003 13 12
Median - 75th Percentile 0.010 5.6 5.5 0.000 2.3 0.0 0.010 3.9 3.9 0.005 12 11
>75th Percentile 0.039 6.7 6.5 0.006 6.5 6.3 0.030 5.0 4.8 0.010 11 10
NH4 Cl Br NO3
MRD (mg/L) MAPD MRPD
MRD (mg/L) MAPD MRPD
MRD (mg/L) MAPD MRPD
MRD (mg/L) MAPD MRPD
<25th Percentile -0.018 11 -11.3 0.002 6.2 5.9 nd nd nd -0.008 4.3 -4.2
25th Percentile - Median -0.011 5.0 -4.9 -0.003 4.5 -4.6 nd nd nd -0.024 5.4 -5.6
Median - 75th Percentile -0.005 5.8 -1.3 -0.018 7.2 -7.4 0.003 55 43 -0.042 6.2 -6.4
>75th Percentile 0.007 7.5 5.3 -0.035 3 -3.1 0 11 0 -0.051 4.5 -4.6
SO4 PO4 H SC
MRD (mg/L) MAPD MRPD
MRD (mg/L) MAPD MRPD
MRD
(Eq/L) MAPD MRPD
MRD
(S/cm) MAPD MRPD
<25th Percentile 0.008 7 6.7 -0.001 67 -100 -0.0766 23 -23 -0.2 6.9 -7.2
25th Percentile - Median -0.005 2.9 -1.2 -0.002 67 -100 -0.4104 27 -26 -0.3 6.2 -6.4
Median - 75th Percentile -0.006 2.1 -0.9 0.002 65 22 -0.1216 14 -3.5 -0.4 6.9 -6.9
>75th Percentile -0.009 1 -0.9 0.011 5.4 5.2 -0.4823 12 -4.7 -0.3 4.1 -1.8

NADP Central Analytical Laboratory Readiness Verification Report
Page 24 of 85
4.0 Assessment of Supplies and Routine Laboratory Operations
4.1 Supply Checks
4.1.1 Wet-Deposition (NTN and AIRMoN) Supplies
Analyte blank levels in washed new NTN and AIRMoN supplies were evaluated before they were
shipped to field sites or used in the W-CAL. All supplies including sampler buckets, bucket lids,
protective shipping bags, field sample bottles, laboratory sample bottles, filters, gloves, and brushes for
cleaning buckets and bottles were tested using Type 1 water rinses. Washed and reused NTN and
AIRMoN supply cleanliness was also tested using Type I water equipment rinseate blanks. The rinseate
quality-control samples were not filtered, irrespective of network. For this study, the I-CAL sent used,
unwashed supplies to the W-CAL for cleaning and subsequent testing. The W-CAL reported the
chemical analysis results for the supply rinseates to the PCQA for preparation of this report. The actual
concentration results are shown in the Appendix – a meta summary is provided below.
The acceptance criteria for new supplies was set such that analyte concentrations in the Type I water
rinseates should not be greater than the RVP minimum required NTN MDLs. For used supplies, rinseate
results should be no greater than the RVP minimum required MDLs + ½ the minimum required NTN
MDL. This deviated slightly from the criteria given in Table 1 for several reasons. The WCAL NTN
MDL studies were not completed until very late in the process of completing this RVP, therefore, criteria
had to be established to use for immediate assessment of supply cleanliness. Secondly, some of the NTN
MDLs that were later calculated did not meet RVP criteria and would not be appropriate benchmarks to
use as supply criteria. Third, in lieu of an unknown standard deviation for the used supplies it was decided
that the analyte concentrations must be less than 1.5 times the minimum required NTN MDL. For
example, the calcium required MDL was 0.006 mg/L, therefore the used supply criteria was established at
0.009 mg/L. Supply cleanliness was determined to be acceptable when more than 80 percent of the
values were less than the RVP minimum required MDLs and no more than 10 percent of the values were
at concentrations greater than or equal to 2 times the RVP minimum required MDLs. This metric is
derived from criteria presented in the 2016 I-CAL QA Report (Gartman, 2017, Table 14). The number of
samples that did not meet the criteria for cleanliness are summarized in Table 11, along with the total
number of each supply item tested. Many of the supplies were tested in numbers greater than the required
minimum, however while lack of availability for several supplies (i.e. rigid lids) limited the number that
could be evaluated in the very short time-frame available, therefore sample numbers were less than that
listed in the RVP.

NADP Central Analytical Laboratory Readiness Verification Report
Page 25 of 85
4.1.2 Ammonia Monitoring Network (AMoN) Supplies
Operational readiness for implementation of the AMoN program by the W-CAL was evaluated with
analyses of sampling supply blanks and laboratory air monitoring samples. Acceptance criteria for the
supply check samples for AMoN Radiello® bodies and cores and glass shipping jars are shown in the
Table below ( 75th percentile ammonium (NH4+) concentration limits) The results for the AMoN
performance-verification blanks are summarized in Tables 12a-12g.
Supply Type
75th Percentile NH4
+ Concentration Limit (mg/L)
Deionized Extraction Water <1.5 x MDL
AMoN Radiello® bodies 0.010
AMoN Radiello® cores 0.020
AMoN glass jars 0.010
Source: I-CAL 2016 Quality Assurance Report (Gartman, 2017)
All of the AMoN supplies blanks met the RVP criteria. Four supply preparation hood air-monitoring
blanks and one laboratory room air-monitoring blank had concentrations exceeding the RVP criteria
(Table 12e). Hood and room air monitoring provides information for determining sources of ammonia
contamination when supply-blank and trip-blank values exceed QC criteria. It will be important to
continue to monitor the hood and room air for ammonia and implement controls as needed. The W-CAL
AMoN dedicated processing room was not fully operational when the RVP was executed – e,g. the main
ammonia-scrubbing hood as well as the floor-standing ammonia-scrubbing unit were not in place at the
time of the air blank monitoring.

NADP Central Analytical Laboratory Readiness Verification Report
Page 26 of 85
Table 11. Analyte concentration measurements greater than acceptance criteria for Type I water equipment-rinse blanks.
[Cl, chloride; SO4, sulfate; Br, bromide NO3, nitrate; Cond, specific conductance; Ca, calcium; K, potassium; Mg, magnesium; Na, sodium; NH4, ammonium; PO4
orthophosphate; n, count; *, multiplication; >, greater than; %, percent; mg/L, milligrams per liter; S/cm, microsiemens per centimeter]

NADP Central Analytical Laboratory Readiness Verification Report
Page 27 of 85
Table 11. Continued

NADP Central Analytical Laboratory Readiness Verification Report
Page 28 of 85
Table 11. Continued

NADP Central Analytical Laboratory Readiness Verification Report
Page 29 of 85
Table 11. Concluded

NADP Central Analytical Laboratory Readiness Verification Report
Page 30 of 85
Table 12a. Results for AMoN supply check verification samples and blanks for W-CAL prepared samplers for 5/29/18, 6/12/18, and 6/26/18 deployments. [NH4+, ammonium; mg/L, milligrams per liter; W-CAL MDL, AMoN network MDL calculated for W-CAL; RVP, Readiness Verification Plan; Criteria values obtained from Gartman, 2017, Figure 12]
Sample Description NH4
+ (mg/L)
W-CAL MDL (mg/L)
RVP Criteria (mg/L)
Meets Criteria
Analysis Date
Type 1 Method Blanks – Extraction water
Method Blank - Type 1 water used for extractions 0.0015 <0.008 <0.01 Yes 5/15/2018
Method Blank - Type 1 water used for extractions 0.0005 <0.008 <0.01 Yes 5/15/2018
Method Blank - Type I Water used for extractions 0.0004 <0.008 <0.01 Yes 5/30/2018
Method Blank - Type 1 water for extractions 0.0030 <0.008 <0.01 Yes 6/7/2018
Method Blank - Type 1 water for extractions 0.0015 <0.008 <0.01 Yes 6/7/2018
Method Blank - Type 1 water for extractions 0.0024 <0.008 <0.01 Yes 6/12/2018
Type 1 Method Blanks – sonicator filling
Method Blank - Type 1 Water Used for filling
Sonicators 0.0007 <0.008 <0.01 Yes 5/15/2018
Method Blank - Type 1 Water Used for filling
Sonicators 0.0004 <0.008 <0.01 Yes 5/30/2018
Method Blank 1, Type 1 Water used for filling
sonicators 0.0027 <0.008 <0.01 Yes 5/30/2018
Method Blank - Type 1 Water Used for filling
Sonicators 0.0015 <0.008 <0.01 Yes 6/12/2018
Method Blank - Type 1 Water Used for filling
Sonicators -0.0016 <0.008 <0.01 Yes 6/12/2018

NADP Central Analytical Laboratory Readiness Verification Report
Page 31 of 85
Table 12b. Results for AMoN supply check verification samples and blanks for W-CAL prepared samplers for 5/29/18, 6/12/18, and 6/26/18 deployments. [NH4+, ammonium; mg/L, milligrams per liter; W-CAL MDL, AMoN network MDL calculated for W-CAL; RVP, Readiness Verification Plan; Criteria values obtained from Gartman, 2017, Figure 12; Bold, values are at or exceeding acceptance criteria]
Sample Description NH4
+ (mg/L)
W-CAL MDL (mg/L)
RVP Criteria (mg/L)
Meets Criteria Analysis
Date
Sonicator water testing
Sonicator water from each sonicator after final
preparation step 0.0070 <0.008
<0.01
(bodies) Yes 5/15/2018
Sonicator water from each sonicator after final
preparation step 0.0052 <0.008
<0.01
(bodies) Yes 5/15/2018
Sonicator water from each sonicator after final
preparation step 0.0120 <0.008
<0.01
(bodies) Yes 5/15/2018
Sonicator water from each sonicator after final
preparation step 0.0083 <0.008
<0.01
(bodies) Yes 5/15/2018
Sonicator water from each sonicator after final
preparation step 0.0021 <0.008
<0.01
(bodies) Yes 5/30/2018
Sonicator water from each sonicator after final
preparation step 0.0046 <0.008
<0.01
(bodies) Yes 5/30/2018
Sonicator water from each sonicator after final
preparation step 0.0033 <0.008
<0.01
(bodies) Yes 5/30/2018
Sonicator water from each sonicator after final
preparation step 0.0003 <0.008
<0.01
(bodies) Yes 5/30/2018
Sonicator water from each sonicator after final
preparation step 0.0013 <0.008
<0.01
(bodies) Yes 6/12/2018
Sonicator water from each sonicator after final
preparation step 0.0030 <0.008
<0.01
(bodies) Yes 6/12/2018
Sonicator water from each sonicator after final
preparation step 0.0006 <0.008
<0.01
(bodies) Yes 6/12/2018
Sonicator water from each sonicator after final
preparation step 0.0017 <0.008
<0.01
(bodies) Yes 6/12/2018

NADP Central Analytical Laboratory Readiness Verification Report
Page 32 of 85
Table 12c. Results for AMoN supply check verification samples and blanks for W-CAL prepared samplers for 5/29/18, 6/12/18, and 6/26/18 deployments. [NH4+, ammonium; mg/L, milligrams per liter; W-CAL MDL, AMoN network MDL calculated for W-CAL; RVP, Readiness Verification Plan; Criteria values obtained from Gartman, 2017, Figure 12; Bold, values are at or exceeding acceptance criteria]
Sample Description NH4
+ (mg/L)
W-CAL MDL (mg/L)
RVP Criteria (mg/L)
Meets Criteria
Analysis Date
New sampler shipping jars
Jar blank 1 - dishwasher batch -0.0009 <0.008 <0.01 Yes 5/15/2018
Jar blank dishwasher batch 3 0.0020 <0.008 <0.01 Yes 5/15/2018
Jar blank dishwasher batch 4 0.0027 <0.008 <0.01 Yes 5/15/2018
Jar blank dishwasher batch 6 0.0017 <0.008 <0.01 Yes 5/15/2018
Jar blank_5-24-18GJ 0.0008 <0.008 <0.01 Yes 5/30/2018
Jar blank_5-25-18GJA_NEW -0.0003 <0.008 <0.01 Yes 5/30/2018
Used and cleaned sampler shipping jars
Jar blank_5-25-18GJA_USED 0.0000 <0.008 <0.01 Yes 5/30/2018
Used jar blank 0.0003 <0.008 <0.01 Yes 6/12/2018
Used jar blank 0.0015 <0.008 <0.01 Yes 6/12/2018

NADP Central Analytical Laboratory Readiness Verification Report
Page 33 of 85
Table 12d. Results for AMoN supply check verification samples and blanks for W-CAL prepared samplers for 5/29/18, 6/12/18, and 6/26/18 deployments. [NH4+, ammonium; mg/L, milligrams per liter; W-CAL Target, AMoN network target value for W-CAL; RVP, Readiness Verification Plan; Criteria and target values obtained from Gartman, 2017, Figure 12; Bold, values are at or exceeding acceptance criteria]
Sample Description NH4
(mg/L)
W-CAL Target (mg/L)
RVP Criteria (mg/L)
Meets Criteria
Analysis Date
Sampler body preparation blanks, fully prepared and stored 24 hours or more in freezer before extraction
Prep blank from 5/8/18 Sonitor #8 batch 1 - assembled
body ECC and core in glass jar 0.0240 <0.03 NA Yes 5/15/2018
Prep blank 2 from Sonicator #16 batch 2 assembled
body EEM and core in glass jar 0.0260 <0.03 NA Yes 5/15/2018
Prep blank 3 from Sonitor #8 5/10/18 EFP - assembled
body and core in glass jar batch 3 0.0068 <0.03 NA Yes 5/15/2018
Prep blank 4 from Sonicator16 batch assembled body
EHJ and core in glass jar batch 4 0.0093 <0.03 NA Yes 5/15/2018
Prep body blank from batch 0521S8 0.0280 <0.03 NA Yes 5/30/2018
Prep Body Blank from batch 0521S16 0.0250 <0.03 NA Yes 5/30/2018
Prep Body Blank from batch 052318S8 0.0320 <0.03 NA Yes 5/30/2018
Prep Body Blank from batch 052318S16 0.0250 <0.03 NA Yes 5/30/2018
Prep Blank from batch: 060518S08 0.0330 <0.03 NA Yes 6/12/2018
Prep Blank from batch: 060518S16 0.0260 <0.03 NA Yes 6/12/2018
Prep Blank from batch: 060618S08 0.0280 <0.03 NA Yes 6/12/2018
Prep Blank from batch: 060618S16 0.0320 <0.03 NA Yes 6/12/2018
Body preparation tests, new and not cleaned
Body, new: not washed/cleaned; core added 5/23/18 0.0240 <0.03 NA Yes 5/30/2018
Body, new: not washed/cleaned; core added 5/23/18 0.0240 <0.03 NA Yes 5/30/2018
Body new: not washed/cleaned; core added 5/25/18 0.0330 <0.03 NA Yes 5/30/2018
Body, new: not washed/cleaned; core added 5/25/18 0.0250 <0.03 NA Yes 5/30/2018

NADP Central Analytical Laboratory Readiness Verification Report
Page 34 of 85
Table 12e. Results for AMoN supply check verification samples and blanks for W-CAL prepared samplers for 5/29/18, 6/12/18, and 6/26/18 deployments. [NH4+, ammonium; mg/L, milligrams per liter; W-CAL Target, AMoN network target value for W-CAL; RVP, Readiness Verification Plan; Criteria values obtained from Gartman, 2017, Figure 12; Bold, values are at or exceeding acceptance criteria]
Sample Description NH4
+ (mg/L)
W-CAL Target (mg/L)
RVP Criteria (mg/L)
Meets Criteria
Analysis Date
Hood air blanks, Room 200C
SAS hood blank (drying and extraction hood)
deployed 5/10/18 M - 5/14/18 normalized to 6 days 1.6760 <0.4 NA High 5/15/2018
Terra hood blank (sonicator hood)
deployed 5/10/18 - 5/14/18 normalized to 6 days 1.0668 <0.4 NA High 5/15/2018
Air Science hood, no shelter, 6 days deployed 0.1320 <0.4 NA Yes 5/25/2018
Air Science hood, sheltered 6 days 0.0770 <0.4 NA Yes 5/25/2018
SAS Hood sampler in shelter 6 days 0.7800 <0.4 NA High 5/25/2018
Air Science hood blank (in shelter) 14 day 5/28/18
13:50 to 6/11/18 9:00; normalized to 6 days 0.0630 <0.4 NA Yes 6/12/2018
SAS Hood Blank (in shelter) 14 day 5/28/18 13:50 to
6/11/18 9:06; normalized to 6 days 0.6220 <0.4 NA High 6/12/2018
Laboratory Room 200C air blanks
Room 200C Blank Deployed 5/10/18 - 5/14/18
normalized to 6 days 2.0760 <0.5 NA High 5/15/2018
Room 200C blank 6 days 0.3030 <0.5 NA Yes 5/25/2018
Room and Air Sci. Hood Blank - 4 days - 2 in Air
Science hood and 2 in room, Air Science hood (6/2 to
6/4), room (6/4 to 6/5) normalized to 6 days
0.1215 <0.5 NA Yes 6/7/2018
Room Blank 14 day 5/28/18 13:50 to 6/11/18 8:54;
normalized to 6 days 0.2820 <0.5 NA Yes 6/12/2018

NADP Central Analytical Laboratory Readiness Verification Report
Page 35 of 85
Table 12f. Results for AMoN supply check verification samples and blanks for W-CAL prepared samplers for 5/29/18, 6/12/18, and 6/26/18 deployments. [NH4+, ammonium; mg/L, milligrams per liter; W-CAL Target, AMoN network target value for W-CAL; RVP, Readiness Verification Plan; Criteria values obtained from Gartman, 2017, Figure 12; Bold, values are at or exceeding acceptance criteria]
Sample Description NH4
+ (mg/L)
W-CAL Target (mg/L)
RVP Criteria (mg/L)
Meets Criteria
Analysis Date
Extraction hood blanks
Extraction hood blank - extraction hood taken down
5/14/18 up 4 hours 0.0330 <0.03 NA Yes 5/15/2018
Hood blank during extractions 0.0240 <0.03 NA Yes 5/30/2018
Hood blank during extraction of co-located samplers 0.0350 <0.03 NA Yes 6/7/2018
Hood blank during extractions (6/11/18) 0.0330 <0.03 NA Yes 6/12/2018
Sampler core blanks
Core blank 1 - Lot# 18049 for sonicator batches
05091808 and 05091816 -0.0001 <0.02 <0.02 Yes 5/15/2015
Core blank 2 - Lot# 18049 for sonicator batches 1 and 2 -0.0083 <0.02 <0.02 Yes 5/15/2015
Core blank 3 - Lot# 18049 for sonicator batches 3 and 4 -0.0004 <0.02 <0.02 Yes 5/15/2015
Core blank 4 - Lot# 18013 Associated with sonicator
batches 3 and 4 -0.0039 <0.02 <0.02 Yes 5/15/2015
Core blank from 5/23/18 assembly; Lot: 18059B16 0.0250 <0.02 <0.02 Yes 5/30/2018
Core blank from 5/25/18 assembly; Lot: 18059B16 0.0230 <0.02 <0.02 Yes 5/30/2018
Core blank (Lot: 18115) 0.0160 <0.02 <0.02 Yes 6/7/2018
Core blank (Lot: 18115) 0.0150 <0.02 <0.02 Yes 6/7/2018
Core blank (Lot: 18115) 0.0190 <0.02 <0.02 Yes 6/7/2018
Core blank (Lot: 18115) 0.0250 <0.02 <0.02 Yes 6/7/2018
Core blank (Lot: 18049) 0.0190 <0.02 <0.02 Yes 6/7/2018
Core blank (Lot: 18049) 0.0200 <0.02 <0.02 Yes 6/7/2018
Core blank (Lot: 18095) 0.0230 <0.02 <0.02 Yes 6/7/2018

NADP Central Analytical Laboratory Readiness Verification Report
Page 36 of 85
Table 12g. Results for AMoN supply check verification samples and blanks for W-CAL prepared samplers for 5/29/18, 6/12/18, and 6/26/18 deployments. [NH4+, ammonium; mg/L, milligrams per liter; W-CAL MDL, AMoN network MDL calculated for W-CAL; RVP, Readiness Verification Plan; Criteria values obtained from Gartman, 2017, Figure 12]
Sample Description NH4
+ (mg/L)
W-CAL MDL (mg/L)
RVP Criteria (mg/L)
Meets Criteria
Analysis Date
New 10 milliliter dispenser blanks, not required by RVP
Dispenser Blank (Type 1 water dispensed) 0.0037 <0.008 NA Yes 5/30/2018
Dispenser Blank (Type 1 water dispensed) 0.0040 <0.008 NA Yes 5/30/2018
Dispenser Blank (Type 1 water dispensed) 0.0033 <0.008 NA Yes 5/30/2018
NADP Central Analytical Laboratory Readiness Verification Report
Page 37 of 85
4.2 Low-Volume Samples
The CAL commonly receives and must attempt to analyze low-volume (<50 mL) precipitation samples
for as many analytes as possible per a prioritized analyte list. Typically, samples are diluted, analyzed,
and then the concentrations are multiplied by the dilution factor. Analytes are prioritized as follows.
1. Ammonium (NH4+) and Orthophosphate (PO4
3-) – Highest priority
2. Anions (NO3-, SO4
2-, Cl-, Br-,)
3. Cations (Ca2+, Mg2+, Na+, K+)
4. pH
5. Specific Conductance – Lowest priority
When the sample volume is less than 15 mL, pH and(or) specific conductance measurements are not
performed.
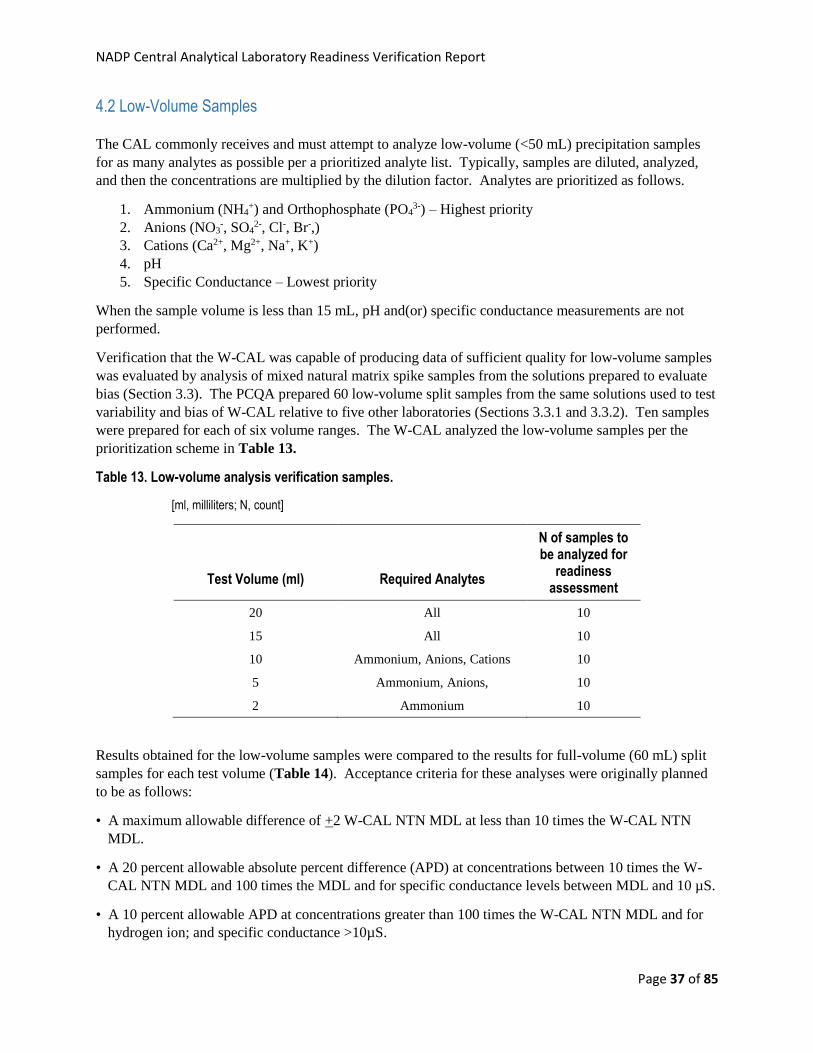
Verification that the W-CAL was capable of producing data of sufficient quality for low-volume samples
was evaluated by analysis of mixed natural matrix spike samples from the solutions prepared to evaluate
bias (Section 3.3). The PCQA prepared 60 low-volume split samples from the same solutions used to test
variability and bias of W-CAL relative to five other laboratories (Sections 3.3.1 and 3.3.2). Ten samples
were prepared for each of six volume ranges. The W-CAL analyzed the low-volume samples per the
prioritization scheme in Table 13.
Table 13. Low-volume analysis verification samples.
[ml, milliliters; N, count]
Test Volume (ml)
Required Analytes
N of samples to be analyzed for
readiness assessment
20 All 10
15 All 10
10 Ammonium, Anions, Cations 10
5 Ammonium, Anions, 10
2 Ammonium 10
Results obtained for the low-volume samples were compared to the results for full-volume (60 mL) split
samples for each test volume (Table 14). Acceptance criteria for these analyses were originally planned
to be as follows:
• A maximum allowable difference of +2 W-CAL NTN MDL at less than 10 times the W-CAL NTN
MDL.
• A 20 percent allowable absolute percent difference (APD) at concentrations between 10 times the W-
CAL NTN MDL and 100 times the MDL and for specific conductance levels between MDL and 10 µS.
• A 10 percent allowable APD at concentrations greater than 100 times the W-CAL NTN MDL and for
hydrogen ion; and specific conductance >10µS.

NADP Central Analytical Laboratory Readiness Verification Report
Page 38 of 85
However, it was later determined that percent difference relative to the MPVs would be more meaningful
than APD relative to the W-CAL’s analysis of the full-volume samples. This is a departure from the
original RVP metrics. The results presented in Table 14 reflect the updated RVP metric, i.e. low bias
with respect to the MPVs instead of high precision between standard and low sample volumes. Both are
important, but the former was judged more important than the later. The data may be analyzed further to
evaluate precision by APD if desired.
Table 14 shows the MRPDs for each sample-volume range along with results of the sign test for the null
hypothesis that the median difference is equal to zero. For this analysis, a statistically significant
difference was not equated to practical significance if median differences were less than or equal to the
W-CAL MDLs.
The results for low-volume samples indicate high MRPD for magnesium (volumes <19 mL),
ammonium (<14 mL), and nitrate (<10 mL). Higher MRPD was indicated for low-volume bromide
and orthophosphate analyses, but most NTN data for these analytes are censored below the detection
limit for samples with sufficient volume for analysis.

NADP Central Analytical Laboratory Readiness Verification Report
Page 39 of 85
Table 14. Summary of low-volume, natural matrix spike sample analyses for Readiness Verification Plan.
[Ca+2, calcium; Mg+2, magnesium; Na+, sodium; K+, potassium; NH4+, ammonium; Cl-, choride; Br-, bromide; NO3-, nitrate; SO4-2,
sulfate; PO4-3, orthophospate; SC, specific conductance, H+, hydrogen ion from pH; mg/L, milligrams per liter; mS/cm,
microsiemens per centimeter; mEq/L, microequivalents per liter; All differences are for reported value -minus- most probable
value where reported values were greater than the detection limits. Percent differences are calculated with respect to most
probable values. Highlighting indicates absolute values of median results are less than the detection limits. * indicates median
differences significantly different from zero by sign test at =0.05.]
Ca+2 Mg+2 Na+
Sample Volume
Range (mL) N
Median difference
(mg/L)
Median relative percent
difference N
Median difference
(mg/L)
Median relative percent
difference N
Median difference
(mg/L)
Median relative percent
difference
2 - 3 0 0 0 4 - 6 0 0 0
10 - 11 0 0 0 14 - 16 10 0.006 9.5 10 -0.006 -30 10 0.005 4.2
19 - 22 10 -0.003 -5.6 10 *-0.003 *-12 10 *0.024 *7.3
60 - 69 10 0.005 5.1 10 0.001 2.5 10 *0.019 *9.4
K+ NH4+ Cl-
N (mg/L) Percent N (mg/L) percent N (mg/L) percent
2 - 3 0 10 *-0.020 *-13 0 4 - 6 0 10 *-0.013 *-14 3 -0.042 -6.2
10 - 11 0 10 *-0.010 *-12 10 *-0.008 *-3.4
14 - 16 10 *0.008 *27 10 -0.001 -1.1 10 0.008 5.7
19 - 22 10 *0.005 *14 10 -0.007 -6.7 10 -0.013 -3.6
60 - 69 10 *0.007 *19 10 *-0.010 *-9.1 10 *-0.008 *-3.5
Br- NO3- SO4-2
N (mg/L) Percent N (mg/L) percent N (mg/L) percent
2 - 3 0 0 0 4 - 6 3 -0.006 -38 3 -0.309 -45 3 -0.006 -2.9
10 - 11 10 0 1.9 10 -0.005 -1.7 10 0 -0.1
14 - 16 7 *0.018 *61 10 -0.011 -2.7 10 0.008 2.8
19 - 22 8 *0.007 *56 10 -0.006 -1.5 10 -0.002 -0.6
60 - 69 10 0.001 7.3 10 -0.002 -0.3 10 *-0.002 *-0.6
PO4-3 SC H+
N (mg/L) Percent N (S/cm) percent N (Eq/L) percent
2 - 3 5 -0.013 -81 0 0 4 - 6 3 -0.005 -60 0 0
10 - 11 3 -0.004 -76 0 0 14 - 16 1 -0.003 -33 10 *-0.1 *-2.0 10 0 0
19 - 22 3 -0.005 -25 10 0 0 10 *0.806 *12
60 - 69 6 *-0.006 *-41 10 *-0.1 *-2.1 10 0.274 5.9

NADP Central Analytical Laboratory Readiness Verification Report
Page 40 of 85
5.0 AMoN Colocated Sampler Study
In addition to the evaluation described above for cleaning of the AMoN supplies, the overall readiness of
the W-CAL to begin AMoN implementation was evaluated using a colocated sampler study. Starting
with previously used supplies, the I-CAL and W-CAL both cleaned and packaged the supplies, and then
independently shipped them to 12 AMoN sites: CA83, CO13, IL11, KS31, MN02, NC30, NH02, NY67,
TN01, UT01, VT99, and WA99. Site operators were contacted in advance by the I-CAL to coordinate
their participation in the study. The laboratories recorded the blue body codes for each sampler for
tracking purposes. Data from MN02 were not included in the evaluation due to broken samplers that
were replaced but then deployed incorrectly.
Site operators received 2 passive samplers and 1 trip blank from both the I-CAL and W-CAL. Each
sampler was clearly identified by the laboratory that prepared and shipped it. Site operators deployed all
4 passive samplers simultaneously in their sampling shelters for a standard 2-week sampling period. The
trip blanks were stored in their respective jars/shipping boxes during the sampler deployment and not
opened. After the 2-week sampling period, the site operators retrieved the samplers from the shelters and
shipped each pair and their corresponding trip blanks back to the same laboratory that sent them, except
for MN02 as previously discussed. Each laboratory verified that they received the same samplers they
had prepared and shipped, back from the sites. The labs extracted the cores and analyzed the extract
solutions for ammonium concentration. Results for the environmental and trip-blank samples were
reported to PCQA as ammonium (mg/L) and as the calculated ambient air ammonium concentration
(g/m3).
The absolute percent differences for each colocated sample pair was calculated as:
Absolute Percent Difference (APD) = 100 × {|(NH3 W-CAL – NH3 I-CAL)| / [(NH3 W-CAL + NH3 I-CAL)]/2}, (8)
where: NH3 W-CAL = Average NH3 concentration of 2 samplers from W-CAL, and
NH3 I-CAL = Average NH3 concentration of 2 samplers from I-CAL.
The median APD for the 11 valid sample pairs was calculated. A median APD of 10 percent or less was
considered acceptable. For reference, the median APD for I-CAL triplicate samples in 2016 was 2.8
percent with a median relative standard deviation of 4.3 percent (Gartman, 2017). Therefore, 10 percent
median APD and MRPB are reasonable objectives for initial W-CAL performance. However, the
samples were collected in the spring, when ambient NH3 concentrations are low, presumably making a
low median APD more challenging. Median absolute percent differences (MAPD) were calculated for
the duplicate samples as follows.
Median Absolute Percent Difference (MAPD) = Median{|(C1 – C2)/((C1+C2)/2)| ×100} (9)
where: C1 = concentration of original sample, and C2=concentration of duplicate sample.
In addition, median relative percent bias (MRPB) values were calculated for each laboratory for NH4+ and
NH3 concentrations for the 11 duplicate samples. A MRPB less than or equal to +10 percent was
considered acceptable. Results for the AMoN colocated study are presented in Table 15, which indicate
an acceptable MRPB of -6.1 percent for W-CAL relative to I-CAL data. Acceptable precision was also
indicated by the MAPD of less than 3 percent for W-CAL and less than 6 percent for I-CAL.

NADP Central Analytical Laboratory Readiness Verification Report
Page 41 of 85
Table 15. Results for Ammonia Monitoring Network (AMoN) colocated study for the Readiness Verification
Plan.
[NH4+, ammonium; NH3, ammonia; mg/L, milligrams per liter; g/m3, micrograms per cubic meter, %, percent; I-CAL, National
Atmospheric Deposition Program Central Analytical Laboratory (CAL) at University of Illinois; W-CAL, CAL at Wisconsin State
Laboratory of Hygiene, University of Wisconsin; relative biases calculated as median of W-CAL minus I-CAL concentration
differences and percent bias is relative to I-CAL concentration]
Median absolute
difference of 11
duplicates (NH4+ , mg/L)
Median absolute
difference of 11
duplicates (NH3,
g/m3)
NH4+
Median absolute
difference of 11
duplicates (%)
NH3 Median
Absolute Difference
of 11 duplicates
()
NH4+
Median relative
bias between
laboratories (%)
NH3 Median relative
bias between
laboratories (%)
I-CAL 0.025 0.050 4.5 5.8
W-CAL 0.007 0.025 2.6 2.9 -6.1 -6.1
Trip Blanks
Median NH4
+ (mg/L)
Median NH3
(g/m3)
Median NH4
+ relative
bias (mg/L)
Median NH4
+ relative percent
bias (%)
I-CAL 0.059 0.12 W-CAL 0.060 0.12 -0.003 -4.1
Median trip blank concentrations of NH3 were identical for both labs at 0.12 g/m3, with a slight negative
bias of -4.1 percent for W-CAL. The RPV states that the W-CAL’s median trip-blank concentration may
not exceed the I-CAL’s 75th percentile trip-blank concentration for 2016, which was 0.058 mg/L. Both
laboratories slightly exceeded this criterion. Efforts will continue to push AMoN trip blank
concentrations as low as reasonably achievable.
6.0 Summary and Conclusions
This report documents the analytical performance of the Wisconsin State Laboratory of Hygiene at the
University of Wisconsin, Madison (W-CAL) as the new Central Analytical Laboratory (CAL) for the
NADP. Transition of NADP analytical operations from the former CAL at the University of Illinois (I-
CAL) required identification and quantification of potential bias between W-CAL and I-CAL results.
Performance metrics and acceptance criteria were established in a Readiness Verification Plan (RVP) a
priori.
Bias and variability (accuracy and precision) of W-CAL results was determined using samples that were
split with other laboratories, most importantly the I-CAL, for independent analysis and subsequent
comparison of the data obtained. Overall the W-CAL performance was determined to be acceptable for
analysis of NADP samples for the NTN, AIRMoN, and AMoN, per the RVP criteria. Nonetheless, biases

NADP Central Analytical Laboratory Readiness Verification Report
Page 42 of 85
between W-CAL and I-CAL were identified, that should be qualified in on-going W-CAL system QA
activities.
In the comparison of W-CAL to 10 other laboratories in the USGS PCQA interlaboratory-comparison
program, the results indicate positive biases in W-CAL concentrations for base cations: calcium,
magnesium, sodium, potassium, especially low-level magnesium and potassium, and for bromide, and
hydrogen ion (from pH). Negative biases were determined for W-CAL ammonium, chloride, and nitrate
concentrations and specific conductance. No bias was observed for W-CAL sulfate and phosphate
concentrations. The W-CAL data had lower variability than all of the laboratories combined for all
analytes except hydrogen ion (pH). Deionized water blank sample analyses indicated detections for base
cations and chloride, though statistical significance was limited by the very low number of blank samples.
Results for W-CAL might have been affected by storage of the performance-evaluation samples for 6
months prior to analysis.
Replicate sample analysis data indicated median precision within +10 percent for all analytes except
magnesium (34%), sodium (20%), and hydrogen ion (16%) in the standard concentration range, and
poorer precision for potassium (23%) and bromide (116%) in the low concentration range Comparison of
W-CAL and I-CAL analyses on split samples indicated statistically significant positive biases for
calcium, sodium, and potassium, and negative biases for ammonium, nitrate, hydrogen ion, and specific
conductance. Median relative percent differences (MRPDs) between W-CAL and I-CAL were within 10
percent for all analytes except for potassium (+12%) and bromide (+21%). The MRPDs increased with
decreasing concentration for magnesium, ammonium, sulfate, orthophosphate, hydrogen ion, and specific
conductance. For the lower 75 percent of split-sample concentrations, the median relative W-CAL -
minus- I-CAL differences (MRDs) were less than the 5th percentiles calculated for 2014-2016 NTN
concentrations, except for sodium (12th percentile), potassiumK (8th percentile), Chloride (6th percentile),
and hydrogen ion (9th percentile) (Appendix, Table A-1).
Type I water rinse blanks were analyzed to test W-CAL performance in the cleaning and processing of
NTN and AMoN field sampling supplies. The rinse solutions for NTN supplies generally demonstrate
adequate cleaning. Although the frequencies of detection for calcium, potassium, chloride, nitrate, and
sulfate were higher than expected, indicating potential sources of low-level contamination during the
period of evaluation, the supply cleaning areas were still under construction during the studies. Blanks
for AMoN supplies demonstrated acceptable cleaning. Although air monitoring indicated possible
sources of contamination in hood and laboratory room air, the AMoN laboratory was not fully operational
during the time of the study.
The W-CAL’s capabilities to analyze low-volume samples were tested. The results indicate high MRPD
for magnesium (volumes <19 mL), ammonium (<14 mL), and nitrate (<10 mL). Higher MRPD indicated
for low-volume bromide and orthophosphate analyses is negligible because most NTN data for these
analytes are censored below the detection limit for samples with sufficient volume for analysis.
Results of an AMoN colocated sampler study indicated nearly identical data collected by both I-CAL and
W-CAL for 11 sites. The W-CAL data had an acceptable median relative bias (-6.1%) with respect to I-
CAL AMoN data. Median trip blank concentrations were nearly identical for I-CAL and W-CAL with
median relative bias of -4.1% for the W-CAL data.

NADP Central Analytical Laboratory Readiness Verification Report
Page 43 of 85
7.0 References Hahn, G.J., and Meeker, W.Q., 1991, Statistical intervals—A guide for practitioners: New York,
John Wiley & Sons, 392 p.
Gartman, N., 2017, Quality Assurance Report, National Atmospheric Deposition Program, 2016, NADP
Central Analytical Laboratory, Champaign, IL., 65 p, accessed December 6, 2017 at
http://nadp.sws.uiuc.edu/lib/qa/cal_qar_2016.pdf.
Mueller, D.K., Schertz, T.L., Martin, J.D., and Sandstrom, M.W., 2015, Design, analysis, and
interpretation of field quality-control data for water-sampling projects: U.S. Geological Survey
Techniques and Methods, book 4, chap. C4, 54 p., http://dx.doi.org/10.3133/tm4C4.
National Atmospheric Deposition Program, 2014a, Guide for New NADP Initiatives, Version 1.2 -2014-
11, NADP Program Office, Champaign, IL, 9 p., accessed December 7, 2017 at
http://nadp.sws.uiuc.edu/lib/brochures/Guide_for_New_NADP_Initiatives_2014_11.pdf.
National Atmospheric Deposition Program, 2017, Quality Assurance Plan, Central Analytical Laboratory,
NADP QA Plan 2017-01, NADP Program Office, Champaign, IL, 28 p.
National Atmospheric Deposition Program, 2016a, Guidelines for Evaluation and Approval of Equipment
for the NADP Wet Deposition Networks, Version 1.1, NADP Program Office, Champaign, IL, 13 p.,
accessed December 7, 2017 at
http://nadp.sws.uiuc.edu/lib/manuals/Guidelines_for_Evaluation_and_Approval_of_Equipment.pdf.
National Atmospheric Deposition Program, 2016b, NADP Quality Management Plan, Version 1.8,
NADP Program Office, Champaign, IL, 31 p., accessed December 7, 2017 at http://nadp.sws.uiuc.edu/lib/qaplans/NADP_QMP.pdf.
Title 40 Code of Federal Regulations Part 136 - GUIDELINES ESTABLISHING TEST PROCEDURES
FOR THE ANALYSIS OF POLLUTANTS, Appendix B – Definition and Procedure for the
Determination of the Method Detection Limit - Revision 1.11, July 1, 2011.
U.S. Environmental Protection Agency (EPA), pre-2017, 40 CFR 136.2.
U.S. Environmental Protection Agency, 821-R-16-006 document, “Definition and Procedure for the
Determination of the Method Detection Limit”, Revision 2.
NADP, August 3, 2017, SOP DA-4065, Standard definitions for AMoN special study intercomparison
calculations.
Wetherbee, G.A., Martin, RA., 2014, U.S. Geological Survey External Quality-AssuranceProject Report
for the National Atmospheric Deposition Program / National Trends Network and Mercury Deposition
Network, 2011-12, NADP QA Report 2014-01, ISWS Miscellaneous Publication 202, 52 p.
Wetherbee, G.A. and Martin, RA., 2016a, External Quality Assurance Project Report for the National
Atmospheric Deposition Program’s National Trends Network and Mercury Deposition Network, 2013–
14, U.S. Geological Survey Scientific Investigations Report 2016-5069, 22 p.

NADP Central Analytical Laboratory Readiness Verification Report
Page 44 of 85
Wetherbee, G.A. and Martin, RA., 2016b, Updated Operational Protocols for the U.S. Geological Survey
Precipitation Chemistry Quality Assurance Project in Support of the National Atmospheric Deposition
Program, U.S. Geological Survey Open-File Report 2016-1213, 18 p.

NADP Central Analytical Laboratory Readiness Verification Report
Page 45 of 85
Appendix

NADP Central Analytical Laboratory Readiness Verification Report
Page 46 of 85
Figure A-1. Reported-minus-most probable value concentration differences for six laboratories in the
National Atmospheric Deposition Program Central Analytical Laboratory Readiness Verification Plan study
for calcium, magnesium, sodium, potassium, ammonium, and hydrogen ion in spiked natural solutions.

NADP Central Analytical Laboratory Readiness Verification Report
Page 47 of 85
Figure A-2. Reported-minus-most probable value concentration differences for six laboratories in the
National Atmospheric Deposition Program Central Analytical Laboratory Readiness Verification Plan study
for bromide, chloride, nitrate, sulfate, and specific conductance in spiked natural solutions.

NADP Central Analytical Laboratory Readiness Verification Report
Page 48 of 85
Figure A-3. W-CAL minus I-CAL concentration differences for 75 natural matrix split samples.
[Ca, calcium; Mg, magnesium; Na, sodium; K, potassium; NH4, ammonium; Cl, chloride; Br, bromide with values less
than the detection limit excluded; NO3, nitrate; SO4, sulfate; PO4, phosphate with values less than the detection limit
excluded; H, hydrogen ion concentration in microequivalents per liter (uEq/L); SC, specific conductance, in
microsiemens per centimeter (uS/cm); red line denotes zero difference]
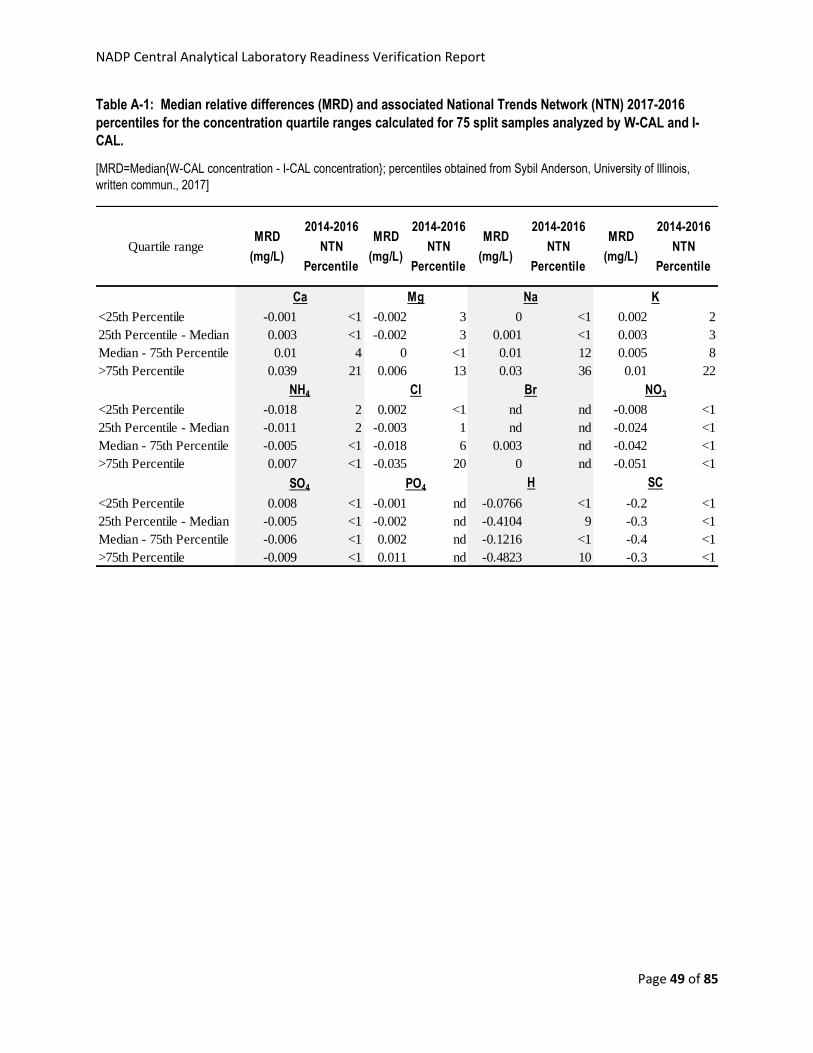
NADP Central Analytical Laboratory Readiness Verification Report
Page 49 of 85
Table A-1: Median relative differences (MRD) and associated National Trends Network (NTN) 2017-2016
percentiles for the concentration quartile ranges calculated for 75 split samples analyzed by W-CAL and I-
CAL.
[MRD=Median{W-CAL concentration - I-CAL concentration}; percentiles obtained from Sybil Anderson, University of Illinois,
written commun., 2017]
Quartile rangeMRD
(mg/L)
2014-2016
NTN
Percentile
MRD
(mg/L)
2014-2016
NTN
Percentile
MRD
(mg/L)
2014-2016
NTN
Percentile
MRD
(mg/L)
2014-2016
NTN
Percentile
<25th Percentile -0.001 <1 -0.002 3 0 <1 0.002 2
25th Percentile - Median 0.003 <1 -0.002 3 0.001 <1 0.003 3
Median - 75th Percentile 0.01 4 0 <1 0.01 12 0.005 8
>75th Percentile 0.039 21 0.006 13 0.03 36 0.01 22
<25th Percentile -0.018 2 0.002 <1 nd nd -0.008 <1
25th Percentile - Median -0.011 2 -0.003 1 nd nd -0.024 <1
Median - 75th Percentile -0.005 <1 -0.018 6 0.003 nd -0.042 <1
>75th Percentile 0.007 <1 -0.035 20 0 nd -0.051 <1
<25th Percentile 0.008 <1 -0.001 nd -0.0766 <1 -0.2 <1
25th Percentile - Median -0.005 <1 -0.002 nd -0.4104 9 -0.3 <1
Median - 75th Percentile -0.006 <1 0.002 nd -0.1216 <1 -0.4 <1
>75th Percentile -0.009 <1 0.011 nd -0.4823 10 -0.3 <1
SO4 PO4 H SC
Ca Mg Na K
NH4 Cl Br NO3

NADP Central Analytical Laboratory Readiness Verification Report
Page 50 of 85
Figure A-4. Mean I-CAL and W-CAL measured ammonium and calculated ammonia concentrations for
duplicate samples collected at 11 colocated Ammonia Monitoring Network sites, 2018.
[I-CAL, former NADP Central Analytical Laboratory (CAL) at the University of Illinois; W-CAL, new CAL at the
University of Wisconsin, red line denotes 1:1; Pr>=|M|, probability of incorrectly deciding that the median ICAL-minus-
WCAL difference is zero when true]

NADP Central Analytical Laboratory Readiness Verification Report
Page 51 of 85
Figure A-5. USGS Interlaboratory-Comparison Program preliminary control charts for calcium, 1 of 2.

NADP Central Analytical Laboratory Readiness Verification Report
Page 52 of 85
Figure A-6. USGS Interlaboratory-Comparison Program preliminary control charts for calcium, 2 of 2.

NADP Central Analytical Laboratory Readiness Verification Report
Page 53 of 85
Figure A-7. USGS Interlaboratory-Comparison Program preliminary control charts for magnesium, 1 of 2.

NADP Central Analytical Laboratory Readiness Verification Report
Page 54 of 85
Figure A-8. USGS Interlaboratory-Comparison Program preliminary control charts for magnesium, 2 of 2.

NADP Central Analytical Laboratory Readiness Verification Report
Page 55 of 85
Figure A-9. USGS Interlaboratory-Comparison Program preliminary control charts for sodium, 1 of 2.

NADP Central Analytical Laboratory Readiness Verification Report
Page 56 of 85
Figure A-10. USGS Interlaboratory-Comparison Program preliminary control charts for sodium, 2 of 2.

NADP Central Analytical Laboratory Readiness Verification Report
Page 57 of 85
Figure A-11. USGS Interlaboratory-Comparison Program preliminary control charts for potassium, 1 of 2.

NADP Central Analytical Laboratory Readiness Verification Report
Page 58 of 85
Figure A-12. USGS Interlaboratory-Comparison Program preliminary control charts for potassium, 2 of 2.

NADP Central Analytical Laboratory Readiness Verification Report
Page 59 of 85
Figure A-13. USGS Interlaboratory-Comparison Program preliminary control charts for chloride, 1 of 2.
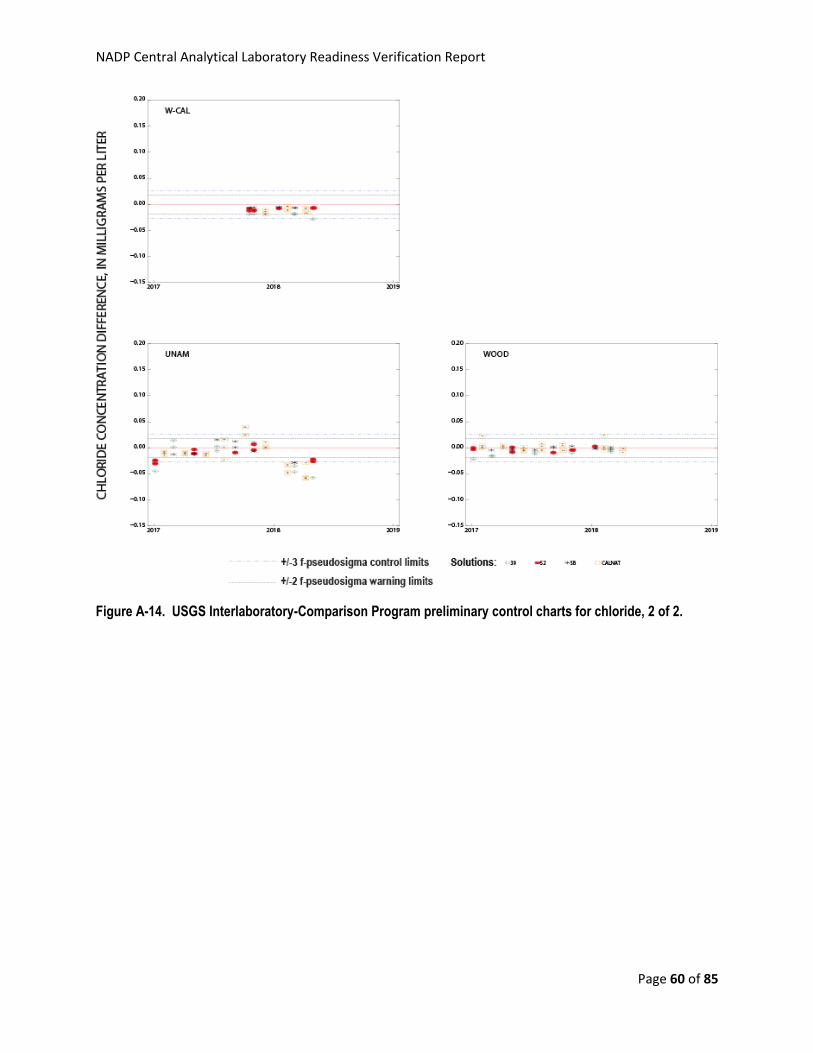
NADP Central Analytical Laboratory Readiness Verification Report
Page 60 of 85
Figure A-14. USGS Interlaboratory-Comparison Program preliminary control charts for chloride, 2 of 2.

NADP Central Analytical Laboratory Readiness Verification Report
Page 61 of 85
Figure A-15. USGS Interlaboratory-Comparison Program preliminary control charts for bromide.

NADP Central Analytical Laboratory Readiness Verification Report
Page 62 of 85
Figure A-16. USGS Interlaboratory-Comparison Program preliminary control charts for ammonium, 1 of 2.

NADP Central Analytical Laboratory Readiness Verification Report
Page 63 of 85
Figure A-17. USGS Interlaboratory-Comparison Program preliminary control charts for ammonium, 2 of 2.

NADP Central Analytical Laboratory Readiness Verification Report
Page 64 of 85
Figure A-18. USGS Interlaboratory-Comparison Program preliminary control charts for nitrate, 1 of 2.

NADP Central Analytical Laboratory Readiness Verification Report
Page 65 of 85
Figure A-19. USGS Interlaboratory-Comparison Program preliminary control charts for nitrate, 2 of 2.

NADP Central Analytical Laboratory Readiness Verification Report
Page 66 of 85
Figure A-20. USGS Interlaboratory-Comparison Program preliminary control charts for sulfate, 1 of 2.

NADP Central Analytical Laboratory Readiness Verification Report
Page 67 of 85
Figure A-21. USGS Interlaboratory-Comparison Program preliminary control charts for sulfate, 2 of 2.

NADP Central Analytical Laboratory Readiness Verification Report
Page 68 of 85
Figure A-22. USGS Interlaboratory-Comparison Program preliminary control charts for hydrogen ion, 1 of 2.

NADP Central Analytical Laboratory Readiness Verification Report
Page 69 of 85
Figure A-23. USGS Interlaboratory-Comparison Program preliminary control charts for hydrogen ion, 2 of 2.
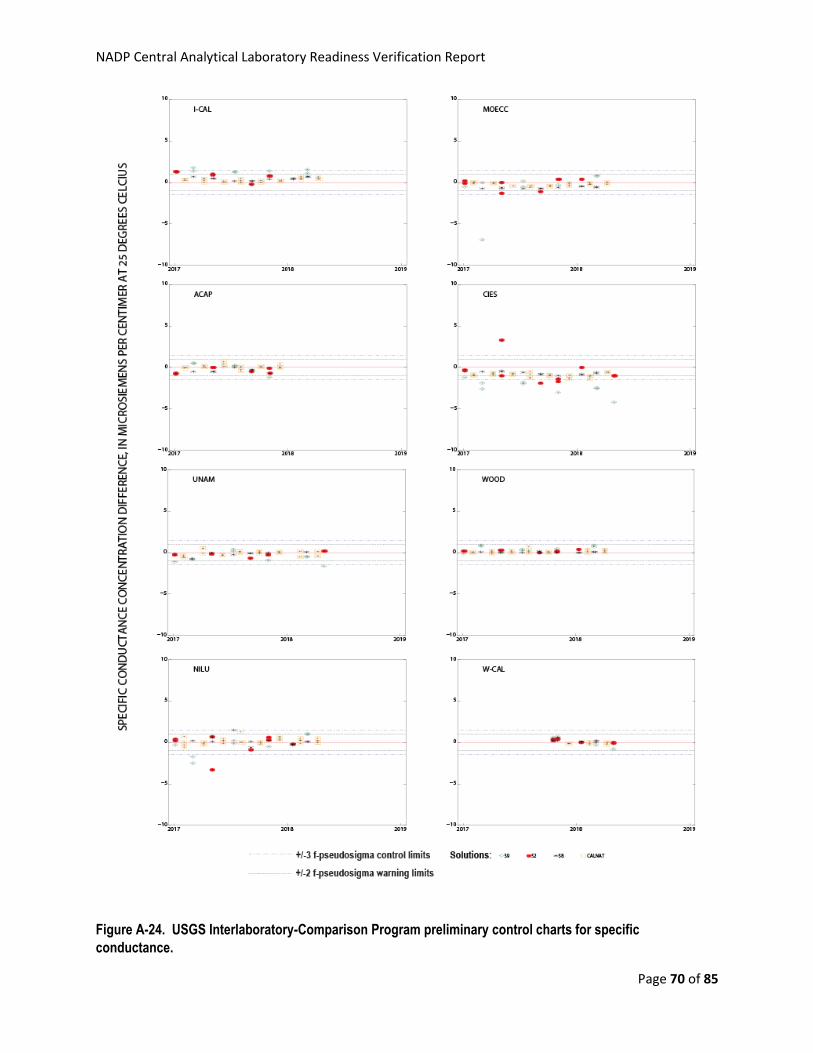
NADP Central Analytical Laboratory Readiness Verification Report
Page 70 of 85
Figure A-24. USGS Interlaboratory-Comparison Program preliminary control charts for specific
conductance.

NADP Central Analytical Laboratory Readiness Verification Report
Page 71 of 85
Quality Control Data Tables for W-CAL Supplies

NADP Central Analytical Laboratory Readiness Verification Report
Page 72 of 85
Cl SO4 Br NO3 pH Cond Ca K Mg Na NH4 PO4
mg/L mg/L mg/L mg/L S.U. µS/cm mg/L mg/L mg/L mg/L mg/L mg/L
Count WSLH ID Detail0.006 New
0.009 Used
0.007 new
0.010 used
0.006 New
0.009 Used
0.008 new
0.012 used NA >1.5
0.011 new
0.017 used
0.005 new
0.008 used
0.003 new
0.005 used
0.004 new
0.006 used
0.028 new
and used
0.008 new
0.012 used
1 SUQC231 Liter bottle
Blank Batch 1 1 liter New <0.002 <0.003 <0.002 <0.007 5.46 1.3 <0.001 <0.002 <0.0003 <0.0007 <0.008 <0.001
2 SUQC241 Liter bottle
Blank Batch 1 1 liter New <0.002 <0.003 <0.002 <0.007 5.50 1.2 <0.001 <0.002 <0.0003 <0.0007 <0.008 <0.001
3 SUQC251 Liter bottle
Blank Batch 1 1 liter New <0.002 <0.003 <0.002 <0.007 5.45 1.3 <0.001 0.002 <0.0003 <0.0007 <0.008 0.002
4 SUQC35 5/14/2018 1L 1 liter New <0.002 <0.003 <0.002 <0.007 5.60 1.2 0.004 0.004 0.0025 0.0012 <0.008 <0.001
5 SUQC36 5/14/2018 1L 1 liter New <0.002 <0.003 <0.002 <0.007 5.51 1.2 0.003 0.004 0.0025 0.0013 <0.008 <0.001
6 SUQC37 5/14/2018 1L 1 liter New 0.008 <0.003 <0.002 0.011 5.55 1.2 0.004 0.003 0.0025 0.0010 <0.008 <0.001
7 SUQC61 51518 1L 1 Liter 1 liter New 0.266 0.007 <0.002 <0.007 5.54 1.2 0.003 0.004 0.0025 0.0012 <0.008 <0.001
8 SUQC62 51518 1L 1 Liter 1 liter New <0.002 <0.003 <0.002 <0.007 5.55 1.3 0.003 0.004 0.0025 0.0011 <0.008 <0.001
9 SUQC63 51518 1L 1 Liter 1 liter New <0.002 <0.003 <0.002 <0.007 5.41 1.3 0.003 0.005 0.0025 0.0011 <0.008 <0.001
10 HMQC1 5/30/2018 1 liter New <0.002 <0.003 <0.002 <0.007 x 1.1 0.001 0.005 0.0009 0.0035 <0.008 <0.001
11 HMQC2 5/30/2018 1 liter New <0.002 <0.003 <0.002 <0.007 x 0.9 0.002 0.006 0.0009 0.0036 <0.008 <0.001
12 HMQC3 5/30/2018 1 liter New <0.002 <0.003 <0.002 <0.007 x 1.0 0.001 0.004 0.0008 0.0035 <0.008 <0.001
13 HMQC4 5/31/2018 1 liter New <0.002 <0.003 <0.002 <0.007 x 0.9 0.001 0.004 0.0009 0.0038 <0.008 <0.001
14 HMQC5 5/31/2018 1 liter New <0.002 <0.003 <0.002 <0.007 x 0.9 <0.001 0.004 0.0008 0.0038 <0.008 <0.001
1 liter New 2 0 0 1 0 0 1 0 0 0 0
1 liter New 1 0 0 0 0 0 0 0 0 0 0n = 14
# > Criterion
# > 1.5*Criterion
RVP Supply QC Summary
Acceptance CriteriaQC
ITEM
June 25 2018 Report

NADP Central Analytical Laboratory Readiness Verification Report
Page 73 of 85
Cl SO4 Br NO3 pH Cond Ca K Mg Na NH4 PO4
mg/L mg/L mg/L mg/L S.U. µS/cm mg/L mg/L mg/L mg/L mg/L mg/L
Count WSLH ID Detail0.006 New
0.009 Used
0.007 new
0.010 used
0.006 New
0.009 Used
0.008 new
0.012 used NA >1.5
0.011 new
0.017 used
0.005 new
0.008 used
0.003 new
0.005 used
0.004 new
0.006 used
0.028 new
and used
0.008 new
0.012 used
1 SUQC32 5/14/18 250 mL 250 mL <0.002 <0.003 <0.002 <0.007 5.36 1.4 0.004 0.004 0.0025 0.0011 <0.008 <0.001
2 SUQC33 5/14/18 250 mL 250 mL <0.002 <0.003 <0.002 <0.007 5.44 1.3 0.004 0.004 0.0025 0.0011 <0.008 <0.001
3 SUQC34 5/14/18 250 mL 250 mL <0.002 <0.003 <0.002 <0.007 5.40 1.2 0.003 0.004 0.0050 0.0025 <0.008 <0.001
4 SUQC64 51518 250 ml 250 mL <0.002 <0.003 <0.002 <0.007 5.41 1.2 0.003 0.004 0.0025 0.0011 <0.008 <0.001
5 SUQC65 51518 250 ml 250 mL <0.002 <0.003 <0.002 <0.007 5.45 1.3 0.003 0.004 0.0025 0.0010 <0.008 <0.001
6 SUQC66 51518 250 ml 250 mL 0.018 <0.003 <0.002 <0.007 5.49 1.2 0.003 0.004 0.0026 0.0012 <0.008 <0.001
7 HMQC6 5/25/2018 250 mL <0.002 <0.003 <0.002 <0.007 5.48 1.1 <0.001 <0.002 <0.0003 0.0014 <0.008 <0.001
8 HMQC7 5/25/2018 250 mL <0.002 <0.003 <0.002 0.009 5.55 1.1 <0.001 <0.002 <0.0003 <0.0007 <0.008 <0.001
9 HMQC8 5/25/2018 250 mL <0.002 <0.003 <0.002 <0.007 x 1.1 <0.001 <0.002 <0.0003 0.0011 <0.008 <0.001
10 HMQC9 5/30/2018 250 mL <0.002 <0.003 <0.002 <0.007 x 1.0 <0.001 0.004 0.0008 0.0040 <0.008 <0.001
11 HMQC10 5/30/2018 250 mL <0.002 <0.003 <0.002 <0.007 x 1.0 <0.001 0.004 0.0009 0.0036 <0.008 <0.001
250 mL New 1 0 0 1 0 0 0 1 0 0 0
250 mL New 1 0 0 0 0 0 0 1 0 0 0
Acceptance Criteria
n = 11# > Criterion
# > 1.5*Criterion
RVP Supply QC Summary
June 25 2018 Report
QC
ITEM

NADP Central Analytical Laboratory Readiness Verification Report
Page 74 of 85
Cl SO4 Br NO3 pH Cond Ca K Mg Na NH4 PO4
mg/L mg/L mg/L mg/L S.U. µS/cm mg/L mg/L mg/L mg/L mg/L mg/L
Count WSLH ID Detail0.006 New
0.009 Used
0.007 new
0.010 used
0.006 New
0.009 Used
0.008 new
0.012 used NA >1.5
0.011 new
0.017 used
0.005 new
0.008 used
0.003 new
0.005 used
0.004 new
0.006 used
0.028 new
and used
0.008 new
0.012 used
1 SUQC1760 mL bottle
blank Batch 1 60 Round New <0.002 <0.003 <0.002 <0.007 5.46 1.3 <0.001 <0.002 <0.0003 <0.0007 <0.008 <0.001
2 SUQC1860 mL bottle
blank Batch 1 60 Round New <0.002 <0.003 <0.002 <0.007 5.46 1.3 <0.001 <0.002 <0.0003 <0.0007 <0.008 <0.001
3 SUQC22 60 mL bottle
Batch 2 60 Round New <0.002 <0.003 <0.002 <0.007 5.59 1.2 <0.001 <0.002 <0.0003 <0.0007 <0.008 <0.001
4 SUQC295/10/18 60 mL
round 60 Round New 0.007 <0.003 <0.002 0.011 5.59 1.2 0.004 0.005 0.0050 0.0027 <0.008 <0.001
5 SUQC305/10/18 60 mL
round 60 Round New <0.002 <0.003 <0.002 <0.007 6.14 1.2 0.002 0.003 0.0025 0.0011 <0.008 <0.001
6 SUQC315/10/18 60 mL
round 60 Round New <0.002 <0.003 <0.002 <0.007 5.46 1.2 0.003 0.005 0.0025 0.0011 <0.008 <0.001
7 SUQC43 5/11/18 60 Round 60 Round New <0.002 <0.003 <0.002 0.013 5.63 1.2 0.002 0.003 0.0025 0.0013 <0.008 <0.001
8 SUQC93 5211860RB 60 Round New <0.002 <0.003 <0.002 <0.007 x 0.8 <0.001 <0.002 <0.0003 <0.0007 <0.008 <0.001
9 SUQC94 5211860RA 60 Round New <0.002 <0.003 <0.002 <0.007 x 0.8 <0.001 <0.002 <0.0003 <0.0007 <0.008 0.004
10 SUQC95 5211860RC 60 Round New <0.002 <0.003 <0.002 <0.007 x 0.7 <0.001 <0.002 <0.0003 <0.0007 <0.008 <0.001
11 SUQC103 5231860RC 60 Round New <0.002 <0.003 <0.002 <0.007 x 0.7 <0.001 0.002 <0.0003 <0.0007 <0.008 <0.001
12 SUQC104 5231860RA 60 Round New <0.002 <0.003 <0.002 0.011 x 0.7 <0.001 <0.002 <0.0003 <0.0007 <0.008 <0.001
13 SUQC105 5231860RC 60 Round New <0.002 <0.003 <0.002 <0.007 x 0.7 <0.001 <0.002 <0.0003 <0.0007 <0.008 <0.001
60 mL Round New 1 0 0 3 0 0 0 1 0 0 0
60 mL Round New 0 0 0 1 0 0 0 1 0 0 0
RVP Supply QC Summary
June 25 2018 Report
QC
ITEM
Acceptance Criteria
n = 13# > Criterion
# > 1.5*Criterion

NADP Central Analytical Laboratory Readiness Verification Report
Page 75 of 85
Cl SO4 Br NO3 pH Cond Ca K Mg Na NH4 PO4
mg/L mg/L mg/L mg/L S.U. µS/cm mg/L mg/L mg/L mg/L mg/L mg/L
Count WSLH ID Detail0.006 New
0.009 Used
0.007 new
0.010 used
0.006 New
0.009 Used
0.008 new
0.012 used NA >1.5
0.011 new
0.017 used
0.005 new
0.008 used
0.003 new
0.005 used
0.004 new
0.006 used
0.028 new
and used
0.008 new
0.012 used
1 SUQC265/10/18 60ml
square 60 Square New <0.002 <0.003 <0.002 <0.007 5.51 1.2 0.003 0.004 0.0025 0.0012 <0.008 <0.001
2 SUQC275/10/18 60ml
square 60 Square New <0.002 <0.003 <0.002 <0.007 5.60 1.3 0.003 0.003 0.0049 0.0026 <0.008 <0.001
3 SUQC285/10/18 60ml
square 60 Square New <0.002 <0.003 <0.002 <0.007 5.53 1.2 0.002 0.004 0.0025 0.0011 <0.008 <0.001
4 SUQC96 5231860SA 60 Square New <0.002 <0.003 <0.002 <0.007 x 0.9 <0.001 0.002 <0.0003 <0.0007 <0.008 <0.001
5 SUQC97 5231860SA 60 Square New <0.002 <0.003 <0.002 <0.007 x 0.7 <0.001 <0.002 <0.0003 <0.0007 <0.008 <0.001
6 SUQC98 5231860SA 60 Square New <0.002 <0.003 <0.002 <0.007 x 0.7 <0.001 <0.002 <0.0003 <0.0007 <0.008 <0.001
7 SUQC99 5231860SA 60 Square New <0.002 <0.003 <0.002 <0.007 x 0.8 <0.001 <0.002 <0.0003 <0.0007 <0.008 <0.001
8 SUQC100 5231860SB 60 Square New <0.002 <0.003 <0.002 <0.007 x 0.8 <0.001 <0.002 <0.0003 <0.0007 <0.008 <0.001
9 SUQC101 5231860SB 60 Square New <0.002 <0.003 <0.002 <0.007 x 0.8 <0.001 <0.002 <0.0003 <0.0007 <0.008 <0.001
10 SUQC102 5231860SB 60 Square New <0.002 <0.003 <0.002 <0.007 x 0.8 <0.001 <0.002 <0.0003 <0.0007 <0.008 <0.001
11 SUQC106 5231860SA 60 Square New <0.002 <0.003 <0.002 <0.007 x 0.8 <0.001 <0.002 <0.0003 <0.0007 <0.008 <0.001
12 SUQC120 6/1/2018 60 Square New <0.002 <0.003 <0.002 <0.007 x 0.9 <0.001 <0.002 <0.0003 <0.0007 <0.008 <0.001
60 mL Square New 0 0 0 0 0 0 0 1 0 0 0
60 mL Square New 0 0 0 0 0 0 0 1 0 0 0
Acceptance Criteria
n = 12# > Criterion
# > 1.5*Criterion
RVP Supply QC Summary
June 25 2018 Report
QC
ITEM

NADP Central Analytical Laboratory Readiness Verification Report
Page 76 of 85
Cl SO4 Br NO3 pH Cond Ca K Mg Na NH4 PO4
mg/L mg/L mg/L mg/L S.U. µS/cm mg/L mg/L mg/L mg/L mg/L mg/L
Count WSLH ID Detail0.006 New
0.009 Used
0.007 new
0.010 used
0.006 New
0.009 Used
0.008 new
0.012 used NA >1.5
0.011 new
0.017 used
0.005 new
0.008 used
0.003 new
0.005 used
0.004 new
0.006 used
0.028 new
and used
0.008 new
0.012 used
1 SUQC86 Air Mon ICAL Bag 1 AirMon Bag 0.008 0.009 <0.002 0.024 5.54 1.3 0.011 0.008 0.0029 0.0041 <0.008 <0.001
2 SUQC87 Air Mon ICAL Bag 2 AirMon Bag <0.002 <0.003 <0.002 0.021 5.48 1.4 0.004 0.004 0.0027 0.0011 <0.008 <0.001
3 SUQC88 Air Mon ICAL Bag 3 AirMon Bag 0.006 <0.003 <0.002 <0.007 5.35 1.2 0.003 0.005 0.0026 0.0012 <0.008 <0.001
4 HMQC11 5/25/2018 AirMon Bag <0.002 <0.003 <0.002 <0.007 5.63 1.1 <0.001 <0.002 <0.0003 0.0010 <0.008 <0.001
5 HMQC12 5/25/2018 AirMon Bag <0.002 <0.003 <0.002 <0.007 x 1.2 0.003 0.004 <0.0003 <0.0007 <0.008 <0.001
6 HMQC13 5/25/2018 AirMon Bag <0.002 <0.003 <0.002 <0.007 x 1.1 <0.001 <0.002 <0.0003 <0.0007 <0.008 <0.001
7 HMQC14 5/29/2018 AirMon Bag <0.002 <0.003 <0.002 <0.007 x 1.2 <0.001 <0.002 <0.0003 <0.0007 <0.008 <0.001
8 HMQC15 5/29/2018 AirMon Bag <0.002 <0.003 <0.002 <0.007 x 1.1 <0.001 <0.002 <0.0003 <0.0007 <0.008 <0.001
9 HMQC16 5/29/2018 AirMon Bag <0.002 <0.003 <0.002 <0.007 x 1.0 <0.001 <0.002 <0.0003 <0.0007 <0.008 <0.001
10 HMQC17 5/29/2018 AirMon Bag <0.002 <0.003 <0.002 <0.007 x 1.1 <0.001 <0.002 <0.0003 <0.0007 <0.008 <0.001
11 HMQC18 5/30/2018 AirMon Bag <0.002 <0.003 <0.002 <0.007 x 1.1 <0.001 0.003 0.0009 0.0037 <0.008 <0.001
AirMon Bag 1 1 0 2 0 0 1 0 0 0 0
AirMon Bag 0 0 0 2 0 0 1 0 0 0 0
1 SUQC395/11/18 Bottle
Brush 1st sample Bottle brush 0.060 0.807 0.012 0.118 6.55 6.3 0.008 0.104 0.0095 1.0593 0.097 0.035
2 SUQC495/11/18 Bottle
Brush 2nd sample Bottle brush 0.010 <0.003 0.016 <0.007 6.23 3.0 0.013 0.046 0.0191 0.4211 0.018 0.001
3 SUQC70511118 Bottle
Brush 3rd test Bottle brush 0.011 0.770 <0.002 0.022 4.90 4.9 0.066 0.059 0.1340 0.5408 <0.008 0.008
4 HMQC19 5/29/2018 Bottle brush 0.018 1.401 0.009 0.011 6.52 8.7 0.078 0.082 0.1466 1.0474 0.164 0.006
Bottle brush 4 3 3 3 4 3 4 4 4 2 1
Bottle brush 4 3 2 2 4 2 4 4 4 2 1
RVP Supply QC Summary
June 25 2018 Report
QC
ITEM
Acceptance Criteria
n = 11# > Criterion
# > 1.5*Criterion
n = 4# > Criterion
# > 1.5*Criterion

NADP Central Analytical Laboratory Readiness Verification Report
Page 77 of 85
Cl SO4 Br NO3 pH Cond Ca K Mg Na NH4 PO4
mg/L mg/L mg/L mg/L S.U. µS/cm mg/L mg/L mg/L mg/L mg/L mg/L
Count WSLH ID Detail0.006 New
0.009 Used
0.007 new
0.010 used
0.006 New
0.009 Used
0.008 new
0.012 used NA >1.5
0.011 new
0.017 used
0.005 new
0.008 used
0.003 new
0.005 used
0.004 new
0.006 used
0.028 new
and used
0.008 new
0.012 used
1 SUQC385/11/18 Bucket
Brush 1st sample Bucket Brush 0.014 <0.003 <0.002 0.022 6.09 2.3 0.019 0.006 0.0037 0.0071 0.206 <0.001
2 SUQC6951118Bucket
Brush 3rd test Bucket Brush 0.009 <0.003 <0.002 0.017 1.50 1.5 0.012 0.007 0.0030 0.0037 0.086 0.001
3 HMQC20 5/29/2018 Bucket Brush 0.022 1.484 <0.002 <0.007 6.67 9.7 0.101 0.111 0.2295 1.1321 0.164 <0.001
Bucket Brush 3 1 0 2 2 2 3 1 2 3 0
Bucket Brush 2 1 0 2 2 1 1 1 2 3 0
1 SUQC46Bucket Lid A
5/14/18 Bucket Lid New Superseal 0.012 0.012 <0.002 0.023 5.62 1.5 0.024 0.030 0.0037 0.0085 0.009 <0.001
2 SUQC47Bucket Lid B
5/14/18 Bucket Lid New Superseal 0.007 0.010 <0.002 0.083 5.47 1.3 0.016 0.010 0.0028 0.0037 <0.008 <0.001
3 HMQC21 5/30/2018 Bucket Lid New Superseal <0.002 <0.003 <0.002 <0.007 x 1.1 0.002 0.004 0.0010 0.0038 <0.008 <0.001
4 HMQC22 5/30/2018 Bucket Lid New Superseal <0.002 <0.003 <0.002 <0.007 x 1.1 0.004 0.005 0.0012 0.0039 <0.008 <0.001
5 HMQC23 5/30/2018 Bucket Lid New Superseal 0.008 <0.003 <0.002 <0.007 x 1.1 0.007 0.005 0.0010 0.0038 <0.008 <0.001
6 HMQC24 5/30/2018 Bucket Lid New Superseal <0.002 0.020 <0.002 0.011 x 1.1 0.037 0.006 0.0018 0.0048 <0.008 <0.001
7 HMQC25 6/1/2018 Bucket Lid New Superseal 0.010 1.102 0.006 0.014 5.94 4.5 0.660 0.003 0.0099 0.0014 0.017 <0.001
8 HMQC26 6/1/2018 Bucket Lid New Superseal 0.021 1.694 <0.002 0.013 6.37 6.9 1.190 0.005 0.0157 0.0124 <0.008 0.001
9 HMQC27 6/1/2018 Bucket Lid New Superseal 0.011 0.465 <0.002 0.013 5.82 2.5 0.291 0.004 0.0050 0.0023 <0.008 <0.001
Bucket Lid New Superseal 6 6 0 6 3 6 3 3 3 0 0
Bucket Lid New Superseal 3 5 0 5 3 5 2 2 2 0 0
RVP Supply QC Summary
June 25 2018 Report
QC
ITEM
Acceptance Criteria
n = 3# > Criterion
# > 1.5*Criterion
n = 9# > Criterion
# > 1.5*Criterion

NADP Central Analytical Laboratory Readiness Verification Report
Page 78 of 85
Cl SO4 Br NO3 pH Cond Ca K Mg Na NH4 PO4
mg/L mg/L mg/L mg/L S.U. µS/cm mg/L mg/L mg/L mg/L mg/L mg/L
Count WSLH ID Detail0.006 New
0.009 Used
0.007 new
0.010 used
0.006 New
0.009 Used
0.008 new
0.012 used NA >1.5
0.011 new
0.017 used
0.005 new
0.008 used
0.003 new
0.005 used
0.004 new
0.006 used
0.028 new
and used
0.008 new
0.012 used
1 HMQC30 6/1/2018 Bucket Lids Used Flids 0.008 0.017 0.007 0.013 x 1.6 0.017 <0.002 <0.0003 <0.0007 0.133 <0.001
2 HMQC31 6/1/2018 Bucket Lids Used Flids 0.008 0.030 <0.002 0.047 x 1.3 0.033 0.011 <0.0003 0.0019 0.037 <0.001
3 HMQC32 6/1/2018 Bucket Lids Used Flids 0.007 0.013 <0.002 0.012 x 1.2 0.006 <0.002 <0.0003 <0.0007 0.037 <0.001
4 HMQC33 6/5/2018 Bucket Lids Used Flids 0.007 <0.003 <0.002 0.012 x 1.5 0.003 <0.002 <0.0003 <0.0007 0.180 <0.001
5 HMQC34 6/5/2018 Bucket Lids Used Flids 0.007 0.012 <0.002 0.013 x 1.3 0.011 <0.002 <0.0003 <0.0007 0.113 <0.001
6 HMQC35 6/5/2018 Bucket Lids Used Flids 0.011 0.005 <0.002 0.019 x 1.5 0.008 0.003 <0.0003 <0.0007 0.161 <0.001
7 HMQC36 6/5/2018 Bucket Lids Used Flids 0.013 0.010 <0.002 0.020 x 1.2 0.009 0.005 <0.0003 0.0023 0.081 <0.001
8 HMQC37 6/6/2018 Bucket Lids Used Flids 0.007 0.003 <0.002 0.012 x 1.1 0.002 <0.002 <0.003 <0.0007 0.018 <0.001
9 HMQC38 6/6/2018 Bucket Lids Used Flids 0.014 0.007 <0.002 0.016 x 1.2 0.006 0.004 <0.003 0.0043 0.011 <0.001
10 HMQC39 6/6/2018 Bucket Lids Used Flids 0.011 0.007 0.007 0.016 x 1.2 0.006 <0.002 <0.003 0.0017 <0.008 <0.001
Bucket Lids Used Flids 4 4 0 6 1 1 1 0 0 7 0
Bucket Lids Used Flids 2 2 0 3 0 1 0 0 0 5 0
1 HMQC40 5/29/2018 Bucket Lids Used Rigid 0.011 0.018 <0.002 0.019 x 1.3 0.012 0.003 <0.0003 0.0029 0.084 <0.001
2 HMQC41 5/29/2018 Bucket Lids Used Rigid 0.012 0.017 <0.002 0.073 x 1.5 0.017 0.025 <0.0003 0.0101 0.058 <0.001
3 HMQC42 5/29/2018 Bucket Lids Used Rigid <0.002 0.004 <0.002 <0.007 x 1.3 <0.001 0.003 <0.0003 0.0012 0.039 <0.001
Bucket Lids Used Rigid 2 2 0 2 0 0 1 0 1 3 0
Bucket Lids Used Rigid 0 2 0 1 0 0 1 0 0 2 0
RVP Supply QC Summary
June 25 2018 Report
QC
ITEM
Acceptance Criteria
n = 10# > Criterion
# > 1.5*Criterion
n = 3# > Criterion
# > 1.5*Criterion

NADP Central Analytical Laboratory Readiness Verification Report
Page 79 of 85
Cl SO4 Br NO3 pH Cond Ca K Mg Na NH4 PO4
mg/L mg/L mg/L mg/L S.U. µS/cm mg/L mg/L mg/L mg/L mg/L mg/L
Count WSLH ID Detail0.006 New
0.009 Used
0.007 new
0.010 used
0.006 New
0.009 Used
0.008 new
0.012 used NA >1.5
0.011 new
0.017 used
0.005 new
0.008 used
0.003 new
0.005 used
0.004 new
0.006 used
0.028 new
and used
0.008 new
0.012 used
1 HMQC 117 6/5/2018 Bucket Lids Used Superseal 0.009 0.012 <0.002 0.029 x 1.2 0.003 0.006 <0.0003 <0.0007 0.058 <0.001
2 HMQC 118 6/5/2018 Bucket Lids Used Superseal <0.002 0.011 0.010 0.014 x 1.1 <0.001 <0.002 <0.0003 <0.0007 0.055 <0.001
3 HMQC 119 6/5/2018 Bucket Lids Used Superseal <0.002 0.024 <0.002 0.032 x 1.2 0.011 0.007 <0.0003 <0.0007 0.048 <0.001
Bucket Lids Used Superseal 0 3 1 3 0 0 0 0 0 3 0
Bucket Lids Used Superseal 0 1 0 2 0 0 0 0 0 3 0
1 SUQC44 Bucket A 5/14/18 Bucket New <0.002 <0.003 <0.002 <0.007 5.59 1.2 0.004 0.004 0.0025 0.0011 <0.008 <0.001
2 HMQC50 5/25/2018 Bucket New <0.002 0.003 <0.002 <0.007 5.56 1.1 <0.001 <0.002 <0.0003 <0.0007 0.016 <0.001
3 HMQC51 5/25/2018 Bucket New <0.002 <0.003 <0.002 <0.007 x 1.1 <0.001 <0.002 <0.0003 <0.0007 0.017 <0.001
4 HMQC52 5/25/2018 Bucket New <0.002 <0.003 <0.002 <0.007 x 1.2 <0.001 <0.002 <0.0003 <0.0007 0.018 <0.001
5 HMQC53 5/31/2018 Bucket New <0.002 <0.003 <0.002 0.010 x 1.0 0.017 0.005 0.0021 0.0046 <0.008 <0.001
6 HMQC54 5/31/2018 Bucket New <0.002 <0.003 <0.002 <0.007 x 1.0 0.009 0.004 0.0010 0.0040 <0.008 <0.001
7 HMQC55 5/31/2018 Bucket New <0.002 <0.003 <0.002 <0.007 x 1.0 0.002 0.004 0.0009 0.0038 <0.008 0.001
8 HMQC56 5/31/2018 Bucket New <0.002 <0.003 <0.002 <0.007 x 1.0 0.003 0.005 0.0009 0.0053 <0.008 <0.001
9 HMQC57 6/1/2018 Bucket New 0.008 <0.003 <0.002 <0.007 x 1.0 0.001 <0.002 <0.0003 <0.0007 <0.008 <0.001
10 HMQC58 6/1/2018 Bucket New <0.002 <0.003 <0.002 <0.007 x 1.0 <0.001 <0.002 <0.0003 <0.0007 <0.008 <0.001
Bucket New 1 0 0 1 0 1 0 0 2 0 0
Bucket New 0 0 0 0 0 1 0 0 0 0 0
RVP Supply QC Summary
June 25 2018 Report
QC
ITEM
Acceptance Criteria
n = 10# > Criterion
# > 1.5*Criterion
n = 3# > Criterion
# > 1.5*Criterion

NADP Central Analytical Laboratory Readiness Verification Report
Page 80 of 85
Cl SO4 Br NO3 pH Cond Ca K Mg Na NH4 PO4
mg/L mg/L mg/L mg/L S.U. µS/cm mg/L mg/L mg/L mg/L mg/L mg/L
Count WSLH ID Detail0.006 New
0.009 Used
0.007 new
0.010 used
0.006 New
0.009 Used
0.008 new
0.012 used NA >1.5
0.011 new
0.017 used
0.005 new
0.008 used
0.003 new
0.005 used
0.004 new
0.006 used
0.028 new
and used
0.008 new
0.012 used
1 SUQC9
Type 1 water New
PALL after FR50
and clean Filter 0.007 <0.003 <0.002 0.008 5.44 1.6 <0.001 0.002 <0.0003 <0.0007 <0.008 <0.001
2 SUQC10Type 1 water New
PALL Filter <0.002 <0.003 <0.002 <0.007 5.53 1.2 <0.001 <0.002 <0.0003 <0.0007 <0.008 <0.001
22 SUQC11Type 1 water New
PALL Filter 0.008 <0.003 <0.002 <0.007 5.67 1.2 0.002 <0.002 <0.0003 <0.0007 <0.008 <0.001
3 SUQC12Type 1 water New
PALL Filter 0.006 <0.003 <0.002 <0.007 5.60 1.2 <0.001 <0.002 <0.0003 <0.0007 <0.008 <0.001
4 SUQC53 PALL Filter Blank Filter <0.002 <0.003 <0.002 <0.007 5.56 1.2 0.004 0.004 0.0025 0.0010 <0.008 <0.001
5 SUQC54 PALL Filter Blank Filter 0.007 0.008 <0.002 <0.007 5.56 1.2 0.005 0.004 0.0026 0.0018 <0.008 <0.001
6 SUQC55 PALL Filter Blank Filter 0.007 <0.003 <0.002 <0.007 5.50 1.2 0.006 0.005 0.0026 0.0012 <0.008 <0.001
7 SUQC56 PALL Filter Blank Filter 0.008 <0.003 <0.002 0.011 5.50 1.2 0.007 0.005 0.0027 0.0020 <0.008 <0.001
8 SUQC71 PALL Old Box Filter <0.002 <0.003 <0.002 <0.007 5.58 1.1 0.003 0.005 0.0026 0.0017 <0.008 <0.001
9 SUQC72 PALL Old Box Filter <0.002 <0.003 <0.002 <0.007 5.47 1.3 0.003 0.005 0.0025 0.0011 <0.008 <0.001
10 SUQC73PALL 5/8/18 Open
Box Filter <0.002 <0.003 <0.002 <0.007 5.52 1.1 0.003 0.004 0.0025 0.0011 <0.008 <0.001
11 SUQC74PALL 5/8/18 Open
Box Filter <0.002 <0.003 <0.002 <0.007 5.54 1.1 0.003 0.005 0.0025 0.0011 <0.008 <0.001
12 SUQC75PALL 5/8/18 Open
Box Filter 0.007 <0.003 <0.002 0.016 5.56 1.2 0.003 0.003 0.0025 0.0012 <0.008 <0.001
13 SUQC76PALL 5/17/18
Open Box Filter <0.002 <0.003 <0.002 <0.007 5.52 1.2 0.003 0.004 0.0025 0.0012 <0.008 <0.001
14 SUQC77PALL 5/17/18
Open Box Filter <0.002 <0.003 <0.002 <0.007 5.53 1.1 0.003 0.004 0.0026 0.0011 <0.008 <0.001
15 SUQC78PALL 5/17/18
Open Box Filter <0.002 <0.003 <0.002 <0.007 5.41 1.2 0.003 0.005 0.0025 0.0009 <0.008 <0.001
16 SUQC89PALL Filter Blank
open 5/17/18 Filter 0.011 0.012 <0.002 0.013 x 0.9 0.005 0.002 <0.0003 <0.0007 <0.008 <0.001
17 SUQC90PALL Filter Blank
open 5/17/19 Filter 0.010 0.017 <0.002 0.008 x 0.9 0.007 <0.002 <0.0003 <0.0007 <0.008 <0.001
18 SUQC91PALL Filter Blank
open 5/17/20 Filter 0.010 0.015 <0.002 <0.007 x 0.9 0.008 0.002 <0.0003 <0.0007 <0.008 <0.001
19 SUQC92PALL Filter Blank
open 5/17/21 Filter <0.002 <0.003 <0.002 <0.007 x 0.9 0.001 <0.002 <0.0003 <0.0007 <0.008 <0.001
20 SUQC122filter blank before
samples Filter <0.002 <0.003 <0.002 <0.007 x 1.0 <0.001 <0.002 <0.0003 <0.0007 <0.008 <0.001
21 SUQC123filter blank after
samples Filter 0.006 <0.003 <0.002 <0.007 x 1.0 <0.001 <0.002 <0.0003 <0.0007 <0.008 <0.001
Filter 9 4 0 3 1 0 0 0 0 0 0
Filter 3 3 0 2 0 0 0 0 0 0 0
Acceptance Criteria
n = 22# > Criterion
# > 1.5*Criterion
RVP Supply QC Summary
June 25 2018 Report
QC
ITEM

NADP Central Analytical Laboratory Readiness Verification Report
Page 81 of 85
Cl SO4 Br NO3 pH Cond Ca K Mg Na NH4 PO4
mg/L mg/L mg/L mg/L S.U. µS/cm mg/L mg/L mg/L mg/L mg/L mg/L
Count WSLH ID Detail0.006 New
0.009 Used
0.007 new
0.010 used
0.006 New
0.009 Used
0.008 new
0.012 used NA >1.5
0.011 new
0.017 used
0.005 new
0.008 used
0.003 new
0.005 used
0.004 new
0.006 used
0.028 new
and used
0.008 new
0.012 used
1 SUQC67
51118 Glove A
after 4 rinses and
4 days Glove 2.096 0.212 0.019 4.701 6.67 25.3 1.696 2.719 0.0221 0.3419 <0.008 0.003
2 SUQC68
51118 Glove B
after 4 water
changes and 4
days Glove 0.384 0.031 <0.002 0.999 6.80 6.8 0.295 0.624 0.0057 0.0716 0.012 0.001
Glove 2 2 1 2 2 2 2 2 2 0 0
Glove 2 2 1 2 2 2 2 1 2 0 0
1 SUQC79 Lid Bag 1 Lid Bag <0.002 <0.003 <0.002 0.011 5.54 1.3 0.003 0.003 0.0028 0.0011 <0.008 <0.001
2 SUQC80 Lid Bag 2 Lid Bag 0.007 <0.003 <0.002 0.007 5.40 1.3 0.003 0.004 0.0033 0.0011 <0.008 <0.001
3 SUQC81 Lid Bag 3 Lid Bag <0.002 <0.003 <0.002 <0.007 5.50 1.3 0.003 0.004 0.0029 0.0012 <0.008 <0.001
4 HMQC59 5/25/2018 Lid Bag <0.002 <0.003 <0.002 0.008 x 1.1 <0.001 <0.002 <0.0003 <0.0007 <0.008 <0.001
5 HMQC60 5/25/2018 Lid Bag <0.002 0.028 <0.002 <0.007 5.37 1.2 0.009 <0.002 <0.0003 <0.0007 <0.008 <0.001
6 HMQC61 5/25/2018 Lid Bag <0.002 0.027 <0.002 <0.007 x 1.2 0.009 <0.002 <0.0003 <0.0007 <0.008 <0.001
7 HMQC62 5/29/2018 Lid Bag <0.002 <0.003 <0.002 <0.007 <0.001 <0.002 <0.0003 <0.0007 <0.008 <0.001
8 HMQC63 5/29/2018 Lid Bag <0.002 <0.003 <0.002 <0.007 <0.001 0.002 <0.0003 <0.0007 <0.008 <0.001
9 HMQC64 5/29/2018 Lid Bag <0.002 <0.003 <0.002 <0.007 x 1.1 <0.001 <0.002 <0.0003 <0.0007 <0.008 <0.001
10 HMQC65 5/29/2018 Lid Bag <0.002 <0.003 <0.002 <0.007 x 1.1 <0.001 <0.002 <0.0003 <0.0007 <0.008 <0.001
Lid Bag 1 2 0 1 0 0 0 0 0 0 0
Lid Bag 0 2 0 0 0 0 0 0 0 0 0
RVP Supply QC Summary
June 25 2018 Report
QC
ITEM
Acceptance Criteria
n = 2# > Criterion
# > 1.5*Criterion
n = 2# > Criterion
# > 1.5*Criterion

NADP Central Analytical Laboratory Readiness Verification Report
Page 82 of 85
Cl SO4 Br NO3 pH Cond Ca K Mg Na NH4 PO4
mg/L mg/L mg/L mg/L S.U. µS/cm mg/L mg/L mg/L mg/L mg/L mg/L
Count WSLH ID Detail0.006 New
0.009 Used
0.007 new
0.010 used
0.006 New
0.009 Used
0.008 new
0.012 used NA >1.5
0.011 new
0.017 used
0.005 new
0.008 used
0.003 new
0.005 used
0.004 new
0.006 used
0.028 new
and used
0.008 new
0.012 used
1 HMQC66 5/25/2018 Bucket Used <0.002 <0.003 <0.002 <0.007 x 1.1 <0.001 <0.002 <0.0003 <0.0007 0.015 <0.001
2 HMQC67 5/25/2018 Bucket Used <0.002 <0.003 <0.002 <0.007 x 1.2 <0.001 <0.002 <0.0003 <0.0007 0.015 <0.001
3 HMQC68 5/25/2018 Bucket Used <0.002 <0.003 <0.002 <0.007 5.66 1.1 <0.001 <0.002 <0.0003 <0.0007 0.012 <0.001
4 HMQC69 5/29/2018 Bucket Used <0.002 <0.003 0.007 <0.007 x 1.0 <0.001 <0.002 <0.0003 <0.0007 <0.008 <0.001
5 HMQC70 5/29/2018 Bucket Used 0.008 <0.003 <0.002 <0.007 x 1.1 <0.001 0.002 <0.0003 <0.0007 <0.008 <0.001
6 HMQC71 5/29/2018 Bucket Used <0.002 <0.003 <0.002 <0.007 x 1.1 <0.001 <0.002 <0.0003 <0.0007 <0.008 <0.001
7 HMQC72 5/29/2018 Bucket Used 0.009 0.033 <0.002 0.022 x 1.2 0.009 <0.002 <0.0003 <0.0007 <0.008 <0.001
8 HMQC73 5/31/2018 Bucket Used <0.002 <0.003 <0.002 <0.007 x 1.0 0.002 0.004 0.0009 0.0039 <0.008 <0.001
9 HMQC74 5/31/2018 Bucket Used <0.002 <0.003 <0.002 <0.007 x 1.0 0.002 0.004 0.0009 0.0037 <0.008 <0.001
10 HMQC75 5/31/2018 Bucket Used <0.002 <0.003 <0.002 <0.007 x 1.0 0.002 0.004 0.0009 0.0038 <0.008 <0.001
11 HMQC76 5/31/2018 Bucket Used <0.002 0.008 <0.002 <0.007 x 1.1 0.008 0.005 0.0010 0.0039 <0.008 <0.001
12 HMQC77 6/1/2018 Bucket Used 0.007 <0.003 <0.002 <0.007 x 1.1 <0.001 <0.002 <0.0003 <0.0007 <0.008 <0.001
13 HMQC78 6/1/2018 Bucket Used <0.002 0.004 <0.002 <0.007 x 1.0 <0.001 <0.002 <0.0003 <0.0007 <0.008 <0.001
14 HMQC79 6/1/2018 Bucket Used 0.007 <0.003 <0.002 <0.007 x 1.1 <0.001 <0.002 <0.0003 <0.0007 0.012 <0.001
15 HMQC80 6/1/2018 Bucket Used <0.002 <0.003 <0.002 <0.007 x 1.0 <0.001 <0.002 <0.0003 <0.0007 <0.008 <0.001
16 HMQC81 6/1/2018 Bucket Used 0.007 <0.003 <0.002 0.012 x 1.1 <0.001 <0.002 <0.0003 <0.0007 0.026 <0.001
17 HMQC 120 6/5/2018 Bucket Used 0.006 <0.003 <0.002 <0.007 x 1.1 <0.001 <0.002 <0.0003 <0.0007 0.014 <0.001
18 HMQC 121 6/5/2018 Bucket Used <0.002 0.012 <0.002 <0.007 x 1.1 <0.001 <0.002 <0.0003 <0.0007 <0.008 <0.001
19 HMQC 122 6/5/2018 Bucket Used 0.008 0.009 <0.002 <0.007 x 1.2 <0.001 <0.002 <0.0003 <0.0007 0.010 <0.001
Bucket Used 0 2 0 1 0 0 0 0 0 0 0
Bucket Used 0 1 0 1 0 0 0 0 0 0 0
RVP Supply QC Summary
June 25 2018 Report
QC
ITEM
Acceptance Criteria
n = 19# > Criterion
# > 1.5*Criterion
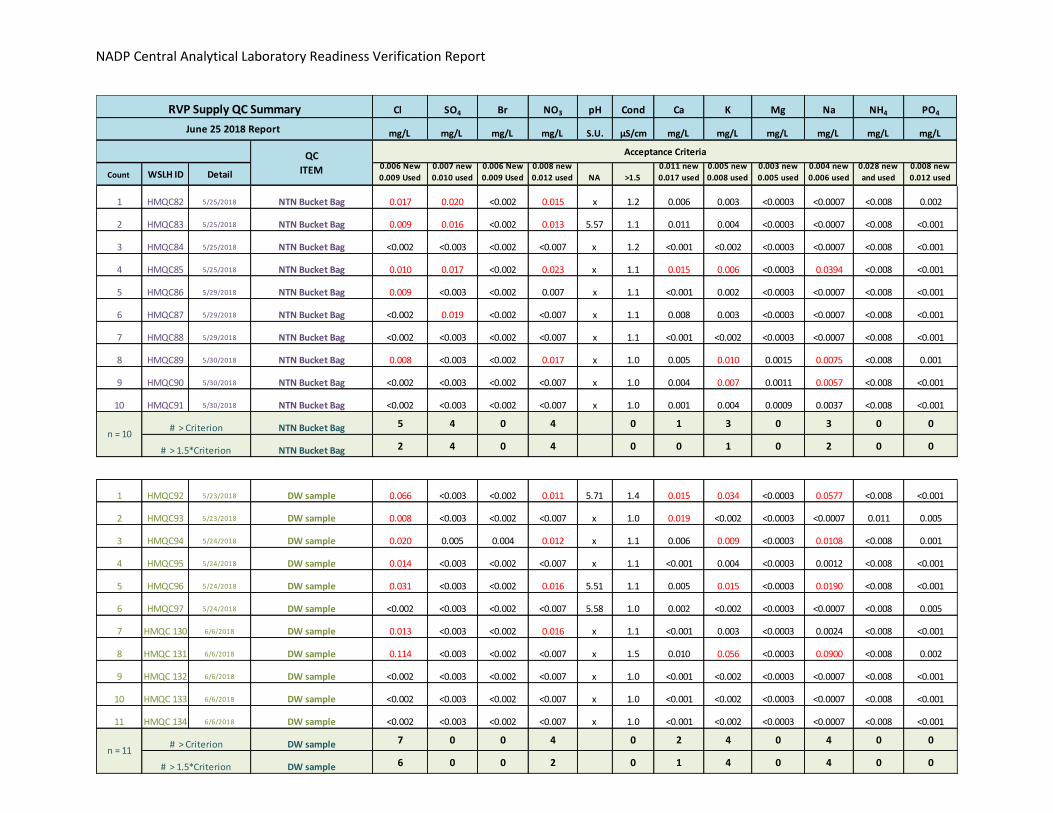
NADP Central Analytical Laboratory Readiness Verification Report
Page 83 of 85
Cl SO4 Br NO3 pH Cond Ca K Mg Na NH4 PO4
mg/L mg/L mg/L mg/L S.U. µS/cm mg/L mg/L mg/L mg/L mg/L mg/L
Count WSLH ID Detail0.006 New
0.009 Used
0.007 new
0.010 used
0.006 New
0.009 Used
0.008 new
0.012 used NA >1.5
0.011 new
0.017 used
0.005 new
0.008 used
0.003 new
0.005 used
0.004 new
0.006 used
0.028 new
and used
0.008 new
0.012 used
1 HMQC82 5/25/2018 NTN Bucket Bag 0.017 0.020 <0.002 0.015 x 1.2 0.006 0.003 <0.0003 <0.0007 <0.008 0.002
2 HMQC83 5/25/2018 NTN Bucket Bag 0.009 0.016 <0.002 0.013 5.57 1.1 0.011 0.004 <0.0003 <0.0007 <0.008 <0.001
3 HMQC84 5/25/2018 NTN Bucket Bag <0.002 <0.003 <0.002 <0.007 x 1.2 <0.001 <0.002 <0.0003 <0.0007 <0.008 <0.001
4 HMQC85 5/25/2018 NTN Bucket Bag 0.010 0.017 <0.002 0.023 x 1.1 0.015 0.006 <0.0003 0.0394 <0.008 <0.001
5 HMQC86 5/29/2018 NTN Bucket Bag 0.009 <0.003 <0.002 0.007 x 1.1 <0.001 0.002 <0.0003 <0.0007 <0.008 <0.001
6 HMQC87 5/29/2018 NTN Bucket Bag <0.002 0.019 <0.002 <0.007 x 1.1 0.008 0.003 <0.0003 <0.0007 <0.008 <0.001
7 HMQC88 5/29/2018 NTN Bucket Bag <0.002 <0.003 <0.002 <0.007 x 1.1 <0.001 <0.002 <0.0003 <0.0007 <0.008 <0.001
8 HMQC89 5/30/2018 NTN Bucket Bag 0.008 <0.003 <0.002 0.017 x 1.0 0.005 0.010 0.0015 0.0075 <0.008 0.001
9 HMQC90 5/30/2018 NTN Bucket Bag <0.002 <0.003 <0.002 <0.007 x 1.0 0.004 0.007 0.0011 0.0057 <0.008 <0.001
10 HMQC91 5/30/2018 NTN Bucket Bag <0.002 <0.003 <0.002 <0.007 x 1.0 0.001 0.004 0.0009 0.0037 <0.008 <0.001
NTN Bucket Bag 5 4 0 4 0 1 3 0 3 0 0
NTN Bucket Bag 2 4 0 4 0 0 1 0 2 0 0
1 HMQC92 5/23/2018 DW sample 0.066 <0.003 <0.002 0.011 5.71 1.4 0.015 0.034 <0.0003 0.0577 <0.008 <0.001
2 HMQC93 5/23/2018 DW sample 0.008 <0.003 <0.002 <0.007 x 1.0 0.019 <0.002 <0.0003 <0.0007 0.011 0.005
3 HMQC94 5/24/2018 DW sample 0.020 0.005 0.004 0.012 x 1.1 0.006 0.009 <0.0003 0.0108 <0.008 0.001
4 HMQC95 5/24/2018 DW sample 0.014 <0.003 <0.002 <0.007 x 1.1 <0.001 0.004 <0.0003 0.0012 <0.008 <0.001
5 HMQC96 5/24/2018 DW sample 0.031 <0.003 <0.002 0.016 5.51 1.1 0.005 0.015 <0.0003 0.0190 <0.008 <0.001
6 HMQC97 5/24/2018 DW sample <0.002 <0.003 <0.002 <0.007 5.58 1.0 0.002 <0.002 <0.0003 <0.0007 <0.008 0.005
7 HMQC 130 6/6/2018 DW sample 0.013 <0.003 <0.002 0.016 x 1.1 <0.001 0.003 <0.0003 0.0024 <0.008 <0.001
8 HMQC 131 6/6/2018 DW sample 0.114 <0.003 <0.002 <0.007 x 1.5 0.010 0.056 <0.0003 0.0900 <0.008 0.002
9 HMQC 132 6/6/2018 DW sample <0.002 <0.003 <0.002 <0.007 x 1.0 <0.001 <0.002 <0.0003 <0.0007 <0.008 <0.001
10 HMQC 133 6/6/2018 DW sample <0.002 <0.003 <0.002 <0.007 x 1.0 <0.001 <0.002 <0.0003 <0.0007 <0.008 <0.001
11 HMQC 134 6/6/2018 DW sample <0.002 <0.003 <0.002 <0.007 x 1.0 <0.001 <0.002 <0.0003 <0.0007 <0.008 <0.001
DW sample 7 0 0 4 0 2 4 0 4 0 0
DW sample 6 0 0 2 0 1 4 0 4 0 0
Acceptance Criteria
n = 11# > Criterion
# > 1.5*Criterion
n = 10# > Criterion
# > 1.5*Criterion
RVP Supply QC Summary
June 25 2018 Report
QC
ITEM

NADP Central Analytical Laboratory Readiness Verification Report
Page 84 of 85
End of Appendix