NADA Automotive Market Report: 2012 Market … Paper...866.975.6232 | nada.com/b2b C E L E B R ATIN...
17
866.975.6232 | nada.com/b2b C E L E B R A T I N G 8 0 Y E A R S C E L E B R A T I N G 8 0 Y E A R S 866.975.6232 | nada.com/b2b NADA Automotive Market Report: 2012 Market Analysis and 2013 Used Price Forecast AT A GLANCE What new vehicle incentive, lease, rental and supply levels were in 2012 How used vehicle prices performed in 2012 The factors that will affect used vehicle prices the most in 2013 What to expect in used price movement in 2013
Transcript of NADA Automotive Market Report: 2012 Market … Paper...866.975.6232 | nada.com/b2b C E L E B R ATIN...

866.975.6232 | nada.com/b2b
CELEBRATING 80 YEARSCELEBRATING 80 YEARS
866.975.6232 | nada.com/b2b
NADA Automotive Market Report:
2012 Market Analysis and 2013
Used Price Forecast
At A GlANce
What new vehicle incentive, lease, rental and supply
levels were in 2012
How used vehicle prices performed in 2012
The factors that will affect used vehicle prices
the most in 2013
What to expect in used price movement in 2013
866.975.6232 | nada.com/b2b
NADA Automotive Market Report: 2012 Market Analysis and 2013 Used Price Forecast
2
IntroductionLast year was certainly not without its challenges—erratic gasoline prices, drought, super storms and a fiscal cliff. But the automotive market weathered these conditions extremely well, becoming an inarguable bright spot in an otherwise overcast environment.
New vehicle sales accelerated by more than 13 percent to 14.4 million units, a half-million more than the year’s initial consensus forecast and the largest annual increase recorded since 1984. This happened despite persistently sluggish economic growth and a 2 percent increase in new vehicle transaction prices—the latter being a product of higher MSRPs, but also a 2 percent reduction in average incentive spending. Essentially, it was pent-up demand that led consumers to brush aside the lurking specter of fiscal uncertainty and be willing to pay more for a new car or truck in the process.
Undoubtedly, 2012’s new sales performance was helped along by higher used vehicle trade-in prices.
By NADA’s estimation, used vehicle prices for units up to eight years in age rose by 2.6 percent last year. This extended a four-year run of appreciation in which prices grew by a staggering 33 percent after bottoming out in 2008. But last year’s increase was significantly lower than the 9.2 percent average rise in prices recorded in the three years prior, leading some to speculate that the used vehicle market is set to give back a substantive portion of its recent gains in 2013.
To address where used vehicle prices are headed, this report begins with a summary of new and used vehicle market performance in 2012, before leading into NADA’s assessment of how these trends and changes to other fundamental factors are expected to affect used vehicle prices over the course of this year.

866.975.6232 | nada.com/b2b
NADA Automotive Market Report: 2012 Market Analysis and 2013 Used Price Forecast
3
2012 MARKET ANALYSIS
New Vehicle DataPent-up demand, new product in high-volume segments, and improvements in consumer confidence and credit availability collaborated to drive new vehicles sales up by 1.7 million units, to a total of 14.4 million in 2012.
Consumer retail activity (both leases and purchases) accounted for 76.4 percent of all transactions last year. While this was just a 0.8 percentage point increase from 2011’s figure, it was the first time since 2003 that a rate this high was achieved (excluding 2009’s Cash for Clunkers–stimulated result of 76.5 percent).
Unlike in 2003, however, when the jump in retail share was driven by an acute increase in incentive spending, last year’s jump in retail share was driven by the factors mentioned above. In fact, manufacturers reduced incentive spending by 2 percent, to an average of $2,484 last year per Autodata. This is the lowest level of spending recorded since 2002, when incentives averaged $1,865 per unit.
Average Incentive Amount
18.0
16.0
14.0
12.0
10.0
8.0
6.0
$4,000
$3,500
$3,000
$2,500
$2,000
$1,500
$1,000
Calendar Year
Sale
s Vo
lum
e (M
illio
ns)
Source: BEA, Autodata
Average Incentive $New Sales
2001
2002
2003
2004
2005
2006
2007
2008
2009
2010
2011
2012
ANNUAL NEW VEHICLE SALES & AVERAGE INCENTIVE SPENDING
866.975.6232 | nada.com/b2b
NADA Automotive Market Report: 2012 Market Analysis and 2013 Used Price Forecast
4
In terms of incentive spending by market sector, mainstream brands spent an average of $2,333 per unit on incentives, down 2.6 percent from 2011, while luxury brand spending rose by 4.4 percent to an average of $3,576.
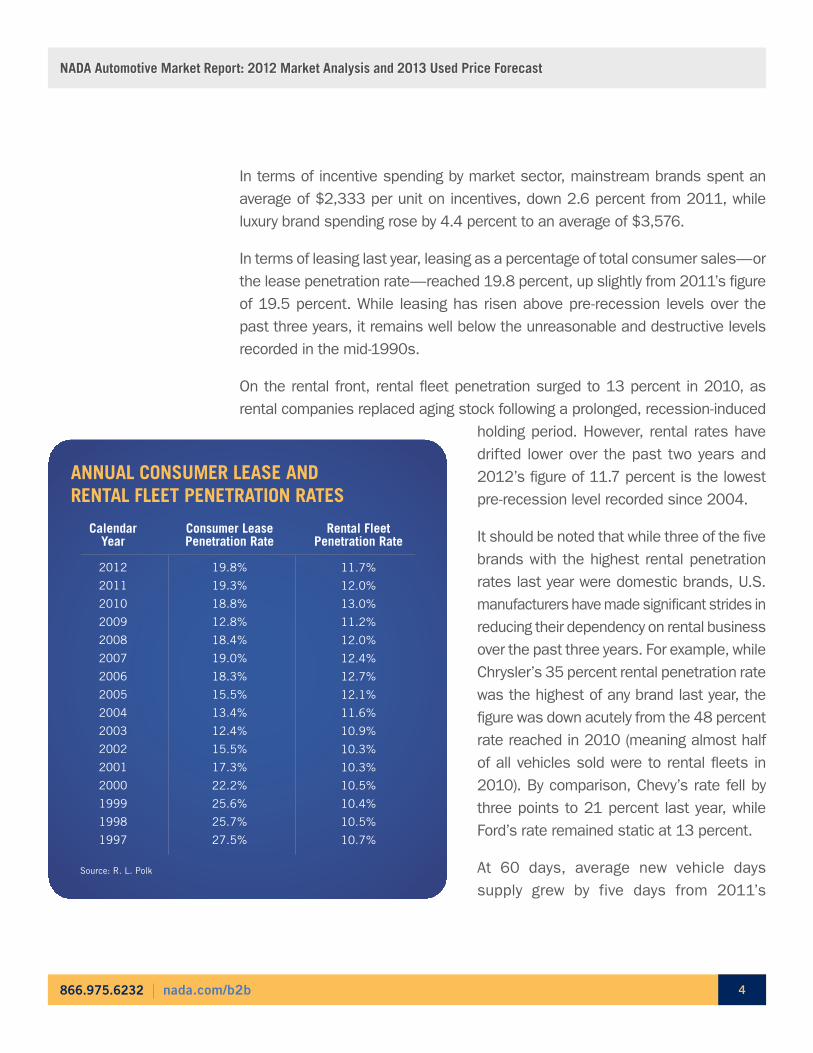
In terms of leasing last year, leasing as a percentage of total consumer sales—or the lease penetration rate—reached 19.8 percent, up slightly from 2011’s figure of 19.5 percent. While leasing has risen above pre-recession levels over the past three years, it remains well below the unreasonable and destructive levels recorded in the mid-1990s.
On the rental front, rental fleet penetration surged to 13 percent in 2010, as rental companies replaced aging stock following a prolonged, recession-induced
holding period. However, rental rates have drifted lower over the past two years and 2012’s figure of 11.7 percent is the lowest pre-recession level recorded since 2004.
It should be noted that while three of the five brands with the highest rental penetration rates last year were domestic brands, U.S. manufacturers have made significant strides in reducing their dependency on rental business over the past three years. For example, while Chrysler’s 35 percent rental penetration rate was the highest of any brand last year, the figure was down acutely from the 48 percent rate reached in 2010 (meaning almost half of all vehicles sold were to rental fleets in 2010). By comparison, Chevy’s rate fell by three points to 21 percent last year, while Ford’s rate remained static at 13 percent.
At 60 days, average new vehicle days supply grew by five days from 2011’s
2012
2011
2010
2009
2008
2007
2006
2005
2004
2003
2002
2001
2000
1999
1998
1997
19.8%
19.3%
18.8%
12.8%
18.4%
19.0%
18.3%
15.5%
13.4%
12.4%
15.5%
17.3%
22.2%
25.6%
25.7%
27.5%
11.7%
12.0%
13.0%
11.2%
12.0%
12.4%
12.7%
12.1%
11.6%
10.9%
10.3%
10.3%
10.5%
10.4%
10.5%
10.7%
CalendarYear
Consumer LeasePenetration Rate
Rental FleetPenetration Rate
Source: R. L. Polk
ANNUAL CONSUMER LEASE AND RENTAL FLEET PENETRATION RATES
866.975.6232 | nada.com/b2b
NADA Automotive Market Report: 2012 Market Analysis and 2013 Used Price Forecast
5
production-plagued average of 55, but last year’s figure was only one day higher than what was recorded in 2010 and remained well below the 67-day average observed for 2003 to 2007.
Used Vehicle Data
Per CNW Research, used vehicle sales also improved for the third straight year in 2012, but at 4 percent, growth was more than three times less than what was registered on the new side of the market.
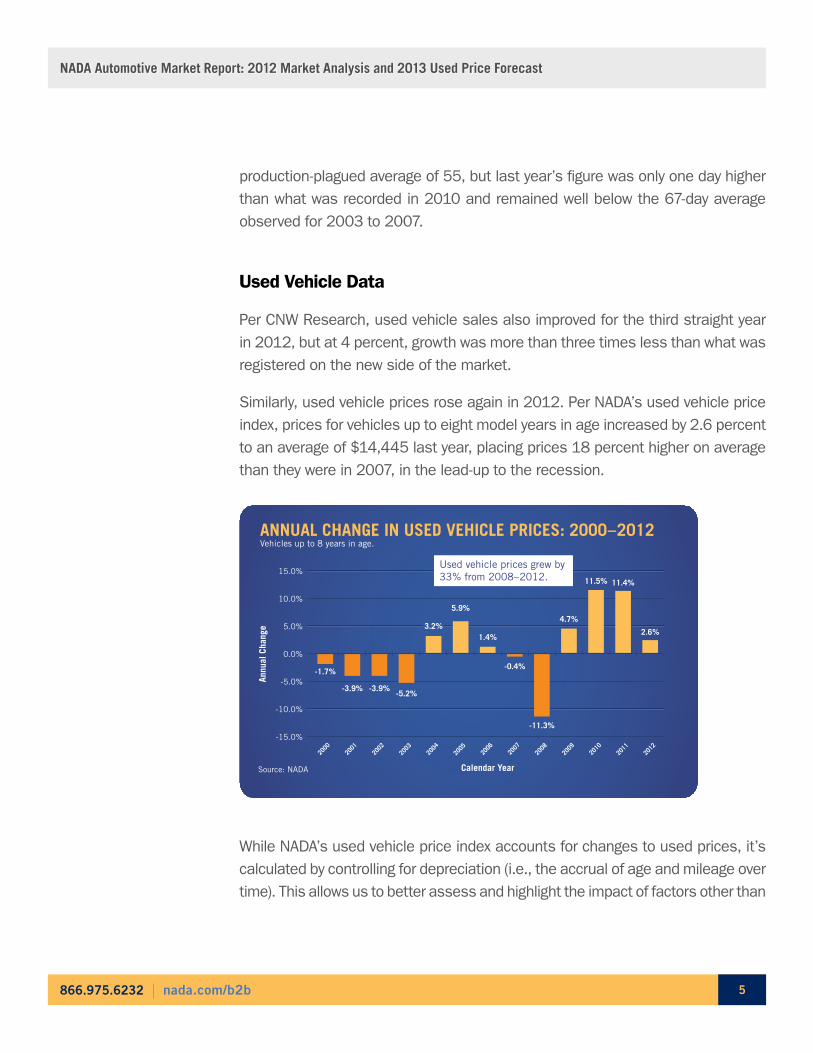
Similarly, used vehicle prices rose again in 2012. Per NADA’s used vehicle price index, prices for vehicles up to eight model years in age increased by 2.6 percent to an average of $14,445 last year, placing prices 18 percent higher on average than they were in 2007, in the lead-up to the recession.
While NADA’s used vehicle price index accounts for changes to used prices, it’s calculated by controlling for depreciation (i.e., the accrual of age and mileage over time). This allows us to better assess and highlight the impact of factors other than
Used vehicle prices grew by 33% from 2008–2012.
Annu
al C
hang
e
Source: NADA
15.0%
10.0%
5.0%
0.0%
-5.0%
-10.0%
-15.0%
Calendar Year
2001
2000
2002
2003
2004
2005
2006
2007
2008
2009
2010
2011
2012
-3.9%
-1.7%
-5.2%-3.9%
5.9%
3.2%
-0.4%
-11.3%
1.4%
4.7%
11.5% 11.4%
2.6%
ANNUAL CHANGE IN USED VEHICLE PRICES: 2000–2012Vehicles up to 8 years in age.

866.975.6232 | nada.com/b2b
NADA Automotive Market Report: 2012 Market Analysis and 2013 Used Price Forecast
6
depreciation (i.e., gasoline prices, employment, etc.) on used vehicle prices. To get an idea of how prices changed over the course of the year with accumulating mileage and age factored in, we can look to the values found in the NADA Official Used Car Guide®.
From January through December, Average Trade-In Values for model year units between 2005 and 2011 depreciated by a historically mild rate of 14.1 percent. This means that on average, a car or truck with a trade-in value of $15,000 in January’s edition of the Official Used Car Guide lost $2,114 of its value by the end of the year, or less than $200 per month.
-21.0%
-20.6%
-19.4%
-18.3%
-17.5%
-16.5%
-16.2%
-14.7%
-14.7%
-14.6%
-14.1%
-13.9%
-13.4%
-11.3%
-11.2%
-11.0%
-10.0%
-9.7%
-8.0%
-25.0%
Large Pickup
Mid-size Pickup
Subcompact Car
Large Car
Compact Car
Large SUV
Mid-size Car
Luxury Sport Car
Market Average
Large Van
Luxury Compact Car
Sport Car
Luxury Mid-size Car
Compact Utility
Mid-size Utility
Luxury Compact Utility
Luxury Mid-size Utility
Mid-size Van
Premium Luxury Large Car
-20.0% -15.0% -10.0% -5.0% 0.0%
Annual Percent ChangeSource: NADA
NADA OFFICIAL USED CAR GUIDE ® VALUE CHANGE: CY 2012Change in Average Trade-In Values from Jan.–Dec. Model years 2005–2011.

866.975.6232 | nada.com/b2b
NADA Automotive Market Report: 2012 Market Analysis and 2013 Used Price Forecast
7
2013 Used Price ForecastThe gains of the past few years were the result of an improving economy and solid market fundamentals. The industry underwent a series of changes that, while difficult at times, helped direct a return to stimulating product, a reduced dependency on incentives and fleet sales, and ultimately, higher used vehicle prices. But as we move further away from the depths of the recession and navigate our way through another new year, the used vehicle market will be presented with a new set of challenges.
To that end, here’s a look at the factors NADA believes will have the greatest influence on used vehicle prices in 2013, along with a summary of the expected effect on prices when these parts are taken as a whole.
The new vehicle market will siphon off a portion of used vehicle demand. It’s widely known that the historic rise in used vehicle prices was largely a product of falling used supply, but growth was also helped along by the positive new market trends cited earlier (i.e., a reduction in both incentive spending and fleet penetration)—an excellent example of the codependency between the new and used market.
Used price growth was also buoyed by traditional new vehicle purchasers whose fiscal anxiety drove them to purchase used vehicles.
Last year, however, it became clear that this “preference for used” began to wane as the duration and extent of the economic recovery—even if moderate— made this set of consumers less apprehensive and more confident in their economic future.
For 2013, NADA expects that new vehicle traditionalists will continue to shift their focus away from used vehicles and back toward their preferred side of the market, and that this trend will have a progressively negative impact on used prices going forward.
That being said, there is still a pool of pent-up demand for used vehicle traditionalists, or the set of consumers who, due to preference or financial reasons, typically

866.975.6232 | nada.com/b2b
NADA Automotive Market Report: 2012 Market Analysis and 2013 Used Price Forecast
8
purchase used vehicles. NADA’s vehicle demand indices showed that used vehicle demand continued to grow last year even as new vehicle demand rose sharply.
Like new vehicle consumers, used vehicle buyers have been driving their current vehicle for an extended period of time (as evidenced by the rise in vehicle age as well as the ongoing yearly decline in scrappage rates), but modest job and wage growth has kept the release of demand for this more price-sensitive demographic at a slower pace. As job growth continues to plod along, these consumers will gradually replace their current vehicle with a newer, pre-owned one, thereby helping to compensate for the loss of new vehicle substitute demand.
There is an elevated risk that incentive spending will reverse course and begin to grow again. Last year’s unexpected increase in new vehicle sales could skew OEMs’ view of consumer demand, and lead to overly aggressive production targets.
Of course, a potential solution for addressing a production-demand imbalance would be to increase incentive spending, but that would be to the detriment of used vehicle prices. At the moment, it appears manufacturers will remain prudent
New demand fell by 35% over the course of 2008–2009. Used demand dropped by just 11%.
As a result, new demand has grown more rapidly than used demand since 2010.
UsedNew
180
160
140
120
100
80
60
Dem
and
Inde
x (J
an 2
010
=10
0)
Month
Jan 05
Apr 0
5Jul
05
Oct 0
5
Jan 06
Apr 0
6Jul
06
Oct 0
6
Jan 07
Apr 0
7Jul
07
Oct 0
7
Jan 08
Apr 0
8Jul
08
Oct 0
8
Jan 09
Apr 0
9Jul
09
Oct 0
9
Jan 10
Apr 1
0Jul
10
Oct 1
0
Jan 11
Apr 1
1Jul
11
Oct 1
1
Jan 12
Apr 1
2Jul
12
Oct 1
2
Source: NADA
NADA NEW & USED VEHICLE DEMAND INDICESEstimated change in new and used vehicle demand.

866.975.6232 | nada.com/b2b
NADA Automotive Market Report: 2012 Market Analysis and 2013 Used Price Forecast
9
in their approach to production. Current production estimates for North America indicate an annual increase of 1.5 percent this year, which is reasonable given that new sales are predicted to grow between 3.4 percent to 6.2 percent (reaching 15 to 15.4 million units).
Even if production and demand remain balanced, the slower pace of new sales growth expected this year—slated to be significantly below the 13.4 percent increase recorded in 2012—will inspire competition among manufacturers. This, too, increases the threat of higher incentives.
OEMs have made a concerted effort to reduce incentive spending over the past three years and they should be reluctant to give up this hard-fought ground. For example, under pressure from critics and facing white-hot competition, Honda and Chevrolet moved quickly to refresh their strategically important Civic and Malibu models just one year after significant overhauls of each. Chevy has also cut production multiple times on the new Malibu to better match supply with demand. This is valuable insight into how manufacturers will counter perceived product deficiencies and / or an unfavorable supply-demand relationship.
Essentially, the brands decided their money was better spent improving the product to drive sales, rather than plying each with large rebates, as we most likely would have seen in the previous decade.
It still remains that slower growth will mean a tougher fight for each new sale, and while signs do not suggest a return to spending that’s on par with the past decade, NADA does expect that OEMs will rely slightly more on incentives this year, applying downward pressure on used prices in 2013.
4 Yrs. Old3 Yrs. Old 5 Yrs. Old2 Yrs. Old1 Yr. Old
At 86%, the 1-year-old Used-to-New spread was smallest in mid-2011...
...but it grew to below 80% at the end of 2012.
90%
80%
70%
60%
50%
40%
30%
Use
d re
tail
pric
e di
stan
ce fr
om N
ew (
%)
Month
Mar 08
Jul 08
Nov 08
Mar 09
Jul 09
Nov 09
Mar 10
Jul 10
Nov 10
Mar 11
Jul 11
Nov 11
Mar 12
Jul 12
Nov 12
Source: NADA
HOW NEW & USED RETAIL PRICES COMPAREThe average difference between new and used retail prices, by vehicle age.

866.975.6232 | nada.com/b2b
NADA Automotive Market Report: 2012 Market Analysis and 2013 Used Price Forecast
10
That said, the current spread, adjusted for mileage, between new and used vehicle prices is such that the retail price of a one-year-old used vehicle is now below 80 percent of the cost of a new vehicle, down from the mid-80 percent peak of 2011. This will reduce used vehicle price sensitivity to lower new prices, should incentive spending grow appreciably.
Late-model used supply will increase, but overall supply will continue to fall. NADA expects used vehicle supply for units up to three years in age to grow by 8 percent or 500,000 units in 2013, primarily as a result of a 27 percent jump in off-lease volume.
Despite the growth in late-model supply, NADA expects the supply of units up to eight years in age to fall by an additional 3 percent in 2013. In addition, late-model volume (units
up to three years in age) will still be roughly 25 percent below where it was in the three years leading up to 2009, even after this year’s increase is factored in. So while the growth in late-model supply will have an adverse effect on younger used vehicle prices, the continued slide in early-model supply will benefit prices of older models.
Credit availability will continue to expand. Data from the Federal Reserve Board’s Senior Loan Officer Survey shows that lenders have loosened auto loan standards for three years running, a trend that helped see loan portfolios grow by 7 percent or $45 billion since Q4 2010, per data from Experian Automotive. Experian data also shows that the subprime share of used vehicle financing improved by 2 percentage points to 38 percent on an over-the-quarter basis in the third quarter of 2012, and that it has grown by 5 points since the third quarter of 2009. Even
Annu
al C
hang
e (C
Y 20
12 v
s. C
Y 20
13)
Source: NADA
15%
10%
5%
0%
-5%
-10%
Registration Type
Rental Lease Retail Total
5%
14%
-6%
-3%
NADA USED VEHICLE SUPPLY FORECAST: CY 2013The expected annual change in available used supply by new vehicle registration type; units up to 8 years in age.

866.975.6232 | nada.com/b2b
NADA Automotive Market Report: 2012 Market Analysis and 2013 Used Price Forecast
11
with this growth, however, subprime’s share of financing remains below levels recorded just prior to the recession.
Standing Fed policy toward holding interest rates at current levels, low delinquency rates and a highly competitive lending environment will keep these trends going over the course of 2013. This will increasingly benefit subprime consumers and stimulate demand for used vehicles, particularly as both employment and the economy continue to improve.
Housing will become an economic tailwind. Builder optimism is growing, mortgage rates remain near all-time lows, and most importantly, home prices are rising.
At 4.65 million, existing home sales in 2012 were the highest in five years, while home prices grew by 6.8 percent according to the S&P / Case-Shiller 20-city composite index, the most since 2006.
As far as this year is concerned, it’s expected that housing starts will increase from 780,000 to 950,000 and that home prices will rise somewhere from 2 to 5 percent. Since jobs are a lagging indicator, this will aid employment as the year progresses—and also support used vehicle prices (due to the overall economic lift). In particular, used large pickup prices will rise due to the segment’s exposure to construction.
NonprimeSubprime Prime +
55%
50%
45%
40%
35%
30%
25%
20%
15%
10%
Perc
ent o
f Use
d Au
to L
oans
Quarter
Q1 20
07
Q2 20
07
Q3 20
07
Q4 20
07
Q1 20
08
Q2 20
08
Q3 20
08
Q4 20
08
Q1 20
09
Q2 20
09
Q3 20
09
Q4 20
09
Q1 20
10
Q2 20
10
Q3 20
10
Q4 20
10
Q1 20
11
Q2 20
11
Q3 20
11
Q4 20
11
Q1 20
12
Q2 20
12
Q3 20
12
Source: Experian Automotive
USED VEHICLE FINANCING BY RISK SEGMENTATIONSeasonally adjusted.
866.975.6232 | nada.com/b2b
NADA Automotive Market Report: 2012 Market Analysis and 2013 Used Price Forecast
12
Job growth will continue, albeit at a moderate pace. Per the Bureau of Labor Statistics, the economy added 157,000 jobs to nonfarm payrolls in January, and over the past two years, the number of jobs added to payrolls each month has averaged 179,000.
Granted, job growth has been frustratingly slow since 2009 and the pace of recovery isn’t expected to improve much this year. But jobs will continue to be added nonetheless, most likely at a pace similar to what was seen over the course of 2011 and 2012. In addition, employment growth should accelerate in the second half of the year, after businesses gain a better grasp on the impact of the government sequester and the debate surrounding the debt ceiling extension has passed.
We still have a long road to travel before the economy has filled in the enormous employment crater left by the last recession, but the gradual improvement in job growth will continue to support used vehicle demand among those used vehicle traditionalists discussed previously.
SummaryUsed vehicle prices will face some new challenges in 2013, but NADA believes that, when combined, these threats will be moderately distressing to used vehicle prices.
It’s expected that the shift in consumer preference toward new vehicles will siphon off some used vehicle demand; however, pent-up demand remains for consumers who traditionally purchase only used vehicles.
Last year’s dramatic rise in new vehicle sales raises the potential for production to get ahead of demand. This, along with the slower rate of new sales growth expected this year, heighten the risk of increased incentive spending by OEMs.
Manufacturer production and incentive spending practices over the past three years warrant cautious optimism as it relates to these points,

866.975.6232 | nada.com/b2b
NADA Automotive Market Report: 2012 Market Analysis and 2013 Used Price Forecast
13
but their actions of the previous decade can’t be summarily dismissed. As a result, NADA expects that incentive spending will increase slightly in 2013, but not enough to have a material impact on used vehicle prices.
Late-model used supply will grow for the first time since 2006, but volume will remain tight by historical standards. In addition, used supply for older units will continue to fall.
In addition, clear positives will continue to support used prices in 2013.
Fed policy and a highly competitive lending environment will continue to see credit standards loosen and availability grow.
Employment will continue to improve, especially toward the latter half of the year once the outcomes of the government sequester and debt ceiling extension are better known.
The recovery in housing and construction will pick up steam, benefiting both the economy and employment. This will help stoke demand for traditional used car and truck consumers.
Vehicle age remains on the rise, with R. L. Polk reporting that the average vehicle age now stands at 11.4 years. This is up two months from 2012’s average of 11.2 years and more than a year older than 2009’s average of 10.3 years. Consumers driving vehicles six years in age or older will predominantly replace their current vehicle with a newer pre-owned one.
When taken as a collective, NADA predicts that the price of units up to eight years

866.975.6232 | nada.com/b2b
NADA Automotive Market Report: 2012 Market Analysis and 2013 Used Price Forecast
14
in age will average $14,215, down 1.6 percent from 2012’s figure of $14,445.
Traditionally, used prices rise over the first three to four months of a given year, in large part because of the release in demand associated with the receipt of tax refunds. This year, however, NADA expects prices through April to be notably weaker than what is typically seen for the period, as consumers and businesses react to the expiration of the 2 percent payroll tax holiday and the political activity surrounding
the Federal budget sequester and debt ceiling extension.
The seasonally premature increase in demand stimulated by Hurricane Sandy at the end of 2012 and the slight delay in filing income tax returns as a result of last year’s American Taxpayer Relief Act (i.e., the fiscal cliff resolution) will also play a role in affecting price movement through the period.
Sales results from the first two months of the year confirm this expectation, as NADA’s used price
index through February grew by an average of 1.4 percent, nearly two percentage points less than the 3 percent average rate of growth recorded over the period in the two years prior.
Excluding November and December’s Hurricane Sandy-inflated showing, used price movement in the second half of the year will be generally in line with what was observed in 2012.
At the segment level, segments where prices are set to experience the largest declines will primarily be those that see the biggest increase in used vehicle supply. Falling into this category are compact utilities (mainstream and luxury),
NADA predicts that used vehicle prices will slip from an average of $14,445 in 2012, to $14,215 in 2013.
$15,500
$15,000
$14,500
$14,000
$13,500
$13,000
$12,500
Month
Aver
age
Pric
e
Source: NADA
CY 2012 (Actual) CY 2013 (Forecast)
Jan Feb
Mar Apr
May Jun Jul Aug
Sep Oc
tNov De
c
NADA USED VEHICLE PRICE FORECAST: CY 2013Vehicles up to 8 years in age.

866.975.6232 | nada.com/b2b
NADA Automotive Market Report: 2012 Market Analysis and 2013 Used Price Forecast
15
luxury mid-size cars and utilities, and premium luxury large cars, with prices for these vehicles predicted to fall between 4 to 6 percent. Declines for most other segments are expected to range between 0.6 to 2.5 percent. However, large pickup and SUV prices are predicted to grow by 0.8 percent and 3 percent, respectively, due to the continued scarcity of late-model used supply, improvements in housing and construction, and relatively stable gasoline prices.
In closing, while NADA expects used prices to fall for the first time in five years, the drop will be relatively mild, as on-balance, used market fundamentals remain predominantly favorable. Overall, the used vehicle market should turn in another solid—albeit less remarkable—performance in 2013.
If you require additional insight or information on the used vehicle market, including used vehicle supply, historical used price data or future used price forecasts, contact NADA anytime. Call 866.975.6232 or email the NADA consulting team at [email protected] to discuss further analysis or the creation of custom reports that can be tailored to meet your specific needs.

866.975.6232 | nada.com/b2b 16
NADA Used car Guide
Since 1933, NADA Used Car Guide has earned its reputation as the leading provider of market-
reflective vehicle valuation products, services and information to businesses throughout the
U.S. and worldwide. NADA collects and analyzes more than one million combined wholesale
and retail automotive-related transaction prices per month. Its guidebooks, auction data,
analysis and data solutions offer automotive, financial, insurance and government professionals
the timely information and reliable solutions they need to make better business decisions.
Visit nada.com/b2b
NADA Analytics & consulting
NADA’s analytics team is charged with maintaining and advancing NADA’s internal forecasting
models and for developing customized forecasting solutions for automotive clients. NADA’s
analytics team has deep industry experience and is well versed in the nuance and complications
involved with forecasting in the automotive market.
NAAA / NADA AuctionNet® Auction Data
Find the most recent wholesale transaction data through AuctionNet Market Report, available
online 24/7. Updated every week, it features more than 600,000 new records added each
month. AuctionNet Market Report represents more than 80 percent of the nation’s auction
activity, giving you a clear view of the marketplace. Available exclusively from NADA, in joint
partnership with the National Auto Auction Association (NAAA).
AuctionNet data is available either as an annual subscription or in back history for specific
years, or it can be customized and / or aggregated based on client needs.
About NADA

866.975.6232 | nada.com/b2b 17
NADA’s Used Supply Forecast
NADA’s used supply forecast is an estimate of the number of vehicles expected to be offered
for sale in the future. NADA calculates used supply volume as the pool of potential vehicles that
could return to the market — as represented by all new vehicle sales — and the probability that
a vehicle will return from a particular source (i.e., rental, consumer lease, consumer purchase,
etc.) after a predicted use period. For example, vehicles sold to rental car companies and
consumers each have a specific probability curve associated with the historical likelihood to
return to the used market after a given use period. The product of the vehicle pool and the return
probability is the expected value of the volume of returned vehicles, which is aggregated to
create the used supply volume. NADA calculates used vehicle supply down to the vehicle level.
NADA’s used supply forecast data is available either as a one-time deliverable or an annual
subscription and can be customized based on client needs.
NADA’s Used Vehicle Price Forecast
NADA’s used vehicle price forecast is based on expectations for changes to key market drivers,
combined with coefficients that estimate how each of these impacts used vehicle prices.
Expectations for changes to macroeconomic drivers are based on a consensus view from
professional forecasting organizations with adjustments made by NADA economists. Endogenous
depreciation, seasonal patterns and expectations for new vehicle prices and incentives are
estimated by NADA economists and the editorial team. Relationship coefficients are estimated
by NADA’s proprietary statistical model.