
Nacho Arronte Arroyuelos EL DIRECTOR Pablo Simón / Endesa ...
171
Autorizada la entrega de la tesis de máster del alumno/a: Nacho Arronte Arroyuelos EL DIRECTOR Pablo Simón / Endesa / [email protected] Fdo.: Fecha:………/Julio/2010 EL TUTOR Javier Reneses/ IIT / [email protected] Rafael Cossent / IIT / [email protected] Fdo.: Fecha:………/Julio/2010 Vº Bº del Coordinador de Tesis Michel Rivier Fdo.: Fecha:………/Julio/2010
Transcript of Nacho Arronte Arroyuelos EL DIRECTOR Pablo Simón / Endesa ...

Autorizada la entrega de la tesis de máster del alumno/a:
Nacho Arronte Arroyuelos
EL DIRECTOR
Pablo Simón / Endesa / [email protected]
Fdo.: Fecha:………/Julio/2010
EL TUTOR
Javier Reneses/ IIT / [email protected]
Rafael Cossent / IIT / [email protected]
Fdo.: Fecha:………/Julio/2010
Vº Bº del Coordinador de Tesis
Michel Rivier
Fdo.: Fecha:………/Julio/2010

UNIVERSIDAD PONTIFICIA COMILLAS
ESCUELA TÉCNICA SUPERIOR DE INGENIERÍA (ICAI)
MÁSTER OFICIAL EN EL SECTOR ELÉCTRICO
TESIS DE MÁSTER
SMART GRIDS BENCHMARKING
AUTOR: Nacho Arronte Arroyuelos
MADRID, Julio de 2010

Summary Smart Grids Benchmarking
July, 2010 i
SUMMARY
The massive electricity grid that utilities have developed to deliver power to
consumers during the past has been with us for over 100 years and during this period
has barely changed. The physical network has been deployed along all these years
with very few changes. The advances came basically through the transmission
network automation, where a relative small numbers of elements are monitored and
controlled, incorporating an important increase in reliability and providing the
security and quality of service of today‟s transmission networks. Additionally,
almost all generators where supervised and controlled through the companies control
centres. All this was possible thanks to a basic, but robust communication network.
These transmission advances came in the 70´s and 80´s, utilities expected a parallel
development for the distribution network in the following years, but unfortunately,
the difficulties associated to the huge number of elements, compared with the
transmission network, and the reduced return for the investment, resulted in a
reduced increase of distribution automation.
On the other hand, in the last years the suspicion of climate change being caused by
human effects, has not only been confirmed, but what is more the majority of the
worlds scientist are keen on acting immediately to change human behaviour radically
in order to reduce our impact on what would lead to the greatest changes in the
history of mankind on the Earth‟s biosphere during the next few centuries. To do so,
it is necessary to reduce carbon dioxide (CO2) emissions drastically. This implies
amongst other aspects the decrease of the use of hydrocarbon based fuels. Truly
committed, the European Union (EU) member states have compromised to the triple
20/20/20 objectives for the year 2020 which are a key issue in relation to electricity
generation, transport, distribution and use. The three objectives are to increase
renewable energy supply to 20% of total demand, reduce energy consumption by
20% with respect to 2020 forecasts and reduce Green House Gas (GHG) emissions
by 20% with respect to 1990 levels.

Summary Smart Grids Benchmarking
July, 2010 ii
In order to achieve these goals major changes must be made by all stakeholders. One
of the fundamental aspects that must change is the implementation of a new
electricity grid different from the one we have today, that has a number of constraints
that make it incompatible with the future needs.
The coming series of events countries will face regarding the energy sector in the
very near future demands the need to introduce new technologies in the grid. The
most used words throughout the sector are Smart Grid.
Taking into consideration the hypothesis that smart grids will be the future of the
electricity network in order to comply with the 20/20/20 requirements, this thesis
reviews these necessities, considering:
The opportunities and challenges faced by all stakeholders; taking into
account traditional generators, Transmission System Operators (TSO),
Distribution System Operators (DSO), retailers, consumers and authorities.
Also new stakeholders are considered: Research and Development (R&D)
institutions, Energy Service Companies (ESCo), equipment vendors,
prosumers (consumers that also produce), etc.
The Network Services expected to achieve the goals. And for these services,
the technological implementations and structural deployment associated.
Concepts and technologies like home automation, smart meters, distributed
and home generation, electric transportation and energy quality are explored.
The current state of the art has been analyzed by conducting a survey directed
to primary stakeholders throughout the world.
The key finding of this master thesis, are:
Histogram analysis reflects the survey has accomplished enough answers,
also obtaining answers from all key roles. Proving the versatility and
uncomplicated advantage of using survey analysis as a tool to gather
information.

Summary Smart Grids Benchmarking
July, 2010 iii
There is a general consent that smart metering devices will see deployment
within the next decade, as a first step towards a smart grid. This view is
shared by both direct survey responses as well as by European regulatory
bodies, such as Eurelectric, giving higher validity to our results.
Future benefits from the implementation of smarter networks are identified.
Demand side management ranks as being a very important benefit, ensuring
customers will play a vital role in the future energy model. Other benefits
such as the penetration of renewable sources of energy, higher efficiency,
integration of electric vehicles, advanced energy storage systems and the
issue of substitution of aging infrastructures, are all considered to be
important drivers towards automated networks, but not as much as DSM. On
the other hand, the least important driver identified is higher energy quality,
probably due to the already satisfactory levels achieved in most countries
participating in the survey.
In the same manner barriers to deployment have been found. The clearest one
for which a general agreement exists is the lack of standards, there is a too
high risk in deploying an investment of this character with no guarantee of
legitimacy. The problems concerning high investment decisions within a
context of uncertainty of future benefits are also important. Stakeholders also
consider as an important barrier the lack pilot projects being conducted,
necessary to perform detailed cost benefit analyses. The least relevant barrier
ranked in the survey is data confidentiality. However as already reflected
earlier, the lack of a clear regulation, understood and shared by all, is a
controversial issue. Not sharing a common view is a tremendous barrier.
The majority of volunteer agents surveyed the implementation of a smarter
grid is considered to be necessary to cope with global warming effects. Many
considering deployment more as a necessity than as an option.
Finally smart grids and metering may be a part of the solution to a sustainable energy
model, but looking into the future we must consider them as the corner stone for the
upcoming power system management, bringing new services that today we cannot
even imagine.

Resumen Smart Grids Benchmarking
July, 2010 iv
RESUMEN
Las redes eléctricas se han desarrollado en los últimos 100 años con el fin de
suministrar energía eléctrica a los consumidores, y en todo este tiempo la filosofía de
construcción no ha variado de forma sustancial. Los avances han venido
fundamentalmente por la automatización de la red de transporte, donde un número
relativamente pequeño de elementos se ha monitorizado y controlado, permitiendo
una importante mejora en la fiabilidad, al tiempo de suministrar la seguridad y
calidad de servicio con la que contamos hoy en día en las redes de transporte.
Adicionalmente, casi todos los generadores están supervisados y controlados desde
los centros de control de las compañías. Todo esto fue posible gracias a la ayuda de
una simple, pero robusta red de comunicaciones. Los avances en la red de transporte
vinieron en los años 70 y 80, y las compañías energéticas esperaban un desarrollo
paralelo de las redes de distribución en los años siguientes, pero desgraciadamente,
las dificultades asociadas al gran número de elementos, comparados con la red de
transporte, y el escaso retorno de las inversiones, resultó en un tímido incremento de
la automatización.
Por otro lado, la sospecha en los últimos años de que el cambio climático ha sido
causado por la acción del hombre, no sólo se ha confirmado, sino que la mayor parte
de los científicos a nivel mundial creen que es imprescindible cambiar de forma
inmediata y radical el comportamiento humano para reducir el impacto de nuestras
acciones sobre la tierra y evitar el mayor cambio de la biosfera que se puede producir
en los próximos siglos. Para ellos es necesario reducir las emisiones de dióxido de
carbono (CO2) de forma radical. Esto implica, entre otros aspectos, la disminución
del uso de combustibles fósiles. En ello se han comprometido los estados miembros
de la Unión Europea (EU) con un triple objetivo denominado 20/20/20 para el
próximo año 2020, donde la generación, transporte, distribución y uso de la energía
es un factor fundamental. Los tres objetivos son: Aumentar el suministro de energías
renovables hasta el 20% de la demanda total; reducir el consumo de energía en un

Resumen Smart Grids Benchmarking
July, 2010 v
20% con respecto a las previsiones de 2020; y reducir las emisiones de gases con
efecto invernadero en un 20% en relación con los niveles de 1990.
Para alcanzar estas metas, deben contribuir de forma decidida todos los stakeholders.
Uno de los aspectos fundamentales que debe ser implantado es una nueva red
eléctrica, diferente a la actual, que tiene una serie de restricciones que la hacen
incompatible con las necesidades del futuro.
Con todo, cualquier previsión de desarrollo para el futuro del sector eléctrico, exige
introducir nuevas tecnologías en las redes eléctricas, con nuevos servicios no
requeridos hasta el momento. Para definir esta red del futuro, el término más
utilizado en el sector es el de Redes Inteligentes.
Teniendo en cuenta que las redes inteligentes serán imprescindibles para cumplir con
las exigencias asumidas en las metas 20/20/20, esta tesis revisa las nuevas
necesidades, considerando:
Las oportunidades y desafíos que tienen que ser afrontados por todos los
stakeholders; considerando las plantas generadoras tradicionales, el operador
de la red de transporte (TSO), los operadores de las redes de distribución
(DSO), comercializadores, consumidores y organismos regulatorios, así como
otros nuevos stakeholders en el sector, tales como organismos de I+D+i,
compañías de servicios energéticos, suministradores de equipos, prosumers
(consumidores que son también productores), etc.
Los nuevos Servicios de red esperados para conseguir los objetivos, así como
la implantación de nueva tecnología asociada a dichos servicios. Son
analizados conceptos y tecnologías como domótica, contadores inteligentes,
generación distribuida y calidad de servicio.
El estado del arte actual se ha analizado mediante una encuesta dirigida a los
principales stakeholders a nivel mundial.
Las principales conclusiones de esta tesis, son las siguientes:

Resumen Smart Grids Benchmarking
July, 2010 vi
El análisis de histograma refleja que la encuesta ha logrado suficientes
contribuciones, así como la obtención de respuestas de todos los involucrados
en tareas clave. Demostrando la versatilidad y la ventaja de utilizar el análisis
de encuesta como una herramienta para recopilar información.
Existe un consenso general de que los contadores inteligentes se implantarán
en la próxima década, como un primer paso hacia una red inteligente. Esta
opinión es compartida por las respuestas directas a nuestra encuesta, así como
por los organismos reguladores europeos, como Eurelectric, dando una mayor
validez a nuestros resultados.
Se identifican los beneficios futuros de la aplicación de las redes inteligentes.
La gestión de la demanda se considera un beneficio muy importante,
garantizando que los usuarios jugarán un papel fundamental en el modelo
energético futuro. Otros beneficios, tales como la penetración de fuentes de
energía renovables, mayor eficiencia, la integración de los vehículos
eléctricos, los sistemas avanzados de almacenamiento de energía y la
sustitución de las infraestructuras anticuadas, son considerados factores
importantes de impulso hacia las redes automatizadas, pero no tanto como la
gestión de la demanda . Por otra parte, una mayor calidad de suministro se
considera como un aspecto menos importante, probablemente debido a los
niveles de satisfacción ya alcanzados en la mayoría de los países participantes
en la encuesta.
De la misma forma, se han encontrado algunos obstáculos al despliegue de las
redes inteligentes. El más claro, y para el que existe un acuerdo generalizado,
es la falta de estándares, ya que existe un riesgo muy alto en una implantación
masiva sin garantía de legitimidad. También se considera problemático tomar
la decisión de una inversión tan elevada, en un contexto de incertidumbre en
cuanto a los beneficios futuros. Los agentes consideran como una barrera la
falta de proyectos piloto, como elemento necesario para obtener un análisis
detallado de coste-beneficios. La barrera menos relevante considerada en la
encuesta es la confidencialidad de datos. Sin embargo como ya se ha
reflejado anteriormente, la falta de una regulación clara, comprendida y
Resumen Smart Grids Benchmarking
July, 2010 vii
compartida por todos, es un tema controvertido. No compartir una visión
común es una enorme barrera.
La mayoría de los encuestados, la implantación de una red más inteligente se
consideren necesarias para hacer frente a los efectos del calentamiento global.
Muchos consideran la implantación más como una necesidad que como una
opción.
Por último, las redes y contadores inteligentes pueden ser parte de la solución para
obtener un modelo energético sostenible, pero mirando hacia el futuro debemos
considerarlas como la primera pieza para la futura gestión del sistema, con nuevos
servicios que hoy no podemos imaginar.

Table of Contents Smart Grids Benchmarking
July, 2010 viii
Table of Contents
SUMMARY .................................................................................................................. i RESUMEN ................................................................................................................. iv Table of Contents ...................................................................................................... viii List of Figures .............................................................................................................. x
1 INTRODUCTION ............................................................................................... 1 1.1 Motivation of the Thesis ............................................................................... 1
1.1.1 The 20/20/20 Objectives ........................................................................ 2 1.1.2 New Electricity Grids .......................................................................... 12
1.2 Smart Grid Definition ................................................................................. 14 1.3 Objectives .................................................................................................... 19
2 DRIVERS FOR SMART GRIDS ...................................................................... 22 2.1 Environment ................................................................................................ 23
2.2 Energy Independence .................................................................................. 24 2.3 Rising cost ................................................................................................... 26 2.4 Power Reliability ......................................................................................... 28
2.5 Green jobs ................................................................................................... 29 2.6 Modern Infrastructure ................................................................................. 29
3 STAKEHOLDERS ............................................................................................ 31
3.1 End Users .................................................................................................... 31 3.2 Generators ................................................................................................... 34
3.3 Energy Service Companies ......................................................................... 37
3.4 Transmission System Operators .................................................................. 38
3.5 Distribution System Operators .................................................................... 39 3.6 Standardization Institutions ......................................................................... 42
3.7 Regulators ................................................................................................... 43 3.8 Equipment Suppliers ................................................................................... 44
4 NETWORK SERVICES .................................................................................... 45 4.1 Smart Meter ................................................................................................. 45
4.2 Smart Home/Home Automation ................................................................. 49 4.3 Electric Transport ........................................................................................ 56 4.4 Energy Quality ............................................................................................ 64
5 WORLD DEVELOPMENT SURVEY ............................................................. 67 5.1 Methods ....................................................................................................... 68
5.1.1 Subjects ................................................................................................ 68
5.1.2 Data Acquired ...................................................................................... 69
5.1.3 Data Analysis ....................................................................................... 71 5.2 Results ......................................................................................................... 71
6 SMART GRIDS IN EUROPE ........................................................................... 84 6.1 SPAIN ......................................................................................................... 86
6.1.1 Economic and Energetic Situation ....................................................... 86
6.1.2 Smart Grids .......................................................................................... 89 6.2 AUSTRIA ................................................................................................. 100

Table of Contents Smart Grids Benchmarking
July, 2010 ix
6.2.1 Economic and Energetic Situation ..................................................... 100
6.2.2 Smart Grids ........................................................................................ 101 6.3 FRANCE ................................................................................................... 102
6.3.1 Economic and Energetic Situation ..................................................... 102 6.3.2 Smart Grids ........................................................................................ 104
6.4 GERMANY............................................................................................... 105
6.4.1 Economic and Energetic Situation ..................................................... 105 6.4.2 Smart Grids ........................................................................................ 106
6.5 GREECE ................................................................................................... 108 6.5.1 Economic and Energetic Situation ..................................................... 108
6.6 PORTUGAL ............................................................................................. 110
6.6.1 Economic and Energetic Situation ..................................................... 110 6.6.2 Smart Grids ........................................................................................ 111
6.7 UNITED KINGDOM ................................................................................ 112
6.7.1 Economic and Energetic Situation ..................................................... 112 6.7.2 Smart Grids ........................................................................................ 114
6.8 MALTA..................................................................................................... 116 6.8.1 Economic and Energetic Situation ..................................................... 116
6.8.2 Smart Grids ........................................................................................ 118 7 SMART GRIDS IN OTHER COUNTRIES .................................................... 120
7.1 UNITED STATES .................................................................................... 120 7.1.1 Economic and Energetic Situation ..................................................... 120 7.1.2 Smart Grids ........................................................................................ 121
7.2 AUSTRALIA ............................................................................................ 123 7.2.1 Economic and Energetic Situation ..................................................... 123
7.2.2 Smart Grids ........................................................................................ 124 7.3 BRAZIL .................................................................................................... 127
8 CONCLUSIONS ............................................................................................. 129 8.1 Discussion ................................................................................................. 129 8.2 Possible Future Progress ........................................................................... 132
REFERENCES ........................................................................................................ 143
TERM DEFINITIONS ............................................................................................ 147 Appendix A – Smart Grid Deployment Survey E-mails ......................................... 150 Appendix B – Eurelectric Smart Grids and Networks of the Future Results .......... 152

Table of Contents Smart Grids Benchmarking
July, 2010 x
List of Figures
Figure 1 Estimated U.S. Energy Use in 2008. ............................................................. 4
Figure 2 Renewable energy, end of 2008 (GW). ......................................................... 5
Figure 3 Energy efficiency label. ................................................................................. 8
Figure 4 Reference Scenario. ..................................................................................... 10
Figure 5 World Greenhouse gas emissions by sectors. ............................................. 11
Figure 6 Smart grid electric elements. ....................................................................... 16
Figure 7 Carbon dioxyde vs. Global temperature graph. ........................................... 23
Figure 8 Natural gas throughout the world. ............................................................... 25
Figure 9 Demand Curve. ............................................................................................ 32
Figure 10 Quality Cost vs. Conformance. ................................................................. 34
Figure 11 Load Curve with EVs. ............................................................................... 35
Figure 12 Swift Quality Cost vs. Conformance. ........................................................ 41
Figure 13 Smart Metering Infrastructure levels. ........................................................ 46
Figure 14 HAN and WAN. ........................................................................................ 47
Figure 15 Final energy use U.S. 2008. ...................................................................... 56
Figure 16 Electric Vehicle. ........................................................................................ 59
Figure 17 Plug-in Hybrid Vehicle. ............................................................................ 59
Figure 18 Fuel Cell Powered Vehicle. ....................................................................... 61
Figure 19 Bio-Fuel Powered Vehicle. ....................................................................... 61
Figure 20 EV Load Curve. ......................................................................................... 64
Figure 21 Origin of survey answers ........................................................................... 72
Figure 22 Spanish Gross Electricity Generation (2009). ........................................... 88
Figure 23 Spanish historical Generation. ................................................................... 89
Figure 24 Spanish Special Regime Installed Capacity. ............................................. 89
Figure 25 Spanish Smart Meter Roll Out Timeline. .................................................. 90
Figure 26 Project Denise Clusters. ............................................................................ 94
Figure 27 Smart City Malaga Technology and Innovation. ...................................... 96
Figure 28 GAD Technologies. ................................................................................... 97
Figure 29 STAR project communications scheme. ................................................... 99
Figure 30 E-Energy projects .................................................................................... 108
Figure 31 United Kingdom Gross Electricity Generation. 2020 forecast. ............... 113
Figure 32 United States Gross Electricity Generation (2009). ................................ 120
Figure 33 Energy policy diagram. ........................................................................... 133
Figure 34 Smart Meters and Smart Boxes ............................................................... 138
Figure 35 Traditional Scheme. ................................................................................. 139
Figure 36 Current Scheme ....................................................................................... 140
Figure 37 Future Scheme ......................................................................................... 141
Figure 38 Smart Grid Deployment Timeline ........................................................... 142

INTRODUCTION Smart Grids Benchmarking
July, 2010 1
1 INTRODUCTION
1.1 Motivation of the Thesis
Electricity is a crucial factor for the development of society. All parts involved, are
influenced positively or negatively by the way electricity is produced, transported
and used. These three stages determine price, quality and other more difficult to
quantify externalities, such as effects on the environment, which differentiate electric
power systems around the world.
For any nation it is strategically important to have a reliable and secure power
generation, transmission and use. For instance, the industries of a nation that sustain
its economy, by providing job and salaries to its workers, are sustainable only if they
create value. In very basic terms the benefits must be greater than the costs. If
electricity costs are high, the benefit will be lower, leaving little margin to industry
growth. Likewise social progresses, to overcome poverty and improve healthcare
would not be possible. Today‟s safe and economic electricity allows us to access a
higher quality of life. The use of heating to keep our homes warm during the winter
period, refrigerators to conserve food, or access to more information through
television, the internet and radio are all good example of how electricity has changed
our world. Other important benefits are the possibility to work during the night, as
well as the constant technological development. For all these reasons electricity is a
safety and physiological need and therefore is considered as a basic right and not as a
service.
Global changes have taken place in the power sector in the last decades. In the past,
the traditional scheme of electricity supply consisted in vertically integrated utilities.
Companies were responsible for all parts of the energy supply chain, providing
consumers with their demand. Today, the majority of developed countries have
liberalized their power sector through a process known as deregulation. The key
steps of this process have been:

INTRODUCTION Smart Grids Benchmarking
July, 2010 2
The unbundling of the activities. Separation of competitive activities,
generation and retailing, from regulated activities, transmission and
distribution.
Open entry to the wholesale markets.
Open access to the transmission network.
Organization of wholesale markets, where generators compete.
Open access to retail market, where consumers can freely choose retailers.
The idea is simple; a competitive market will lead to higher efficiency, which will in
turn lead to lower prices, and in this way since electricity is a basic need, gains in
society as a whole. [1]
However the regulated activities are also crucial for the wellbeing of the system, and
must also develop accordingly to its needs. Now the world faces new challenges in
this front as the complexity of the sector increases.
The massive electricity grid that utilities have developed to deliver power to
consumers during the past has been with us for over 100 years, and during this period
has barely changed. The advances came basically through the transmission network
automation, where a relatively small numbers of elements began to be monitored and
controlled, incorporating an important increase in reliability and providing the
security and quality of service of today‟s transmission networks. Additionally,
almost all generators where supervised and controlled through the companies control
centres. All this was possible thanks to a basic, but robust communication network.
These transmission advances came in the 70´s and 80´s, utilities expected a parallel
development for the distribution network in the following years, but unfortunately,
the difficulties associated to the huge number of elements, compared with the
transmission network, and the reduced return for the investment, resulted in an
insignificant increase of distribution automation.
1.1.1 The 20/20/20 Objectives

INTRODUCTION Smart Grids Benchmarking
July, 2010 3
On the other hand, in the last years the suspicion of climate change being caused by
human effects, has not only been confirmed, but what is more, the majority of the
worlds scientist are keen on acting immediately to change human behaviour radically.
The goal is to reduce our impact on what would lead, during the next few centuries,
to the greatest changes on the Earth‟s biosphere in the history of mankind. To do so,
it is necessary to reduce carbon dioxide (CO2) emissions drastically. This implies,
amongst other aspects, the decrease of the use of hydrocarbon based fuels. Truly
conscious, the European Union (EU) member states have committed to the triple
20/20/20 objectives for the year 2020 which are a key issue in relation to electricity
generation, transmission, distribution and use. [2] The three objectives are:
1. Increase renewable energy supply to 20% of total demand of primary energy
consumption
2. Reduce energy consumption by 20% with respect to 2020 forecasts
3. Reduce Green House Gas (GHG) emissions by 20% with respect to 1990
levels.
The 20/20/20 objectives, do not imply a predefined scheme to reach them, leaving
countries with the freedom of having a number of ways to reach the goals.
1.1.1.1 Increase Renewable Energy Supply to 20%
The first objective, to increase renewable energy supply to 20% of the total primary
energy demand, implies a huge economic effort. Total Energy can be divided into a
series of different processes: residential, commercial, industrial and transportation
use (see figure 1).

INTRODUCTION Smart Grids Benchmarking
July, 2010 4
Figure 1 Estimated U.S. Energy Use in 2008.
Source: Lawrence Livermore National Laboratory.
Renewable electricity production is particularly economically demanding, due to two
reasons: Firstly because, the high investment cost of these power generators is much
higher than the needed for traditional generators that result in a cheaper price per
MW installed. Secondly, the quantity of capacity that must be installed in order to
reach a level of supplying of 20% of total final demand, means the real quantity of
installed capacity must be much higher, around 40%, because other energy uses such
as traditional energy transportation will not use renewable energy sources and also
because of the low flexibility nature of the technology that have a low capacity factor
(see equation 1).
Capacity factor =power fullat operated hadit ifoutput
timeof period aover output actual (1)
In most countries these type of generation must be subsidised. The market structure
does not consider the cost on the environment, and therefore it is the responsibility of
government to find a way to internalize green cost through different schemes, such as
carbon taxes, or subsidies. In 2008, the worldwide capacity of installed renewable
INTRODUCTION Smart Grids Benchmarking
July, 2010 5
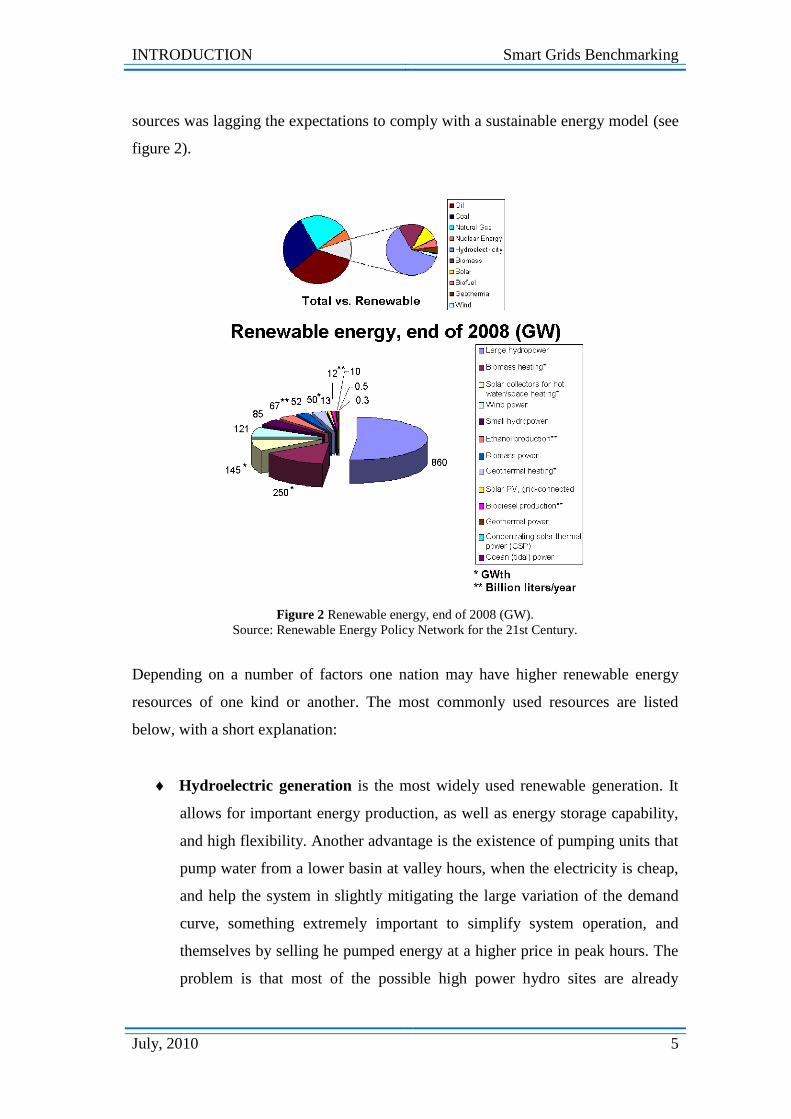
sources was lagging the expectations to comply with a sustainable energy model (see
figure 2).
Figure 2 Renewable energy, end of 2008 (GW).
Source: Renewable Energy Policy Network for the 21st Century.
Depending on a number of factors one nation may have higher renewable energy
resources of one kind or another. The most commonly used resources are listed
below, with a short explanation:
Hydroelectric generation is the most widely used renewable generation. It
allows for important energy production, as well as energy storage capability,
and high flexibility. Another advantage is the existence of pumping units that
pump water from a lower basin at valley hours, when the electricity is cheap,
and help the system in slightly mitigating the large variation of the demand
curve, something extremely important to simplify system operation, and
themselves by selling he pumped energy at a higher price in peak hours. The
problem is that most of the possible high power hydro sites are already

INTRODUCTION Smart Grids Benchmarking
July, 2010 6
exploited, and new plants are environmentally unviable. Small hydro is also
used and is currently being further developed through new technologies.
Wind generation is facing a high deployment in many countries, it is very
possibly the cheapest and therefore most viable renewable throughout the
world. Wind farms are located at sites where the source is available, therefore
many times this generation plants are directly connected to distribution
networks, changing the traditional power flow patterns. This will at some
point constrain the network and a more developed grid will be necessary.
What is more, high intermittency and unpredictability requires a high reserve
capacity consistent of peaking units. Mainly gas powered, are necessary to
back up the system in case of wind fault, and indeed other renewable of
similar characteristics like solar generation. Ideally in a large enough system
with wind generation in many areas, wind would always produce and back up
its self. This would demand huge investments in interconnection
infrastructures, and new joint market structures. [3]
Solar generation. The energy emitted by the sun may also be taken
advantage of through different processes:
Solar photovoltaic cells generate electricity through a process where
the photons colliding with cells create a voltage difference. They have
the advantage of being usable in isolated location and the drawbacks
that the production of photovoltaic cells is expensive and heavy
metals are produced during manufacturing.
Solar thermal plants are another alternative not yet so mature.
Basically, these plants collect the heat from the sun to heat a fluid and
generate electricity. This generation involves an important number of
technologies that allow a variety of uses. From Low-thermal solar
heat collectors for domestic use to produce hot water, for example for
sanitary hot water, to large thermal generation plants to produce
electricity that could also use gas as an alternative fuel in the case the
sun is not shining, this would allow more flexibility, but gas storage
would be a new dilemma. Once more considering the ideal approach

INTRODUCTION Smart Grids Benchmarking
July, 2010 7
diversification in renewable could very well be another part of the
solution, since many times when it is not windy it is sunny and one
source could backup the other.
Biomass consists of using biological materials as fuel for thermal generation,
especially interesting in the case of residues that are a problem that can
become a solution. The transport sector can also reduce emissions thanks to
switching from conventional petrol or diesel powered engines to biofuels that
are derived from biomass.
Tidal and wave generation are forms of hydro-generation applied at the sea.
The economic effort they demand is high, yet they are more predictable than
wind and solar. The drawbacks are mainly the investment costs in
infrastructures and networks.
Geothermal generation of electricity takes advantage of the heat stored in
the earth, only possible in very specific regions. But has the important
advantage of not having to rely on variable sources of energy such as wind or
solar, with low power but high capacity factor meaning that even though it
may produce not large amounts, it can produce it constantly, which is good
for system security as a renewable base unit.
Combined heat and power (CHP) is many times remunerated as a
renewable generator, because it leads to lower primary energy consumption
and emissions. It consists of gaining efficiency by adding the useful heat of
an industrial process with electricity generation, independently of which
process came first (heat electricity or electricity heat), the simultaneous
use allows for energy recycling.
In this way we can see that the generation technology is available to comply with the
20% renewable compromise, but it must be noted that it is equally important to have
a secure enough grid to operate with the new power flows, hence a smarter grid with
higher monitorization of information and superior flexibility.

INTRODUCTION Smart Grids Benchmarking
July, 2010 8
1.1.1.2 Reduce Energy Consumption by 20%
The second objective, to reduce energy consumption by 20% with respect to 2020
forecasts may also be confronted in different approaches that vary considerably in
complexity and costs. Electricity consumption can potentially contribute to attaining
this goal. The means to achieve it could come in a number of ways:
Many countries are taking measures by giving incentives to use more efficient
equipment. A very clear example of these are the switching programs for EU
member states from incandescent light bulbs, that will soon disappear from
the market, to Compact Fluorescent Lights (CFL) and Light Emitting Diode
(LED) which have longer lifetimes and higher efficiency. Another initiative
many countries are adopting is to grant subsidies to those who buy high
efficiency appliances. More efficient white goods such as: refrigerator,
washing machines, dishwashers, or air conditioners would save energy and
more importantly, money directly to clients. Consumer awareness is crucial
to obtain optimal results. Therefore appliances must be sold with standard
energy labels (see figure 3) that clearly inform of the energy efficiency of the
apparatus. Rated from A to G, A being the most efficient.
Figure 3 Energy efficiency label.
Source: www.fareham.gov.uk/council/departments/housing

INTRODUCTION Smart Grids Benchmarking
July, 2010 9
Many countries have already started installing or are starting the deployment
of smart meters. This subject is dealt with in more detail in Chapter 4:
Network Services. As a brief introduction to smart meters, it is important to
know that they are meters that still do not have specific standard, but should
ideally include new features such as real time consumption information in
detail and establishes two-way communication with utilities. This new
technology may very well revolutionize the way we use electricity today.
Initial pilot projects estimate 10% saving in energy costs. Basically the new
meter has the important advantage of informing consumers of energy cost.
The idea is that by giving energy prices, consumers have incentives to modify
inefficient consumption patterns. The efficient consumer will cut costs in
peak periods by shifting some of their power needs to valley hours. This idea
is subject of debate by many sceptics that find it hard to believe that ordinary
customers will change their habits.
A future step will be home automation; this consists of a set of domestic
appliances that will gain intelligence through automatic energy management.
In other words, the apparatus will automatically be able to determine the
optimal moment to turn on and operate as efficiently as possible. For instance
a refrigerator that cools down at maximum power during valley hours, and
then work at lower load during the peak.
The transportation sector is another of the major parts involved in the carbon
emission debate. A very promising future is expected from electric
transportation. Electric engines have a much higher efficiency ratio with
respect to the traditional combustion ones; furthermore it is not only a matter
of efficiency, but also of the primary energy source. In conventional thermal
engines, the primary source derives from fossil fuels. However, the primary
source that activates Electric Vehicles (EVs) depends on the electricity
generation mix, which may comprise a significant share of RES. Therefore
the net energy use will be lower, reducing energy consumption in the near
future. What is more, the electric vehicle could be used as an energy storage
system and balance the demand curve by charging during the valley, and
INTRODUCTION Smart Grids Benchmarking
July, 2010 10
serving as a security service in case of outage. In Chapter 4: Network
Services a more thorough discussion on the topic is approached.
Finally, reducing energy consumption will have economic benefits. The allocation of
the costs and benefits must be shared in a fair way. It is crucial to consider that
prevailing over the economic interest, the security of the system is the most
important priority, and that international interconnections, together with smart grids
will allow the optimal flow of power generation in the most efficient way.
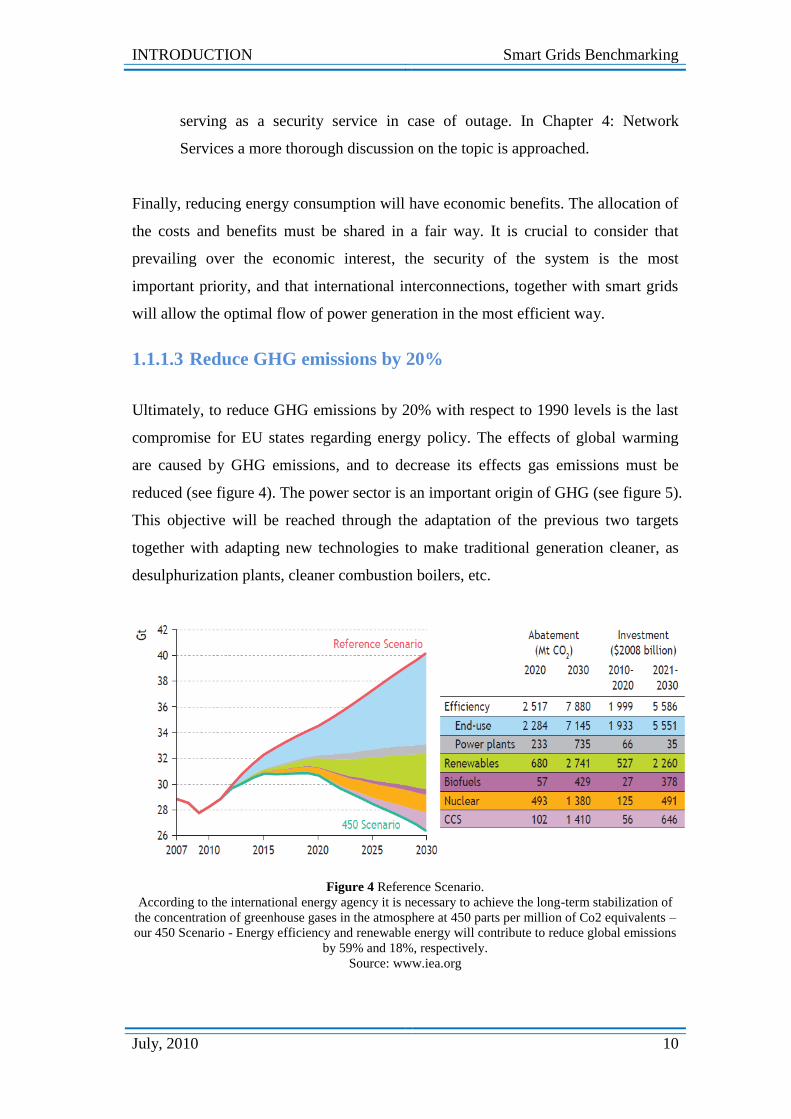
1.1.1.3 Reduce GHG emissions by 20%
Ultimately, to reduce GHG emissions by 20% with respect to 1990 levels is the last
compromise for EU states regarding energy policy. The effects of global warming
are caused by GHG emissions, and to decrease its effects gas emissions must be
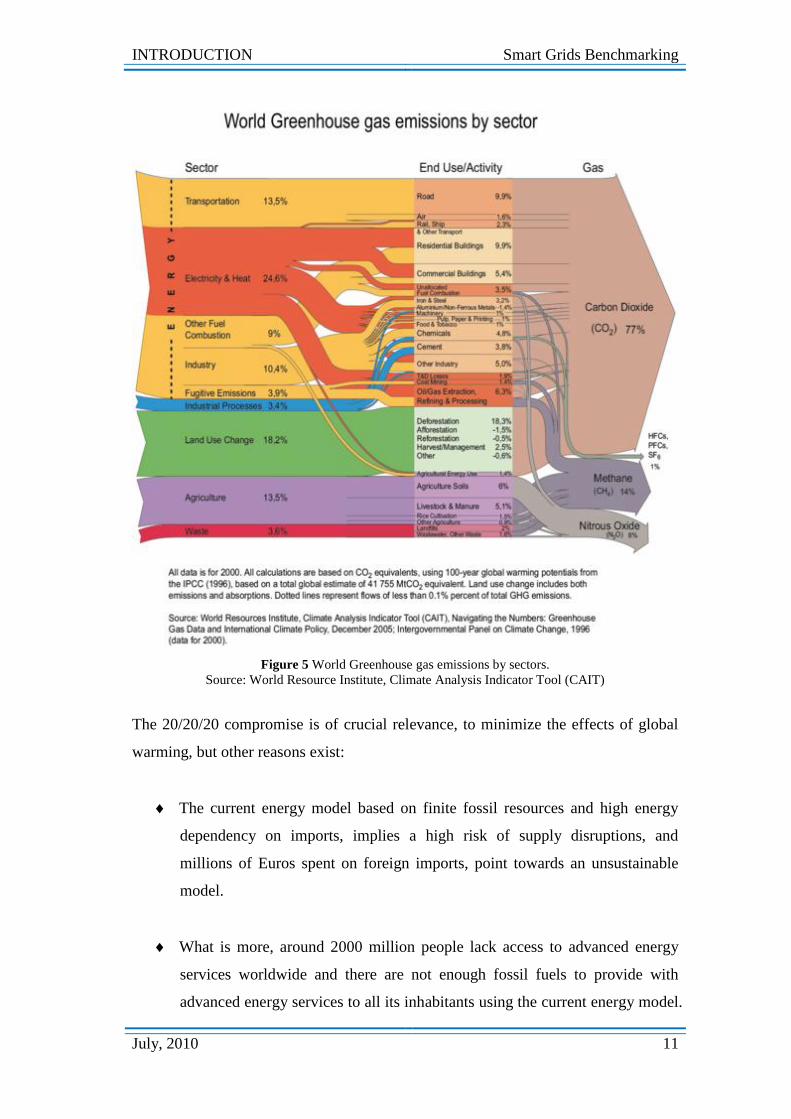
reduced (see figure 4). The power sector is an important origin of GHG (see figure 5).
This objective will be reached through the adaptation of the previous two targets
together with adapting new technologies to make traditional generation cleaner, as
desulphurization plants, cleaner combustion boilers, etc.
Figure 4 Reference Scenario.
According to the international energy agency it is necessary to achieve the long-term stabilization of
the concentration of greenhouse gases in the atmosphere at 450 parts per million of Co2 equivalents –
our 450 Scenario - Energy efficiency and renewable energy will contribute to reduce global emissions
by 59% and 18%, respectively.
Source: www.iea.org
INTRODUCTION Smart Grids Benchmarking
July, 2010 11
Figure 5 World Greenhouse gas emissions by sectors.
Source: World Resource Institute, Climate Analysis Indicator Tool (CAIT)
The 20/20/20 compromise is of crucial relevance, to minimize the effects of global
warming, but other reasons exist:
The current energy model based on finite fossil resources and high energy
dependency on imports, implies a high risk of supply disruptions, and
millions of Euros spent on foreign imports, point towards an unsustainable
model.
What is more, around 2000 million people lack access to advanced energy
services worldwide and there are not enough fossil fuels to provide with
advanced energy services to all its inhabitants using the current energy model.

INTRODUCTION Smart Grids Benchmarking
July, 2010 12
The efficiency objectives together with new market designs and especially new
secure networks, with smart grids and international interconnections, will lead to a
competitive and sustainable new energy model, which will allow doing more with
less.
The current electricity grids of the world could be much more productive and
efficient, but the cost in the infrastructures when they were built did not justify the
investments, however with a rapidly changing production scheme, and new
environmental externalities that must be considered, a smarter grid could be the
solution.
1.1.2 New Electricity Grids
In order to achieve these goals, major changes must be made by all stakeholders. One
of the fundamental aspects that must change is the implementation of a new
electricity grid different from the one we have today, that has a number of constraints
that make it incompatible with the future needs.
The current grid is designed for large controllable generators, connected to a High
Voltage (HV) transmission network, supplying energy to an inelastic demand
connected to a Low Voltage (LV) distribution system. However, due to the necessity
to fight climate change, some states are already experiencing the penetration of
renewable energy sources, some of which deliver smaller amounts of power, are less
predictable and may be connected to lower voltage levels, since they are also
constrained to generate in the locations where the renewable source is available.
Additionally, the predictions of demand awareness will make demand elasticity more
variable. Therefore distributed generation and demand side response are two key
trends that are growing steadily and without a doubt will cause the complexity of
power flows to increase. This leads to a new challenge in the way to plan, design and
operate electricity networks.
INTRODUCTION Smart Grids Benchmarking
July, 2010 13
The necessities of this new network must consider the opportunities and challenges
faced by all stakeholders. The introduction of two way communication, higher
efficiency, new generation technologies as well as energy storage systems are some
of the predictable necessities and benefits coming. In this way, in addition to
traditional generators, Transmission System Operators (TSO), Distribution System
Operators (DSO), retailers, consumers and authorities; new stakeholders are entering
the sector. These comprise Research and Development (R&D) institutions, Energy
Service Companies (ESCo), equipment vendors, prosumers (consumers that also
produce)… as well as traditional members are modifying their stake to adapt to the
future characteristics that the network will presumably settle in.
However, the difficulty to reach this ideal situation has a number of problems that are
lagging or avoiding the deployment of new grids. These must be solved as soon as
possible. One of the problems is the lack of a developed technology, partially due to
not having consolidated standards. Another problem is related to not adopting a
common scheme: different approaches taken by different countries. The result is the
lack of new services that would be responsible for the economic justification of new
investments.
The problem must be considered from an economic perspective. If the total cost
necessary to implement the new grid is smaller than the future benefits, then the
existence of a competitive market should lead to the deployment (see equation 2).
Total Costs < Future Benefits Competitive Market (2)
Yet even if the total cost is higher than the future benefits but the benefits are still
considered necessary to fulfil the international compromise, then the executive
should implement incentives to reach the objectives (see Equation 3).
Total Costs > Future Benefits (NECESSARY) Incentives (3)
Identifying which equation to follow is crucial, but in order to choose, regulators
must have a clear idea of the costs and benefits. Therefore all stakeholders must work

INTRODUCTION Smart Grids Benchmarking
July, 2010 14
together in order to catalyse the deployment. The role of regulators is essential to
finally reach the future benefits the new grid will bring. Understanding all
stakeholders points of view, identifying and removing possible barriers and finding a
good and fair solution will lead to effective regulation.
1.2 Smart Grid Definition
Although discussion on the topic is vast, there are not yet clear definitions of what a
smart grid should feature. Reading through many different articles on the subject,
one quickly notices, it can mean different things to different people, often leading
discussions to confusion [9]. Some countries consider the deployment of smart
meters is enough, whilst others even consider incorporating the use of
superconductive transmission lines for fewer power losses [10].
Carnegie Mellon University recently published an article that describes the idea that
a smart grid is neither a clearly defined single concept nor a single technology.
Rather it is like a basket containing various combinations of balls. The context and
the interpretation depend upon the user. The article describes all of the various balls
typically found in this metaphorical basket. Some of them represent innovations that
are still in the development phase, while others stand for technologies which have
already been applied for years [74].
However a number of major smart grid platforms have given long, specific and sort
of official definitions. Following are the two most relevant ones:
A) European view
The European Technology Platform Smart Grids [11] defines smart grids as
“electricity networks that can intelligently integrate the behaviour and actions of all
users connected to it - generators, consumers and those that do both – in order to
efficiently deliver sustainable, economic and secure electricity supplies”.

INTRODUCTION Smart Grids Benchmarking
July, 2010 15
A smart grid employs innovative products and services together with intelligent
monitoring, control, communication, and self-healing technologies in order to:
Better facilitate the connection and operation of generators of all sizes and
technologies;
Allow consumers to play a part in optimising the operation of the system;
Provide consumers with greater information and options for choice of supply;
Significantly reduce the environmental impact of the whole electricity supply
system;
Maintain or even improve the existing high levels of system reliability,
quality and security of supply;
Maintain and improve the existing services efficiently;
Foster market integration towards European integrated market.
The “smartness” implies that Smart Grids do not only supply power but also
information and intelligence. The “smartness” is manifested in making better use of
technologies and solutions to better plan and run existing electricity grids, to
intelligently control generation and to enable new energy services and energy
efficiency improvements.
The Smart Grid Platform of the EU is also clear on what it does NOT mean.
The smart grid relates to the electricity network only (not gas) – it concerns
both distribution and transmission levels.
Smart grids are not new “super grids”. They will not look significantly
different to today‟s “conventional” electricity grids transporting and
distributing power over “copper and iron”. However, smart grids will lead to
improved cost-efficiency and effectiveness.
The smart grid is no revolution but rather an evolution or a process within
which electricity grids are being continuously improved to meet the needs of
current and future customers.
There will not (and cannot) be any “roll-out” of smart grids, since such a
“roll-out” is continuously occurring.

INTRODUCTION Smart Grids Benchmarking
July, 2010 16
Although the concepts are sometimes confused, the smart grid is not smart
metering – the smart grid is a much broader set of technologies and solutions
(see figure 6).
Figure 6 Smart grid electric elements.
Source: European Technology Platform Smart Grids
While many utilities have put their focus on smart metering, smart metering does not
provide a smart grid. Indeed, it is possible to have smarter electricity grids (i.e.
distribution and transmission networks) without smart metering. But, there are
several benefits to smart metering which can reinforce other policy actions on
climate change. For example, when used with other parameters (such as differential
tariffs and information) smart meters can encourage consumers to reduce their
demand (load) when prices are high or when system reliability or power quality is at
risk.”
B) United States view
The U.S. Department of Energy's (DOE) Modern Grid Team has detailed seven key
characteristics of the Smart Grid. [12]
These include:

INTRODUCTION Smart Grids Benchmarking
July, 2010 17
Enabling active participation by consumers
Accommodating all generation and storage options
Enabling new products, services, and markets
Optimizing assets and operating efficiently
Anticipating and responding to system disturbances in a self-healing manner
Operating resiliently against physical and cyber attacks and natural disasters
Providing the power quality for the range of needs in a digital economy.
The DOE has explicitly called out superconductors as one of the fundamental
technologies needed for the Smart Grid. Superconductor cables can significantly
enhance the flow of power on the transmission system, relieving grid congestion and
increasing efficiency. Applied under our city streets, they can enable, for instance,
widespread adoption of plug-in hybrid electric vehicles. These same cables also can
automatically suppress power surges and enable resilient power grids that can
survive attacks and disasters
In the US Energy Independence and Security Act of 2007 in its section 1301 [13]
states: “It is the policy of the United States to support the modernization of the
Nation's electricity transmission and distribution system to maintain a reliable and
secure electricity infrastructure that can meet future demand growth and to achieve
each of the following, which together characterize a smart grid:
Increased use of digital information and control technology to improve
reliability, security, and efficiency of the electric grid.
Dynamic optimization of grid operations and resources, with full cyber
security.
Deployment and integration of distributed resources and generation,
including renewable resources.
Development and incorporation of demand response, demand-side resources,
and energy-efficiency resources.
Deployment of `smart' technologies (real-time, automated, interactive
technologies that optimize the physical operation of appliances and consumer
devices) for metering, communications concerning grid operations and status,
and distribution automation.

INTRODUCTION Smart Grids Benchmarking
July, 2010 18
Integration of `smart' appliances and consumer devices.
Deployment and integration of advanced electricity storage and peak shaving
technologies, including plug-in electric and hybrid electric vehicles, and
thermal-storage air conditioning.
Provision to consumers of timely information and control options.
Development of standards for communication and interoperability of
appliances and equipment connected to the electric grid, including the
infrastructure serving the grid.
Identification and lowering of unreasonable or unnecessary barriers to
adoption of smart grid technologies, practices, and services.”
After considering these detailed definitions. In a very simplified manner a smart grid
should include smart network devices and smart meters (recall figure 6).
A smart grid should include two basic features:
1. Automated metering infrastructure: metering must allow two-way
communication between the customer and utilities.
2. Automated devices in transmission and distribution: devices must allow
higher power flow information recollection and higher operational
flexibility.
3. Smart safe, efficient and sustainable grid reaction to users and
generation actions (1) and network constraints (2).
The definitions stated above describe the meaning and functions that a smart grid
must achieve. But do not explain in detail, neither the way nor the moment of how
this should be done. In other words the goals are given but the strategy is not. As an
analogous descriptive example consider the process of building a bridge. A bridge is
a structure built to span a physical obstacle, for the purpose of providing passage
over the obstacle. Known the definition there are a number of ways to obtain the
same goal, the designs of bridges vary depending on the function of the bridge and
the nature of the terrain where the bridge is constructed. In the same way a smart grid
will vary depending on the specific needs of each network. Temporal phases and
steps are just as important as the actual definition.

INTRODUCTION Smart Grids Benchmarking
July, 2010 19
1.3 Objectives
Taking into consideration the new challenges of the energy sector, and the need to
give a sustainable solution, the smart grids represent a part of the future, and it will
be configured as the backbone for next changes in the power system.
With this premise, the objective of this thesis is to analyze the current situation and
the elements around, and internal, to the smart grids, trying to identify the needs of
the system and the future the smart grids have to consider. Also, it will analyze the
actions performed or scheduled, so that a state of the art can be presented. Finally, a
look to the future will be foreseen.
The development of this thesis covers the following main objectives:
1. DRIVERS: First of all, the drivers of the system, as the facts to steer to a
complex solution as smart grids, will be reviewed. There are a great number
of challenges for the electrical networks that the world has to face in the near
future. All of them must be confronted by players involved, but they can be
summarize in the following, that will be analyzed in detail:
a. Environment
b. Energy Independence
c. Rising cost
d. Power Reliability
e. Green jobs
f. Modern Infrastructure
2. STAKEHOLDERS: Once reviewed the drivers the smart grids have to face. It
is needed to analyze the agents involved in the solution. For smart grids, the
stakeholders are not only the transmission or distribution system operators,
but all players that directly or indirectly are involved with the electric system.

INTRODUCTION Smart Grids Benchmarking
July, 2010 20
In this chapter, the problems and expectations of each of the stakeholders will
be analyzed. Every stakeholder must cover their expectations and must
engage dialogue with the rest, sending and receiving the correct information,
to assist regulators in understanding how smart grids can benefit all network
users. The roles, responsibilities and rights of relevant stakeholders and
authorities must be clearly defined and adopted suitably.
The stakeholders analyzed are:
a. End Users
b. Generators & Distributed Generators
c. Energy Service Companies
d. TSO
e. DSO
f. Standardization Institutions
g. Regulators
h. Equipment Suppliers
3. SERVICES: Analysis of the network services expected to achieve the goals.
And for these services, the technological implementations and structural
deployment associated. Concepts and technologies like home automation,
smart meters, distributed and home generation, electric transportation and
energy quality will be explored.
4. DEVELOPMENTS IN EUROPE: Study the current state of the art situation,
the implementations executed or under way, as well as the government and
regulator point of view in a number of states of Europe and other areas, and
obtain expectations from different stakeholders. Identify the different impacts
the implementation that these grids will have on the different stakeholders
throughout Europe and other areas in order to help regulators and utilities
understand different views, as well as recognize possible inconvenience and
barriers for their necessary deployment.
5. THE WAY TO GO: Finally, we believe that a specific time line with clear
objectives is fundamental for the deployment of the new technology.
INTRODUCTION Smart Grids Benchmarking
July, 2010 21
Alternative solutions and possible guidelines will be advised to reach a fair
and sustainable compromise.
6. FURTHER DEVELOPMENT: Further works will be needed in order to
reach international solutions to the clear, transparent and fair deployment of
smart grids. This paper aims to help this deployment and serve as a reference
to future works.

DRIVERS FOR SMART GRIDS Smart Grids Benchmarking
July, 2010 22
2 DRIVERS FOR SMART GRIDS
The power sector, as already described in the introduction, involves a number of
different activities such as generation, transmission, distribution and retailing, as well
as other more indirect activities like regulation, market operation, demand response,
equipment industry and so on.
The near future challenges for the networks around the world, must be confronted by
all players involved, and not only by the regulated activities, like transmission and
distribution. Among these challenges, we find some so important as: (i) forecasted
increase in energy demand, (ii) escalating political believe in competition through
market liberalization, (iii) environmental directives, as the 20/20/20 EU objectives,
(iv) low emissions generation trend, (v) penetration of distributed generation, (vi)
promotion of new high efficiency technologies, (vii) demand side management, (viii)
incursion of the electric vehicle, (ix) energy storage systems and customer active
participation in markets, (x) new investments to guarantee higher system security to
replace aging infrastructures, (xi) stimulating intelligent consumption and (xii)
creation of new services. All these are just some of the probable tests the power
sector stakeholders will confront. [14]
As mentioned above, all stakeholders are involved and have to provide answers to
these challenges, but the electrical grid has a special role. It has to be ready, not only
to support all the changes without representing a limitation to new implementations,
but also to promote the new services and developments requested by all network
users.
Analysing in detail the indicated challenges, and noting the high correlation between
many of them. It is possible to summarize all of them in six key factors, as main
drivers to the smart grid, destined to be part of a possible solution. These six key
factors are following: [15]
1. Environment
2. Energy Independence

DRIVERS FOR SMART GRIDS Smart Grids Benchmarking
July, 2010 23
3. Rising cost
4. Power Reliability
5. Green jobs
6. Modern Infrastructure
2.1 Environment
Global warming has alarmed society about the hazards the planet is exposed to by
pollution, and primarily about the increase of hydrocarbon gases resulting from
human activity as the main source to blame for the greenhouse effect. The high
correlation between carbon dioxide and global temperature illustrates the necessity to
reduce carbon emissions (see figure 7). Since the use of fossil fuels accounts for 40%
of these greenhouse gases, [16] and they are still the most widely used source of
energy, at around 70% of the net generation today. [17] There is a common
conformity on the need to reduce these emissions.
Figure 7 Carbon dioxyde vs. Global temperature graph.
Source: http://zfacts.com/p/226.html

DRIVERS FOR SMART GRIDS Smart Grids Benchmarking
July, 2010 24
The integration of renewable sources, as clean energy, is undoubtedly very important.
Even though we could invest in renewable generation, today‟s electrical
infrastructure cannot maximize the benefits of these clean sources, because of their
location, and variability. The location is a handicap because the introduction of high
quantities of distributed generation may cause power flow problems, since the grid
was designed to work in a decreasing voltage level structure with unidirectional
power flows. The variability may cause system operation technical hitches because
the system is not automated enough, which means a lack of operational flexibility.
But the change of energy generation sources is not the only action that can be taken
to ease the environment. The energy efficiency is another parameter important to rely
on. Here the goal is to use less energy without losing quality of live. And this means
taking actions as for instance replacing all lightning technology, with 80% savings,
changing all inefficient equipments for new “Class A” ones, and so on.
Electric vehicles for public transportation can also help change the use of fuel for
electricity, which could be generated by cleaner sources, as explain above. In this
case, the advantages are not only the change of the power source, but also the benefit
brought by the better efficiency of electric engines. In Chapter 4 a more detailed
discussion on electric transport is provided.
But all these actions are impossible to implement without an electrical network able
to support them. So, as new requests as renewable portfolio standards are adopted by
an increasing number of countries, the networks must be adapted to fully incorporate
the benefits brought. The same will occur with the massive incorporation of new
electric vehicles. New standards have to be defined and new elements have to be
incorporated in the future Smart Grid. In summary, a smart grid would improve
energy efficiency and facilitate the penetration of new services in an efficient and
reliable way, contributing to the overall system needs, reducing investment in
traditional generation.
2.2 Energy Independence

DRIVERS FOR SMART GRIDS Smart Grids Benchmarking
July, 2010 25
Today fossil fuels are essential for the development and wellbeing of our society.
Energy resources vary from one country to another. The majority of traditional
generation fuels: petroleum, natural gas and coal, are concentrated in just a few
producing countries, making the rest energetically dependent. This strategic
constraint is a major threat for many nations, as witnessed by eastern European
countries during the last winter periods, when Russian gas suffered a lack of supply.
Note that the vast majority of gas is produced by Russia and the Middle East
countries (see figure 8). Generally, governments have confronted the problem
throughout diversification in different energy sources, technologies and importing
partnerships. However, the figures spent on imports are astonishing. For instance, the
United States of America spends more than $200,000 per minute on foreign oil [18].
Figure 8 Natural gas throughout the world.
Natural gas resources located throughout the world in billion cubic meters.
Source: Cedigaz 2009.
This situation will get worse and worse in the future, as the current non renewable
sources diminish. The goal is to replace these sources by others owned by the
country, or that could be acquired by an important number of other countries at a
reasonable price. But obviously, the best and most reasonable approach is to have a
diversify energy matrix, based on clean energy, renewable ones and, in the last case,
not dependent of a few countries.

DRIVERS FOR SMART GRIDS Smart Grids Benchmarking
July, 2010 26
As indicated in the previous driver, the change of the primary energy sources has to
be reinforced by an increase in the energy efficiency, smart demand and penetration
of electric vehicles.
The possibility to do more with less is one of the advantages of a smarter grid,
reducing the energy generation needs, for a given demand. High efficient grids, and
the penetration of clean sustainable fuels, will reduce foreign fuel dependency and
increase efficiency. Add this to the rest of efficiency actions, thanks to further
features of smart grids will bring even better results for all, both economical and
environmentally.
2.3 Rising cost
One of the characteristics of the electricity chain process is that energy cannot be
stored in significant amounts. This means, there must always be a permanent balance
between the power generated and the power consumed. The use of electricity varies
throughout the day, and therefore the generation must also adapt to demand changes.
Therefore it is necessary to have plants that may only be used for short periods of
time, making them more expensive in order to recover their fixed cost, i.e.
investment. In this way a growing demand means growing costs.
Customers are not aware that the generation price of energy is different in peak than
in valley hours, and of the constant generation management to satisfy demand, that
comes at different prices depending on the overall consumption. The number of
variables related to the final price is huge, and very complex to reflect. Amongst
other factors that define final price we find: the energetic matrix, primary sources
market price - this is the value of the already mentioned fuels with very high
volatilities, power plants availability costs, ancillary services, and of course the
demand. But finally, all this means that the end consumer will unavoidably also have
an increase in its electricity bill, as more electricity is required.

DRIVERS FOR SMART GRIDS Smart Grids Benchmarking
July, 2010 27
On the other hand, historically the demand has been considered inelastic. This means
that demand is considered fixed and therefore cannot be modified. But as the price of
electricity started increasing and discriminated from peak demand to valley demand,
the big consumers began to change their consumption profile, changing the energy
use time periods and reducing the demand by increases in efficiency. Additionally,
small consumers also move a small part of their consumption profile from peak to
valley, mainly in the heating equipments, moving the connexion time from day to
night. Price signals may bring elasticity to demands side response.
In this environment, there are two ways to reduce the bill.
One is to reduce the electricity cost by using cheaper electricity. And that
could be done by changing the energetic matrix to a more efficient one. In the
long-run renewable sources could bring costs down.
The other possibility is to use energy more efficiently, through the
management of demand. There is a huge margin for demand rationalization.
It is not logical to have a single price structure if electricity prices change
with time and space of use. The solution would consist of variable energy
prices for any time of the day since prices must reflect the real cost.
In fact, for households, an important part of the consumption could be
scheduled in normal conditions at any time of the day. For example, not just
the above indicated heating equipment, but also programmable washing
machines, dishwashers, refrigerators and heating that could work more
efficiently if they work during the valley and stopped or work at low power
during the peak. Other needs such as lighting, computer and television use
could achieve higher efficiency through the use of household energy storage
systems such as the lithium batteries we use in laptops, which could be
charged during the cheapest periods of the day. Obviously, in order to make it
possible in a rational way, it is necessary to have real time information for the
energy condition – peak or valley – and have smart appliances.

DRIVERS FOR SMART GRIDS Smart Grids Benchmarking
July, 2010 28
In both situations it is essential to have a smart grid to support these features. The
problem once more is the economic effort needed at first to introduce a smart grid,
given the uncertainty of not knowing if in the long term benefits will surpass costs.
2.4 Power Reliability
The reliability indices of most developed countries are relatively high compared to
the cost of upgrading the grid, still a cost/benefit analysis must be rerun periodically
as new technology cost go down. On the other hand, analyzing the power
disturbances as a whole, they still cause major economic loses. In the United States
more than $150 billion dollars are wasted every year due to power outages, about
$500 per citizen. [19].
With the increase of electrification, both in quantity and quality – mainly associated
to computerized equipment – the sensitivity of users for power reliability is changing.
Today the loss of energy supply even for a short period of time is detected by the
users through more sensitive equipments, such as electric clocks, computers, and so
on, even though the new ones are typically more protected. This results in a higher
demand for reliability. In summary, an important increase in reliability, would allow
saving money offering a better service, yet the problem today is to justify the
investments through the cost/benefit analysis.
Smart grids would in a natural way increase security and reliability of supply. The
communication infrastructure associated to smart grids will solve the cost/benefit
analysis, and allow higher network automation. Currently the lack of automation
means utilities in many cases do not know there is an outage until a customer calls in
to report it, and the operational flexibility is very limited. The risk of cascading
failure increases the greater the interruption time is, thus increasing the probability of
a massive blackout [20]. The higher automation of smart grids implies higher
knowledge of power flows and therefore higher flexibility in operation. Reaction to
potential problems will take place before customers may even be affected, or much
faster and safer, and in this way the impact will be minimized.

DRIVERS FOR SMART GRIDS Smart Grids Benchmarking
July, 2010 29
2.5 Green jobs
The world economic crisis has shot unemployment rates upwards throughout the
world, a need to find stimulus to reactivate struggling economies is a crucial problem.
A common mistake made by many of the executive administrations is to rush into
unproven projects that generate unnecessary jobs that solve one problem today to
have two problems tomorrow. The key to success is therefore not to oblige to waste
money but to spend money on its equivalent benefit. New jobs can arise from
promoting and allowing consumers to take advantage of new opportunities that have
proven a cost/benefit relationship analysis, understanding by benefit both economical
and social gains.
As explained earlier, the power sector will require necessary research and
development and the related jobs in the transformation of the energy sector in the
future society. Renewable generation, efficiency increasing, public electric
transportation, and the network developments have to be prepared.
Many people believe that the smart grid is an opportunity to create hundreds of
thousands new jobs. But before spending millions of dollars, government funding
must promote pilot projects to assess the cost/benefit relation. This will be the first
step to assess the potential of the economic benefits of all changes that can be done.
Such risky investment on new technologies will not be made by only a player, such
as distribution companies alone for smart grids, unless a fair return is settled.
Regulation plays the key role in deploying a promising job sprout. Green jobs will
provide products and services that use renewable energy resources, reduce pollution,
and conserve energy and natural resources.
2.6 Modern Infrastructure
In many cases, the infrastructure we use today in the energy sector has
technologically barely changed from the one used 100 years ago. From the power
plants, to transmission, distribution and the equipment use by the final users, the
changes have been very small. We can just think of the incandescent light bulb as an

DRIVERS FOR SMART GRIDS Smart Grids Benchmarking
July, 2010 30
example of a contemporary way to emit light inefficiently. We have been using this
technology since Thomas Edison invented it in 1878. Only now, obliged by the
increase of electricity prices and the need for higher efficiency are new technologies
beginning to emerge.
Now, all the factors are together pointing at a new target. First of all, we have higher
energy needs, but also need the technology to be more efficient, the technology to
have new clean and renewable energy sources, the technology to adapt the network
to the user‟s needs.
All the advances together, will give us the opportunity, and the urge, to revolutionize
the sector, bringing an efficient and sustainable use of energy.
Specifically, for smart grids, as costs of communication technologies go down and
the technology available for switching and sensors become smarter, the time seems
right for the next step towards new developments. But we must wait until pilot
projects prove a cost/benefit analysis, ensuring sustainability.

STAKEHOLDERS Smart Grids Benchmarking
July, 2010 31
3 STAKEHOLDERS
To perform changes of this magnitude it is basic to take into account the needs and
expectations of all players involved, ensuring non discrimination and fair allocation
of resources. Every stakeholder must cover their expectations and must engage
dialogue with the rest, sending and receiving the correct information, to assist
regulators in understanding how smart grids can benefit all network users.
The roles, responsibilities and rights of relevant stakeholders and authorities must be
clearly defined and adopted suitably. The most important stakeholders are listed
below and commented in detail in the following pages:
1. End Users
2. Generators & Distributed Generators
3. Energy Service Companies
4. TSO
5. DSO
6. Standardization Institutions
7. Regulators
8. Equipment Suppliers
3.1 End Users
The power market, as in fact any economic market, is governed by supply and
demand. Demand side is represented by Customers. Traditional electricity markets
have been characterized by an extremely inelastic demand (see figure 9). What this
means is independently of the price of the market, the demand remains constant.
There are various reasons for this, but primarily since electricity is a basic need,
consumers have become dependent on it. As a simple example, consider that if
electricity prices rise the consumers will logically still keep their refrigerators
plugged in, maintaining demand. Make no mistake. People do and are very worried
about the price they pay for electricity, but the truth today is that they do not have a
choice, and indeed this usually becomes a political problem. The inexistence of

STAKEHOLDERS Smart Grids Benchmarking
July, 2010 32
efficient price signals for consumers leads to a lack of transparency. This can lead to
market power abuse. Customers have the right to be protected from market power. It
is the responsibility of the administrative authorities to regulate the market in order to
protect consumers from being abused. The inexistence of efficient price signals for
consumers and market power abuse are two different topics but more transparent
price signals would also bring barriers to market abuse. [21]
Figure 9 Demand Curve.
Example of the inelastic demand curve and the escalating power generation bids of the Spanish
electrical system.
Source: www.omel.es
With the new energetic scheme, we cannot talk any more of consumers, as passive
agents connected to the network to use energy. New technologies allow today anyone
to have an active role as end users of the network, not only as consumers but also as
producers, and indirectly, taking part of the network management. The new
renewable energies make it possible for end users to have small generators at home.
The energy produced, depending of the country‟s regulation, can be used to reduce
their consumption or even to inject it into the network.
Another possibility that will arise in the near future with the development of new
batteries is the capability of household energy storage. This could be done with high
capacity batteries for general use, or even taking advantage of the specific batteries,
STAKEHOLDERS Smart Grids Benchmarking
July, 2010 33
like the electric vehicle ones. Again the advantage is that in some specific cases at
peak times, the client could revert – sell – the stored energy to the network.
But finally, end users will take actions moved basically by: desire for the best prices,
higher quality of service and new added value services:
Lower Prices - Fundamentally what customers expect and want are the best
power prices. The smart grid should give end users the opportunity to obtain
the highest prices as small producers, and in the same way, get the lowest
prices as consumers.
The liberalization of energy markets ideally allows consumers to adapt
consumption pattern to a lower energy price. Catalyze demand side
management of electricity, thanks to two way communication between
customer and utilities, given an effective price signal. What this means is that
a consumer will be able to observe real time prices, or at least the peak and
valley periods, and react in an intelligent way, displacing consumption from
expensive peak hours to cheaper valley hours, which would mean important
economic benefits to users. Currently a wide range of the consumption could
be moved to valley hours with absolutely no problem as already explained in
Chapter 2.3 in the section devoted to rising cost, with the examples provided.
Higher Quality of Service - Today quality of service is well regulated and in
most developed countries considered highly satisfactory, since a compromise
has been achieved between costs and quality levels. What is more, in many
countries DSOs have incentives to increase quality of service levels (see
figure 10).
With the deployment of smart devices in the network and two-way
communication meters, the distribution companies will find it cheaper to
further improve quality of service. Perceptibly the smart grid would bring
even better levels that would again benefit all users. [22]

STAKEHOLDERS Smart Grids Benchmarking
July, 2010 34
Figure 10 Quality Cost vs. Conformance.
Quality costs for consumer and utility are aggregated to obtain total quality cost.
Source: www.emeraldinsight.com
New Added Value Services - As for new services and technology, consumers
are currently unaware of their benefits and therefore not interested, which in
market terms means no demand, action or contribution. Certainly, once the
deployment of smart grid occurs, the new services which will be studied in
depth in the following chapter will accelerate their deployment.
3.2 Generators
The more efficient network use will modify the electricity generation balance curve,
forcing the generators to operate in new ways. Generator operation will suffer: fewer
stops, fewer ramps, etc. It is important to note that while traditional generation may
worry that smart grids, through their higher efficiency may reduce energy prices for
consumers, this does not necessarily mean losses for electricity production.
Generators receive an economic benefit proportional to the market price times the
quantity of power sold minus their production costs, as explained below (see
equation 4).
B = P · Q – C (4)

STAKEHOLDERS Smart Grids Benchmarking
July, 2010 35
Where P is the market price, Q is the quantity of power soled and C is the cost for the
company to produce Q. Generator obtaining an economic benefit equal to B. [21]
As a consequence even if prices fall, the benefits of generation could increase due to
higher production. The lower prices and new services can also bring rebound effects
increasing demand. An example could be the use of electric vehicles that would burst
demand during valley hours (see figure 11). In the following figure an increase of the
demand during the off peak hours due to the expected high penetration of electric
vehicles in the Spanish system, implies higher quantities of electricity sold by
generators.
Figure 11 Load Curve with EVs.
Forecasted load curve for the Spanish system for a penetration of one million electric vehicles in
2014. With 8 hours off-peak recharge.
Source: Proyecto Piloto de MOVilidad ELEctrica: MOVELE [23]
The bottom line is that maybe consumers will not consume less, but actually more,
yet surely in a more efficient way. Especially important is once again to consider the
problem, not for network and generation separately, but as a single complex process,
because of the correlation each one causes on the other. What this means is that
generators must forecast the future network in their investments to adapt to future
system needs and avoid investing in obsolete technology.
STAKEHOLDERS Smart Grids Benchmarking
July, 2010 36
The expected high beneficiaries of a more flexible network are distributed generation
plants. Currently the access and connection points for these generators are complex
and hence expensive. In many cases these costs must be covered by the generator
itself, increasing fixed cost. Other possibility not explored yet could be the
cooperating generation. Today, for example in Spain, each generator has its
exclusive connection point, but talking about renewable generation, the same point
could be shared in a cooperative way, for example for solar and wind generation, so
that during sunny days the generation could come from the solar farm and at night
and cloudy days, the wind plant, if possible, could generate. At conflict times, clear
rules should be established to assure the maximum capacity generation with the
agreed priority. In this way, the network investments could be optimized.
With Smart Grids this scenarios could be considered, taking the grid the
responsibility to manage the agreements in an effective way. So, cost would surely
decrease, meaning lower investment cost and higher security of supply.
As mentioned above, another form of generation that will increase in the near future
and have to be supported by the upcoming new services will be those customers that
also produce their own energy, sometimes known as prosumers. New
microgeneration technologies and energy storage systems make them viable for
domestic use. This new form of extreme distributed generation in high amounts is
unviable without an important upgrade in the current grid.
Additionally, with the increasing penetration of renewable generation, new problems
arise for the generator community as a whole. Historically, the generation park was
able to manage the demand in an economic way. As new technology entered the
sector, old plants where replaced by new ones in a more economic way. Today, the
renewable generation is coming to the market helped by government incentives and
displacing other plants, creating a distortion to the market. But it is the first effect to
a coming alarming situation. With the increase of renewable plants, an excess of
energy in the market will be produced at certain periods of time – mainly at valley
hours – this will bring conflict between generators in the market. In this case, the

STAKEHOLDERS Smart Grids Benchmarking
July, 2010 37
business plans calculated only with the incentives, but considering full production,
will not comply with reality. Many plants will operate far less hours than planned
and therefore obtain worse economic results than expected.
Other effect associated with the increasing participation of renewable generation, is
the fact that at certain point, every kW of renewable energy will need to be backed
up for almost the same quantity in kW of traditional generation. This means an
increase of traditional generation deployed as back up, but with an expectation of
minimum participation in the market, which implies higher price back up units.
These two last cases would be particularly important in markets not very well
interconnected, as Spain. It could be minimized by more capacity to absorb the
exceeding energy, which can come through increase the interconnection capacity,
increase the storage capability with new pump reservoirs, or moving the demand
through demand side management.
Anyway, smart grids have to support all the expected functions, and the regulator has
to solve the economic distortions of the market through adequate remuneration
and/or services.
3.3 Energy Service Companies
Energy Service Companies (ESCo) are businesses that use their knowledge of energy
usage, to come up with a broad range of comprehensive energy solution products for
consumers. An example of ESCo service could be the design and implementation of
energy saving projects. ESCo perform an in-depth analysis of the property, designs
an energy efficient solution, and then recommend a package of improvements to be
paid for through savings. Once contracted, ESCo may install the required elements
and maintain the system to ensure energy savings during the payback period. In this
case, ESCo will guarantee that savings meet or exceed annual payments to cover all
project costs, usually over a contract term of seven to 10 years. If savings don't
materialize, the ESCo pays the difference, not the consumer.

STAKEHOLDERS Smart Grids Benchmarking
July, 2010 38
Many types of building improvements can be funded through their existing budgets:
new lighting technologies, boilers and chillers, energy management controls and
swimming pool cover, to name a few.
The above mentioned cases are a small part of the activities that the ESCo could
implement. With the unbundling of the energy process and the increase in flexibility,
a wider range of products for ESCo will appear. Also customers more aware of
environmental problems, energy markets and system operation, through a direct
economic signal, imply higher interest in energy efficiency products. A promising
future awaits the companies that find efficient ways to find win-win situations
together with customers.
Obviously, the more flexibility will imply more services, and overall, the network to
support it, which means, smart grids.
3.4 Transmission System Operators
Even though the transmission system is already highly automated, it will be also
responsible to support the new services of the whole system. At the end, the
responsibility of the stability of the entire system is in the hands of the transmission
system operator.
The TSO has to have the tools to observe the entire system, which include all the
interconnections with the distribution companies and other networks, and also the
real time generation of the system. Until now it was easy, since only big plants were
in the system, and typically connected to the transmission network. But in the
coming years, the number of sources will become huge, and will be connected to any
point in the network. The question now, is how much real time information has to be
integrated into the TSO computer systems to obtain the highest efficiency in the
electrical system.

STAKEHOLDERS Smart Grids Benchmarking
July, 2010 39
These questions have to have an answer translated in new services and have to be
supported by the transmission network to help accomplish a higher flexibility in
operation that will help the stability and security of the system.
Additionally, due to the uncertainty of the renewable power plants production, it is
necessary to count with reserve backup generation in the own network, or optionally,
share common reserves with neighboring countries through interconnections. The
EU has plans to implement a supergrid that would interconnect the transmission
systems from the northern countries to the north of Africa. The available power
should be at least the 10% of the maximum consumption.
3.5 Distribution System Operators
Distribution system operators will play a key role for the viability of smart grids that
are basically set on distribution networks. The general deployment of communication
systems and automation equipment until the user end point as part of the smart grid,
will mean an important effort has to be made by distribution companies, since it is in
their networks where the major impact must occur.
The current network is dimensioned for the peak load period, with little automation
in high voltage, very little in medium voltage and none in low voltage networks. This
means an almost null operational flexibility in the whole distribution system and
hence a traditional and inefficient management scheme. The increase in operation
possibilities and the demand side management shift to cheaper prices, means the
energy consumption could be more efficiently distributed. In this way, investment in
new assets that would be necessary with demand growth in a traditional scheme,
need not be made if the efficiency increases. Costs for consumers would be lower in
terms of energy generation, and the bottom line is that a higher, but much more
rational use of the network can be achieved.
The smart grid is fundamentally based on different devices that are in constant
communication between network users. This increase in information allows a higher
gain in efficiency in the distribution area.

STAKEHOLDERS Smart Grids Benchmarking
July, 2010 40
A common mistake is to think that due to the huge number of clients, the technology
needed for this high integration of communications is unavailable. However, there
are no technical problems for the implementation, but actually the barriers are purely
economic ones. The communication between the central dispatch and the
substation – or the transformer center of medium to low voltage – can typically be
done easily through the public network, and from there to the user house. It is
possible to communicate through power line carrier over the own electric lines.
Directly proportional to the vast number of clients are the needs in equipment
necessary to achieve correct communication. Given current regulatory incentives,
quality of service may justify a very small number of automation made on the
distribution network, about 5% of the elements depending on the network design.
But still far from the requirements, an efficient grid would need to have to comply
with all the coming challenges. The devices needed are today too expensive to justify
a reasonable return. [42]
With a scheme, where the clients would be responsible for the costs, directly or
indirectly, of the two-way communication meters, a very important part of the
needed communications would be solved, and the DSO could reach much higher
levels of automation. This would bring a wide range of advantages for the
distribution company.
Firstly, the quality of service would rise exponentially. Although already considered
satisfactory in many countries, a better quality of service means higher revenues for
distribution that work under incentive scheme regulation, and very high economic
savings for the aggregated customers, meaning gains in society as a whole. Recall
figure 10, if the cost of distribution falls the graph would swift to a balancing point
with higher quality (see figure 12). The demand quality cost and utility quality cost
functions change with time due to changes in related costs.

STAKEHOLDERS Smart Grids Benchmarking
July, 2010 41
Figure 12 Swift Quality Cost vs. Conformance.
Shift from high cost for the distribution company to obtain higher quality of service to lower cost
under hypothesis of automation being waged by clients.
Source: inspired by www.emeraldinsight.com
Operating a poorly automated system means that in case of fault, the DSO will not be
aware of the error until the client communicates it. The problem reaches individual
client level. What is more, locating the fault in the actual network must be done
physically through maintenance crews that must examine the lines and devices, in the
actual scenario. All this process is time demanding and expensive. Under automated
operation the process of restoration of supply could be done in much shorter time,
since the smart devices working together, would inform of the specific location
where the fault is located. Once more, the important number of faults that are due to
avoidable causes could be foreseen by the operator and dodged altogether, signifying
savings in maintenance and increasing the life span of assets.
Another way in which the maintenance and assets would be exploited more
efficiently is in the equipment substitution criteria. If the load balance of a line or
transformer is unknown its operating life is estimated. This means that sometimes,
assets are replaced prior to their optimal amortization, and other times break because
of aging, causing a problem to the system. The first case is economically inefficient,
and the second is even worse since it compromises system security. It would be
much more efficient to optimize the substitution of the assets. In a highly
communicated system power flow information can be taken, and the use of assets
can be recorded in detail. Useful life of assets is a very important optimization to
take into account, due to their extremely high costs.

STAKEHOLDERS Smart Grids Benchmarking
July, 2010 42
Further reward for distribution companies, is that losses will also reduce, both
technical and non-technical.
Technical losses are due to the physical effects of load flows in power lines,
being the most important the Joule effect that is caused by electron kinetic
energy transforming into heat. These losses will be smaller because of the
new ways the system will operate.
Non-technical loses are due to theft by means of illegal connections or
mistaken invoices to clients. The DSO will have the possibility to find the
hitch and solving it by disconnecting illegal connection. The problems with
clients that do not pay will easily be solved by remote disconnection, and
connection.
In this way the distribution company may well be the major risk taker and
responsible for the deployment of the smart grid, but the benefits will also be
substantial. The remuneration of the DSO must be reasonable considering the major
benefits it will bring to all stakeholders.
3.6 Standardization Institutions
The standardization institutions will face problems that up to date have never been
posed. Included in the standardization institutions must be all the users involved in
the new elements. So, technical representatives of generator, transmission and
distribution companies, equipment suppliers and other experts have to be involved in
the discussions to obtain the standards that comply with the users‟ expectations.
As utilities implement Automated Metering Infrastructure (AMI) and seek to extend
the Smart Grid beyond the meter into the home and other devices, the diverse
number of communication protocols creates serious compatibility problems for
utilities, suppliers and consumers alike.

STAKEHOLDERS Smart Grids Benchmarking
July, 2010 43
Communications protocols must be defined. If each supplier has a unique protocol, a
market of winners and losers may outcome. More sensible would be an approach
where open and public protocols were defined.
So, it is very important to end up having open standards that can be shared with
everybody, as a form of promoting development without restriction for the different
suppliers, to reinforce efficiency.
3.7 Regulators
The regulatory authorities are responsible for the well being of the entire power
system, not only in the short term but also in the long term. They must do so by
taking the appropriate actions in the long, medium and short term, to help all
stakeholders achieve the maximum net social benefit.
The role of the regulators has been vital in the liberalization of the power sector.
Currently, the systems have successful operating markets, however new services and
activities demand new regulation. It is crucial to not forget that in a sector where all
parts are interconnected; an unfair allocation of charges may bring direct
consequences on the rest. In this way it is important to have clear rules before
implementation of new activities.
From the regulatory perspective, the imminent social compromises imply actions be
taken in at least the following three fundamental aspects:
1. The environmental challenges many countries have agreed to work on.
Diminishing the effects of climate change, through reducing carbon
emissions, promoting energy efficiency and encouraging a high penetration
of renewable sources of energy production.
2. The interest to keep on promoting higher quality of service.
3. The sustainability of the system always considering the new challenges that
without a doubt will continue emerging.

STAKEHOLDERS Smart Grids Benchmarking
July, 2010 44
The employment of smart grids is considered to be crucial to deal with all these
problems. However the regulatory authorities must be clear and define: roles,
responsibilities and rights.
The economic validation of important investments must be taken assuring the rate of
return is proportional to the risks involved. The regulator must find a way to share
the costs amongst stakeholders to assure deployment occurs. The learning curve of
new technologies and services must be managed so that cost efficiency is reached.
An erroneous regulation that does not remove barriers, or that brings excessive
restrictions, may make a fair rate of return over investment impossible.
3.8 Equipment Suppliers
Suppliers of smart equipment must work hand in hand with standardization
institutions. Together, along with the other stakeholders included in the Standard
Organizations have to specify the standards needed be fitted into the new devices.
And finally, the equipment suppliers have the challenge to make them as sustainable
and cheap as possible, assuring correct operation.

NETWORK SERVICES Smart Grids Benchmarking
July, 2010 45
4 NETWORK SERVICES
The drivers to smart grids, already discussed in chapter 2, all share three common
social compromises that as a result ensure the sustainability of the power system. The
system must be:
Environmentally responsible
Economy efficient
Reliable enough to ensure an adequate security of supply
The answer to the question of if the costs needed to achieve these objectives are
lower than the cost incurred in building such a network, is unknown because it is
difficult to determine just how much investment is necessary and how much benefit
will outcome. It is necessary to distinguish where a surplus of investment is made
and where it lacks. Determining the perfect investment is impossible due to the
abundant number of unknowns. Estimations of optimal investment may and should
be calculated under a number of different schemes taking into account the future
forecasts and uncertainty factors. Once more it is important to consider that with the
new network, new products and services will emerge modifying expectations.
The present chapter will be devoted to an examination of the most important new
products and services that a smart grid will predictably introduce. Although precise
information about these products is not yet known, a promising future is expected.
In the following years, deployment of the following products and services is
expected:
a. Smart meters
b. Home automation
c. Electric transportation
d. Energy quality
4.1 Smart Meter

NETWORK SERVICES Smart Grids Benchmarking
July, 2010 46
The vast majority of stakeholders agree that in the coming decade, smart meters will
become a common feature in consumer connection points. Customers will need these
devices to adapt to future network needs, and to take advantages of the benefits.
The term smart meter, similarly to what occurs with the description of smart grid, is
not very precisely defined. This is because no specific standards have been agreed
upon; leaving a range of different possibilities open to choice, from relatively simple
meters to extremely advanced ones.
A smart meter is a device that records the energy consumed and quantity of power by
the customer, i.e. the meter, and has the ability to communicate information to the
outside world, transforming the traditional passive meter into an active smart meter.
Therefore, any meter that can communicate is a smart meter.
The communication can be one-way or two-way. The level of smartness depends on
the exact capabilities of the meter. One-way communication is the simplest way of
smart meter and facilitates Automated Meter Reading (AMR). As device complexity
increases, two-way communication and advanced services are introduced. The meter
begins to be a part of the intelligent grid. The term then commonly used to refer to
this kind of meter is Advanced Metering Infrastructure (AMI) (see figure 13).
Figure 13 Smart Metering Infrastructure levels.
Market definition and expectation of different types of metering infrastructures.
Source: http://www.ti.com/corp/docs/landing/smartmetering/

NETWORK SERVICES Smart Grids Benchmarking
July, 2010 47
Communication in a smart meter can be wired or wireless. A common wired scheme
is via the power line. This is commonly known as Power Line Communication (PLC).
PLC uses the existing infrastructure to modulate information on the main signal.
Whereas wireless communication uses Radio Frequency (RF) to communicate using
wireless transceivers, a device that has both a transmitter and a receiver sharing
common circuitry. A variety of wireless standards such as Zigbee, 802.15.4,
Bluetooth, etc… dominate the metering industry today.
The meter is especially important because it is the channel of communication
between the personal network inside the home and the external distribution and
transmission networks. In a residence, the network formed inside a home is called a
Home Area Network or HAN. In a similar way, the external network is known as a
Wide Area Network or WAN. The smart meter just outside the home forms both a
HAN and WAN (see figure 14). The HAN communicates with appliances inside a
home to monitor and control energy consumption. The WAN allows the meter to
communicate with other external sources, like the smart grid.
Figure 14 HAN and WAN.
Source: http://www.ti.com/corp/docs/landing/smartmetering/
Smart meters are a breakthrough to the metering industry bringing a number of
advantages to the consumer and utility companies.
Some of the advantages for the customer include:
Demand information on consumption via sub-metering in a home.

NETWORK SERVICES Smart Grids Benchmarking
July, 2010 48
Clear and accurate invoicing based on actual consumption.
Automated failure information and handling.
Capability for selling energy back to the supplier which will facilitate
microgeneration technology (e.g. solar panels or wind turbines).
Flexible tariffs that measure consumption over set time periods.
Additionally, some of the advantages for the utility companies are:
Network optimization.
Automated metering and invoice processes.
Remote disconnect of power to delinquent players.
Real time monitoring of meter tampering.
Suppliers will be able to differentiate their tariffs and services through
offering alternative means of displaying energy consumption – i.e. through
mobiles, the internet or via digital TV.
Improved accuracy of forecasting energy demand at different times of the day.
For the previous reasons, it is now commonly recognized that smart electronic meters
deployment will be the first key step to smart grid success. The new feature will
enable energy efficiency gains and therefore reduce carbon emissions.
The smart electrical meters need to face new tests such as tariff flow profile
management or over the air upgrade. This implies that the application must have well
designed processors that must support large quantities of data. These data must be
banked in the device‟s memory, be securely encrypted, for security reasons and
processed with enough connectivity, to interface with the smart grid functions.
These modern architectures will be installed in the field for the next decades. And
will have to be built reliable and at the right cost, to enable mass deployment. The
definition of standards must be approached to find the right sort of solutions.
In summary, smart meters will empower customers to make choices on how and how
much energy they use. Suppliers will install two-way communication systems that

NETWORK SERVICES Smart Grids Benchmarking
July, 2010 49
display accurate real-time information on energy use for consumer and feedback
energy information to supplier.
4.2 Smart Home/Home Automation
Till this point, this thesis has focussed on the drivers towards a smart grid at regional
system level. However since an important part of the system is composed of small
clients it is interesting to analyse how the future grids will change electricity use at a
domestic level.
The term smart home is used to describe a home that has been automated to obtain
system and personal efficiency by driving energy costs down.
Today home automation, or domotics, basically consists of state of the art
technologies applied for domestic services. Another definition widely used is the
integration of technologies in the intelligent design of a social space. Examples of
these automations are: (i) home entertainment systems, (ii) house plant watering, (iii)
pet feeding, (iv) domestic robots, (v) automatic shades, etc. These products are
expensive and consumers are not aware of their direct and indirect benefits, for this
reason demand is low and therefore only a small market exists. An important
consequence of the imminent introduction of smart meters into consumers‟ homes is
the arrival of new power products and services. As clients become aware of cost,
through an efficient electricity price signal, an incentive towards energy efficiency
and new commodities will drive consumers to look for new products. The industry
will start a new market for these goods, whose primary expectations bode well for a
promising future.
Recall that primarily what users are interested in is in obtaining a lower electricity
bill. The nature of the market means there are basically two ways of achieving these:
(i) either there are cheaper offers, this means the generation and distribution is made
more efficient, or (ii) there is a reduction of demand, this implies reducing the energy
consumption.

NETWORK SERVICES Smart Grids Benchmarking
July, 2010 50
Consumption can be reduced overall with less use or with the use of new
technologies. Reducing domestic energy consumption can be accomplished in many
ways. Good insulation, double-paned glass, weather-stripping and similar efforts can
improve your home's ability to retain the desired temperature. Some homeowners
take a further step and choose to install solar panels or to simply reduce their energy
use, for example by turning off standby modes or computers when they're not needed.
But as part of managing your energy use, it's important to know how much electricity
you're actually using, even though your monthly electric bill may not include all the
relevant information. [24] This is why the smart meter is a key element for
improving efficiency, by providing a competent price signal. When the user is able to
react by reducing or moving its power needs during excessively expensive periods,
this action is known as Demand Side Management (DSM).
Home automation has four key drivers, which will substantially increase as the smart
grid deploys: [25]
1. Convenience
2. Security
3. Savings
4. Environment
Convenience – The increase in personal comfort is a natural driver in any
market. If the benefit the product returns is higher than the cost, customers
will buy the product. The benefits are subjective, but as price decreases the
quantity sold will increase. An automated home increases comfort by saving
time and effort. Routine occupations such as: watering your plants, turning
off all lights, setting the thermostat to economy mode and arming the security
system can all be automated. Moreover, automation has an important market
in the entertainment sector. As an example, take for instance the case of how
traditional television sets have changed over the last decade to home theatres.
The experience of having the lights dim, curtains close, the movie to start and
the phone to mute all with the touch of a button is another market front for

NETWORK SERVICES Smart Grids Benchmarking
July, 2010 51
this technology that can incorporate further benefits thanks to the future
electricity model.
Security – More important than convenience may be the higher security an
automated home may provide. Simple fire detectors, gas shut down devices
and ventilation systems, lighting escape paths, security cameras and
automatic dialling to emergency services are all important devices that can be
intelligently synchronized into one‟s home to increase security levels.
Savings – The economic savings are the benefit that traditionally drives
consumers to a product. As energy costs increase with society having higher
power needs, the importance at an individual level of saving electricity
increases. With a smart grid implemented at regional level and AMI in each
home, the operation of lights, water heater, heating and air conditioning
systems, entertainment components, appliances and irrigation systems may be
used in a highly efficient way.
Environment – As a direct consequence of being more efficient the automated
home become eco-friendly. This may have intangible social benefits given
that nowadays not being ecologically aware is frowned upon by society.
The smart grid will allow future development by coordinating the interactions
between the WAN, the smart meter and the HAN. Both utilities and home owners
will work together to reach a win-win solution. The new products are being designed
to bring smarter solutions that take advantage of the new energy model. Some of the
products expected to have a high demand are for instance the development of
microgeneration, which is defined as the on-site generation of zero or low carbon
emission, heat and power by small consumers to reduce external power needs,
examples are: (i) photovoltaic panels, (ii) small wind turbines, (iii) combined heat
and power, (iv) solar water heating… [26] Also energy storage systems bring
convenience and security in the way of more reliable energy, and savings and
efficiency by charging during valley hours and reducing overall system consumption
in the peak.
Consumption pattern, quantity and type, may vary strongly depending on factors
such as location, power price and life style. However in the vast majority of countries,

NETWORK SERVICES Smart Grids Benchmarking
July, 2010 52
domestic clients are unaware of the price they pay for energy consumed - €/MWh,
and energy prices do not distinguish between different time periods. Furthermore
smart appliances are not used. The promising possibilities of home automation can
be explained through the very simplified model designed to show the hypothetical
electricity use of a small dwelling. Let us consider the following four possibilities:
Traditional Scheme – Considering a single tariff or flat rate of 0,12 €/kWh,
with no off-peak discrimination and no smart appliances (see table 1).
Table 1
Power [W] use [h]
Energy
[kWh]
Cost
[€]
Standby – Entertainm. 10 24 7,2 - 0,864
Standby - Phone, Rout. 75 24 54 - 6,48
TV 120 3 10,8 - 1,296
Music 40 2 2,4 - 0,288
Laptop 1 50 6 9 - 1,08
Laptop 2 50 6 9 - 1,08
Washer 500 0,3 4,5 - 0,54
Dryer 5400 0,3 48,6 - 5,832
Dishwasher 1500 0,5 22,5 - 2,7
Cooking 1000 1 30 - 3,6
Security light 26 12 9,36 - 1,123
Lighting 300 6 54 - 6,48
Refrigerator 500 9 135 - 16,2
Heat pump 1500 4 180 - 21,6
576,36 Cost: 69,16
Under this hypothesis the client will consume a quantity of energy, in the
example 576,36 kWh in a month and be invoiced for a total cost of total
energy times the flat rate (0,12 €/kWh) giving a total cost of 69,16 €. In this
scheme clients are unaware of electricity cost, and will not have an incentive
to reduce cost and energy use.
Hourly discrimination – Peak prices of 0,14 €/kWh and an off-peak of 0,06
€/kWh from 10 pm to 12 am. This mean that during the off-peak the energy
saving are around 50% with respect to the regular tariff. Therefore during the

NETWORK SERVICES Smart Grids Benchmarking
July, 2010 53
14 hours of cheaper electricity it is ideal to turn high consumption appliances
on. With no smart appliances and an unaware customer (see table 2).
Table 2
Power
[W]
use
[h]
Off-peak
[h]
Peak
[h]
Energy O-
p [kWh]
Energy P
[kWh]
O-p
Cost [€]
P Cost
[€]
Standby - Entert 10 24 14 10 4,2 3 0,252 0,420
Standby - Others 75 24 14 10 31,5 22,5 1,89 3,150
TV 120 3 0 3 0 10,8 0 1,512
Music 40 2 0 2 0 2,4 0 0,336
Laptop 1 50 6 0 6 0 9 0 1,260
Laptop 2 50 6 0 6 0 9 0 1,260
Washer 500 0,3 0 0,3 0 4,5 0 0,630
Dryer 5400 0,3 0 0,3 0 48,6 0 6,804
Dishwasher 1500 0,5 0 0,5 0 22,5 0 3,150
Cooking 1000 1 0 1 0 30 0 4,200
Security light 26 12 11 1 8,58 0,78 0,515 0,109
Lighting 300 6 3 3 27 27 1,62 3,780
Refrigerator 500 9 4,5 4,5 67,5 67,5 4,05 9,450
Heat pump 1500 4 0 4 0 180 0 25,200
138,78 437,58 8,327 61,261
Energy: 576,36 Cost: 69,59
The idea behind discrimination periods is that the consumer will have
incentives to shift consumption to cheaper periods. However as is described
in the numerical example if the consumer is unaware of this and there is not a
channel of communication, the customer will not change its energy use habits
and there is a risk of achieving worse results. The discrimination price will
bring a net negative benefit since the punishment of consuming in peak
period at a higher price (0,14 €/kWh) will weigh more than the benefit of
consuming during off-peak periods at (0,06 €/kWh). The total cost will be
0,43 € more expensive using the same quantity of energy in the same way that
under a flat rate scheme.
Hourly discrimination – Peak prices of 0,14 €/kWh and off-peak of 0,06
€/kWh. With no smart appliances but with an aware customer thanks to a
smart meter with two-way communication (see table 3).

NETWORK SERVICES Smart Grids Benchmarking
July, 2010 54
Table 3
Power
[W]
use
[h]
Off-
peak [h]
Peak
[h]
Energy O-p
[kWh]
Energy P
[kWh]
O-p
Cost [€]
P Cost
[€]
Standby - Entert 10 0 0 0 0 0 0 0
Standby - Others 75 24 14 10 31,5 22,5 1,89 3,15
TV 120 3 0 3 0 10,8 0 1,512
Music 40 2 0 2 0 2,4 0 0,336
Laptop 1 50 6 6 0 9 0 0,54 0
Laptop 2 50 6 6 0 9 0 0,54 0
Washer 500 0,3 0,3 0 4,5 0 0,27 0
Dryer 5400 0,3 0,3 0 48,6 0 2,916 0
Dishwasher 1500 0,5 0,5 0 22,5 0 1,35 0
Cooking 1000 1 0 1 0 30 0 4,2
Security light 26 12 11 1 8,58 0,78 0,5148 0,11
Lighting 300 6 3 3 27 27 1,62 3,78
Refrigerator 500 9 4,5 4,5 67,5 67,5 4,05 9,45
Heat pump 1500 4 0 4 0 180 0 25,2
228,18 340,98 13,69 47,74
Energy: 569,16 Cost: 61,43
The installation of two-way communication meters with an efficient price
signal and after educating customers in energy appliance consumption will
bring the correct incentive to consumers to change traditional energy habits.
In the example consumers switch completely off entertainment systems, such
as television sets or video players, by disconnecting the systems from the
actual appliance not just leaving the system on standby with the remote
control. Another change may come through shifting appliances that can be
used during off-peak periods with no major problem. Laptops can be charged
during the night, the washer, dryer and dishwasher may turn on during the
cheap 14 hours. Just with these few modifications energy is saved and used
more efficiently. The benefits in economic terms are noticeable in the
example over 7 € are saved, this is around 11% of the hypothetical monthly
bill. However the drawback is that consumers will lose personal quality of life
having to worry about when to turn on and off appliances.

NETWORK SERVICES Smart Grids Benchmarking
July, 2010 55
New energy model hypothesis – Price discrimination and smart appliances
that disconnect appliances instead of standby and have better efficiency rates,
and smart metering infrastructure, that provide competent price signals (see
table 4).
Table 4
Power
[W]
use
[h]
Off-peak
[h]
Peak
[h]
Energy
O-p
[kWh]
Energy P
[kWh]
O-p Cost
[€]
P Cost
[€]
Standby – Entert. 10 24 0 0 0 0 0 0
Standby – Others 75 24 14 16 31,5 36 1,89 5,04
TV 120 3 0 3 0 10,8 0 1,512
Music 40 2 0 2 0 2,4 0 0,336
Laptop 1 50 6 6 0 9 0 0,54 0
Laptop 2 50 6 6 0 9 0 0,54 0
Washer -10% 450 0,3 0,3 0 4,05 0 0,243 0
Dryer -10% 4860 0,3 0,3 0 43,74 0 2,6244 0
Dishwasher -10% 1350 0,5 0,5 0 20,25 0 1,215 0
Cooking 1000 1 0 1 0 30 0 4,2
Sec. Light -10% 23,4 12 11 1 7,722 0,702 0,463 0,098
Lighting -10% 270 6 3 3 24,3 24,3 1,458 3,402
Refrigerator smart 500 9 6 3 90 45 5,4 6,3
Heat pump 1500 4 1 3 45 135 2,7 18,9
284,562 284,202 17,074 39,788
Energy: 568,764 Cost: 56,862
The use of home automation combined with an efficient price signal means the
consumer will not need to have to deal with the uncomfortable part of the
problem of worrying about turning off or shifting use to less wasteful periods.
The automation in smart appliances may provide this service directly for them.
In addition, these appliances are more efficient and automatically compute
complex algorithms to optimise when to turn on depending on the price given
by the smart meter and other consumer personalized variables. In the example
more than 12 € per month are saved compared to the traditional monthly bill.
The other advantage is that the overall power system is more efficient, meaning less
hazardous for the environment. The smart grid can allow further development of new

NETWORK SERVICES Smart Grids Benchmarking
July, 2010 56
products that would bring more benefits in the form of commodity and savings.
Other products not mentioned in the example, but that augurs an important
deployment, are the introduction of: micro-generation, as previously mentioned in
this chapter; and the electric vehicle, to which the next section of this chapter is
devoted, since it will play very relevant roles in this context.
Finally it is important to mention that since the deployment of smart grids is so
important for environmental reasons, but difficult to justify economically; it is of
great importance to seize all the possible benefits related. Therefore it is important to
have a clear understanding about these in order to introduce smart grids, smart meter
and appliances that have standards prepared to achieve this. Introducing smart meters
that have an hourly discrimination prices but do not efficiently interact with the
consumer through an easy to read screen or that do not communicate through a HAN
with the automated appliances will not allow capturing many of the benefits needed
to justify the investment.
4.3 Electric Transport
The alarming situation of energy supply and use is unsustainable - economically,
environmentally, and socially. The transport sector is responsible for the highest final
end use of electricity throughout the majority of developed countries. (See figure 15).
39%
33%
12%
16%
Final energy use U.S. 2008
Transportation
Industrial
Comercial
Residential
Figure 15 Final energy use U.S. 2008.
Source: Lawrence Livermore National Laboratory.

NETWORK SERVICES Smart Grids Benchmarking
July, 2010 57
Besides being responsible for the highest final energy use, the transport sector is also
one of the less efficient ones. Taking the train or bus is cheaper and more efficient
than using a family wagon, yet today, a dynamic way of life requires a comfortable
and quick mode of transportation, in this way the car is the mode of transportation of
most citizens. On the other hand, the desire to cut down greenhouse gas emissions
and reduce our dependence on foreign oil, means electric drive is a solution that
shows potential [28]. However, adapting the world for electric vehicles will not
happen overnight. It will require substantial investments in technology,
manufacturing, modernizing infrastructure and market development. The power
utilities and the car industry, two sectors that have traditionally been independent
must work together to achieve deployment. The car industry must develop new cars,
with all the technologies that this demands, that are able to comply with the low
emission standards, while bringing competitive comfort and drive experience
compared to traditional ones. On the other hand, the infrastructure required to power
these vehicles are networks that can cope with the new needs. The power sector shall
be responsible to foresee the more complex power flows at distribution level and
adapt the network; as a result a smart grid is needed to get on the right road, right
away.
International organizations are aware of the needs. The International Energy Agency
(IEA) published in December 2009, a detail paper on “Global Gaps in clean energy
research development and demonstration” [27]. In this report the agency expresses
the future economic needs in RD&D of different energy related technologies. As
well as research needed in topics such as: energy efficiency, carbon capture storage
(CCS) systems, smart grids and other renewable sources, the report calls out the
importance of the deployment of advanced vehicles as the primary needs for funds in
RD&D during the coming years (see table 5). To achieve the blue map 2050 goal
almost half of total fund for RD&D for the sector should be devoted to advanced
vehicles.

NETWORK SERVICES Smart Grids Benchmarking
July, 2010 58
Table 5 RD&D Gap Analysis Overview. Source: IEA [27]
Before going into RD&D priorities, a very basic conceptual background of the
different types of electric vehicles is given for a better understanding.
An electric vehicle is one, in which the torque supplied to the wheels comes from an
electric motor, much more efficient than a traditional combustion engine. This
electric motor may be powered by different sources of energy:
Either exclusively by rechargeable batteries, usually made of lead acid or the
more modern and efficient Lithium-ion. All Battery electric vehicles (EVs)
are charged through the network and through advance development will be
able to sell back energy to the grid. At the present time battery vehicles have

NETWORK SERVICES Smart Grids Benchmarking
July, 2010 59
the advantage of being very cheap to run, due to the low electricity price and
use of very efficient engines that do not emit pollutants. However the main
drawback is that the technology is immature and very expensive, batteries
have low energy storage to mass ratio, and this means these vehicles are very
heavy, making mileage low. An additional disadvantage is that recharging
takes very long using traditional low voltage sockets. For these reasons the
infrastructure necessary is crucial.
Figure 16 Electric Vehicle.
Source: inspired by CEESA PROJECT. WP.3. FUTURE ELECTRIC POWER SYSTEMS [29]
When the vehicle is powered by a combination of batteries working together
with an internal combustion engine (ICE) using petrol or diesel, these are the
so called hybrids (HEVs), when these are able to recharge the batteries form
the network or sell it back they are known as plug-in hybrid electric vehicles
(PHEVs). These cars seem to be a positive compromise for a transition to
pure EVs, reducing the drawbacks yet still achieving important benefits.
Figure 17 Plug-in Hybrid Vehicle.
Source: inspired by CEESA PROJECT. WP.3. FUTURE ELECTRIC POWER SYSTEMS [29]
Another promising possibility is the use of hydrogen as a source of energy for
fuel cells. These fuel cell vehicles (FCVs) are powered with hydrogen (H2)
produced from an electrolysis process. A process that uses an electric current

NETWORK SERVICES Smart Grids Benchmarking
July, 2010 60
to produce H2 in other word producing car fuel with electricity. The basic idea
behind a hydrogen fuel cell is to use as its fuel and oxygen, usually from air,
as its oxidant [30]. Fuel cells generate electricity from a simple
electrochemical reaction in which an oxidizer in the anode, O2 from air, and a
fuel, H2, in the cathode of the fuel cell combine to form a product, water H2O.
Therefore the advantage of using H2 as a fuel is that the only residue is water.
In addition, the fuel cell itself has no moving parts, making it a quiet and
reliable source of power. The electrolyte that separates the anode and cathode
is an ion-conducting material. At the anode, hydrogen and its electrons are
separated so that the hydrogen ions (protons) pass through the electrolyte
while the electrons pass through an external electrical circuit as a Direct
Current (DC) that can power useful devices. The hydrogen ions combine with
the oxygen at the cathode and are recombined with the electrons to form
water. The reactions equations are shown below (see equation 5).
Anode Reaction: 2H2 => 4H+ + 4e- (5)
Cathode Reaction: O2 + 4H+ + 4e- => 2H2O
Overall Cell Reaction: 2H2 + O2 => 2H2O
Fuel cell cars don‟t have the drawbacks of long recharging and are almost
identical to traditional ones, however the electrolysis process needed to
produce hydrogen is very expensive due to the high energy demanded,
furthermore the technology is still immature and problems exist related to
hydrogen storage in compact and secure ways. It would be needed to develop
a brand new infrastructure to produce, transport and store hydrogen. This last
activity is particularly risky. Under this scheme the paradigm would change,
besides having a vehicle, the client would have an energy storage system,
being able to sell power back to the grid.

NETWORK SERVICES Smart Grids Benchmarking
July, 2010 61
Figure 18 Fuel Cell Powered Vehicle.
Source: inspired by CEESA PROJECT. WP.3. FUTURE ELECTRIC POWER SYSTEMS [29]
Finally, it is important to consider that electric vehicles may be part of the
solution but that they are not necessarily the only solution. There are a
number of alternatives that achieve the same final objectives, but using
traditional combustion engines. Bio-fuels have almost zero emission and
there is no need for these to be imported. Switching to Bio-fuel means no
major changes are needed in the electricity grid for transport purposes.
However this also means less added value services for consumer such as
energy storage.
Figure 19 Bio-Fuel Powered Vehicle.
Source: inspired by CEESA PROJECT. WP.3. FUTURE ELECTRIC POWER SYSTEMS [29]
Clearly economic incentives are needed to deploy ways to achieve the efficient
vehicle technologies that are capable of seizing all the benefits and, just as
importantly, recover the costs. Therefore in this early stage, RD&D is necessary for
this purpose. According to the IEA decarbonisation of the transport sector will
require a significant move towards more efficient vehicles, advanced propulsion
systems, improved vehicle energy storage, and low-carbon alternative fuel
production and compatibility with vehicles. The highest priority advanced vehicle
RD&D investments should include:

NETWORK SERVICES Smart Grids Benchmarking
July, 2010 62
Energy storage: For electricity and hydrogen to realise their full potential as
transportation fuels, improved on-board storage devices will be needed, with
energy densities two to three times those for current best performance levels.
Target systems include PHEVs in the short term, followed by EVs in the
medium term, and FCVs in the long term. These vehicles will be more
expensive than conventional vehicles; minimising any cost increase via
reduced battery and other energy storage costs will be critical to their success.
Lightweight materials: Significantly lighter vehicles are needed to increase
vehicle efficiency, such as very high strength steel, aluminium, and
composite materials.
Fuel efficient technologies: Options include advanced internal combustion
engine based power trains capable of recovering some of the energy lost as
heat. HEVs represent a suite of technologies that continue to be improved and
optimised. More efficient power trains are accompanied by energy efficiency
improvements addressing all vehicle components, like low rolling resistance
tires and more efficient on-board electric and electronic devices.
Breakthroughs in thermoelectric materials for waste heat recuperation are
also possible, both in bulk materials and those associated with
nanotechnology.
Low-carbon fuels and fuel delivery infrastructure: Advances in
production of low-CO2 hydrogen and pathways towards an affordable
hydrogen distribution infrastructure are needed if fuel cell vehicles are to
become a commercial reality. Similarly, recharging infrastructure for EVs
will be required to scale up vehicle electrification, beginning in targeted cities
and regions.
Fuel cell propulsion systems: Continuous improvements in fuel cell systems
are needed, including improved durability and performance under real-world
conditions as well as system cost reduction. Much progress has been made in
recent years but it must continue in order for fuel cell vehicles to become
competitive with ICE vehicles.

NETWORK SERVICES Smart Grids Benchmarking
July, 2010 63
As pilot project proof positive cost benefit analysis, the electric transport sector will
see its market rise. One possible outcome is a mix of traditional, bio-fuelled powered,
EVs and FCVs. The advantages of EVs are already very clear, the vehicle allows for
lower hazardous emissions mainly due to three reasons: firstly, since the electric
engine is more efficient, less overall energy is needed to cover the equivalent
mileage; secondly, since this energy comes from an energy mix of different energy
sources like: solar, wind, hydro, nuclear and fossil, the proportion of fossil fuels is
lower (recall figure 1), and finally the vehicle‟s batteries can be used as energy
storage system that will allow to flatten the load curve allowing a more efficient use
of the grid. Apart from the environmental aspects, the economic aspect is positive in
the way that electric transportation is cheaper due to the lower cost of electricity
compared with gasoline, considering approximate values of electric, hybrid and
internal combustion engines (see table 6).
Table 6 Estimated Current Cost to Run Different Vehicles
Assumptions €/100km gCO2/km
electric motor 0,15 kWh/km · 0,12 €/kWh 1,80 88*
Hybrid 4,6 l/km · 1,30 €/l 5,98 109
ICE 6,0 l/km · 1,30 €/l 7,80 135
* considering the 2007 Spanish energy mix
The whole system will benefit from the overall increase in efficiency. But to deploy
all these systems a grid able to cope with more complex energy flows is necessary.
The possibility to store electricity, means demand must have further tools to
effectively recharge vehicles during off-peak and reduce peak consumption. Correct
price signal will allow flattening the load curve. Even though the penetration of
electric vehicles will mean higher electrical energy use (see the additional green area
in the example in figure 20 or recall figure 11), this energy will substitute traditional
transport energy - petroleum; hence overall total energy use will be lower [31]. More
importantly, not only is more energy saved, but as green house gas emission are
avoided, because of the less pollutant energy mix, the net social benefit is higher (see
equations 6 and 7).

NETWORK SERVICES Smart Grids Benchmarking
July, 2010 64
Avoided Use of Petroleum – Electricity Mix Use = Energy Savings (6)
Energy Savings + Avoided GHG >0 Higher Net Social Benefit (7)
Figure 20 EV Load Curve.
BLUE - example of daily load curve. GREEN - additional energy needed to recharge electric vehicles,
under the hypothesis of penetration of one million EVs in the Spanish system.
Source: inspired by Proyecto Piloto de MOVilidad ELEctrica: MOVELE [23]
Finally, others issues that need to be solved are external electricity infrastructures
that must be developed by stakeholders both from the power and car industries.
Examples of these important aspects are: types of charge (slow or fast), types of
connection point (domestic plugs or electro-stations), etc.
4.4 Energy Quality
Taking into consideration all the previous assumptions, it seems clear that the smart
grid together with all its possible directly linked products brings higher efficiency.
Because, the higher grid automation implies that system security will also be higher
and therefore energy quality will be more robust.

NETWORK SERVICES Smart Grids Benchmarking
July, 2010 65
Once the communications have being deployed in order to get the SM information,
the next step is to acquire real time information from the MV network and
telecommand some neuralgic points.
This level of automation will allow DSOs to increase the quality of service through:
Supervision of MV and LV network
Real time fault detection
Real time automation and control of MV network
Alarm detection in CTs
Failure detection in MV and LV without test-error procedure
Unbalance/overload/deviation detection on voltage
Losses reduction
Assets load
Increase MV network configuration
To have profiles of load/voltages/current in the network
Grid automation is basically combining the power grid with Information and
Communication Technologies (ICT). Communications allow network providers to
obtain valuable information, and with this information, it is possible to better
understand problematic power flows. Furthermore, some devices can actually act on
the grid, combing the higher ICT with active devices; higher network flexibility is
achieved. Detecting real time problems and solving them before reaching emergency
situations, or in the worst case scenario allowing faster restoration.
When describing the most important parts of the power sectors, it is clear that they
are greatly related to the backbone of the system, this is the network. All the topics
listed below are directly related to energy quality:
Safety – line worker, public, equipment
Reliability – up time
Security – ability to meet demand
Robustness – environmental

NETWORK SERVICES Smart Grids Benchmarking
July, 2010 66
Market – cost of congestions

WORLD DEVELOPMENT SURVEY Smart Grids Benchmarking
July, 2010 67
5 WORLD DEVELOPMENT SURVEY
The Previous chapters have been devoted to giving a detailed discussion on the great
necessity and future benefits that the deployment of a smart grid will bring. The
questions that arise are then: “What are we waiting for? Why doesn‟t any country in
the world has a smart grid?” The answers to these questions are open and depend on
who you ask because each nation is very different. Therefore one of the strong points
of this thesis is to achieve a greater understanding of how this problem is being faced
worldwide.
Therefore the objective is to study the current state of the art situation, the
implementations executed or under way, as well as the government and regulator
point of view in a number of states of Europe and other areas, and obtain
expectations from different stakeholders. Identify the different impacts the
implementation that these grids will have on the different stakeholders throughout
Europe and other areas in order to help regulators and utilities understand different
views, as well as recognize possible inconveniences and barriers to their necessary
deployment.
At this point of the discussion, it is very important to remind the reader that the
problem of deploying smart grids is merely economic. A network should be as smart
as the society that pays for it decides it should be. In this way a network in Japan,
where network charges are high, is already much more efficient than one in a less
developed country, as it is logical.
Another important fact to be kept in mind is that investment is the main economic
barrier, due to the high risk associated with sunk costs. The business cases do not yet
clearly prove that returns are higher than the costs. And above all these, a series of
risks related to this return exist.

WORLD DEVELOPMENT SURVEY Smart Grids Benchmarking
July, 2010 68
5.1 Methods
To gather information to develop this study, two approaches have been used. Firstly,
information has been gathered from a series of different electricity platforms that are
working on the current development of smart grids. Secondly, an internationally
targeted survey was designed to recollect specific information and a series of similar
questions to validate results comparing them to the ones from established platforms.
5.1.1 Subjects
For preliminary examination, information on the different countries has been gathered
from an important number of references. However three papers: (i) “Smart Grid and
Networks of the Future” - Eurelectric Views, (ii) “Position Paper on Smart Grids” -
ERGEG and (iii) “EcoPinion: Separating Smart Grid from Smart Meters? Consumer
Perceptions and Expectations of Smart Grid” – EcoAlign, have been used to gather a
global view of the problem. These papers have been of vital importance for this thesis
since they have been used to acquire answers and compare results.
“Smart Grid and Networks of the Future” - Eurelectric Views: Provides data
from 30 DSOs from 16 European countries. Quantitative Histograms
answering 45 questions on nine different topics to understand the present
status and perspective of smart grid implementation until 2020 are attached
together with interesting discussions on the topic.
“Position Paper on Smart Grids” – ERGEG: aims to initiate a dialogue with
all stakeholders of the European electricity power systems and markets, in
order to assist regulators in understanding how smart grids can benefit
network users and, assuming that cost-effective benefits can be identified, to
explore ways in which the development of smart grids can be encouraged.
This paper explores the drivers and opportunities for „smarter‟ networks from
the users‟ perspective. Most importantly, it discusses the regulatory
challenges and priorities and proposes a number of questions and issues for
stakeholders to respond to. Answers to these questions are particularly
interesting and can be found in the ERGEG website.
“EcoPinion: Separating Smart Grid from Smart Meters? Consumer
Perceptions and Expectations of Smart Grid” – EcoAlign: conducted the

WORLD DEVELOPMENT SURVEY Smart Grids Benchmarking
July, 2010 69
survey in conjunction with Clasma Events, in May 2010 to test United States
consumer perceptions and expectations in regard to smart grid.
Information has also been gathered directly from end-sources through the
development of a detailed survey prepared specifically for this thesis. A list of over
700 emails was established after performing intense research. The sample was
balanced to match the worldwide stakeholders by three categories:
1. Stakeholder function:
(i) Regulators
(ii) TSO
(iii) DSO
(iv) Utilities
(v) Independent
2. Organization
3. Country involved
The hypothesis was established that the expected reply would be in between a 5% to
10%. This low participation was hypothesised for the following reasons:
Lacks of interest to answer a student – many consultancies are already
conducting similar studies with more resources.
Lack of knowledge about the subject – although all emails belonged to
stakeholders involved in the matter. A portion is not aware of the regulation
on the subject.
Incorrect email – The initial source of where the emails where collected are
subject to error.
Delivery Failure
Out of the office / Vacation
5.1.2 Data Acquired
All subjects where sent the same email that consisted of a letter with the triple
objective of:

WORLD DEVELOPMENT SURVEY Smart Grids Benchmarking
July, 2010 70
Informing of the study taking place and its importance.
Request for collaboration.
Explained complete confidentiality criteria
The first emails where sent during the month of April 2010, and as previously
planned a new set of emails were redirected in May 2010 to obtain additional results.
Both emails can be found in appendix A.
The actual survey was designed and developed using Google docs software [43].
This software brings advantages to both volunteer and survey developers. A link on
the email redirected volunteers to the Smart Grid Deployment Survey, a fast and easy
way to answer surveys is available, given respondent may answer directly on the
interface and send the answers at the click of a button. The answers are securely
encrypted and available in a self reloading excel spread sheet for developers.
One of the strengths of the survey is that both qualitative and quantitative questions
are presented, all aiming at identifying the current situation worldwide for Smart
Grid deployment. The topics considered are:
1. Origin and role of volunteer.
2. Regulation on Smart Grids in his country.
3. Regulation on Smart Meters in his country.
4. Timing for deployment.
5. Pilot projects.
6. Expected costs.
7. Drivers.
8. Barriers.
9. Additional questions the volunteer considers are important to take into
consideration.

WORLD DEVELOPMENT SURVEY Smart Grids Benchmarking
July, 2010 71
5.1.3 Data Analysis
Primary analysis to the twelve questions included in the survey show the current
situation of the volunteers‟ countries. However, data must be analysed individually
and collectively to ensure results validity. To do so the information obtained is
researched to prove validity, this is simple because volunteers are asked to provide
references. Personal volunteer opinions are also analysed and considered.
Quantitative results are aggregated to compute histograms that can be objectively
compared to results from similar studies developed by established research groups.
Histograms represent a graphic display of the frequency of an answer [44]. In order
to assess whether histogram distributions are similar to the results obtained by others,
we compare both normalized histogram to set qualitative results and use statistical
analysis to test objective quantitative results.
5.2 Results
The results for the smart grid deployment survey are summarised in the following
section, identified by the number of the question.
1. Data origin
Volunteer demographics are shown in charts 1.a and 1.b.
A total of 35 survey answers from 12 different nationalities were obtained between
the months of April to June 2010. Responses are very disperse including answers
from seven European Union member states, four answers from non-EU but OECD
members and one response from a developing country, Brazil. (See figure Answers).

WORLD DEVELOPMENT SURVEY Smart Grids Benchmarking
July, 2010 72
Figure 21 Origin of survey answers
Australia
Austria
Brazil
Canada
France
Germany
Greece
Portugal
Spain
Switzerland
UK
United States
1
1
1
1
1
1
2
1
10
1
1
14
1.a. From what country are you responding?
The United States call can be considered positive obtaining 14 responses. A total of
17 answers came from European member states, although 10 of these came from
Spain, from where this survey was lunched and it has been easier and more effective
to encourage response. Finally response from Brazil, Canada and Switzerland
complete survey replies.

WORLD DEVELOPMENT SURVEY Smart Grids Benchmarking
July, 2010 73
14
12
4
23
1.b. What role do you play?
Survey results are shown to come from in a major part from independent sources and
suppliers. The reason could be because the answer could represent the personal
opinion of the responder and not the official position of their companies.
4. Smart Meter switching program
As a first step towards smart grid deployment, stakeholders were asked if switching
programs to smart meters where expected and when they are due. In Chart 4 answers
are reflected.
0 - 5 years 5 - 10 years Already implemented
N/A
7
12
9
7
4. If there is a switching program to Smart Meters when is it due?

WORLD DEVELOPMENT SURVEY Smart Grids Benchmarking
July, 2010 74
Implementation of smart meters is certain in the next decade over the majority of
countries surveyed. Eurelectric DSO survey [40] reflected similar answers for EU
member states. (See Appendix Eurelectric views on smart grids and networks of the
future: chart 7.1. DSO installs Smart Metering devices to all residential customers.)
Eurelectric concludes that DSOs will install smart metering devices for all residential
customers. Responses to smart grid deployment survey indicate that 80% of total
answers have already implemented or will implement in the next decade smart meter
switching programs.
5. Smart Meter regulation
A vital question to be addressed is if an activity will be regulated or liberalized. This
was enquired for smart metering.
Regulated Unregulated N/A
18
7
10
5. Is the Power Sector Regulation addressing Smart Meter development, as a regulated or unregulated activity?
This result reflects how, even after ensuring smart meter deployment in most
countries, a great uncertainty exists on regulatory issues. This is an alarming figure
since almost 30% of volunteers could not give a firm answer.
8. Smart Grid projects
In question 8 stakeholders were asked to identify if smart grid pilot projects were
being conducted, specifying size and expected aggregated cost per consumer
considering. Answers can be found in charts 8.a. and 8.b.

WORLD DEVELOPMENT SURVEY Smart Grids Benchmarking
July, 2010 75
> 100,000 50,000 -100,000
10,000 -50,000
0 - 10,000 None N/A
20
13
24
5
8.a. My country is approaching a SG project for xxx points
Pilot projects are being conducted and are of important scale. Utilities show
awareness that this kind of projects must be run at an important scale to accurately
reflect cost benefit analysis. A fundamental question is if the benefits of these
projects will be maintained after project ending, or if they will be dismantled.
< US$100
US$100 to
US$200
US$200 to
US$300
US$300 to
US$400
US$400 to
US$500
> US$500
N/A
5
12
4
1 12
10
8.b. If your country is developing a pilot Project, what is the aggregated cost per customer?
From these data we drive to two conclusions. Firstly that there is a general consent in
believing that the aggregated cost per customer will be above $100 an under $200.
The second conclusion, and maybe more important is that many fundamental
stakeholders are not aware of cost needed.

WORLD DEVELOPMENT SURVEY Smart Grids Benchmarking
July, 2010 76
9. Smart Grid benefits
Question on key features the deployment of a smart grid would bring are given in the
following seven charts.
Very Important
Important Relevant Not Relevant
1312
10
0
9. Smart grid development increase renewable source production
Similar results as the ones published by Eurelectric show how the development of
smart grids is correlated to an increase in renewable generation. (See Appendix
Eurelectric views on smart grids and networks of the future: chart 2.2. Integration of
Distributed/Renewable Energy Sources, Plug in hybrid cars into the grid.) However
in Eurelectrics analysis of chart 2.2., the main conclusion considers that smart grids
are not a necessity for the integration of distributed generation. This is a
controversial response since clearly the majority of answers indicate the high
importance of smart grids to deploy renewable energies.

WORLD DEVELOPMENT SURVEY Smart Grids Benchmarking
July, 2010 77
Very Important
Important Relevant Not Relevant
11
18
5
1
9. Smart grid development increase high efficiency technologies
High efficiency technologies will be catalyzed by the development of smart grids
worldwide.
Very Important
Important Relevant Not Relevant
16 16
3
0
9. Smart grid development increase demand side management
There is no doubt that smart grids will allow customers to actively participate in
decision making processes. Eurelectric responses show similar results, although
slightly considered more as important, than as very important. (See Appendix
Eurelectric views on smart grids and networks of the future: chart 2.3. Utilize
Demand Side Management (DSM) for improvement in overall system efficiency
(avoiding investments in peak generation) and customer tariff system with

WORLD DEVELOPMENT SURVEY Smart Grids Benchmarking
July, 2010 78
incentives.) The main conclusion to acquire here is that DSM is surely a driver
towards smart grids.
Very Important
Important Relevant Not Relevant
10
16
9
0
9. Smart grid development increase penetration of the electric vehicle
Electric vehicles will need of advanced communications systems to control power
flows increasing system operation complexity.
Very Important
Important Relevant Not Relevant
7
17
10
1
9. Smart grid development increase energy storage systems
When asked about expectation with regards to energy storage systems, the majority
of stakeholders considered this as an important driver for the smart grid. Eurelectric
considers this question from the distribution system operation perspective. (See
Appendix Eurelectric views on smart grids and networks of the future: chart 4.8.
Advanced storage devices (batteries, compressed air systems, etc.) are used in DSO

WORLD DEVELOPMENT SURVEY Smart Grids Benchmarking
July, 2010 79
operation). The DSO‟s answers to Eurelectric are very dispersed and the document
conclusions indicate that in network development no breakthrough of advanced
storage devices in DSO‟s operation are expected to constitute new network
developments.
Very Important
Important Relevant Not Relevant
7
15
10
3
9. Smart grid development increase aging infrastructures
As the infrastructure in most countries is already very mature, the issue of obsolete
assets is considered to be an important driver for smart grids.
Very Important
Important Relevant Not Relevant
8
10
15
2
9. Smart grid development increase higher quality of service
The smart grid development will bring a service of higher quality but this is not
considered as of fundamental importance by voluntary subjects surveyed.
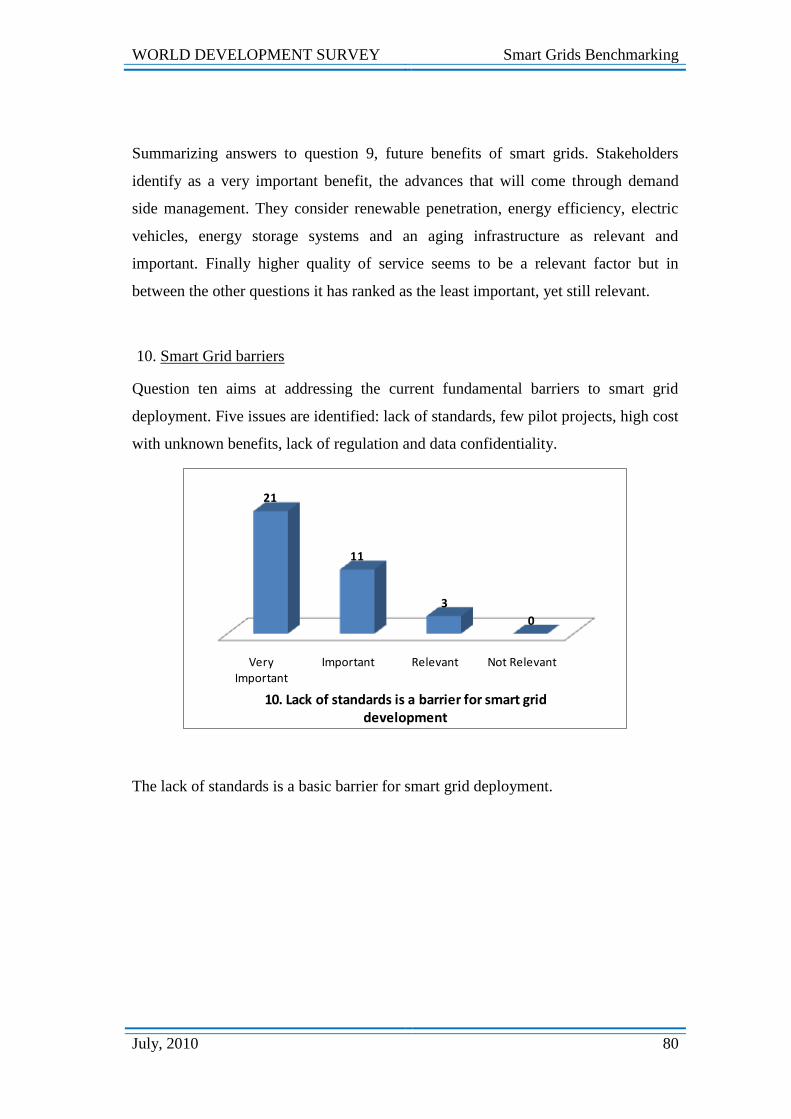
WORLD DEVELOPMENT SURVEY Smart Grids Benchmarking
July, 2010 80
Summarizing answers to question 9, future benefits of smart grids. Stakeholders
identify as a very important benefit, the advances that will come through demand
side management. They consider renewable penetration, energy efficiency, electric
vehicles, energy storage systems and an aging infrastructure as relevant and
important. Finally higher quality of service seems to be a relevant factor but in
between the other questions it has ranked as the least important, yet still relevant.
10. Smart Grid barriers
Question ten aims at addressing the current fundamental barriers to smart grid
deployment. Five issues are identified: lack of standards, few pilot projects, high cost
with unknown benefits, lack of regulation and data confidentiality.
Very Important
Important Relevant Not Relevant
21
11
3
0
10. Lack of standards is a barrier for smart grid development
The lack of standards is a basic barrier for smart grid deployment.

WORLD DEVELOPMENT SURVEY Smart Grids Benchmarking
July, 2010 81
Very Important
Important Relevant Not Relevant
2
21
9
3
10. Few pilot projects is a barrier for smart grid development
Majority of stakeholders consider that the issue of there being few pilot projects can
be considered as important, but not as very important.
Very Important
Important Relevant Not Relevant
14
12
9
0
10. High costs vs. unknown benefits is a barrier for smart grid development
The investment needed to develop a smart grid is compromised by the uncertainty of
future benefits.

WORLD DEVELOPMENT SURVEY Smart Grids Benchmarking
July, 2010 82
Very Important
Important Relevant Not Relevant
1112
6 6
10. Lack of regulation is a barrier for smart grid development
Once again the issue of regulation is a controversial one. Although the majority of
stakeholders considerate as an important barrier almost 20% of survey responses
consider that regulation is not a relevant barrier for smart grid deployment.
Very Important
Important Relevant Not Relevant
5
11
16
3
10. Data Confidentiality is a barrier for smart grid development
As communication systems increase the data interchanges in-between the system
components. Stakeholders‟ answers reflect data confidentiality is a relevant, but not
all that important barrier to smart grid deployment.
Therefore, the clearest barrier to smart grid deployment is identified as the lack of
standards. While volunteers consider that having few pilot projects and the
uncertainty of future benefits from high investments are important barriers. There is

WORLD DEVELOPMENT SURVEY Smart Grids Benchmarking
July, 2010 83
not a common view towards the issue of lack of regulation and finally data
confidentiality is not that much considered as important, but just as a relevant issue
that must be considered as a barrier.
11. Smart Grid necessary to minimize global warming effects
Finally, control volunteers were asked if they consider that the smart gird is
necessary to fulfill the decrease in global warming effects.
Yes No
25
9
11. Will the Smart Grid be necessary to fulfil the decrease of global warming effects?
More than 70% consider a smart grid is necessary to mitigate global warming. In this
way many consider the smart grid deployment is not an option, but more a necessity.

SMART GRIDS IN EUROPE Smart Grids Benchmarking
July, 2010 84
6 SMART GRIDS IN EUROPE
European smart grid stakeholders have been very active at all levels, from politicians
working on regulations and directives, to distribution companies deploying pilot
projects.
The supremacy of European law over member state law implies that member states
will eventually have to adapt to European Union policy.
EU law comes in two forms:
Regulations - Laws that directly come into force in all member states, without
requiring any implementing measures, and automatically override conflicting
domestic provisions.
Directives – Laws that require member states to achieve a certain result, but
allowing certain flexibility in the way to attain the desired result, typically
within a given timeframe, this process is known as transposition.
Therefore member states transpose EU directives, and state governments actively
participate with national regulators.
A number of EU legislations refer to smart grid showing the European compromise
to advances in the networks of the future.
Already in the Directive 2006/32/EC, on energy end-use efficiency and energy
services, concerns achieving an overall indicative energy savings target by each
Member State. Article 13 mentions the need to provide final consumers with
competitively priced individual utility meters that accurately reflect the final
customer's actual energy consumption and that provide information on actual time of
use.
Directive 2009/72/EC of the European parliament and of the council, of 13 July 2009,
concerning common rules for the internal market in electricity and repealing
SMART GRIDS IN EUROPE Smart Grids Benchmarking
July, 2010 85
Directive 2003/54/EC establishes in ANNEX I - Measures on consumer protection
section 2:
“Member States shall ensure the implementation of intelligent metering systems that
shall assist the active participation of consumers in the electricity supply market. The
implementation of those metering systems may be subject to an economic assessment
of all the long-term costs and benefits to the market and the individual consumer or
which form of intelligent metering is economically reasonable and cost-effective and
which timeframe is feasible for their distribution.
Such assessment shall take place by 3 September 2012.
Subject to that assessment, Member States or any competent authority they designate
shall prepare a timetable with a target of up to 10 years for the implementation of
intelligent metering systems. Where roll-out of smart meters is assessed positively, at
least 80 % of consumers shall be equipped with intelligent metering systems by 2020.
The Member States, or any competent authority they designate, shall ensure the
interoperability of those metering systems to be implemented within their territories
and shall have due regard to the use of appropriate standards and best practice and
the importance of the development of the internal market in electricity.”
Therefore by 2012, EU member states must make economic assessment of smart
metering devices. Where assessment reflects positive results, at least 80% of
consumers shall be equipped with a smart meter by 2020.
Furthermore, EU legislation identifies the importance of open and public standards.
That guarantees interoperability in distribution networks. Open standards also allow
equipment market competition, therefore reducing prices for consumers; and avoid
the creation of possible monopolies or technical barriers. A Spanish energy agency,
Energía y Sociedad, considers that without standards, future developments and
solutions will be compromised, putting investments at risk. [14]

SMART GRIDS IN EUROPE Smart Grids Benchmarking
July, 2010 86
The European Commission‟s M/441 EN standardisation mandate to European
standardisation institutions in the field of measuring instruments, namely CEN,
CENELEC and ETSI, to develop an open architecture for utility meters involving
communication protocols enabling interoperability.
Additionally, in the communication COM (2009) 111 final, Brussels, 12.3.2009, the
European parliament encourages a minimum level of functionality for smart
metering so that the same minimum options can be offered to all consumers,
irrespective of where they live and who provides the service.
In this direction, a series of European R&D projects are being conducted. In the
following pages we briefly describe some of the most important projects up to date.
PRIME – Power-Related Intelligent Metering Evolution
OPEN METER – Open and Public Extended Network metering infrastructure
FENIX – Flexible Electricity Networks to Integrate the eXpected „energy
evolution‟
ADDRESS – Active Distribution Network with full integration of Demand
and distributed energy RESourceS
6.1 SPAIN
6.1.1 Economic and Energetic Situation
Spain is the twelfth largest economy in the world by GDP, with a per capita income
in the average of the European Union. GDP is the market value of all final goods and
services made within the borders of a country in a year.
Currently Spain‟s financial situation is somewhat compromised. After almost 15
years of economic growth, Spain entered into a recession period in the second
quarter of 2008. Spain's unemployment rate has risen since 2007, from 8% to more
than 19% in December 2009, and continues to rise. What is more, the countries fiscal
deficit doubles the Economic and Monetary Union of the European Union (EMU)
limit. Government stimulus to improve unemployment levels and boost economic

SMART GRIDS IN EUROPE Smart Grids Benchmarking
July, 2010 87
growth has been unsuccessful, to an important extent due to an excess of
construction sector workers in a country where over construction has occurred during
the last years. Spain's private banking sector is another story, relatively insulated
from the global financial crisis; Spanish leading banks have not required government
intervention as has taken place in other countries. The economy is projected to
resume modest growth sometime in 2010, making Spain the last major economy to
emerge from the global recession.
The energy sector in Spain is approximately five percent of the country's gross
domestic product; its importance goes beyond its share in total output, constituting a
strategic sector needed by all branches of economic activity. Spain is considered as
an electrical island since the interconnections with France are very weak.
Additionally, even though Spain has some natural resources (see table 8), it is largely
dependent on foreign fuel imports, in almost 82% [47].
The energy demand in Spain has grown at around 3.5% annually since 2002, with a
sudden halt in the last two years due to the economic crisis. The Spanish annual
energy peninsular consumption for the year 2009 reached 251 TWh, 4.6% less than
the previous year. During the last decade important investments in generation plants
have been necessary to cope with demand growth. Spain is a leading producer of
solar and wind power (see figure 22). However, the existence of a liberalized
competitive market and the regulated special regime generation, i.e. renewable
generation, has brought an overinvestment in the competitive market of peaking
combined cycle units.
According to a report by Ernst & Young in October 2008, Spain is the fifth most
attractive country in the world to invest in renewable energy after the United States
Germany, India and China.

SMART GRIDS IN EUROPE Smart Grids Benchmarking
July, 2010 88
Figure 22 Spanish Gross Electricity Generation (2009).
R.E. stands for special regime production.
Source: www.ree.es
Table 7 Electricity Generation
Electricity Production Consumption Exports Imports Losses **
(TWh)
300.5 276.1 16.92 5.88 13.36
Country
comparison to
the world
13 14
*2007 est. or 2008 est. or 2009est.
**The discrepancy between the amount of electricity generated and/or imported and the amount
consumed and/or exported is accounted for as loss in transmission and distribution.
Table 8 Resources
Production Consumption Exports Imports Proved
Reserve
Oil**(bbl/day)
28,130 1.562 million 226,900 1.813
million
150
million
bbl
Natural Gas
(cu m) 17 million 38.18 billion 0
38.59
billion
38.59
billion
*2007 est. or 2008 est. or 2009est.
**This entry is the total oil produced in barrels per day (bbl/day). The discrepancy between the
amount of oil produced and/or imported and the amount consumed and/or exported is due to the
omission of stock changes, refinery gains, and other complicating factors.
During the last decade Spain has seen the incursion of combined cycle and
renewable, reducing thermal coal generation (see figure 23) [57]. Wind production
has grown from 11 897 MW in 2006 to 18365 MW in 2009, while solar PV has
increased from 146 MW in 2006 to 3708 in the first quarter of 2010 (see figure 24)
[58]. The new Spanish energy mix requires better grid operation tools, to maintain
system security. This denotes that a smarter grid could be a necessity.

SMART GRIDS IN EUROPE Smart Grids Benchmarking
July, 2010 89
0
50.000
100.000
150.000
200.000
250.000
300.000
350.000
1996 1997 1998 1999 2000 2001 2002 2003 2004 2005 2006 2007 2008 2009
(TW
h)
Spanish Historical Generation
Other Renewables (SR)
Hidraulic (SR)
Thermal (SR)
Combine Cicle
Thermal Fuel-Gas
Thermal Coal
Nuclear
Hidraulic
Figure 23 Spanish historical Generation.
Source: inspired by CNE tables
0
5.000
10.000
15.000
20.000
25.000
30.000
35.000
2006 2007 2008 2009 2010
MW
Spanish Special Regime Installed Capacity
SOLAR
EÓLICA
TRAT.RESIDUOS
RESIDUOS
BIOMASA
HIDRÁULICA
COGENERACIÓN
Figure 24 Spanish Special Regime Installed Capacity.
Source: inspired by CNE tables
6.1.2 Smart Grids
In Spain there are a set of rulings to regulate: network efficiency, renewable energies,
smart meters and smart grids, but the economic sources to finance the developments
are still not clearly define.
The 28th
of December ITC/3860/2007 Order [59], in the First Additional Disposition
indicates the obligation for the distribution utilities to deploy the new meters before
the 31st of December 2018 for all Spanish users. Specifically, it states:

SMART GRIDS IN EUROPE Smart Grids Benchmarking
July, 2010 90
Plan de sustitución de equipos de medida. 1. Todos los contadores de medida en suministros de energía eléctrica con una
potencia contratada de hasta 15 kW deberán ser sustituidos por nuevos equipos
que permitan la discriminación horaria y la telegestión antes del 31 de
diciembre de 2018. Este cambio se realizara de acuerdo al plan de sustitución
que se establece en la presente disposición.
2. El número de equipos que deberán ser sustituidos por cada una de las
compañías distribuidoras se establece como un porcentaje del total del parque
de contadores de medida de cada una de dichas empresas para este tipo de
suministros y deberá ajustarse a los valores que se señalan a continuación para
cada intervalo de tiempo:
a. Entre el 1 de enero de 2008 y el 31 de diciembre de 2010 deberá sustituirse
un 30 por ciento del total del parque de contadores de hasta 15 kW de
potencia contratada de cada empresa distribuidora.
b. Entre el 1 de enero de 2011 y el 31 de diciembre de 2012 deberá sustituirse
un 20 por ciento del total del parque de contadores de hasta 15 kW de
potencia contratada de cada empresa distribuidora.
c. Entre el 1 de enero de 2013 y el 31 de diciembre de 2015 deberá sustituirse
un 20 por ciento del total del parque de contadores de hasta 15 kW de
potencia contratada de cada empresa distribuidora.
d. Entre el 1 de enero de 2016 y el 31 de diciembre de 2018 deberá sustituirse
un 30 por ciento del total del parque de contadores de hasta 15 kW de
potencia contratada de cada empresa distribuidora.
Figure 25 Spanish Smart Meter Roll Out Timeline.
Source: Energia y Sociedad Smart Grids
In addition, it indicates the need for remote management systems to deal with the
new meters, but it does not define the technical requirements.
In Spain this implies changing 28 million meters in 10 years time [66]. This is a huge
effort, both in work and economic terms, and not only for the DSOs in charge of the
deployment, but also for the users that, in many cases, have to prepare their sites.
Considering a cost of 200 €/unit, the total cost for Spain would be 5.600 Million €.
Currently, the deployment is behind schedule, basically due to:

SMART GRIDS IN EUROPE Smart Grids Benchmarking
July, 2010 91
1. At the time when the regulation was passed, no standards or technical
specifications were defined. It was not until May 2009 that the standards of
communication, meter management and associated equipment were defined.
2. As a result, no equipment was available in the market;
3. The companies had the concern, that if they deployed equipment with no
defined standards, they risked to later face new legal requirements that could
not be complied with.
4. The associated remuneration costs were not indicated.
In addition, the Government also wanted to speed up the process of Smart Meter
deployment, in the way that individual consumers could ask at any time for their
meter substitution in order to have access to hourly discriminated tariffs, but the
Spanish regulator, CNE discouraged it [63].
On the other hand the order ITC/3022/2007, anticipating the EU directive, that
defines the following specifications in electric meters [64], and the RD 1110/2007,
defines the unified regulation for the measure point in the Spanish electric system
[65]:
Measure:
Active (P) and Reactive (Q) energy
Maximum power demand (every 15‟)
Period discrimination data storage capacity for 3 months
Management capabilities for 6 tariff periods storage of information for 3
invoices
Register:
Quality parameters (more than 3 min interruptions and voltage limits)
Events (alarms, changes in invoice, fraud )
Display information for user.
Power control
Power limiter

SMART GRIDS IN EUROPE Smart Grids Benchmarking
July, 2010 92
Switch integrated in the meter
Manual reconnection
Remote management
Measures of energy and power for invoice closure
Remote reading of quality parameters
Parameter modifications – tariffs, power contracts, type of contract, etc.
Remote synchronisation
Software update
Remote metering of events
Remote connection and disconnection
Capacity to manage loads
Capacity to send messages to consumer
The Electric Sector Law, in the Article 46 [61], defines the possibility to develop
DMS projects, which could be financed by the electric tariff. It specifically states:
Artículo 46. Programas de gestión de la demanda. 1. Las empresas distribuidoras, comercializadoras y el operador del sistema en
coordinación con los diversos agentes que actúan sobre la demanda, podrán
desarrollar programas de actuación que, mediante una adecuada gestión de la
demanda eléctrica, mejoren el servicio prestado a los usuarios y la eficiencia y
ahorro energéticos.
El cumplimiento de los objetivos previstos en dichos programas podrá dar lugar
al reconocimiento de los costes en que se incurra para su puesta en práctica
conforme a lo dispuesto en el Título III. A los efectos de dicho reconocimiento
los programas deberán ser aprobados por el Ministerio de Industria y Energía,
previo informe de las Comunidades Autónomas en su ámbito territorial.
2. Sin perjuicio de lo anterior, la Administración podrá adoptar medidas que
incentiven la mejora del servicio a los usuarios y la eficiencia y el ahorro
energéticos, directamente o a través de agentes económicos cuyo objeto sea el
ahorro y la introducción de la mayor eficiencia en el uso final de la electricidad.
The Royal Decree 222/2008 [60] established a new remuneration scheme for DSOs,
based on incentives for distributors to reduce costs, which also included some
efficiency criteria. But currently there is no specific regulation addressing Smart
Grids.

SMART GRIDS IN EUROPE Smart Grids Benchmarking
July, 2010 93
And recently, the Sustainable Economy Law [62], in the Article 83, paragraph 2,
makes explicit reference to incentivize the smart grids as a mean to increase the
efficiency of the whole system. Specifically, it states:
2. El Gobierno aprobará programas y tomará las medidas necesarias para
favorecer el desarrollo de redes inteligentes y microrredes integradas que
mejoren y faciliten la gestión del sistema, acerquen los puntos de generación de
energía eléctrica a los puntos de consumo, incorporando, preferentemente,
energía de origen renovable o de sistemas de cogeneración de alta eficiencia.
Todo ello con el objetivo de disminuir las pérdidas en transporte y distribución
eléctrica, mejorar la garantía, estabilidad y rendimiento del sistema eléctrico e
incrementar la aportación térmica de origen renovable.
On the other hand, a significant barrier for new development in the Spanish market is
the important deficit in the regulated tariff. From several years ago, even though the
regulated costs and the incentives to renewable production have been recognized to
the DSOs, they have not been brought to the tariffs, creating a deficit that has to be
neutralized in the next years. Besides the dysfunction in the financial account of the
companies, the most important effect is the fact that tariffs do not represent the real
cost of the energy chain. For the implementation of smart grids, it is very important
that stakeholders can show the new offered services reduce costs for final consumer,
and for this reason tariffs must reflect realistic cost of the energy chain.
In Spain there are very interesting projects in development, either alone or in
partnership with different stakeholders. The most important are:
1. DENISE- Intelligent, Secure and Efficient Energy Distribution
2. SMART CITY- Plugging Smart to the Grid
3. GAD – Gestión Activa de la Demanda
4. STAR – Sistema Telegestión y Automatización Red
6.1.2.1 DENISE Project
Objective
The objective of this project is to do research on smart grids, focused on the new
services and demand side management, as well as network reliability [67] [68]. The
project is divided in the following clusters:

SMART GRIDS IN EUROPE Smart Grids Benchmarking
July, 2010 94
Cluster 1. Common areas
Cluster 2. Network logic intelligence
Cluster 3. Physical network intelligence
Cluster 4. Energy efficiency
Cluster 5. Energy reliability
Figure 26 Project Denise Clusters.
Source: www.cenit-denise.org [67]
Partnerships
The DENISE Project is led by ENDESA. In addition, 12 companies and 7 research
institutions participate in this project: Hidrocantábrico Energía, Capgemini, Cetecom
(AT4Wireless), DMR Consulting (Everis), DS2, Eliop, Home Systems, Inelcom,
Isotrol, Sadiel, Taim-TFG, Telvent, Greenpower, AICIA, CIRCE, CITCEA, IIT-
Comillas, Universidad de Málaga (grupos ISIS e IC), Universidad Politécnica de
Madrid (CeDInt) y las Fundaciones CITIC y Creafutur.
Budget and Time for Fulfilment
The Project budget is 30 million € and the scheduled time is four years.
Expected results
Functional integration of the electric and communication networks,
throughout new technologies. In this way project expect to: (i) improve
quality of service; (ii) integrate real time information in order to achieve the

SMART GRIDS IN EUROPE Smart Grids Benchmarking
July, 2010 95
optimal service and demand side management and network reliability; and (iii)
implement a new generation of energy services and communications
Definition of new scenarios to evaluate the future network generation in the
following areas: (i) standards and regulation developments; (ii) development
and deployment costs in the current networks; and (iii) benefits for society
and the economy of the country
Development of a new control architecture and devices able to be integrated
in the current networks
6.1.2.2 SMART CITY Project
Objective
Smart City Malaga objective is the implementation of a new energetic management
model, in the Spanish city of Malaga [69] [70]. The implementation will save 20% of
energy consumption, which represents 6.000 tons of carbon dioxide save per year.
It will involve the implementation of:
5 MV (20 kV) feeders, for 38 km
59 MV/LV transformers
300 Industrial consumers, 900 Commercial consumers and 11.000 domestic
consumers
63 MW of contracted power
70 GWh/year of consumption, which means 28.000 Tons CO2 annual
emissions

SMART GRIDS IN EUROPE Smart Grids Benchmarking
July, 2010 96
Figure 27 Smart City Malaga Technology and Innovation.
Source: portalsmartcity.sadiel.es [70]
Partnerships
The Smart City Project is led by ENDESA and counts with the participation of the
following 11 companies: Enel, Acciona, IBM, Sadiel, Ormazábal, Neo Metrics,
Isotrol, Telvent, Ingeteam y Greenpower, along with several universities and
research institutions.
Budget and Time for complexion
The Project budget is 31 million € and the scheduled time is four years.
Expected results
The project will demonstrate the following basic concepts of Smart Energy needed to
contribute to comply with the 20/20/20 objectives:
Smart Energy Management. 8 - 15% emission reductions
Smart Buildings. 30 – 50% emission reductions
Smart Energy Generation
Smart and Informed Customer. 5 - 15% emission reductions
Smart Energy storage
Smart Mobility

SMART GRIDS IN EUROPE Smart Grids Benchmarking
July, 2010 97
6.1.2.3 GAD Project
Objective
The project is aimed to research on mechanisms to implant active demand side
management in Spain [71] [72]. These mechanisms include regulatory and economic
aspects as well as technology needed to implement an effective active demand side
management at domestic level.
The project is divided in the following work packages:
WP1. Analysis of scenarios
WP2. Pricing / Legislation
WP3. Algorithms for Demand Side Management
WP4. Measurement and Management of Loads
WP5. Communications
WP6. Experimental Test Setting
WP7. Analysis of Results
Figure 28 GAD Technologies.
Source: www.proyectogad.com
Partnerships
GAD project, funded by CDTI (Technological Development Centre of the Ministry
of Science and Innovation) in the INGENIO 2010 program, pursues research and
development of solutions for the optimization of electrical consumption at a domestic

SMART GRIDS IN EUROPE Smart Grids Benchmarking
July, 2010 98
level. The National Strategical Consortium of the Electrical Active Demand
Management is led by Iberdrola Distribución Eléctrica, S.A.. Other partners are: Red
Eléctrica de España, Unión Fenosa Distribución, Unión Fenosa Metra, Iberdrola,
Orbis Tecnología Eléctrica, ZIV Medida, DIMAT, Siemens, Fagor
Electrodomésticos, BSH Electrodomésticos España, Ericsson España, GTD Sistemas
de Información, Foresis y Corporación Altra. On top of this, fourteen Spanish
research organizations are collaborating.
Budget and Time for complexion
The project has a duration of four years (2007-2010) and it has a budget of 23‟3 M€
Expected results
The project expects to bring the following benefits:
For consumers. The household consumption optimizations will reduce the
electric bill as result of avoiding the peak load prices. This is possible by
programming the household equipment to start in valley hours;
For DSOs. Because it will be able to optimize the network, today designed for
peak load use. Since the load will be uniformly distributed in the 24 hours,
network investments could be adjust;
GAD project will allow the electric consumption of green energy. Allowing a
higher penetration of renewable energies;
Consequently, GAD will have an impact in the climate change mitigation
6.1.2.4 STAR Project
Objective
The STAR project will be a large implementation of smart grid technologies in the
Spanish city of Castellón [66]. The project will involve:
583 MV/LV transformation locations (CTs). 384 CTs in remote supervision
and 66 CTs in remote supervision and control
100.973 domestic meters, involving 175.000 consumers
Several different typological installations

SMART GRIDS IN EUROPE Smart Grids Benchmarking
July, 2010 99
The most innovative aspects that will be incorporated during the project are:
Advance meters, provided by different suppliers, working together
Active demand side management. Continuation of GAD project
Electric vehicle charging points
Figure 29 STAR project communications scheme.
Source: Energia y Sociedad Smart Grids
Partnerships
The Star project is exclusively conducted by Iberdrola.
Budget and Time for complexion
The Project budget is 22 million € and the scheduled time is one year.
Expected results
The project expects to bring the following results:
In Operation:
Supervision of MV and LV network
Fault detection
Real time automation and control of MV network
Alarm detection in CTs
Failure detection in MV and LV without test-error procedure
Increase quality of service
In Network Planning:

SMART GRIDS IN EUROPE Smart Grids Benchmarking
July, 2010 100
Unbalance/overload/deviation detection on voltage
Losses reduction
Assets load
Increase MV network configuration
To have profiles of load/voltages/current in the network
Evaluation of electric vehicle impact
6.2 AUSTRIA
6.2.1 Economic and Energetic Situation
Located in central Europe, two thirds of Austria is in the great mountain range
system of the Alps. The eastern valley regions are the most populated, the most
important of which is the Danube basin. With a well developed market economy and
high standard of living, Austria is the tenth richest country ranked by per capita GDP.
Its economy features a large service sector, a sound industrial sector, and a small, but
highly developed agricultural sector.
Austria‟s energy generation is primarily based on hydropower, responsible for almost
60% of generation considering hydro and pumped storage. Other renewable sources
such as wind, solar and biomass power plants are today a minor part of the energy
mix. The rest of production comes from gas and oil. Austria has fossil fuel reserves
but requires additional imports to cover the demand (see table 10). Austria has no
nuclear power generation. The countries energy policy changed in the 70‟s after a
referendum voted approximately 50.5% against nuclear power, and parliament
subsequently unanimously passed a law forbidding the use of nuclear power to
generate electricity. [52]
Table 9 Electricity Generation
Electricity Production Consumption Exports Imports Losses **
(TWh)
66.78 68.37 14.93 19.8 3.28

SMART GRIDS IN EUROPE Smart Grids Benchmarking
July, 2010 101
Country comparison
to the world 40 38
*2007 est. or 2008 est. or 2009est.
**The discrepancy between the amount of electricity generated and/or imported and the amount
consumed and/or exported is accounted for as loss in transmission and distribution.
Table 10 Resources
Production Consumption Exports Imports Proved
Reserve
Oil**(bbl/day)
19,360 244,900 50,160 263,200 96 mill.
bbl
Natural Gas (cu m) 1.532 bill. 8.39 bill. 2.788 bill. 9.78 bill. 27.9 bill.
*2007 est. or 2008 est. or 2009est.
**This entry is the total oil produced in barrels per day (bbl/day). The discrepancy between the
amount of oil produced and/or imported and the amount consumed and/or exported is due to the
omission of stock changes, refinery gains, and other complicating factors.
6.2.2 Smart Grids
The Austrian power sector regulation is not yet addressing the Smart Grid
development. However the Federal, Ministry for Transport, Innovation and
Technology (BMVIT) and based on the results of the research programmes of
BMVIT, an intensive discussion process on the topic of Smart Grids has started some
years ago in Austria. This early positioning and the high commitment of scientists
and researchers, grid operators and industry, as well as the already existing specific
know-how in Austria have contributed to the development of trend-setting research
projects. First pioneer regions are already engaged in the questions of the
implementation of these new system solutions. [36]
Recently the Federal Minister for Transport, Innovation and Technology, Doris
Bures declared:
“The development of smart grids is an essential basic prerequisite for intelligent
future energy systems. It represents one of the most difficult economic challenges
worldwide. We do realize that this is an important technology field in the
international context. Here Austria can play an important role within the peer group
of “innovative leaders”.

SMART GRIDS IN EUROPE Smart Grids Benchmarking
July, 2010 102
It is the task of modern and rational energy and technology research policy to
develop strategies for a safe, environmentally friendly and economic energy supply
system.
It is our joint goal to develop future oriented concepts and solutions in the field of
smart grids and to initiate their implementation.”
Up to date only smart meter pilots are running, some DSOs are starting to roll-out
smart meters in certain regions, but covering all costs by themselves. This is the case
of ENERGIE AG, which is since autumn 2008 in a trial run of 10,000 units in the
ENERGIE AG supply region.
The Austrian power system may for a number of reasons not require a smart grid.
Since due to its location Austria is well interconnected with the European power
system, there is very little distributed generation and neither peak demand nor overall
consumption are very high.
On the other hand, the power supply system is the key to effectively linking relevant
social topics such as climate protection, energy efficiency and decentralized energy
production. Issus that the EU energy directives make binding for all member states.
Austria sees this challenge as an opportunity to acquire a strong position in a
promising new industry. This year, the first Smart Grid model region in Austria will
officially start with funding from the climate and energy funds.
6.3 FRANCE
6.3.1 Economic and Energetic Situation
France‟s modern economy is changing, from the traditional French economic system
strongly characterized by extensive government ownership and intervention, to one
that relies more on market mechanisms. In recent years the government has partially
or fully privatized many large companies, banks, and insurers, and has conceded
stakes in such leading firms as Air France, France Telecom, Renault, and Thales.

SMART GRIDS IN EUROPE Smart Grids Benchmarking
July, 2010 103
However government still maintains a strong presence in some strategic sectors, such
as power, public transport, and defence industries.
Global economic crisis effects have not affected severely the France, which have
gone through the crisis better than most other big EU economies because of more
resilient consumer and government spending, and lower exposure to the downturn in
global demand.
The French energy sector is characterized by a moderate dependency of oil and gas,
very little of which is used for electricity generation. France produces more
electricity than it consumes, thanks to 59 nuclear power plants responsible for
supplying almost 80% of demand. As for renewable sources, their share in electricity
production is around 13%, largely hydropower. France is the smallest emitter of
carbon dioxide among the seven most industrialized countries in the world, due to its
heavy investment in nuclear power. In this context renewable technologies seam
unnecessary, therefore these technologies are having difficulties taking off the
ground.
Table 11 Electricity Generation
Electricity Production Consumption Exports Imports Losses **
(TWh)
535.7 447.2 58.69 10.68 40.49
Country
comparison to
the world
9 9
*2007 est. or 2008 est. or 2009est.
**The discrepancy between the amount of electricity generated and/or imported and the amount
consumed and/or exported is accounted for as loss in transmission and distribution.
Table 12 Resources
Production Consumption Exports Imports Proved
Reserve
Oil**(bbl/day)
70,800 1.986 million 554,100 2.346
million 103.3
million
Natural Gas
(cu m) 17 million 17 million 0
38.59
billion
2.548
billion

SMART GRIDS IN EUROPE Smart Grids Benchmarking
July, 2010 104
*2007 est. or 2008 est. or 2009est.
**This entry is the total oil produced in barrels per day (bbl/day). The discrepancy between the
amount of oil produced and/or imported and the amount consumed and/or exported is due to the
omission of stock changes, refinery gains, and other complicating factors.
6.3.2 Smart Grids
While the smart grid topic is somewhat diffuse, French regulation is already working
on a program to install 34 million new smart meters, called Linky, are due in less
than five years. The metering standardization follows the European mandate (M441).
The CEN, the European Committee for Standardization, CENELEC, the European
Committee for Electrotechnical Standardization, and ETSI, the European
Telecommunications Standards Institute have agreed to combine their strategic
approach to standards work in the area of smart meters.
In order to address these EU energy directives, the European Commission and EFTA
addressed Mandate M/441 to CEN, CENELEC and ETSI. A Smart Meters
Coordination Group (SM-CG) was set up to answer this request. This group will
provide a focal point concerning smart meter standardization issues in respect to
Mandate M/441. The group will give an update on the European context and ongoing
and/or future standardization activities in coordination with ISO and IEC in the field
of eco-design (new regulation), electric vehicles, smart meters and smart grids.
In this way functional specification for smart meters are not yet decided. But France
has already a time incentive program with low tariffs. On the other hand technical
specifications have been decided by ERDF, the French DSO, which has defined PLC
Power Line Communication for outdoor communication. Indoor communications are
still at a study level.
In France, EDF works on smart grid demonstration project: PREMIO to demonstrate
an innovative, open, and repeatable architecture to optimize the integration of
distributed generation, storage, renewable energy resources, demand response and
energy efficiency measures in order to provide load relief, local network support and
reduce CO2 emissions in the PACA region, in south east France, a area subject to

SMART GRIDS IN EUROPE Smart Grids Benchmarking
July, 2010 105
congestion during peak hours, where it is difficult to guarantee the demand supply
balance.
6.4 GERMANY
6.4.1 Economic and Energetic Situation
The German economy is the fifth largest economy in the world in terms of
Purchasing Power Parity (PPP) and Europe's largest. Germanys industry is based on
machinery, vehicles, chemicals, and domestic equipment. One of Germany‟s main
problems is its aging population. Low fertility rates and declining net immigration
are increasing pressure on the country's social welfare system that necessitates
structural reforms. Germany exited recession in the second and third quarters of
2009, thanks largely to rebounding manufacturing orders, exports outside the Euro
Zone and a relatively steady consumer demand. The German economy expects to
recover to about 1.5% growth for the year 2010. However, experts call for caution,
since the relatively strong euro, tighter credit markets, and an anticipated bump in
unemployment could mitigate medium-term recovery prediction.
Germany is the world's fifth largest consumer of total energy; considering electricity
generation, residential use, commercial, industry, and transport; requiring large
imports of oil and natural gas (see table 14). In terms of electricity consumption
Germany is Europe's largest consumer. German power industry is characterized by
vertically integrated utilities, which are amongst the world leaders. The country is
known for its environmental consciousness and green policy. As an example the state
is committed to several treaties promoting biodiversity, low emission standards,
recycling, and the use of renewable energy, and supports sustainable development at
a global level.
Nevertheless Germany's carbon dioxide emissions per capita are among the highest
in the EU, although they are significantly lower than those of Australia, Canada,
Saudi Arabia and the United States. This is due to the fact that coal generation is the
fundamental technology employed to produce electricity. Even though the largest

SMART GRIDS IN EUROPE Smart Grids Benchmarking
July, 2010 106
wind farm and solar power capacity in the world is installed in Germany. Currently
nuclear energy produces an important portion of the German base load, but is
planned to be phased out by 2021.
Table 13 Electricity Generation
Electricity Production Consumption Exports Imports Losses **
(TWh)
593.4 547.3 61.7 41.67 26.07
Country
comparison to
the world
8 7
*2007 est. or 2008 est. or 2009est.
**The discrepancy between the amount of electricity generated and/or imported and the amount
consumed and/or exported is accounted for as loss in transmission and distribution.
Table 14 Resources
Production Consumption Exports Imports Proved
Reserve
Oil**(bbl/day)
150,800 2.569 million 582,900 2.777
million 276
million
Natural Gas
(cu m) 16.36 billion 95.79 billion
12.68
billion
91.99
billion
175.6
billion
*2007 est. or 2008 est. or 2009est.
**This entry is the total oil produced in barrels per day (bbl/day). The discrepancy between the
amount of oil produced and/or imported and the amount consumed and/or exported is due to the
omission of stock changes, refinery gains, and other complicating factors.
6.4.2 Smart Grids
The German energy model will face many difficulties in the coming years primarily
because even though the system is well interconnected, the Feed-in tariffs design to
comply with EU compromises to achieve a high penetration of renewable has lead to
a fast expansion of these energies and the countries policy to phase out nuclear
production implies a volatile production, that will require to change the energy
management system.
These are the primary reasons of why Germany demands the implementation of a
smart grid that could help achieve future goals. Such as:

SMART GRIDS IN EUROPE Smart Grids Benchmarking
July, 2010 107
Security of supply, efficiency and climate protection with digital networking
of the power providing system
Optimization of the energy supply system using modern information and
communication technologies (ICT)
New interdisciplinary jobs in the fields of renewables and communication
New markets for high-tech solutions
Progress in liberalization and decentralization of the energy market
The German government is working in supporting many R&D activities, e-energy
projects and support of electric vehicle projects. Current regulation already ensures
that all new meters installed from January 1st this year must be smart.
E-energy is a four year term initiative by the German Federal Ministry of Economics
and the German Ministry of Environment. The budget of the project is approximately
€140 million. The project consists of developing six information and communication
technologies for energy system and in parallel the development of seven projects for
intelligent integration of electric vehicles (E-Mobility) through ICT into Smart grids
(see figure 30).
As Chancellor Angela Merkel put it at IT summit in Darmstadt, November 2008:
“E-Energy shall bring intelligent IT support to energy production and consumption –
from the generator in the power station way down to the customer.”
The standardization roadmap for German Smart Grid is responsibility of the DKE
German Commission for Electrical, Electronic & Information Technologies of DIN
and VDE.

SMART GRIDS IN EUROPE Smart Grids Benchmarking
July, 2010 108
Figure 30 E-Energy projects
6 E-Energy projects & 7 integrated ICT for Electric Mobility projects.
Source: E-Energy German Smart Grid Project [53]
6.5 GREECE
6.5.1 Economic and Energetic Situation
Greece has a capitalist economy in which the public sector accounting for about 40%
of GDP. Important income comes from tourism, which provides 15% of GDP. EU
aid has helped Greece arrive to this situation. The Greek economy grew by nearly
4.0% per year between 2003 and 2007; investment was catalyzed by the 2004 Athens
Olympic Games, and in part to an increased availability of credit, which has
sustained record levels of consumer spending. But the economy went into recession
in 2009 and Greece violated the EU's Growth and Stability Pact budget deficit
criterion of no more than 3% of GDP, with the deficit reaching 10.7% of GDP.
Under intense pressure by the EU and international market participants, the
government has adopted a medium-term austerity program that includes cutting
government spending, reducing the size of the public sector, decreasing tax evasion,
reforming the health care and pension systems, and improving competitiveness
through structural reforms to the labor and product markets. The government faces
long-term challenges to push through unpopular reforms. In April 2010 a leading
credit agency assigned Greek debt its lowest possible credit rating; in response, the

SMART GRIDS IN EUROPE Smart Grids Benchmarking
July, 2010 109
International Monetary Fund and Eurozone governments pledged more than $160
billion in support of Greece over the next three years.
Greece's is composed in a major part by thousands of small islands. This geography
has led to the development of a fragmented electricity system, with little of the
country's power plants connected to the mainland grid. The energy balance of Greece
is strongly dependent on imported oil. Electricity is generated mainly from lignite,
leading thus to high CO2 intensity values. Greece is second only to Germany in the
EU for lignite coal. The majority of power plants are in the north where the lignite
fields are located, while the bulk of demand is in and around the region of Attica in
the south, where 40 percent of the population and most of the country‟s industry
reside. Interconnection between the country's numerous islands remains low, albeit
increasing. Domestic lignite remains the most important fuel for electricity
generation, although the use of natural gas is growing rapidly and renewable energy
use is also expected to expand. Already Greece has a significant amount of installed
wind capacity and other renewables including geothermal, solar, wood and waste
electric power units exist. The total system consists of some 12,800 megawatts (MW)
of installed capacity with a further 850 MW of interconnectors for imports. Greece
will benefit from greater electricity connections with its neighbor. Although Greece
has liberalized its electricity sector, former state monopoly Public Power Corporation
(PPC) continues to hold a dominant position.
Table 15 Electricity Generation
Electricity Production Consumption Exports Imports Losses **
(TWh)
58.79 58.28 1.962 7.575 6.123
Country
comparison to
the world
43 42
*2007 est. or 2008 est. or 2009est.
**The discrepancy between the amount of electricity generated and/or imported and the amount
consumed and/or exported is accounted for as loss in transmission and distribution.
Table 16 Resources
Production Consumption Exports Imports Proved
Reserve
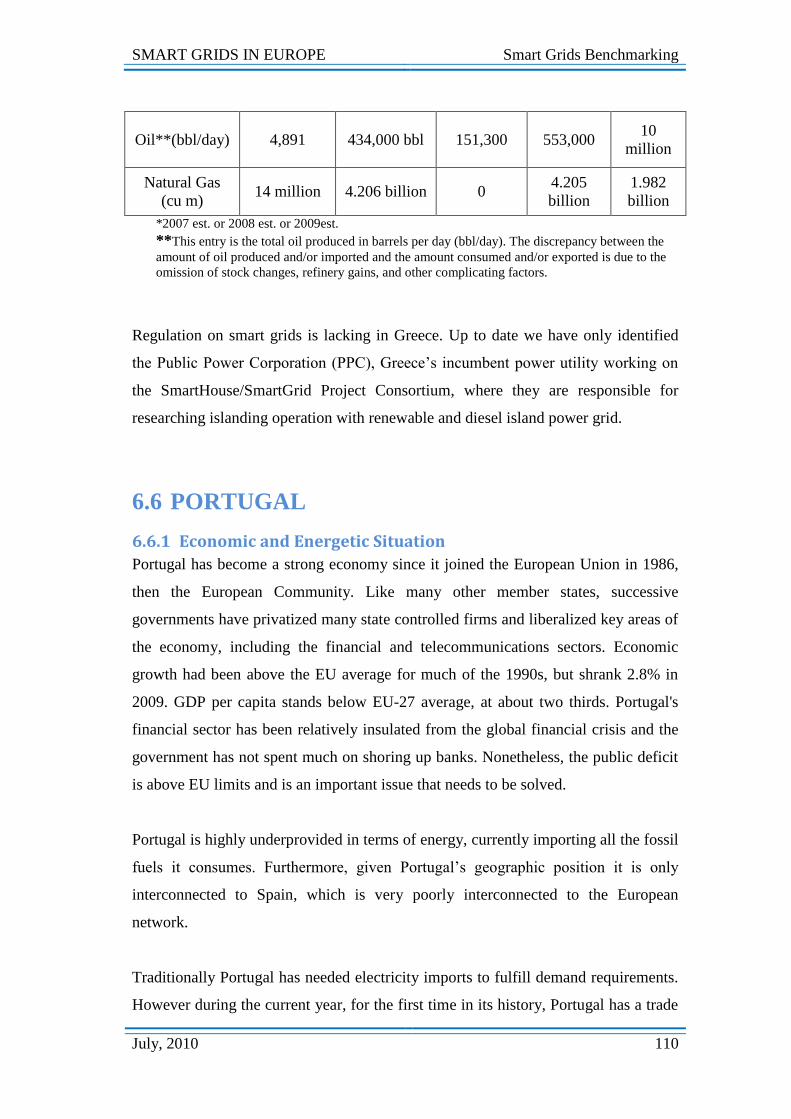
SMART GRIDS IN EUROPE Smart Grids Benchmarking
July, 2010 110
Oil**(bbl/day)
4,891 434,000 bbl 151,300 553,000 10
million
Natural Gas
(cu m) 14 million 4.206 billion 0
4.205
billion
1.982
billion
*2007 est. or 2008 est. or 2009est.
**This entry is the total oil produced in barrels per day (bbl/day). The discrepancy between the
amount of oil produced and/or imported and the amount consumed and/or exported is due to the
omission of stock changes, refinery gains, and other complicating factors.
Regulation on smart grids is lacking in Greece. Up to date we have only identified
the Public Power Corporation (PPC), Greece‟s incumbent power utility working on
the SmartHouse/SmartGrid Project Consortium, where they are responsible for
researching islanding operation with renewable and diesel island power grid.
6.6 PORTUGAL
6.6.1 Economic and Energetic Situation
Portugal has become a strong economy since it joined the European Union in 1986,
then the European Community. Like many other member states, successive
governments have privatized many state controlled firms and liberalized key areas of
the economy, including the financial and telecommunications sectors. Economic
growth had been above the EU average for much of the 1990s, but shrank 2.8% in
2009. GDP per capita stands below EU-27 average, at about two thirds. Portugal's
financial sector has been relatively insulated from the global financial crisis and the
government has not spent much on shoring up banks. Nonetheless, the public deficit
is above EU limits and is an important issue that needs to be solved.
Portugal is highly underprovided in terms of energy, currently importing all the fossil
fuels it consumes. Furthermore, given Portugal‟s geographic position it is only
interconnected to Spain, which is very poorly interconnected to the European
network.
Traditionally Portugal has needed electricity imports to fulfill demand requirements.
However during the current year, for the first time in its history, Portugal has a trade

SMART GRIDS IN EUROPE Smart Grids Benchmarking
July, 2010 111
balance of positive power, exporting more energy than it imported. This is largely
thanks to the investment in renewable generation and the hydrological year that has
brought abundant water. The investment in renewable energy in Portugal could total
€12 billion by 2012 and €120 billion by 2020, primarily in wind, solar and hydro
generation.
Table 17 Electricity Generation
Electricity Production Consumption Exports Imports Losses **
(TWh)
44.47 48.78 1.313 10.74 5.117
Country
comparison to
the world
53 47
*2007 est. or 2008 est. or 2009est.
**The discrepancy between the amount of electricity generated and/or imported and the amount
consumed and/or exported is accounted for as loss in transmission and distribution.
Table 18 Resources
Production Consumption Exports Imports Proved
Reserve
Oil**(bbl/day)
7,861 291,700 53,260 351,100 0
Natural Gas
(cu m) 0 4.754 billion 0
4.763
billion 0
*2007 est. or 2008 est. or 2009est.
**This entry is the total oil produced in barrels per day (bbl/day). The discrepancy between the
amount of oil produced and/or imported and the amount consumed and/or exported is due to the
omission of stock changes, refinery gains, and other complicating factors.
6.6.2 Smart Grids
At this moment Portuguese government directives to develop the Smart Grid concept
exist, but there is no regulatory support for them. Research and industrial projects are
encouraged through national funds. The best example of this is a large national
project: InovGrid, that is being conducted by EDP, INESC Porto, EFACEC,
LOGICA, CONTAR to create smart meters and to develop a pilot with 50.000
consumers dimension. [41] [42]. This is presently already running in the city of
Evora and involves an investment of €12 million. At present different PLC

SMART GRIDS IN EUROPE Smart Grids Benchmarking
July, 2010 112
communication standard type protocols are being tested, but other solutions are also
being considered.
The inescporto has conducted important research projects concerning distributed
generation and microgeneration that proof the how energy losses diminish with the
penetration of distributed generation in all distribution areas, from urban to rural.
These studies proof that large technical, economic and environmental benefits can be
achieved by using microgeneration thanks to:
Considerable amounts of loss network reduction
Better voltage profiles
Reliability improvements
Increase economic performance of the distribution activity
Investment deferral network reinforcement cost
Avoided costs in network losses
Avoided co2 emissions
And identify the importance that specific and fair new remuneration schemes
must be identified to benefit all stakeholders.
6.7 UNITED KINGDOM
6.7.1 Economic and Energetic Situation
The UK is one of the quintets of trillion dollar economies of Western Europe,
together with German, France, Spain and Italy. Over the past two decades, the
strategy followed by government has been to reduce public ownership. Privet
ownership has brought competition and efficiency to the economic system. Services,
particularly banking, insurance, and business services, account by far for the largest
proportion of GDP while industry continues to decline in importance. In 2008,
however, the global financial crisis hit the economy particularly hard, due to the
importance of its financial sector. The Bank of England periodically coordinates
interest rate moves with the European Central Bank, but Britain remains outside the
European Economic and Monetary Union (EMU).
The UK‟s electricity production is primarily based on coal and gas (see figure 31),
since it has large coal, natural gas, and oil resources, but its oil and natural gas

SMART GRIDS IN EUROPE Smart Grids Benchmarking
July, 2010 113
reserves are declining and the UK became a net importer of energy in 2005 (see table
20). To comply with EU directives, investments in green technologies, such as
carbon capture storage (CCS) and renewables are necessary in the coming years.
Another particularity is that the UK energy regulator (OFGEM) predicts serious
security of supply issues by the year 2015, therefore new regulatory schemes are
being designed to ensure system security. [54]
Figure 31 United Kingdom Gross Electricity Generation. 2020 forecast.
Source: one third of UK power renewable by 2020
Table 19 Electricity Generation
Electricity Production Consumption Exports Imports Losses **
(TWh)
368.6 345.8 1.272 12.29 33.818
Country
comparison to
the world
12 12
*2007 est. or 2008 est. or 2009est.
**The discrepancy between the amount of electricity generated and/or imported and the amount
consumed and/or exported is accounted for as loss in transmission and distribution.
Table 20 Resources
Production Consumption Exports Imports Proved
Reserve
Oil**(bbl/day)
1.584
million 1.71 million
1.602
million 1.651
million
3.41
billion
bbl

SMART GRIDS IN EUROPE Smart Grids Benchmarking
July, 2010 114
Natural Gas
(cu m) 69.9 billion 95.94 billion 10.5 billion
36.54
billion
342.9
billion
*2007 est. or 2008 est. or 2009est.
**This entry is the total oil produced in barrels per day (bbl/day). The discrepancy between the
amount of oil produced and/or imported and the amount consumed and/or exported is due to the
omission of stock changes, refinery gains, and other complicating factors.
6.7.2 Smart Grids
The UK government is committed to seeking measures to achieve carbon savings,
however smart grids are still in a pilot phase, what the government has already
started deploying are better metering and billing systems. It considers that one way
this can be achieved is if all new and replaced meters are smart. In October 2008 the
Government announced its intention to mandate a roll out of electricity and gas smart
meters to all homes in Great Britain with the aim of completing the roll out by the
end 2020. [55]
Regulation for smart metering is described in the Department of Energy and Climate
Change paper: TOWARDS A SMARTER FUTURE: GOVERNMENT RESPONSE
TO THE CONSULTATION ON ELECTRICITY AND GAS SMART METERING.
That states that Regulation will follow the Central Communications Model, under
which energy suppliers will be responsible for purchasing and installing meters, and
communications are coordinated centrally offering the best model for Britain‟s smart
meter roll out. This scheme combines strong incentives for energy suppliers to
deliver a high quality service to their customers, with wide scope to simplify and
improve industry processes, making it easier to switch between suppliers. This model
is expected to minimise the time and risk involved in preparing for roll out, in
particular since it avoids changing the disposition of responsibility for metering
services.
The Government believes that the development of smart grids can be fostered
effectively under this approach, in particular by ensuring the requirements of
network business are reflected appropriately in the minimum meter specification and
the communications solution. The Government believes that this approach is also
likely to result in a smart metering roll out which is more responsive to customers

SMART GRIDS IN EUROPE Smart Grids Benchmarking
July, 2010 115
overall, in particular because the provision of smart meters and related services will
be an important part of the supply companies‟ relationship with their customers.
The Government also believes that strong positive engagement among local
communities will be particularly powerful in generating the necessary awareness,
enthusiasm and take up. This underlines the value of managing the roll out, so that as
many people as possible in local communities receive their new meters at the same
time. The Government therefore intends to develop measures to promote
coordination of deployment at local level. As part of the Implementation Programme
we will therefore assess the optimal approach to an area by area deployment further.
An important aspect of this work will be to consider linkages to the development of a
smarter grid and measures to tackle fuel poverty. The full range of stakeholders will
need to be involved in this work as it is taken forward, including consumer groups,
Local Authorities, the Energy Savings Trust, suppliers and network companies.
Proposals for the Domestic Sector - Functionality
The Government confirms the proposals it set out in the Consultation Document on
high-level smart meter functionality requirements, with the exception of functionality
to remotely enable/disable gas supply. The Government considers that further work
is needed to assess some of the issues raised before a final decision is taken on this
element of the gas smart metering system.
The Government considers the detailed proposals made by some respondents on
smart grid functionality to be a subset of the requirements it set out in the
Consultation and therefore has not made any additions to its original proposals for
the electricity smart metering system in response to these.
The Government notes the comments received relating to the security and safety of
the smart metering system as well as the need for appropriate consumer protections
particularly relating to switching between credit and pre-pay and the possibility of
remote disablement of energy supply. Ensuring security of the smart metering system,

SMART GRIDS IN EUROPE Smart Grids Benchmarking
July, 2010 116
safety and protection of consumers will be at the heart of the Implementation
Programme and also in particular, the work on functionality.
The Smart Metering Implementation Programme will develop the agreed list of high
level requirements into more detailed functional requirements. This work will
examine the more detailed functionality issues raised in Consultation Responses and
smart grid functionality in particular. It will also take into account the independent
analysis on the gas valve once that is complete. There will also be close links with
the work on communications infrastructure requirements. Cost-benefit considerations
will be an important part of this work.
Specific grid automation is being promoted by pilot projects from the Institute of
Energy Technology, Research Councils and the regulator's innovation fund.
6.8 MALTA
6.8.1 Economic and Energetic Situation
Malta is expected to become the world‟s first Smart Grid Island by 2012. The
Maltese Smart Grid not only includes the energy sector, but works together with the
water sector in a synergy that is of crucial importance for this country. Due to its
geographic location, Malta has limited fresh water supplies, and has few domestic
energy sources. In Malta, water and electricity are inextricably clear. Roughly one-
third of Malta‟s water comes from three aging plants that squeeze the salt out of
seawater through reverse osmosis (RO). Another third is pumped out of Malta‟s
shrinking aquifers by approximately 8600 private borehole owners who extract water
free of charge. About a quarter is pumped out of Water Services‟ own boreholes. The
rest comes either from small RO plants run by a few large hotels or from private
cisterns that store the scant 550 millimetres of annual rainfall. Therefore electricity
accounts for 75% of the cost of the water produced. So when electricity rates go up
for large commercial customers by 60 percent, it effectively bumped up domestic and
commercial rates for water, too, by as much as 25%.[48]. Malta's financial services
industry has grown in recent years and in 2008-09 it escaped significant damage
from the international financial crisis, largely because the sector is centred on the

SMART GRIDS IN EUROPE Smart Grids Benchmarking
July, 2010 117
indigenous real estate market and is not highly leveraged. The global economic
downturn and high electricity and water prices have hurt Malta's real economy,
which is dependent on foreign trade. The need for more efficient energy and water
supplies are key drivers to the smart grid [47]. Changes in distribution and metering
will be needed to build a smarter energy and water system. These brave decisions
taken by the Maltese National Electricity and Water Utilities: Enemalta and Water
Services Corporation (WSC) are required due to the challenges the system will face
in the coming years. Immediate attention is needed to ensure that Malta is able to
deliver affordable and secure energy, as well as supply an increasing demand for
water, without endangering the environment. [46]
Current problems the Maltese Smart Grid should tackle:
7% Non-technical revenue electricity losses;
23% non-technical revenue water losses;
20% of 6-monthly bills issued on estimated readings due to no-shows;
€1m annual incremental cost to provide bi-monthly actual bills;
The cost of producing electricity varies by season and time of day. Tariffs do
not correlate price with the cost of production;
Malta is expected to become the world‟s first Smart Grid Island by 2012. The
Maltese Smart Grid not only includes the energy sector, but works together with the
water sector in a synergy that is of crucial importance for this country. Due to its
geographic location, Malta has limited fresh water supplies, and has few domestic
energy sources. In Malta, water and electricity are inextricably clear. Roughly one-
third of Malta‟s water comes from three aging plants that squeeze the salt out of
seawater through reverse osmosis (RO). Another third is pumped out of Malta‟s
shrinking aquifers by approximately 8600 private borehole owners who extract water
free of charge. About a quarter is pumped out of Water Services‟ own boreholes. The
energy production and resources may be found in the following tables [47]:
[45]

SMART GRIDS IN EUROPE Smart Grids Benchmarking
July, 2010 118
Table 21 Electricity Generation
Electricity Production Consumption Exports Imports Losses ***
(TWh)
2.146* 1.832* 0** 0** 0.314
Country
comparison to
the world
131 136
*2007 est.
**2009 est.
***The discrepancy between the amount of electricity generated and/or imported and the amount
consumed and/or exported is accounted for as loss in transmission and distribution.
Table 22 Resources
Production Consumption Exports Imports Proved
Reserve
Oil**(bbl/day)
0* 19.000* 0* 17,910* 0*
Natural Gas
(cu m) 0* 0* 0* 0* 0*
*2007 est. or 2008 est. or 2009est.
**This entry is the total oil produced in barrels per day (bbl/day). The discrepancy between the
amount of oil produced and/or imported and the amount consumed and/or exported is due to the
omission of stock changes, refinery gains, and other complicating factors.
6.8.2 Smart Grids
The 70 million euro project is being conducted by IBM. The deal includes new grid
infrastructures, replacement of 250,000 analogue electricity and water meters and
state of the art communications software. That will enable the national utilities and
their customers to better manage energy and water use.
Included advance IT:
Grid communications - identifying problems with the grid much more
quickly.
Remotely monitor and suspend meters - save money by not having to employ
meter readers, and cutting illegal clients.
More choice in tariffs – display internet window to allow customers to
understand their technical and commercial data, to track current consumption
and choose the most appropriate tariffs.

SMART GRIDS IN EUROPE Smart Grids Benchmarking
July, 2010 119
Monitor demand much more accurately, saving on emissions by not having to
over-estimate electricity use, and identifying more accurate patterns of use.
Advanced automated meter-management system will also allow the firm to
improve its water loss-management initiatives.
IBM has spent the past couple of years developing a variety of software to make the
power grid smarter. The Intelligent Utility Network Coalition, which includes a
group of utilities that are interested in bringing electronics to the electricity network,
was formed by IBM in 2007. The important advantage of companies like IBM is that
they are in contact with all parts of the electricity value chain. Therefore, they can be
very important partners, as to connect meter makers, energy management firms, and
wireless sensor distributors with utilities.
Being Europe‟s first mover, the Maltese network could provide valuable information
about how an entire community responds to these new tools.
On the other hand, even if Enemalta squeezes every last cent from its grid, the
potential for much higher electricity and water prices looms. Enemalta has no plans
to replace its oil-fired power plants, so it will be subject to the vagaries of the
petroleum market for the foreseeable future. To further complicate matters, studies
show that saltwater is infiltrating Malta‟s aquifers, which supply about 60 percent of
the country‟s freshwater. That will inevitably lead to a shift toward more seawater
desalination and more energy consumption. Being an electric island the problems of
energy dependence need to find solutions, higher efficiency is only a part of the
solution. Inevitably more investments in generation will be needed, the penetration of
renewable sources and cheaper thermal generation.

SMART GRIDS IN OTHER COUNTRIES Smart Grids Benchmarking
July, 2010 120
7 SMART GRIDS IN OTHER COUNTRIES
7.1 UNITED STATES
7.1.1 Economic and Energetic Situation
The US is the world's third-largest country by size (after Russia and Canada) and by
population (after China and India), with over 310 million residents. It has the largest
and most technologically powerful economy in the world, with a Gross Domestic
Product (GDP) of more than $14 trillion, this means a per capita GDP of $46,400.
The US is the world energy producer and consumption leader. The nation has a
variety of natural resources including the world's largest coal reserves with 491
billion short tons accounting for 27% of the world's total. The nation also counts with
important oil and gas reserves. However, resource imports also play a vital role in
energy generation, imported oil accounts for about two-thirds of US consumption
(see table 24). Due to the vast geographical extent, climate varies between the
different regions. This is another factor that condition energy demand.
Figure 32 United States Gross Electricity Generation (2009).
Source: U.S. Energy Information Administration wwww.eia.doe.gov
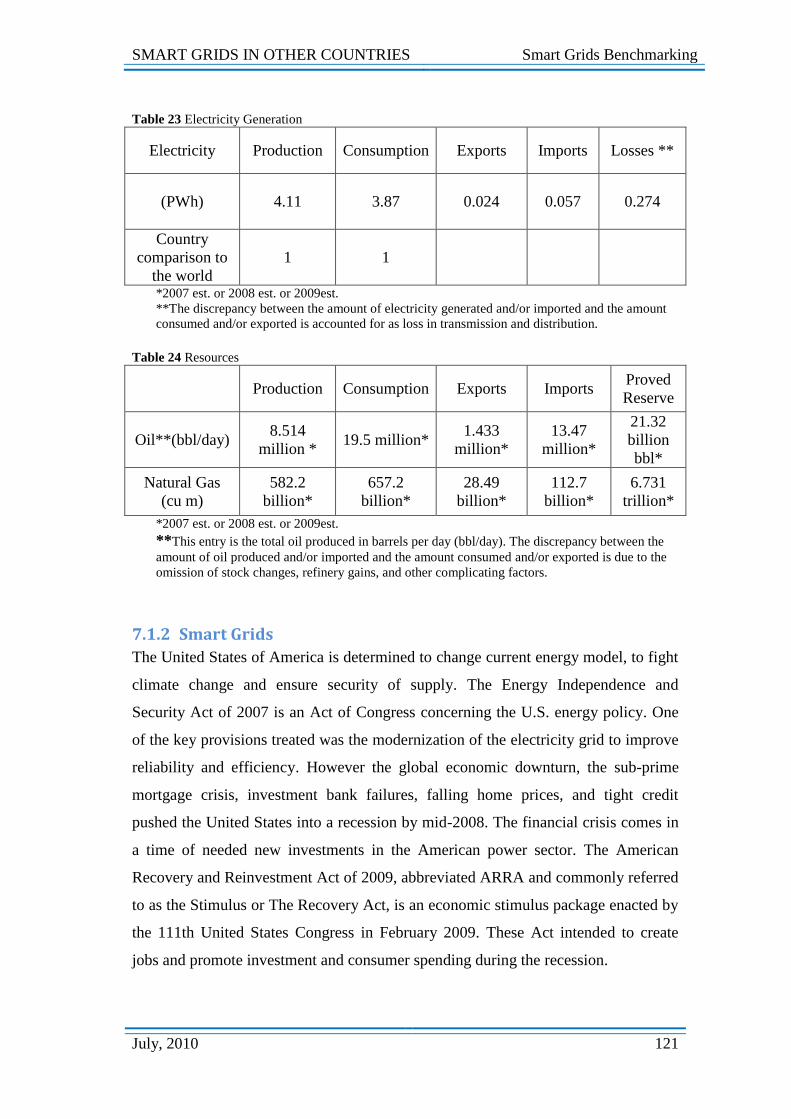
SMART GRIDS IN OTHER COUNTRIES Smart Grids Benchmarking
July, 2010 121
Table 23 Electricity Generation
Electricity Production Consumption Exports Imports Losses **
(PWh)
4.11 3.87 0.024 0.057 0.274
Country
comparison to
the world
1 1
*2007 est. or 2008 est. or 2009est.
**The discrepancy between the amount of electricity generated and/or imported and the amount
consumed and/or exported is accounted for as loss in transmission and distribution.
Table 24 Resources
Production Consumption Exports Imports Proved
Reserve
Oil**(bbl/day)
8.514
million * 19.5 million*
1.433
million* 13.47
million*
21.32
billion
bbl*
Natural Gas
(cu m)
582.2
billion*
657.2
billion*
28.49
billion*
112.7
billion*
6.731
trillion*
*2007 est. or 2008 est. or 2009est.
**This entry is the total oil produced in barrels per day (bbl/day). The discrepancy between the
amount of oil produced and/or imported and the amount consumed and/or exported is due to the
omission of stock changes, refinery gains, and other complicating factors.
7.1.2 Smart Grids
The United States of America is determined to change current energy model, to fight
climate change and ensure security of supply. The Energy Independence and
Security Act of 2007 is an Act of Congress concerning the U.S. energy policy. One
of the key provisions treated was the modernization of the electricity grid to improve
reliability and efficiency. However the global economic downturn, the sub-prime
mortgage crisis, investment bank failures, falling home prices, and tight credit
pushed the United States into a recession by mid-2008. The financial crisis comes in
a time of needed new investments in the American power sector. The American
Recovery and Reinvestment Act of 2009, abbreviated ARRA and commonly referred
to as the Stimulus or The Recovery Act, is an economic stimulus package enacted by
the 111th United States Congress in February 2009. These Act intended to create
jobs and promote investment and consumer spending during the recession.

SMART GRIDS IN OTHER COUNTRIES Smart Grids Benchmarking
July, 2010 122
An important part of this funding is destined for the US Department of Energy DEO,
and particularly Smart Grids. As president Obama announced on November 9th,
2009:
“Today I am pleased to announce that under the Recovery Act, we are making the
largest ever investment in a smarter, stronger and secure electric grid. This
investment will come in the form of 100 grants, totalling $3.4 billion, that will go to
cities, power companies, utilities and other partners who applied with plans to install
smart grid technology in their areas,” - President Obama at Florida Power and
Light‟s Next Generation Solar Energy Centre.
Therefore a $3.4 billion commitment to initiate the largest single electricity grid
modernization investment in U.S. history, adding significantly to the DOE‟s
continuing commitments to spur the nation‟s economic recovery with funding
provided under the American Reinvestment and Recovery Act of 2009 (ARRA).
Additionally, numerous U.S. state incentives and private funds are also helping
electric utilities deploy pilot projects aiming at shifting to a sustainable energy model.
The new policy allows managing your electricity use and budget at the same time.
According to president Obama it is expected to save consumers more than $20
billion over the next decade, on their utility bills. Such an investment will create
tenths of thousands of new jobs all across America in areas ranging from
manufacturing and construction to IT and installation.
Under the Energy Independence and Security Act of 2007 (EISA), the National
Institute of Standards and Technology (NIST) is assigned the “primary responsibility
to coordinate development of a framework that includes protocols and model
standards for information management to achieve interoperability of Smart Grid
devices and systems…” [EISA Title XIII, Section 1305]. Therefore NIST must
respond as the urgent need to establish protocols and standards for the Smart Grid.
[51]

SMART GRIDS IN OTHER COUNTRIES Smart Grids Benchmarking
July, 2010 123
The Federal Energy Regulatory Commission and the National Institute of Standards
and Technology are the parties responsible for developing regulating and standards at
the federal level.
At the moment state public utility commissions are taking different approaches.
Regulation varies from state to state. Some states are mandating certain performance
requirements and customer access to data, while others are not.
The specific case of California Public Utilities Commission (CPUC) has initiated a
rulemaking to consider policies for California investor-owned electric utilities to
develop a smarter electric grid in the state. The proceeding will consider setting
policies, standards and protocols to guide the development of a smart grid system
and facilitate integration of new technologies such as distributed generation, storage,
demand-side technologies and electric vehicles [50]. California will have deployed
two-way communicating meters in 12 million homes over the next couple of years.
Majority of US stakeholders surveyed consider the aggregated cost for the whole
smart grid value chain will have a cost per customer ranging from the $100 to $200.
There are over 100 ongoing projects, several in each state. A detailed list can be
found in the recovery act selections for smart grid investment grant awards and on
the Smart Metering Projects Map – Google Maps.
7.2 AUSTRALIA
7.2.1 Economic and Energetic Situation
In recent decades, Australia has transformed into an international leader, with a
competitive and advanced market economy. During the 1990s, Australia was one of
the members of the Organisation for Economic Co-operation and Development or
OECD, with fastest growing economies. A performance due in large part thanks to
economic reforms adopted in the 1980s. Currently, the government is focusing on
raising Australia's economic productivity. Australian environmental awareness is
also growing. Examples of this are the passing of emissions trading legislation, and
other climate-related issues such as drought and devastating bushfires aid projects.

SMART GRIDS IN OTHER COUNTRIES Smart Grids Benchmarking
July, 2010 124
Concerns in the long-term include climate-change issues such as the depletion of the
ozone layer and more frequent droughts, and management and conservation of
coastal areas.
The Australian electricity sector is characterized by its abundant and diverse natural
resources. These goods attract high levels of foreign investment and include
extensive reserves of coal, iron ore, copper, gold, natural gas, uranium, and
renewable energy sources. A series of major investments, such as the US$40 billion
Gorgon Liquid Natural Gas project, will significantly expand the resources sector.
The following tables reflect Australian energy generation and resources.
Table 25 Electricity Generation
Electricity Production Consumption Exports Imports Losses **
(TWh)
239.9* 222* 0** 0** 17.9
Country
comparison to
the world
17 16
*2007 est. or 2008 est. or 2009est.
**The discrepancy between the amount of electricity generated and/or imported and the amount
consumed and/or exported is accounted for as loss in transmission and distribution.
Table 26 Resources
Production Consumption Exports Imports Proved
Reserve
Oil**(bbl/day)
586,400 * 953,700* 332,400* 687,200* 1.5
billion
bbl*
Natural Gas
(cu m)
45.22
billion* 34.2 billion *
19.48
billion *
5.377
billion *
849.5
billion*
*2007 est. or 2008 est. or 2009est.
**This entry is the total oil produced in barrels per day (bbl/day). The discrepancy between the
amount of oil produced and/or imported and the amount consumed and/or exported is due to the
omission of stock changes, refinery gains, and other complicating factors.
7.2.2 Smart Grids
Australia is already working on an advanced metering infrastructure as the first step
toward a future intelligent grid. The Essential Service Commission (ESC) body took
the decision to implement an Interval Meter Roll-Out (“IMRO”) on July 2004.
SMART GRIDS IN OTHER COUNTRIES Smart Grids Benchmarking
July, 2010 125
The Ministerial Council on Energy (MCE) approved the distributor led rollout of
smart metering where the benefits outweigh the costs, in order to enable consumers
to make more informed choices and better manage their electricity use and
greenhouse gas emissions, reduce demand for peak power with potential
infrastructure savings, and drive efficiency and innovation in electricity business
operations and retail market competition.
In Victoria, increasing summer electricity demand peaks by air conditioning caused
extra investments on low use plants [34]. Introduction of smart meters to customers
was seen as a mechanism to link wholesale and retail markets. The government
changed legislation as instigated by the ESC of Victoria. Installation started in 2006
for dedicated categories, and in 2013 about one million smart meters should be
installed.
The Australian regulatory drivers are described by ESC in the „POSITION PAPER:
INSTALLING INTERVAL METERS FOR ELECTRICITY CUSTOMERS –
COST‟. The key aims are listed below [39]:
Increase the efficiency of the combined wholesale and retail electricity
markets. - When customers respond to high price signals by reducing their
demand for electricity or shifting usage to other lower-priced times. The
market benefits from the reduced need for capacity to meet otherwise higher
peak demands. The benefit arises from the avoided capacity cost in the
generation, transmission and distribution systems where capacity increases
are all driven by peak demand in summer.
Provided the capacity and incentive for customers to manage this electricity
consumption more efficiently.
Increase price efficiency and product innovation.
Bring operational network management improvements and increase the
availability to the network businesses of more data for network planning
purposes.
Increase the accuracy of settlement and ensure equity between customers.

SMART GRIDS IN OTHER COUNTRIES Smart Grids Benchmarking
July, 2010 126
Therefore in Australia the regulatory drivers are all related to shifting demand peaks.
The problem of a high peak is that all the power system must be designed for the
moment of maximum load even if it is only for very short periods of time. Given the
forecasted consumption is expected to double in the next 40 years. The energy model
must become smarter, to avoid potential problems. For this reason it is necessary to
reduce demand peak and an optimal price signal should help solve this problem in
the short and long term.
The Victoria government has since run trails to asses cost and benefits of an
accelerated rollout of interval meters with different communications technologies,
under different scenarios.
Summing up Australia needs to reduce load peak. Smart meter rollout programs are
expected to be implemented in the next decade. Currently multiple projects for the
implantation of Smart Grids are being approached by the different utilities as the
market is somewhat deregulated. More importantly these projects aim to proof cost
benefit analysis and are of an important scale, over 100,000 connection points.
Expected aggregated cost for Smart Grid infrastructure is in the range of $200 to
$300 per customer. There are not yet plans for implementing a Smart Grid, but Smart
Meters as a first step towards these future networks are already on their way, with
expected off 10% for domestic home owners. Nevertheless, Australian institutions
like the Institute for Sustainable Futures, UTS calls for the importance of correct
regulation due to the uncertainty of the topic and advice to diversify in other parts
needed to change the current energy model. Because, even if smart metering
technology and dynamic electricity pricing have the potential to solve part of the
economic and environmental sustainability problem. It is important to be cautious
about what can actually be achieved through use of price signals. UTS considers it is
likely that equivalent or better reduction in demand can be achieved using non-price
measures, such as regulation to improve energy efficiency equipment and distributed
energy.

SMART GRIDS IN OTHER COUNTRIES Smart Grids Benchmarking
July, 2010 127
7.3 BRAZIL
Brazil is the only developing country considered in this study. Brazil's economy
outweighs that of all other South American countries and Brazil is expanding its
presence in world markets. The vast extent of the country and the high natural,
having important crude oil and gas reserves, make it very interesting from an energy
perspective.
Brazil is the tenth largest energy consumer in the world (see table 27). The Brazilian
energy matrix is based on renewable sources, particularly hydro, although small
renewable power generation, like wind, are being deployed rapidly in the north east
of the country thanks to the favorable conditions. Another important source of
renewable energy is bio fuels, based on sugar cane. A minor part of the mix comes
from nuclear power, accounting for 3% of the energy produced in the country.
Table 27 Electricity Generation
Electricity Production Consumption Exports Imports Losses **
(TWh)
438.8 404.3 2.034 42.06 74.53
Country
comparison to
the world
11 10
*2007 est. or 2008 est. or 2009est.
**The discrepancy between the amount of electricity generated and/or imported and the amount
consumed and/or exported is accounted for as loss in transmission and distribution.
Table 28 Resources
Production Consumption Exports Imports Proved
Reserve
Oil**(bbl/day)
1.973
million 2.52 million 570,100 632,900
12.62
billion
bbl
Natural Gas
(cu m) 12.62 billion 23.65 billion 0
11.03
billion
365
billion
*2007 est. or 2008 est. or 2009est.
**This entry is the total oil produced in barrels per day (bbl/day). The discrepancy between the
amount of oil produced and/or imported and the amount consumed and/or exported is due to the
omission of stock changes, refinery gains, and other complicating factors.

SMART GRIDS IN OTHER COUNTRIES Smart Grids Benchmarking
July, 2010 128
Brazilian policy does not consider the construction of a smart grid as a priority. An
investment of such an extent, that would have to be higher to that of developed
countries since the grid is less developed, is absurd in a country struggling in
economic terms. Many share the idea that the power sector in Brazil is not strong
enough to force the development of technologies and that rich countries should
proofed a cost saving investment before. However, others consider that since
investments must be made anyhow to develop the grid, it would be better to already
get ahead and develop an automated grid. In any case the Brazilian government has
the last word, and up to date, only standards and smart meter deployment is being
discussed in detail.
In Brazil there is a governmental group which is working on a standard called PIMA
(Protocol Implementation Infrastructure for Advanced Metering), which must direct
the needs of industry when developing a Smart Grid system. Next year a regulation
will probably force utilities to go to electronic meters instead of electromechanical
ones. The Government in this country always take the lead, and this is why almost
always utilities can't reach their needs.
The PIMA is a communication protocol that provides interoperability among
network components. All PIMA electronic meters shall have mass memory, active
and reactive measurements, cut-off relay and a communication media that is still
under analysis (probably PLC + RF or just RF). The project aims to create a unique
language that can be used for all meters and other intelligent devices on the network,
by all the manufacturers.

CONCLUSIONS Smart Grids Benchmarking
July, 2010 129
8 CONCLUSIONS
8.1 Discussion
Our work has identified smart grid deployment concerns at an international level,
identifying needs and benefits as well as current and future regulatory expectation on
the studied subject.
As a primary objective this study aims to further understand the complex dilemma of
smart grid regulation. It is critical to allow all stakeholders to understand the views
and practices of the other roles involved. In this paper voluntary answers from
different stakeholders have allowed us to achieve this objective by benchmarking
current state of deployment.
Survey results have shown an easy and time effective way to collect sometimes
dispersed information.
A comparison between our results and already established consultancy bodies show
we have obtained coherent answers. This has been possible thanks to the cooperation
of voluntary stakeholders. That has the benefit of being objective, making this
analysis highly reproducible and robust. Therefore, allowing further studies to follow
progress in smart grid regulation over the following years.
It is important to note that analysis has been computed by aggregating answers from
different nations and roles. In any case following this approach, there is a trade-off,
to gain some advantages by aggregating results, but we incur in the disadvantage of
losing origin and role of response. A more in depth analysis distinguishing between
response origin and role would bring further results. Unfortunately, due to the lack of
time the decision to conduct an aggregated response was considered as the best
solution. In addition, as a preliminary analysis we do not consider this to be an error,
since at current state of deployment, and given the level of uncertainty, aggregated
responses may better reflect deployment.
CONCLUSIONS Smart Grids Benchmarking
July, 2010 130
Quantitative answers have been acquired, by aggregating individual answers and
constructing histograms. Qualitative results have been obtained by analyzing direct
survey results and additional regulators research papers.
Following is a summary of the key finding of this master thesis:
Histogram analysis reflects the survey has accomplished enough answers,
also obtaining answers from all key roles. Proving the versatility and
uncomplicated advantage of using survey analysis as a tool to gather
information.
There is a general consent that smart metering devices will see deployment
within the next decade, as a first step towards a smart grid. This view is
shared by both direct survey responses as well as by European regulatory
bodies, such as Eurelectric, giving higher validity to our results.
Future benefits from the implementation of smarter networks are identified.
Demand side management ranks as being a very important benefit, ensuring
customers will play a vital role in the future energy model. Other benefits
such as the penetration of renewable sources of energy, higher efficiency,
integration of electric vehicles, advanced energy storage systems and the
issue of substitution of aging infrastructures, are all considered to be
important drivers towards automated networks, but not as much as DSM. On
the other hand, the least important driver identified is higher energy quality,
probably due to the already satisfactory levels achieved in most countries
participating in the survey.
In the same manner barriers to deployment have been found. The clearest one
for which a general agreement exists is the lack of standards, there is a too
high risk in deploying an investment of this character with no guarantee of
legitimacy. The problems concerning high investment decisions within a
context of uncertainty of future benefits are also important. Stakeholders also
consider as an important barrier the lack pilot projects being conducted,
necessary to perform detailed cost benefit analyses. The least relevant barrier
ranked in the survey is data confidentiality. However as already reflected

CONCLUSIONS Smart Grids Benchmarking
July, 2010 131
earlier, the lack of a clear regulation, understood and shared by all, is a
controversial issue. Not sharing a common view is a tremendous barrier.
Finally, to the majority of volunteer agents surveyed the implementation of a
smarter grid is considered to be necessary to cope with global warming
effects. Many considering deployment more as a necessity than as an option.
Summarized in the following table are the needs and regulatory principles followed
by surveyed countries.
Table 29 Smart Grids Worldwide Summary
Country Needs Regulation
EU Environmental compromise –
20/20/20 objectives
Aging Assets – Important
blackouts in large cities in the
last decade
80% of total meters must be smart by
2020
Spain 82% energy dependent
High penetration of renewable
sources
Weak interconnections
Rules to regulate: network efficiency,
renewable energies, smart meters and
smart grids, but the economic sources
to finance the developments is still not
clearly define
100% of total meters must be smart
before 31 of December 2018
multiple pilot projects
Austria Not yet addressing the Smart Grid
development
France Nuclear generation – low
flexibility important to flatten
load curve
French regulation is already working
on a program to install 34 million new
smart meters, called Linky, due in less
than five years
Multiple pilot projects
Germany Energy mix based on coal, high
penetration of renewable and
phase out of nuclear production
implies a volatile generation
Automobile industry to electric
vehicle
Not yet addressing the Smart Grid
development. Pilot projects – with
€140 million budget
Greece High energy dependency
Weak interconnections
Regulation on smart grids is lacking
in Greece
Portugal High energy dependency
High penetration of renewable
sources
Portuguese government directives to
develop the Smart Grid concept exist,
but there is no regulatory support for
them
multiple projects
UK Security of supply problem by
the year 2015
Weak interconnections
Smart grids are still in a pilot phase
Roll out of electricity and gas smart
meters to all homes in Great Britain
with the aim of completing the roll
out by the end 2020
Multiple pilot projects

CONCLUSIONS Smart Grids Benchmarking
July, 2010 132
Malta Total energy dependency
Electricity is necessary to obtain drinking water
No interconnections
first nation to deploy a fully operational smart grid
USA Energy dependent
Green jobs
Fight climate change
Ensure security of supply
The Energy Independence and
Security Act of 2007 - key provisions
treat the modernization of the
electricity grid to improve reliability
and efficiency.
The American Recovery and
Reinvestment Act of 2009 -.
$3.4 billion commitment to initiate
the largest single electricity grid
modernization investment
Australia Efficiency - high peak problems Since 2004 working on an advanced
metering infrastructure as the first
step toward a future intelligent grid.
Interval Meter Roll-Out (“IMRO”) to
be implemented in the next decade.
multiple projects for the implantation
of Smart Grids
Brazil High losses Currently no regulation on the subject
of smart grids
The survey processes have a number of limitations that have affected our results,
such as misunderstood stakeholders‟ answers. Yet in any case, assuming the
existence of errors, these have been considered good enough by project developers.
In summary, our results show that survey technique can be used to benchmark and
asses stakeholder communication and help all parts involved understand the complex
dilemma of future smart grid regulation. Further research must be performed to
assure the method is viable, but primary results are promising and reflect worldwide
concern and interest in solving communication difficulties in between stakeholders.
8.2 Possible Future Progress
In the following section the ideas and expected possible outcome of the author are
reflected.
Firstly let us recall once more that some areas of the electricity chain are to be
regulated for its specific characteristics that make it an essential service.

CONCLUSIONS Smart Grids Benchmarking
July, 2010 133
For European Union member states the 20/20/20 objectives are less than ten year
away. Other countries as the United States are also keen on advanced energy
efficiency. However, to implement a project of such extent, a number of years are
necessary. If a smart grid is to be deployed in the next decade, it is time to start
making decisions, standards and clear action plans are needed, or grids will continue
unaltered.
In order to develop a road map, it is of vital importance to understand views and
practices of all stakeholders in order to develop duties and rights for each player. The
first step is to analyze if it is possible to consider the problem from an economic
perspective, as explained in the introduction.
In this case, we have to consider that networks are as smart as society wants them to
be. The problem is purely economic. This dilemma can be understood considering
we have a three variables problem: (i) cost, (ii) security of supply and (iii)
environment (see figure 33).
Figure 33 Energy policy diagram.
Green dotted line represents the environmental objectives. Red dotted line represents the security
limits. The orange zone represents the area where the optimal energy policy is located
We have the possibility to choose our location within this diagram. We can have
cheap green energy, but then it will not be secure; otherwise have secure cheap
energy, but then it will not be green; or green and secure energy at a very high cost.
It is clear that a compromise between the three variables must be achieved.

CONCLUSIONS Smart Grids Benchmarking
July, 2010 134
Furthermore given that politically a series of green objectives and a sufficient level
of security of supply must be provided. The problem is reduced to finding the
minimum cost at which this can be achieved. The orange colored area is the ideal
working zone.
Recall that if the total cost necessary to implement the new grid is smaller than the
future benefits, then existence of a competitive market should lead to the deployment
(recall equation 2).
Total Costs < Future Benefits Competitive Market (2)
Yet even if the total cost is higher than the future benefits but the benefits are still
considered necessary to fulfil with international compromise, then the executive
should implement incentives to reach the objectives (recall equation 3).
Total Costs > Future Benefits (NECESSARY) Incentives (3)
Identifying which equation to follow is crucial, but in order to choose, regulators
must have a clear idea of the costs and benefits.
However, this consideration can only be made in a new market where the product
justifies the price. In our case, the smart grid implementation cannot be justified
economically. Every stakeholder will get different advantages, but none of them,
individually or in conjunction will pay the deployment cost. On the other side, the
regulator is the only agent that can anticipate the future benefits in the medium term,
and the one who has the visibility of the political needs of the country.
Considering that the main agent involved in the smart grids implementation are the
DSOs, it is needed to define a scenario to recover the massive investment required.
The DSO will not invest in network electronic equipment, communication
infrastructures, automation and management systems, when an important part of the
benefits will not impact the regulated business. Therefore, the body that has the

CONCLUSIONS Smart Grids Benchmarking
July, 2010 135
possibility and responsibility to lead the process and define the subsidies and the fair
return over the investment is the regulator.
The final success of the implementation will not come from the current way to run
the market with the new equipments, but by the incentive to the consumers to take
advantages of the new possibilities the smart grids will bring. Particularly, in the
Spanish case, since the tariff presents a recognized deficit, this will be a challenge for
the regulator. The effort has to be: first of all to integrate in the tariff all the current
costs, and secondly show the advantages in costs for consumers as a result of the new
implementations.
A worst case scenario not mentioned throughout most reports is the case of
impossible implementation. The struggling economic situation means most
politicians are trying to avoid higher electricity tariffs. This is unfeasible with the
needed investments in a smart grid. In the case, there is no economic possibility to
deploy, the truth must be assumed and grid automation must wait for better days.
However, most politicians have already showed their commitment to develop a smart
grid within their electrical network; and smart metering, as a first step, has been
shown to already be a reality. Smart meters are a fundamental part of smart grids and
it would be a shame not to fully obtain all possible benefits. The smart grids second
step would be grid automation that could very possibly be much more important for
system security. Smart metering will bring efficiency through commercial and
energy saving programs. But emergency situations are to be solved by system
operator.
Under the technical point of view, the pilot projects are developing step by step the
different components that are needed for the final implementation. New
interoperability standards and equipments are produced, and the doubts of the
different services and future possibilities are being clarified. By analyzing the
different projects and the effort involved, it can be stated that shortly, the technical
problems will be solved. The following question is how, when and who will be

CONCLUSIONS Smart Grids Benchmarking
July, 2010 136
responsible for the massive implementation, and under my personal point of view,
only the politician and/or their regulators, will have the answer.
After analysing a number of pilot projects that aim to prove cost benefit analysis. The
first difference that complicates analysis is vertical integration. In the real world
some parts must be regulated while other parts may be left to free market
competition. The problem of conducting a pilot project is that all benefits are
collected by a single player as in a traditional scheme, following vertical integration.
Benefits are then within the same utility. In the real world, this is much more difficult
to do because windfall profits and losses will appear in between agents, creating
barriers for deployment.
Therefore, key issues to be addressed are which costs are regulated, or in other word
which cost are politically and strategically necessary to: firstly, comply with energy
sustainability in terms of environment and system security; and secondly, promote a
market for new energy services which create added value, providing sustainable
industry and jobs.
To succeed in today's environment, fresh business models are needed, as well as
changes in business architecture, protocols, rights and pricing terms to facilitate
emerging products and services enabled by new technologies.
As an attempt to further help develop new energy models this thesis proposes a smart
grid regulatory scheme merely based on observed energy market developments and
not having attempted any mathematical model.
The hypothetical regulatory scheme proposes differentiating between regulated and
liberalized smart grid element as follows.
While grid automation is still a controversial topic, with uncertainty in level of
automation, it must in any case remain a regulated activity. This is reasonable since
the grid is a natural monopoly and system operator must have control over system
security in real-time and in the long-term.

CONCLUSIONS Smart Grids Benchmarking
July, 2010 137
On the other hand, this thesis has proved that demand side management is considered
as the key driver to smarter grids development. Smart metering as a first step is
currently the only confirmed feature of future grids. The fundamental role of smart
meters for the whole system is increase overall efficiency through correct price
signals, reducing peak demand. Energy liberalized retailing has shown to be more
efficient, through the existence of competition.
Smart meters current standards do not have the technical capacity to provide system
operators real-time information necessary to better run the system. To do so grid
elements like protection relays are necessary.
Therefore, it could seem logical to partly deregulate smart metering to allow
competition to allocate benefits correctly. Smart meters will provide valuable
information for retailers to bring new tailor made products but not system security.
However there are two key issues for smart meters to be regulated: firstly, regulated
distribution companies have traditional been responsible for electricity meter
readings and the meter registers information to pay for regulated and liberalized
activities. Secondly, and more importantly in a free retail market it could bring
market barriers to free competition.
What could be a regulatory mistake that could cause competition problems could be
the lack of interoperability. Smart meter devices must be able to communicate with
any collector using any communications module.
Today, considering the economic interests at stake and the huge data base necessary,
it is very complex to implement an open interoperability scheme. When considering
a subject as complex and broad as smart grids, we are considering a new paradigm.
With the beginning of a new philosophy, with new communications, new equipment
and new services appear, but it is important to consider the different time frames. In
the next paragraphs we consider a future development that would increase efficiency
on the very long term, when the previews problems mentioned are mitigated, and
data interoperability is viable.

CONCLUSIONS Smart Grids Benchmarking
July, 2010 138
As an alternative to bring competition benefits, the proposed scheme hypothesises
the existence of a regulated smart meter. This device would ensure freedom of
energy provider and minimum technical and commercial requirements. Additionally,
thanks to the implementation of smart meters, retailers will be able to deploy what
we have chosen to call smart boxes (see figure 34). A Smart Box is a device that
collects the information from the smart meter and brings added value services such
as display screens showing specific tariffs, home automation and other new services.
That will bring much higher efficiency and smarter energy use than smart meters that
on their own do not bring major benefits to the system. The idea that a smart meter
on its own will make consumers shift their energy use, is, to say the least, very
optimistic.
Figure 34 Smart Meters and Smart Boxes
Under the smart box, competition between retailers would have the important
advantage of actually having differentiators in energy supplier, something that will
change energy markets worldwide. The new energy service companies and current

CONCLUSIONS Smart Grids Benchmarking
July, 2010 139
retailers that face the problem and find effective solutions will succeed. At a
regulatory level ensuring the basic needs for the smart meter will be enough to gather
information for billing and long term security of supply.
The following figures show a possible road map for the grids of the future. The
evolution from the traditional power grids to the future grids is shown in figures 35,
36 and 37.
Figure 35 Traditional Scheme.
In the traditional scheme, system operation was relatively simple; Communications
were used in the HV transmission to ensure system security.

CONCLUSIONS Smart Grids Benchmarking
July, 2010 140
TSO
DSO
Generation
CURRENT SCHEME
Distributed Generation
Co
mm
un
ication
s
EnvironmentEnergy
IndependenceRising Cost
Power Reliability
Green JobsModern
InfrastructureRegulated: System Operation
Demand (LV)
Demand (HV/MV)•Smart Meter
LiberalizedRetailing
Co
mm
un
icatio
ns
Figure 36 Current Scheme
As the new drivers to smart grids arrived in the last decade, system operation
complexity increases, as does the liberalized electricity business. Communications
start to play a vital role to achieve system efficiency. Distributed generation, requires
higher grid flexibility, and smart meters for energy intensive consumers allow
finding more optimal energy usage. The grid slowly becomes smart.

CONCLUSIONS Smart Grids Benchmarking
July, 2010 141
CommunicationsTSO
DSO
Generation
Demand (HV)•Smart Meter
System Operation•ComunicationsFUTURE SCHEME
High DG
EnvironmentEnergy
IndependenceRising Cost
Power Reliability
Green JobsModern
Infrastructure
Demand (LV)•Smart Meter•Prosumers•Evs•Energy Storage
LiberalizedRetailing
Co
mm
un
icatio
ns
Co
mm
un
ication
s
Figure 37 Future Scheme
As communication systems advance, this allow information gathering, with which
system operation may have higher flexibility, and hence allows deploying further
solutions. The energy model shifts to a new paradigm, which allows doing more with
less.
A timeline is provided in figure 38. Two basic phases can be considered:
Phase 1 – Smart grid deployment. The assembly of a new energy grid that
will be able to cope with the future requirements.
Phase 2 – New services deployment. Innovative new technologies will allow
the deployment of many new products and services.

CONCLUSIONS Smart Grids Benchmarking
July, 2010 142
Figure 38 Smart Grid Deployment Timeline
Finally smart grids and metering may be a part of the solution to a sustainable energy
model, but looking into the future we must consider them as the corner stone for the
upcoming power system management, bringing new services that today we cannot
even imagine.

References Smart Grids Benchmarking
July, 2010 143
REFERENCES
Some of the parts of this thesis have been taken from the following references:
[1] Carlos Batlle. Training Course on Regulation of Energy Utilities. Module 6.
Deregulation of the generation activity: Wholesale markets in electricity. 2009.
www.iit.upcomillas.es/batlle
[2] http://ec.europa.eu/environment/climat/climate_action.htmREN21 (2009).
[3] http://green.blogs.nytimes.com/2010/02/15/gains-in-global-wind-capacity-
reported/
[4] http://www.pvresources.com/en/top50pv.php
[5] http://www.geysers.com/
[6] http://www.renewableenergyworld.com/rea/news/article/2006/05/america-and-
brazil-intersect-on-ethanol-44896
[7] Union of Concerned Scientists. How Biomass Energy Works
[8] How the Energy Sector can deliver on a climate agreement in Copenhagen
[9] http://www.leonardo-energy.org/what-definition-smart-grid
[10] http://www.amsc.com/products/applications/utilities/smartgrid.html
[11] http://www.smartgrids.eu/?q=node/163
[12] http://www.amsc.com/products/applications/utilities/smartgrid.html
[13] America's Oil Dependence. 2004
[14] Energía y Sociedad: Smart grids redes inteligentes Marzo de 2010
[15] GE energy http://www.itsyoursmartgrid.com/energy_issues/index.html
[16] Energy Information Administration. "Greenhouse Gasses, Climate Change, and
Energy." May 2008.
[17] Energy Information Administration. "Net Generation by Energy Source by Type
of Producer." Data for 2007. 21 January 2009
[18] Natural Resources Defense Council. "Safe, Strong and Secure: Reducing
America's Oil Dependence." 2004
[19] U.S. Department of Energy. “The Smart Grid: An Introduction.”]
[20] HowStuffWorks.com. “How Blackouts Work.”
[21] Economía del Sector Eléctrico. Fundamentos Económicos de la Regulación y
Modelos de Mercado. Mariano Ventosa, 20 de octubre de 2003

References Smart Grids Benchmarking
July, 2010 144
[22] Training Course: Regulation of Energy Utilities. Module 10.A “Electricity
distribution”. Tomás Gómez San Román (2008 - 2009)
[23] Proyecto Piloto de MOVilidad ELEctrica: MOVELE. Departamento de
Transporte.
[24] http://science.howstuffworks.com/earth/green-
technology/sustainable/home/mobile-energy-management.htm
[25] http://www.homecontrols.com/why_automate
[26] http://www.icax.co.uk/on_site_renewable_energy.html
[27] International Energy Agency. December 2009. Global Gaps in clean energy
research development and demonstration
[28] http://www.electricdrive.org/
[29] CEESA Project. WP.3. Future Electric Power Systems
[30] http://www.fctec.com/fctec_basics.asp
[31] Proyecto Movel. Proyecto Piloto de MOVilidad ELEctrica. Instituto para la
Diversificación y Ahorro de la Energía . Departamento de Transporte
[32] http://home.vicnet.net.au/~eag1/Intervalmeters.htm
[33] http://share.aemo.com.au/smartmetering/default.aspx
[34] http://www.aemo.com.au/
[35] Advanced Metering Infrastructure in Victoria
[36] Salzburg Smart Week. http://www.salzburg-ag.at/kundenservice/smart-metering/
[37] Infrastructure. Australian energy market commission
[38] National Smart Metering Program. Work Program Structure and Consultation
Process. NSMP
[39] Business Requirements Work Stream. MCE Policy Objectives to Smart
Metering Business Requirements Advanced. NSMP
[40] Smart Grids and Networks of the Future – EURELECTRIC VIEWS
[41] http://www.inovcity.pt/pt/rede-inteligente/inovgrid/
[42] Distributed Generation and Microgeneration and its Impacts. Joao A. Peças
lopes INESC & FEUP May 2010.
[43] http://www.google.com/google-d-s/intl/es/tour1.html
[44] http://quarknet.fnal.gov/toolkits/ati/histograms.html
[45] http://www.businessgreen.com/businessgreen/news/2235721/malta-smart-grid

References Smart Grids Benchmarking
July, 2010 145
[46] Smart Grid In Malta - Sean.Barbara
[47] https://www.cia.gov/library/publications/the-world-factbook/geos/mt.html
[48] http://spectrum.ieee.org/energy/environment/maltas-smart-grid-solution/0
[49] http://www-935.ibm.com/services/us/gbs/bus/html/ibv-electric-utility-
innovation.html
[50] http://www.cpuc.ca.gov/PUC/energy/smartgrid.htm
[51] NIST Framework and Roadmap for Smart Grid Interoperability Standards,
Release 1.0
[52] "Austria Renewable Energy Fact Sheet" (PDF). Europe's Energy Portal. 2008-
01-23.
http://www.energy.eu/renewables/factsheets/2008_res_sheet_austria_en.pdf.
Retrieved 2009-05-20.
[53] E-Energy German Smart Grid Projects Overview EPRI Smart Grid
Demonstration Advisory Meeting, June 2010 Paris/EDF Andreas Reinhardt and
Lutz Steiner, Ancillary Research www.e-energy.de
[54]
[55] Towards a Smarter Future: Government Response to the Consultation on
Electricity and Gas Smart Metering. December 2009. Department of Energy and
Climate Change. Website: www.decc.gov.uk
http://www.iea.org/textbase/pm/?mode=pm&id=3789&action=detail.
http://www.iea.org/textbase/pm/?mode=pm&id=3789&action=detail
[56] REE. Preliminary Report. The Spanish Electricity System 2009.
Avance_REE_2009_ingles.v2.pdf
[57] REE Web Site. Monthly Report. Excel Serial data
[58] CNE Web Site. Información Estadística sobre las Ventas de Energía del
Régimen Especial
[59] BOE 312 2007/12/29 Orden ITC/3860/2007
[60] Royal Decree 222/2008 www.boe.es/boe/dias/2008/03/18/pdfs/A16067-
16089.pdf
[61] Electric Sector Law Ley 54/1997
[62] Ley de Economía Sostenible, Mach. 2010
[63] http://www.cne.es/cne/doc/publicaciones/cne119_09.pdf
[64] ORDEN ITC/3022/2007, Definition on electric meters

References Smart Grids Benchmarking
July, 2010 146
[65] RD 1110/2007, defines the unified regulation for the measure point in the
Spanish electric system
[66] www.energiaysociedad.es – Presentation on Smart Grids
[67] DENISE Project Official WEB. http://www.cenit-denise.org
[68] DENISE PROJECT. Partnership presentation. http://www.cenit-
denise.org/pcd/impe/descarga?uuid=c2c09015-fcd7-11dc-ba78-bddfdfb9a42f
[69] Smart City Malaga Project Official WEB. http://smartcitymalaga.com/
[70] Smart City Malaga Project Presentation.
http://portalsmartcity.sadiel.es/documentos/100204_%20Smartcity_ENDESA_E
sp3.pdf
[71] GAD Project. Aims, Developments and Initial Results
[72] GAD Gestión Activa de la Demanda Eléctrica Official WEB.
http://www.proyectogad.com/
[73] REN21 (2009). Renewables Global Status Report: 2009 Update
[74] http://www.sei.cmu.edu/smartgrid/index.cfm

Term Definitions Smart Grids Benchmarking
July, 2010 147
TERM DEFINITIONS
Term Definition
AMR Advance Meter Reading
AMI Advanced Metering Infrastructure
CBA Cost-benefit analysis
CCS Carbon Capture Storage
CEER Council of European Energy Regulators
CENELEC Comité Européen de Normalisation Électrotechnique
CHP Combined heat and power
CNE Spanish Regulator - Comisión Nacional de Energía
CT MV/LV transformation location. Centro de Transformación
DC Direct Current
DER Distributed energy resources
DG Distributed generation
DNO Distribution network operator(s)
DOE Department of Energy (US)
DSO Distribution system operator(s)
EC European Commission
EER(s) European Energy Regulator(s)
EHV Extra high voltage
EISA energy independence and security act (US)
Electricity WG Electricity Working Group
EMU Economic and Monetary Union of the European Union
ENS Energy not supplied
ENTSO-E
European Network of Transmission System Operators –
Electricity
EPACT Energy Policy Act (US)
EPRI Electric Power Research Institute
EQS TF Electricity Quality of Supply Task Force
ERGEG European Regulators Group for Electricity and Gas
ESCo Energy service companies

Term Definitions Smart Grids Benchmarking
July, 2010 148
ESO(s) European Standardization Organization(s)
ETP European Technology Platform
ETSO European Transmission System Operators
EU European Union
EV Electric Vehicle
FACTS Flexible alternating current transmission systems
FCV Fuel Cell Vehicles
FERC Federal Energy Regulatory Commission
FP (5/6/7) (European) Framework Program (for research)
HAN Home Area Network
HEV Hybrid Vehicle
HV High voltage
HVDC High voltage direct current
ICE Internal Combustion Engine
ICT Information & communication technology
IEC International Electrotechnical Commission
IEM Internal Energy Market
LV Low voltage
MV Medium voltage
NIST National Institute of Standards and Technology
NRA(s) National Regulatory Authority (Authorities)
NTP National Technology Platform
OEDER Office of Electricity Delivery and Energy Reliability (US)
OETD Office of Electricity Transmission and Distribution (US)
OFGEM Office of Gas and Electricity Markets
PHEV Plug-in Hybrid Electric Vehicles
PLC Power Line Communication
PV Photovoltaic
R&D Research and development
RD&DD Research, development, demonstration, deployment
RES Renewable energy sources
RF Radio Frequency
SAIDI System average interruption duration index

Term Definitions Smart Grids Benchmarking
July, 2010 149
SAIFI System average interruption frequency index
SE Smart Energy
SGD Smart Grid Demonstration Program
SGIG Smart Grid Investment Grant Program (US)
SM Smart Meter
SRSM Supplier Requirements for Smart Metering
T&D Transmission and distribution
ToU Time-of-use
TSO(s) Transmission system operator(s)
UoS Use-of-system
US United States
WAN Wide Area Network

Appendix A Smart Grids Benchmarking
July, 2010 150
Appendix A – Smart Grid Deployment Survey E-mails
Dear Sir or Madam, As an active stakeholder in the Power Sector, you are probably aware that professional consensus on Smart Grid regulation is lacking. I am writing to ask for your assistance with an important study: “Smart Grid Benchmarking.” To address these important issues, it is critical to understand the views and practices of primary stakeholders such as yourself. My name is Nacho Arronte, and I am a post-graduate student by the Spanish university “Universidad Pontificia Comillas” in the program “Master in the Electric Power Industry”. As a part of the master program I am currently conducting a research thesis to worldwide benchmark Smart Grid regulation and development. I have designed a short, targeted survey that will greatly enhance our understanding of this complex dilemma. Your response is critical to ensure valid results. We hope that you will take a few moments to respond to this survey. While funding limitations preclude compensating you for your time, upon completion of the survey, and under request I will email you a copy of the final report as a small token of our appreciation. To complete the survey, please click below. If the link does not work please ctrl+click or copy and paste the following into your browser:https://spreadsheets.google.com/viewform?formkey=dFprWWxfNkh1WX
BMY056eXhOT2ViQ2c6MA https://spreadsheets.google.com/viewform?formkey=dFprWWxfNkh1WXBMY056eXhOT2ViQ2c6MA Your answers will be securely encrypted as soon as you submit them and will be treated with complete confidentiality. To learn more about the study please write to: [email protected] I greatly appreciate your participation in this important study! Sincerely, Nacho Arronte

Appendix A Smart Grids Benchmarking
July, 2010 151
Dear Sir or Madam, Soon the survey: “Smart Grid Benchmarking” will close. Primary responses have been very favorable. I thank respondents for your cooperation. If you have not yet replied I would greatly appreciate if you could dedicate a few moments of your time to complete the survey within the next two weeks. As an active stakeholder in the Power Sector, you are probably aware that professional consensus on Smart Grid regulation is lacking. I am writing to ask for your assistance with an important study: “Smart Grid Benchmarking.” To address these important issues, it is critical to understand the views and practices of primary stakeholders such as yourself. My name is Nacho Arronte, and I am a post-graduate student by the Spanish university “Universidad Pontificia Comillas” in the program “Master in the Electric Power Industry”. As a part of the master program I am currently conducting a research thesis to worldwide benchmark Smart Grid regulation and development. I have designed a short, targeted survey that will greatly enhance our understanding of this complex dilemma. Your response is critical to ensure valid results. I hope that you will take a few moments to respond to this survey. While funding limitations preclude compensating you for your time, upon completion of the survey, and under request I will email you a copy of the final report as a small token of our appreciation. To complete the survey, please click below. If the link does not work please ctrl+click or copy and paste the following into your browser: https://spreadsheets.google.com/viewform?formkey=dFprWWxfNkh1WXBMY056eXhOT2ViQ2c6MA Your answers will be securely encrypted as soon as you submit them and will be treated with complete confidentiality. To learn more about the study please write to: [email protected] I greatly appreciate your participation in this important study! Sincerely, Nacho Arronte

Appendix B Smart Grids Benchmarking
July, 2010 152
Appendix B – Eurelectric Smart Grids and Networks of the Future Results

Appendix B Smart Grids Benchmarking
July, 2010 153

Appendix B Smart Grids Benchmarking
July, 2010 154

Appendix B Smart Grids Benchmarking
July, 2010 155

Appendix B Smart Grids Benchmarking
July, 2010 156

Appendix B Smart Grids Benchmarking
July, 2010 157

Appendix B Smart Grids Benchmarking
July, 2010 158

Appendix B Smart Grids Benchmarking
July, 2010 159