NACE Class of 2014 Student Survey Report
56
The Class of 2014 Student Survey Report Results from NACE’s annual survey of college students $160 NACE Member / $260 Nonmember Price 9 | 2014 National Association of Colleges and Employers 62 Highland Avenue • Bethlehem, PA 18017-9085 • 610.868.1421 www.naceweb.org ©Copyright September 2014 by the National Association of Colleges and Employers Sponsored by
Transcript of NACE Class of 2014 Student Survey Report

The Class of 2014 Student Survey Report Results from NACE’s annualsurvey of college students
$160 NACE Member / $260 Nonmember Price
9 |
2014
National Association of Colleges and Employers62 Highland Avenue • Bethlehem, PA 18017-9085 • 610.868.1421www.naceweb.org
©Copyright September 2014 by the National Association of Colleges and Employers
Sponsored by
2 | The Class of 2014 Student Survey Report | National Association of Colleges and Employers National Association of Colleges and Employers | The Class of 2014 Student Survey Report | 3
Executive Summary .......................................................................................................................3
Introduction .......................................................................................................................... 5
Plans After Graduation ..................................................................................................................7Plans by Academic Program (Major)Other Factors Impacting Plans After Graduation
Student Expectations and Preferences ...........................................................................................13
Career PreferencesEmployer/Job PreferencesSalary ExpectationsBenefit PreferencesPerformance ExpectationsTarget Industries
The Job Search ............................................................................................................................25The Use of Career Services Social Networking and the Job Search
Internships ..................................................................................................................................38Internships and Job OffersPaid vs. Unpaid InternshipsJob Offers and Internship Pay
Success in the Job Search .............................................................................................................44
Employment Attitudes and Preferences of the Class of 2014 ..........................................................50
Appendix: Participating Schools ...................................................................................................51
TABLE OF CONTENTS

National Association of Colleges and Employers | The Class of 2014 Student Survey Report | 3
EXECUTIVE SUMMARY
PLANS AFTER GRADUATION• 59.9 percent of graduates from the Class of 2014 plan to enter the work force
• 23.4 percent of new grads plan to attend graduate or professional school
• 10.0 percent of graduating students are unsure of what to do after graduating
• 5.7 percent plan to take time off
• 28 percent of new grads with GPAs above 3.5 plan to continue their education
STUDENT EXPECTATIONS AND PREFERENCES• More than 40 percent of graduating seniors from the Class of 2014 are interested in working for a government
entity at the federal, state, or local level.
• 23 percent of new graduates are interested in teaching in the K-12 arena.
• 52 percent of new grads view starting salary as very or extremely importance—however a high starting salary ranked tenth out of 16 job attributes measured in terms of important.
• For students that accepted a full-time job offer, the median starting salary was $50,050.
• The opportunity for personal growth is clearly the most important consideration students have when evaluating a job offer.
• About 30 percent of the Class of 2014 said diversity of an employer’s work force is extremely important.
• Graduating seniors from the Class of 2014 entering the work force view more than two weeks of vacation as the most important benefit from employers, followed by tuition reimbursement for advanced education, and promises of annual salary increases.
• Almost 84 percent of new graduates entering the work force say they plan to stay with their first employer more than two years.

4 | The Class of 2014 Student Survey Report | National Association of Colleges and Employers National Association of Colleges and Employers | The Class of 2014 Student Survey Report | 5
THE JOB SEARCH• 96.8 percent of the members of the Class of 2014 entering the work force say they use employers’ websites to
research potential employers.
• New grads entering the work force named LinkedIn, company websites, and the career center’s job posting website as the top Internet sites to obtain employer information.
• Almost 47 percent of Class of 2014 grads entering the work force said they made multiple visits to the career center each semester.
• 52 percent of grads entering the work force found the career services office an effective resource for learning about potential employers.
• New grads that visited the career center or the career center website during their senior year and applied for jobs had an offer rate that was 1.3 percent higher than respondents who did not visit the career center or its website and applied for jobs.
• Resume writing/reviews, career center job listings, job-search assistance were the top three activities used by graduating seniors at the career center.
SOCIAL MEDIA IN THE JOB SEARCH• 73.4 percent of new graduates expect employers to view their social networking profiles during the college
recruiting process.
• 42.9 percent of members of the Class of 2014 believe social networking sites should be used for college recruiting.
• 94 percent of graduating seniors have a profile.
• Use of social media in the job search has grown from 37 percent in 2010 to 58 percent in 2014.
INTERNSHIPS AND JOB OFFERS• 61 percent of graduating seniors had an internship or co-op experience.
• 52 percent of those graduates receiving job offers before graduation held internships.
• 46.5 of internships were unpaid.
• 42 percent of paid internships (with for-profit organizations) received a full-time offer.
• Graduates who came from a paid internship and received a full-time job offer generally commanded a higher starting salary than did graduates from an unpaid internship who received full-time job offers.
JOB SEARCH SUCCESS• 47.9 percent of job applicants received at least one offer; 30.1 percent of the graduating class who had applied
for a full-time position landed a job prior to graduation.
• Majors most likely to get job offers included accounting, economics, computer science, engineering, and business administration.
• Greatest improvement in offer rates went to liberal arts, education, and social sciences majors.
National Association of Colleges and Employers | The Class of 2014 Student Survey Report | 5
INTRODUCTION
Between February 15, 2014, and April 30, 2014, NACE conducted its eighth annual student survey. The survey queries students on a range of issues connected with their plans after graduation. These include delineating the direction students expect to take immediately after receiving their degrees, if they have actively begun pursuit of their after-graduation goals; what actions they have taken in pursuit of their goals, and whether they have been successful in attaining their goals. Students were also asked to express opinions on what they want out of job or employer, what they expect to earn in their first job after graduation, and where they would like to begin their professional career, as well as a number of other questions pertaining to entry into the work force.
While the survey is open to students at all degree levels and at all stages of an academic career, the focus of this report is on the responses received from students who will receive their bachelor’s degree by the end of the 2014 academic year. Articles covering responses from those pursuing associate and advanced degrees will appear in the NACE Journal over the next several months.
The NACE Student Survey is distributed to students throughout the United States in electronic form. NACE contacts potential respondents through the cooperation of member college career centers which distribute a link to the survey to their students. This year participation came from 696 member institutions resulting in responses from 43,864 students from throughout the United States. Of these nearly 44,000 responses, 10,210 came from bachelor’s degree seniors who indicated that they would be getting their degrees by August 2014. This report is based on the responses from this group of seniors.
While the survey delves into a variety of avenues a student can take after receiving a degree, the primary focus has been on the pursuit of full-time employment after graduation—the avenues that students take in pursuit of full-time jobs and the success that graduating seniors experience in getting full-time jobs. In addition, the survey also covers the move to a more advanced degree. As in the past, students were questioned about their use of various sources in their attempt to fulfill their plans. This includes particular attention to the use of career services, whether the plan is to get a job or to get another degree.
Beyond career services, the survey focused on how students researched potential employers and how they used social media in addition to other, more traditional tools in their job searches, and what they paid particular attention to when they explored potential employers.
The survey also looked for factors correlated with success in the job market. As a result, academic background, work experience through an internship or cooperative education, gender, ethnicity, and the resources used in the pursuit of employment were examined to see what, if any, factors were connected with getting a job before graduation.

6 | The Class of 2014 Student Survey Report | National Association of Colleges and Employers National Association of Colleges and Employers | The Class of 2014 Student Survey Report | 7
Finally, students were asked to rate various factors in their pursuit of the ideal job/employer. This information was gathered to compare this year’s graduating class to previous graduating groups to discover if there were any trends developing in the perspectives graduates are bringing to the job market, e.g., increased desire for higher salary or improved benefits as opposed to opportunities for creativity or personal growth. These attitudes toward job attributes are explored in detail with a focus on determining how an employer can become an ideal landing place for this year’s crop of graduates.
Edwin W. KocDirector of Research, Public Policy, and Legislative Affairs
Andrea J. KonczResearch Manager
Kenneth C. TsangResearch Associate
Anna LongenbergerResearch Assistant
ABOUT THE SURVEYNACE’s eighth annual Student Survey was conducted February 15, 2014, through April 30, 2014.
A total of 43,864 students at 696 NACE-member institutions took part, including 10,210 seniors earning bachelor’s degrees. Data reported here reflect responses from those seniors. The 2014 Student Survey was sponsored by Enterprise.
National Association of Colleges and Employers | The Class of 2014 Student Survey Report | 7
PLANS AFTER GRADUATION
The plans graduating students have are often reflective of the job market. When the labor market is strong from the seller’s perspective, graduates tend to enter immediately after college. When the market weakens, there tends to be an increase in the percentage of graduates who look to stay in school pursuing an advanced degree.
What was the labor market for the new college graduates in 2014?
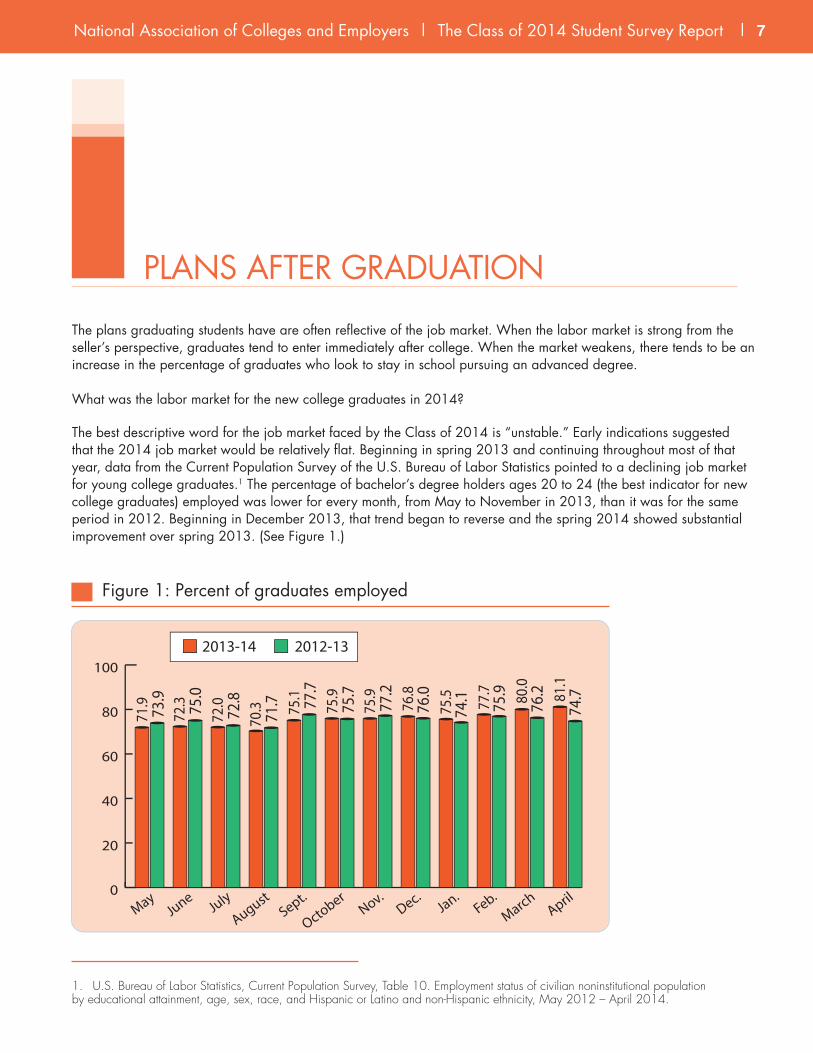
The best descriptive word for the job market faced by the Class of 2014 is “unstable.” Early indications suggested that the 2014 job market would be relatively flat. Beginning in spring 2013 and continuing throughout most of that year, data from the Current Population Survey of the U.S. Bureau of Labor Statistics pointed to a declining job market for young college graduates.1 The percentage of bachelor’s degree holders ages 20 to 24 (the best indicator for new college graduates) employed was lower for every month, from May to November in 2013, than it was for the same period in 2012. Beginning in December 2013, that trend began to reverse and the spring 2014 showed substantial improvement over spring 2013. (See Figure 1.)
1. U.S. Bureau of Labor Statistics, Current Population Survey, Table 10. Employment status of civilian noninstitutional population by educational attainment, age, sex, race, and Hispanic or Latino and non-Hispanic ethnicity, May 2012 – April 2014.
0
20
40
60
80
1002013-14 2012-13
MayJune
July
AugustSept.
OctoberNov.
Dec.Jan.
Feb.March
April
71.9 73.9
72.3 75
.072
.072
.870
.3 71.7 75
.975
.775
.977
.276
.876
.075
.574
.1 77.7
75.9 80
.076
.2 81.1
74.7
75.1 77
.7
Figure 1: Percent of graduates employed

8 | The Class of 2014 Student Survey Report | National Association of Colleges and Employers National Association of Colleges and Employers | The Class of 2014 Student Survey Report | 9
As a result, the labor marketplace for new graduates appears to be somewhat improved for the Class of 2014. A similar impression was conveyed by the findings of NACE’s employer survey of the job market. The NACE Job Outlook 2014 survey showed a bounce back from the lackluster results of 2013, although the improvement was not dramatic. The overall change for the Class of 2014 was an increase in hiring of 8.6 percent, a clear improvement over 2013’s 2.1 percent increase, but still a tepid performance when compared with the double-digit yearly increases experienced between 2004 and 2007. (See Figure 2.)2
The bottom line is that the college hiring market has been improving since the great recession, but at an unprecedented slow pace, and in a series of fits and starts rather than in a continuous upward flow, as in the years following the recession at the beginning of the century.
2. NACE, Job Outlook, Spring Update, 2004 through 2014, Bethlehem, PA: National Association of Colleges and Employers.
-25
-20
-15
-10
-5
0
5
10
15
20
2004 2005 2006 2007 2008 2009 2010 2011 2012 2013 2014
11.213.8
19.2
8.05.3
19.3
10.2
2.1
8.6
-21.6
13.0
Figure 2: Percent increase in new graduate hiring

National Association of Colleges and Employers | The Class of 2014 Student Survey Report | 9
0 5 10 15 20 25 30 35 40
20132014 2012
5.7%5.4%
4.4%
5.2%5.6%
5.0%23.4%23.4%23.3%
17.2%18.1%
18.7%
35.9%34.5%
35.1%
1.2%1.5%1.6%
11.6%10.0%10.0%Not sure
Begin own business
Take time-o�
Nonprot/Teach
Government
Grad or prof school
Work in private sector
Figure 3: Plans after graduation
Given the lackluster hiring market of the past several years, one might expect to see graduating seniors delaying entrance into the labor market by either pursuing an advanced degree or simply taking time off after graduation. There is evidence that points in that direction based on the differences in the plans of graduating seniors from 2012 to 2014. The percentage of graduates who planned to opt out of the labor market for at least the first year after graduation grew from 27.7 percent in 2012 to 29.1 percent in 2014. The difference is not particularly large, but it is in the expected direction, and virtually all of it is made up by the graduates who are planning on taking the year off, which further reinforces the idea that the trend is a reaction to the unstable labor market. It should be noted that the erosion of plans to enter the labor market has not really affected employment in the private, for-profit sector. The percentage of graduates planning on entering this sector has grown somewhat since 2012. The loss is located primarily in those planning to enter the not-for-profit sector. The percentage of graduates aiming for jobs in this sector has dropped from 18.7 percent in 2012 to 17.2 percent in 2014. (See Figure 3.)

10 | The Class of 2014 Student Survey Report | National Association of Colleges and Employers National Association of Colleges and Employers | The Class of 2014 Student Survey Report | 11
PLANS BY ACADEMIC PROGRAM (MAJOR)As with any large group, graduating seniors are not monolithic. They vary by gender and ethnicity, and, as seen in the past, most especially by the academic program they are pursuing. How much does the academic program impact post-graduate expectations? To address this question, graduating seniors who identified their major were categorized into two groups—those pursuing a “career-oriented” program and those involved in an “academic” discipline.3 “Career-oriented” majors included accounting, business administration, communications, computer science, education, engineering, healthcare, and environmental science. “Academic” majors included economics, English, foreign language, liberal arts/humanities, mathematics, history/political science, psychology, biology, chemistry, physics, sociology, and visual and performing arts. Among graduates in the Class of 2014 there was an increase in the percentage of those graduating with career-oriented majors—58.8 percent of respondents identified themselves with a career-oriented major compared with 56 percent of respondents in 2012 and 2013. The remaining 41.2 percent were associated with an academic program.
The plans following graduation were distinctly different for students in career-oriented programs than they were for those enrolled in academic pursuits.
Figure 4 shows that career-oriented majors are more likely than their academic counterparts to have definitive plans post-graduation, to be entering the work force directly after college, and to be planning on being part of the private, for-profit sector.
Career-Oriented Academic
% of Responses
Continue education 17.2% 30.5%
Work in the private sector 43.7% 20.0%
Work for a nonprofit organization 8.9% 12.3%
Work for a state or local government 2.6% 5.0%
Work for the federal government 1.5% 1.8%
Teach 8.1% 5.0%
Begin own business 1.9% 1.1%
Military 0.6% 0.9%
Take time off 4.0% 7.9%
Not sure 8.8% 11.6%
Other 2.7% 3.9%
Figure 4: Plans after graduation by academic program – graduating seniors
3. These divisions and the majors associated with these divisions were taken from a study published by the National Center for Education Statistics: Susan P. Choy and Ellen M. Bradburn, Ten Years after College: Employment Experiences of 1992-93 Bachelor’s Degree Recipients with Academic and Career-Oriented Majors, Washington, DC: Institute for Education Services, 2008.

National Association of Colleges and Employers | The Class of 2014 Student Survey Report | 11
Figure 4 shows that about 13 percent of students graduating from career-oriented programs have no clear plan for beginning their post-graduate career (either unsure of any plans or expect to take the year off). By comparison, approximately 20 percent of students in academic programs indicate no clear career plan directly following their degree.
As might be expected of those pursuing a career-oriented program, the vast majority have plans to directly enter the work force following attaining their degrees. Seventy percent of career-oriented majors plan on entering one of the work force categories while only 50 percent of those in an academic pursuit plan on entering the work force. Academic majors are, by contrast, much more likely to be directed toward continuing their educations immediately after getting the bachelor’s degree. More than 30 percent of academic majors plan on going to graduate or professional schools directly after college compared with only 17 percent of career-oriented majors. Finally, career-oriented majors are twice as likely to be headed for the private, for-profit sector (43.7 percent) than are those majoring in an academic field (20 percent).
These results are very similar to those found for the Class of 2013. The minor variations from last year are that career-oriented majors are somewhat less sure of entering the work force directly after getting their degrees this year while academic majors are planning on entering the work force in slightly greater numbers with fewer opting for graduate or professional school. These differences may be a reflection of the job markets each of these groups has encountered in 2014.
OTHER FACTORS IMPACTING PLANS AFTER GRADUATIONIn addition to the academic program, several other factors are correlated with the types of plans respondents had for their immediate post college pursuits. These factors are gender, ethnicity, and grade point average (GPA).
Female respondents are somewhat less likely to plan on entering the work force directly after receiving their degrees than are their male counterparts. Fifty-eight percent of women said they were planning on looking for a job immediately following graduation compared with 66 percent of men. However, this is not primarily due to more women planning to pursue an advanced degree after graduation. The differential between men and women on continuing their education is relatively small (24 percent of women plan to continue their education compared with 22 percent of men). The major difference in the plans of men and women is the lack of certainty that women express over the direction they will pursue after graduation. Seventeen percent of women are either unsure of what they will do or plan to take a year off after graduation. By comparison, only 10 percent of men expressed uncertainty about their plans.
Ethnic groups can be divided into two groups when it comes to the differences in their plans after graduation. Whites and Asian-Americans have virtually identical plans—62 percent of both groups plan on entering the work force directly after college while 22 percent of whites expect to pursue an advanced degree compared with 21 percent of Asian-Americans. By contrast, ethnic groups traditionally classified as underrepresented minorities (African-American, Hispanic-American, Native-American, and multi-racial) were less likely to plan to enter the work force directly after college, with a greater percentage expressing a desire to continue their education. For example, 55 percent of African-Americans plan to enter the work force upon completion of the degree while 30 percent state that they will seek a graduate or professional degree.

12 | The Class of 2014 Student Survey Report | National Association of Colleges and Employers National Association of Colleges and Employers | The Class of 2014 Student Survey Report | 13
There is a near linear relationship between GPA and plans for after college. Those graduating at the lowest grade point average are the most likely to plan to enter the job market and the least likely to be considering graduate or professional school. Sixty-four percent of graduates with a GPA under 3.0 reported that they intended to enter the job market directly following their degree. Sixty-two percent of graduates with GPAs between 3.0 and 3.5 are planning to enter the labor force while only 58 percent of those with the highest grade point averages (above 3.5) expect to go directly into the work force. The exact opposite trend holds for those anticipating entering graduate or professional school. More than 28 percent of graduates with GPAs over 3.5 are planning to continue their education. Twenty-one percent of those with GPAs between 3.0 and 3.5 are looking at graduate or professional school, and 16 percent with grades below 3.0 are contemplating going further with their education.

National Association of Colleges and Employers | The Class of 2014 Student Survey Report | 13
STUDENT EXPECTATIONS AND PREFERENCES
CAREER PREFERENCESIn addition to their immediate plans after graduation, students were asked to rate their interest in pursuing a range of potential career choices. Figure 5 details the results of the responses to that question from the Class of 2014 graduates. These results suggest two interesting findings:
• First, most students have not focused on a particular career direction as they leave college. Three options (working as a professional in a private sector firm, working as a professional in a nonprofit organization, and owning and managing your own business) saw expressed interest (very interested or extremely interested) from more than 50 percent of the respondents. More than 40 percent of graduating seniors are very interested or extremely interested in working for a government entity at the federal, state, or local level.
• Next, teaching, in particular at the elementary or secondary level, is not interesting to the vast majority of those graduating in 2014. Only 22.8 percent of respondents expressed any interest in pursuing teaching in the K-12 arena as a career option. This can be viewed as troublesome because the education sector has traditionally represented one of the best sources for professional job opportunities for individuals with a bachelor’s degree.
Not of Any Interest
Not Very Interested
Very Interested
Extremely Interested
% of Responses
Work for a private sector firm 16.3% 19.4% 40.5% 23.8%
Work for a nonprofit organization 15.5% 30.3% 36.5% 17.7%
Work in the medical/healthcare sector 33.8% 28.1% 18.5% 19.7%
Teach – elementary or secondary 49.6% 27.6% 12.6% 10.2%
Teach – college 35.0% 29.9% 23.4% 11.7%
Work for the federal government 30.2% 26.7% 27.4% 15.8%
Work for the state or local government 31.9% 27.5% 26.7% 14.0%
Military career 67.9% 22.1% 7.1% 2.9%
Own and manage a business 24.3% 22.7% 29.7% 23.3%
Work as a performing artist 64.3% 20.3% 9.5% 5.8%
Figure 5: Ideal career industry – graduating seniors
14 | The Class of 2014 Student Survey Report | National Association of Colleges and Employers National Association of Colleges and Employers | The Class of 2014 Student Survey Report | 15
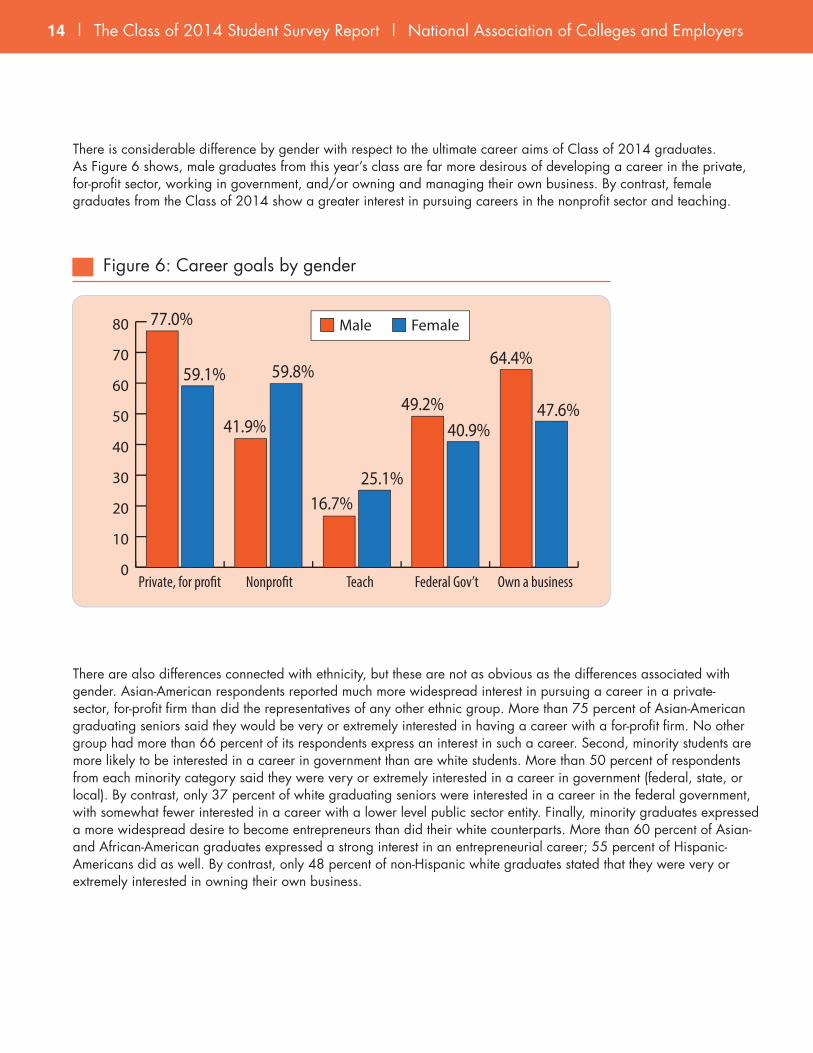
There is considerable difference by gender with respect to the ultimate career aims of Class of 2014 graduates. As Figure 6 shows, male graduates from this year’s class are far more desirous of developing a career in the private, for-profit sector, working in government, and/or owning and managing their own business. By contrast, female graduates from the Class of 2014 show a greater interest in pursuing careers in the nonprofit sector and teaching.
There are also differences connected with ethnicity, but these are not as obvious as the differences associated with gender. Asian-American respondents reported much more widespread interest in pursuing a career in a private-sector, for-profit firm than did the representatives of any other ethnic group. More than 75 percent of Asian-American graduating seniors said they would be very or extremely interested in having a career with a for-profit firm. No other group had more than 66 percent of its respondents express an interest in such a career. Second, minority students are more likely to be interested in a career in government than are white students. More than 50 percent of respondents from each minority category said they were very or extremely interested in a career in government (federal, state, or local). By contrast, only 37 percent of white graduating seniors were interested in a career in the federal government, with somewhat fewer interested in a career with a lower level public sector entity. Finally, minority graduates expressed a more widespread desire to become entrepreneurs than did their white counterparts. More than 60 percent of Asian- and African-American graduates expressed a strong interest in an entrepreneurial career; 55 percent of Hispanic-Americans did as well. By contrast, only 48 percent of non-Hispanic white graduates stated that they were very or extremely interested in owning their own business.
77.0%
59.1%
41.9%
59.8%
16.7%25.1%
49.2%40.9%
64.4%
47.6%
Private, for pro�t Nonpro�t Teach Federal Gov’t Own a business0
10
20
30
40
50
60
70
80 FemaleMale
Figure 6: Career goals by gender

National Association of Colleges and Employers | The Class of 2014 Student Survey Report | 15
EMPLOYER/JOB PREFERENCESAs in past years, graduating seniors were asked to rate a series of employer/job attributes as to their importance in identifying a preferred employment situation. The results were very stable until the Class of 2011. After that, instead of graduating seniors being focused on the opportunity to advance with an employer, attain job security, and begin a career with a high starting salary, the focus switched to finding a job that provided an opportunity for personal growth. Job security was still very important and a high starting salary was a desirable element, but the difference between members of the Class of 2011 and its predecessors was that the development the graduate was seeking was one focused on the person abstracted from any relationship to the employer. Rapid advancement was no longer necessary if the job provided the improvement of skills and networking opportunities that would serve an individual’s career in the long term.
The Class of 2014 followed the lead of earlier classes in emphasizing a preference for the opportunity to grow in skills as opposed to being able to advance with the employer. In addition, the Class of 2014 had its own preference ratings further down on the list, suggesting a trend away from a direct career focus. This could be suggestive of potential problems engaging these graduates on the job.
The set of employer/job preferences used was the set of factors that has been employed consistently since 2008, which allows the ability to identify changes in student preferences over time. These are employer/job conditions that a student rates as important when considering a particular job offer. Students were asked to rate a list of 16 factors as to their importance when they evaluate a particular job opportunity. These factors are:
• Casual atmosphere
• Clearly defined assignments
• Diversity of the work force
• Friendly co-workers
• Good benefits
• “Green” company
• High starting salary
• Improve the community
• Job security
• Located close to home
• Located in a diverse and tolerant community
• Opportunity for advancement
• Opportunity for creativity
• Opportunity for personal growth
• Recognition for good performance, and
• Employer has a well-recognized name

16 | The Class of 2014 Student Survey Report | National Association of Colleges and Employers National Association of Colleges and Employers | The Class of 2014 Student Survey Report | 17
Not at All Important
Not Very Important
Somewhat Important
Very Important
Extremely Important
% of Responses
Opportunity for personal growth 0.3% 0.8% 6.9% 31.3% 60.7%
Job security 0.6% 1.8% 13.2% 38.5% 46.0%
Friendly co-workers 0.6% 1.6% 13.4% 40.6% 43.7%
Good benefits package 0.6% 2.7% 17.5% 40.1% 39.2%
Ability to improve community 1.6% 5.2% 22.2% 36.3% 34.7%
Recognition for good performance 0.7% 3.9% 20.0% 43.0% 32.5%
Clearly defined assignments 0.8% 3.9% 21.6% 43.4% 30.3%
Diversity 4.1% 8.3% 23.6% 34.5% 29.6%
Opportunity for creativity 1.8% 7.5% 26.3% 36.1% 28.3%
High starting salary 1.4% 9.9% 36.8% 32.3% 19.7%
Opportunity for rapid advancement 1.3% 9.1% 33.6% 36.6% 19.4%
Located in a diverse and tolerant community 4.7% 14.3% 31.9% 30.4% 18.7%
Well-recognized name 6.0% 18.3% 30.5% 27.7% 17.4%
Located close to home 8.6% 15.8% 30.2% 28.1% 17.2%
Casual atmosphere 3.4% 13.5% 36.5% 29.7% 16.9%
“Green” company 8.6% 21.9% 38.0% 21.8% 9.8%
Figure 7: Job/employer preferences – graduating seniors entering the work force
Each of these factors was rated on a five-point scale that ranged from “Not at all important” to “Extremely important.” Figure 7 shows the percentage rating for each point of the scale for each of these factors. The factors are listed in order of the percent of respondents ranking the factor as “Extremely important.”
The Class of 2014 exhibits few differences in their job/employer preferences when compared with the responses from members of the classes of 2013 or 2012. The opportunity for personal growth is clearly the most important consideration students have when evaluating a specific job. Just as the Class of 2013 graduates, the 2014 graduating group saw limited opportunities in the economy with any specific employer. Consequently, the importance of opportunities to rapidly advance with their first employers fell well down on the list of preferences used to evaluate a job offer. The drop in importance of the opportunity for advancement is perhaps the clearest reflection of the impact the recession has had on the outlook of new graduates on the job market. Additionally, graduates no longer view strong prospects for compensation. Whereas prior classes tended to rate a high starting salary as relatively important, the Class of 2014 rates a high starting salary as relatively unimportant in finding their preferred job or employer.

National Association of Colleges and Employers | The Class of 2014 Student Survey Report | 17
While personal development is clearly upper most in the minds of new graduates when looking for their preferred job after college, attention needs to be paid to several other items that appear to be rising in importance. Graduates from the past several classes have become increasingly concerned with having a job where they can directly improve the community. For the Class of 2014, this employer/job attribute has risen to fifth in importance—the highest ranking to date, with more than one-third of respondents identifying this attribute as extremely important. The diversity of an employer’s work force is also becoming of more concern to recent graduates. Just under 30 percent of this year’s class listed diversity as extremely important, approximately 4 percentage points higher than for the Class of 2013. Work force diversity displayed the greatest growth in the percentage of respondents rating attributes as extremely important. Finally, an attribute that has consistently ranked high, but also displayed noticeable growth in importance for the Class of 2014 is the nature of the benefits package. Slightly less than 40 percent of graduating seniors identified a good benefits package as extremely important in considering potential jobs/employers.
Figure 8 shows some interesting differences among this year’s graduates in their ratings of job preferences based on their academic backgrounds. While students from all disciplines rate the opportunity for personal growth as the most preferred job attribute, it is business majors that are particularly strong in their preference for this attribute. More than 66 percent of business graduates rated the opportunity for personal growth as an extremely important job attribute. By comparison, fewer than 60 percent of the graduates in the social sciences, humanities, and engineering rated the opportunity for personal growth as extremely important. The graduates from the social sciences and humanities stood out in their ratings for the ability to improve the community and the diversity of the employer’s work force. Students from both academic disciplines were considerably more likely to rate community involvement and diversity as extremely important when compared with graduates from either business or engineering.
66.3
%27
.7%
25.8
%25
.3%
58.4
%42
.7%
20.4
%37
.1%
54.7
%39
.2%
13.2
%35
.8%
59.3
%25
.8%
20.4
%20
.1%
Business Social Sciences Humanities Engineering0
10
20
30
40
50
60
70
80
Ability to improve communityOpportunity for personal growthDiversityHigh starting salary
Figure 8: Selected job preferences by academic major

18 | The Class of 2014 Student Survey Report | National Association of Colleges and Employers National Association of Colleges and Employers | The Class of 2014 Student Survey Report | 19
Responses % of Responses
Less than $20,000 210 4.2%
$20,000 – $25,000 342 6.9%
$25,001 – $30,000 481 9.7%
$30,001 – $35,000 794 16.0%
$35,001 – $40,000 710 14.3%
$40,001 – $45,000 620 12.5%
$45,001 – $50,000 482 9.7%
$50,001 – $55,000 400 8.1%
$55,001 – $60,000 305 6.2%
$60,001 – $65,000 256 5.2%
$65,001 – $70,000 151 3.0%
$70,001 – $75,000 97 2.0%
$75,001 – $80,000 42 0.8%
More than $80,000 64 1.3%
Figure 9: Starting salary expectations – graduating seniors entering the work force
SALARY EXPECTATIONSA greater proportion of this year’s class viewed starting salary as very or extremely important (52 percent) than did graduates from the Class of 2013 (47 percent). Nevertheless, high starting salary finished tenth out of the 16 job attributes measured in terms of importance.
This is not to say that salary should be dismissed by employers as a factor in attracting new college graduates. Nearly 40 percent of students who received offers of full-time employment either rejected the offer or had not decided to accept the offer at the time of the survey. This percentage is similar to the non-acceptance rate of previous classes. One clear factor in why a new college graduate does not jump at the offer of a full-time job is the starting salary connected with the offer. To determine the effect salary plays on the probability that a job offer will be accepted, the median salary offers for students who had not accepted a job against their median expected salary were compared with the median salary offers of students who did accept a job offer against their salary expectations.
The discernible difference between the two populations was fairly dramatic. For students who accepted a full-time offer, the median starting salary was $50,050, compared with a median expected salary of $48,890 or 2.4 percent above expectations. By contrast, the median salary offer for students that had not accepted a full-time job offer was $37,191, compared with a median expected salary from this group of graduates of $40,806 or 8.9 percent below expectations. While students may not expect to be making a mint in their first job, they do expect employers to offer what the student perceives to be a “fair” salary offer.
Figure 9 shows the overall distribution of salary expectations for 2014 graduates entering the work force.

National Association of Colleges and Employers | The Class of 2014 Student Survey Report | 19
As Figure 9 shows, most graduate salary expectations fall within the range from $30,000 to $45,000. The overall median expectation is $39,581. This is similar to the results found in previous studies, indicating that salary expectations have not changed very much since the beginning of data collection in 2007. The actual change among this year’s graduates was an increase of 2.8 percent. As always, the overall number masks significant differences in expectations for students graduating in different academic disciplines and the expectations for different demographic categories.
Figure 10 displays the median starting salary expectation by academic major along with the percentage change in the expected salary between the Class of 2014 and the Class of 2013. This year’s class is a bit unusual in that there is a good deal of change within individual majors when compared to the previous year’s class. This went in both directions. Career-oriented majors that expect to go directly into the for-profit, private sector still expect the highest levels of salary, led by engineering and computer science, with median expectations of $56,112 and $51,855, respectively. However, these expectations are down considerably when compared with the figures for these majors from the Class of 2013. Students from these majors may be reacting to a perceived softening of demand for these skills in this year’s market. By contrast, students graduating in political science, psychology, healthcare (nursing), and the physical sciences all responded with salary expectations 10 percent or greater than their counterparts from the Class of 2013.
Major 2013 2014 % Change
Accounting $45,000 $47,553 5.7%
Business Administration $42,914 $42,247 -1.6%
Communications/Journalism $32,788 $34,957 6.6%
Computer Science $56,147 $51,855 -7.6%
Education $32,682 $34,826 6.6%
Engineering $59,504 $56,112 -5.7%
English $31,574 $31,274 -1.0%
Healthcare $43,469 $48,701 12.0%
Mathematics $43,142 $43,084 -0.1%
History/Political Science $33,489 $39,421 17.7%
Psychology $31,142 $35,494 14.0%
Physical Sciences $35,098 $38,644 10.1%
Social Sciences $36,637 $35,386 -3.4%
Visual & Performing Arts $30,218 $33,067 9.4%
Figure 10: Salary expectations by major, 2013 and 2014

20 | The Class of 2014 Student Survey Report | National Association of Colleges and Employers National Association of Colleges and Employers | The Class of 2014 Student Survey Report | 21
As in past years, there are significant gender differences in the salary expectations of new graduates. Men expect to earn more than women and the difference in expectations is not shrinking. The median expected salary among male graduates from the Class of 2014 is $47,088 while the median salary expectation for female graduates is $37,693—a difference of 24.9 percent. Last year, the difference in expected salary between male and female graduates was 24.4 percent
BENEFIT PREFERENCESThe composition and quality of an employer’s benefit package has been one of the most important employer/job traits to graduates over the past several graduating classes. For the Class of 2014, it stands fourth on the list in terms of importance—the same position it has held since the Class of 2012.
As in the past, student respondents were asked to rank order their top five choices for employee benefits they wanted a potential employer to offer. Responses were ordered based on two criteria. First, Figure 11 shows the ranking of benefits based on the percentage of first-place votes each benefit received compared with the overall number of first-place votes cast. Second, Figure 12 shows the ranking of benefits based on the percentage of total number of votes received, regardless of ranking, compared with the number of total votes cast.
% of Responses
More than 2 weeks of vacation 10.0%
Tuition reimbursement for advanced education 9.2%
Promises annual salary increases 9.2%
Company match for 401(k) 8.6%
100% employer-paid medical insurance 7.3%
Casual dress policy 7.2%
Dental insurance 7.2%
On-site fitness center 6.8%
Bonus/commission plan 6.3%
Frequent performance reviews 6.1%
Life insurance 5.9%
Family-friendly benefits 5.8%
Flextime 4.5%
Telecommuting option 2.4%
Employee assistance (counseling) program 2.1%
On-site day care facilities 1.5%
Figure 11: Employee benefit preferences – graduating seniors entering the work force

National Association of Colleges and Employers | The Class of 2014 Student Survey Report | 21
The ranking displayed in Figure 11 incorporates interest and intensity associated with benefit preference. The fact that this is the order of first-place votes indicates which benefit would make the most difference to a new graduate/employee when comparing potential employers. When reviewing the list, there are a number of observations that stand out. First, no single benefit is the overwhelming first choice among this year’s graduates. Number one on the list—more than two weeks of vacation in the first year of employment—is the first choice of only 10 percent of all respondents. This is very different from the responses received from students several years ago when the number one choice was overwhelmingly 100 percent employer-paid medical insurance. Second, the leading vote getters, at least as far as the top spot is concerned, are very different than choices made by previous classes. Since 2007, the leading vote getters among benefit preferences have been either 100 percent employer-paid medical insurance or the promise of annual salary increases. These are still of interest to the Class of 2014, as is clear from the rankings in Figure 12. However, the Class of 2014 is more focused on increased vacation time and the opportunity for developing skills and credentials at the employer’s expense than any previous class.
Total
Promises annual salary increases 12.3%
100% employer-paid medical insurance 12.2%
Company match for 401(k) 11.5%
Tuition reimbursement for advanced education 10.5%
More than 2 weeks of vacation 8.5%
Dental insurance 6.9%
Family-friendly benefits 6.1%
Life insurance 5.9%
Bonus/commission plan 5.9%
Frequent performance reviews 4.7%
Casual dress policy 4.2%
Flextime 3.6%
On-site fitness center 3.5%
Employee assistance (counseling) program 1.7%
Telecommuting option 1.7%
On-site day care facilities 0.9%
Figure 12: Employee benefit preferences – ranked by percent of total votes
Figure 12 shows the rank of overall interest in specific benefits without taking into account the level of intensity associated with those benefits. Receiving the most overall votes are the benefits that have traditionally had the most votes cast as preferred benefits—annual salary increases, employer-paid medical insurance, and a company-matched 401(k) program. The difference between the Class of 2014 and preceding classes is that the differential between these overall top vote getters and the two relative newcomers (tuition reimbursement and increased vacation time) has gotten considerably smaller. Meanwhile, some of the benefits that were near the top in the preference rankings of preceding classes (dental insurance, life insurance, and family-friendly benefits) are now dropping out of the preferred top tier.

22 | The Class of 2014 Student Survey Report | National Association of Colleges and Employers National Association of Colleges and Employers | The Class of 2014 Student Survey Report | 23
The changes seen in the preference orderings of benefits over the past several years go along with the focus of overall job preferences. The past several graduating classes are decidedly focused on maximizing personal gains in a job, i.e., developing their career options for down the road as opposed to maximizing performance in the current job with the current employer.
PERFORMANCE EXPECTATIONSStudents were asked about what they expected to give in the way of work commitment to their first job. The questions asked were about the hours they expected to work and the length of time they expected to remain with their first employer after graduation. These are questions that have been posed to new graduates periodically since 1982. They provide a perspective of how student attitudes may have changed across generations or in the light of changing economic conditions.
Figure 13 displays how graduates have responded to these two questions over the past several years compared with graduates from the Class of 2008. The figure indicates that the Class of 2014 is strikingly similar to Class of 2013 graduates in how they view their performance expectations. Both classes showed 1) an increased desire to remain with an initial employer for an extended period of time and 2) a reduced percentage of graduates who are willing to commit to working long hours in the initial job. These are changes that have occurred since the recession of 2009-10 seriously impacted the college hiring market. They point in a consistent direction along with the reduced importance on rapid advancement and high starting salary and the increased ranking of vacation time as an important employee benefit. Together these preferences indicate that current graduates have reduced their expectations for financial rewards connected with employment and have decided to emphasize the non-work aspects of the work-life equation when examining the opportunities presented by the labor market. They point to potential serious issues with workplace engagement, at least at the beginning of the career, with the current crop of new college graduates.
0 20 40 60 80 100
20132014 2012 2008
84.1%84.0%84.8%
77.9%
83.4%83.4%
86.8%86.7%
Stay more than 2 years
Work more than 40 hrs.
Figure 13: Commitment expectations

National Association of Colleges and Employers | The Class of 2014 Student Survey Report | 23
TARGET INDUSTRIESAll of the preceding brings us to the industries where Class of 2014 graduates say they would like to begin their careers. Students were asked to identify their top three industry sector choices from a list of 19 industry sectors for employment. As with benefit preferences, preferred industries were ranked first by the percentage of respondents that identified the industry as their top choice, then by the percentage of total votes the industry received compared with the total number of votes cast.
% Identified as Top Choice % Total Votes
Government 13.7% 10.3%
Human Services 12.3% 10.6%
Education 10.9% 11.0%
Social Services 9.9% 9.2%
Professional Services Consulting 7.6% 11.4%
Hospitality 6.4% 4.4%
Healthcare 6.2% 9.6%
Communications 5.2% 6.7%
Retail Trade 5.1% 3.8%
Finance 4.7% 5.8%
Pharmaceutical Manufacturing 3.4% 3.5%
Computer & Electronics Manufacturing 2.8% 3.2%
Other Manufacturing 2.5% 2.3%
Oil & Gas Extraction 2.1% 1.9%
Agriculture 1.9% 1.7%
Transportation 1.5% 1.3%
Architecture & Construction 1.3% 1.3%
Wholesale Trade 1.3% 1.1%
Utilities 1.1% 0.9%
Figure 14: Preferred industry to begin career – graduating seniors
As has been true with the past several classes, the top four industries are essentially outside of the private sector—they are either government or nonprofit organizations. The only for-profit, private sector choice that scores anywhere near the top is the professional services sector—an area focused on consulting services dealing with accounting, engineering, law, and/or general management consulting. (See Figure 14.) However, there is a difference with the Class of 2014. When ranking industries by the percentage of total votes received—essentially a measure of acceptability—the top scoring industry is professional services, eclipsing government, which had been the top acceptable choice of the past two graduating classes.
24 | The Class of 2014 Student Survey Report | National Association of Colleges and Employers National Association of Colleges and Employers | The Class of 2014 Student Survey Report | 25
% Identified as Top Choice % Total Votes
Government 13.4% 9.9%
Human Services 10.9% 9.6%
Education 9.8% 9.6%
Professional Services Consulting 8.6% 12.9%
Social Services 8.6% 8.0%
Hospitality 6.5% 4.5%
Communications 5.8% 7.7%
Healthcare 5.7% 7.4%
Retail Trade 5.7% 4.3%
Finance 5.4% 6.8%
Other Manufacturing 3.4% 3.0%
Computer & Electronics Manufacturing 3.3% 3.8%
Pharmaceutical Manufacturing 2.9% 3.0%
Oil & Gas Extraction 2.5% 2.4%
Transportation 1.7% 1.6%
Agriculture 1.7% 1.7%
Wholesale Trade 1.4% 1.3%
Utilities 1.4% 1.2%
Architecture & Construction 1.3% 1.5%
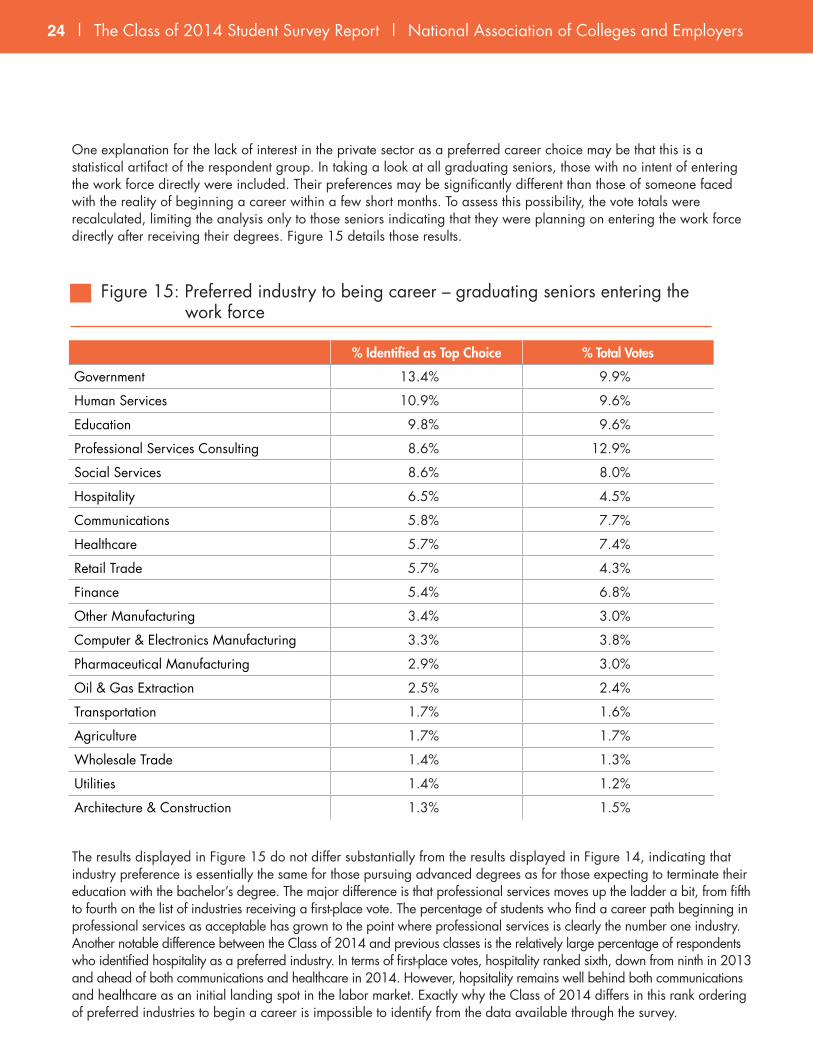
Figure 15: Preferred industry to being career – graduating seniors entering the work force
One explanation for the lack of interest in the private sector as a preferred career choice may be that this is a statistical artifact of the respondent group. In taking a look at all graduating seniors, those with no intent of entering the work force directly were included. Their preferences may be significantly different than those of someone faced with the reality of beginning a career within a few short months. To assess this possibility, the vote totals were recalculated, limiting the analysis only to those seniors indicating that they were planning on entering the work force directly after receiving their degrees. Figure 15 details those results.
The results displayed in Figure 15 do not differ substantially from the results displayed in Figure 14, indicating that industry preference is essentially the same for those pursuing advanced degrees as for those expecting to terminate their education with the bachelor’s degree. The major difference is that professional services moves up the ladder a bit, from fifth to fourth on the list of industries receiving a first-place vote. The percentage of students who find a career path beginning in professional services as acceptable has grown to the point where professional services is clearly the number one industry. Another notable difference between the Class of 2014 and previous classes is the relatively large percentage of respondents who identified hospitality as a preferred industry. In terms of first-place votes, hospitality ranked sixth, down from ninth in 2013 and ahead of both communications and healthcare in 2014. However, hopsitality remains well behind both communications and healthcare as an initial landing spot in the labor market. Exactly why the Class of 2014 differs in this rank ordering of preferred industries to begin a career is impossible to identify from the data available through the survey.
National Association of Colleges and Employers | The Class of 2014 Student Survey Report | 25
2014 2013
% Used
Employer websites 96.8% 95.4%
Friends 88.3% 83.9%
Parents and/or relatives 84.6% 81.9%
Career/job fairs 83.2% 78.1%
Faculty members 80.1% 75.1%
Social networking sites 78.5% 70.7%
Employer representatives on campus 75.4% 70.0%
Career services office 73.0% 68.9%
Employer information presentations on campus 70.7% 62.7%
Ads in recruitment publications 68.8% 60.7%
Employer recruitment brochures (print) 68.8% 60.8%
Alumni 68.6% 58.9%
Articles in newspapers or magazines 57.9% 49.7%
Trade/professional associations 53.4% 45.1%
Virtual career fairs 43.5% 34.1%
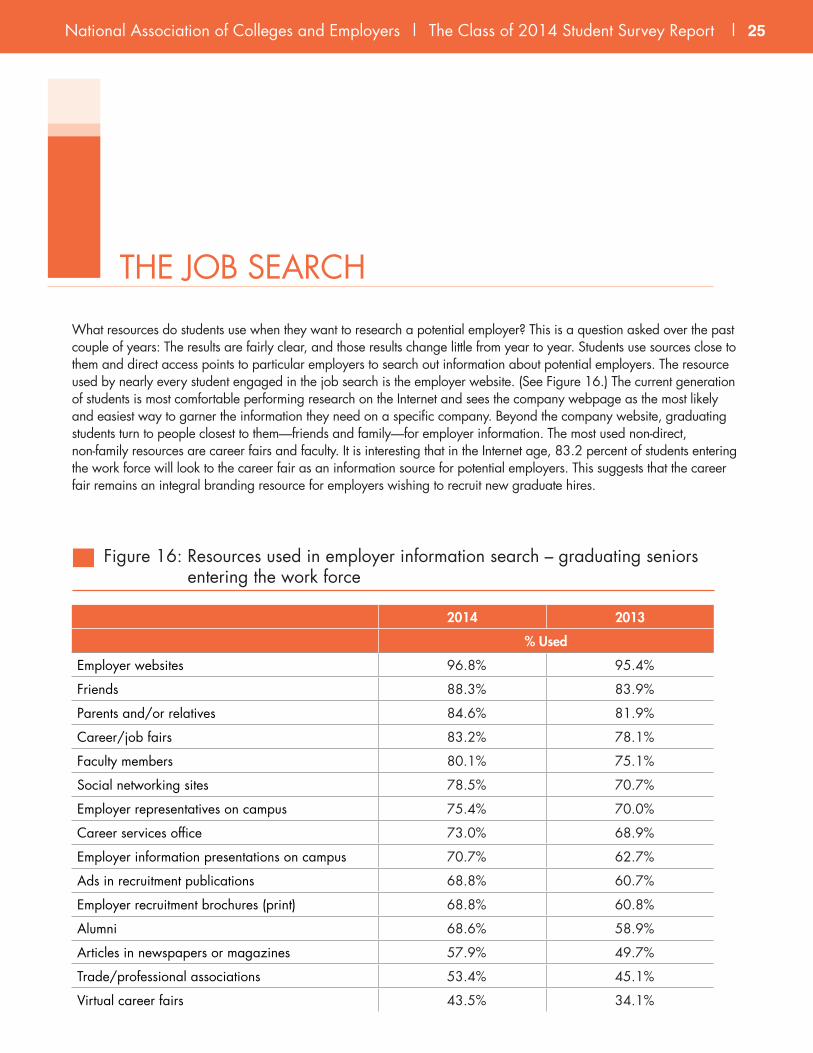
Figure 16: Resources used in employer information search – graduating seniors entering the work force
THE JOB SEARCH
What resources do students use when they want to research a potential employer? This is a question asked over the past couple of years: The results are fairly clear, and those results change little from year to year. Students use sources close to them and direct access points to particular employers to search out information about potential employers. The resource used by nearly every student engaged in the job search is the employer website. (See Figure 16.) The current generation of students is most comfortable performing research on the Internet and sees the company webpage as the most likely and easiest way to garner the information they need on a specific company. Beyond the company website, graduating students turn to people closest to them—friends and family—for employer information. The most used non-direct, non-family resources are career fairs and faculty. It is interesting that in the Internet age, 83.2 percent of students entering the work force will look to the career fair as an information source for potential employers. This suggests that the career fair remains an integral branding resource for employers wishing to recruit new graduate hires.

26 | The Class of 2014 Student Survey Report | National Association of Colleges and Employers National Association of Colleges and Employers | The Class of 2014 Student Survey Report | 27
There are no remarkable changes in the use of these resources between the classes of 2013 and 2014. The major difference is that the Class of 2014 appears to have been generally more aggressive in pursuing employer information across the variety of resources than was the Class of 2013. The usage rate for every source of employer information increased this year as compared to the Class of 2013 graduates that were entering the work force.
The company website and friends and family are the most popular resources, but how do those that use these resources rate them in terms of their effectiveness in providing good information about the employer? Figure 17 shows the percentage of users for each resource that rated the resource as being an effective way to get information about the potential employer.
Resource 2014 2013 2012
Employer websites 78.2% 71.9% 77.9%
Employer representatives on campus 65.7% 59.3% 66.1%
Friends 63.0% 57.5% 61.7%
Parents and/or relatives 61.1% 59.3% 62.1%
Faculty members 59.9% 58.3% 61.8%
Employer information presentations on campus 59.8% 54.9% 61.5%
Career/job fairs 58.4% 53.3% 59.4%
Alumni 54.7% 50.5% 52.7%
Social networking sites 52.7% 46.4% 44.0%
Career services office 52.4% 54.2% 57.4%
Ads in job-search/recruitment publications 47.2% 43.7% 45.0%
Employer recruitment brochures (print) 44.5% 40.0% 44.4%
Trade/professional associations 38.9% 39.1% 42.5%
Articles in newspapers or magazines 36.1% 35.7% 40.4%
Virtual career fairs 31.0% 30.7% 36.0%
Figure 17: Effectiveness of resources to learn about potential employers

National Association of Colleges and Employers | The Class of 2014 Student Survey Report | 27
As with the usage rate of these resources, the graduates from the Class of 2014 generally rated every resource as more effective than did the Class of 2013. This is probably a reflection of the positive job market encountered in the spring of 2014. It is more interesting to compare the changes since 2012 to see if any pattern is emerging, particularly since 2012 was an optimistic year for college hiring as compared to 2013. Compared to 2012, very few resources have risen in effectiveness from the perspective of the graduate seeking information on potential employers. The one outstanding change has been the growth in positive effectiveness ratings for social networking sites. While still ranking in the lower half of resources, there has been steady and significant growth in the percentage of graduating job seekers who perceive these sites as providing good information about potential employers. The effectiveness rating for social networking sites has grown by nearly 9 percentage points since 2012. Only two other resources have increased their effectiveness rating by 2 or more percentage points, alumni (2.2 points) and ads in job-search magazines (2 points). By contrast, most of the other resources have seen a drop in effectiveness led by virtual career fairs and the career services office both of which have experienced a 5 percentage point drop in effectiveness. The drop in effectiveness of career services as a source of employer information is particularly troublesome because there were declines in this rating when compared with both 2012 and 2013.
Since social networking and the Internet in general have clearly grown as resources in obtaining information about employers, it was necessary to identify those Internet sites that students entering the work force used most heavily when they sought information about employers. This question was asked in 2012 as well as in 2014, and it is instructive to see not only what the current top websites are, but also what trending is apparent in the use of these sites.
Figure 18 lists the sites in rank order of current usage. LinkedIn is now the number one Internet site for obtaining information about a potential employer—approximately 58 percent of graduating seniors who had begun their job searches used LinkedIn to obtain information about employers. Following LinkedIn, the Internet sites used by Class of 2014 graduates are the employer’s company website, the college career center website, and Indeed.com. Two sites stand out for their growth in usage over the past two years. LinkedIn and Indeed have both increased in usage by more than 22 percentage points since 2012. No other website increased by more than 4 percentage points. A number of websites suffered modest decreases in usage. The most notable are CareerBuilder and Monster—both decreased by just over 3 percentage points.
Students were also asked as to the relative helpfulness of job-search resources. This has been a question asked throughout the history of this survey and the responses are fairly consistent year to year. Students tend to use friends and family as their most trusted advisers with faculty as the most influential on-campus resource. What tends to change from one year to the next is the relative perception of how helpful any of these resources are in the job search. This respondent perception is highly influenced by the job market. In very bad years, virtually none of these personal resources are considered very helpful, and as the market improves, the perception that these sources are indeed helpful also improves.

28 | The Class of 2014 Student Survey Report | National Association of Colleges and Employers National Association of Colleges and Employers | The Class of 2014 Student Survey Report | 29
With a job market improving at the very time this survey was conducted, it was expected that there would be some improvement in the helpfulness ratings around these job-search resources. However, as Figure 19 illustrates, there is little change in the perceptions of the Class of 2014. Only friends and faculty were viewed by a greater percentage of respondents as more helpful in 2014 than in 2013. All other personal contacts had lower helpfulness scores than in 2013. This result may be partially explained by the increase in use for a number of these contacts. Alumni, relatives, and the career center saw significant increases in the percentage of graduating seniors using them as a resource in the job search. All had usage rate increases of 7 percentage points or more. So, the decline in effectiveness is somewhat comparable to the unemployment rate, increasing when the percentage of the population looking for work increases. More students are saying they are being helped by using these contacts, but the base of students using the contacts is increasing even faster.
2014 2012
LinkedIn 58.3% 34.8%
Individual company websites 45.9% 44.1%
My career center’s job posting website 45.4% 41.6%
Indeed 43.7% 21.1%
CareerBuilder 32.0% 35.2%
Monster 31.9% 35.2%
SimplyHired 20.5% 16.2%
USAJobs 19.9% 20.7%
Internships.com 17.0% 13.1%
Experience 8.9% 7.8%
JobCentral/US.jobs 7.6% 10.1%
MonsterCollege 6.0% 7.4%
CollegeRecruiter.com 5.7% 5.6%
Classifieds in the college newspaper 5.3% 8.8%
AfterCollege 4.1% 2.7%
CareerRookie 2.3% 3.6%
Vault 2.2% 2.0%
Doostang 1.7% 0.6%
Dice 1.6% 1.9%
Figure 18: Internet sites used to obtain employer information

National Association of Colleges and Employers | The Class of 2014 Student Survey Report | 29
0 10 20 30 40 50
20132014
31.7%33.3%
43.6%44.7%
46.8%43.1%
45.3%43.4%
36.1%38.3%
35.4%36.1%
Relatives
Parents
Friends
Faculty
Career services
Alumni
Figure 19: Personal contacts used in the job search, 2013 - 2014
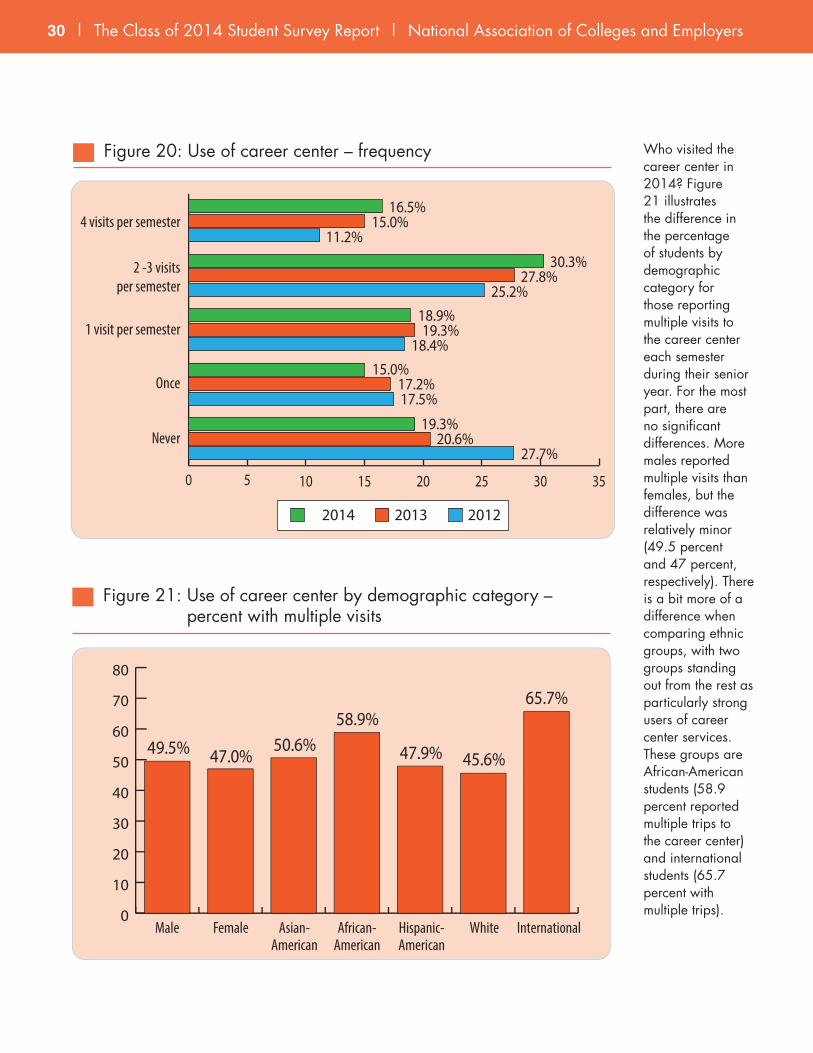
THE USE OF CAREER SERVICESMore of the Class of 2014 tended to use their college career services office than previous classes. Figure 20 displays the frequency with which the career center was visited by the member of the Class of 2014 compared with the two previous classes. This year’s graduating seniors were more likely to have paid a visit to their career center than members of any previous classes. The percentage of seniors who said they did not visit their college career center at least once during their senior year dipped below 20 percent for the first time since the question was first asked in 2010. By contrast, 28 percent of previous classes typically reported that they did not visit the career center. The Class of 2013 was the first to deviate from the typical response, with just over 20 percent indicating that they did not visit their career center. This suggests that graduating students are now more open to checking out what they perceive to be a more enticing job market. From 2010 to 2012, the dour prospects associated with the recession may have discouraged graduates from pursuing job possibilities until after their graduation.
Respondents from the Class of 2014 were also considerably more likely to visit their career centers on multiple occasions when compared with previous graduating groups. Nearly 47 percent of respondents to this year’s survey said that they made multiple visits per semester compared with the previous high of 43 percent recorded by the Class of 2013.
30 | The Class of 2014 Student Survey Report | National Association of Colleges and Employers National Association of Colleges and Employers | The Class of 2014 Student Survey Report | 31
0 5 10 15 20 25 30 35
20132014 2012
16.5%15.0%
11.2%
30.3%27.8%
25.2%18.9%19.3%
18.4%15.0%
17.2%17.5%
19.3%20.6%
27.7%
4 visits per semester
2 -3 visits per semester
1 visit per semester
Once
Never
Figure 20: Use of career center – frequency Who visited the career center in 2014? Figure 21 illustrates the difference in the percentage of students by demographic category for those reporting multiple visits to the career center each semester during their senior year. For the most part, there are no significant differences. More males reported multiple visits than females, but the difference was relatively minor (49.5 percent and 47 percent, respectively). There is a bit more of a difference when comparing ethnic groups, with two groups standing out from the rest as particularly strong users of career center services. These groups are African-American students (58.9 percent reported multiple trips to the career center) and international students (65.7 percent with multiple trips).
49.5% 47.0%50.6%
58.9%
47.9% 45.6%
65.7%
Male Female White InternationalAsian-American
African-American
Hispanic-American
0
10
20
30
40
50
60
70
80
Figure 21: Use of career center by demographic category – percent with multiple visits

National Association of Colleges and Employers | The Class of 2014 Student Survey Report | 31
International-10
-5
0
5
10
15
20
Male Female Asian-American
African-American
Hispanic-American
White Overall
1.3%2.0%3.8%
15.1%
1.7%
-4.1%-7.4%
-1.0%
Figure 22: Impact of the career center on offer rates
Did visiting the career center make a difference when it came to getting a job, or, at least, getting an offer of a job? Frankly, with the host of other variables that can play a role in whether or not a graduate receives a job offer, it is very difficult to truly isolate the impact of the career center. Nevertheless, there are some interesting differences that can be seen when comparing the percentage of students who received full-time job offers between graduates who used the career center and those that did not.
Overall, there seems to be a modest positive relationship between using the career center and receiving a job offer. Respondents who said they visited the career center or the career center website during the course of their senior year and applied for jobs had an offer rate that was 1.3 percentage points higher than respondents who did not visit the career center or its website and applied for jobs. More interesting, perhaps, is the difference that visiting the career center had for certain demographic groups, particularly African-Americans.
Figure 22 illustrates the differential in offer rate connected with using the career center by demographic category. The greatest positive difference is recorded for African-American respondents. Among African-American graduates, those that used the career center had an offer rate that was just over 15 percentage points higher than for African-American graduates who did not use the career center. This may be connected with the relatively high usage rate of the career center recorded for African-Americans. However, the usage rate among international students was even higher than it was for African-Americans, but the results were no better than for international students who did not use the career center. In fact, they were worse—down by 4 percentage points. The problem with this comparison is that international students present a very special case. Immigration laws in the United States make it particularly difficult for an international graduate of an American university to secure a job in the United States. Most who wish to stay in the United States will seek the help of the career center, but there is little assistance that the career center can provide that will increase the opportunities available to international students. Consequently, effectiveness assessments based on international students cannot be made.

32 | The Class of 2014 Student Survey Report | National Association of Colleges and Employers National Association of Colleges and Employers | The Class of 2014 Student Survey Report | 33
Figure 23 details the services used by the seniors who visit the career center. As with visits, the percentage of students reporting the use of individual services increased with the Class of 2014 for virtually every service on the list. The relative usage of each of the services does remain the same, however. The most frequently used activity is help with resumes. Eighty percent of students coming to career services do so in order to upgrade or to review their resumes. Other services that are heavily used are the career services job listings and job-search assistance from career counselors. The biggest change was in the use of career testing and career assessments. The use of these tests grew by 6 percentage points over the past year.
Service % of Respondents
Resume writing/reviewing assistance 80.2%
Career center job listings 75.9%
Job-search assistance 74.5%
Individual career counseling 65.2%
Internship/co-op search assistance 64.9%
Researching a potential employer 58.7%
Career or employment workshops 58.5%
Career skills testing and career assessments 54.6%
Practice interview sessions 50.9%
Figure 23: Career center activities: usage rates for graduating seniors
Service % of Respondents
Resume writing/reviewing assistance 55.9%
Using career center job listings 45.7%
Practice interview sessions 45.3%
Individual career counseling 41.1%
Career or employment workshops 40.1%
Internship/co-op search assistance 39.6%
Job-search assistance 37.6%
Researching a potential employer 36.3%
Career skills testing and career assessments 33.8%
Figure 24: Career center activities: helpfulness ratings
How do students perceive the various services offered by their career centers as to how helpful they are in the job-search process? Figure 24 ranks career center services by their perceived helpfulness in the job search. In order to assess their true evaluation, the rankings are based on only those students who reported actually using the service. As can be seen from a review of the table, the highest ranked service is also the one most students report using—help in writing or editing the student’s resume. Following resume writing and review assistance are the career center’s job listings and practice interview sessions. Since all of these services are directly related to the immediate job search, their standing at the top of the list is understandable given that the respondents to the survey were seniors intent on entering the job market. The one troubling rating goes to researching potential employers. This is one area of the immediate job search that respondents did not feel that the career center was particularly adept at assisting.

National Association of Colleges and Employers | The Class of 2014 Student Survey Report | 33
Overall, the “helpfulness” assessment given to career services is about the same as was recorded for previous classes, even though interaction with career services increased significantly with the Class of 2014. The major differences were in significant improvements in the helpfulness rating for career skills testing (an increase of 3.6 percentage points) and individual career counseling (an increase of 3 percentage points). This is an indication that there is some growth in the student perception of career services, taking that perception beyond the simple placement notion to associating the career center with the immediate search for a job.
SOCIAL NETWORKING AND THE JOB SEARCHOne last aspect of the graduate job search covered in the survey was the use of social networking. A few years ago social networking was seen as a “game changer” in the way employers and new graduates connect with each other. This was when social networking was seen as a “future trend.”4 To some extent, social networking has come of age and can no longer be seen as something that will transform the recruiting landscape in a future sense—just note how important social networks, particularly LinkedIn, have become in providing students with information about prospective employers.
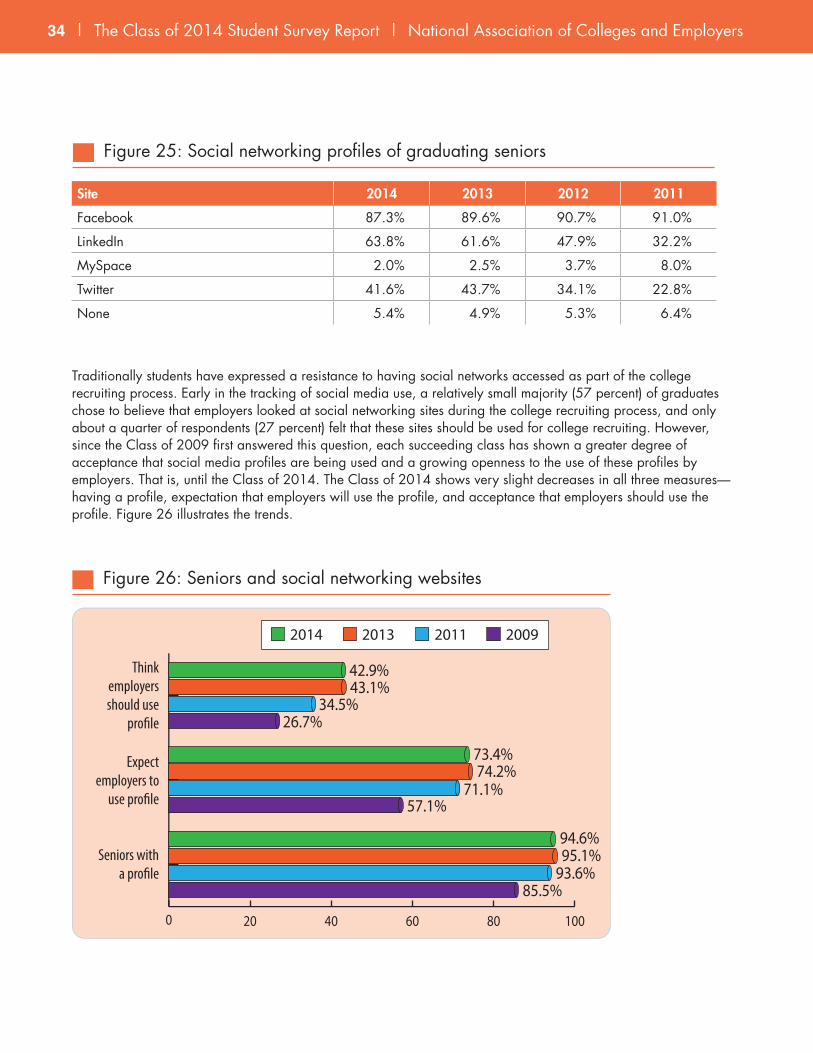
Many of the players in college recruiting feel social networks are now a central aspect of the process. Recent surveys conducted by NACE of both employers and college career services have found groups open and enthusiastic about employing these networks in the college recruiting process, although there remain issues with how these technologies can be employed most effectively.5 For the past several years, students were asked if they have a social networking profile. The first couple of years, around 85 percent of the respondents reported that they had a profile. This year’s graduates who plan to enter the job market report the highest percentage to date for the number of students with an online social networking profile. The number now approaches 95 percent. It is the rare student indeed that cannot be reached through an online social network.
The central question at this point may not be the growth in social networking related to the job search, but whether students have reached a state of maturity with social networking, particularly with specific sites. The critical questions may be whether it is time to find new actors in this sphere and/or has social networking essentially peaked as a job-search factor?
What social networking technologies are these students actually using? Figure 25 displays the distribution of graduating seniors who are entering the work force among the better known social networking technologies with the usage trends from 2011 to the present. Facebook remains the dominant social network, although the percent of graduating seniors with a Facebook profile has declined every year since 2011. The decline has not been dramatic, dropping from 91 percent in 2011 to 87 percent in 2014. Nevertheless, it is clear that Facebook has reached its peak penetration among college students and some are apparently searching for alternatives. LinkedIn is still in second place in terms of the percentage of students that have created a profile in its space. LinkedIn grew dramatically from 2011 to 2013 moving from 32 percent to 62 percent use by graduating seniors. However, the past year saw only nominal growth to 64 percent of graduating seniors possessing a LinkedIn profile. Twitter also grew substantially during the 2011-2013 period. Among students graduating in 2011, approximately 23 percent said they had a Twitter account. In two years this percentage doubled: 44 percent of respondents from the Class of 2013 report having a Twitter account. However, the 40 percent level may be Twitter saturation point. Among graduating seniors from the Class of 2014, only 42 percent reported having a Twitter account. Finally, MySpace, which at one point was a major player in the social networking community, has all but died as an application among today’s college students. The MySpace profile merits only 2 percent.
4. NACE, “Looking Ahead: Highlights from the Future Trends Survey,” NACE Journal, Vol. LXX, No.1, September 2009.5. NACE, “Use of Facebook in the Talent Acquisition Process,” Bethlehem, PA: National Association of Colleges and Employers, June, 2012 and NACE, “Career Services Use of Social Media Technologies,” National Association of Colleges and Employers and Career Advisory Board, May 2013.
34 | The Class of 2014 Student Survey Report | National Association of Colleges and Employers National Association of Colleges and Employers | The Class of 2014 Student Survey Report | 35
Site 2014 2013 2012 2011
Facebook 87.3% 89.6% 90.7% 91.0%
LinkedIn 63.8% 61.6% 47.9% 32.2%
MySpace 2.0% 2.5% 3.7% 8.0%
Twitter 41.6% 43.7% 34.1% 22.8%
None 5.4% 4.9% 5.3% 6.4%
Figure 25: Social networking profiles of graduating seniors
Traditionally students have expressed a resistance to having social networks accessed as part of the college recruiting process. Early in the tracking of social media use, a relatively small majority (57 percent) of graduates chose to believe that employers looked at social networking sites during the college recruiting process, and only about a quarter of respondents (27 percent) felt that these sites should be used for college recruiting. However, since the Class of 2009 first answered this question, each succeeding class has shown a greater degree of acceptance that social media profiles are being used and a growing openness to the use of these profiles by employers. That is, until the Class of 2014. The Class of 2014 shows very slight decreases in all three measures—having a profile, expectation that employers will use the profile, and acceptance that employers should use the profile. Figure 26 illustrates the trends.
0 20 40 60 80 100
20132014 2011 2009
42.9%43.1%
34.5%26.7%
73.4%74.2%
71.1%57.1%
94.6%95.1%
93.6%85.5%
Think employers should use
pro�le
Expect employers to
use pro�le
Seniors with a pro�le
Figure 26: Seniors and social networking websites
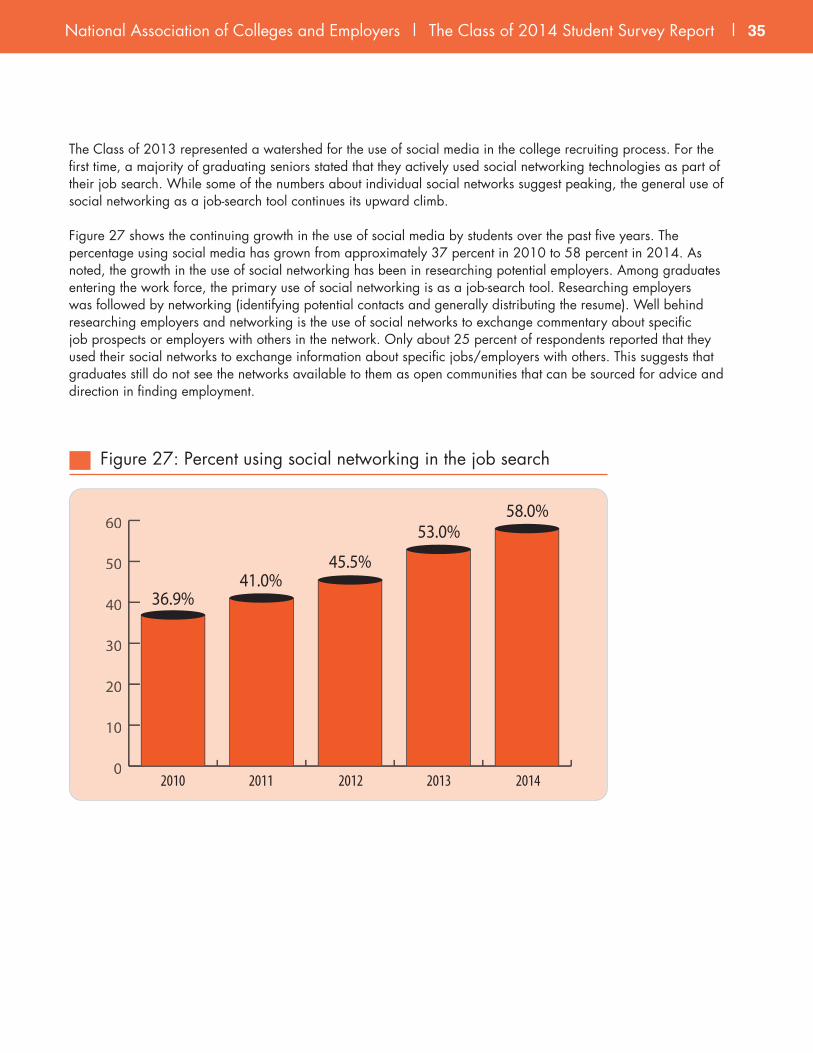
National Association of Colleges and Employers | The Class of 2014 Student Survey Report | 35
The Class of 2013 represented a watershed for the use of social media in the college recruiting process. For the first time, a majority of graduating seniors stated that they actively used social networking technologies as part of their job search. While some of the numbers about individual social networks suggest peaking, the general use of social networking as a job-search tool continues its upward climb.
Figure 27 shows the continuing growth in the use of social media by students over the past five years. The percentage using social media has grown from approximately 37 percent in 2010 to 58 percent in 2014. As noted, the growth in the use of social networking has been in researching potential employers. Among graduates entering the work force, the primary use of social networking is as a job-search tool. Researching employers was followed by networking (identifying potential contacts and generally distributing the resume). Well behind researching employers and networking is the use of social networks to exchange commentary about specific job prospects or employers with others in the network. Only about 25 percent of respondents reported that they used their social networks to exchange information about specific jobs/employers with others. This suggests that graduates still do not see the networks available to them as open communities that can be sourced for advice and direction in finding employment.
0
10
20
30
40
50
60
0
10
20
30
40
50
60
36.9%41.0%
45.5%
53.0%58.0%
2010 2013 20142011 2012
Figure 27: Percent using social networking in the job search
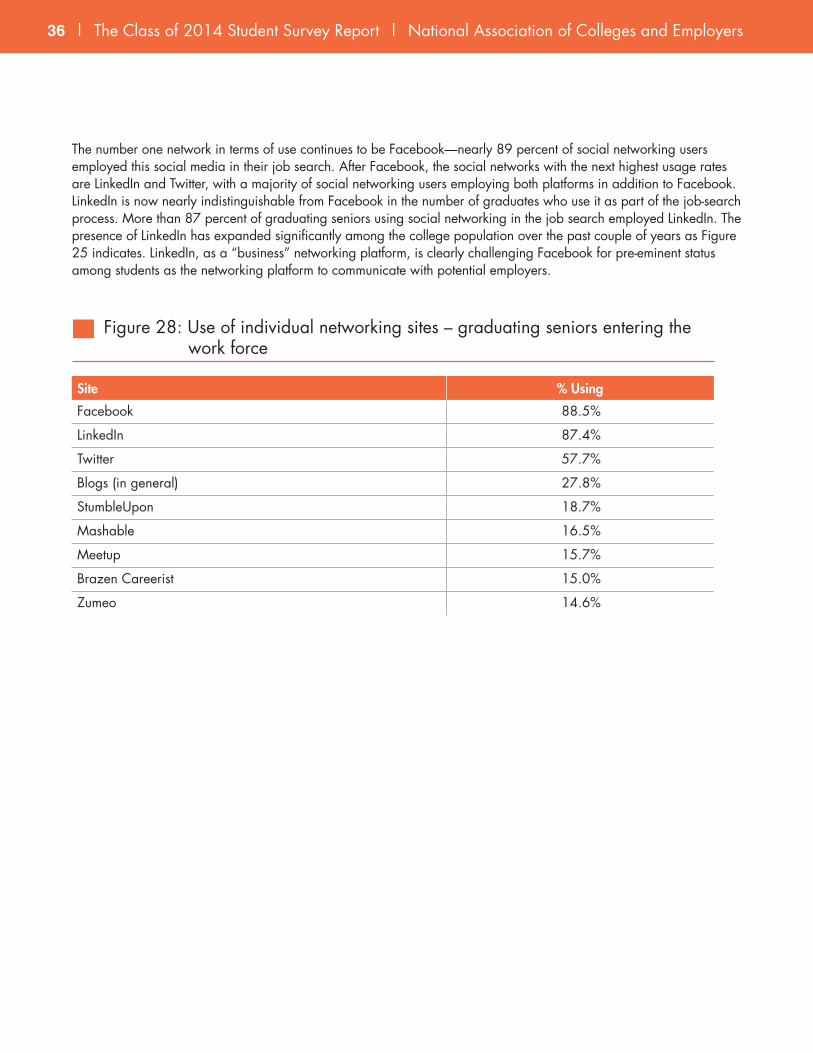
36 | The Class of 2014 Student Survey Report | National Association of Colleges and Employers National Association of Colleges and Employers | The Class of 2014 Student Survey Report | 37
Site % Using
Facebook 88.5%
LinkedIn 87.4%
Twitter 57.7%
Blogs (in general) 27.8%
StumbleUpon 18.7%
Mashable 16.5%
Meetup 15.7%
Brazen Careerist 15.0%
Zumeo 14.6%
Figure 28: Use of individual networking sites – graduating seniors entering the work force
The number one network in terms of use continues to be Facebook—nearly 89 percent of social networking users employed this social media in their job search. After Facebook, the social networks with the next highest usage rates are LinkedIn and Twitter, with a majority of social networking users employing both platforms in addition to Facebook. LinkedIn is now nearly indistinguishable from Facebook in the number of graduates who use it as part of the job-search process. More than 87 percent of graduating seniors using social networking in the job search employed LinkedIn. The presence of LinkedIn has expanded significantly among the college population over the past couple of years as Figure 25 indicates. LinkedIn, as a “business” networking platform, is clearly challenging Facebook for pre-eminent status among students as the networking platform to communicate with potential employers.

National Association of Colleges and Employers | The Class of 2014 Student Survey Report | 37
Figure 29 clearly indicates why student usage of LinkedIn is gaining on Facebook in the realm of the college job search. Figure 29 presents the list of social networks in rank-order based on the percentage of users that rated the platform as an effective tool (service) in their job search. The figure shows only one network, LinkedIn, which is perceived as effective in providing help in the job search. Nearly 74 percent of LinkedIn users felt that the service was effective. By comparison, fewer than 25 percent of users of any other social networking platform found that individual service to be effective.
Site 2014 2013
LinkedIn 73.8% 69.6%
Blogs (in general) 23.7% 19.5%
Facebook 19.9% 18.0%
Twitter 17.5% 17.6%
Mashable 11.4% 12.0%
Meetup 9.2% 7.9%
StumbleUpon 6.4% 7.5%
Brazen Careerist 5.9% 6.3%
Zumeo 4.7% 4.8%
Figure 29: Effectiveness of individual networking sites as rated by graduating seniors entering the work force
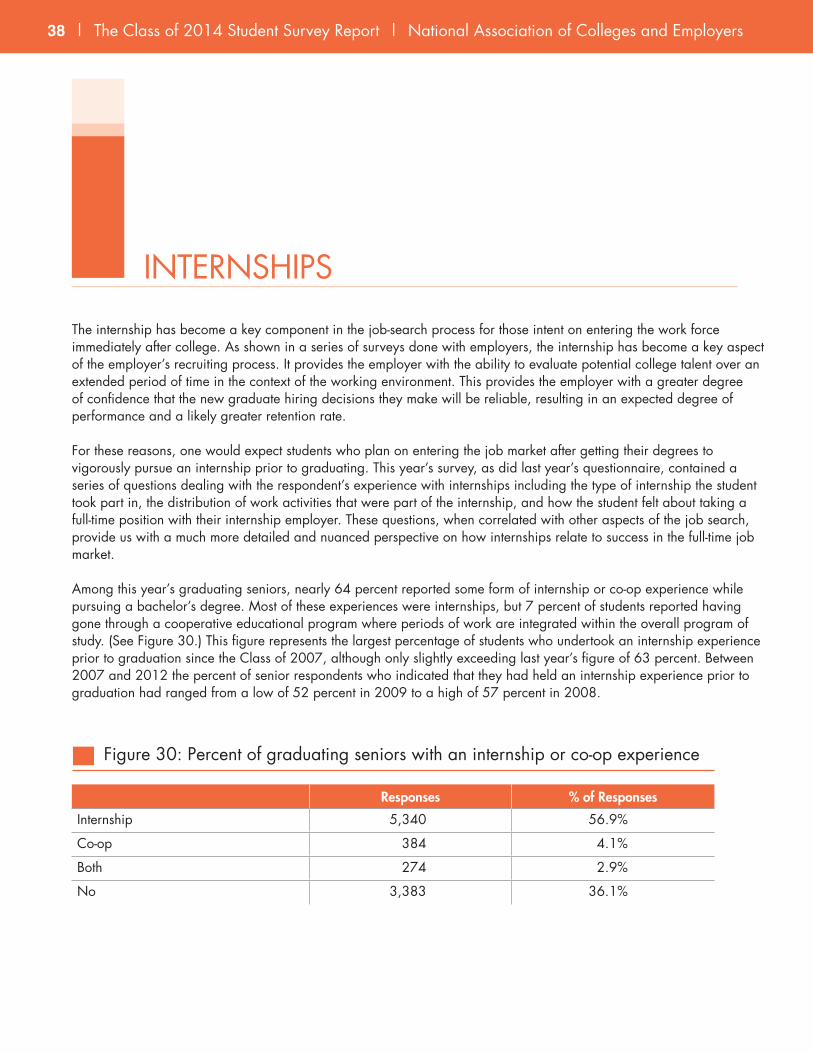
38 | The Class of 2014 Student Survey Report | National Association of Colleges and Employers National Association of Colleges and Employers | The Class of 2014 Student Survey Report | 39
INTERNSHIPS
The internship has become a key component in the job-search process for those intent on entering the work force immediately after college. As shown in a series of surveys done with employers, the internship has become a key aspect of the employer’s recruiting process. It provides the employer with the ability to evaluate potential college talent over an extended period of time in the context of the working environment. This provides the employer with a greater degree of confidence that the new graduate hiring decisions they make will be reliable, resulting in an expected degree of performance and a likely greater retention rate.
For these reasons, one would expect students who plan on entering the job market after getting their degrees to vigorously pursue an internship prior to graduating. This year’s survey, as did last year’s questionnaire, contained a series of questions dealing with the respondent’s experience with internships including the type of internship the student took part in, the distribution of work activities that were part of the internship, and how the student felt about taking a full-time position with their internship employer. These questions, when correlated with other aspects of the job search, provide us with a much more detailed and nuanced perspective on how internships relate to success in the full-time job market.
Among this year’s graduating seniors, nearly 64 percent reported some form of internship or co-op experience while pursuing a bachelor’s degree. Most of these experiences were internships, but 7 percent of students reported having gone through a cooperative educational program where periods of work are integrated within the overall program of study. (See Figure 30.) This figure represents the largest percentage of students who undertook an internship experience prior to graduation since the Class of 2007, although only slightly exceeding last year’s figure of 63 percent. Between 2007 and 2012 the percent of senior respondents who indicated that they had held an internship experience prior to graduation had ranged from a low of 52 percent in 2009 to a high of 57 percent in 2008.
Responses % of Responses
Internship 5,340 56.9%
Co-op 384 4.1%
Both 274 2.9%
No 3,383 36.1%
Figure 30: Percent of graduating seniors with an internship or co-op experience

National Association of Colleges and Employers | The Class of 2014 Student Survey Report | 39
Demographically, there was little difference between those seniors with an internship experience and those that did not have one. Males and females partook of internships in relatively equal proportions (63 percent for males; 65 percent for females). There was some difference among ethnic groups in those having an internship experience. African-American and Hispanic-American graduates were somewhat less likely to have had an internship experience than other ethnic groups. Fifty-eight percent of African-American graduates and 57 percent of Hispanic-American graduates reported having an internship experience compared with 63 to 65 percent in the other individual ethnic categories.
INTERNSHIPS AND JOB OFFERSThat internships are positively correlated with an improved chance of getting a full-time job offer is virtually indisputable at this point. Since undertaking these expanded student surveys in 2007, it has been shown that graduates applying for a full-time job prior to graduation were far more likely to receive a job offer, and to be compensated at a higher level in a full-time position if they had an internship or co-op experience. That was certainly the case among graduates from the Class of 2014 entering the work force.
Figure 31 shows the differential in offer rate for graduates who had an internship/co-op experience against those graduates active in the job market who did not have such an experience since 2011. In every year, the percentage of job seekers with an experiential education background did considerably better in terms of receiving a job offer than those who did not engage an internship or co-op. The differential fluctuated a bit from year to year, but it has consistently remained in the range of 12 to 15 percentage points. For the Class of 2014, 52.1 percent of job applicants with an internship or co-op received at least one offer of a full-time position compared with just 38.6 percent of applicants without the internship or co-op—a difference of 13.5 percentage points.
While it is clear in the broadest sense that having an internship is positively correlated with getting a full-time job offer, there remains the question whether this positive correlation works for all types of internships, particularly for those that students that take one without compensation.
0
10
20
30
40
50
60
Internship No Internship
2014 2013 2012 2011
45.9%51.3%
33.3%39.6%
50.7%
35.2%
52.1%
38.6%
Figure 31: Internship and job offers
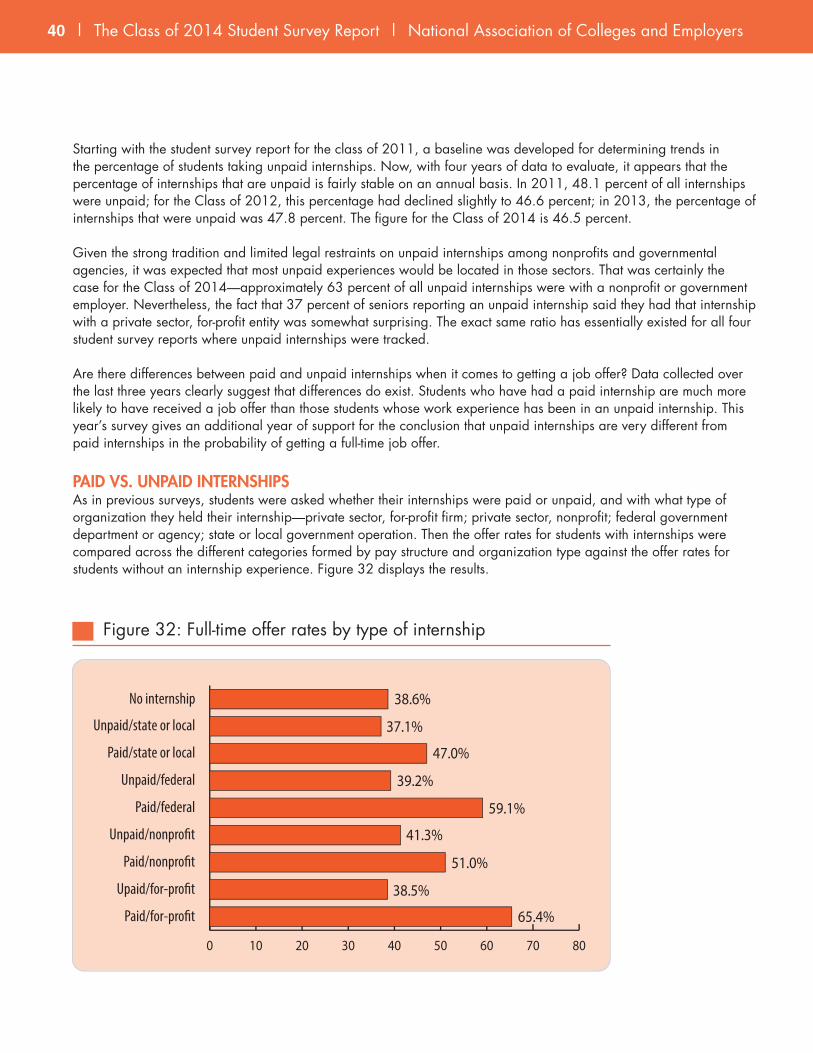
40 | The Class of 2014 Student Survey Report | National Association of Colleges and Employers National Association of Colleges and Employers | The Class of 2014 Student Survey Report | 41
Starting with the student survey report for the class of 2011, a baseline was developed for determining trends in the percentage of students taking unpaid internships. Now, with four years of data to evaluate, it appears that the percentage of internships that are unpaid is fairly stable on an annual basis. In 2011, 48.1 percent of all internships were unpaid; for the Class of 2012, this percentage had declined slightly to 46.6 percent; in 2013, the percentage of internships that were unpaid was 47.8 percent. The figure for the Class of 2014 is 46.5 percent.
Given the strong tradition and limited legal restraints on unpaid internships among nonprofits and governmental agencies, it was expected that most unpaid experiences would be located in those sectors. That was certainly the case for the Class of 2014—approximately 63 percent of all unpaid internships were with a nonprofit or government employer. Nevertheless, the fact that 37 percent of seniors reporting an unpaid internship said they had that internship with a private sector, for-profit entity was somewhat surprising. The exact same ratio has essentially existed for all four student survey reports where unpaid internships were tracked.
Are there differences between paid and unpaid internships when it comes to getting a job offer? Data collected over the last three years clearly suggest that differences do exist. Students who have had a paid internship are much more likely to have received a job offer than those students whose work experience has been in an unpaid internship. This year’s survey gives an additional year of support for the conclusion that unpaid internships are very different from paid internships in the probability of getting a full-time job offer.
PAID VS. UNPAID INTERNSHIPSAs in previous surveys, students were asked whether their internships were paid or unpaid, and with what type of organization they held their internship—private sector, for-profit firm; private sector, nonprofit; federal government department or agency; state or local government operation. Then the offer rates for students with internships were compared across the different categories formed by pay structure and organization type against the offer rates for students without an internship experience. Figure 32 displays the results.
0 10 20 30 40 50 60 70 80
38.6%
37.1%
47.0%
39.2%
59.1%
41.3%
51.0%
38.5%
65.4%
No internship
Unpaid/state or local
Paid/state or local
Unpaid/federal
Paid/federal
Unpaid/nonpro�t
Paid/nonpro�t
Upaid/for-pro�t
Paid/for-pro�t
Figure 32: Full-time offer rates by type of internship
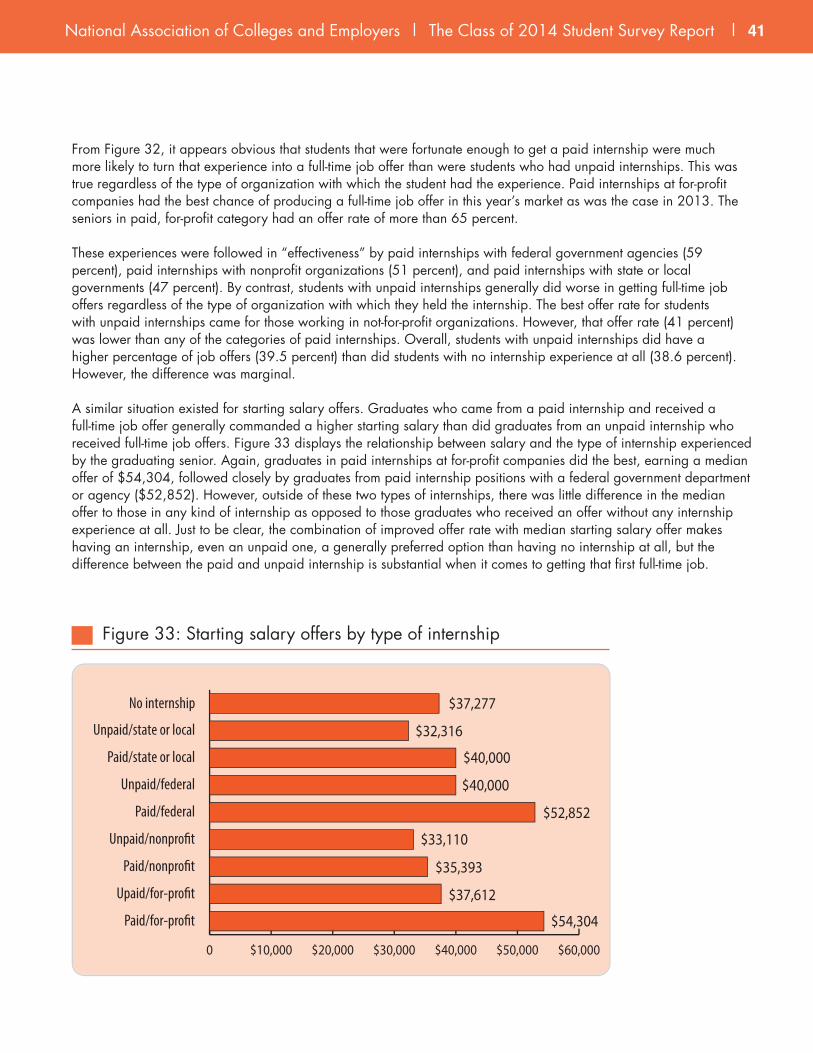
National Association of Colleges and Employers | The Class of 2014 Student Survey Report | 41
From Figure 32, it appears obvious that students that were fortunate enough to get a paid internship were much more likely to turn that experience into a full-time job offer than were students who had unpaid internships. This was true regardless of the type of organization with which the student had the experience. Paid internships at for-profit companies had the best chance of producing a full-time job offer in this year’s market as was the case in 2013. The seniors in paid, for-profit category had an offer rate of more than 65 percent.
These experiences were followed in “effectiveness” by paid internships with federal government agencies (59 percent), paid internships with nonprofit organizations (51 percent), and paid internships with state or local governments (47 percent). By contrast, students with unpaid internships generally did worse in getting full-time job offers regardless of the type of organization with which they held the internship. The best offer rate for students with unpaid internships came for those working in not-for-profit organizations. However, that offer rate (41 percent) was lower than any of the categories of paid internships. Overall, students with unpaid internships did have a higher percentage of job offers (39.5 percent) than did students with no internship experience at all (38.6 percent). However, the difference was marginal.
A similar situation existed for starting salary offers. Graduates who came from a paid internship and received a full-time job offer generally commanded a higher starting salary than did graduates from an unpaid internship who received full-time job offers. Figure 33 displays the relationship between salary and the type of internship experienced by the graduating senior. Again, graduates in paid internships at for-profit companies did the best, earning a median offer of $54,304, followed closely by graduates from paid internship positions with a federal government department or agency ($52,852). However, outside of these two types of internships, there was little difference in the median offer to those in any kind of internship as opposed to those graduates who received an offer without any internship experience at all. Just to be clear, the combination of improved offer rate with median starting salary offer makes having an internship, even an unpaid one, a generally preferred option than having no internship at all, but the difference between the paid and unpaid internship is substantial when it comes to getting that first full-time job.
0 $10,000 $20,000 $30,000 $40,000 $50,000 $60,000
$37,277
$32,316
$40,000
$40,000
$52,852
$33,110
$35,393
$37,612
$54,304
No internship
Unpaid/state or local
Paid/state or local
Unpaid/federal
Paid/federal
Unpaid/nonpro�t
Paid/nonpro�t
Upaid/for-pro�t
Paid/for-pro�t
Figure 33: Starting salary offers by type of internship

42 | The Class of 2014 Student Survey Report | National Association of Colleges and Employers National Association of Colleges and Employers | The Class of 2014 Student Survey Report | 43
JOB OFFERS AND INTERNSHIP PAYWhat explains this counterintuitive result for unpaid internships? In an effort to find a potential intervening variable, data were controlled for potential differences in gender, ethnicity, and academic major for the groups that took paid vs. unpaid internships vs. no internship at all. Over the years, it has been shown that none of these factors play a significant role in modifying the statistical relationships found between the type of internship a student undertook and the overall probability of landing a full-time job offer. This year the analysis was extended by recoding variables into dichotomous categories in order to run statistical correlations that allowed control for groups of potentially intervening variables simultaneously. Discipline (major) was recoded into a category that included business majors, engineering majors, and computer science majors, and another category that included all other majors. Grade point average was included as a possible control variable for the first time and was coded into two groups—above 3.0 and below 3.0. Finally, the parents’ education was added as a control, coded as having a bachelor’s degree or above, against those students whose parents did not have a college degree.
Overall, the correlation between having a paid as opposed to an unpaid internship is small, but highly statistically significant. The correlation coefficient is .221, which indicates a modest relationship between the two variables, but the statistical significance connected with the correlation is .000, which means that there is less than 1 chance in 1,000 that the relationship is due to chance. Each of the possible intervening factors (academic discipline, gender, GPA, age, and parents’ education) was introduced, first one by one, then as a whole group to see if they lessened the relationship substantially, especially if they lowered the statistical significance attached to the relationship. Only one factor, academic discipline, had a noticeable impact on the correlation between a paid internship and the probability of receiving a full-time offer. In this instance, the correlation coefficient was lowered from .221 to .178. Nevertheless, the significance level remained extremely high at .000. Even adding all the listed intervening factors together did not alter the correlation coefficient beyond that which occurred with academic discipline and did not impact the statistical significance of the relationship at all.
Does this conclusively confirm that unpaid internships have no positive effect on receiving a full-time job offer? No, it does not. One of the conditions that cannot be tested is the effect after the graduation date. This survey’s data are limited to graduating seniors who have applied for and received a job offer prior to graduation. Most students will receive a job offer after they graduate, so the overarching impact of the unpaid internship on the job search cannot be fully assessed with current data.
This weakness in the causal relationship between an unpaid internship and success in the job search can be illustrated by taking a look at offers that flow directly from the internship. NACE research on internships with its employer members has highlighted the fact that the internship is seen by these companies as a direct recruiting device for potential full-time employees. Approximately 80 percent of the employer respondents state that recruiting is the primary purpose of the internship, and the current conversion rate of interns into full-time employees is 55 percent.6 These employers also report that virtually all (98 percent) of their interns are paid. Consequently, it would be expected that precisely these students—those being most actively recruited—would dominate the group with full-time offers prior to graduation. This is, in fact, the case.
6. NACE, 2014 Internship and Co-op Survey, Bethlehem, PA: National Association of Colleges and Employers, April 2014.
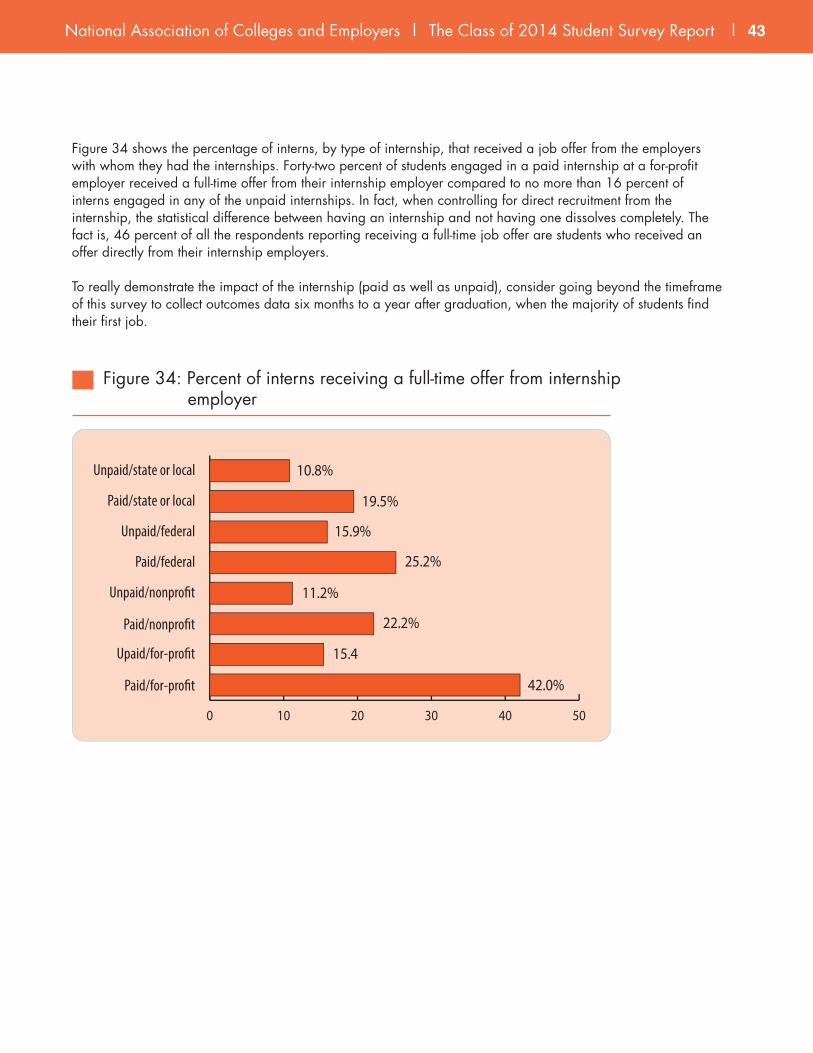
National Association of Colleges and Employers | The Class of 2014 Student Survey Report | 43
0 10 20 30 40 50
10.8%
19.5%
15.9%
25.2%
11.2%
22.2%
15.4
42.0%
Unpaid/state or local
Paid/state or local
Unpaid/federal
Paid/federal
Unpaid/nonpro�t
Paid/nonpro�t
Upaid/for-pro�t
Paid/for-pro�t
Figure 34: Percent of interns receiving a full-time offer from internship employer
Figure 34 shows the percentage of interns, by type of internship, that received a job offer from the employers with whom they had the internships. Forty-two percent of students engaged in a paid internship at a for-profit employer received a full-time offer from their internship employer compared to no more than 16 percent of interns engaged in any of the unpaid internships. In fact, when controlling for direct recruitment from the internship, the statistical difference between having an internship and not having one dissolves completely. The fact is, 46 percent of all the respondents reporting receiving a full-time job offer are students who received an offer directly from their internship employers.
To really demonstrate the impact of the internship (paid as well as unpaid), consider going beyond the timeframe of this survey to collect outcomes data six months to a year after graduation, when the majority of students find their first job.
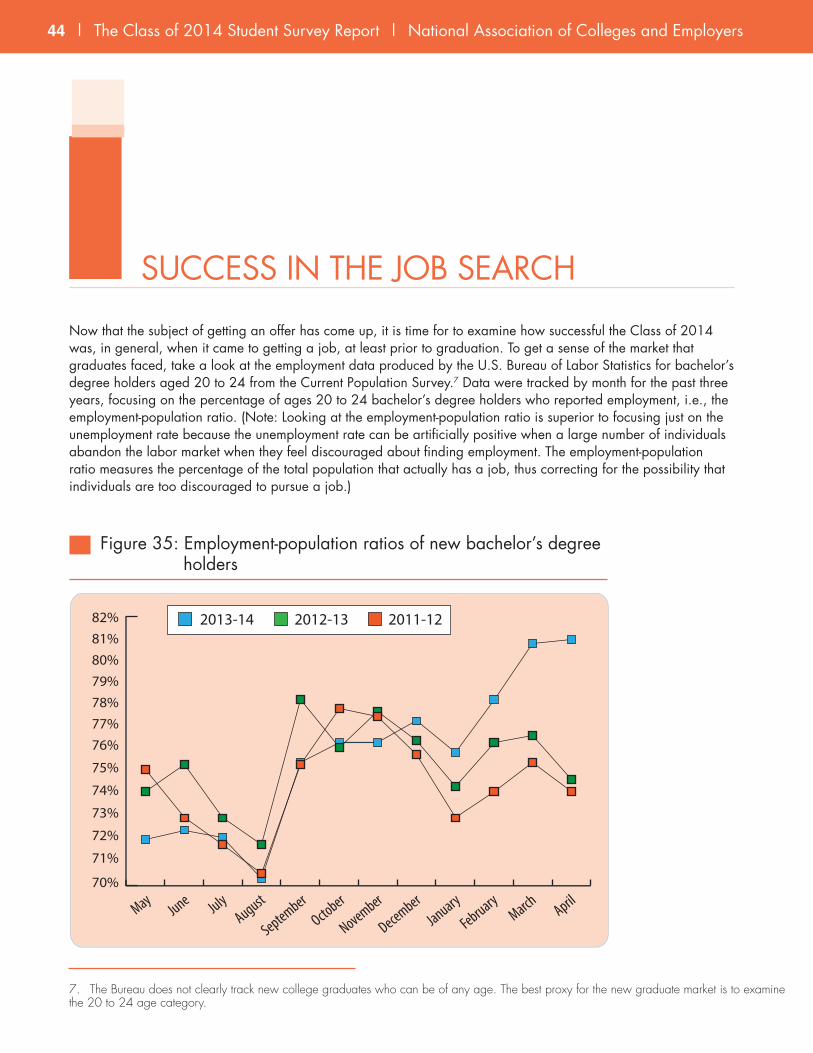
44 | The Class of 2014 Student Survey Report | National Association of Colleges and Employers National Association of Colleges and Employers | The Class of 2014 Student Survey Report | 45
SUCCESS IN THE JOB SEARCH
Now that the subject of getting an offer has come up, it is time for to examine how successful the Class of 2014 was, in general, when it came to getting a job, at least prior to graduation. To get a sense of the market that graduates faced, take a look at the employment data produced by the U.S. Bureau of Labor Statistics for bachelor’s degree holders aged 20 to 24 from the Current Population Survey.7 Data were tracked by month for the past three years, focusing on the percentage of ages 20 to 24 bachelor’s degree holders who reported employment, i.e., the employment-population ratio. (Note: Looking at the employment-population ratio is superior to focusing just on the unemployment rate because the unemployment rate can be artificially positive when a large number of individuals abandon the labor market when they feel discouraged about finding employment. The employment-population ratio measures the percentage of the total population that actually has a job, thus correcting for the possibility that individuals are too discouraged to pursue a job.)
70%
82%81%80%79%78%77%76%
75%
74%
73%
72%
71%
2012-132013-14 2011-12
MayJune July
August
SeptemberOctober
November
DecemberJanuary
FebruaryMarch April
Figure 35: Employment-population ratios of new bachelor’s degree holders
7. The Bureau does not clearly track new college graduates who can be of any age. The best proxy for the new graduate market is to examine the 20 to 24 age category.

National Association of Colleges and Employers | The Class of 2014 Student Survey Report | 45
0
10
20
30
40
50
60
70
80 2014 2013 2012
Received at least 1 o�er Accepted an o�er Applied and had a job
47.9
%
45.9
%
47.7
%
62.8
%
63.9
%
62.5
%
30.1
%
29.3
%
29.8
%
Figure 36: Getting a job prior to graduation
Figure 35 shows the employment-population ratio by month from May to April for the last three years to provide some context for the Class of 2014. Overall, the trend lines indicate a very stagnant market—some months the ratio improved, but that was generally followed by some down months with no clear direction. At the end of the 2013 recruiting season (April 2013) the market was in a down period. This coincided with overall numbers for the Class of 2013 that were no better than those for the Class of 2012; in fact, they were a bit worse. This negative situation characterized the first couple of months for the Class of 2014. In May 2013, the employment-population ratio for the Class of 2014 (71.9 percent) was lower than the ratio for the Class of 2013 (73.9 percent), and the Class of 2012 (74.8 percent). However, beginning in December 2013 and proceeding throughout the spring, the employment-population ratio for young college graduates improved substantially, increasing to 81.1 percent of young bachelor’s degree holders reporting being employed. This is the highest figure for the ratio since before the recession in 2008.
Given the improved market identified by the employment-population ratio, it could be expected that much the same would be reflected in the job-search success data from this survey. To a degree, the data from the survey do bear out the picture of an improved labor market for the graduates of the Class of 2014. However, the degree of improvement is relatively small.
Figure 36 illustrates comparisons among member of the classes of 2012, 2013, and 2014 in getting a job prior to graduation. The overwhelming indication from the chart is that there is little difference across graduating classes. First, the percentage of job applicants who received at least one offer of a full-time position (47.9 percent) improved from 2013 (45.9 percent) and was marginally better than in 2012 (47.7 percent). Second, acceptance rates for offers dropped from 2013’s nearly 64 percent to fewer than 63 percent. This is not uncommon in years where the market is improved, if even slightly improved. Applicants have the confidence in an improving market that if expectations are not met they can move on and find a different opportunity. Finally, the offer and acceptance rates for the Class of 2014 resulted in 30.1 percent of the graduating class who had applied for a full-time position having landed a job prior to graduation; the comparable figures for the classes of 2013 and 2012 were 29.3 percent and 29.8 percent, respectively.
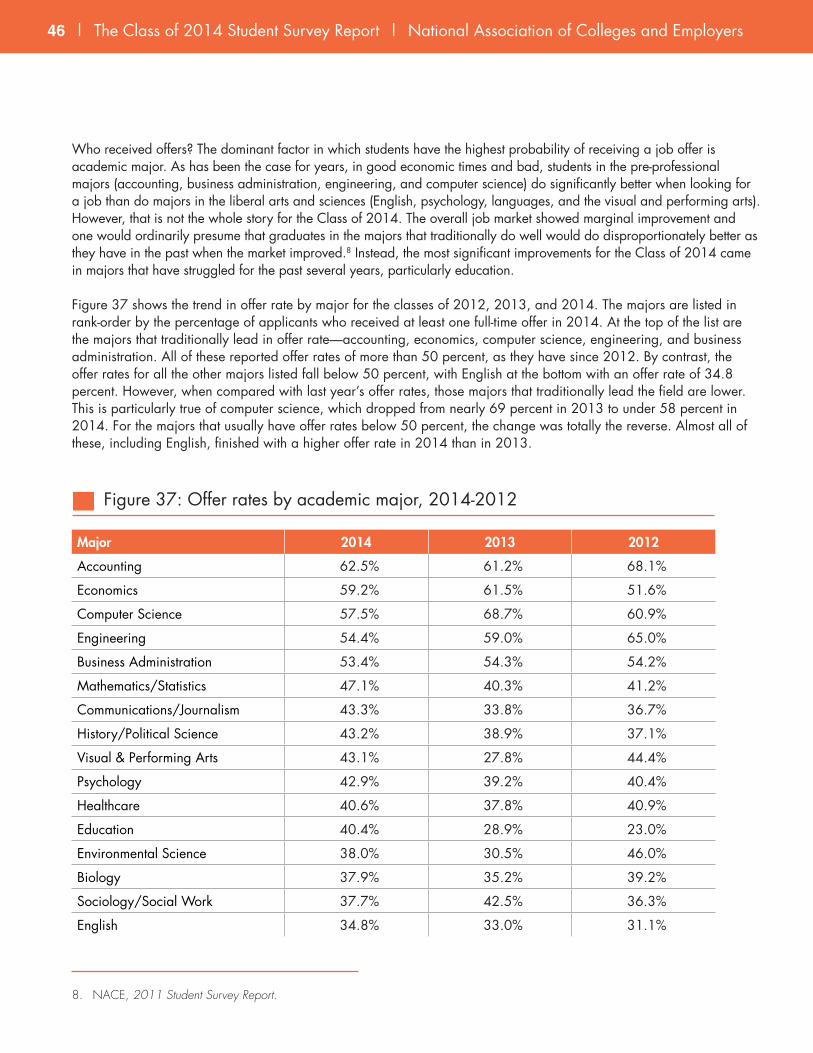
46 | The Class of 2014 Student Survey Report | National Association of Colleges and Employers National Association of Colleges and Employers | The Class of 2014 Student Survey Report | 47
Who received offers? The dominant factor in which students have the highest probability of receiving a job offer is academic major. As has been the case for years, in good economic times and bad, students in the pre-professional majors (accounting, business administration, engineering, and computer science) do significantly better when looking for a job than do majors in the liberal arts and sciences (English, psychology, languages, and the visual and performing arts). However, that is not the whole story for the Class of 2014. The overall job market showed marginal improvement and one would ordinarily presume that graduates in the majors that traditionally do well would do disproportionately better as they have in the past when the market improved.8 Instead, the most significant improvements for the Class of 2014 came in majors that have struggled for the past several years, particularly education.
Figure 37 shows the trend in offer rate by major for the classes of 2012, 2013, and 2014. The majors are listed in rank-order by the percentage of applicants who received at least one full-time offer in 2014. At the top of the list are the majors that traditionally lead in offer rate—accounting, economics, computer science, engineering, and business administration. All of these reported offer rates of more than 50 percent, as they have since 2012. By contrast, the offer rates for all the other majors listed fall below 50 percent, with English at the bottom with an offer rate of 34.8 percent. However, when compared with last year’s offer rates, those majors that traditionally lead the field are lower. This is particularly true of computer science, which dropped from nearly 69 percent in 2013 to under 58 percent in 2014. For the majors that usually have offer rates below 50 percent, the change was totally the reverse. Almost all of these, including English, finished with a higher offer rate in 2014 than in 2013.
Major 2014 2013 2012
Accounting 62.5% 61.2% 68.1%
Economics 59.2% 61.5% 51.6%
Computer Science 57.5% 68.7% 60.9%
Engineering 54.4% 59.0% 65.0%
Business Administration 53.4% 54.3% 54.2%
Mathematics/Statistics 47.1% 40.3% 41.2%
Communications/Journalism 43.3% 33.8% 36.7%
History/Political Science 43.2% 38.9% 37.1%
Visual & Performing Arts 43.1% 27.8% 44.4%
Psychology 42.9% 39.2% 40.4%
Healthcare 40.6% 37.8% 40.9%
Education 40.4% 28.9% 23.0%
Environmental Science 38.0% 30.5% 46.0%
Biology 37.9% 35.2% 39.2%
Sociology/Social Work 37.7% 42.5% 36.3%
English 34.8% 33.0% 31.1%
Figure 37: Offer rates by academic major, 2014-2012
8. NACE, 2011 Student Survey Report.
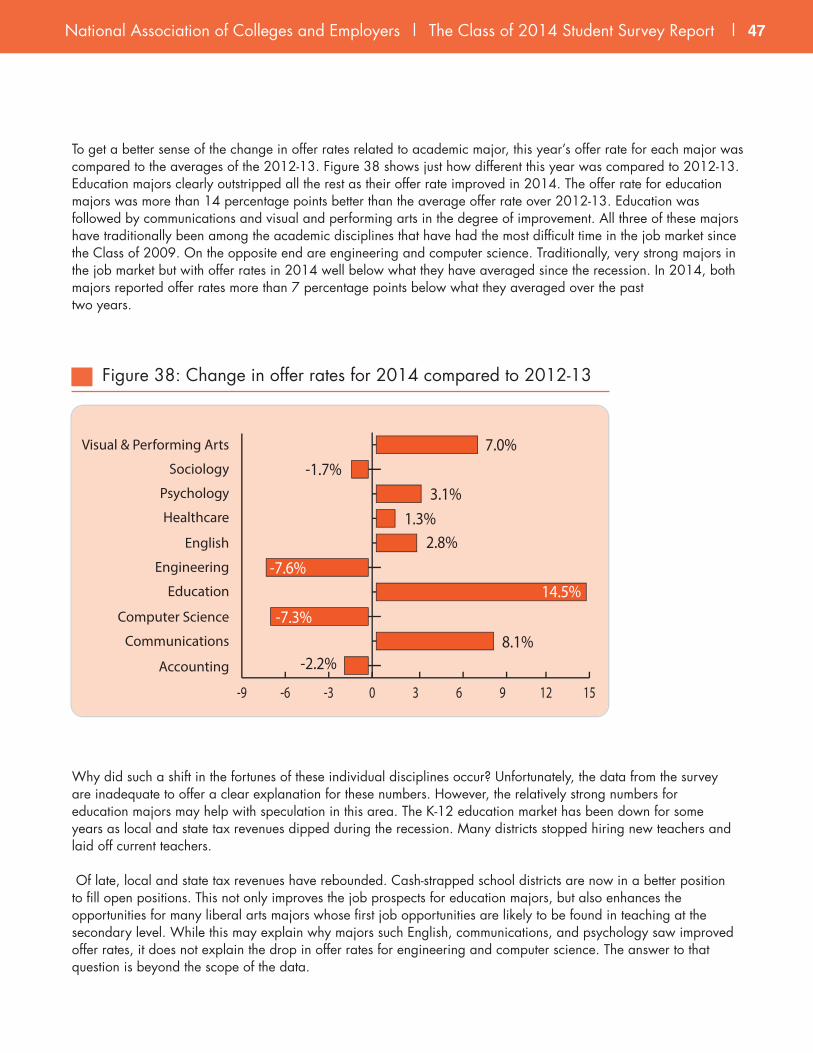
National Association of Colleges and Employers | The Class of 2014 Student Survey Report | 47
To get a better sense of the change in offer rates related to academic major, this year’s offer rate for each major was compared to the averages of the 2012-13. Figure 38 shows just how different this year was compared to 2012-13. Education majors clearly outstripped all the rest as their offer rate improved in 2014. The offer rate for education majors was more than 14 percentage points better than the average offer rate over 2012-13. Education was followed by communications and visual and performing arts in the degree of improvement. All three of these majors have traditionally been among the academic disciplines that have had the most difficult time in the job market since the Class of 2009. On the opposite end are engineering and computer science. Traditionally, very strong majors in the job market but with offer rates in 2014 well below what they have averaged since the recession. In 2014, both majors reported offer rates more than 7 percentage points below what they averaged over the past two years.
-9 -6 -3 0 3 6 9 12 15
Visual & Performing Arts
Sociology
Psychology
Healthcare
English
Engineering
Education
Computer Science
Communications
Accounting
7.0%
3.1%1.3%
2.8%
14.5%
8.1%
-1.7%
-7.6%
-7.3%
-2.2%
Figure 38: Change in offer rates for 2014 compared to 2012-13
Why did such a shift in the fortunes of these individual disciplines occur? Unfortunately, the data from the survey are inadequate to offer a clear explanation for these numbers. However, the relatively strong numbers for education majors may help with speculation in this area. The K-12 education market has been down for some years as local and state tax revenues dipped during the recession. Many districts stopped hiring new teachers and laid off current teachers.
Of late, local and state tax revenues have rebounded. Cash-strapped school districts are now in a better position to fill open positions. This not only improves the job prospects for education majors, but also enhances the opportunities for many liberal arts majors whose first job opportunities are likely to be found in teaching at the secondary level. While this may explain why majors such English, communications, and psychology saw improved offer rates, it does not explain the drop in offer rates for engineering and computer science. The answer to that question is beyond the scope of the data.
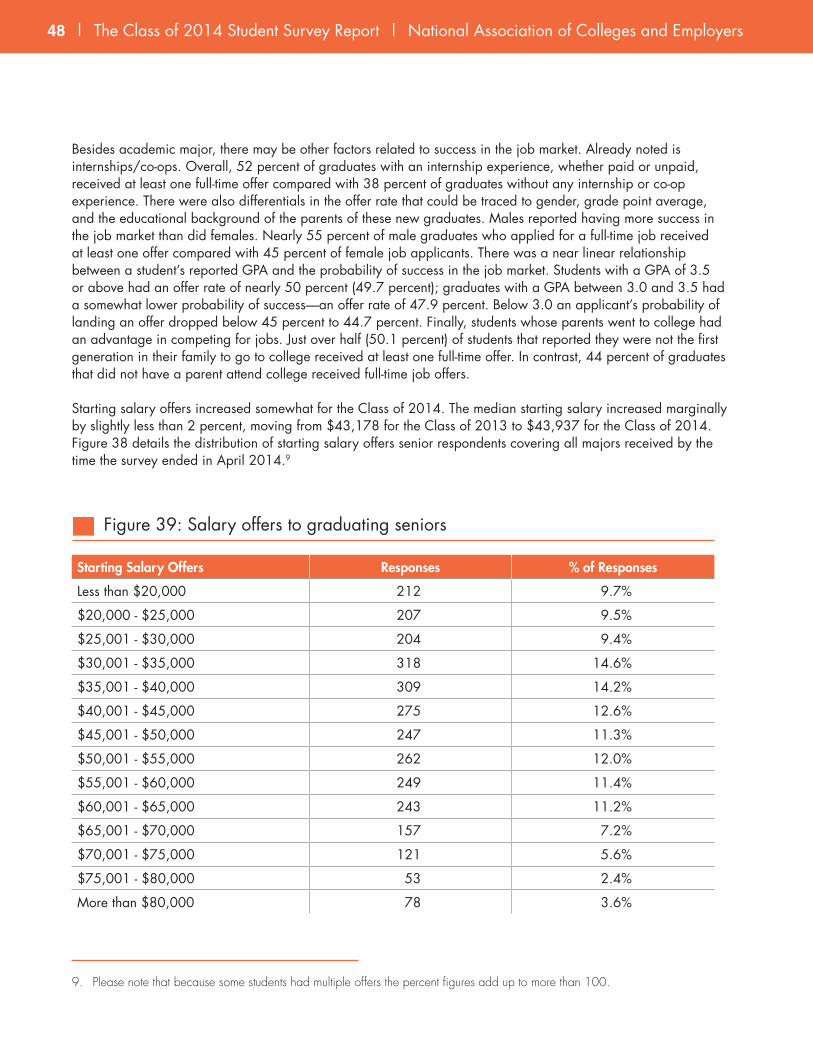
48 | The Class of 2014 Student Survey Report | National Association of Colleges and Employers National Association of Colleges and Employers | The Class of 2014 Student Survey Report | 49
Besides academic major, there may be other factors related to success in the job market. Already noted is internships/co-ops. Overall, 52 percent of graduates with an internship experience, whether paid or unpaid, received at least one full-time offer compared with 38 percent of graduates without any internship or co-op experience. There were also differentials in the offer rate that could be traced to gender, grade point average, and the educational background of the parents of these new graduates. Males reported having more success in the job market than did females. Nearly 55 percent of male graduates who applied for a full-time job received at least one offer compared with 45 percent of female job applicants. There was a near linear relationship between a student’s reported GPA and the probability of success in the job market. Students with a GPA of 3.5 or above had an offer rate of nearly 50 percent (49.7 percent); graduates with a GPA between 3.0 and 3.5 had a somewhat lower probability of success—an offer rate of 47.9 percent. Below 3.0 an applicant’s probability of landing an offer dropped below 45 percent to 44.7 percent. Finally, students whose parents went to college had an advantage in competing for jobs. Just over half (50.1 percent) of students that reported they were not the first generation in their family to go to college received at least one full-time offer. In contrast, 44 percent of graduates that did not have a parent attend college received full-time job offers.
Starting salary offers increased somewhat for the Class of 2014. The median starting salary increased marginally by slightly less than 2 percent, moving from $43,178 for the Class of 2013 to $43,937 for the Class of 2014. Figure 38 details the distribution of starting salary offers senior respondents covering all majors received by the time the survey ended in April 2014.9
Starting Salary Offers Responses % of Responses
Less than $20,000 212 9.7%
$20,000 - $25,000 207 9.5%
$25,001 - $30,000 204 9.4%
$30,001 - $35,000 318 14.6%
$35,001 - $40,000 309 14.2%
$40,001 - $45,000 275 12.6%
$45,001 - $50,000 247 11.3%
$50,001 - $55,000 262 12.0%
$55,001 - $60,000 249 11.4%
$60,001 - $65,000 243 11.2%
$65,001 - $70,000 157 7.2%
$70,001 - $75,000 121 5.6%
$75,001 - $80,000 53 2.4%
More than $80,000 78 3.6%
Figure 39: Salary offers to graduating seniors
9. Please note that because some students had multiple offers the percent figures add up to more than 100.

National Association of Colleges and Employers | The Class of 2014 Student Survey Report | 49
As with virtually all aspects of the college hiring market, the level of the starting salary is directly related to the academic major of the graduate. As shown in Figure 40, academic major had a significant effect on the level of starting salary offers for the Class of 2014. Although this year’s survey used a more detailed listing of academic majors to develop salary data, the overall outcome is similar to what was found in previous years—the starting salaries for the pre-professional majors were considerably higher than they were for liberal arts, social science, and even physical science graduates.
At the top of the starting salary list were engineering ($60,027), computer science ($55,574), nursing ($54,286), finance ($52,208), accounting ($51,939), and economics ($50,721). Since a somewhat different set of majors was used in this year’s survey, direct comparisons with previous years are difficult. However, the top-paying majors remain very similar to what was found previously.
The additions to this top-paying list, nursing and finance, do not change the overall assessment that what sets the top starting salary majors apart is the fact that they all involve the development of considerable technical/quantitative skills. The marketplace is clearly speaking as to which skills and abilities are most valued in today’s entry-level college graduate labor market—the ability to demonstrate specific technical skill sets rather than just a broad range of knowledge. The one disquieting note is that, as with offer rate, the median salary offer for engineering and computer science decreased this year, particularly for computer science. The median salary offer for engineering majors dropped by 4.5 percent and for computer science majors by just over 9 percent.
There were five majors in which the median starting salary offer fell below $35,000. They were psychology ($33,522), sociology ($32,511), miscellaneous social science ($32,286), English ($32,187), and agriculture ($31,258).
Major Median Starting Salary
Engineering $60,027
Computer Science $55,574
Nursing $54,286
Finance $52,208
Accounting $51,939
Economics $50,721
Marketing $44,749
Mathematics $42,501
Business Administration $42,444
Education $37,309
Healthcare (other) $36,155
Communications $36,063
Political Science $35,992
Visual & Performing Arts $35,369
Physical Sciences $35,000
Psychology $33,522
Sociology $32,511
Social Science (other) $32,286
English $32,187
Agriculture $31,258
Figure 40: Median starting salaries by academic major, Class of 2014
9. Please note that because some students had multiple offers the percent figures add up to more than 100.

50 | The Class of 2014 Student Survey Report | National Association of Colleges and Employers National Association of Colleges and Employers | The Class of 2014 Student Survey Report | 51
EMPLOYMENT ATTITUDES AND PREFERENCES OF THE CLASS OF 2014
The Class of 2014 faced an employment market that was somewhat better than in previous years. A higher percentage of the class that applied for a full-time job received at least one job offer and a higher percentage of the class had a job in hand at graduation. But, the market was not improved across the board. In a somewhat strange twist, the academic majors that have led the improvement of the college hiring market since the recession of 2009-10 actually did worse in 2014 than they did in 2013. Both the percentage of engineering and computer science majors who received full-time offers and the salary levels of those offers decreased. By contrast, academic majors that lagged during the improvement of the job market since the recession, particularly education, saw their situations improve substantially—particularly in terms of the percentage of these majors that received job offers.
What this indicates is that there has been no real consistency in the recovery of the labor market since the recession. This applies to the college hiring market as well as the general labor market. This inconsistency seems to have had an impact on graduate attitudes entering the market. Confidence that a professional-level career awaits them after college seems low. Confidence in the entry-level position after college being a stepping stone to advancement in the company is low. Consequently, the attributes students look for in an employer have shifted away from the classic outcomes associated with a professional business career—rapid advancement and a high starting salary. These job attributes have been replaced by more inner-focused personal attributes—the opportunity for personal development, a conducive work atmosphere characterized by friendly employees, and a benefits plan that offers considerable amounts of free time in the form of vacation days.
These attitudes toward the job and employer suggest that recent graduates are not looking to become as engaged with the job and their employer as students in the past—and, that past is not so very long ago. As recently as 2008, the survey showed seniors entering the work force to hold attitudes toward the job and their employer that were very similar to the same age cohort in 1982.10 The economic recession and the long road to recovery seems to have been a watershed event that has split the “Millennial” generation into two parts, with the latter part of the generation possibly posing far more challenges for employers than was true of those initially classified as Millennials.
10. NACE, “Moving On: Student Approaches and Attitudes Toward the Job Market for the College Class of 2008,” Bethlehem, PA: National Association of Colleges and Employers, September 2008.

National Association of Colleges and Employers | The Class of 2014 Student Survey Report | 51
APPENDIX
PARTICIPATING SCHOOLS
Abilene Christian UniversityAcademy of Art UniversityAlbright CollegeAllen UniversityAlma CollegeAmerican InterContinental
UniversityAmerican Military UniversityAnderson University (IN)Anderson University (SC)Andrews UniversityAngelo State UniversityAnne Arundel Community
CollegeArgosy University - Los AngelesArizona State UniversityArkansas Tech UniversityAsbury UniversityAshland Community and
Technical CollegeAshland UniversityAshland University - Dwight
Schar College of Nursing and Health Sciences
Aurora UniversityAustin Community CollegeAverett UniversityAzusa Pacific UniversityBabson CollegeBaker UniversityBall State UniversityBarton CollegeBarton Community CollegeBaruch CollegeBellingham Technical CollegeBelmont UniversityBenedictine CollegeBennett CollegeBinghamton University - SUNYBishop Community CollegeBlack Hills State UniversityBlue Ridge Community CollegeBluefield State College
Borough of Manhattan Community College
Boston CollegeBouve College of Health
Sciences, Northeastern University
Bowie State UniversityBowling Green State UniversityBradley UniversityBrandman UniversityBridgewater CollegeBrigham Young UniversityBrigham Young University -
HawaiiBrooklyn CollegeBroward CollegeBryan College- DaytonBryant UniversityBuena Vista UniversityBuffalo State College - SUNYButler Community CollegeCabrini CollegeCairn UniversityCalifornia State Polytechnic
University- PomonaCalifornia State UniversityCalifornia State University -
ChicoCalifornia State University -
FullertonCalifornia State University -
Long BeachCalifornia State University -
Los AngelesCalifornia State University -
NorthridgeCalifornia State University -
San BernardinoCalifornia State University -
San MarcosCalvary Bible CollegeCalvary Chapel Bible CollegeCameron University
Canisius CollegeCapital UniversityCapitol CollegeCarroll CollegeCarroll UniversityCarthage CollegeCasper CollegeCazenovia CollegeCedarville UniversityCentenary College New JerseyCentenary College of
LouisianaCentral Methodist UniversityCentral Penn CollegeCentral Piedmont Community
CollegeCentral Texas CollegeChaminade University of
HonoluluCharleston Southern UniversityChattanooga State Community
CollegeCity University of SeattleClaflin UniversityClayton State UniversityCleary UniversityClemson UniversityCleveland State UniversityCoastline Community CollegeCoe CollegeCoker CollegeColby CollegeColby-Sawyer CollegeCollege of CharlestonCollege of Coastal GeorgiaCollege of Mount St. JosephCollege of Saint BenedictCollege of Staten Island -
CUNYCollege of the OzarksColorado State UniversityColorado State University -
Fort Collins
Columbia UniversityColumbia University - Teachers
CollegeConcordia University - IrvineConcordia University -
Portland - School of Management
Concordia University - TexasCornerstone UniversityCosumnes River CollegeCottey CollegeCreighton UniversityCulver-Stockton CollegeCuny Medgar Evers CollegeDalton State CollegeDefiance CollegeDenison UniversityDenison UniversityDePaul UniversityDeSales UniversityDiablo Valley CollegeDominican UniversityDrew UniversityDrexel UniversityDrexel University - LeBow
College of BusinessDrury UniversityEast Carolina UniversityEast Los Angeles CollegeEast Mississippi Community
CollegeEast Stroudsburg University of
PennsylvaniaEastern Illinois UniversityEastern Kentucky UniversityEastern UniversityEckerd CollegeEdison State CollegeElgin Community CollegeElizabeth City State UniversityElizabethtown CollegeElmira CollegeElms College

52 | The Class of 2014 Student Survey Report | National Association of Colleges and Employers National Association of Colleges and Employers | The Class of 2014 Student Survey Report | 53
Embry-Riddle Aeronautical University - Daytona Beach Campus
Emory UniversityEmory University - Goizueta
Business SchoolEmporia State UniversityEverett Community CollegeFairleigh Dickinson University -
College at FlorhamFairleigh Dickinson University -
School of PharmacyFairleigh Dickinson University
- Silberman College of Business
Fairleigh Dickinson UniversityFairleigh Dickinson University
- Becton College of Arts & Sciences
Fairleigh Dickinson University - Metropolitan Campus
Farmingdale State CollegeFashion Institute of Design &
MerchandisingFeather River CollegeFerrum CollegeFisk UniversityFlagler CollegeFlorida Atlantic UniversityFlorida Atlantic University -
Boca Raton CampusFlorida Atlantic University -
Harriet L. Wilkes Honors College
Florida International UniversityFlorida International University -
Chaplin School of Hospitality & Tourism Management
Florida International University - Modesto A. Maidique Campus
Florida Southern CollegeFlorida State College at
JacksonvilleFolsom Lake CollegeFontbonne UniversityFordham UniversityFordham University - Gabelli
School of BusinessFort Hays State UniversityFranklin CollegeFresno Pacific UniversityFront Range Community
CollegeFull Sail UniversityFurman UniversityGannon UniversityGeneva CollegeGeorge Fox University
Georgetown UniversityGeorgia Institute of TechnologyGeorgia Institute of Technology
- College of EngineeringGeorgia Institute of Technology
- Scheller College of BusinessGeorgia Piedmont Technical
CollegeGeorgia Regents UniversityGeorgia Southwestern State
UniversityGettysburg CollegeGlenville State CollegeGolden Gate UniversityGraceland UniversityGrand Canyon UniversityGrand Valley State UniversityGreen Mountain CollegeGreenville CollegeGreenville Technical CollegeGrossmont CollegeGrove City CollegeGulf Coast State CollegeGustavus Adolphus CollegeHampshire CollegeHarding UniversityHarvard UniversityHarvey Mudd CollegeHawaii Pacific UniversityHeritage UniversityHilbert CollegeHillsborough Community
CollegeHillsdale CollegeHong Kong University of
Science & TechnologyHoward UniversityHunter CollegeHuston-Tillotson UniversityIllinois CollegeIllinois Institute of TechnologyIllinois Institute of Technology -
Stuart School of BusinessIllinois Institute of Technology -
Stuart School Of BusinessIllinois State UniversityImmaculata UniversityIndiana Institute of TechnologyIndiana Technical UniversityIndiana UniversityIndiana University -
BloomingtonIndiana University - KokomoIndiana University - Purdue
University IndianapolisIndiana University - South BendIndiana University - SoutheastIndiana University -
Bloomington
Indiana University - Purdue University Fort Wayne
Indiana University-Purdue University Indianapolis
Indiana Wesleyan UniversityIowa State UniversityIvy Tech Community CollegeIvy Tech Community College -
BloomingtonIvy Tech Community College -
Central IndianaIvy Tech Community College -
IndianapolisIvy Tech Community College -
LawrenceIvy Tech Community College -
North MeridianIvy Tech Community College -
NortheastJarvis Christian CollegeJefferson Community CollegeJefferson State Community
CollegeJohn Brown UniversityJohn Jay College of Criminal
JusticeJohnson & Wales University -
Florida CampusJohnson C. Smith UniversityJones International UniversityKalamazoo CollegeKansas City Kansas Community
CollegeKansas State UniversityKaplan University- OnlineKennesaw State UniversityKent State UniversityKent State University - Stark
CampusKent State University at KentKentucky Wesleyan CollegeKeuka CollegeKingsborough Community
CollegeLa Salle UniversityLa Sierra UniversityLafayette CollegeLaguna College of Art & DesignLake Superior State UniversityLakeland CollegeLamar Institute of TechnologyLamar UniversityLander UniversityLane Community CollegeLangston UniversityLees-McRae CollegeLeeward Community CollegeLehigh Carbon Community
College
Lehman CollegeLiberty UniversityLincoln Memorial UniversityLincoln UniversityLindenwood UniversityLinfield CollegeLipscomb UniversityLone Star College - KingwoodLong Island UniversityLorain County Community
CollegeLouisiana State UniversityLouisiana State University -
College of EngineeringLouisiana State University at
AlexandriaLouisiana State University at
Baton RougeLouisiana State University at
EuniceLouisiana State University in
ShreveportLoyola University ChicagoLubbock Christian UniversityLuzerne County Community
CollegeLynn UniversityMalone UniversityManchester UniversityMarian University - IndianaMarietta CollegeMarist CollegeMars Hill CollegeMarshall UniversityMarymount California
UniversityMaryville CollegeMassachusetts College of
Pharmacy and Health Sciences
Massachusetts Maritime Academy
Mayville State UniversityMcMurry UniversityMcNeese State UniversityMedaille CollegeMedgar Evers CollegeMercy CollegeMessiah CollegeMethodist UniversityMiami Dade College-KendallMichigan State UniversityMid-America College of
Funeral ServiceMiddle East Technical
University, TurkeyMiddle Tennessee State
UniversityMidlands Technical College
National Association of Colleges and Employers | The Class of 2014 Student Survey Report | 53
Midlands Technical College - Airport
Midlands Technical College - Beltline
Midway CollegeMidwestern UniversityMillikin UniversityMillsaps CollegeMinneapolis College of Art &
DesignMiraCosta CollegeMississippi University for WomenMissouri Baptist UniversityMissouri State UniversityMissouri Western State
UniversityMonmouth UniversityMonroe CollegeMontana State UniversityMorehead State UniversityMount Aloysius CollegeMount Holyoke CollegeMount Mercy UniversityMount St. Mary’s UniversityMount Vernon Nazarene
UniversityMt. San Antonio CollegeMuhlenberg CollegeMurray State UniversityNational UniversityNew Mexico Highlands
University - Las VegasNew Mexico Highlands
UniversityNew Mexico Highlands
University - RatonNew Mexico Highlands
University - AlbuquerqueNew Mexico Highlands
University - EspanolaNew Mexico Highlands
University - FarmingtonNew Mexico Highlands
University - Rio RanchoNew Mexico Highlands
University - RoswellNew Mexico Highlands
University - Santa FeNew York City College of
TechnologyNew York UniversityNew York University - Leonard
N. Stern School of BusinessNew York University - Robert F.
Wagner Graduate School of Public Service
New York University - School of Continuing and Professional Studies
New York University - Silver School of Social Work
New York University - Steinhardt
New York University - Tisch School of the Arts
New York University Polytechnic School of Engineering
Niagara UniversityNorth Central CollegeNorth Central Texas CollegeNorth Central UniversityNorth Lake CollegeNorthcentral UniversityNortheast Community CollegeNortheast Texas Community
CollegeNortheastern Illinois UniversityNortheastern UniversityNorthern Arizona UniversityNorthern Michigan UniversityNorthland Pioneer CollegeNorthwest Arkansas Community
CollegeNorthwest CollegeNorthwest Missouri State
UniversityNorthwest Nazarene UniversityNorthwestern UniversityNova Southeastern UniversityOakwood UniversityOcean County CollegeOhio UniversityOhio Wesleyan UniversityOklahoma Baptist UniversityOld Dominion UniversityOlivet Nazarene UniversityOral Roberts UniversityOrangeburg-Calhoun Technical
CollegeOregon Health & Science
UniversityOregon Institute of TechnologyOregon State UniversityOuachita Baptist UniversityOur Lady of the ElmsOzarks Technical Community
CollegePacific UniversityPaine CollegePalm Beach State CollegePalm Beach State College -
Belle GladePalm Beach State College -
Boca RatonPalm Beach State College - Lake
WorthPalm Beach State College -
Palm Beach Gardens
Palomar Community CollegePasadena City CollegePennsylvania College of
TechnologyPennsylvania State UniversityPennsylvania State University -
AltoonaPennsylvania State University -
Smeal College of BusinessPennsylvania State University -
University ParkPepperdine UniversityPittsburg State UniversityPoint Park UniversityPrince George’s Community
CollegePurdue UniversityPurdue University - CalumetPurdue University - College of
TechnologyQueens CollegeQuincy UniversityRamapo College of New JerseyRandolph CollegeRaritan Valley Community
CollegeRegent UniversityRemington College HonoluluRhode Island CollegeRice UniversityRingling College of Art &
DesignRoane State Community CollegeRoberts Wesleyan CollegeRock Valley CollegeRockhurst UniversityRocky Mountain CollegeRoxbury Community CollegeRutgers UniversityRutgers University - CamdenRutgers University - New
BrunswickRutgers University - NewarkRutgers University - Newark -
Rutgers Business SchoolSacred Heart UniversitySaginaw Valley State UniversitySaint Bonaventure UniversitySaint Francis UniversitySaint John’s UniversitySaint Joseph’s UniversitySaint Mary-of-the-Woods
CollegeSaint Mary’s College of
CaliforniaSalve Regina UniversitySam Houston State UniversitySan Bernardino Valley CollegeSan Diego City College
San Diego State UniversitySan Jose State UniversitySavannah State UniversitySchreiner UniversitySeattle UniversitySeward County Community
CollegeShawnee State UniversityShippensburg UniversitySimpson CollegeSinclair Community CollegeSkyline CollegeSmith CollegeSomerset Community CollegeSouth Texas CollegeSoutheast Community CollegeSoutheastern UniversitySouthern Adventist UniversitySouthern Arkansas UniversitySouthern Illinois University -
CarbondaleSouthern Maine Community
CollegeSouthern New Hampshire
UniversitySouthern Oregon UniversitySouthern Polytechnic State
UniversitySouthern Utah UniversitySouthwest Baptist UniversitySouthwest Florida CollegeSouthwest Minnesota State
UniversitySouthwestern Adventist
UniversitySouthwestern College - KansasSpring Arbor UniversitySpringfield CollegeSpringfield College - School of
Social WorkSt. Bonaventure UniversitySt. Charles Community CollegeSt. Norbert CollegeStephen F. Austin State
UniversityStevenson UniversityStonehill CollegeStony Brook UniversityStratford UniversitySuffolk County Community
CollegeSUNY - DelhiSUNY - Farmingdale State
CollegeSUNY College at Old WestburySUNY Empire State CollegeSUNY FredoniaSUNY GeneseoSUNY Oswego

54 | The Class of 2014 Student Survey Report | National Association of Colleges and Employers National Association of Colleges and Employers | The Class of 2014 Student Survey Report | 55
SUNY Purchase CollegeSusquehanna UniversitySyracuse UniversityTarleton State UniversityTarrant County CollegeTarrant County College -
Northeast CampusTarrant County College -
Northwest CampusTarrant County College - South
CampusTarrant County College -
Southeast CampusTarrant County College - Trinity
River CampusTaylor UniversityTennessee State UniversityTerra Community CollegeTexas A&M International
UniversityTexas A&M UniversityTexas A&M University - Central
TexasTexas A&M University -
CommerceTexas State UniversityTexas State University - Round
RockTexas Wesleyan UniversityTexas Woman’s UniversityThe Art Institute of California -
Inland EmpireThe Art Institute of PittsburghThe City University of New YorkThe College of New RochelleThe College of New Rochelle
- GSThe College of New Rochelle
- SASThe College of New Rochelle
- SNRThe College of New Rochelle -
SONThe Community College of
Baltimore CountyThe Richard Stockton College of
New JerseyThe University of AlabamaThe University of ArizonaThe University of Arizona - Eller
College of ManagementThe University of ChicagoThe University of GeorgiaThe University of KansasThe University of Louisiana at
LafayetteThe University of North
Carolina at CharlotteThe University of Oklahoma
The University of Oklahoma - Norman
The University of South DakotaThe University of Southern
MississippiThe University of Texas at
ArlingtonThe University of Texas at AustinThe University of Texas at DallasThe University of Texas at San
AntonioThe University of Texas at TylerThe University of Texas-Pan
AmericanThe University of West AlabamaThomas Edison State CollegeTiffin UniversityTompkins Cortland Community
CollegeTowson UniversityTri-County Technical CollegeTruman State UniversityTufts UniversityUnion UniversityUnity CollegeUniversiti Teknologi PetronasUniversity at Albany - SUNYUniversity at Buffalo, The State
University of New YorkUniversity Catholic of Brasilia -
BrazilUniversity of ArkansasUniversity of Arkansas -
FayettevilleUniversity of Arkansas - Fort
SmithUniversity of CaliforniaUniversity of California - DavisUniversity of California - IrvineUniversity of California - Los
AngelesUniversity of California - Santa
BarbaraUniversity of Central FloridaUniversity of Central MissouriUniversity of Central OklahomaUniversity of CharlestonUniversity of CincinnatiUniversity of Cincinnati -
Lindner College of BusinessUniversity of ConnecticutUniversity of DallasUniversity of DaytonUniversity of Dayton - School
of LawUniversity of FindlayUniversity of FloridaUniversity of Great FallsUniversity of Houston
University of IllinoisUniversity of Illinois at ChicagoUniversity of Illinois at Chicago
- Liautaud Graduate School of Business
University of Illinois at Springfield
University of Illinois at Urbana-Champaign
University of IndianapolisUniversity of La VerneUniversity of LouisvilleUniversity of MarylandUniversity of Maryland -
College ParkUniversity of Maryland -
University CollegeUniversity of MassachusettsUniversity of Massachusetts -
AmherstUniversity of Massachusetts -
BostonUniversity of Massachusetts -
DartmouthUniversity of MiamiUniversity of Michigan - Ann
ArborUniversity of Michigan
Engineering - Ann ArborUniversity of MississippiUniversity of MissouriUniversity of Missouri -
ColumbiaUniversity of Missouri - Kansas
CityUniversity of Missouri - St. LouisUniversity of MobileUniversity of Nebraska - LincolnUniversity of Nebraska at
KearneyUniversity of Nevada, Las
VegasUniversity of New HavenUniversity of North DakotaUniversity of North FloridaUniversity of North GeorgiaUniversity of North TexasUniversity of Notre DameUniversity of Notre Dame -
Mendoza College of BusinessUniversity of Notre Dame -
School of ArchitectureUniversity of PennsylvaniaUniversity of PhoenixUniversity of PittsburghUniversity of RedlandsUniversity of Rio GrandeUniversity of San FranciscoUniversity of South Alabama
University of South Alabama - College of Engineering
University of South CarolinaUniversity of South Carolina -
AikenUniversity of South Carolina -
ColumbiaUniversity of South Carolina -
Palmetto CollegeUniversity of South FloridaUniversity of South Florida -
College of PharmacyUniversity of South Florida -
Morsani College of MedicineUniversity of South Florida -
Sarasota/ManateeUniversity of South Florida -
St. PetersburgUniversity of South Florida -
TampaUniversity of Southern
CaliforniaUniversity of Southern MaineUniversity of St. Thomas -
St. Paul CampusUniversity of the CumberlandsUniversity of the OzarksUniversity of the PacificUniversity of the RockiesUniversity of VirginiaUniversity of WashingtonUniversity of Washington -
BothellUniversity of Washington -
Michael G. Foster School of Business
University of Washington - Seattle
University of Washington - Tacoma
University of Wisconsin - Green Bay
University of Wisconsin - La Crosse
University of Wisconsin - Madison
University of Wisconsin - Whitewater
Utah State UniversityUtah Valley UniversityValdosta State UniversityValley City State UniversityVanderbilt UniversityVassar CollegeVillanova UniversityVirginia TechWagner CollegeWake Technical Community
College

National Association of Colleges and Employers | The Class of 2014 Student Survey Report | 55
Walden UniversityWaldorf CollegeWarner Pacific CollegeWarner UniversityWashburn UniversityWashington Adventist
UniversityWashington CollegeWayland Baptist UniversityWayne State CollegeWayne State University
Webster UniversityWest Chester University of
PennsylvaniaWest Texas A&M UniversityWest Virginia UniversityWest Virginia University
- College of Business & Economics
West Virginia Wesleyan College
Westchester Community College
Western Carolina UniversityWestern University - College of
Osteopathic Medicine of the Pacific
Western Washington University
Westminster College - MOWestminster College - PAWhittier CollegeWichita Area Technical
College
Wichita State UniversityWilkes UniversityWilliam Paterson UniversityWinston Salem State
UniversityWinthrop UniversityWorcester State UniversityYeshiva UniversityYork CollegeYork College of PennsylvaniaYoungstown State University

National Association of Colleges and Employers | The Class of 2014 Student Survey Report | 56
62 HIGHLAND AVENUE • BETHLEHEM, PA 18017-9085610.868.1421
www.naceweb.org